


HPHT-Treated Impact Diamonds from the Popigai Crater (Siberian Craton): XRD and Raman Spectroscopy Evidence
 , , and
Abstract
:1. Introduction
2. Materials and Methods
3. Results
3.1. Graphitization of Impact Diamond
3.1.1. Samples of Type 1, with 0 to 10% Lonsdaleite (Runs 4-12-22-7 and 4-12-22-5)
3.1.2. Dark (Type 2) Diamond Samples 3 and 4 (40 to 55 mol.% Lonsdaleite), Runs 4-35-21 and 4-46-21
3.2. XRD Analysis of Impact Diamond Samples of Types 1 and 2 before and after HPHT Runs
Diamond Samples 5 and 6 of Intermediate 3/2 Type (20 to 30 mol % Lonsdaleite), Runs 2022-1 and 2022-2)
3.3. Diamond/Lonsdaleite Ratio in Raman Spectra of Impact Diamonds before and after HPHT Treatment
3.3.1. Light-Color Type 1 Diamond Samples 1 and 2 (0 to 10% Lonsdaleite), Runs 4-12-22-5 and 4-12-22-7
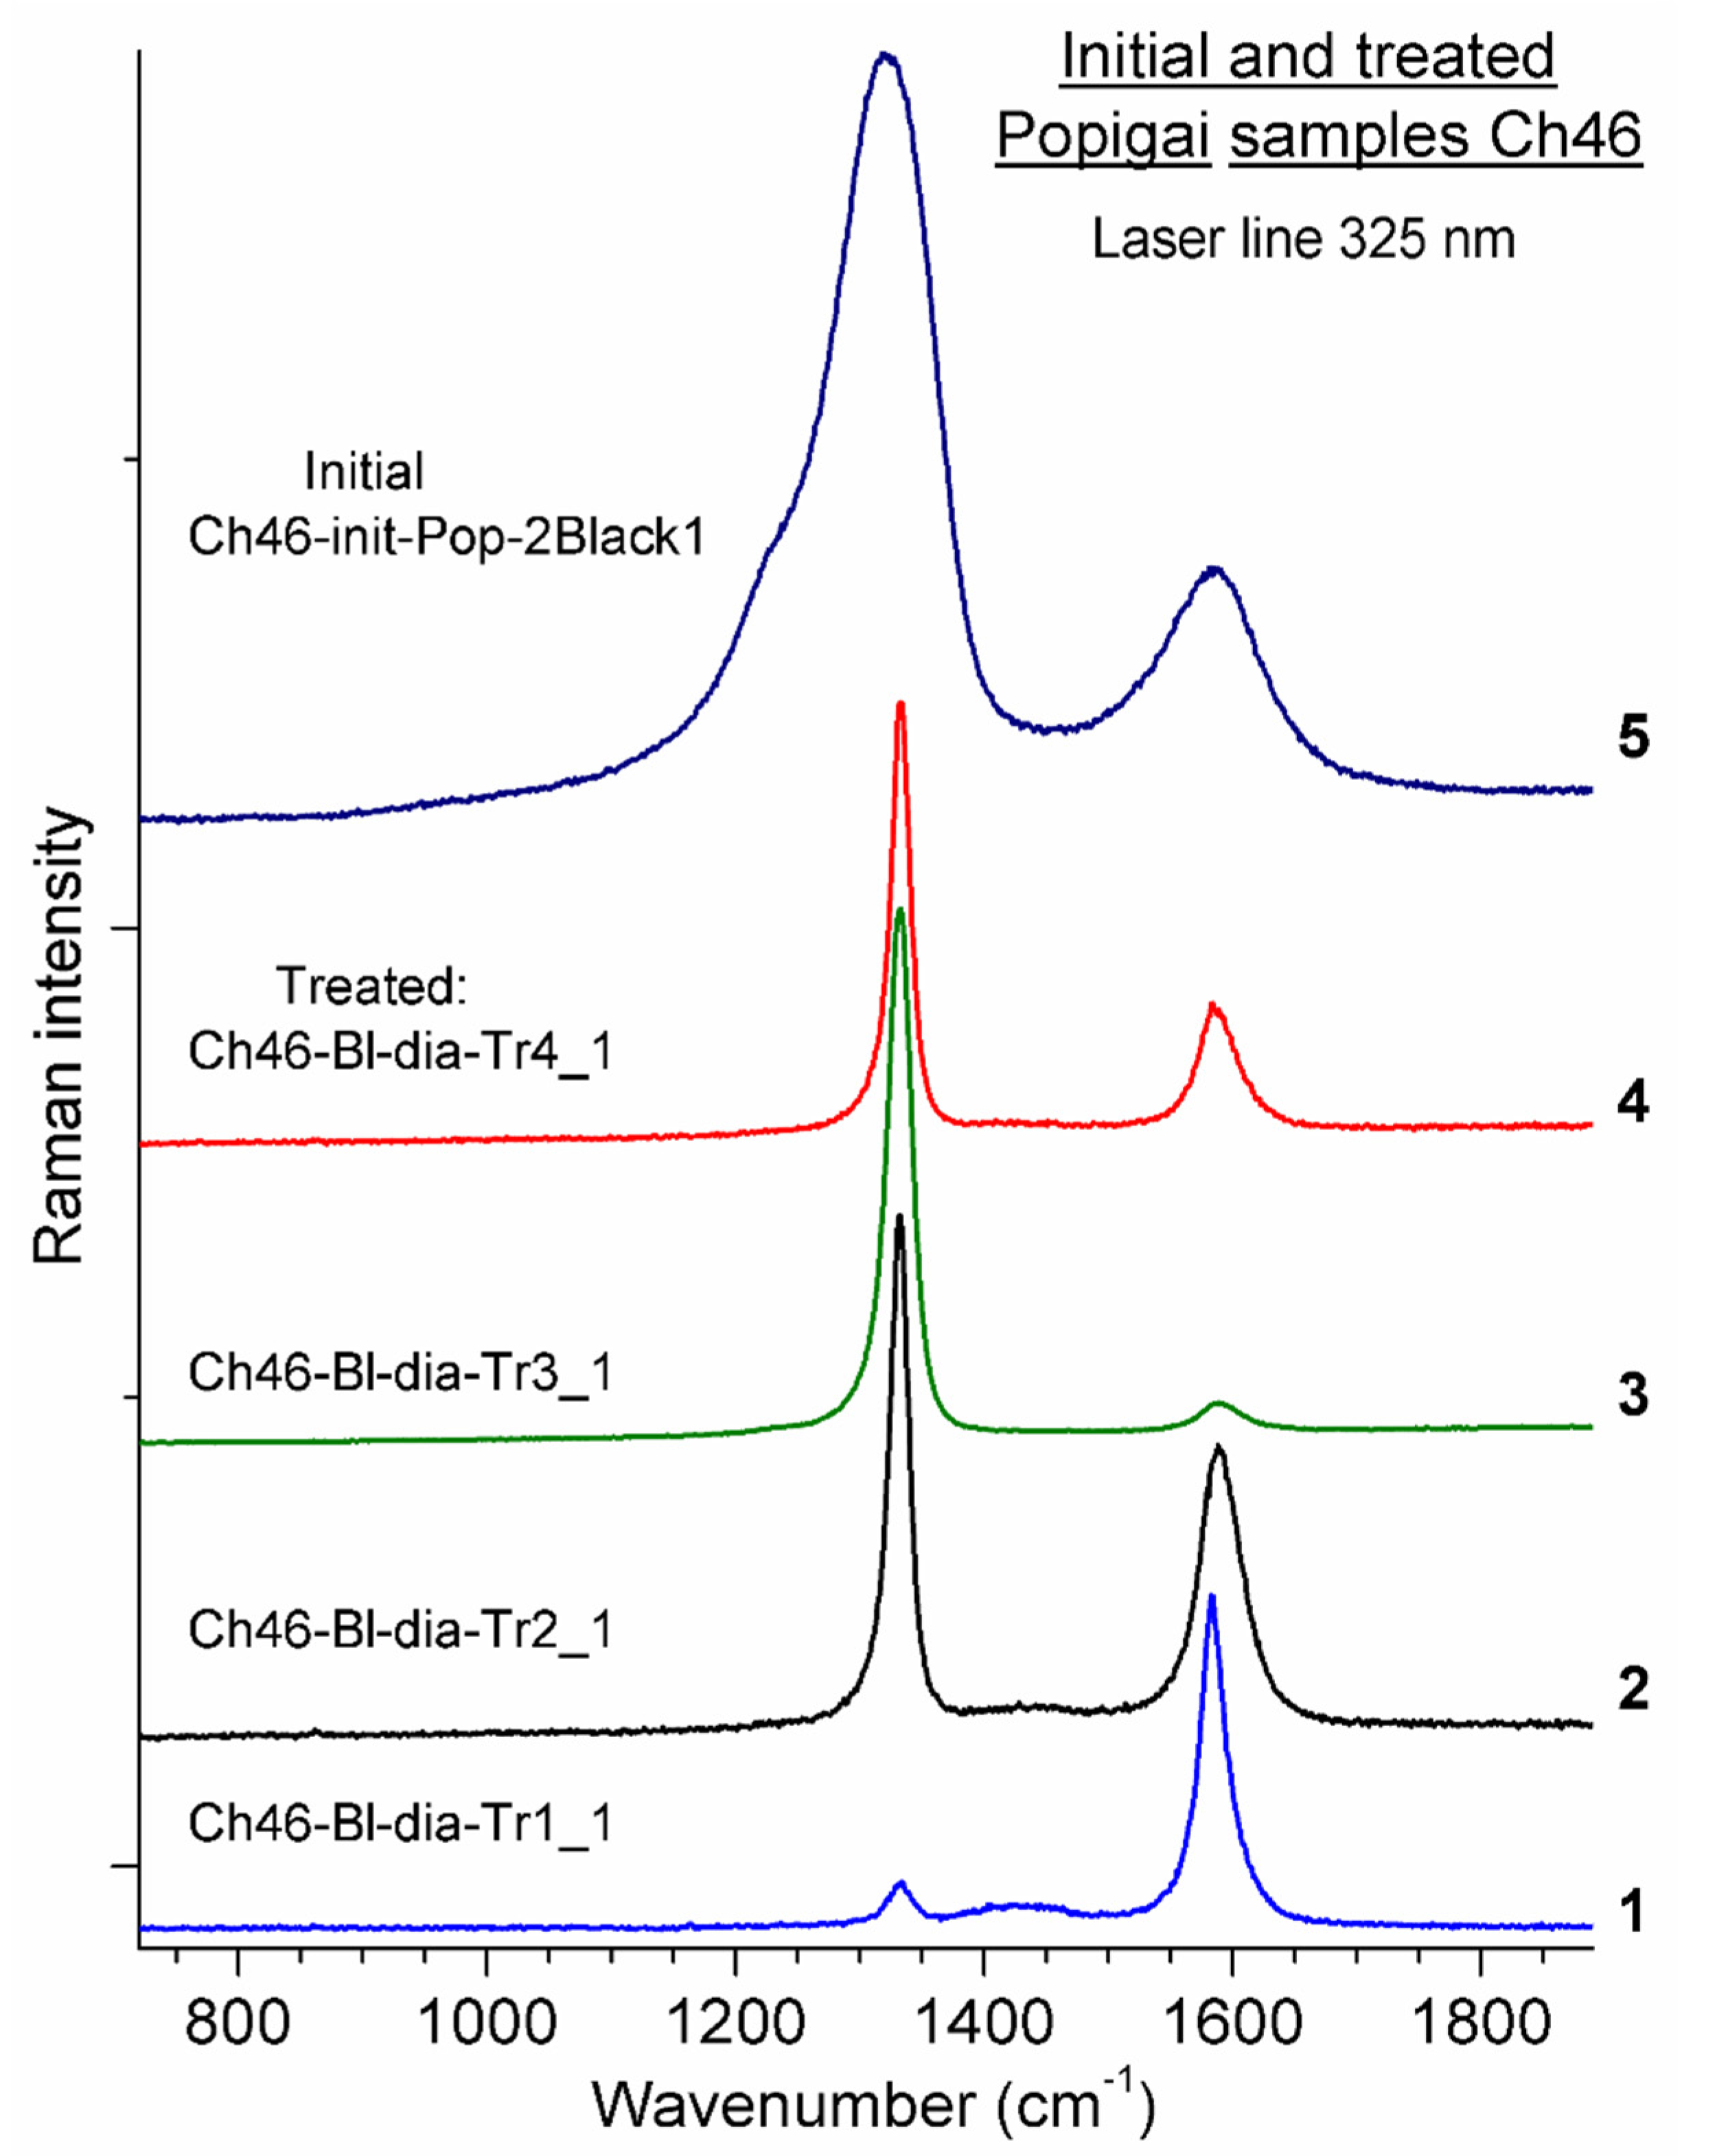
3.3.2. Dark (Type 2) Samples 3 and 4 with 40 to 55% Lonsdaleite, Runs 4-35-21 and 4-46-21
3.3.3. Samples 5 and 6 of Intermediate 3/2 Type (20 to 30 mol % Lonsdaleite), Runs 4-3-22-1 and 4-3-22-2
- Sample 5 (run 22-1)
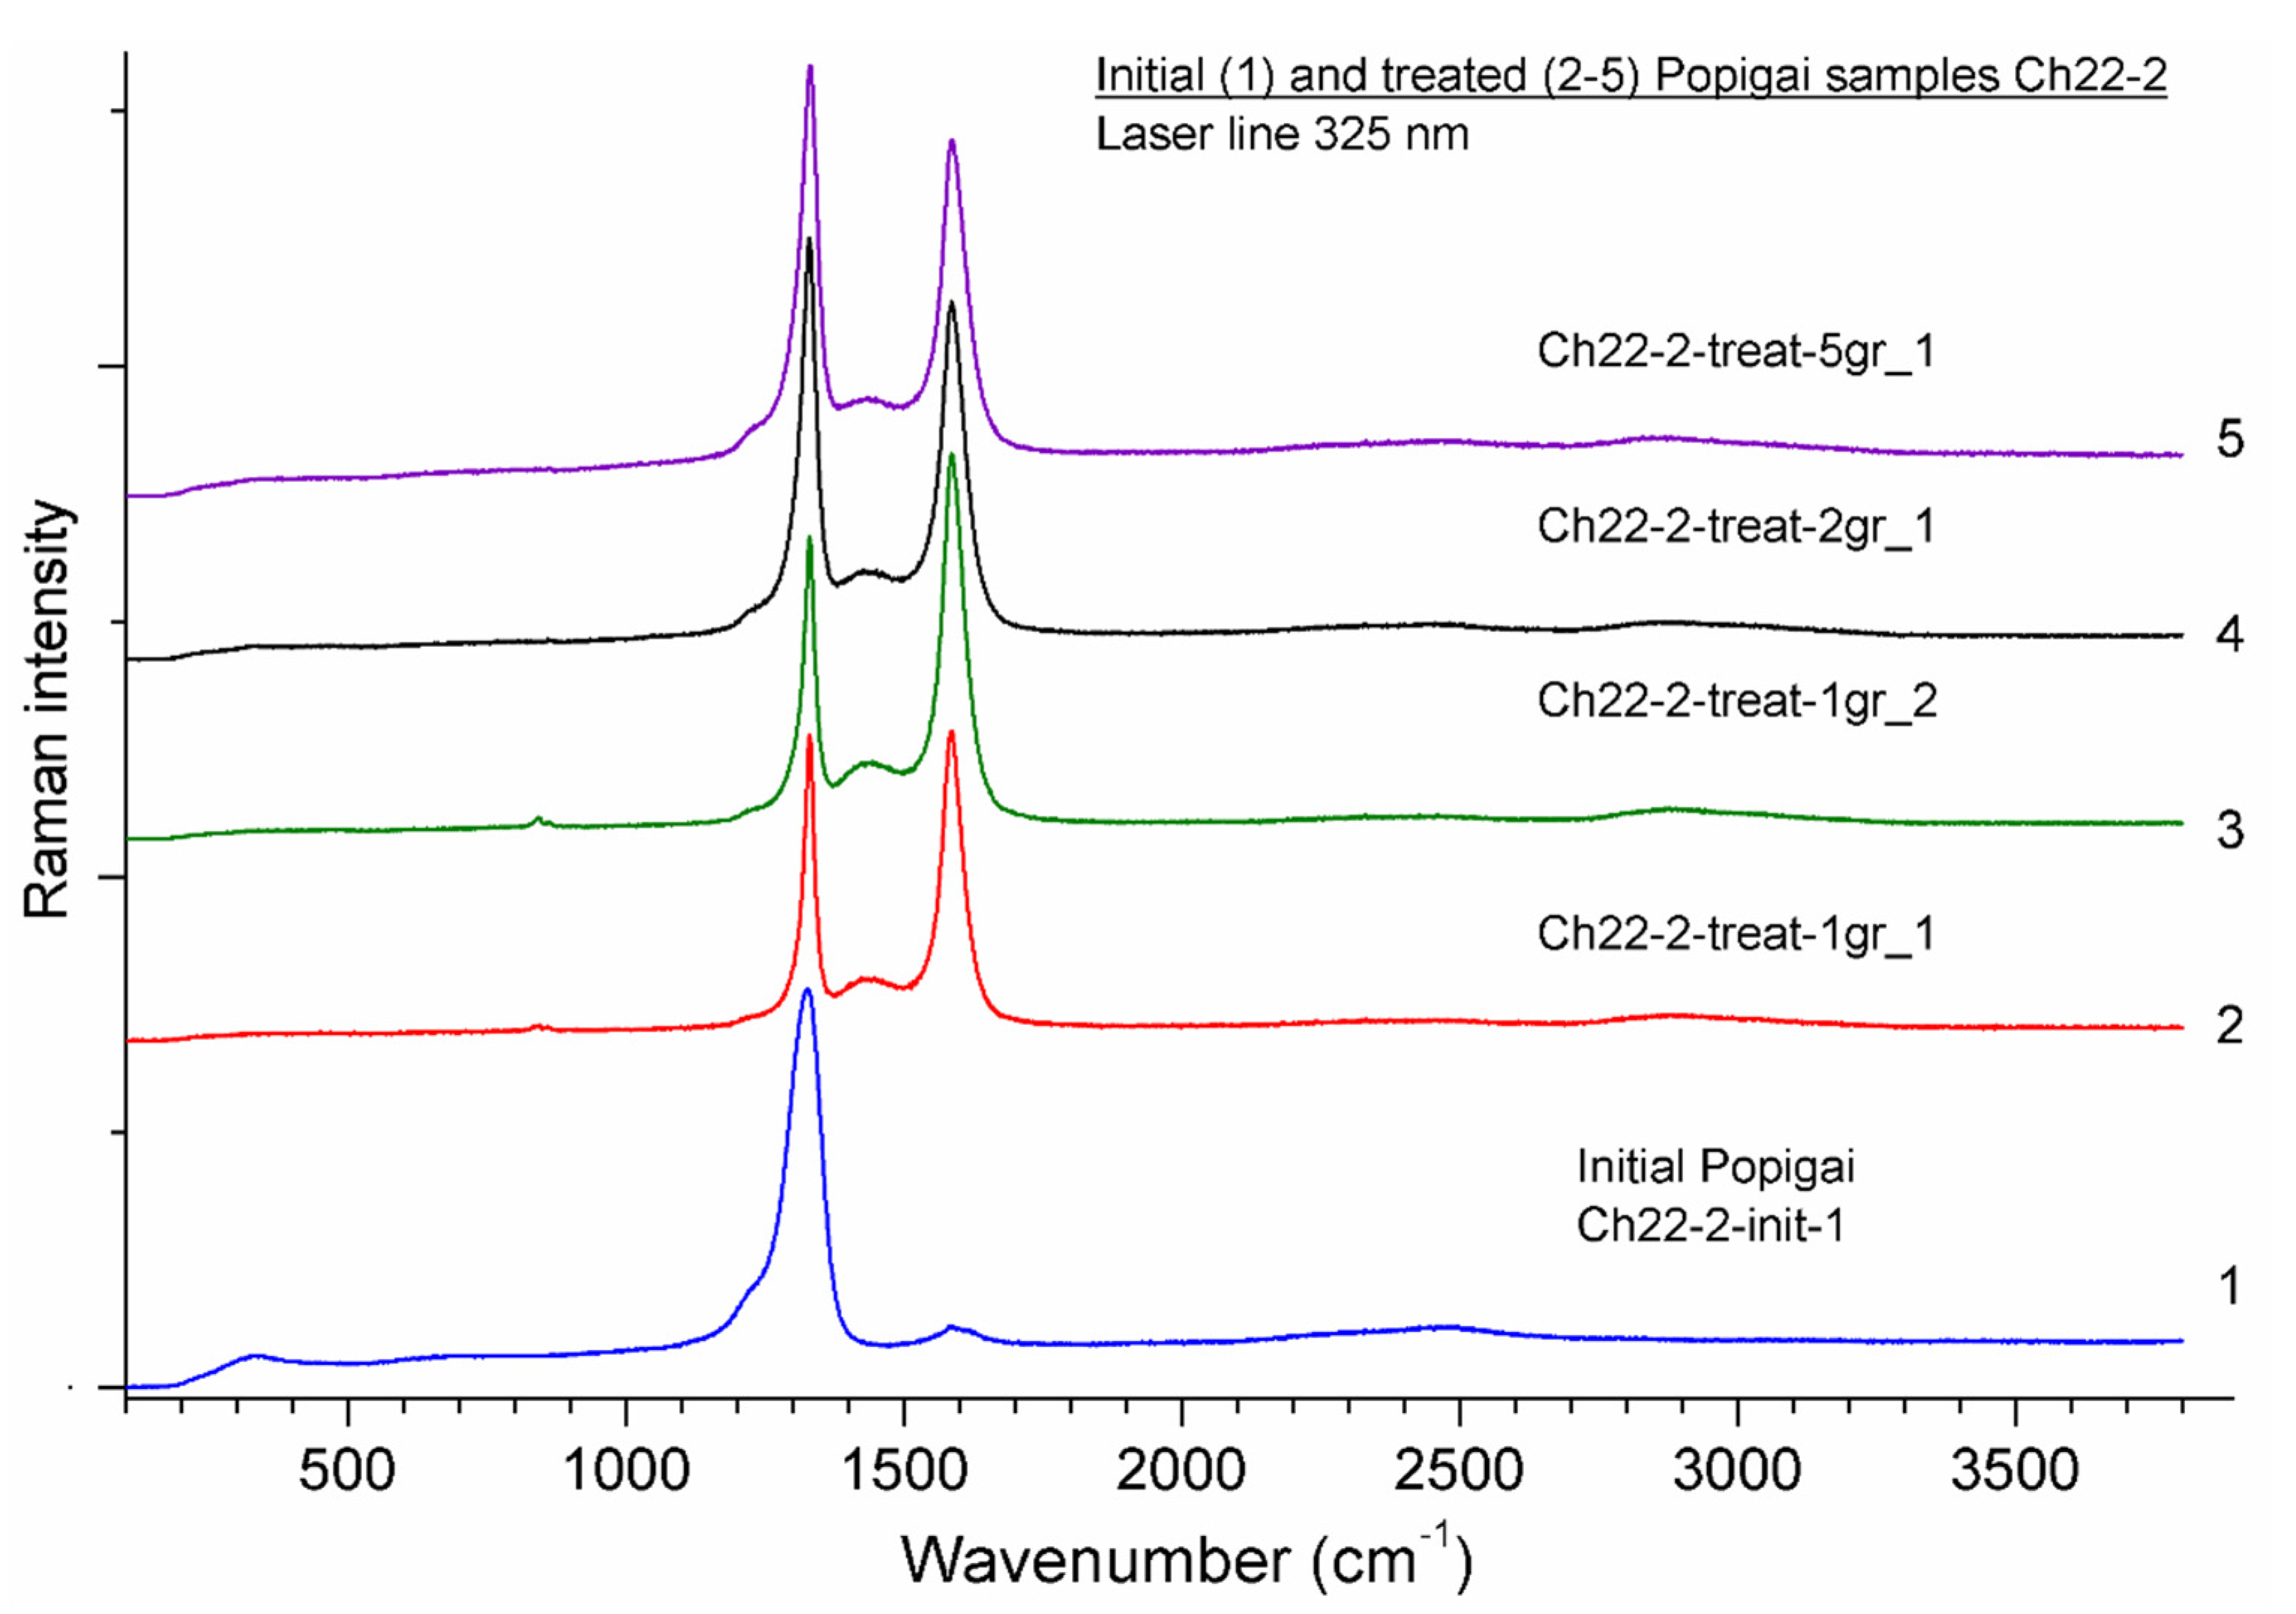
- Sample 6 (run 22-2)
3.4. XRD Analysis of Type 2 Impact Diamond Samples before and after HPHT Runs
4. Discussion
5. Conclusions
- The percentages of lonsdaleite from the lonsdaleite/diamond Raman intensity ratio was estimated at 0 to 10% and 40 to 55% in samples of types 1 and 2, respectively, and 20 to 30% in those of intermediate type.
- For impact diamonds of type 1 (with 0%–10% lonsdaleite content in the lonsdaleite-diamond mixture) under the conditions of the experiments performed, only the process of surface graphitization is observed (bulk graphitization is absent), and they are more resistant to graphitization as compared to impact diamonds of type 2 (with 40%–55% lonsdaleite content).
- For impact diamonds of type 2 with high content of lonsdaleite and graphite inclusions, the competing process with respect to surface graphitization is bulk graphitization occurring at a much higher rate.
- The spectra measured sufficient homogeneity of the samples at three or four points, with minor variations of diamond percentage appearing as a small shift within 2 cm−1.
Author Contributions
Funding
Data Availability Statement
Conflicts of Interest
References
- Nemeth, P.; Garvie, L.A.J.; Aoki, T.; Dubrovinskaia, N.; Dubrovinsky, L.; Buseck, P.R. Lonsdaleite is faulted and twinned cubic diamond and does not exist as a discrete material. Nat. Commun. 2014, 5, 5447. [Google Scholar] [CrossRef] [Green Version]
- Masaitis, V.L. Impact diamonds of the Popigai astrobleme: Main properties and practical use. Geol. Ore Depos. 2013, 55, 607–612. [Google Scholar] [CrossRef]
- Bundy, F.P.; Kasper, J.S. Hexagonal diamond—A new form of carbon. J. Chem. Phys. 1967, 46, 3437–3446. [Google Scholar] [CrossRef]
- Frondel, C.; Marvin, U.B. Lonsdaleite, a hexagonal polymorph of diamond. Nature 1967, 214, 587–589. [Google Scholar] [CrossRef]
- Sokhor, M.I.; Futergendler, S.I. X-ray diffraction analysis of the cubic diamond–lonsdaleite system. Kristallografiya 1974, 19, 758–762. [Google Scholar]
- Kvasnitsa, V.N.; Zinchuk, N.N.; Koptil, V.I. Typomorphism of Diamond Microcrystals; Nedra-Biznescentr: Moscow, Russia, 1999. (In Russian) [Google Scholar]
- Denisov, V.N.; Mavrin, B.N.; Serebryanaya, N.R.; Dubitsky, G.A.; Aksenenkov, V.V.; Kirichenko, A.N.; Kuzmin, N.V.; Kulnitskiy, B.A.; Perezhogin, I.A.; Blank, V.D. First-principles, UV Raman, X-ray diffraction and TEM study of the structure and lattice dynamics of the diamond–lonsdaleite system. Diam. Relat. Mater. 2011, 20, 951–953. [Google Scholar] [CrossRef]
- Goryainov, S.V.; Likhacheva, A.Y.; Rashchenko, S.V.; Shukin, A.S.; Afanas’ev, V.P.; Pokhilenko, N.P. Raman identification of lonsdeilite in Popigai impactites. J. Raman Spectrosc. 2014, 45, 305–313. [Google Scholar] [CrossRef]
- Afanasiev, V.; Gromilov, S.; Sonin, V.; Zhimulev, E.; Chepurov, A. Graphite in rocks of the Popigai impact crater: Residual or retrograde? Turk. J. Earth Sci. 2019, 28, 470–477. [Google Scholar] [CrossRef]
- Chepurov, A.I.; Zhimulev, E.I.; Sonin, V.M.; Chepurov, A.A.; Karpovich, Z.A.; Goryainov, S.V.; Afanasiev, V.P.; Pokhilenko, N.P. Morphology of crystals growing in impact diamonds of the Popigai astrobleme (experimental data). Dokl. Earth Sci. 2021, 500, 734–737. [Google Scholar] [CrossRef]
- Kvasnytsya, V.; Wirth, R. Micromorphology and internal structure of apographitic impact diamonds: SEM and TEM study. Diam. Relat. Mater. 2013, 32, 7–16. [Google Scholar] [CrossRef]
- Pan, Z.; Sun, H.; Zhang, Y.; Chen, C. Harder than diamond: Superior indentation strength of wurtzite BN and lonsdaleite. Phys. Rev. Lett. 2009, 102, 055503. [Google Scholar] [CrossRef] [PubMed]
- Sonin, V.M.; Zhimulev, E.I.; Tomilenko, A.A.; Chepurov, S.A.; Chepurov, A.I. Chromatographic study of diamond etching in kimberlitic melts in the context of diamond natural stability. Geol. Ore Depos. 2004, 46, 182–190. [Google Scholar]
- Chepurov, A.; Sonin, V.; Dereppe, J.-M.; Zhimulev, E.; Chepurov, A. How do diamonds grow in metal melt together with silicate minerals? An experimental study of diamond morphology. Eur. J. Miner. 2020, 32, 41–55. [Google Scholar] [CrossRef] [Green Version]
- Chepurov, A.; Zhimulev, E.; Chepurov, A.; Sonin, V. Where did the largest diamonds grow? The experiments on percolation of Fe-Ni melt through olivine matrix in the presence of hydrocarbons. Lithos 2021, 404–405, 106437. [Google Scholar] [CrossRef]
- Day, H.W. A revised diamond–graphite transition curve. Am. Mineral. 2012, 97, 52–62. [Google Scholar] [CrossRef]
- Kvasnytsya, V.; Wirth, R.; Piazolo, S.; Jacob, D.T.; Trimby, P. Surface morphology and structural types of natural impact apographitic diamonds. J. Superhard Mater. 2016, 38, 71–84. [Google Scholar] [CrossRef]
- Yelisseyev, A.; Khrenov, A.; Afanasiev, V.; Pustovarov, S.; Gromilov, S.; Panchenko, A.; Pokhilenko, N.; Litasov, K. Impact diamond from the Popigai crater. Diam. Relat. Mater. 2015, 58, 69–77. [Google Scholar] [CrossRef]
- Goryainov, S.V.; Krylov, A.S.; Pan, Y.; Madyukov, I.A.; Smirnov, M.B.; Vtyurin, A.N. Raman investigation of hydrostatic and nonhydrostatic compressions of OH- and F-apophyllites up to 8 GPa. J. Raman Spectrosc. 2012, 43, 439–447. [Google Scholar] [CrossRef]
- Model S506 Interactive Peak Fit; User’s Manual; Canberra Industries Inc.: Canberra, Australia, 2002.
- Ovsyuk, N.N.; Goryainov, S.V.; Likhacheva, A.Y. Raman scattering of impact diamonds. Diam. Relat. Mater. 2019, 91, 207–212. [Google Scholar] [CrossRef]
- Smith, D.C.; Godard, G. UV and VIS Raman spectra of natural lonsdaleites: Towards a recognised standard. Spectrochim. Acta Part A Mol. Biomol. Spectrosc. 2009, 73, 428–435. [Google Scholar] [CrossRef]
- El Mendili, Y.; Orberger, B.; Chateigner, D.; Bardeau, J.-F.; Gascoin, S.; Petit, S. Raman investigations and ab initio calculations of natural diamond-lonsdaleite originating from New Caledonia. Chem. Phys. 2022, 559, 111541. [Google Scholar] [CrossRef]
- Afanas’ev, V.P.; Litasov, K.D.; Goryainov, S.V.; Kovalevski, V.V. Raman spectroscopy of nanopolycrystalline diamond produced from shungite at 15 GPa and 1600 °C. JETP Lett. 2020, 111, 218–224. [Google Scholar] [CrossRef]
- Kraus, D.; Ravasio, A.; Gauthier, M.; Gericke, D.O.; Vorberger, J.; Frydrych, S.; Helfrich, J.; Fletcher, L.B.; Schaumann, G.; Nagler, B.; et al. Nanosecond formation of diamond and lonsdaleite by shock compression of graphite. Nat. Commun. 2016, 7, 10970. [Google Scholar] [CrossRef] [PubMed]
- Shiell, T.B.; McCulloch, D.G.; Bradby, J.E.; Haberl, B.; Roehler, R.; McKenzie, D.R. Nanocrystalline hexagonal diamond formed from glassy carbon. Sci. Rep. 2016, 6, 37232. [Google Scholar] [CrossRef]
- McCukkoch, D.G.; Wong, S.; Shiell, T.B.; Brenton, B.H.; Cook, A.; Hunag, X.; Boehler, R.; McKenzie, D.R.; Bradby, J.E. Investigation of room temperature formation of the ultra-hard nanocarbons diamond and lonsdaleite. Nano-Micro Small 2020, 16, 2004695. [Google Scholar] [CrossRef]
- Salzmann, C.G.; Murray, B.J.; Shephard, J.J. The extent of stacking disorder in diamond. Diam. Rel. Mater. 2015, 59, 69–72. [Google Scholar] [CrossRef] [Green Version]
- Nakamuta, Y.; Toh, S. Transformation of graphite to lonsdaleite and diamond in the Goalpara ureilite directly observed by TEM. Am. Mineral. 2013, 98, 574–581. [Google Scholar] [CrossRef]
- Nemeth, P.; Garvie, L.A.J.; Buseck, P.R. Twinning of cubic diamond explains reported nanodiamond polymorphs. Sci. Rep. 2016, 5, 18381. [Google Scholar] [CrossRef] [Green Version]
- Sonin, V.M.; Chepurov, A.I.; Fedorov, I.I. The action of iron particles at catalyzed hydrogenation of {100} and {110} faces of synthetic diamond. Diam. Relat. Mater. 2003, 12, 1559–1562. [Google Scholar] [CrossRef]


| Sample | Run | Temperature, T °C | Run Duration τ, s | Lonsdaleite Percentage, % |
|---|---|---|---|---|
| 1 | 4-12-22(7) | 2000 | 600 | 3.2 → 3.6–5.3; average 4.5 |
| 2 | 4-12-22(5) | 2050 | 600 | 8.0 → average 6.0 |
| 3 | 4-35-21 | 2100 | 180 | 45 → 7.6–6.3: average 7.1 |
| 4 | 4-46-21 | 2100 | 600 | 52 → 2.8–4.5: average 3.3 |
| 5 | 4-3-22(1) | 2050 | 1200 | 29.7 → 4.6–13.6; average 9.3 |
| 6 | 4-3-22(2) | 2100 | 1200 | 25.9 → 4.3–8.6; average 6.1 |
| Scheme | Lonsd | νdia | Idia | wdia | wdia · Idia | νg | Ig | wg | wg · Ig | Rdg (Peak) | Rdg | Rgd |
|---|---|---|---|---|---|---|---|---|---|---|---|---|
| % | cm−1 | cm−1 | cm−1 | cm−1 | cm−1 | cm−1 | ||||||
| Ch7b-init2 | 3.6 | 1332.7 | 3400 | 19.4 | 65,960 | 1590.5 | 632 | 37.8 | 23,889.6 | 5.38 | 2.76 | 0.36 |
| Ch7a-1tr1 | 5.3 | 1332.3 | 1647 | 25 | 41,175 | 1588.2 | 454 | 44.5 | 20,203 | 3.63 | 2.038 | 0.49 |
| Ch7a-2tr1 | 3.6 | 1332.1 | 1572 | 19.4 | 30,497 | 1589.9 | 471 | 52 | 24,492 | 3.34 | 1.245 | 0.8 |
| Ch7a-3tr1 | 3.8 | 1331.7 | 522 | 20.4 | 10,649 | 1586.3 | 990 | 37.3 | 36,927 | 0.527 | 0.288 | 3.47 |
| Ch7a-3tr2 | 4.8 | 1332.4 | 488 | 23.4 | 11,419 | 1587.1 | 685 | 36.8 | 25,208 | 0.712 | 0.453 | 2.21 |
| Sample/Point | Lonsd | νdia | Idia | wdia | νL2 | νg | Ig | wg | Rdg (peak) | Rdg | Rgd |
|---|---|---|---|---|---|---|---|---|---|---|---|
| % | cm−1 | cm−1 | cm−1 | cm−1 | cm−1 | ||||||
| Ch-5init-1 | 8 | 1331.7 | 11,262 | 32.9 | 1238 | 1609 | 20 | 46 | 563 | 408 | 0.0024 |
| Ch-5tr-2 | 6 | 1331.6 | 11,282 | 33.6 | 1232 | 1588.7 | 651 | 46.6 | 17.3 | 12.5 | 0.08 |
| Sample/ Grain/Point | Lonsd. | Intensity Idia/Ig | νdia | wdia | νG1 | νG2 | wG12 | νD12 | Comment |
|---|---|---|---|---|---|---|---|---|---|
| % | Dimensionless | cm−1 | cm−1 | cm−1 | cm−1 | cm−1 | cm−1 | ||
| Ch35-init-Pop-1Black1 | 45 | 3.8 | 1317.2 | 82.5 | 1588 | - | 93.6 | - | min νdia, high lonsd. content |
| Ch35-Tr1-1 | 7.63 | 0.22 | 1333.6 | 31.9 | 1588.8 | 1606 | 53.5 | 1435 | |
| Ch35-Tr1-2 | 6.9 | 0.24 | 1333.0 | 29.7 | 1590 | 1603 | 50.8 | 1435 | |
| Ch35-Tr2-1 | 7.3 | 0.16 | 1334.0 | 31.0 | 1590 | 1602 | 53.2 | 1439 | |
| Ch35-Tr2-2 | 6.5 | 0.16 | 1333.9 | 28.7 | 1589.7 | 1605 | 47.8 | 1437 | |
| Ch35-Tr3-1 | 6.3 | 0.15 | 1334.0 | 28.1 | 1584.9 | ~1600 | 38.5 | 1426 | |
| Ch35-Tr4-1 | 7.6 | 0.26 | 1332.0 | 31.7 | 1593 | 1605 | 52.3 | 1440 | |
| Ch35-Tr4-2 | 7.2 | 0.2 | 1335.8 | 30.7 | 1588 | 1600 | 43.2 | 1434 | max νdia |
| Ch35-Tr5-1 | 7.55 | 0.3 | 1333.6 | 31.7 | 1590.7 | 1606 | 47.7 | 1444 |
| Sample-Grain-Point | Lonsd. | Intensity Idia/Ig | νdia | wdia | νG1 | νG2 | wG12 | νD12 | Comment |
|---|---|---|---|---|---|---|---|---|---|
| % | Unitless | cm−1 | cm−1 | cm−1 | cm−1 | cm−1 | cm−1 | ||
| Ch46-init-Pop-2Black1 | 52 | 3.9 | 1322.0 | 89.7 | 1586 | - | 84.3 | - | Highest lonsd.cont. |
| Ch46-Tr1-1 | 4.5 | 0.11 | 1332.3 | 22.4 | 1583.6 | - | 23.8 | 1426 | Narrow G1 |
| Ch46-Tr2-1 | 2.9 | 0.83 | 1332.1 | 17.4 | 1589.3 | 1608 | 39 | 1440 | |
| Ch46-Tr3-1 | 2.9 | 2.0 | 1332.3 | 17.2 | 1588.5 | 1609 | 38.8 | - | |
| Ch46-Tr4-1 | 2.8 | 1.68 | 1332.9 | 17.1 | 1586.8 | 1601 | 36.1 | 1429 | Max νdia |
| Sample/Grain/ Point | Lonsd | Intensity Idia/Ig | νdia | wdia | 2νdia | νG1 | νG2, νD2 | wG12 | νD1 | 2νD1 |
|---|---|---|---|---|---|---|---|---|---|---|
| % | Dimensionless | cm−1 | cm−1 | cm−1 | cm−1 | cm−1 | cm−1 | cm−1 | cm−1 | |
| Ch22-uv1init-2 (initial Popigai) | 29.7 | 2.5 | 1329.1 | 73.2 | 2472 | 1583 | 1608, 1630 | 28.7 | 1425 | 2842 |
| Ch22-uv-1tr-1grain-1 | 12.7 | 0.6 | 1331 | 44.8 | 2525 | 1595.3 | - | 54.6 | 1427 | 2858 |
| Ch22-uv-1tr-1grain-2 | 10.4 | 0.89 | 1331.6 | 39.4 | 2484 | 1594.3 | - | 51 | 1424 | 2857 |
| Ch22-uv-1tr-2grain-1 | 8.3 | 0.33 | 1331.4 | 33.7 | 2314, 2480 | 1588.8 | - | 46.4 | 1436 | 2883 |
| Ch22-uv-1tr-2grain-2 | 10.7 | 0.88 | 1331.5 | 40.1 | 2480, 2530 | 1590 | 1605, 1626 | 52.8 | 1449 | 2865 |
| Ch22-uv-1tr-3grain-1 | 4.6 | 0.91 | 1331.2 | 22.9 | 2470, 2528 | 1589.2 | - | 46 | 1443 | 2868 |
| Ch22-uv-1tr-3grain-2 | 7.4 | 0.62 | 1331.8 | 31.2 | 2304, 2528 | 1587.8 | - | 47.3 | 1438 | 2875 |
| Ch22-uv-1tr-4grain-1 | 13.6 | 0.87 | 1330 | 47 | 2272, 2494 | 1597.4 | - | 56.7 | 1444 | 2873 |
| Ch22-uv-1tr-5grain-2 | 7.5 | 0.16 | 1331.4 | 31.6 | 2285, 2453 | 1587.9 | - | 40 | 1433 | 2886 |
| Ch22-uv-1tr-5grain-3 | 8.1 | 0.26 | 1332.1 | 33.1 | 2278, ~2528 | 1592.2 | - | 43.5 | 1428 | 2976 |
| Sample/Grain/ Point | Lonsd. | Intensity Idia/Ig | νdia | wdia | 2νdia | νG1 | νG2 | wG1 | νD1 |
|---|---|---|---|---|---|---|---|---|---|
| % | Dimensionless | cm−1 | cm−1 | cm−1 | cm−1 | cm−1 | cm−1 | cm−1 | |
| Ch22-uv-2i-1 (initial Popigai) | 25.9 | 16 | 1326.4 | 68.5 | 2474 | 1585.6 | no | 84.7 | - |
| Ch22-uv-2tr-1grain-1 | 4.3 | 0.5 | 1329.9 | 21.9 | 2473 | 1585 | no | 42.9 | 1436 |
| Ch22-uv-2tr-1grain-2 | 4.6 | 0.39 | 1330.1 | 22.7 | 2457 | 1586 | no | 44.3 | 1438 |
| Ch22-uv-2tr-2grain-1 | 6.9 | 0.76 | 1329.4 | 29.7 | 2458 | 1585.8 | no | 46.4 | 1432 |
| Ch22-uv-2tr-5grain-1 | 8.6 | 0.88 | 1331.1 | 34.5 | 2468 | 1586.6 | no | 48.3 | 1432 |
Disclaimer/Publisher’s Note: The statements, opinions and data contained in all publications are solely those of the individual author(s) and contributor(s) and not of MDPI and/or the editor(s). MDPI and/or the editor(s) disclaim responsibility for any injury to people or property resulting from any ideas, methods, instructions or products referred to in the content. |
© 2023 by the authors. Licensee MDPI, Basel, Switzerland. This article is an open access article distributed under the terms and conditions of the Creative Commons Attribution (CC BY) license (https://creativecommons.org/licenses/by/4.0/).
Share and Cite
Chepurov, A.; Goryainov, S.; Gromilov, S.; Zhimulev, E.; Sonin, V.; Chepurov, A.; Karpovich, Z.; Afanasiev, V.; Pokhilenko, N. HPHT-Treated Impact Diamonds from the Popigai Crater (Siberian Craton): XRD and Raman Spectroscopy Evidence. Minerals 2023, 13, 154. https://doi.org/10.3390/min13020154
Chepurov A, Goryainov S, Gromilov S, Zhimulev E, Sonin V, Chepurov A, Karpovich Z, Afanasiev V, Pokhilenko N. HPHT-Treated Impact Diamonds from the Popigai Crater (Siberian Craton): XRD and Raman Spectroscopy Evidence. Minerals. 2023; 13(2):154. https://doi.org/10.3390/min13020154
Chicago/Turabian StyleChepurov, Anatoly, Sergey Goryainov, Sergey Gromilov, Egor Zhimulev, Valeriy Sonin, Aleksey Chepurov, Zakhar Karpovich, Valentin Afanasiev, and Nikolay Pokhilenko. 2023. "HPHT-Treated Impact Diamonds from the Popigai Crater (Siberian Craton): XRD and Raman Spectroscopy Evidence" Minerals 13, no. 2: 154. https://doi.org/10.3390/min13020154