Article

Physical Separations for Rare-Earth Beneficiation of the Nechalacho Deposit

1
Department of Mining and Materials Engineering, McGill University, 3610 University Street, Montreal, QC H3A 0C5, Canada
2
SGS Canada Inc., 185 Concession Street, Lakefield, ON K0L 2H0, Canada
3
School of Chemical Engineering, University of Birmingham, Edgbaston, Birmingham B15 2TT, UK
4
Bunting Redditch, Burnt Meadow Road, Redditch B98 9PA, UK
*
Author to whom correspondence should be addressed.
Minerals 2023, 13(12), 1521; https://doi.org/10.3390/min13121521
Submission received: 16 October 2023 / Revised: 23 November 2023 / Accepted: 24 November 2023 / Published: 5 December 2023

Abstract

:
The rare-earth elements (REEs) are strategic metals which are indispensable to the development of modern defence systems, electronic applications, and green technologies. The growing economic and strategic importance of these sectors, coupled with uncertainty in the global supply, has led to the development of many new deposits around the world. Many of these deposits, such as the Nechalacho deposit, are complex and contain multiple rare-earth element-bearing minerals (REMs) for which there is limited processing knowledge. This study explores a physical-separations-based flowsheet to beneficiate the Nechalacho deposit, which employs a spiral concentrator to preconcentrate the ore at a relatively coarse particle size (d80 = 120 μm), before further size reduction (d100 = 53 μm) and separation using a Mozley laboratory shaking table and two stages (low- and high-intensity) of magnetic separation. QEMSCAN was used to understand the effectiveness of each stage of separation and provide recommendations to improve the process. Although optimisation would be required, the results demonstrate that the physical-separations-based flowsheet could be an effective method of beneficiation.

1. Introduction

The rare-earth elements (REEs) have become essential for the production of permanent magnets, catalysts, and advanced materials required for technologies in the green energy, aerospace, automotive, and defence sectors. However, for over three decades, China has held a dominant share of the production and processing of rare-earth element-bearing minerals (REMs) [1]. With the growing economic and strategic importance of these sectors, several countries have identified REEs as a critical resource [2,3,4,5], which has accelerated the identification and development of new REE projects around the world. These deposits are generally complex and contain multiple REMs for which there is limited processing knowledge [1,6]. Among the advanced projects, the Nechalacho deposit (co-owned by Avalon Advanced Materials Inc. and Vital Metals Ltd.), located in the Northwest Territories of Canada, is one of the largest. It has an inferred resource of 183.4 million tonnes at a grade of 1.27% total rare earth oxide (REO) and 0.17% heavy rare earth oxide (HREO) [7]. The REEs are hosted in zircon, bastnäsite, synchysite, allanite, monazite, fergusonite, and columbite (Fe), and the major gangue minerals in the deposit are feldspars, quartz, and iron oxides.
This work investigates a physical-separations-based flowsheet for the beneficiation of the Nechalacho deposit, building upon the findings of Jordens et al. [8,9,10] and Marion et al. [11]. Jordens et al. [8] first indicated the applicability of physical separations to the Nechalacho deposit examining the use of centrifugal separators and a wet high-intensity magnetic separator (WHIMS) to concentrate REMs. This preliminary study led to a more extensive investigation following the flowsheet depicted in Figure 1 [9,10]. The ore was ground to a d80 of 40 μm and processed first by a Knelson concentrator. The Knelson tailings were then further processed by a Falcon ultra-fine bowl concentrator. The concentrates from each technique were subjected to a series of low-, medium-, and high-intensity magnetic separation steps, to remove iron oxide gangue and separate paramagnetic REMs from diamagnetic gangue minerals. A thorough mineralogical analysis of the products suggested that the Knelson concentrator exhibited greater selectivity for particle size and specific gravity (SG) compared to the Falcon concentrator. The Knelson concentrator upgraded zircon (one of the most important minerals in the deposit [7,12]) 3.3 times, REMs 1.8 times, and iron oxides 3.4 times. However, recoveries remained low (zircon = 22%, REMs = 12.5%) and were attributed to a lack of recirculation in the tested flowsheet [10]. Along with recirculation of the feed, optimisation of Knelson’s operating parameters may have also offered significant benefits.
Low- and medium-intensity magnetic separations were able to selectively remove strongly ferromagnetic iron-bearing gangue. However, iron oxides at grades as high as the initial feed grade remained in the non-magnetic fraction. The products of WHIMS tests, following the wet drum magnetic separation steps, were only analysed with semi-quantitative XRD. However, the mineral assemblage indicated that WHIMS after wet drum magnetic separation of the centrifugal gravity concentrates may be able to reject additional iron oxide gangue and concentrate strongly paramagnetic REMs while rejecting silicate gangue into the non-magnetic tailings.
In addition to these findings, it was indicated that following grinding, coarse particle sizes (>20 μm) were enriched in zircon. These coarse zircon particles had generally high SG, even at sizes > 300 μm, where liberation was limited. While the mass in this size range was limited, the Knelson concentrator was capable of upgrading zircon 1.75 times. Jordens et al. [10] proposed a flowsheet which involved a much coarser grind (~300 μm) followed by a centrifugal gravity concentration step, further grinding of the gravity concentrate, and separation. It was mentioned that this flowsheet would not be suitable for processing the entire deposit but might provide significant savings in grinding costs while producing an initial high-grade concentrate.
Building upon this work, Marion et al. [11] compared the results from a Knelson concentrator and a spiral to preconcentrate the Nechalacho ore at particle sizes well above the liberation size of most REMs in the deposit (d80 = 97 μm, d50 = 72 μm, d0 = 38 μm). Both concentrators were capable of upgrading zircon and REMs, while rejecting predominately feldspar gangue. Concentration by the Knelson resulted in zircon, light rare-earth mineral (LREM), and heavy rare-earth mineral (HREM) upgrade ratios of 2.3, 2.1, and 1.8, respectively. The spiral upgrade ratios were 2.0, 1.6, and 1.4, respectively. Similar to the work of Jordens et al. [9], recoveries were low (<30% using the Knelson and <50% using the spiral). However, the mineralogical analysis via QEMSCAN (quantitative evaluation of minerals by scanning electron microscopy) indicated similar mineral liberation and association characteristics in the spiral concentrate and tailings, suggesting that these low recoveries were due to a lack of recirculation, rather than insufficient liberation. It was suggested that proper optimisation with both concentrators could be used as a gangue rejection step early in the beneficiation process to preconcentrate the ore, even at coarser particle sizes.
These studies have all indicated that a combination of gravity and magnetic separation may be a suitable processing route to concentrate or preconcentrate REMs in the Nechalacho ore. However, they have not demonstrated that an adequate recovery could be obtained. As such, this study was developed to assess a multi-stage process involving preconcentration using a spiral at a relatively coarse particle size, regrinding followed by further processing using a Mozley laboratory shaking table, and finally magnetic separation. Two stages of magnetic separation were tested. First, low-intensity magnetic separation (LIMS) was assessed to remove iron oxides from the heavy mineral gravity concentrate. The non-magnetic fraction was then processed using a WHIMS to determine if the various REMs could be effectively separated from zircon. The separation of REMs from zircon may be beneficial to the downstream elemental extraction and separation processes.
To assess some of the observations from Marion et al. [11], a coarser primary feed was examined and processed with multiple passes through the spiral to ensure an elevated recovery of valuable material. Each stage of separation was analysed with QEMSCAN to determine the impact of various mineralogical characteristics on separation. It is important to note that this proposed process is not representative of the currently selected process design for the Nechalacho deposit. Any application of this process to this beneficiation of the deposit would require optimisation to ensure appropriate grade and recovery targets are met.

2. Materials and Methods

2.1. Materials

The ore used in this work originated from the Bazal Zone of the Nechalacho deposit (Avalon Advanced Materials Inc., Toronto, ON, Canada) located in the Northwest Territories, Canada. The REEs are hosted in zircon, bastnäsite, synchysite, allanite, monazite, fergusonite, and columbite (Fe), and the major gangue minerals in the deposit are feldspars, quartz, and iron oxides.

2.2. Ore Preparation

A feed sample weighing 15 kg was riffled to produce 1 kg representative charges. Samples were then wet stage ground at 50%w/w solids using a laboratory rod mill for 5 min intervals, to avoid over production of fines, removing all the −150 μm material through sieving between each interval and refilling the mill to ensure a 1 kg charge. Following this initial grinding stage, which produced a product with a d80 and d50 size distribution of 120 μm and 66 μm, respectively, the material was sieved at 53 μm to split it into a fine (d100 = 53 μm) and coarse particle stream (d100 = 150 μm, d50 = 106 μm, d0 = 53 μm). The coarse particle stream was processed using a spiral concentrator. The spiral concentrate was then reground following a similar stage grinding procedure as the initial feed but to −53 μm. The ground concentrate was then combined with the initial fine particle stream and processed using a shaking table followed by magnetic separation. The simplified flowsheet detailing the operations carried out is provided in Figure 2.

2.3. Spiral Concentrator

The spiral separator used in this work was a Walkabout assembly from Mineral Technologies (Carrara, Australia). The unit is composed of a four turn Wallaby trough, with a 208 mm pitch and trough diameter of 360 mm. The sample was fed as a slurry (20%w/w solids) to the top of a spiral, which was fitted with a funnel (for pulse damping), using a diaphragm pump. The coarse particle stream was processed with three stages of spiral concentration. The three spiral concentrates were combined and reground to be processed using a Mozley laboratory shaking table. A flowsheet detailing this process is provided in Figure 3. The spiral concentrates were sampled and analysed using X-ray fluorescence (XRF) and QEMSCAN.

2.4. Mozley Laboratory Shaking Table

Following regrinding of the spiral concentrate, the regrind product was recombined with the fine particle stream and processed using a Mozley laboratory shaking table equipped with a flat deck for fine particle separation (see flowsheet provided in Figure 2). The deck slope was set at 1.5° and it was operated with a stroke length of 5.08 cm and stroke rate of 90 rpm. The material was fed to the table as 100 g representative samples, processing each 100 g sample individually. The products obtained from each sample were combined to form a concentrate blend and a tailings blend, which were analysed using XRF and QEMSCAN.

2.5. Wet Magnetic Test Chute

A Wet Magnetic Test Chute with a ferrite magnet (0.04 T) (Bunting Redditch, Redditch, UK) was employed in this work as a low-intensity magnetic separator. The gravity concentrate produced following separation using the shaking table was processed. Material was poured wet manually into the magnetic chute with non-magnetic material washed down the inclined surface using water. The products were analysed using XRF and QEMSCAN. The non-magnetic fraction was further processed using a WHIMS.

2.6. Wet High Intensity Magnetic Separator

A jaw-type WHIMS concentrator equipped with a coarse expanded metal matrix (Master Magnets, Redditch, UK) was used to process the non-magnetic fraction of the Wet Magnetic Test Chute. The WHIMS was operated at 1.4 T and material was passed through the magnetic matrix as a slurry. The magnetic material trapped in the matrix was recovered as magnetic concentrate. Magnetic and non-magnetic fractions were analysed using XRF and QEMSCAN.

2.7. X-ray Fluorescence

XRF was used in this work to determine ZrO2, Fe2O3, and Ce2O3 content of the feed, as well as the various separation products. Prior to analysis, mineral samples were pulverised and a homogenous glass disk was prepared by fusing the sample with a lithium tetraborate/lithium metaborate fusion flux. The prepared disks were analysed by wavelength dispersion XRF (WD-XRF). The loss on ignition (LOI) was determined separately and gravimetrically at 1000 °C and included in the matrix corrections, which are performed by the XRF software. All XRF analyses were conducted by SGS Canada (Lakefield, ON, Canada). Assays are primarily used as validation of QEMSCAN.

2.8. Quantitative Evaluation of Minerals by Scanning Electron Microscopy

The feed and separation products in this study were analysed using QEMSCAN to determine mineralogical information related to each sample. Prior to analysis, samples were sieved into different size classes and representative samples were micro-riffled to prepare graphite-impregnated polished sections with a 30 mm diameter. They were analysed using QEMSCAN at the Advanced Mineralogy Facility at SGS Canada (Lakefield, ON, Canada). QEMSCAN is an EVO 430 automated scanning electron microscope equipped with four light-element energy-dispersive X-ray spectrometer (EDS) detectors, and iDiscover software was used to process the data and images. QEMSCAN operates with a 25 kV accelerating voltage and a 5 nA beam current. The QEMSCAN measures, and the iDiscover software processes, data from every pixel across a sample with a pixel size defined based on the scope of the analysis. The software assigns each pixel a mineral name based on 1000 counts of energy dispersive X-ray spectral data and backscatter electron intensities.
If the minerals or constituent phases comprising the sample are chemically distinct, QEMSCAN is capable of reliably discriminating and quantifying minerals. Magnetite and hematite are grouped and referred to as Fe-oxides. The mineral definitions were validated and refined to fit the particular samples. A reference mineral list was developed using XRD (primarily to define the major minerals), a scanning electron microscope (SEM) equipped with an energy dispersive spectrometer, and electron probe micro-analysis (EPMA). REMs were identified based on their major REE composition.
The samples were analysed using the Particle Mineral Analysis (PMA) method. PMA is a two-dimensional mapping analysis aimed at resolving liberation and locking characteristics of a set of particles. A pre-defined number of particles were mapped at a pixel size of 3.4–7 μm.

3. Results and Discussion

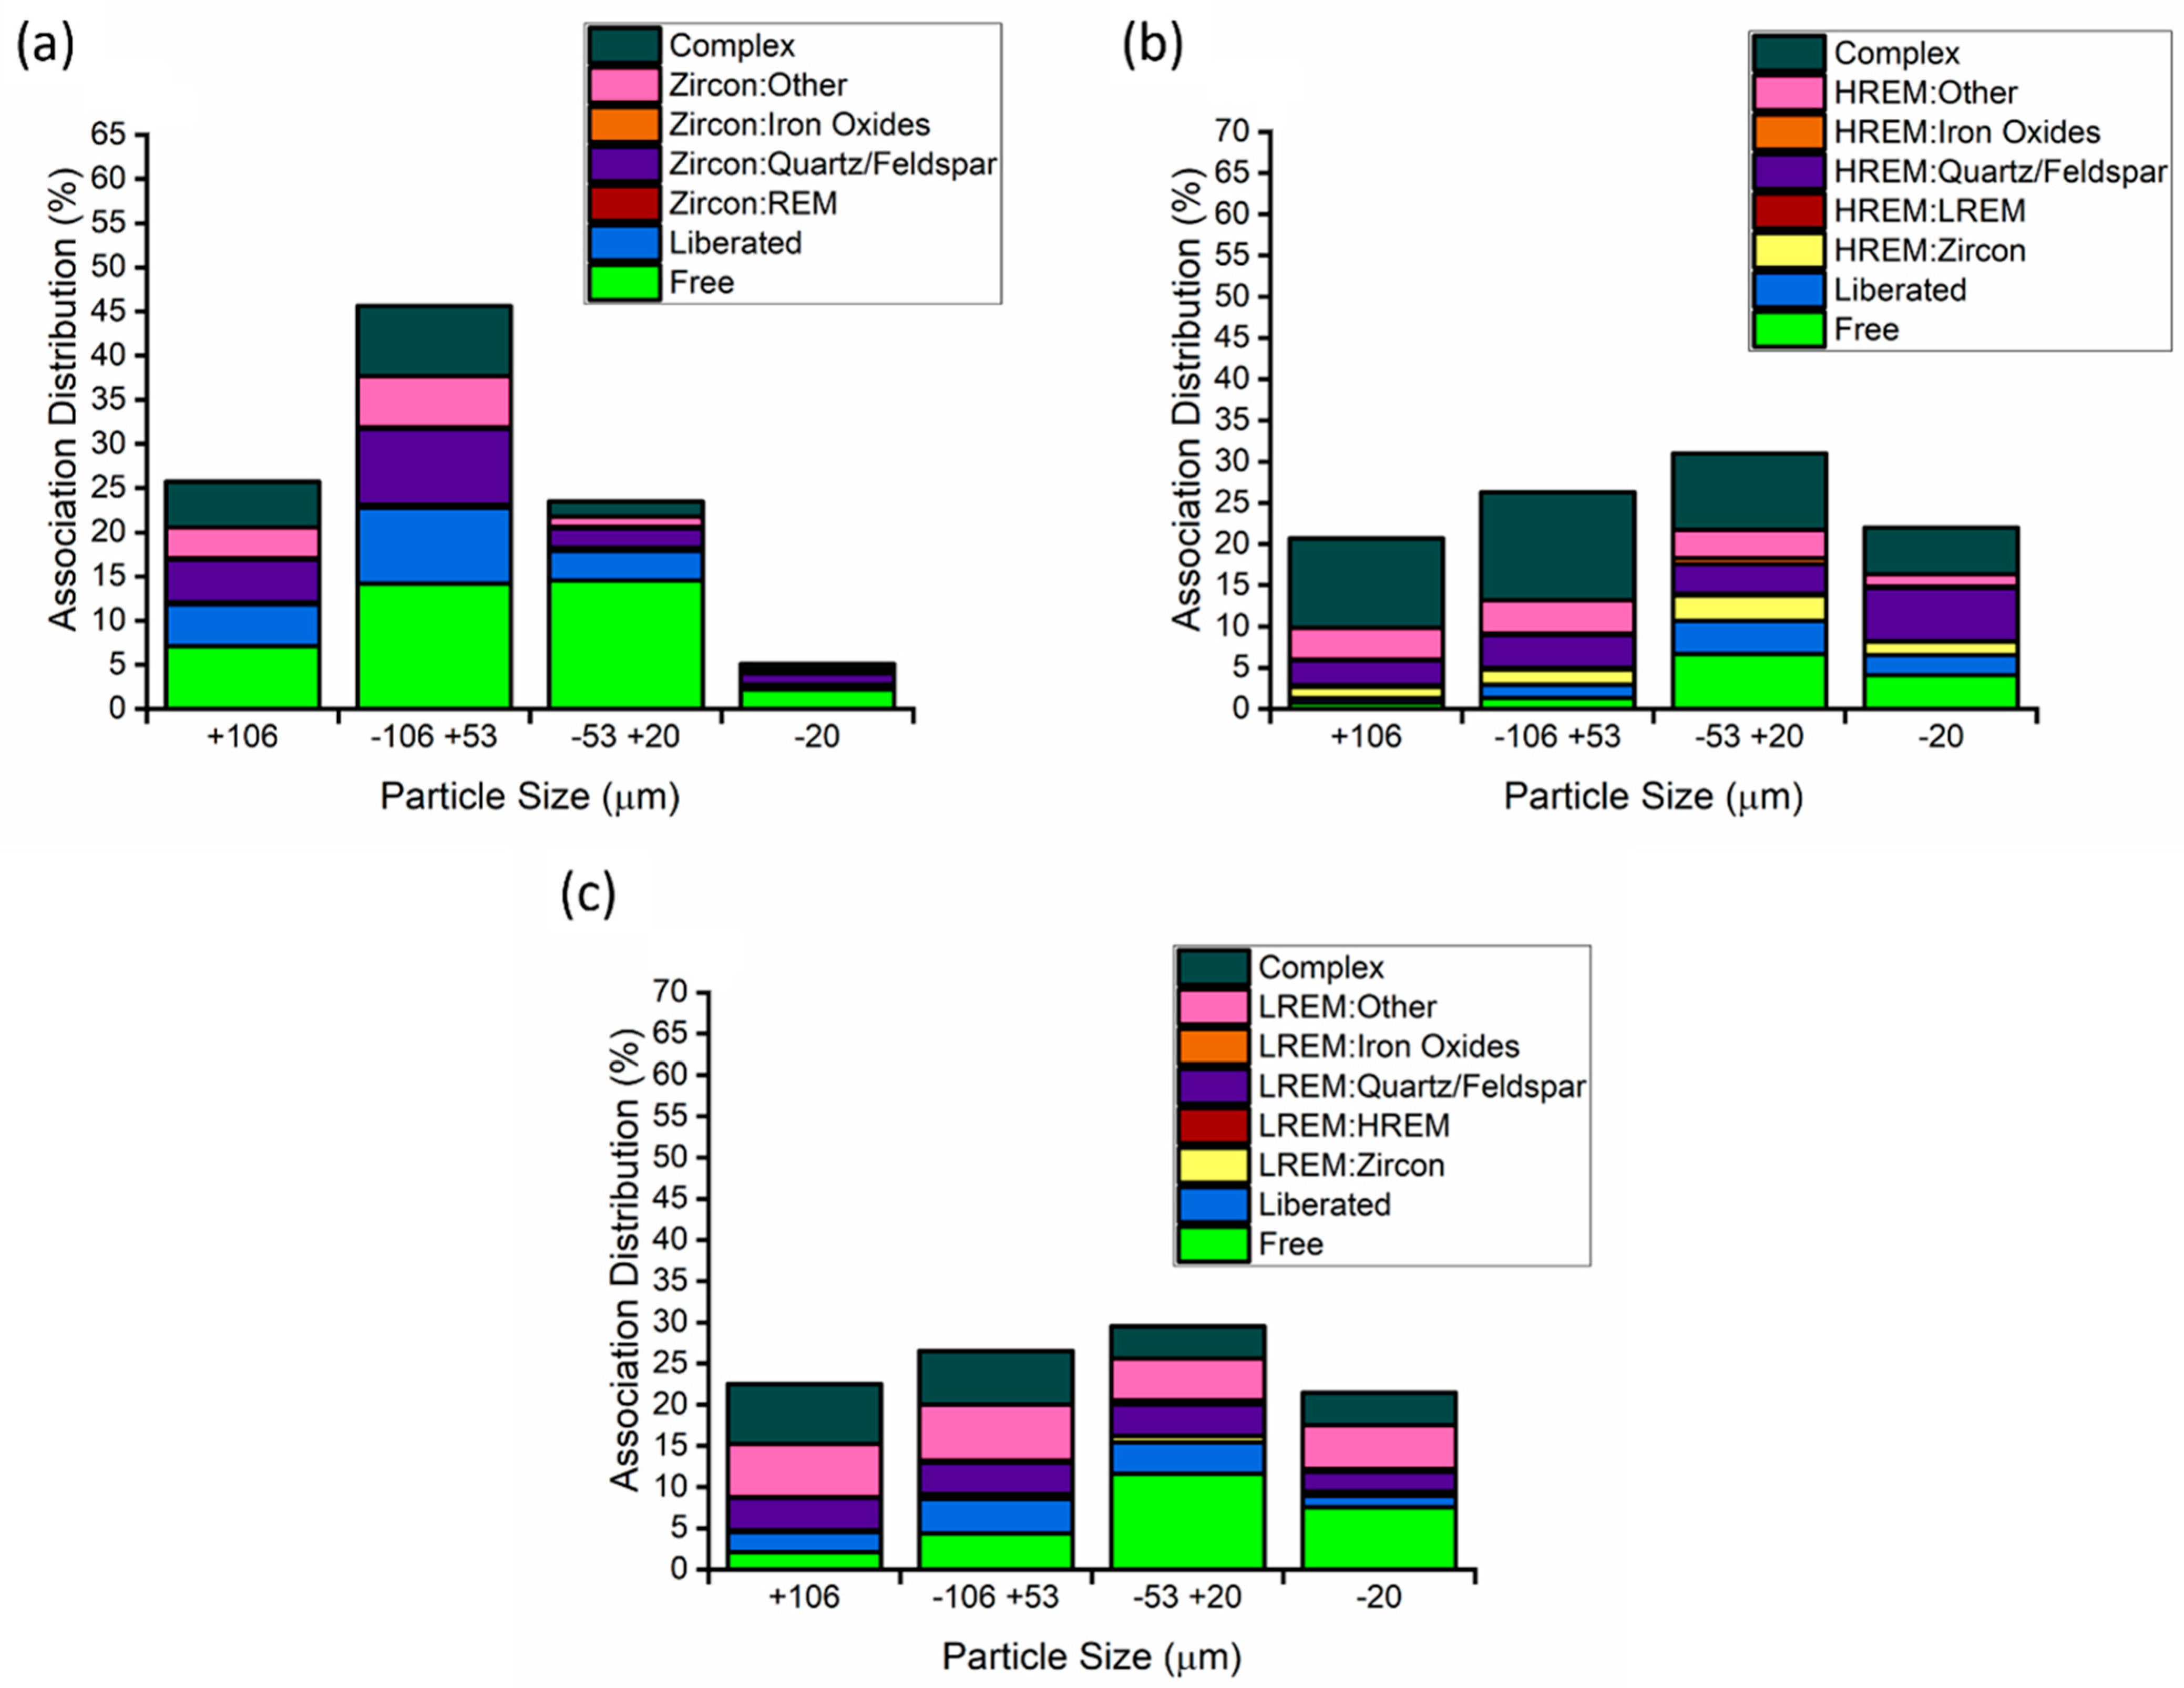
3.1. Feed Characteristics

The mineralogy and elemental content of the feed, sorted by size following the initial grind (Figure 2), are given in Table 1 and Table 2 respectively. REMs are grouped into LREMs, comprised of predominantly LREE-bearing minerals (bastnäsite, synchysite, allanite, and monazite), and HREMs, comprised of HREE-bearing minerals (fergusonite and columbite (Fe)). The size-by-size mineralogical analysis of the feed sample indicates that zircon is significantly enriched in >20 μm size fractions, which is consistent with the findings of Jordens et al. [9] and Marion et al. [11]. This reiterates the conclusion from those studies that optimising the grinding and classification circuit may provide an opportunity to preconcentrate zircon in the ore through selective comminution.
The liberation and association behaviour of valuable minerals (zircon, HREMs, and LREMs) in the ore following the initial grinding stage are shown in Figure 4. The QEMSCAN definition of “Free” refers to particles with the mineral of interest having greater than 95% of the particle surface area, and “Liberated” refers to particles with less than 95% and greater than 80% of the surface area. The results indicate that liberation (“Free + Liberated”) of zircon, HREMs, and LREMs in the feed are 55%, 22%, and 37%, respectively. The poor liberation of REMs is expected, as they are fine grained (average grain size of REMs is 20 μm). However, it is noted that even in the finest (−20 μm) size class, HREM (30%) and LREM (41%) liberation remains poor. This suggests that liberating these minerals to a high degree is likely to be challenging. Jordens et al. [10] achieved a much greater REM liberation (>70% LREM; >50% HREM) when grinding the ore using a ball mill to a d80 of 40 μm compared to the rod mill used in this present study. This suggests that the grinding method has a large impact on liberating REMs. It is likely that the ball mill produces more ultra-fine (<10 μm) particles, improving liberation, or improved liberation may be a result of different breakage mechanisms in the ball mill. More work is required for a fundamental understanding of the mechanisms involved.
Although the liberation of value minerals (particularly REMs) is poor at a d80 of 120 μm, QEMSCAN data suggest that they are present in relatively high-SG particles. Particle SG distributions are determined by estimating the volumetric composition of a particle from the two-dimensional phase map and stereological corrections in the QEMSCAN software [13]. Each mineral is assigned a SG value, and the SG of each particle is calculated based upon its constituents. With the SG distribution of particles containing a specific mineral and the SG distribution of all particles in the sample, theoretical grade and recovery values can be determined by artificially splitting the sample at a given SG. The accurate prediction of such an analysis has been demonstrated by Marion et al. [11], comparing the QEMSCAN estimated results to those obtained from heavy liquid separation. The theoretical upgrading and recovery of zircon, HREMs, and LREMs of the feed at an SG of 3.5 and 4.0 is given in Figure 5.
At an SG of 3.5, the predicted recovery of zircon, LREMs, and HREMs is 85%, 71%, and 69%, respectively. The corresponding upgrade ratios are 4.5 (zircon), 3.7 (LREMs), and 3.6 (HREMs). At an SG of 4.0, the predicted recoveries are 74% (zircon), 44% (LREMs), and 54% (HREMs), and upgrade ratios are 5.4 (zircon), 3.2 (LREMs), and 4.0 (HREMs). This demonstrates that the valuable minerals are concentrated in particles of high SG, but if particles have SG 3.5 to 4.0 then they are not effectively recovered, and REM losses may be significant.
Examination of the mineralogical results by size fraction provides some interesting observations. The highest grade of valuable material following the theoretical split is the +106 μm fraction, and recoveries remain relatively high (>60% at SG 3.5). As liberation is poor at this size, it is suggested that mineral association behaviour and/or grain size distributions could present opportunities to concentrate the ore at a particle size coarser than that which is studied here. Although this could have a negative impact on the overall recovery of a gravity preconcentration stage, it could further reduce the energy requirements of grinding and have an overall benefit on the economics. Much like when examining the combined feed, Figure 5b does indicate that REM recoveries could be low if material of SG between 3.5 and 4.0 is not effectively recovered.
A second observation is the relatively poor upgrading and low recoveries predicted for the material <20 μm. This finding is consistent with the liberation and association data presented in Figure 4. REMs are poorly liberated and associated with low SG gangue and therefore present in low SG particles. High losses of REMs in this size class are expected; however, as previously discussed, optimising the comminution circuit could alter the liberation profile to allow for improved separation.

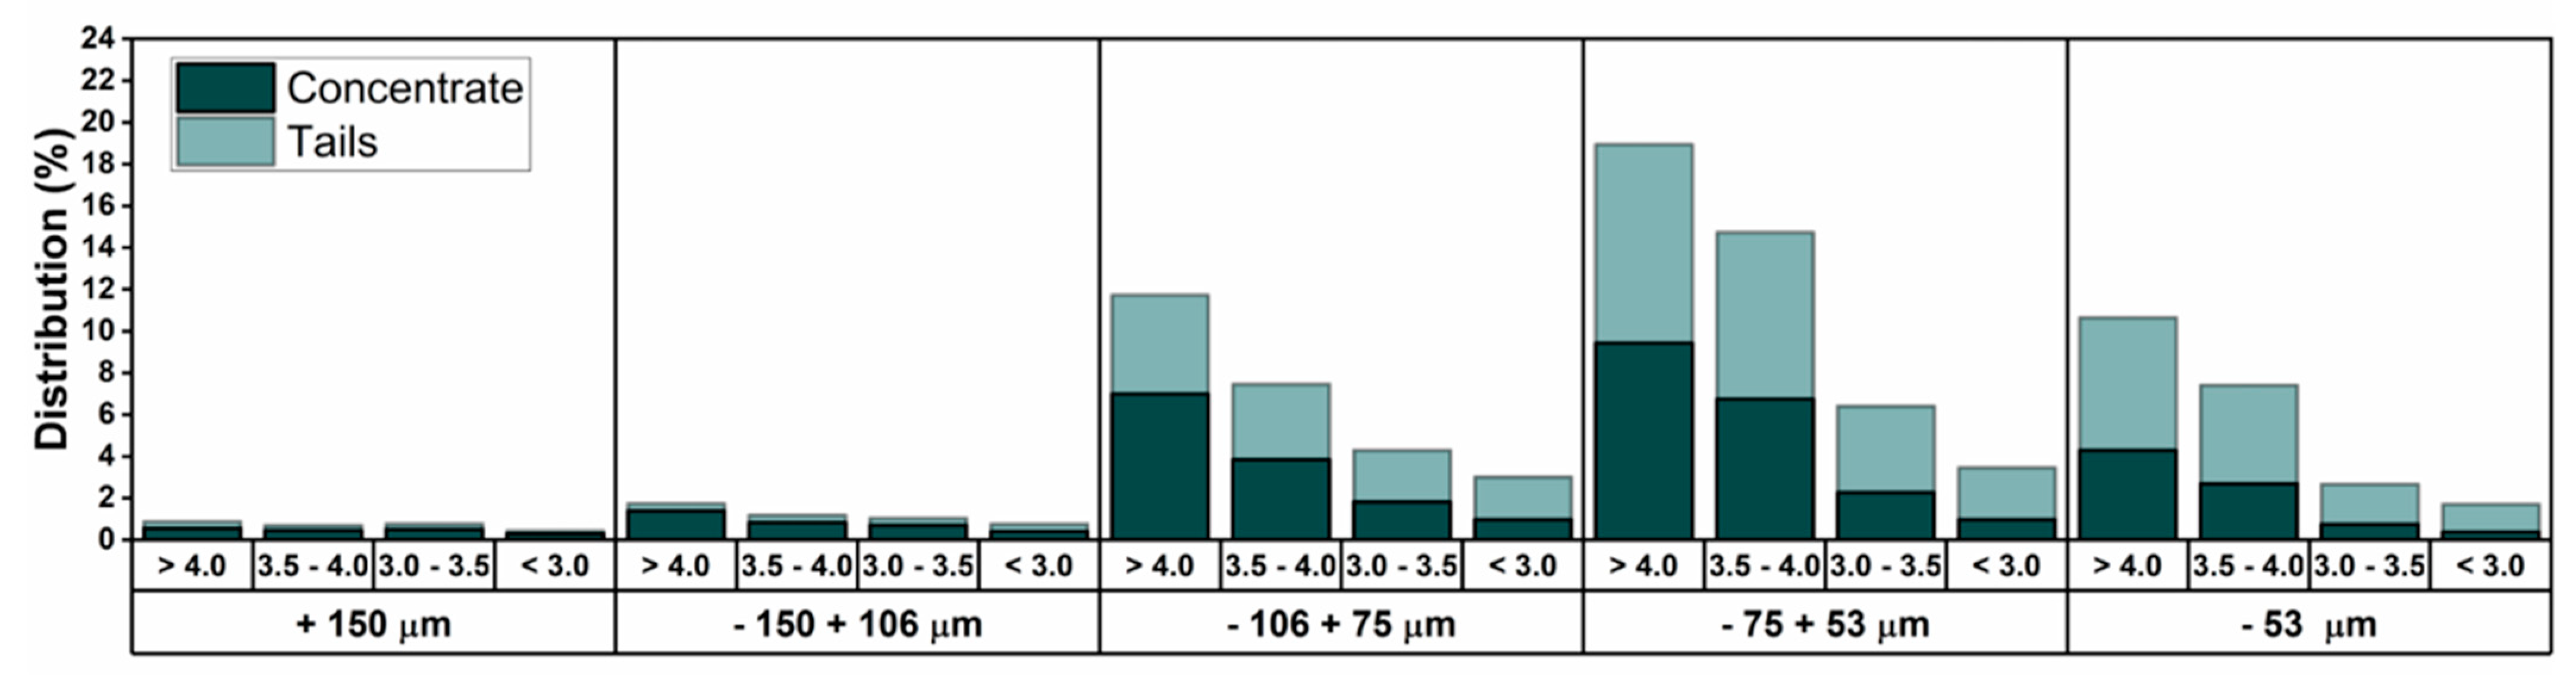
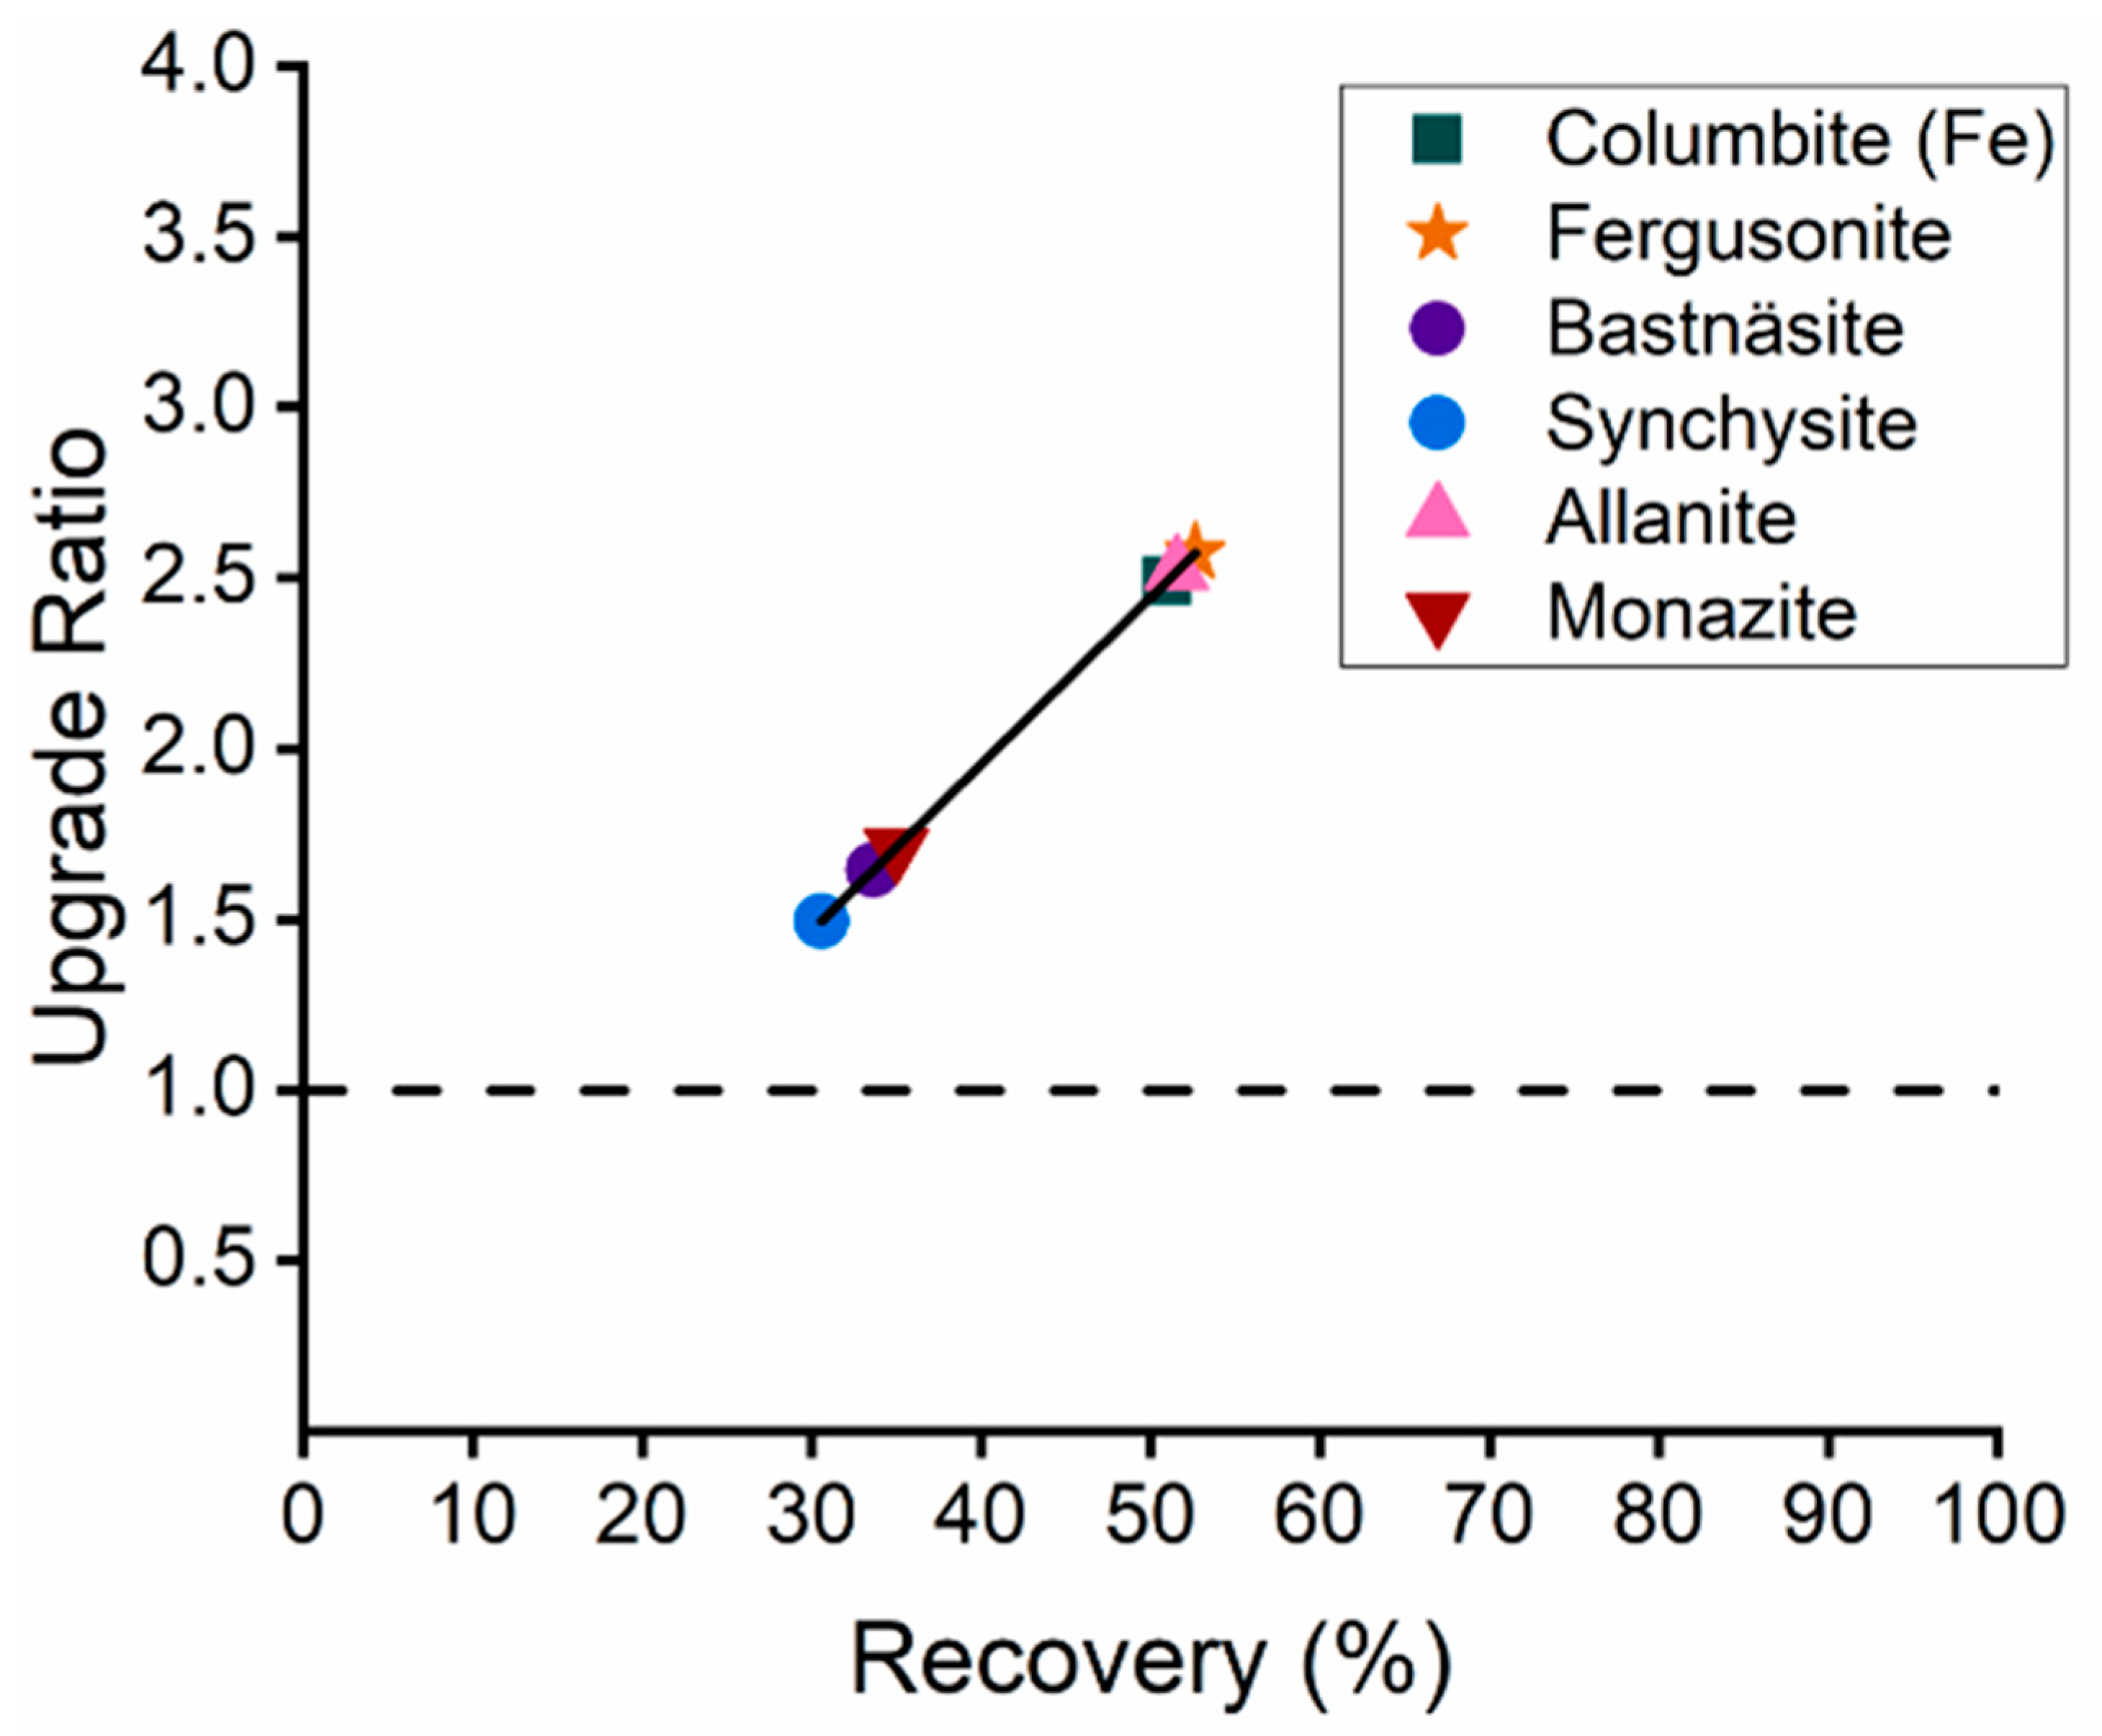
3.2. Spiral Concentrator

The cumulative upgrade ratio and recovery plots of the major mineral classes (determined from QEMSCAN) and equivalent metal oxides (ZrO2 and Ce2O3) (determined from XRF) following each pass of the spiral are shown in Figure 6 and Figure 7, respectively. After a single pass, the concentrate recovered 57% of the iron oxides, 56% of the zircon, 50% of the LREMs, and 47% of the HREMs, upgrading the feed by 2.3, 2.3, 2.0, and 1.9, respectively. These results are improved over those observed in [11]. This is unexpected if one were to compare only the liberation characteristics of the feed for this work to that of the preliminary study (which was of finer size with a greater degree of liberation). However, these improvements are likely realised due to the coarser feed being better suited for separation in the spiral, coupled with the fact that valuable mineral-bearing particles remain of sufficiently high SG (Figure 5). Similar to the initial study, the spiral is significantly better at rejecting feldspar than quartz.
After reprocessing the tails, zircon, HREM, and LREM recoveries respectively increased to 81%, 73%, and 74% after a second pass, and 91%, 86%, and 86% after a third pass. However, upgrading was impacted after each subsequent pass and the grade of valuable material in the third concentrate was lower than that of the initial feed. The cumulative mass percentage of the spiral feed reporting to the tailings after each concentrate was 17%, 31%, and 33%, which correspond to 10%, 19%, and 20% of the initial feed. Further optimisation of this process is required; however, these findings suggest that it is possible to recover a high percentage of value minerals while effectively rejecting gangue (particularly feldspar) using a spiral concentrator.
To better investigate the effectiveness of each stage of separation, upgrade ratio vs. recovery plots relative to the feed for each separation step (i.e., tails of pass 1 are the feed for pass 2, and tails of pass 2 are the feed for pass 3) are illustrated (Figure 8). These results indicate that although the process becomes less selective with each subsequent pass, enrichment is still occurring. Future work should investigate spiral circuits which include rougher, cleaner, and scavenger stages with recycling to improve the performance of this preconcentration step and ideally produce a high-grade preconcentrate with minimal losses of valuable material.
Figure 9 shows the recovery by liberation of the major mineral classes. After the first pass of the spiral, the recovery of liberated valuable minerals exceeded 62%, and, with a second pass, 82%. The recovery of value minerals which are associated in binary particles with other high-SG minerals (other valuable minerals and/or iron oxides) exceeded 66% after one pass and 85% after the second. This process is effective at recovering zircon, LREMs, and HREMs present in complex particles, with recoveries >43% after the first stage and >72% after the second. This finding reaffirms that unliberated valuable minerals are present in high-SG particles due to grain size differences and mineral associations, and are therefore recoverable. Figure 9e indicates that most of the quartz and feldspar recovered is liberated, which suggests that with optimisation of the process parameters and circuit design, further improvements in grade could be realised.
Figure 10 shows the recovery of mineral particles by SG class. Figure 10a shows the recovery of all particles in the feed. After one pass, the recovery of particles with an SG > 4.0, from 3.5 to 4.0, from 3.0 to 3.5, and <3.5 was 65%, 49%, 30%, and 15% respectively. After a second pass, the respective cumulative recoveries were 86%, 77%, 59%, and 35%. Similar trends were observed for particles bearing zircon (Figure 10b), LREMs (Figure 10c), and HREMs (Figure 10d). The spiral’s effectiveness at recovering and concentrating particles with SG > 4.0 is particularly useful for the preconcentration of zircon, of which 69% is present in particles with an SG > 4.0. Although the liberation of zircon is greater than that of HREMs and LREMs, both mineral classes are primarily found in high-SG particles. The recovery of HREMs of particles that are greater than SG 4.0 accounts for 51% of HREMs, and, of those greater than SG 3.5, accounts for 66%. Recovery of LREMs which are recovered and of particle SG > 4.0 is lower, at 40%, and of SG > 3.5 is similar, at 69%. This may suggest that HREMs are more preferentially associated with other high-SG minerals than LREMs, given the average grain sizes are similar (approximately 20 μm). It may also be the result of a significant quantity (32%) of the LREM content being allanite, which has a low SG (3.5–4.2) relative to the other major REMs in the deposit (SG > ~5.0). It is noted that the recovery of allanite in this stage does not differ significantly from that of other REMs.
A comparison of the SG distributions of zircon obtained here (Figure 10b) to those observed by Marion et al. [11] (Figure 11) indicates distributions for zircon are more advantageous for gravity separation (more material in SG > 4.0 particles) even at a coarser particle size. This feed was prepared through stage grinding with a rod mill, whereas the feed used in Marion et al. [11] was ground with one stage using a ball mill. This demonstrates that the comminution process plays a critical role in the effectiveness of this preconcentration step, which should be optimised to ensure the properties of feed are ideal for separation using a spiral at coarse particle sizes. One area of focus for future work is to examine the SG distributions of valuable minerals at coarser sizes than those investigated here, using various methods of comminution (rod mill, ball mill, high pressure grinding rolls, etc.). If valuable minerals remain in high-SG particles, the spiral may be effective at preconcentrating a coarser feed, which could have significant benefits, particularly in energy savings in comminution.

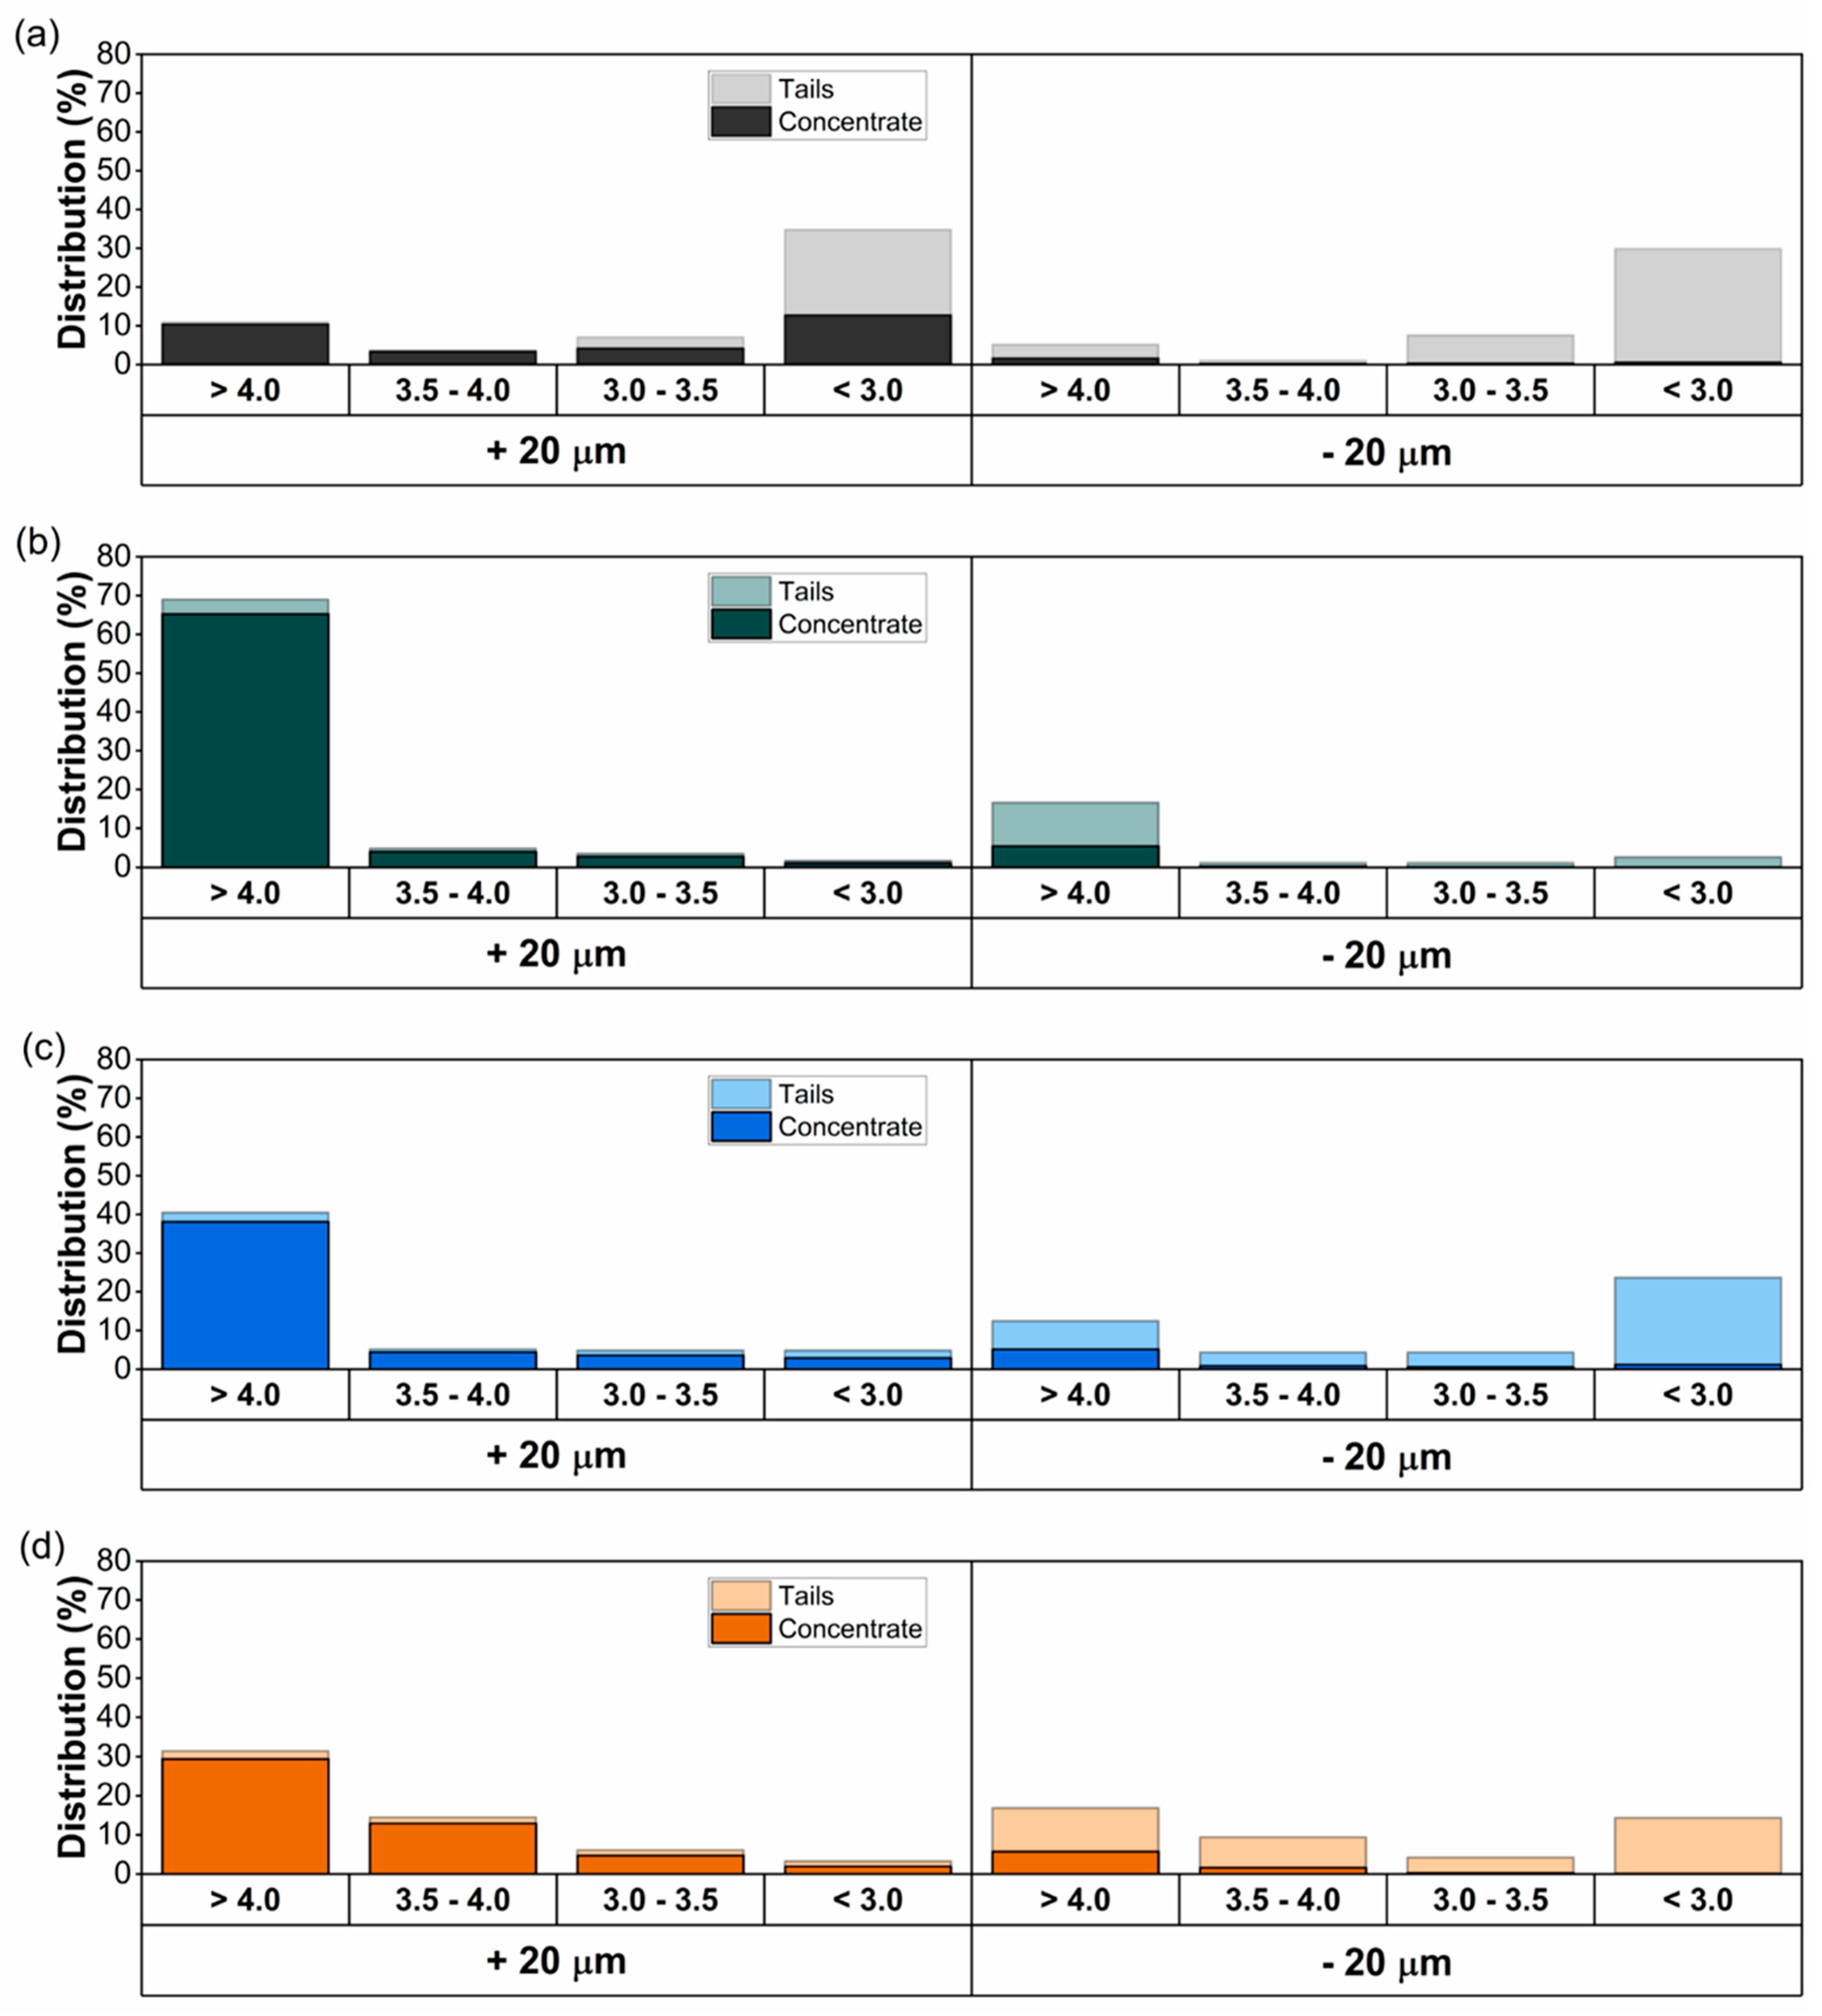
3.3. Mozley Laboratory Shaking Table

Following the initial preconcentration stage using the spiral, the concentrate was reground, combined with the fine particle stream, and processed with a Mozley laboratory shaking table (Figure 2). The upgrade ratio and recovery of the major mineral classes relative to the shaking table (after spiral concentration) feed and to the initial feed (before spiral concentration) are shown in Figure 12. The corresponding ZrO2 and Ce2O3 upgrade ratio and recovery are shown in Figure 13. The recovery by size and SG class are shown in Figure 14. The table is highly effective at recovering and concentrating zircon. This is a result of the fact that the majority of zircon is present in particles >20 μm with a SG > 4.0. Figure 14 illustrates that the minor zircon losses are from fine <20 μm particles. Most of these particles are of elevated SG but are likely too fine to be recovered by the shaking table [14].
Although the recovery and upgrading of LREMs and HREMs are lower than those of zircon, they follow a similar trend. REM-bearing particles > 20 μm are primarily present as particles of SG > 4.0 (particularly HREMs) and well recovered, and the primary losses occur at particle sizes < 20 μm. Similar to zircon, part of these losses might be attributed to being too fine. However, even if effective recovery of fine-grained high-SG particles were achieved, significant REM losses would occur from the large proportion present in SG < 3.0 particles (Figure 14). Optimisation of the comminution circuit may provide improvements in the SG distribution of REMs, which would provide opportunities to better recover these minerals.
Although these results show promise, particularly for particles in the size range of 20 μm to 53 μm, it should be noted that the Mozley laboratory shaking table is a laboratory device, and does not directly represent an industrial shaking table. However, it does offer some understanding of the potential of using a gravity separator to further upgrade the preconcentrate produced by the spiral. One potentially promising technique that deserves further attention is a Multi-Gravity Separator (MGS). An MGS has been shown to offer better results than a Mozley laboratory shaking table, especially for particles less than 20 μm [14]. Promising results using an MGS have also been demonstrated on a Turkish bastnäsite ore [15,16]. However, it is noted that, industrially, shaking tables are much more commonly employed and have been used in various flowsheets developed for three of the largest REE mines in China: the Bayan Obo, the Maoniuping, and the Weishan deposits [17,18,19,20,21,22].

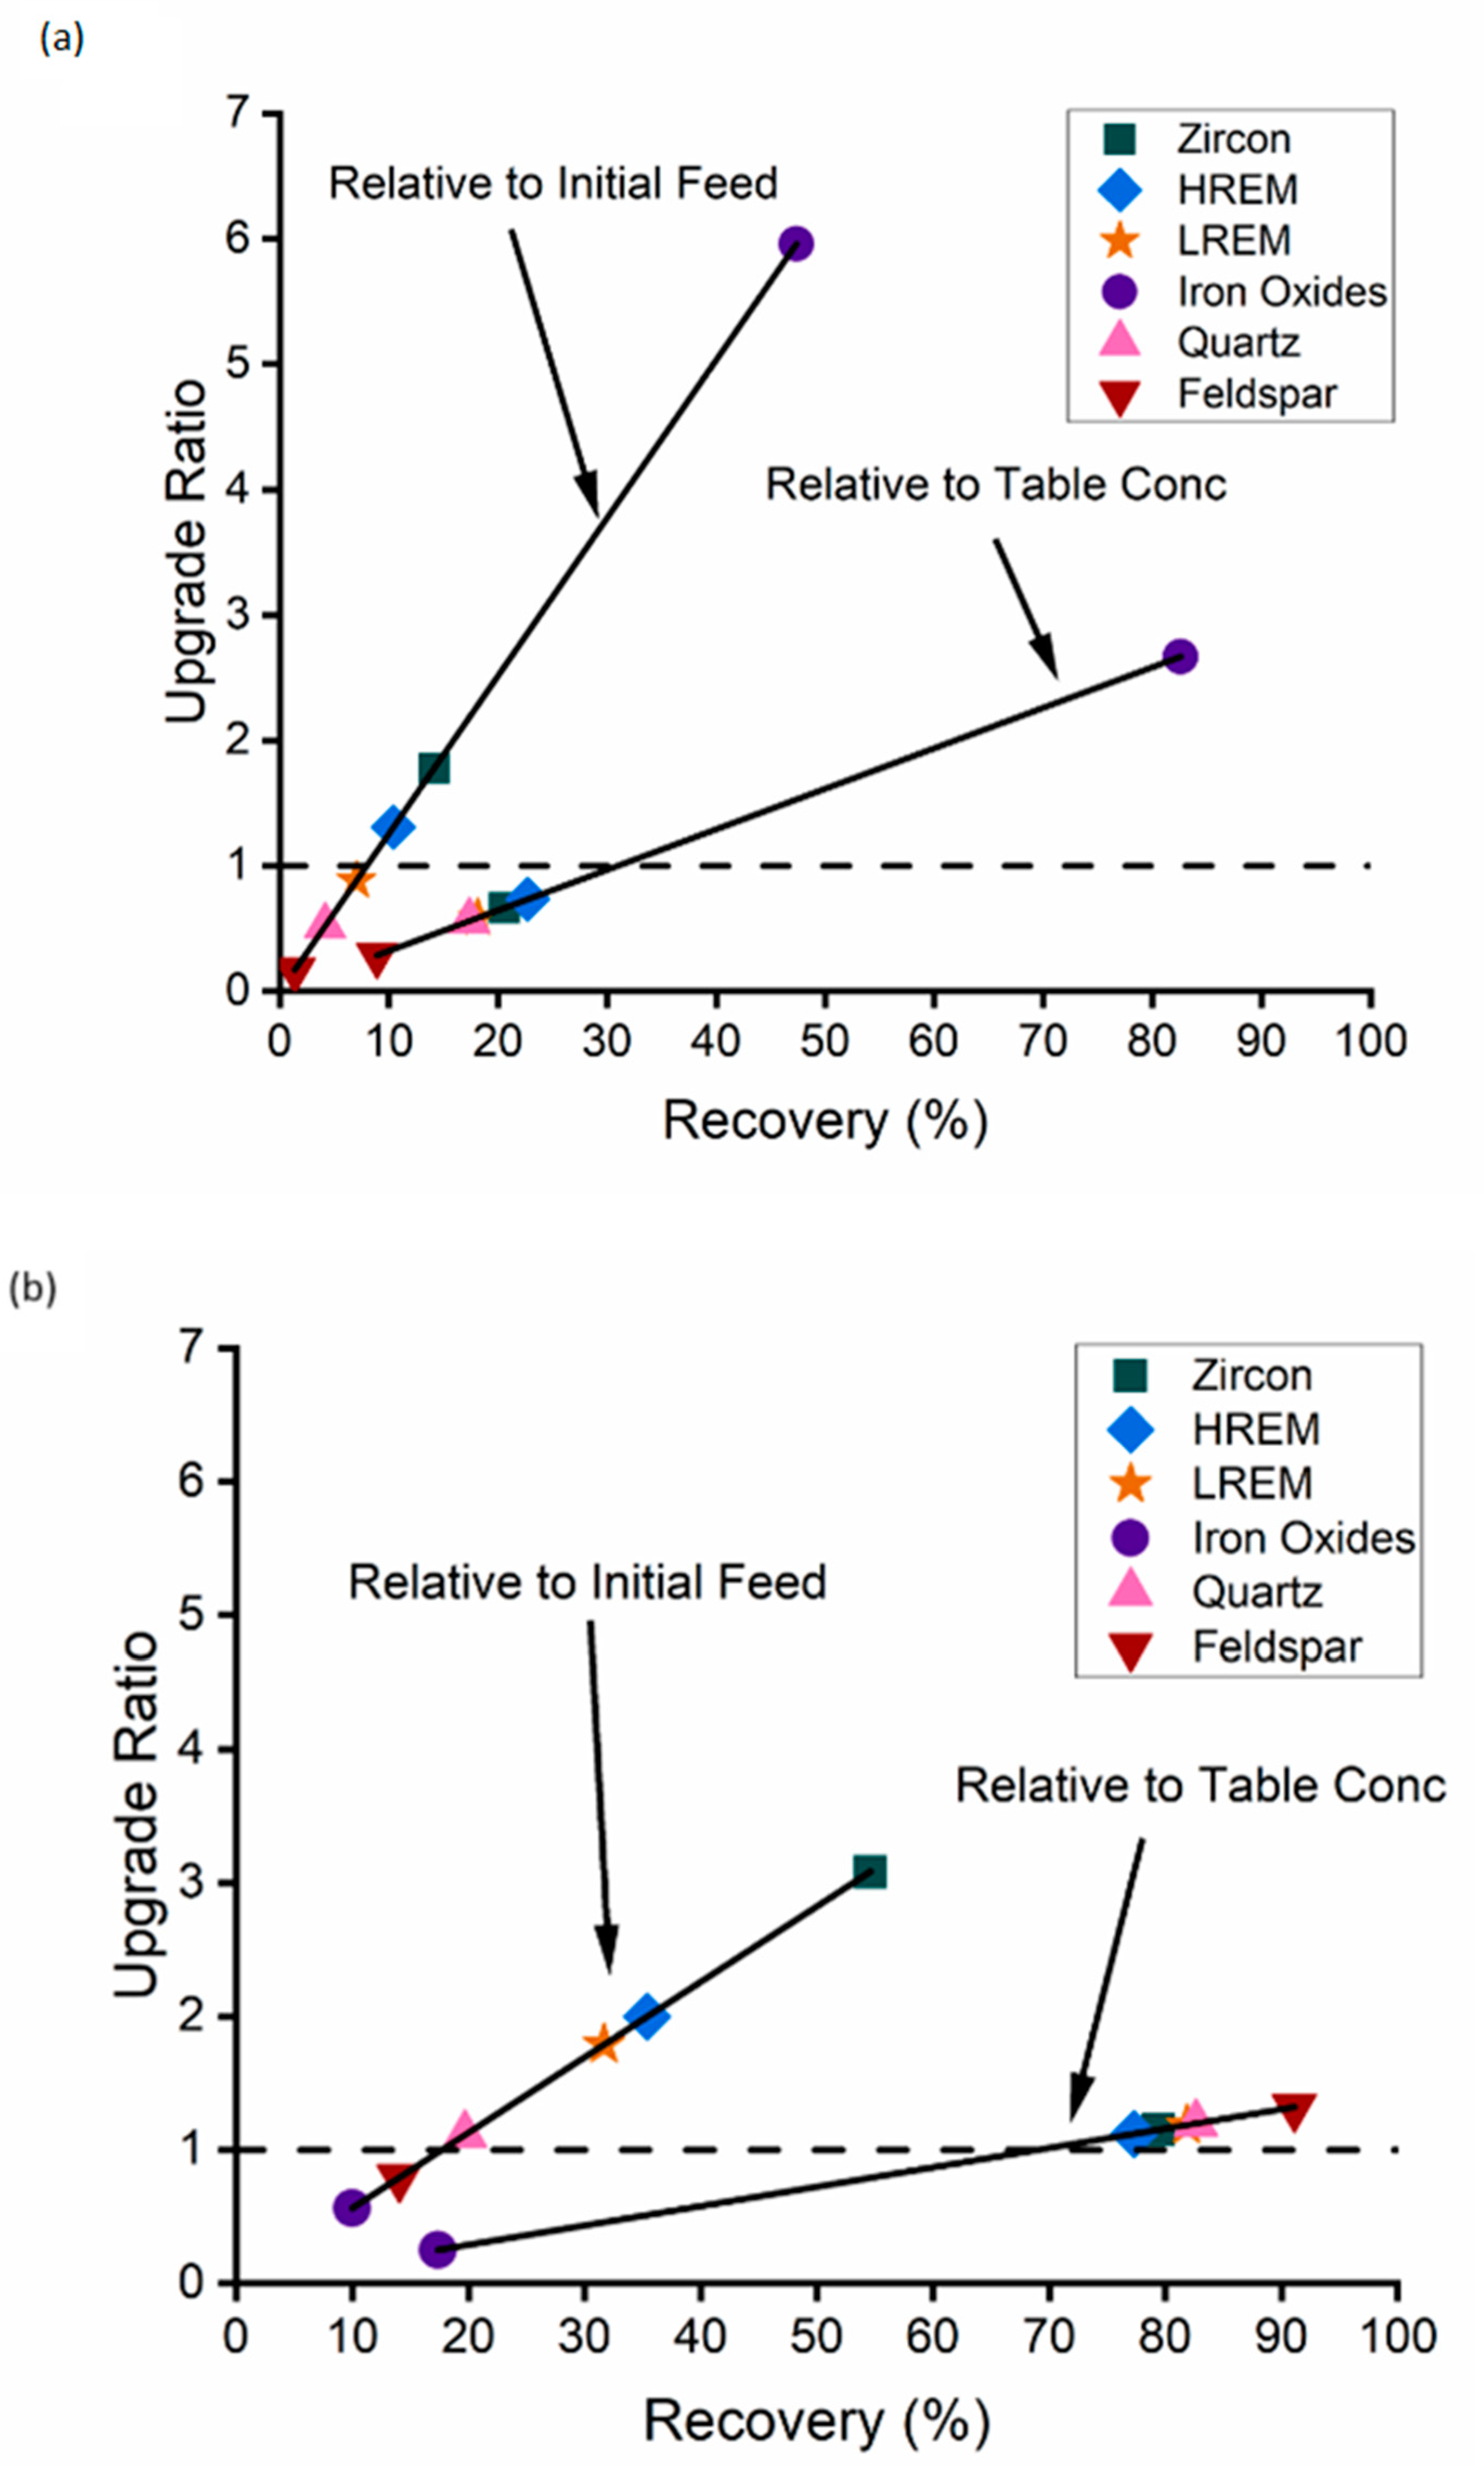
3.4. Wet Magnetic Test Chute

After tabling, the heavy mineral concentrate was processed using a Laboratory Wet Magnetic Test Chute as a LIMS step to assess the removal of iron oxides. The upgrade ratio and recovery of the major mineral classes in the magnetic and non-magnetic classes are shown in Figure 15. Elemental (ZrO2, Ce2O3, and Fe2O3) upgrade ratio and recovery values determined via XRF are shown in Figure 16. The results are presented relative to the feed to the magnetic separation step (the table concentrate) and to the initial feed sample.
The results demonstrate that iron oxides can be removed (80% recovery (relative to the table concentrate)); however, losses of zircon and REMs to the magnetic fraction are significant (~20% (relative to the table concentrate)). These minerals are reported as paramagnetic or diamagnetic [8,23,24,25,26,27], and therefore they would not be expected to report to the magnetic fraction following separation with the Wet Magnetic Test Chute. Thus, they are recovered as a result of being entrapped by magnetic material (iron oxides), being associated in particles with highly magnetic material, or they possess some highly paramagnetic or ferromagnetic properties. The liberation and association distribution of minerals in the magnetic and non-magnetic fractions are given in Figure 17. The results indicate that most of the valuable mineral-bearing particles (particularly zircon) in the magnetic fraction are free. The QEMSCAN definition of a free particle used here is that >95% of the particle surface area is a single mineral. A <5% association with a highly magnetic species, such as magnetite, may cause these particles to report to the magnetic fraction. However, zircon particle maps (Figure 18) do not show any evidence of this occurring. Therefore, one would suspect this material is recovered by entrapment or that some zircon (altered) in the Nechalacho deposit may possess a high degree of para/ferromagnetism. If it is the latter, an alternative beneficiation technique (such as flotation) may be preferred to avoid these losses.
As an alternative to the upgrade ratio and recovery plots given in Figure 15, the grade and recovery (relative to the initial feed) of the non-magnetic fractions are given in Figure 19. Mineral grades in this fraction were 18% zircon, 1.5% HREMs, 5.8% LREMs, 6% iron oxides, 16% quartz, and 37% feldspars. The elevated quartz and feldspar grades and relatively low valuable mineral recoveries are a result of the effectiveness of the preceding gravity separation stage. The results from Section 3.2 and Section 3.3 imply that, with optimisation, improved silicate gangue rejection and heavy mineral recovery could be achieved. Given that this low magnetic separation stage indicates effective removal of iron oxides, it is suggested that a flowsheet employing gravity and magnetic separation could produce a high-grade concentrate with adequate recoveries. Future work on the optimisation of each stage is required to confirm this hypothesis.

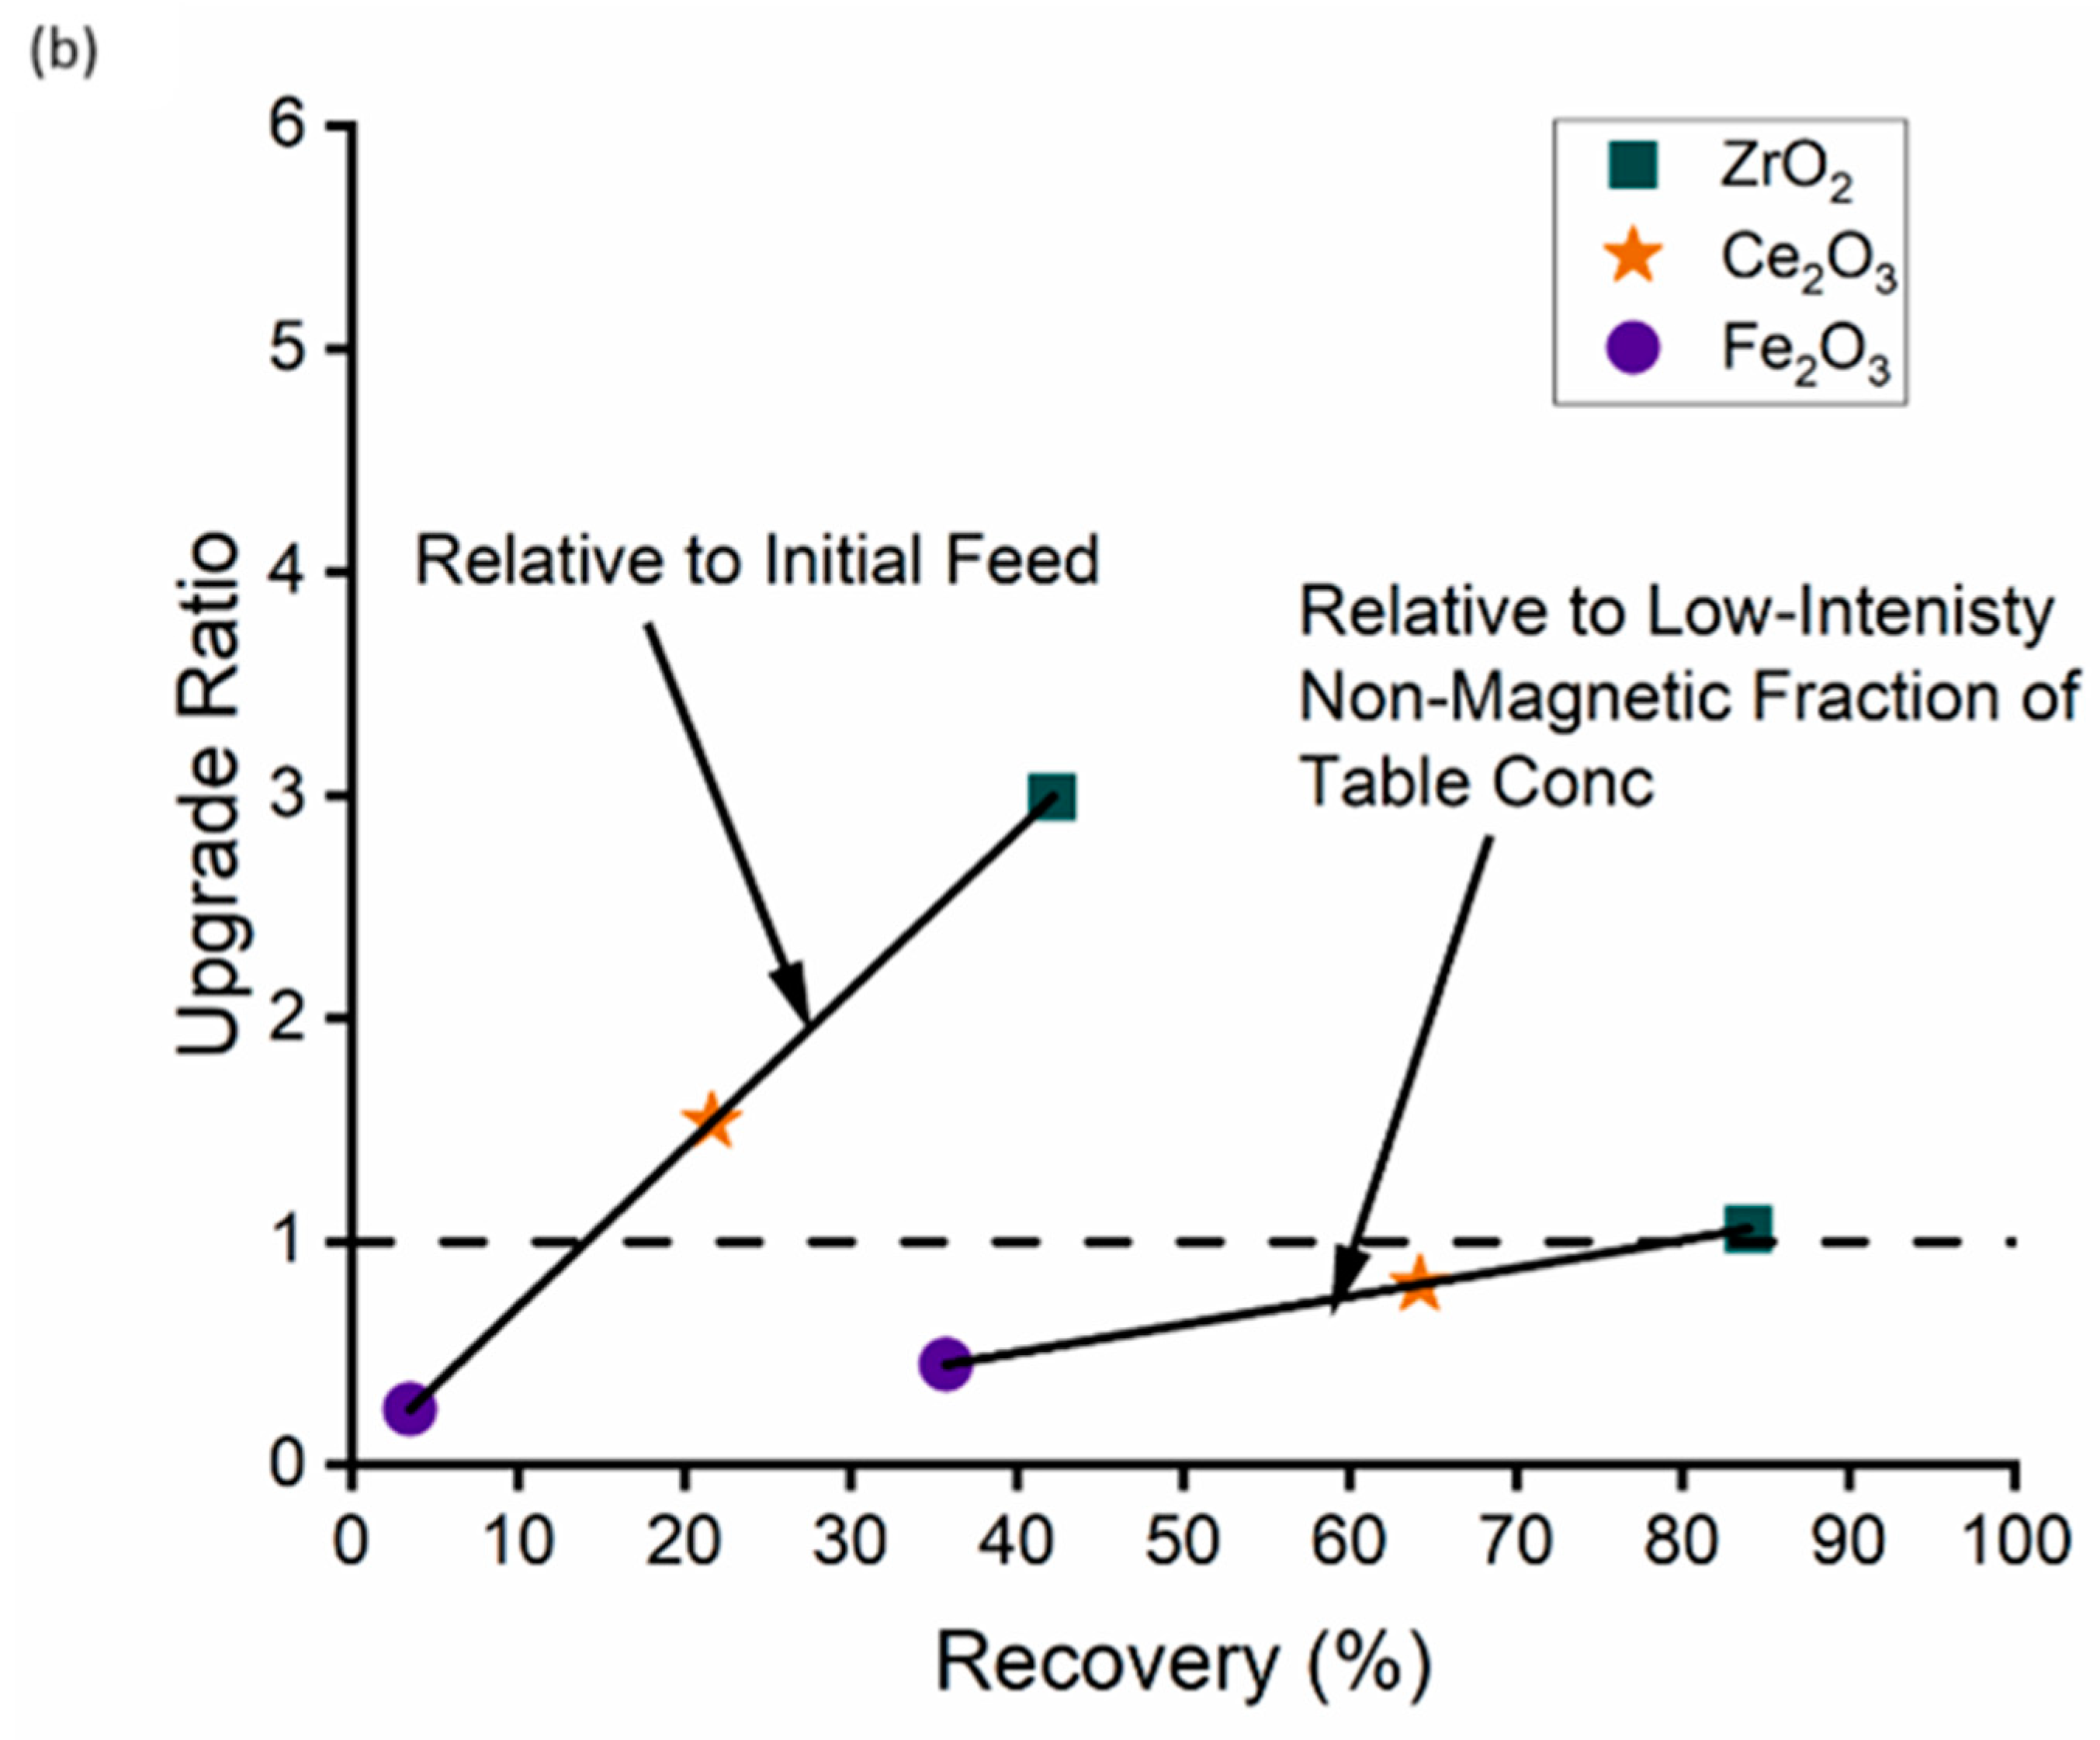
3.5. Wet High-Intensity Magnetic Separator

The preceding results suggest that, with optimisation, a high-grade bulk zircon/REM concentrate could be produced employing a gravity separation step to remove silicate gangue and a low-intensity magnetic separation stage to remove iron oxides. It may be of interest to then separate REMs from zircon as their response in downstream elemental extraction and separation processes is likely to differ (leaching and digestion of zircon is more difficult than other REMs such as bastnäsite). As most of the REMs in the deposit (apart from synchysite) are paramagnetic and zircon is diamagnetic, a WHIMS was tested with the goal of separating REMs from zircon.
The upgrade ratio and recovery of the major mineral phases in the WHIMS (operated at 1.4 T) products are shown in Figure 20. The elemental (ZrO2, Ce2O3, and Fe2O3) upgrading and recovery can be seen in Figure 21. The results indicate that the HREMs and LREMs (along with the remaining iron oxides) are concentrated in the magnetic fraction, with the majority of zircon reporting to the non-magnetic fraction. Although this demonstrates REMs can be concentrated, the recovery (relative to the WHIMS feed) of HREMs and LREMs is only 51% and 38%, respectively. Apart from synchysite, which has been reported as a diamagnetic mineral [23], all other REMs are paramagnetic. Therefore, those that report to the non-magnetic fraction may be insufficiently liberated or too fine (relative to their magnetic susceptibility) to be recovered with the employed WHIMS conditions (matrix type, field strength, and/or field gradient). Increasing the magnetic field strength may be beneficial; however, this can also result in a lower magnetic force acting on particles. Therefore, it may be more effective to increase the magnetic field gradient by employing a different matrix design, or using a different technique all together, such as an HGMS (i.e., SLon).
Figure 22 assesses the magnetic response of the individual REMs. The results indicate that the minerals with the greatest magnetic response were allanite, fergusonite, and columbite (Fe). Bastnäsite, synchysite, and monazite were selectively recovered, although to a lesser extent than the other three REMs. The results correspond well to the magnetic susceptibilities that have been previously reported [8,23,25]. The liberation and association characteristics of zircon, HREMs, LREMs, and iron oxides in the WHIMS products are illustrated in Figure 23. The recovery of liberated HREMs and LREMs to the magnetic fraction was 64% and 41%, respectively. The relatively low recovery of liberated paramagnetic material reiterates that a higher magnetic force is required to recover them at this particle size, and methods with an increased magnetic field gradient should be investigated.
The grade and recovery values (relative to the initial feed) of the WHIMS magnetic and non-magnetic fractions are shown in Figure 24. The WHIMS magnetic product contained REM grades of 15% and the non-magnetic fraction contained zircon grades of 18%. This demonstrates significant REM upgrading (REM feed grade of 3.9), but improved recoveries in the gravity separation stages and through the use of elevated magnetic field gradients will be required.

4. Conclusions

This study investigated a physical-separations-based flowsheet for the Nechalacho REE deposit, employing a spiral, a shaking table, and two stages of magnetic separation. QEMSCAN was employed to understand the effectiveness of each separation stage and provide recommendations to improve the process. The conclusions are as follows:
Although valuable minerals are not liberated at coarse particle sizes, their association characteristics provide opportunities to recover them using a gravity preconcentration step.
The spiral concentrator effectively recovered valuable minerals in the deposit. The QEMSCAN results suggest that, with proper optimisation of the flowsheet, which may include scavenging and cleaning stages, this could be a highly effective process for early gangue rejection.
Following the preconcentration stage and regrinding of the spiral concentrate, a Mozley laboratory shaking table was able to further concentrate the ore, demonstrating a gravity separation step could be used to produce a heavy mineral concentrate for magnetic separation. However, any application of such a stage would likely require an improved recovery of <20 μm particles over that which was achieved here.
Low-intensity magnetic separation was demonstrated as an effective method of removing iron oxides from a heavy mineral concentrate. However, further investigation is necessary to determine if losses of valuable zircon and REMs can be mitigated.
WHIMS was capable of concentrating REMs, leaving most of the zircon in the non-magnetic fraction. However, as REM recovery was low, it is recommended that elevated field gradients would need to be employed if REM and zircon separation is desired.

Author Contributions

Conceptualization, C.M., O.K. and K.E.W.; methodology, C.M., O.K., T.G. and K.E.W.; formal analysis, C.M., T.G. and R.L. (Ronghao Li); investigation, C.M., J.P., R.L. (Ray Langlois), O.K., R.L. (Ronghao Li) and N.A.R.; resources, T.G., N.A.R. and K.E.W.; writing—original draft preparation, C.M. and J.P.; writing—review and editing, C.M., J.P., T.G., R.L. (Ray Langlois), O.K., R.L. (Ronghao Li), N.A.R. and K.E.W.; visualization, C.M.; supervision, K.E.W.; project administration, K.E.W.; funding acquisition, K.E.W. All authors have read and agreed to the published version of the manuscript.

Funding

This research was funded by the Natural Sciences and Engineering Research Council of Canada (NSERC) and Avalon Advanced Materials Inc. through the Collaborative Research and Development (CRD) Program (CRDPJ 44537-12). C.M. would like to acknowledge funding from the NSERC Alexander Graham Bell Canada Graduate Scholarships Program. C.M., J.P. and R.L. (Ronghao Li) would also like to acknowledge funding from the McGill Engineering Doctoral Award.

Data Availability Statement

Data are contained within the article.

Acknowledgments

The authors would like to thank the Advanced Mineralogy Facility at SGS Canada (Lakefield) for the QEMSCAN analysis.

Conflicts of Interest

Author Dr Tassos Grammatikopoulos was employed by the SGS Canada. The remaining authors declare that the research was conducted in the absence of any commercial or financial relationships that could be construed as a potential conflict of interest.

References

  1. Liu, S.-L.; Fan, H.-R.; Liu, X.; Meng, J.; Butcher, A.R.; Yann, L.; Yang, K.-F.; Li, X.-C. Global rare earth elements projects: New developments and supply chains. Ore Geol. Rev. 2023, 157, 105428. [Google Scholar] [CrossRef]
  2. Government of Canada. The Canadian Critical Minerals Strategy from Exploration to Recycling: Powering the Green and Digital Economy for Canada and the World. 2022; ISBN 978-0-660-46339-1. Available online: https://www.canada.ca/content/dam/nrcan-rncan/site/critical-minerals/Critical-minerals-strategyDec09.pdf (accessed on 23 November 2023).
  3. European Commission. Communication from the Commission to the European Parliament, the Council, the European Economic and Social Committee and the Committee of the Regions—Critical Raw Materials Resilience: Charting a Path towards greater Security and Sustainability. 2020. Available online: https://eur-lex.europa.eu/legal-content/EN/TXT/PDF/?uri=CELEX:52020DC0474 (accessed on 4 December 2023).
  4. U.S. Geological Survey. Mineral Commodity Summaries 2023; U.S. Geological Survey: Reston, VA, USA, 2023; p. 210.
  5. Australian Government. Critical Minerals Strategy 2023–2030. 2023. Available online: https://www.industry.gov.au/publications/critical-minerals-strategy-2023-2030 (accessed on 4 December 2023).
  6. Marion, C.; Li, R.; Waters, K.E. A review of reagents applied to rare-earth mineral flotation. Adv. Colloid Interface Sci. 2020, 279, 102142. [Google Scholar] [CrossRef] [PubMed]
  7. Ciuculescu, T.; Foo, B.; Gowans, R.; Hawton, K.; Jacobs, C.; Spooner, J. Technical Report Disclosing the Results of the Feasibility Study on the Nechalacho Rare Earth Elements Project; Avalon Rare Metals Inc.: Toronto, ON, Canada, 2013; pp. 1–307. [Google Scholar]
  8. Jordens, A.; Sheridan, R.S.; Rowson, N.A.; Waters, K.E. Processing a rare earth mineral deposit using gravity and magnetic separation. Miner. Eng. 2014, 62, 9–18. [Google Scholar] [CrossRef]
  9. Jordens, A.; Marion, C.; Langlois, R.; Grammatikopoulos, T.; Rowson, N.A.; Waters, K.E. Beneficiation of the Nechalacho rare earth deposit. Part 1: Gravity and magnetic separation. Miner. Eng. 2016, 99, 111–122. [Google Scholar] [CrossRef]
  10. Jordens, A.; Marion, C.; Langlois, R.; Grammatikopoulos, T.; Sheridan, R.S.; Teng, C.; Demers, H.; Gauvin, R.; Rowson, N.A.; Waters, K.E. Beneficiation of the Nechalacho rare earth deposit. Part 2: Characterisation of products from gravity and magnetic separation. Miner. Eng. 2016, 99, 96–110. [Google Scholar] [CrossRef]
  11. Marion, C.; Grammatikopoulos, T.; Rudinsky, S.; Langlois, R.; Williams, H.; Chu, P.; Awais, M.; Gauvin, R.; Rowson, N.A.; Waters, K.E. A mineralogical investigation into the pre-concentration of the Nechalacho deposit by gravity separation. Miner. Eng. 2018, 121, 1–13. [Google Scholar] [CrossRef]
  12. Grammatikopoulos, T.; Mercer, W.; Gunning, C.; Prout, S. Quantitative characterization of the REE minerals by QEMSCANTM from the Nechalacho Heavy Rare Earth Deposit, Thor Lake Project, NWT, Canada. In Proceedings of the 43rd Annual Meeting of the Canadian Mineral Processors, Ottawa, ON, Canada, 18–20 January 2011. [Google Scholar]
  13. Pascoe, R.D.; Power, M.R.; Simpson, B. QEMSCAN analysis as a tool for improved understanding of gravity separator performance. Miner. Eng. 2007, 20, 487–495. [Google Scholar] [CrossRef]
  14. Traore, A.; Conil, P.; Houot, R.; Save, M. An evaluation of the mozley MGS for fine particle gravity separation. Miner. Eng. 1995, 8, 767–778. [Google Scholar] [CrossRef]
  15. Atalay, U.; Ozbayoglu, G. Beneficiation of Beylikahir complex rare earth deposit of Turkey. Physicochem. Probl. Miner. Process. 1995, 29, 19–29. [Google Scholar]
  16. Özbayoğlu, G.; Ümit Atalay, M. Beneficiation of bastnaesite by a multi-gravity separator. J. Alloys Compd. 2000, 303–304, 520–523. [Google Scholar] [CrossRef]
  17. Chi, R.; Xu, S.; Zhu, G.; Xu, J.; Qiu, X. Benefication of rare earth ore in China. In Proceedings of the Light Metals 2001 as Held at the 130th TMS Annual Meeting, Warrendale, PA, USA, 11–15 February 2001; pp. 1159–1165. [Google Scholar]
  18. Houot, R.; Cuif, J.P.; Mottot, Y.; Samama, J.C. Recovery of rare earth minerals, with emphasis on flotation process. In Materials Science Forum; Trans Tech Publications Ltd.: Stafa-Zurich, Switzerland, 1991; pp. 301–324. [Google Scholar]
  19. Krishnamurthy, N.; Gupta, C.K. Extractive Metallurgy of Rare Earths; CRC Press: Boca Raton, FL, USA, 2015; p. 251. [Google Scholar]
  20. Jordens, A.; Cheng, Y.P.; Waters, K.E. A review of the beneficiation of rare earth element bearing minerals. Miner. Eng. 2013, 41, 97–114. [Google Scholar] [CrossRef]
  21. Li, L.Z.; Yang, X. China’s Rare Earth Ore Deposits and Beneficiation Techniques. In Proceedings of the 1st European Rare Earth Resources Conference, Milos, Greece, 4–7 September 2014. [Google Scholar]
  22. Luo, J.; Chen, X. Research into the recovery of high-grade rare-earth concentrate from Baotou Complex iron ores, China. Miner. Process. Extr. Metall. 1984, 663–675. [Google Scholar]
  23. Al-Ali, S.; Wall, F.; Sheridan, R.; Pickles, J.; Pascoe, R. Magnetic properties of REE fluorcarbonate minerals and their implications for minerals processing. Miner. Eng. 2019, 131, 392–397. [Google Scholar] [CrossRef]
  24. Haapala, I.; Ervamaa, P.; Löfgren, A.; Ojanperä, P. An Occurrence of Monazite in Puumala, Eastern Finland. Bull. Geol. Soc. Finl. 1969, 41, 117–124. [Google Scholar] [CrossRef]
  25. Rosenblum, S.; Brownfield, I.K. Magnetic Susceptibilities of Minerals; US Geological Survey: Reston, VA, USA, 2000; pp. 99–529. [Google Scholar]
  26. Svoboda, J.M. Magnetic Techniques for the Treatment of Materials; Kluwer Academic Publishers: Dordrecht, The Netherlands, 2004. [Google Scholar]
  27. Yang, H.; Rong, Y.; Tang, R.; Xue, X.-X.; Li, Y. Recovery of iron from Baotou rare earth tailings by magnetizing roast. Rare Met. 2013, 32, 616–621. [Google Scholar] [CrossRef]
Figure 1. Flowsheet detailing gravity and magnetic separation experiments carried out by [9]. Figure reproduced with permission from [9].
Minerals 13 01521 g001
Figure 2. Flowsheet detailing gravity and magnetic separation experiments carried out. Mineral grades were determined by QEMSCAN analysis.
Minerals 13 01521 g002
Figure 3. Flowsheet detailing the three stages of spiral concentration to process the coarse particle stream.
Minerals 13 01521 g003
Figure 4. QEMSCAN estimated (a) zircon, (b) HREM, and (c) LREM associations by particle size.
Minerals 13 01521 g004
Figure 5. QEMSCAN predicted upgrade ratio and recovery of zircon, HREMs, and LREMs splitting the feed at a SG of (a) 3.5 and (b) 4.0. The dashed line represents the feed grade.
Minerals 13 01521 g005
Figure 6. Cumulative upgrade ratio and recovery of the major mineral classes in the spiral concentrates.
Minerals 13 01521 g006
Figure 7. Cumulative upgrade ratio and recovery of ZrO2 and Ce2O3 in the spiral concentrates.
Minerals 13 01521 g007
Figure 8. Upgrade ratio and recovery of the major mineral classes in the spiral concentrates produced from the coarse particle fraction relative to the feed of each pass.
Minerals 13 01521 g008
Figure 9. Mineral associations of the spiral products from the coarse particle fraction for (a) zircon, (b) HREMs, (c) LREMs, (d) Fe oxides, (e) quartz/feldspars.
Minerals 13 01521 g009
Figure 10. SG distribution of (a) all particles, (b) zircon, (c) LREMs, and (d) HREMs in the spiral products produced from the coarse particle fraction shown cumulatively such that the total of all bars equates to 100%.
Minerals 13 01521 g010
Figure 11. SG distribution of zircon in the spiral concentrate and tails from the preliminary test work detailed in Marion et al. [11], shown cumulatively as such that the total of all bars equates to 100%.
Minerals 13 01521 g011
Figure 12. Upgrade ratio and recovery of the major mineral classes in the table concentrate relative to the table feed and the initial feed.
Minerals 13 01521 g012
Figure 13. Upgrade ratio and recovery of ZrO2 and Ce2O3 in the table concentrate relative to the table feed and the initial feed.
Minerals 13 01521 g013
Figure 14. SG distribution of (a) all particles, (b) zircon, (c) HREMs, and (d) LREMs in the table products produced shown cumulatively such that the total of all bars equates to 100%.
Minerals 13 01521 g014
Figure 15. Upgrade ratio and recovery of the major mineral classes in the Wet Magnetic Test Chute’s (a) magnetic and (b) non-magnetic fractions. Results are presented relative to the table concentrate and the initial feed.
Minerals 13 01521 g015
Figure 16. Upgrade ratio and recovery of ZrO2, Ce2O3, and Fe2O3 in the Wet Magnetic Test Chute’s (a) magnetic and (b) non-magnetic fractions. Results are presented relative to the table concentrate and the initial feed.
Minerals 13 01521 g016
Figure 17. Mineral associations of the Wet Magnetic Test Chute’s magnetic and non-magnetic fractions for (a) zircon, (b) HREMs, (c) LREMs, and (d) Fe oxides.
Minerals 13 01521 g017
Figure 18. Free zircon particles.
Minerals 13 01521 g018
Figure 19. Grade and recovery of the major mineral classes in the Wet Magnetic Test Chute’s non-magnetic fraction, relative to the initial feed.
Minerals 13 01521 g019
Figure 20. Upgrade ratio and recovery of the major mineral classes in the (a) magnetic and (b) non-magnetic fractions following WHIMS. Results are presented relative to the non-magnetic fraction of the table concentrate and the initial feed.
Minerals 13 01521 g020aMinerals 13 01521 g020b
Figure 21. Upgrade ratio and recovery of ZrO2, Ce2O3, and Fe2O3 in the (a) magnetic and (b) non-magnetic fractions following WHIMS. Results are presented relative to the non-magnetic fraction of the table concentrate and the initial feed.
Minerals 13 01521 g021aMinerals 13 01521 g021b
Figure 22. Upgrade ratio and recovery of REM in the WHIMS magnetic fraction, relative to the WHIMS feed.
Minerals 13 01521 g022
Figure 23. Mineral associations of the WHIMS magnetic and non-magnetic fractions for (a) zircon, (b) HREMs, (c) LREMs, and (d) Fe oxides, relative to the WHIMS feed.
Minerals 13 01521 g023
Figure 24. Grade and recovery of the major mineral classes in the WHIMS (a) magnetic and (b) non-magnetic fractions, relative to the initial feed.
Minerals 13 01521 g024
Table 1. Mineralogy (in wt%) of the feed (determined via QEMSCAN).
ClassMineralWt%
Combined−150 + 106 μm−106 + 53 μm−53 + 20 μm−20 μm
LREMBastnäsite1.21.11.41.41.0
Synchysite0.60.40.60.70.5
Allanite1.20.90.91.02.7
Monazite0.20.20.20.30.3
HREMFergusonite0.10.10.10.10.1
Columbite (Fe)0.60.40.60.70.8
Zircon7.15.19.39.63.4
Silicate GangueQuartz15.417.015.814.613.0
K-Feldspar22.127.222.018.818.9
Plagioclase25.029.725.423.419.0
Biotite9.26.46.98.119.2
Other GangueFe-Oxides10.66.310.614.711.5
Other6.65.16.26.59.7
Total 10028.928.125.517.5
Table 2. Concentration (in wt%) of ZrO2 and Ce2O3 in the feed (determined via XRF).
Equivalent Metal OxideWt%
Combined−150 + 106 μm−106 + 53 μm−53 + 20 μm−20 μm
ZrO23.02.23.93.91.7
Ce2O30.60.40.70.70.7
Total10028.928.125.517.5
Disclaimer/Publisher’s Note: The statements, opinions and data contained in all publications are solely those of the individual author(s) and contributor(s) and not of MDPI and/or the editor(s). MDPI and/or the editor(s) disclaim responsibility for any injury to people or property resulting from any ideas, methods, instructions or products referred to in the content.

