
Utilization of PMA-EDTC as a Novel Macromolecular Depressant for Galena in the Flotation Separation of Chalcopyrite
Abstract
:1. Introduction
2. Materials and Methods
2.1. Minerals and Reagents
2.2. Micro-Flotation Experiments

2.3. Contact Angle Measurements
2.4. Zeta Potential Analysis
2.5. FI-IR Analysis
2.6. XPS Measurements
3. Results and Discussion
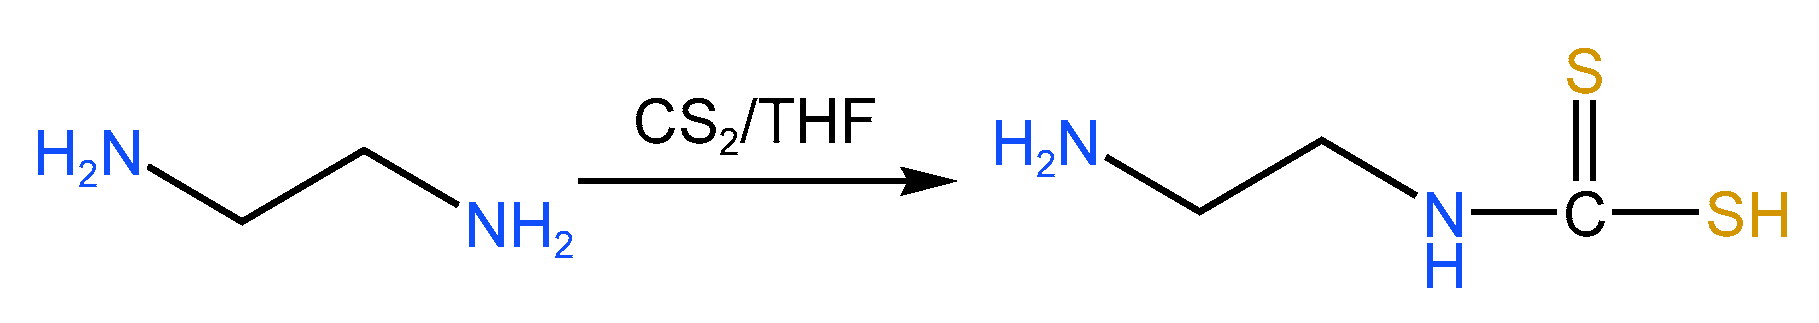
3.1. Synthesis and Characterization of PMA–EDTC
3.2. Micro-Flotation Experiments
3.3. Contact Angle Measurements
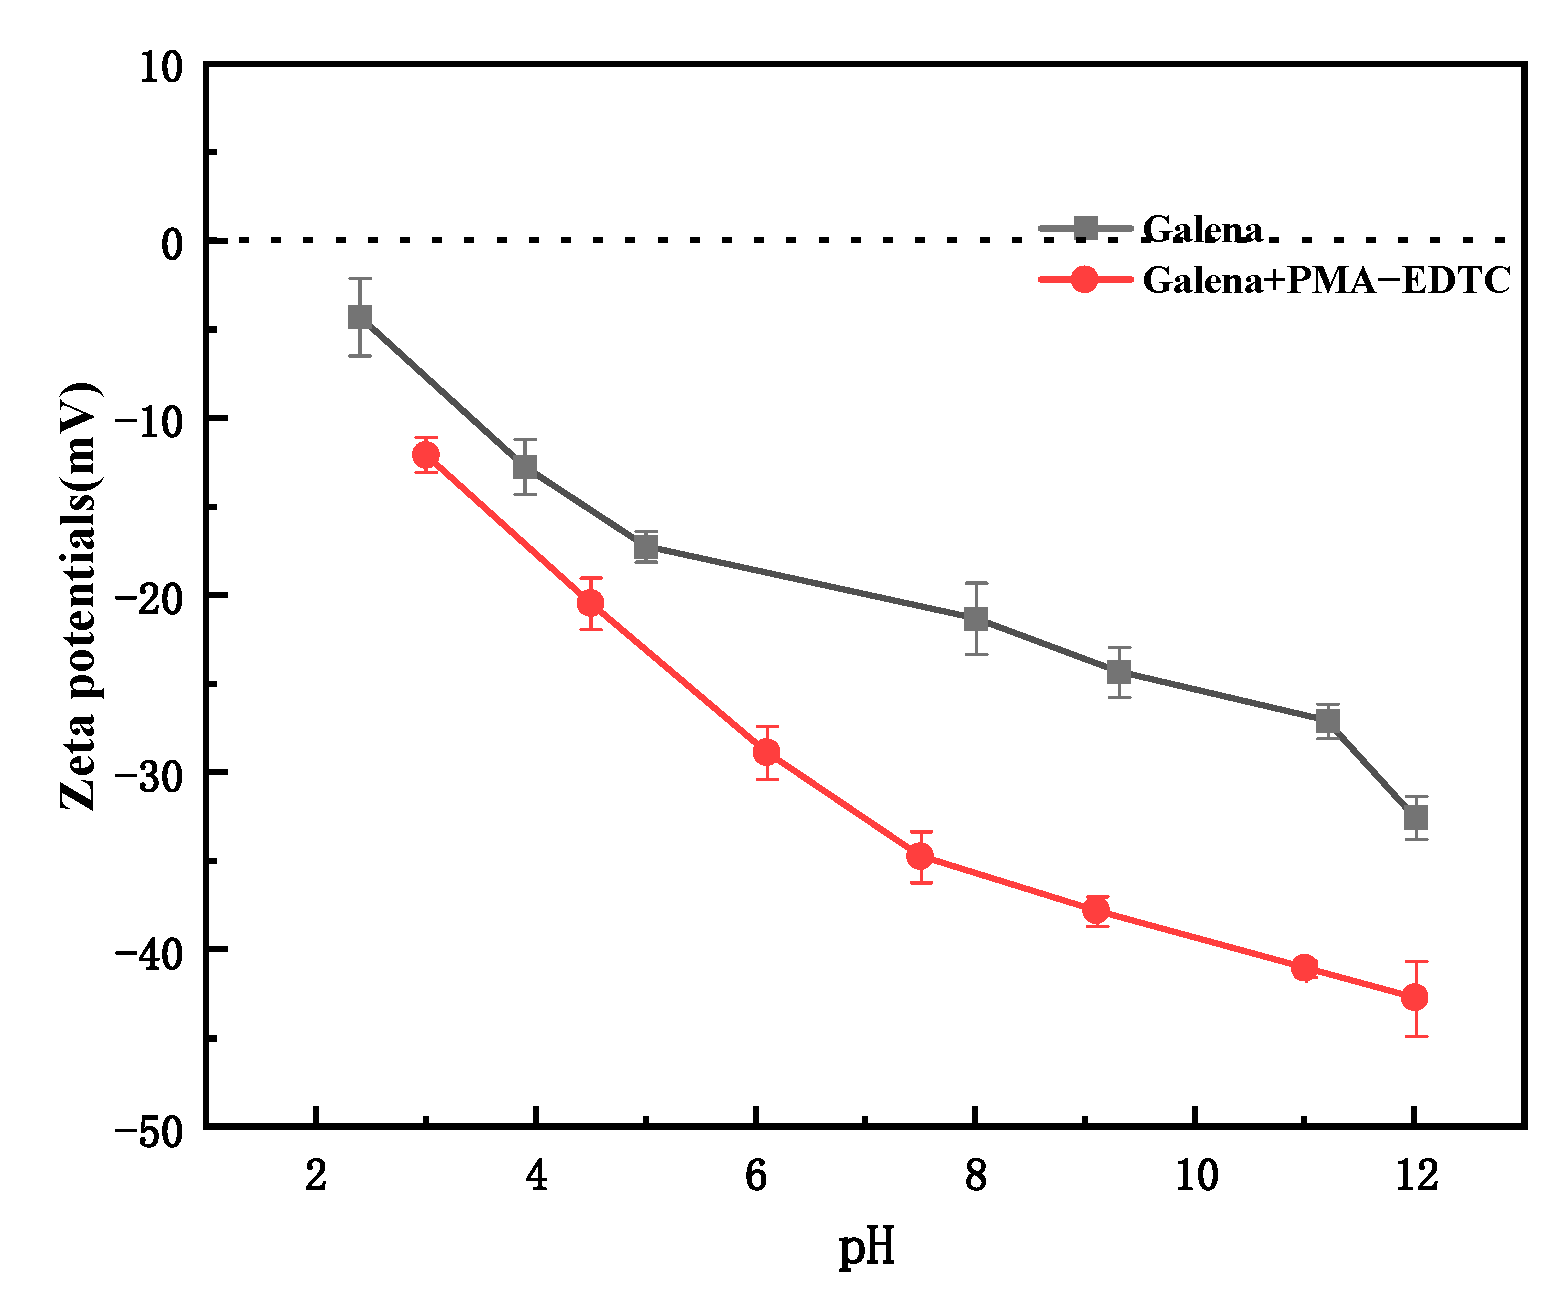
3.4. Zeta Potential Analysis
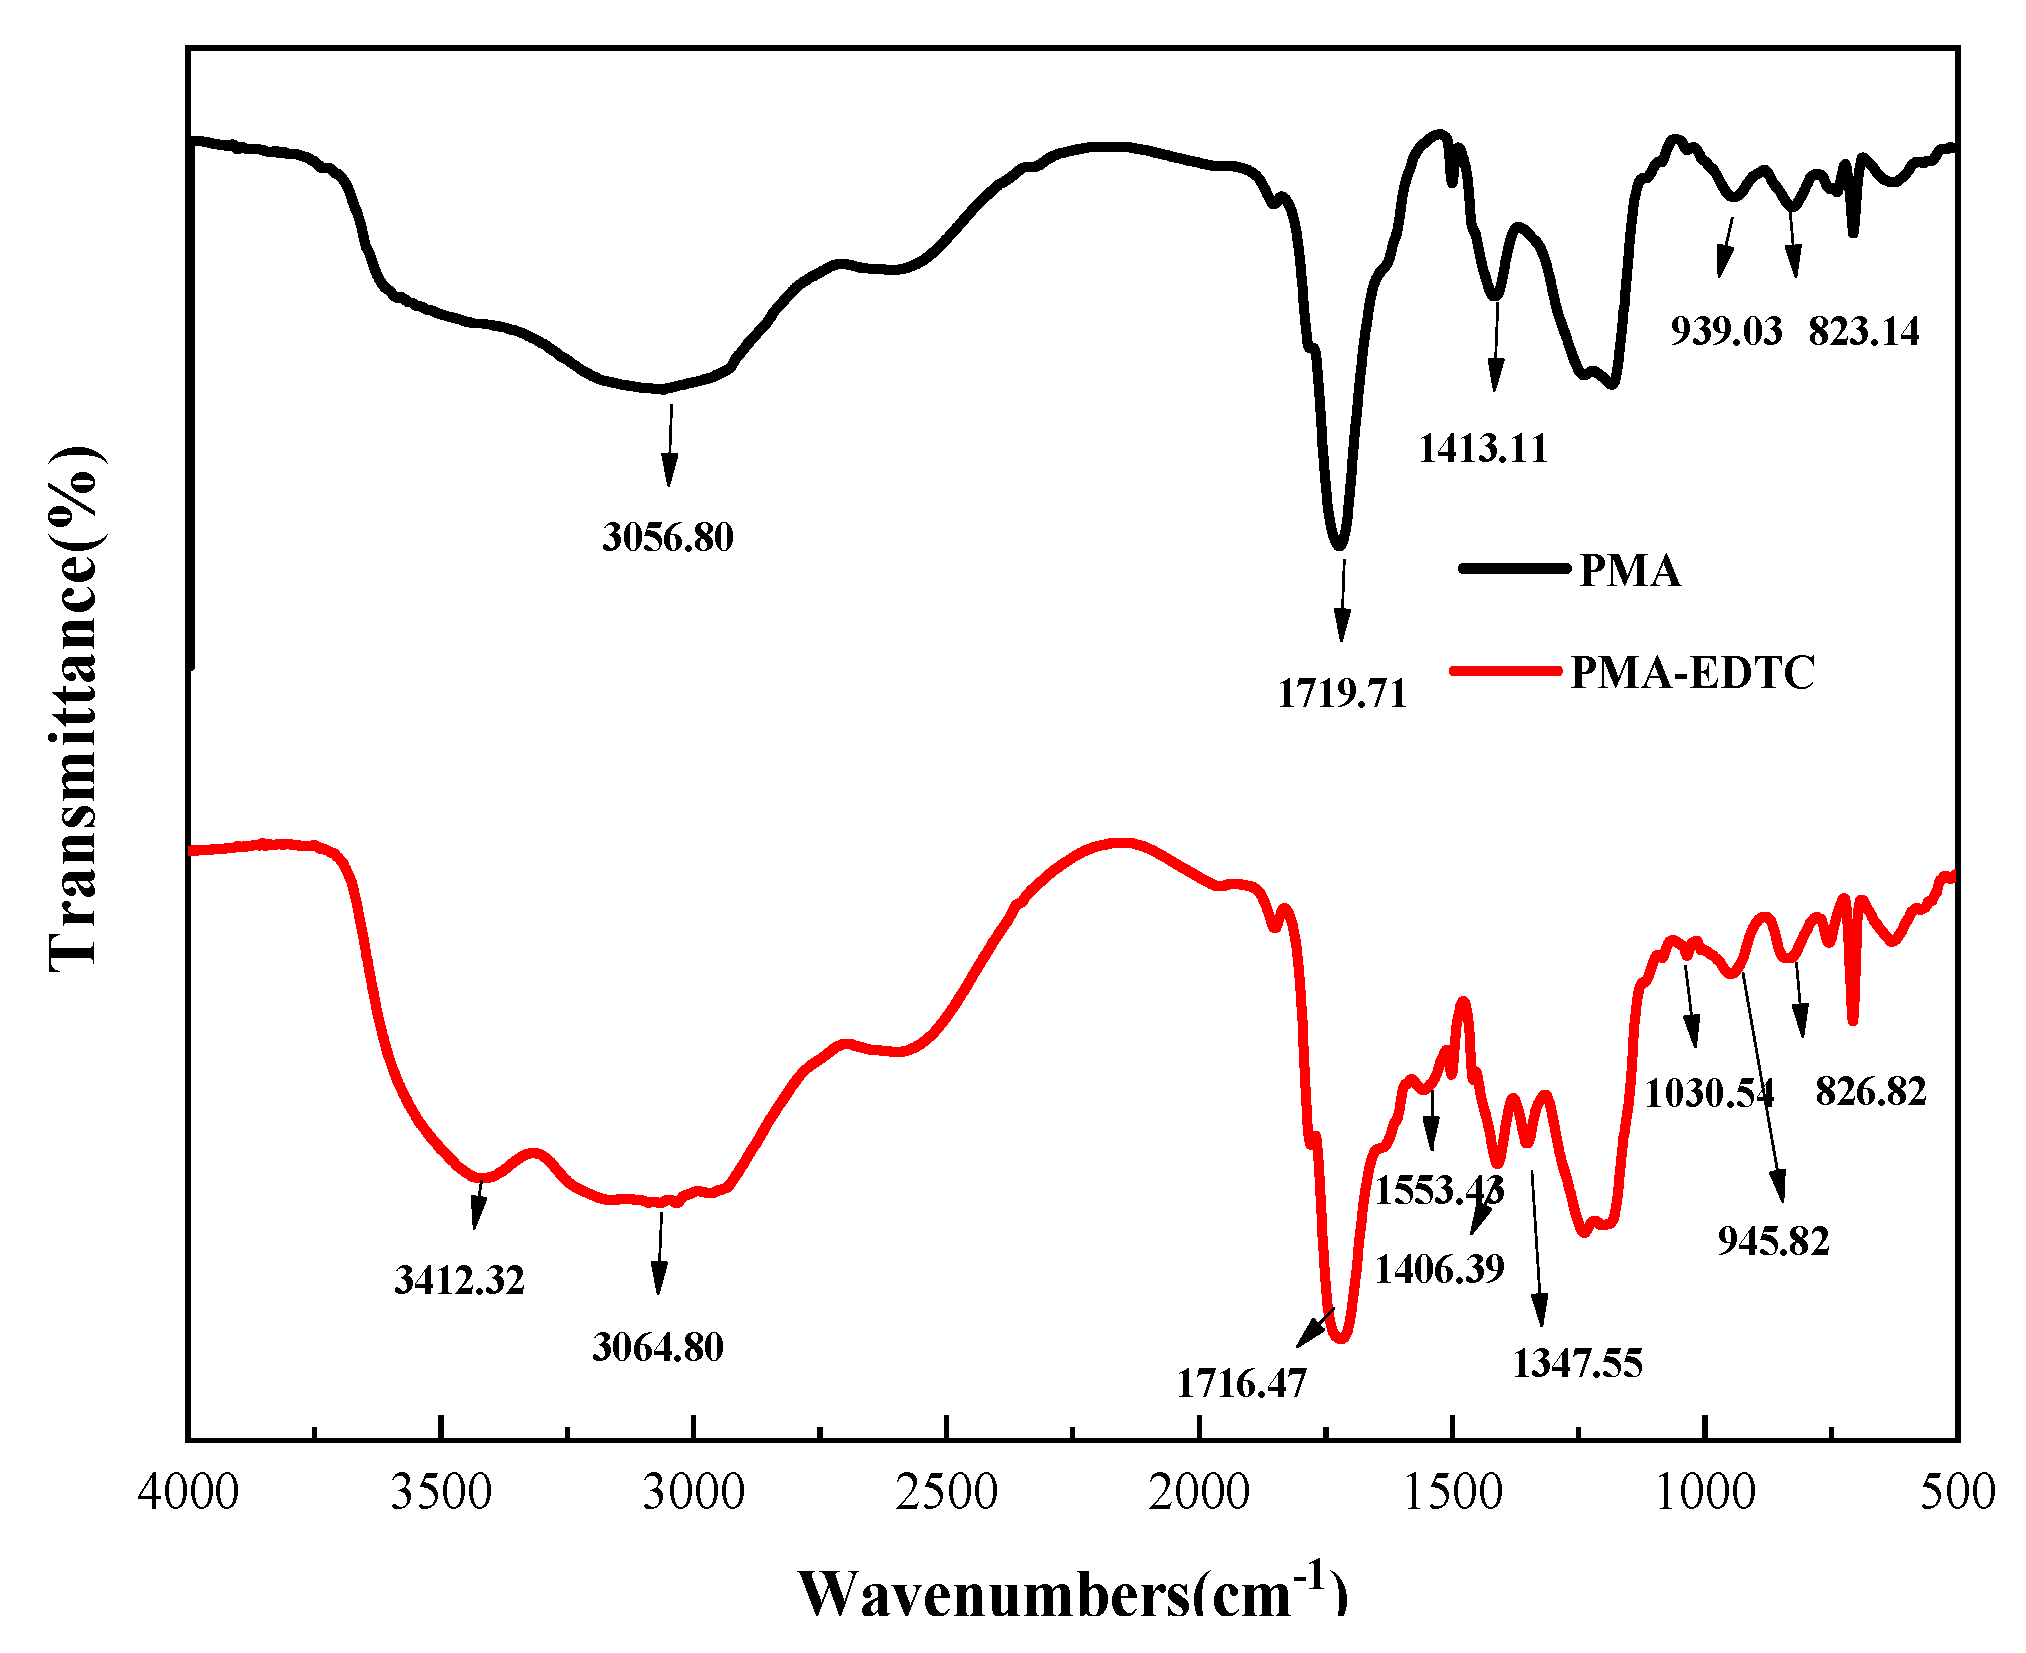
3.5. FT-IR Analysis
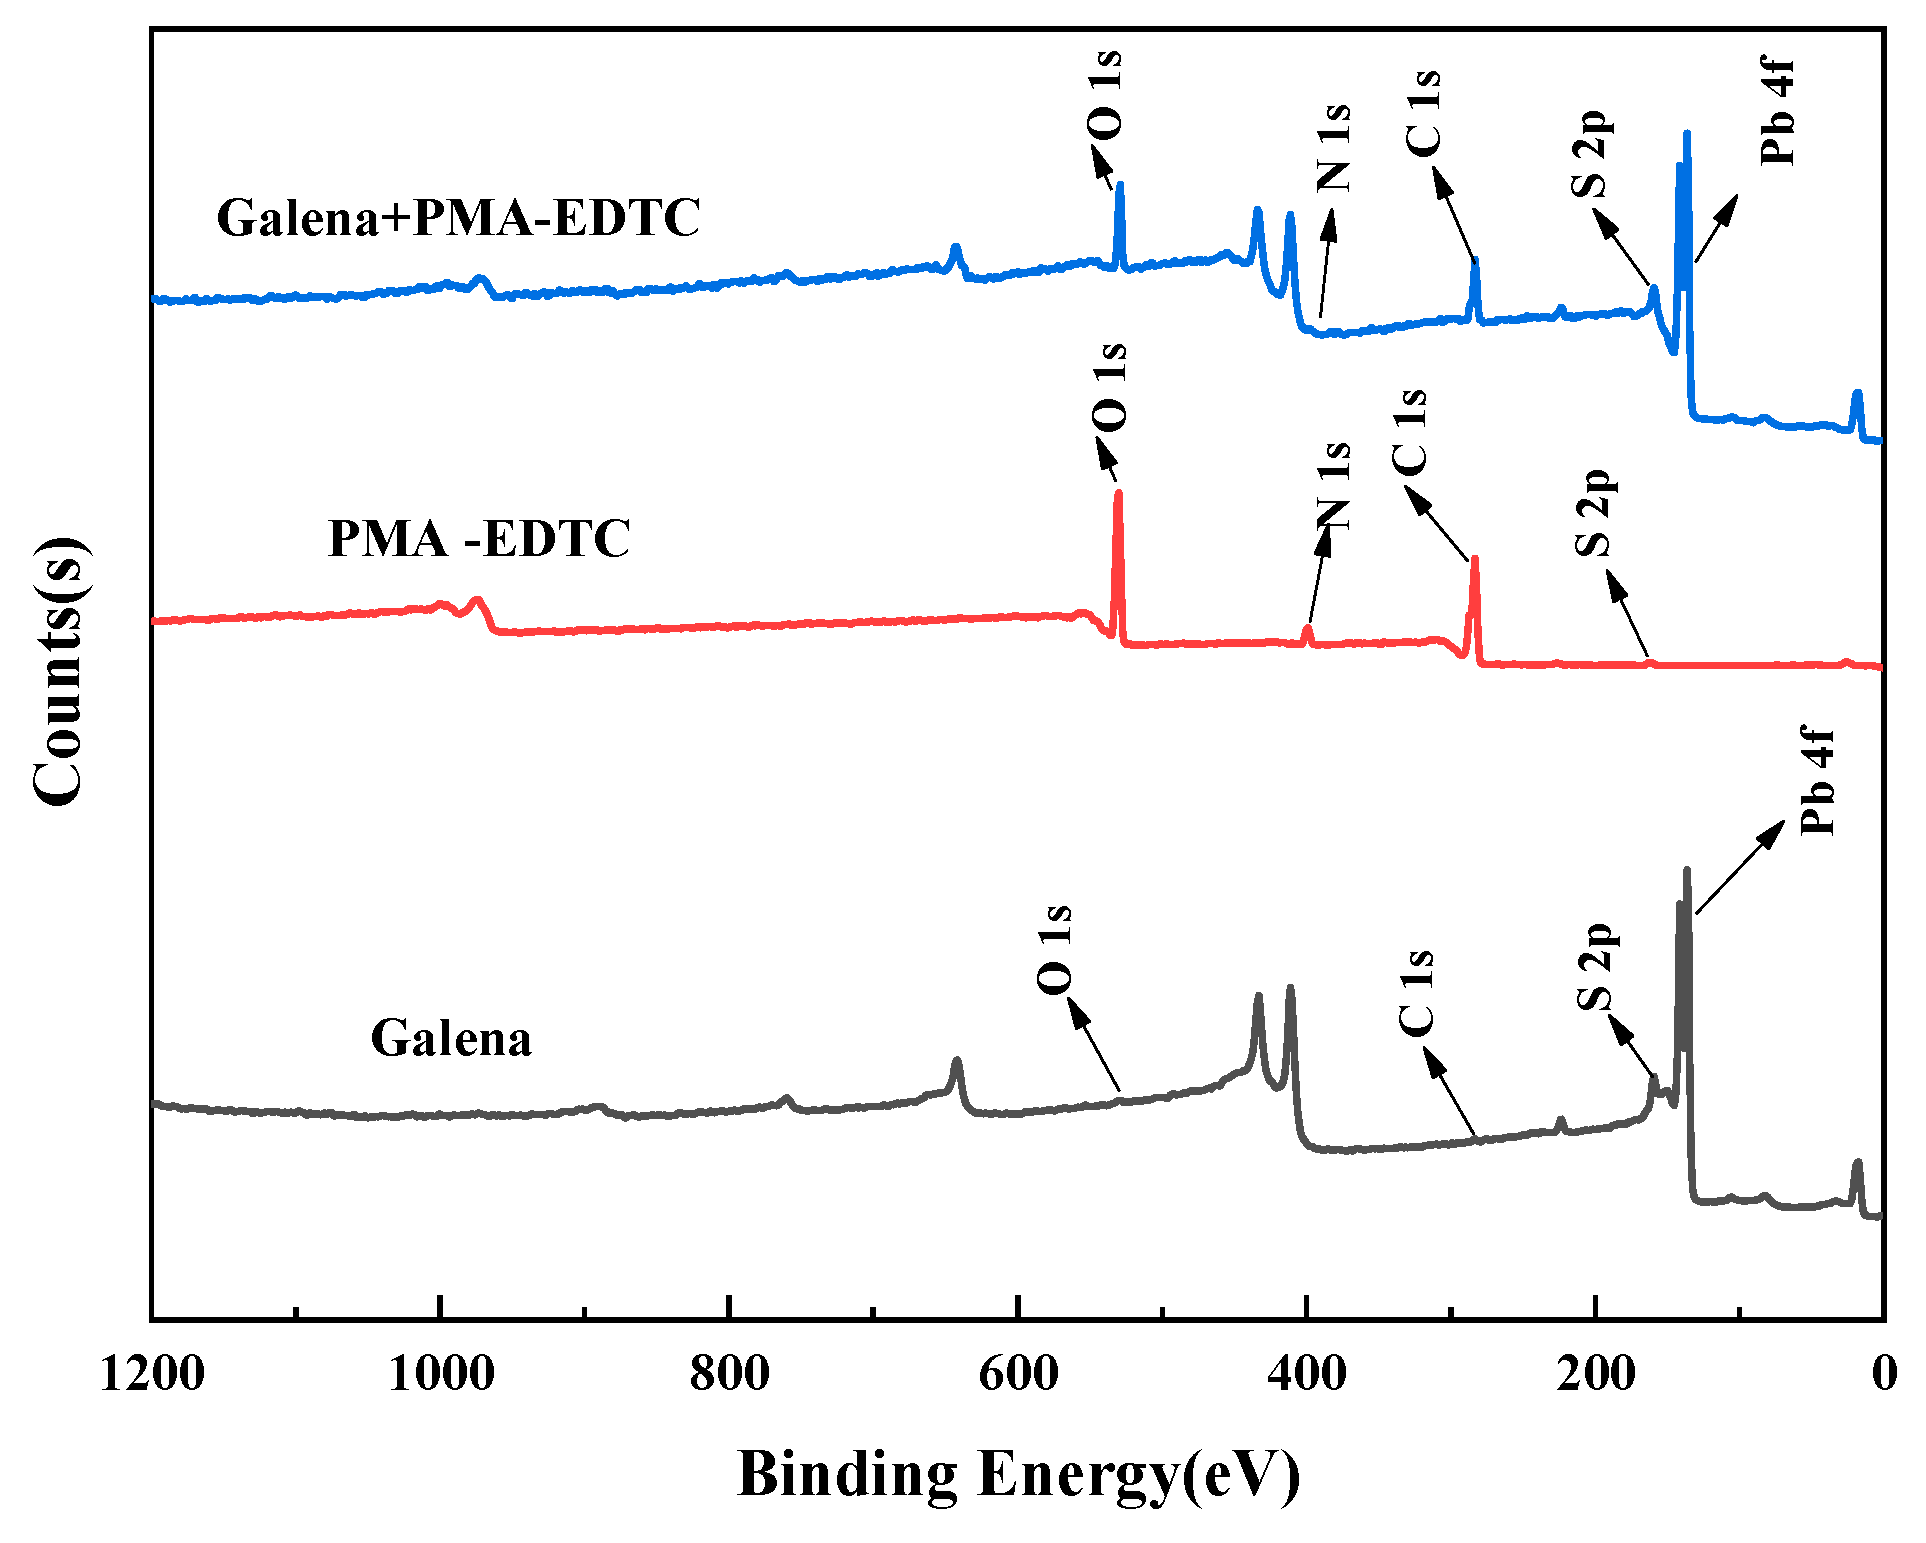
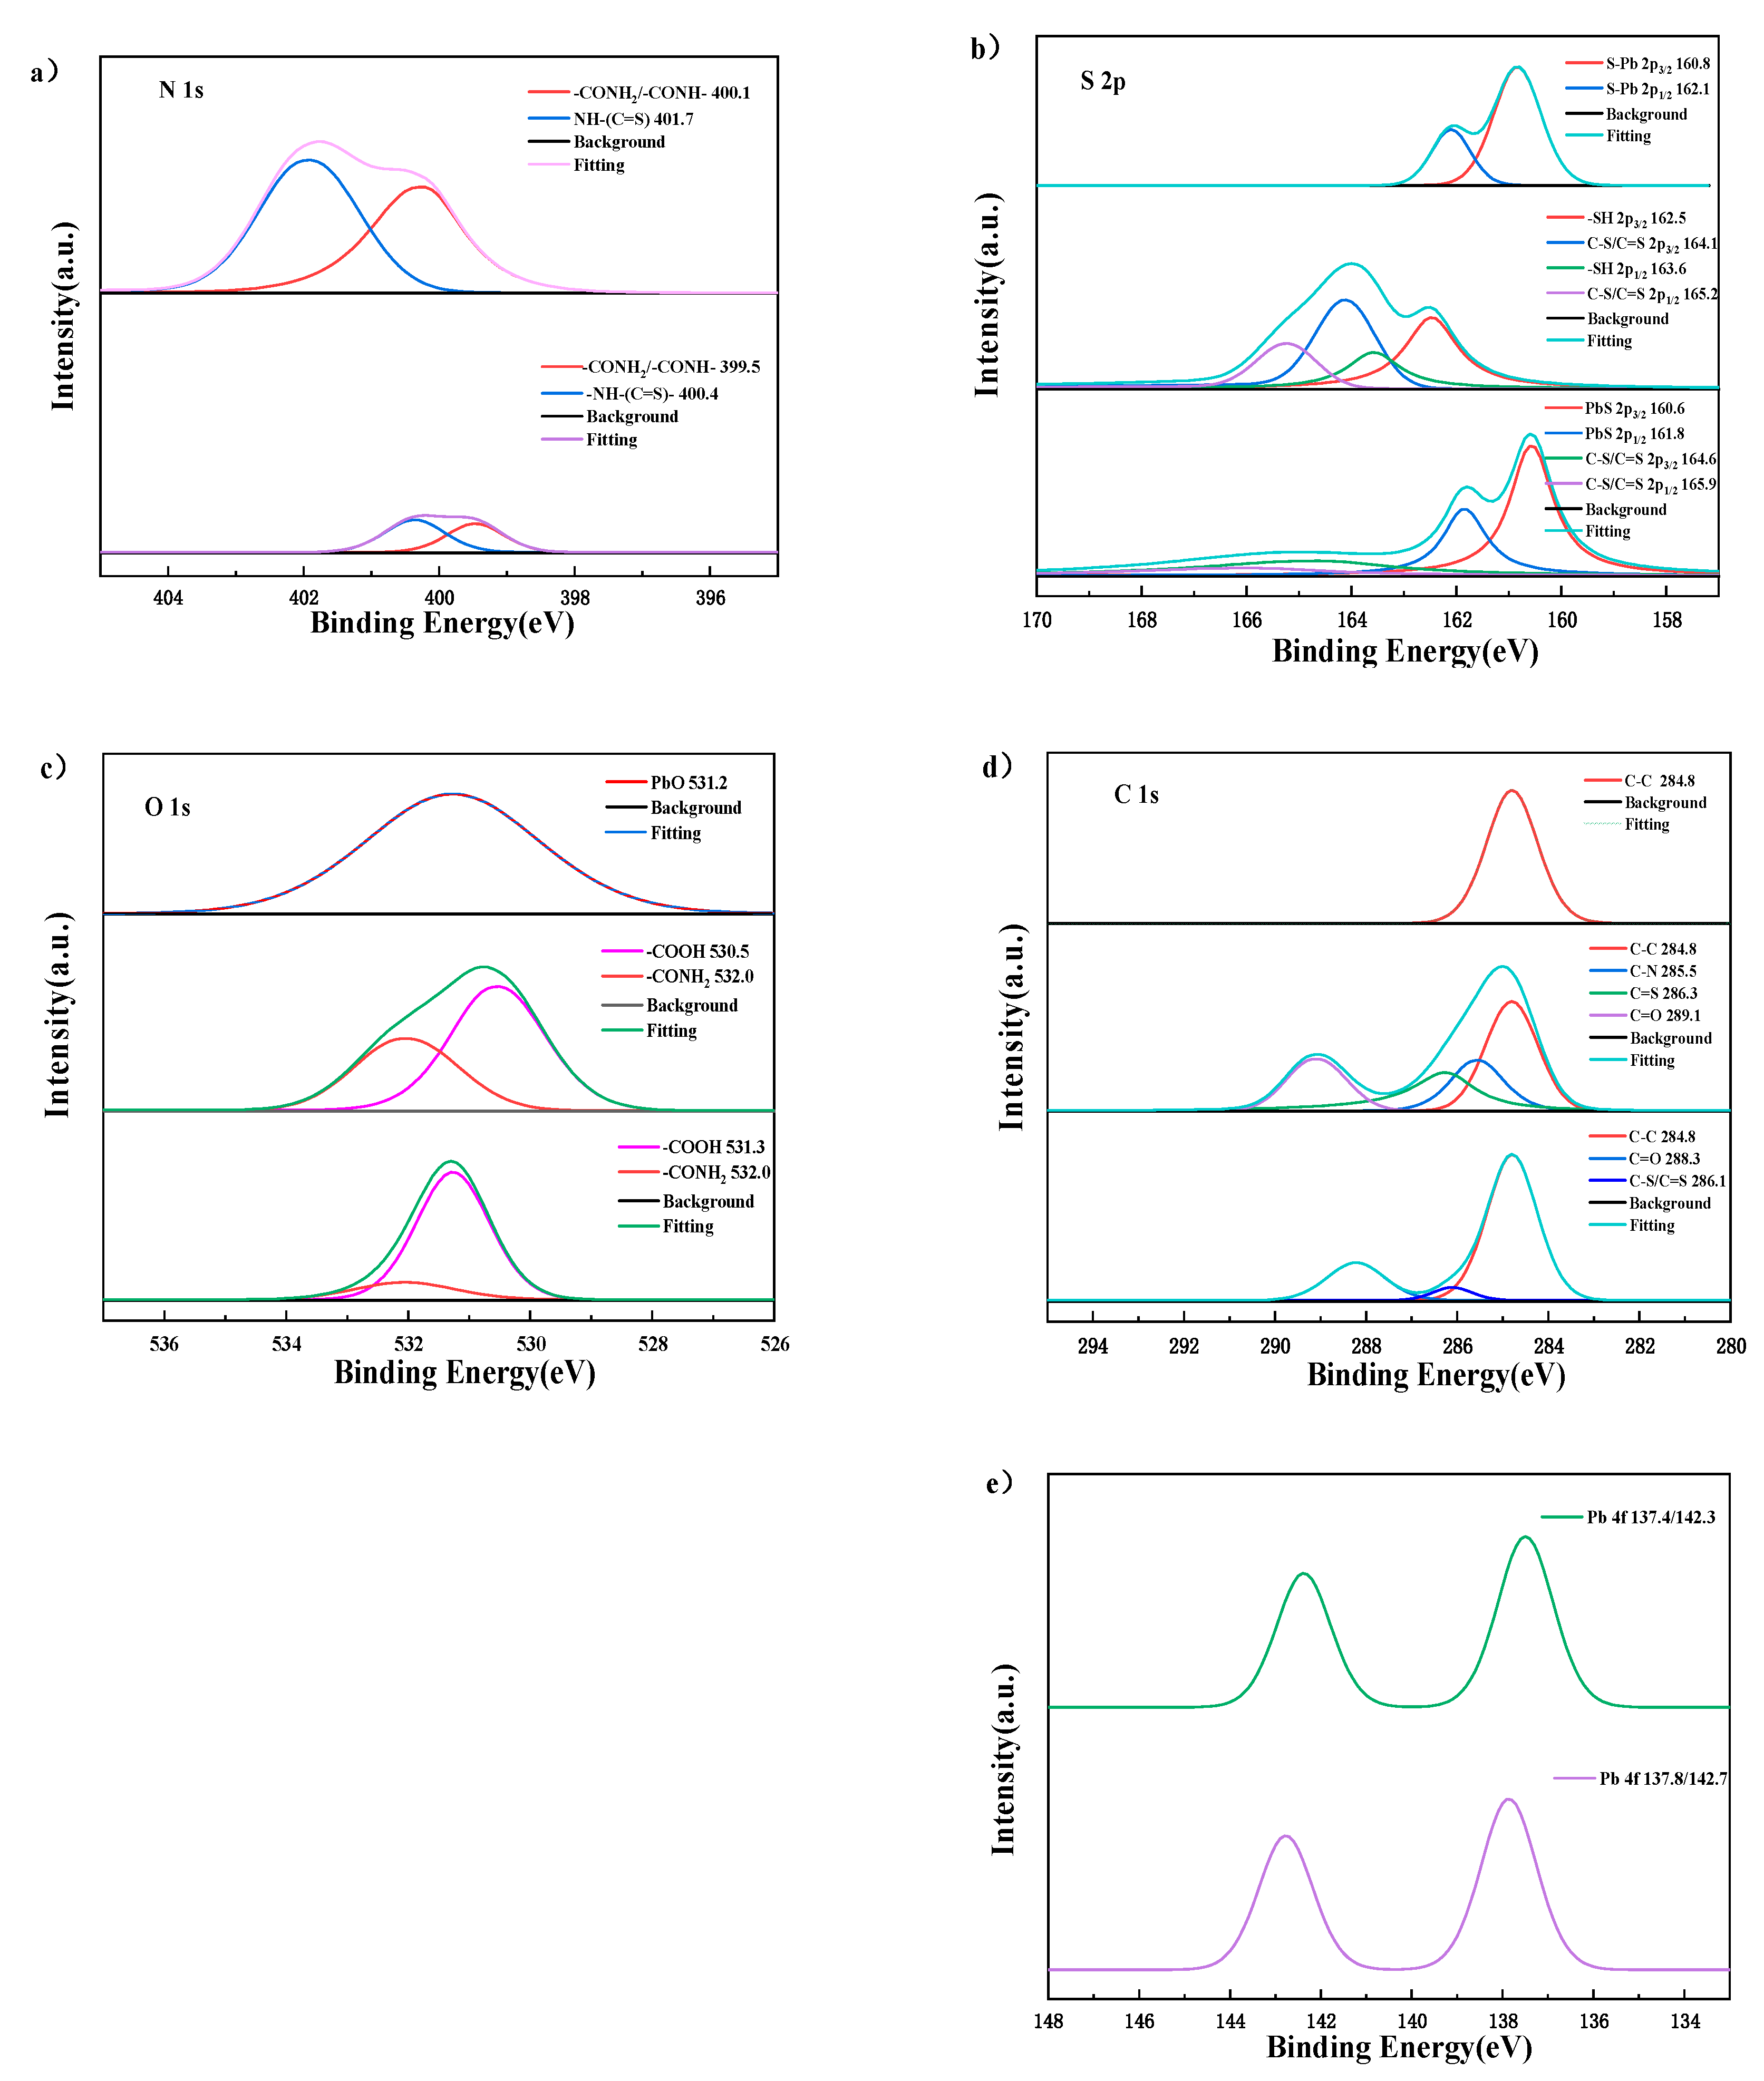
3.6. XPS Analysis
4. Conclusions
Author Contributions
Funding
Data Availability Statement
Conflicts of Interest
References
- Cui, Y.; Jiao, F.; Qin, W.; Wang, C.; Li, X. Flotation separation of sphalerite from galena using eco-friendly and efficient depressant pullulan. Sep. Purif. Technol. 2022, 295, 121013. [Google Scholar] [CrossRef]
- Zhang, M.; Li, J.; Li, P.; Liang, W.; Zheng, X.; Sun, K. Summarize on the lead and zinc ore resources of the world and China. China Min. Mag. 2016, 25 (Suppl. S1), 41–45, 103. [Google Scholar]
- Qin, W.; Wei, Q.; Jiao, F.; Yang, C.; Liu, R.; Wang, P.; Ke, L. Utilization of polysaccharides as depressants for the flotation separation of copper/lead concentrate. Int. J. Min. Sci. Technol. 2013, 23, 179–186. [Google Scholar] [CrossRef]
- Cai, J.; Jia, X.; Ma, Y.; Ibrahim, A.M.; Su, C.; Yu, X.; Shen, P.; Liu, D. Effect of pre-oxidation on copper-lead bulk concentrate flotation separation with sodium polyacrylate as galena depressant. Sep. Purif. Technol. 2023, 304, 122276. [Google Scholar] [CrossRef]
- Sehlotho, N.; Sindane, Z.; Bryson, M.; Lindvelt, L. Flowsheet development for selective Cu-Pb-Zn recovery at Rosh Pinah concentrator. Miner. Eng. 2018, 122, 10–16. [Google Scholar] [CrossRef]
- Liu, R.; Lu, H.; Xu, Z.; Wang, C.; Sun, W.; Wu, M.; Dong, Y.; Bai, L. New insights into the reagent-removal mechanism of sodium sulfide in chalcopyrite and galena bulk flotation: A combined experimental and computational study. J. Mater. Res. Technol. 2020, 9, 5352–5363. [Google Scholar] [CrossRef]
- Jiao, F.; Cui, Y.; Wang, D.; Hu, C. Research of the replacement of dichromate with depressants mixture in the separation of copper-lead sulfides by flotation. Sep. Purif. Technol. 2021, 278, 119330. [Google Scholar] [CrossRef]
- Valdivieso, A.; Ledesma, L.A.; Cabrera, A.; Orozco Navarro, O.A. Carboxymethylcellulose (CMC) as PbS depressant in the processing of Pb Cu bulk concentrates. Adsor. Float. Stud. Miner. Eng. 2017, 112, 77–83. [Google Scholar] [CrossRef]
- Huang, P.; Cao, M.; Liu, Q. Using chitosan as a selective depressant in the differential flotation of Cu–Pb sulfides. Int. J. Miner. Process. 2012, 106, 8–15. [Google Scholar] [CrossRef]
- Pearse, M.J. An overview of the use of chemical reagents in mineral processing. Miner. Eng. 2005, 18, 139–149. [Google Scholar] [CrossRef]
- Bulatovic, S.; Wyslouzil, D.M. Selection and evaluation of different depressants systems for flotation of complex sulphide ores. Miner. Eng. 1995, 8, 63–76. [Google Scholar] [CrossRef]
- Zhang, X.; Lu, L.; Zeng, H.; Hu, Z.; Zhu, Y.; Han, L. A macromolecular depressant for galena and its flotation behavior in the separation from molybdenite. Miner. Eng. 2020, 157, 106576. [Google Scholar] [CrossRef]
- Qin, W.; Wei, Q.; Jiao, F.; Li, N.; Wang, P.; Ke, L. Effect of sodium pyrophosphate on the flotation separation of chalcopyrite from galena. Int. J. Min. Sci. Technol. 2012, 22, 345–349. [Google Scholar] [CrossRef]
- Chen, X.; Gu, G.; Chen, Z. Seaweed glue as a novel polymer depressant for the selective separation of chalcopyrite and galena. Int. J. Miner. Metall. Mater. 2019, 26, 1495–1503. [Google Scholar] [CrossRef]
- Chen, J.; Lan, L.; Liao, X. Depression effect of pseudo glycolythiourea acid in flotation separation of copper–molybdenum. Trans. Nonferrous Met. Soc. China 2013, 23, 824–831. [Google Scholar] [CrossRef]
- Yin, Z.; Sun, W.; Hu, Y.; Zhai, J.; Qingjun, G. Evaluation of the replacement of NaCN with depressant mixtures in the separation of copper–molybdenum sulphide ore by flotation. Sep. Purif. Technol. 2017, 173, 9–16. [Google Scholar] [CrossRef]
- Liu, Y.; Liu, Q. Flotation separation of carbonate from sulfide minerals, II: Mechanisms of flotation depression of sulfide minerals by thioglycollic acid and citric acid. Miner. Eng. 2004, 17, 865–878. [Google Scholar] [CrossRef]
- Li, M.; Wei, D.; Shen, Y.; Liu, W.; Gao, S.; Liang, G. Selective depression effect in flotation separation of copper–molybdenum sulfides using 2,3-disulfanylbutanedioic acid. Trans. Nonferrous Met. Soc. China 2015, 25, 3126–3132. [Google Scholar] [CrossRef]
- Chen, J.; Feng, Q.; Lu, B. Research on a new organic depressant ASC for Separation chalcopyrite and galena. Conserv. Util. Miner. Resour. 2000, 20, 39–42. (In Chinese) [Google Scholar]
- Piao, Z.; Wei, D.; Liu, Z.; Liu, W.; Gao, S.; Li, M. Selective depression of galena and chalcopyrite by O,O-bis(2,3-dihydroxypropyl)dithiophosphate. Trans. Nonferrous Met. Soc. China 2013, 23, 3063–3067. [Google Scholar] [CrossRef]
- Pugh, R.J. Macromolecular organic depressants in sulphide flotation—A review, 1. Principles, types and applications. Int. J. Miner. Process. 1989, 25, 101–130. [Google Scholar] [CrossRef]
- Kar, B.; Sahoo, H.; Rath, S.S.; Das, B. Investigations on different starches as depressants for iron ore flotation. Miner. Eng. 2013, 49, 1–6. [Google Scholar] [CrossRef]
- Rath R, K.; Subramanian, S. Effect of guar gum on selective separation of sphalerite from galena by flotation. Trans. Inst. Min. Metall. Sect. C—Miner. Process. Extr. Metall. 1999, 108, C1–C7. [Google Scholar]
- De Melo, B.A.G.; Motta, F.L.; Santana, M.H.A. Humic acids: Structural properties and multiple functionalities for novel technological developments. Mater. Sci. Eng. C 2016, 62, 967–974. [Google Scholar] [CrossRef]
- Pearse, M.J. Historical use and future development of chemicals for solid–liquid separation in the mineral processing industry. Miner. Eng. 2003, 16, 103–108. [Google Scholar] [CrossRef]
- Moudgil, B.M. Effect of polyacrylamide and polyethylene oxide polymers on coal flotation. Colloids Surf. 1983, 8, 225–228. [Google Scholar] [CrossRef]
- Boulton, A.; Fornasiero, D.; Ralston, J. Selective depression of pyrite with polyacrylamide polymers. Int. J. Miner. Process. 2001, 61, 13–22. [Google Scholar] [CrossRef]
- Zhang, J.F.; Hu, Y.H.; Wang, D.Z.; Han, L. Depressant effect of hydroxamic polyacrylamide on pyrite. J. Cent. South Univ. Technol. (Engl. Ed.) 2004, 128, 6–15. [Google Scholar]
- Bulatovic, S.M. Use of organic polymers in the flotation of polymetallic ores: A review. Miner. Eng. 1999, 12, 341–354. [Google Scholar] [CrossRef]
- Jiménez-Hernández, L.; Estévez-Hernández, O.; Hernández-Sánchez, M.; Díaz, J.; Sánchez, M.F.; Reguera, E. 3-mercaptopropionic acid surface modification of Cu-doped ZnO nanoparticles: Their properties and peroxidase conjugation. Colloids Surf. A Physicochem. Eng. Asp. 2016, 489, 351–359. [Google Scholar] [CrossRef]
- Yin, Z.; Hu, Y.; Sun, W.; Zhang, C.; He, J.; Xu, Z.; Zou, J.; Guan, C.; Zhang, C.H.; Guan, Q.; et al. Adsorption mechanism of 4-amino-5-mercapto-1,2,4-triazole as flotation reagent on chalcopyrite. Langmuir 2018, 34, 4071–4083. [Google Scholar] [CrossRef]
- Huang, P.; Wang, L.; Liu, Q. Depressant function of high molecular weight polyacrylamide in the xanthate flotation of chalcopyrite and galena. Int. J. Miner. Process. 2014, 128, 6–15. [Google Scholar] [CrossRef]
- Fullston, D.; Fornasiero, D.; Ralston, J. Zeta potential study of the oxidation of copper sulfide minerals. Colloids Surf. A Physicochem. Eng. Asp. 1999, 146, 113–121. [Google Scholar] [CrossRef]
- Vergouw, J.M.; Difeo, A.; Xu, Z.; Finch, J. An agglomeration study of sulphide minerals using zeta-potential and settling rate. Part 1: Pyrite and galena. Miner. Eng. 1998, 11, 159–169. [Google Scholar] [CrossRef]
- Liu, R.; Qin, W.; Fen, J.; Wang, X.; Pei, B.; Yang, Y.; Lai, C. Flotation separation of chalcopyrite from galena by sodium humate and ammonium persulfate. Trans. Nonferrous Met. Soc. China 2016, 26, 265–271. [Google Scholar] [CrossRef]
- Lu, L.; Xiong, W.; Zhu, Y.; Zhang, X.; Zheng, Y. Depression behaviors of N-thiourea-maleamic acid and its adsorption mechanism on galena in Mo-Pb flotation separation. Int. J. Min. Sci. Technol. 2022, 32, 181–189. [Google Scholar] [CrossRef]
- Buckley, A.N.; Woods, R. An X-ray photoelectron spectroscopic study of the oxidation of chalcopyrite. Aust. J. Chem. 1984, 37, 2403–2413. [Google Scholar] [CrossRef]
- Yin, Z.; Sun, W.; Hu, Y.; Zhang, C.; Guan, Q.; Liu, R.; Chen, P.; Tian, M. Utilization of acetic acid-[(hydrazinylthioxomethyl) thio]-sodium as a novel selective depressant for chalcopyrite in the flotation separation of molybdenite. Sep. Purif. Technol. 2017, 179, 248–256. [Google Scholar] [CrossRef]
- Li, W.; Li, Y. Improved understanding of chalcopyrite flotation in seawater using sodium hexametaphosphate. Miner. Eng. 2019, 134, 269–274. [Google Scholar] [CrossRef]
- Ikumapayi, F.; Makitalo, M.; Johansson, B.; Rao, K.H. Recycling of process water in sulphide flotation: Effect of calcium and sulphate ions on flotation of galena. Miner. Eng. 2012, 39, 77–88. [Google Scholar] [CrossRef]
- Yu, J.; Liu, R.; Wang, L.; Sun, W.; Peng, H.; Hu, Y. Selective depression mechanism of ferric chromium lignin sulfonate for chalcopyrite–galena flotation separation. Int. J. Miner. Metall. Mater. 2018, 25, 489–497. [Google Scholar] [CrossRef]
- Wang, Y.; Xiong, W.; Zhang, X.; Lu, L.; Zhu, Y. A new synthetic polymer depressant PADEMA for Cu-Pb separation and its interfacial adsorption mechanism on galena surface. Appl. Surf. Sci. 2021, 569, 151062. [Google Scholar] [CrossRef]


| Sample | P | Zn | Pb | SiO2 | Al2O3 | CaO | MgO | Cu | Tfe | S |
|---|---|---|---|---|---|---|---|---|---|---|
| Chalcopyrite | 0.13 | 0.075 | 0.016 | <0.01 | 0.040 | 0.11 | 0.078 | 33.95 | 30.84 | 34.54 |
| Galena | 0.0021 | <0.01 | 84.99 | <0.01 | 0.047 | 0.032 | 0.013 | 0.031 | 0.067 | 12.11 |
| Mp | Mn | Mw | Mz | Mz + 1 | Mv | PD | |
|---|---|---|---|---|---|---|---|
| PMA–EDTC | 2197 | 1753 | 2067 | 2402 | 2738 | 2018 | 1.18 |
| PMA–EDTC Dosage/mg·L−1 | Product | Grade/% | Recovery/% | Separation Index * | ||
|---|---|---|---|---|---|---|
| Pb | Cu | Pb | Cu | |||
| 0 | Concentrate | 55.95 | 14.20 | 97.10 | 99.89 | 5.30 |
| Tailing | 35.72 | 0.32 | 2.90 | 0.11 | ||
| Feed | 55.05 | 13.58 | 100.00 | 100.00 | ||
| 2 | Concentrate | 36.39 | 19.04 | 43.56 | 93.90 | 4.46 |
| Tailing | 80.05 | 2.10 | 56.44 | 6.10 | ||
| Feed | 52.57 | 12.76 | 100.00 | 100.00 | ||
| 4 | Concentrate | 6.46 | 33.17 | 4.00 | 76.88 | 8.93 |
| Tailing | 73.87 | 4.75 | 96.00 | 23.12 | ||
| Feed | 52.12 | 13.92 | 100.00 | 100.00 | ||
| 6 | Concentrate | 3.02 | 33.46 | 1.72 | 76.49 | 13.61 |
| Tailing | 75.66 | 4.52 | 98.28 | 23.51 | ||
| Feed | 53.48 | 13.36 | 100.00 | 100.00 | ||
| 8 | Concentrate | 1.08 | 33.60 | 0.56 | 76.82 | 24.17 |
| Tailing | 75.72 | 4.03 | 99.44 | 23.18 | ||
| Feed | 54.49 | 12.44 | 100.00 | 100.00 | ||
| 10 | Concentrate | 2.16 | 33.18 | 0.40 | 25.48 | 9.22 |
| Tailing | 61.42 | 11.08 | 99.60 | 74.52 | ||
| Feed | 55.35 | 13.35 | 100.00 | 100.00 | ||
| Without Any Treatment (Galena) | 10.0 mg/L PMA–EDTC (Galena) | 20.0 mg/L PMA–EDTC (Galena) | 50.0 mg/L PMA–EDTC (Galena) |
 |  |  |  |
| Without Any treatment (Chalcopyrite) | 10.0 mg/L PMA–EDTC (Chalcopyrite) | 20.0 mg/L PMA–EDTC (Chalcopyrite) | 50.0 mg/L PMA–EDTC (Chalcopyrite) |
 |  |  |  |
| Sample | Atomic Concentration of Elements (Atomic%) | ||||
|---|---|---|---|---|---|
| C | O | N | S | Pb | |
| PMA–EDTC | 63.76 | 29.27 | 5.98 | 1.00 | |
| Galena+PMA–EDTC | 50.06 | 22.96 | 1.43 | 16.12 | 9.43 |
| Galena | 11.28 | 9.88 | 54.14 | 24.70 | |
| Δa | 38.78 | 13.08 | 1.43 | −36.02 | −15.27 |
Disclaimer/Publisher’s Note: The statements, opinions and data contained in all publications are solely those of the individual author(s) and contributor(s) and not of MDPI and/or the editor(s). MDPI and/or the editor(s) disclaim responsibility for any injury to people or property resulting from any ideas, methods, instructions or products referred to in the content. |
© 2023 by the authors. Licensee MDPI, Basel, Switzerland. This article is an open access article distributed under the terms and conditions of the Creative Commons Attribution (CC BY) license (https://creativecommons.org/licenses/by/4.0/).
Share and Cite
Zeng, H.; Zhu, Y.; Sun, C.; Zhao, Z.; Wu, G.; Liu, C.; Lu, T.; Zhang, X. Utilization of PMA-EDTC as a Novel Macromolecular Depressant for Galena in the Flotation Separation of Chalcopyrite. Minerals 2023, 13, 1478. https://doi.org/10.3390/min13121478
Zeng H, Zhu Y, Sun C, Zhao Z, Wu G, Liu C, Lu T, Zhang X. Utilization of PMA-EDTC as a Novel Macromolecular Depressant for Galena in the Flotation Separation of Chalcopyrite. Minerals. 2023; 13(12):1478. https://doi.org/10.3390/min13121478
Chicago/Turabian StyleZeng, Hong, Yangge Zhu, Chuanyao Sun, Zhiqiang Zhao, Guiye Wu, Chongjun Liu, Tong Lu, and Xingrong Zhang. 2023. "Utilization of PMA-EDTC as a Novel Macromolecular Depressant for Galena in the Flotation Separation of Chalcopyrite" Minerals 13, no. 12: 1478. https://doi.org/10.3390/min13121478