
The Use of DEM for Optimising an Industrial Vezin Sampler Operation
 , , ,
, , ,
Abstract
:1. Introduction
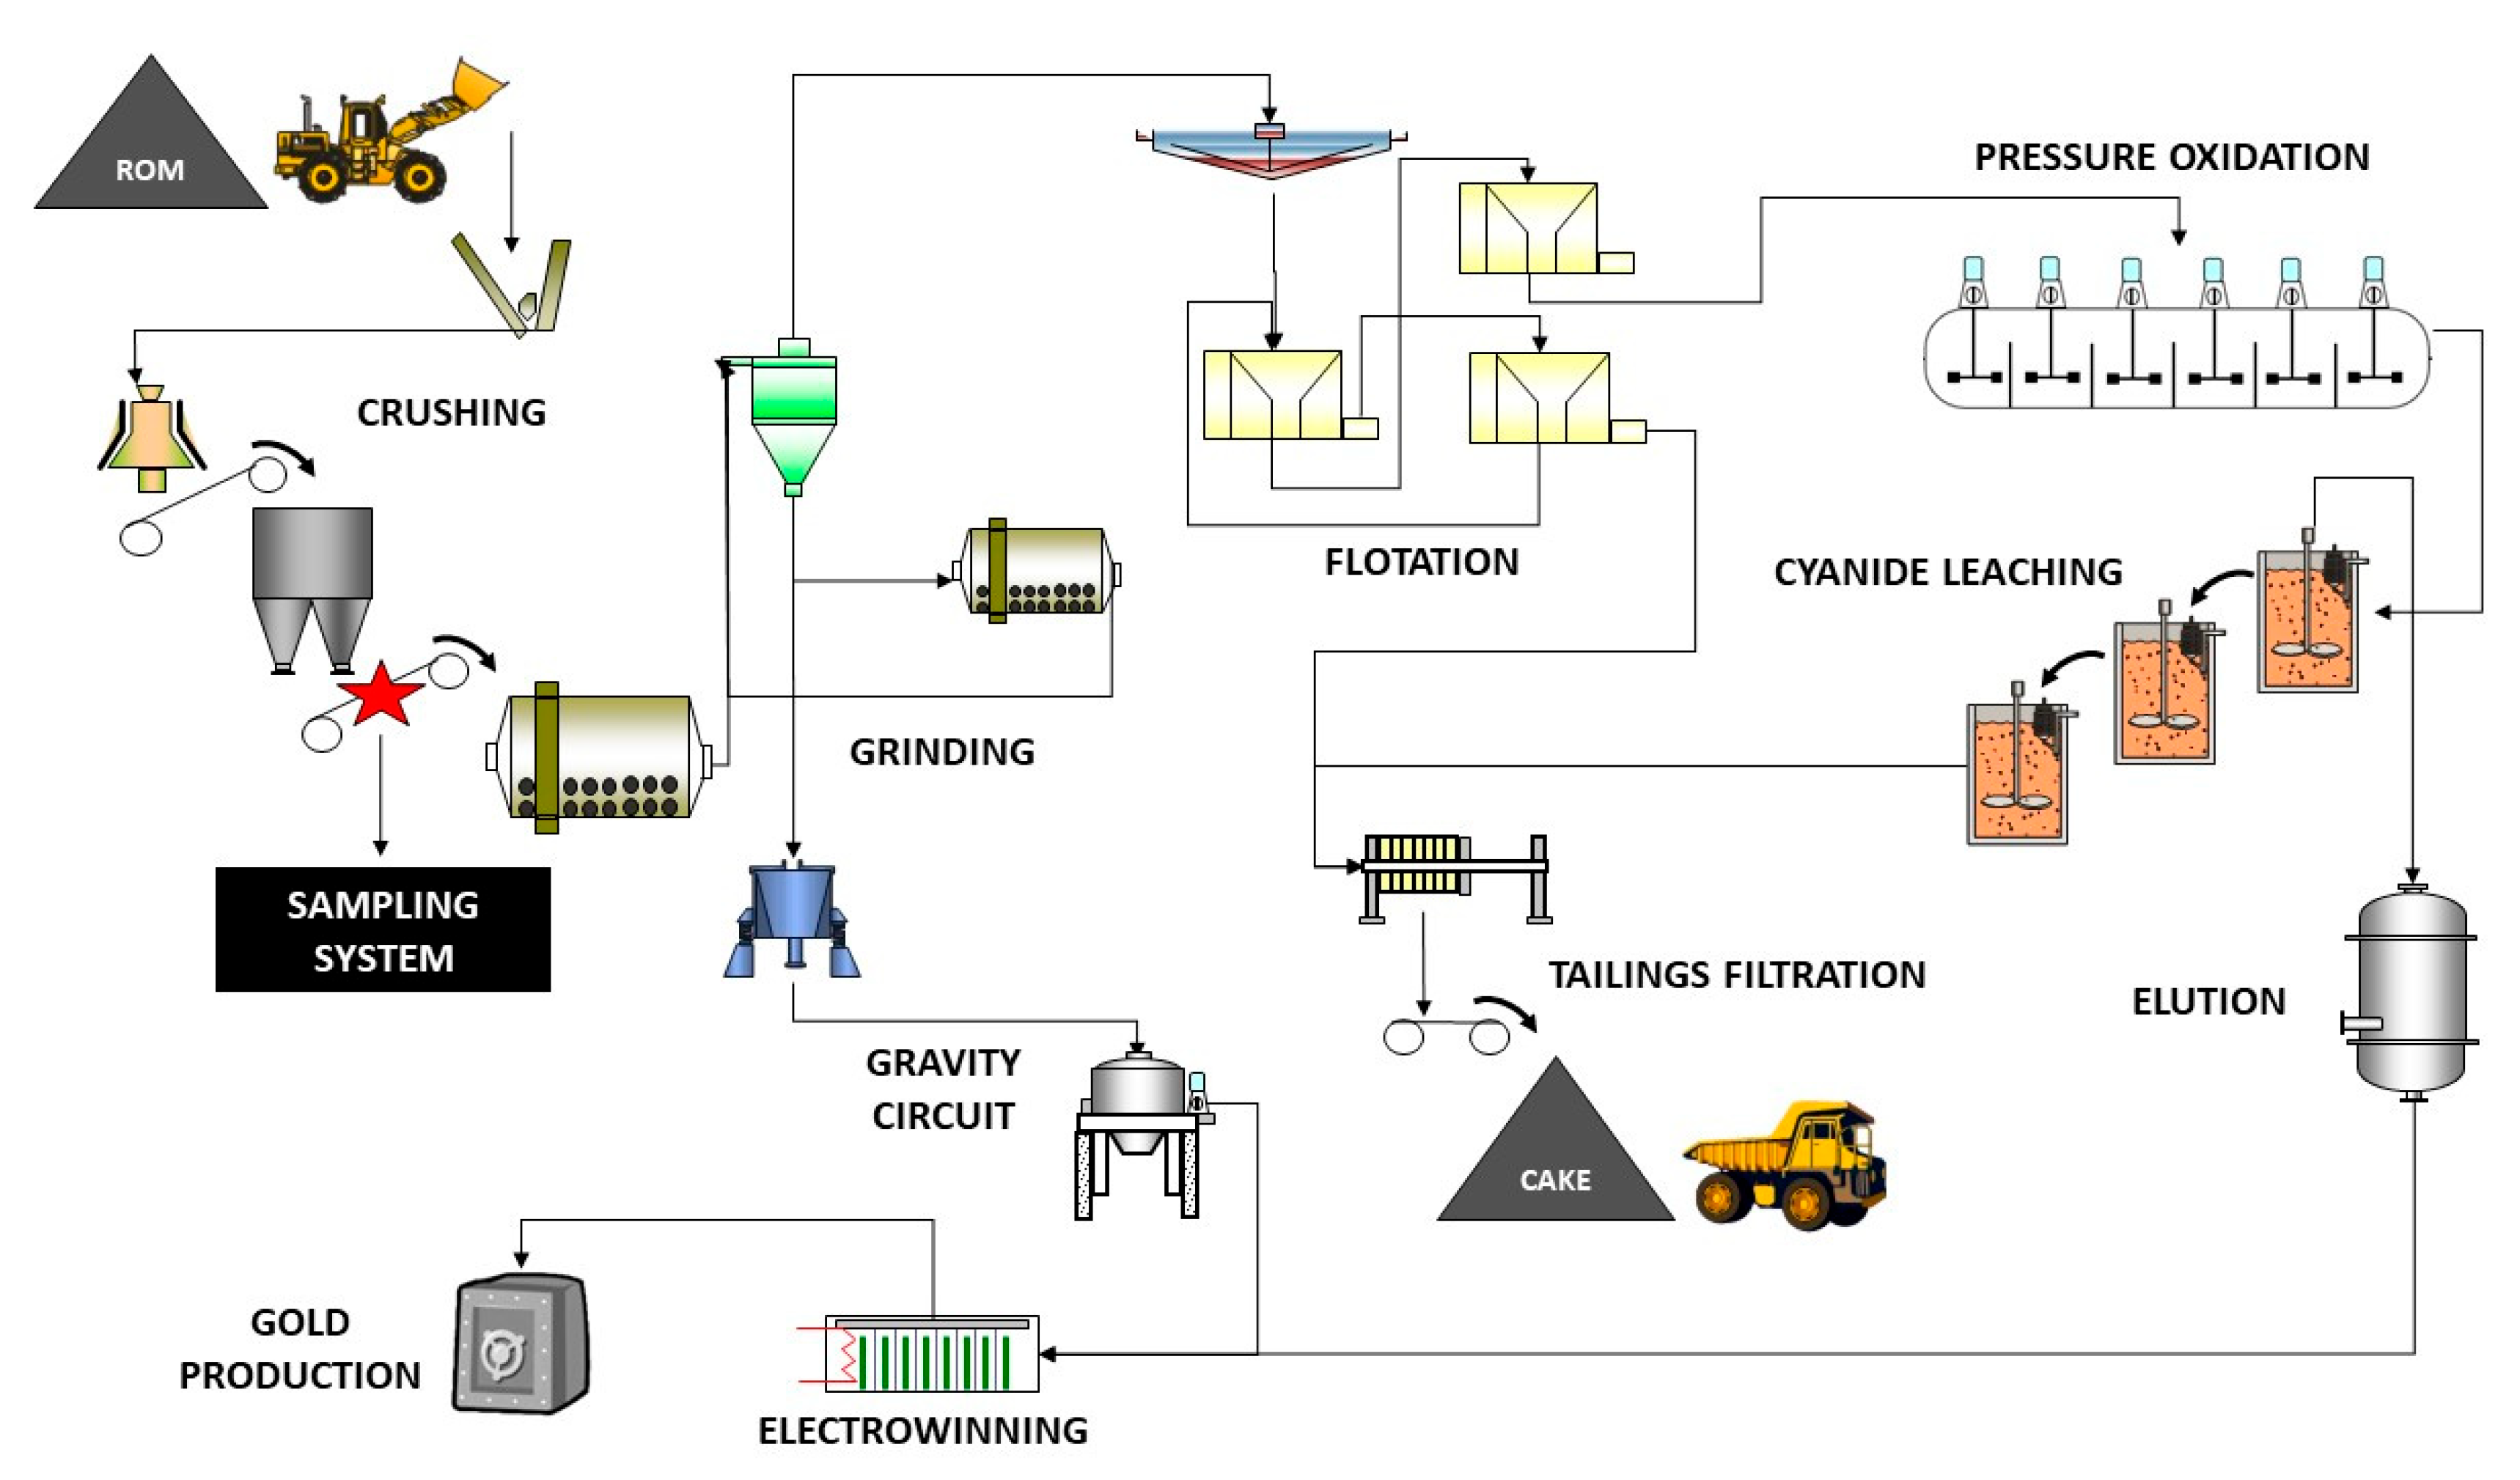
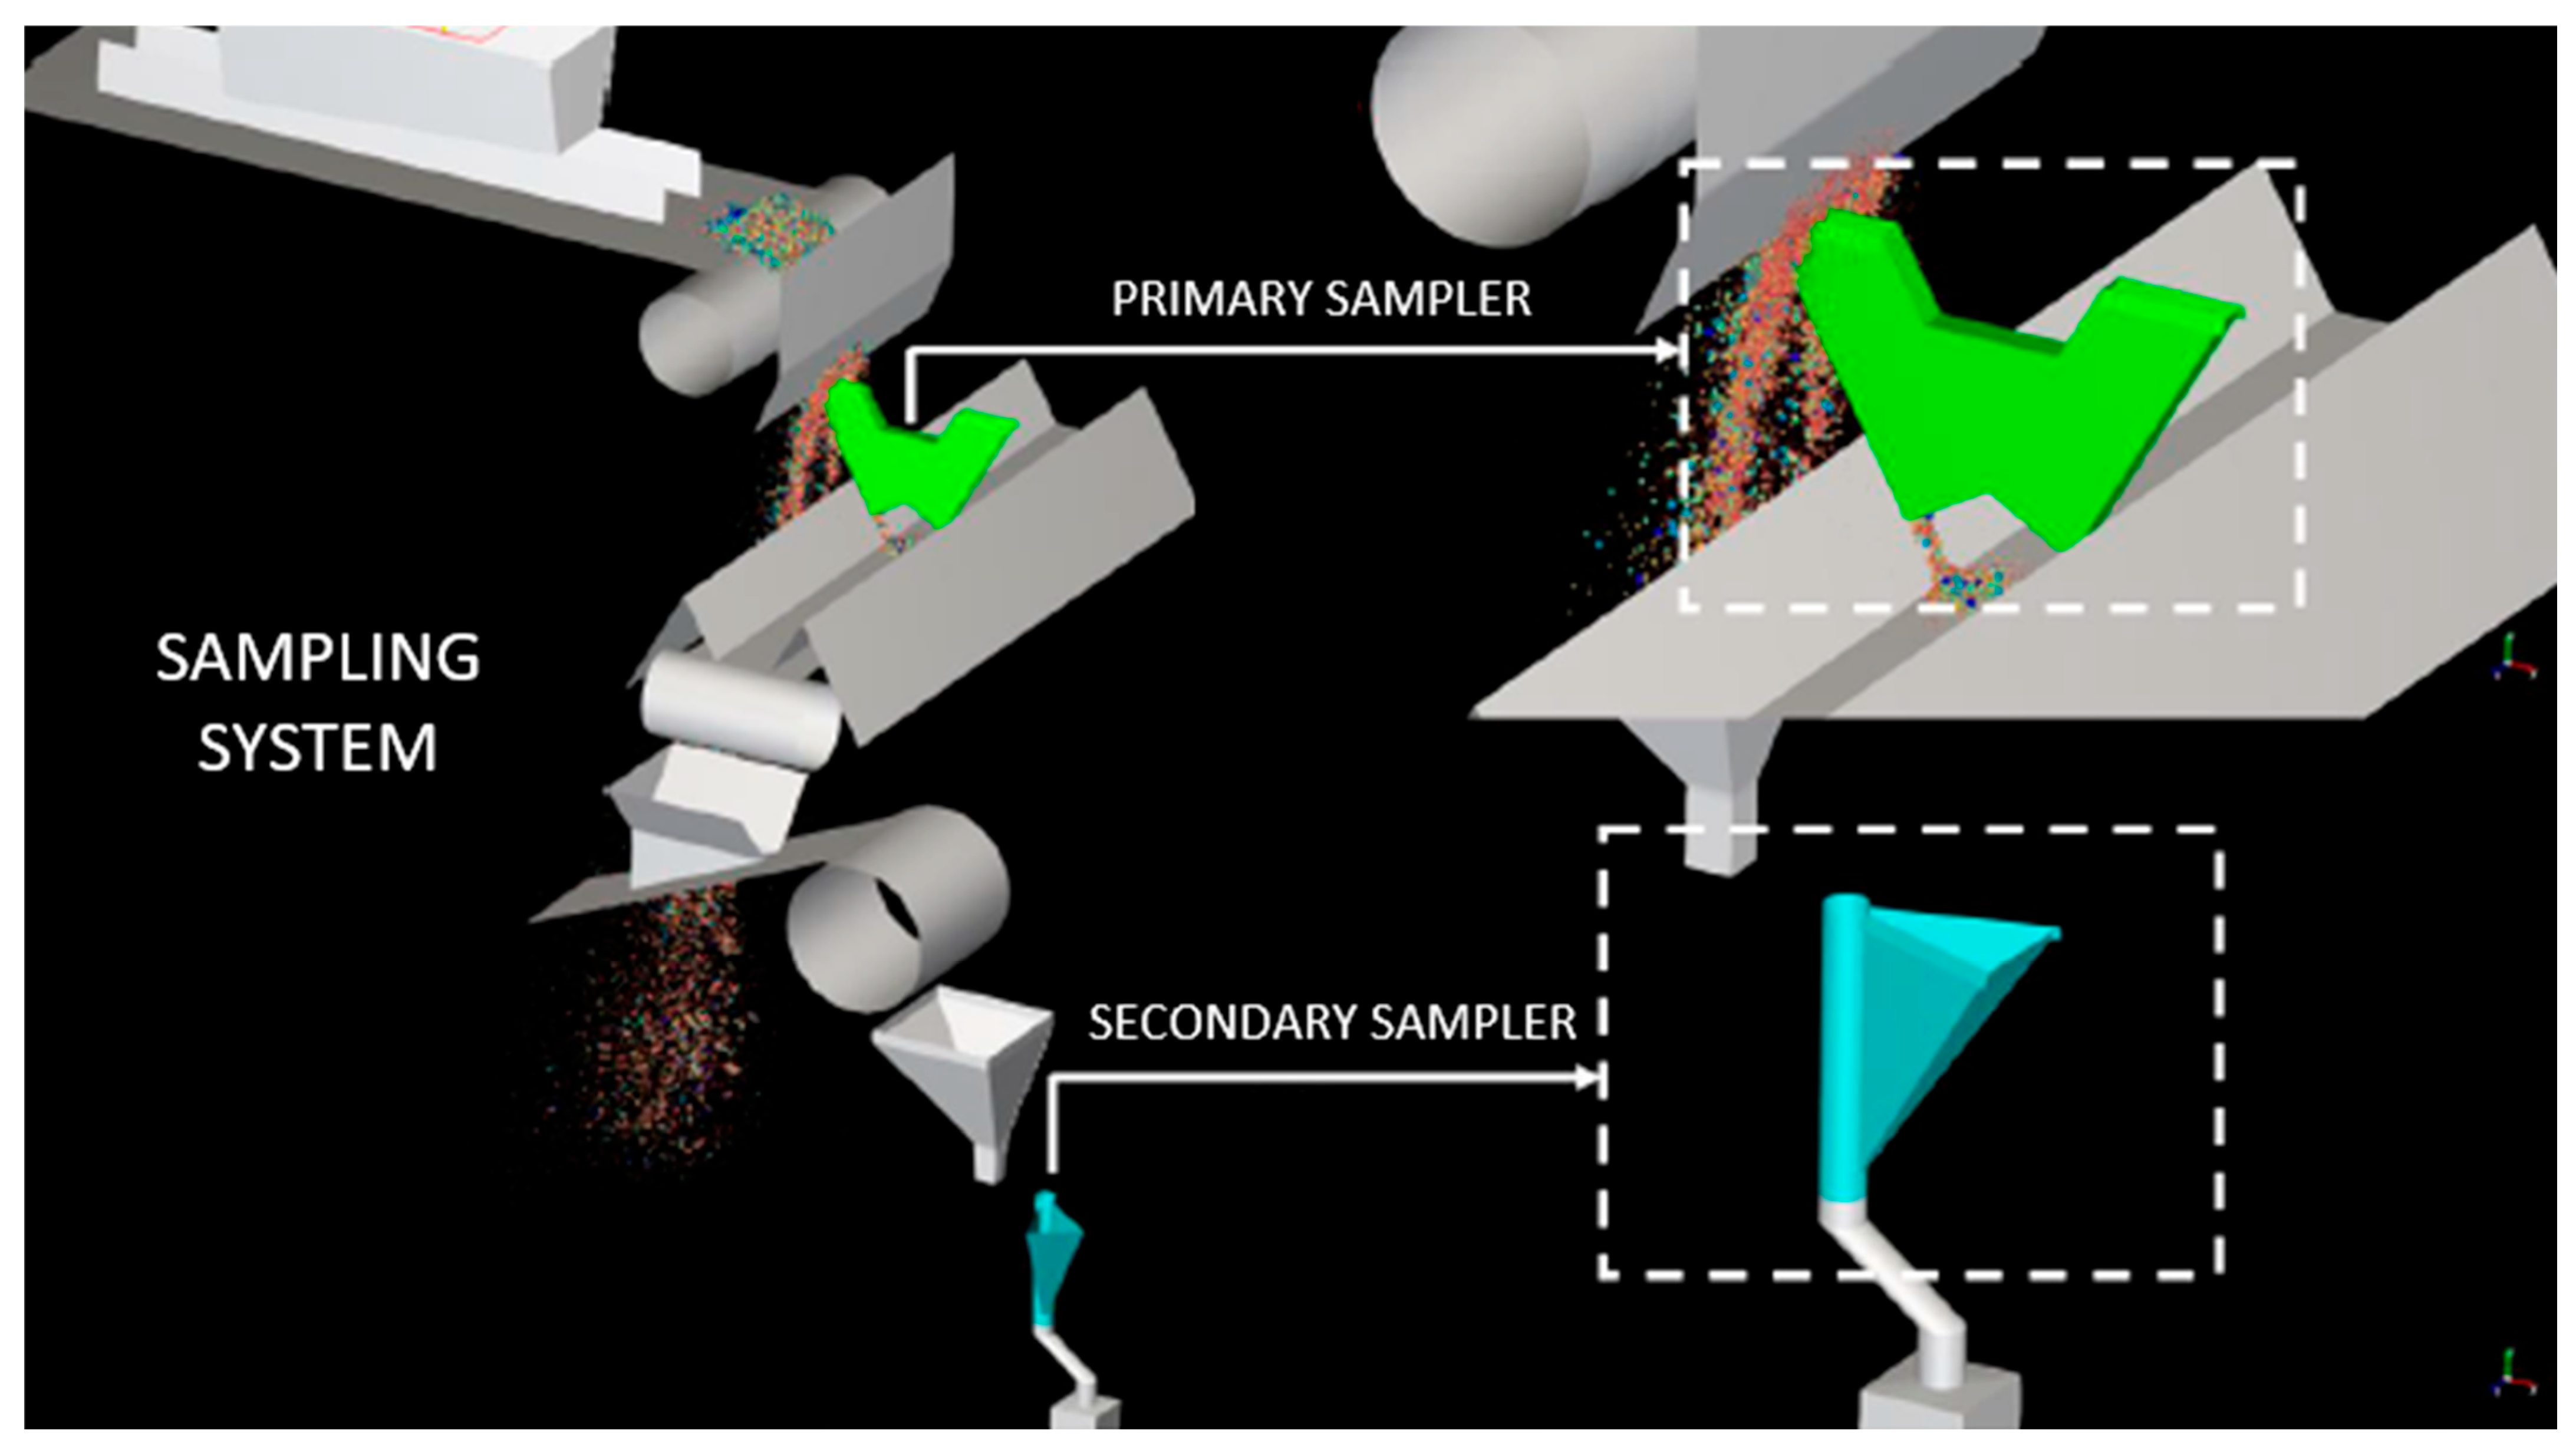
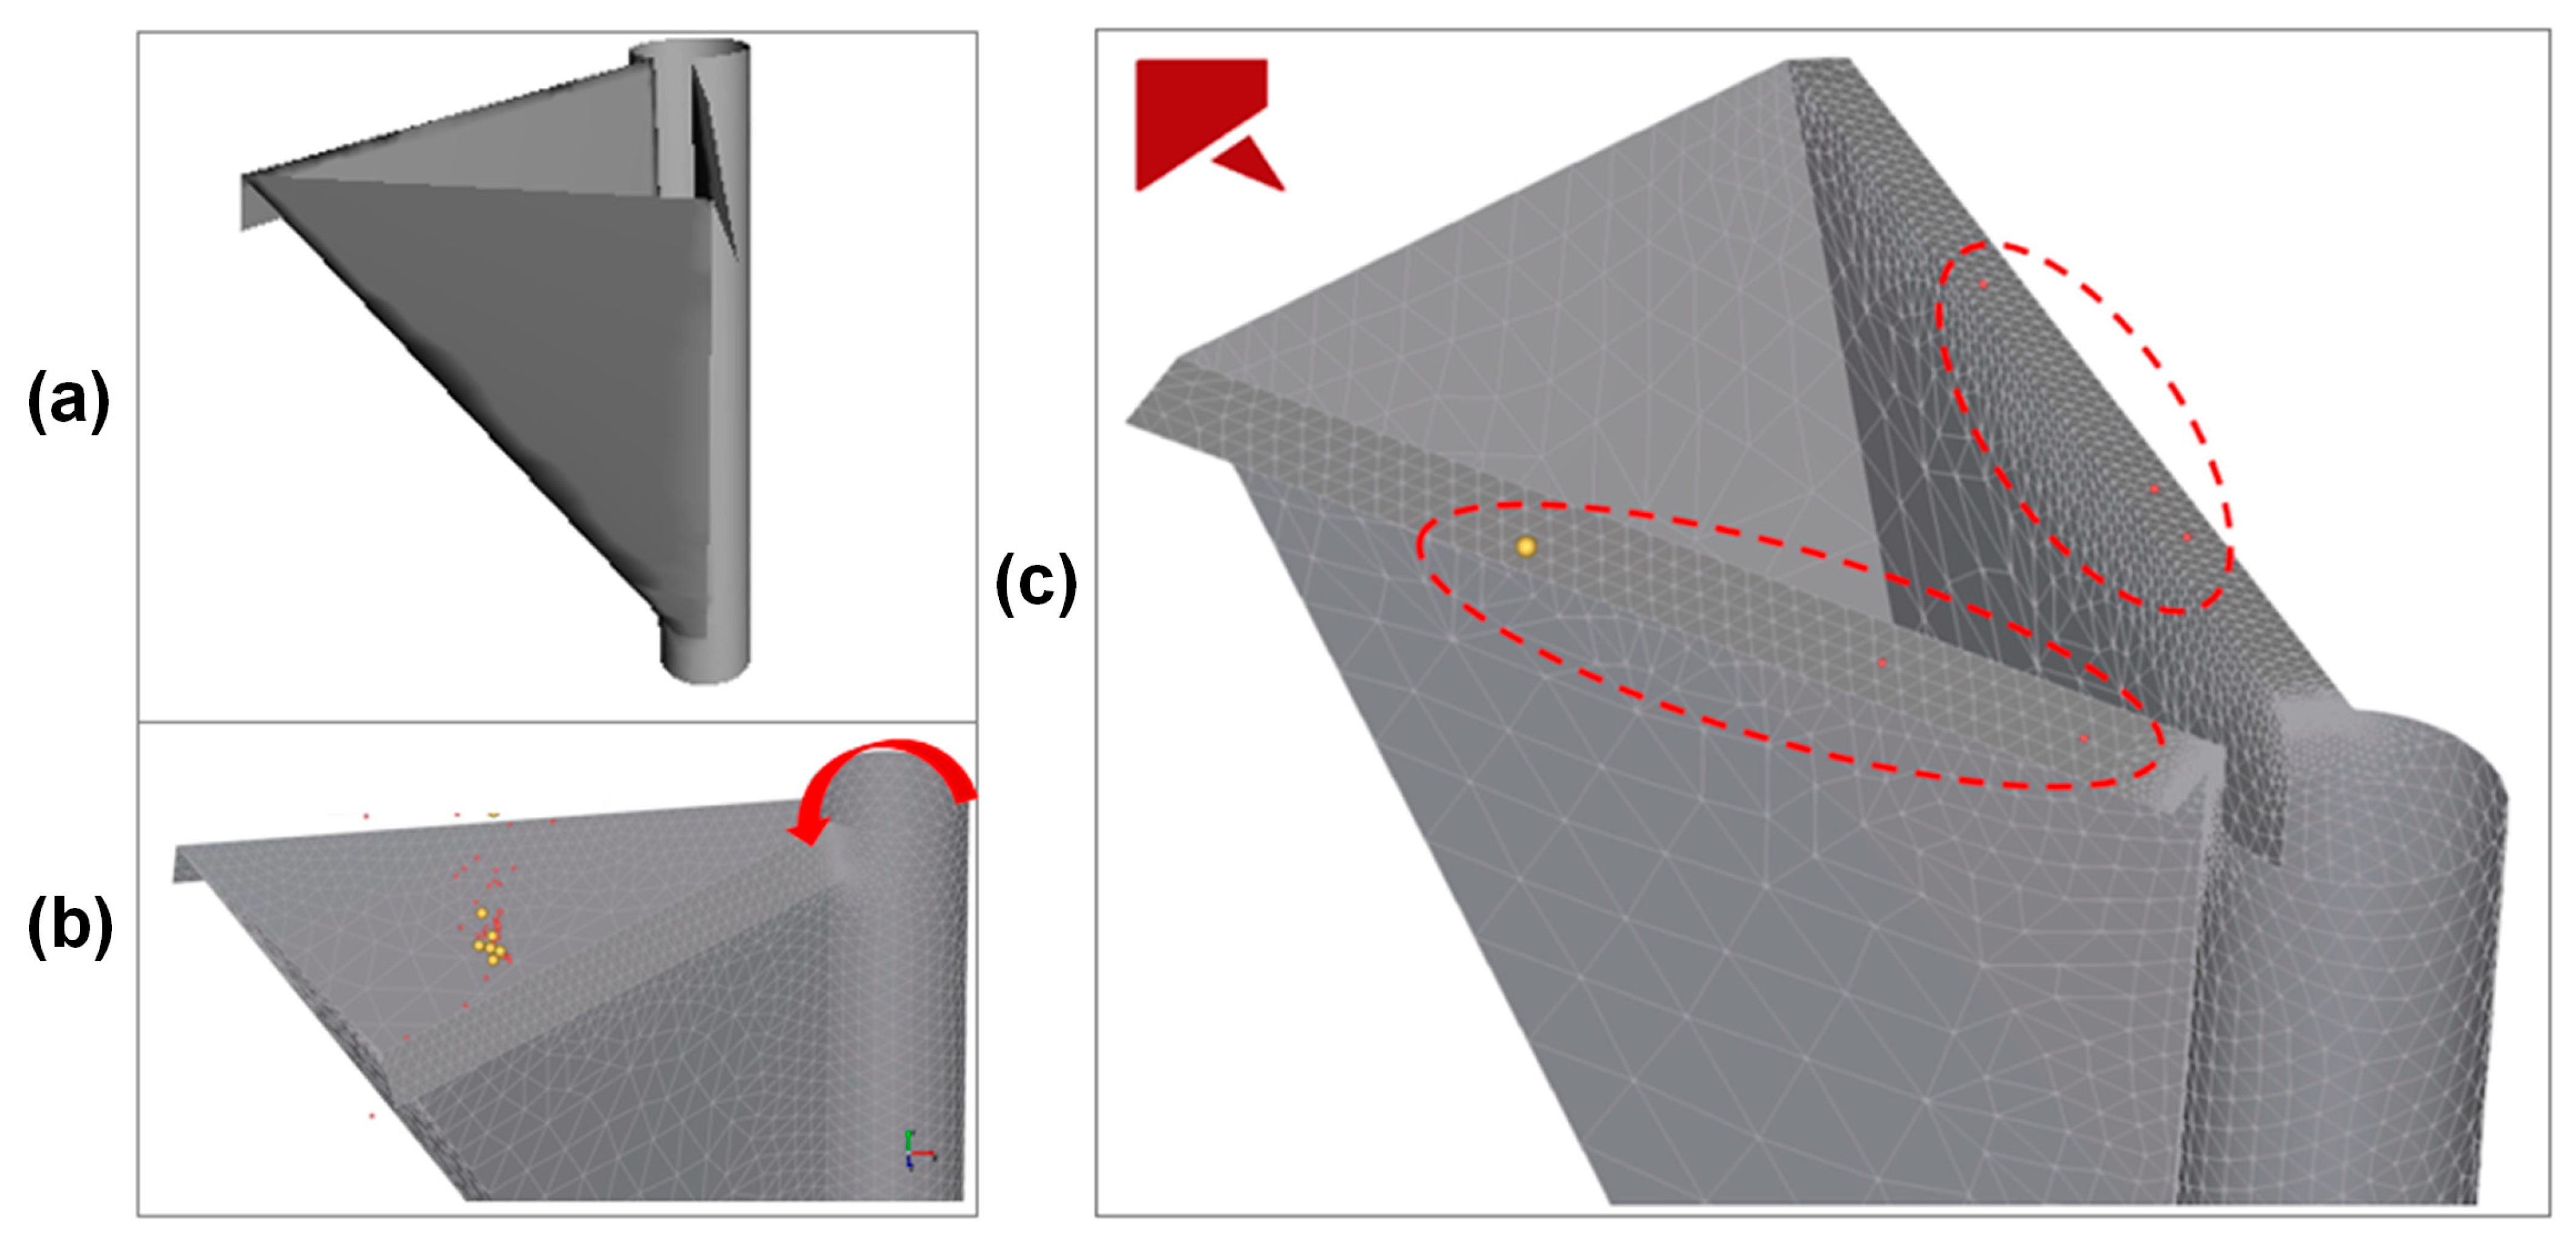
2. CDS Sampling System and DEM Simulation
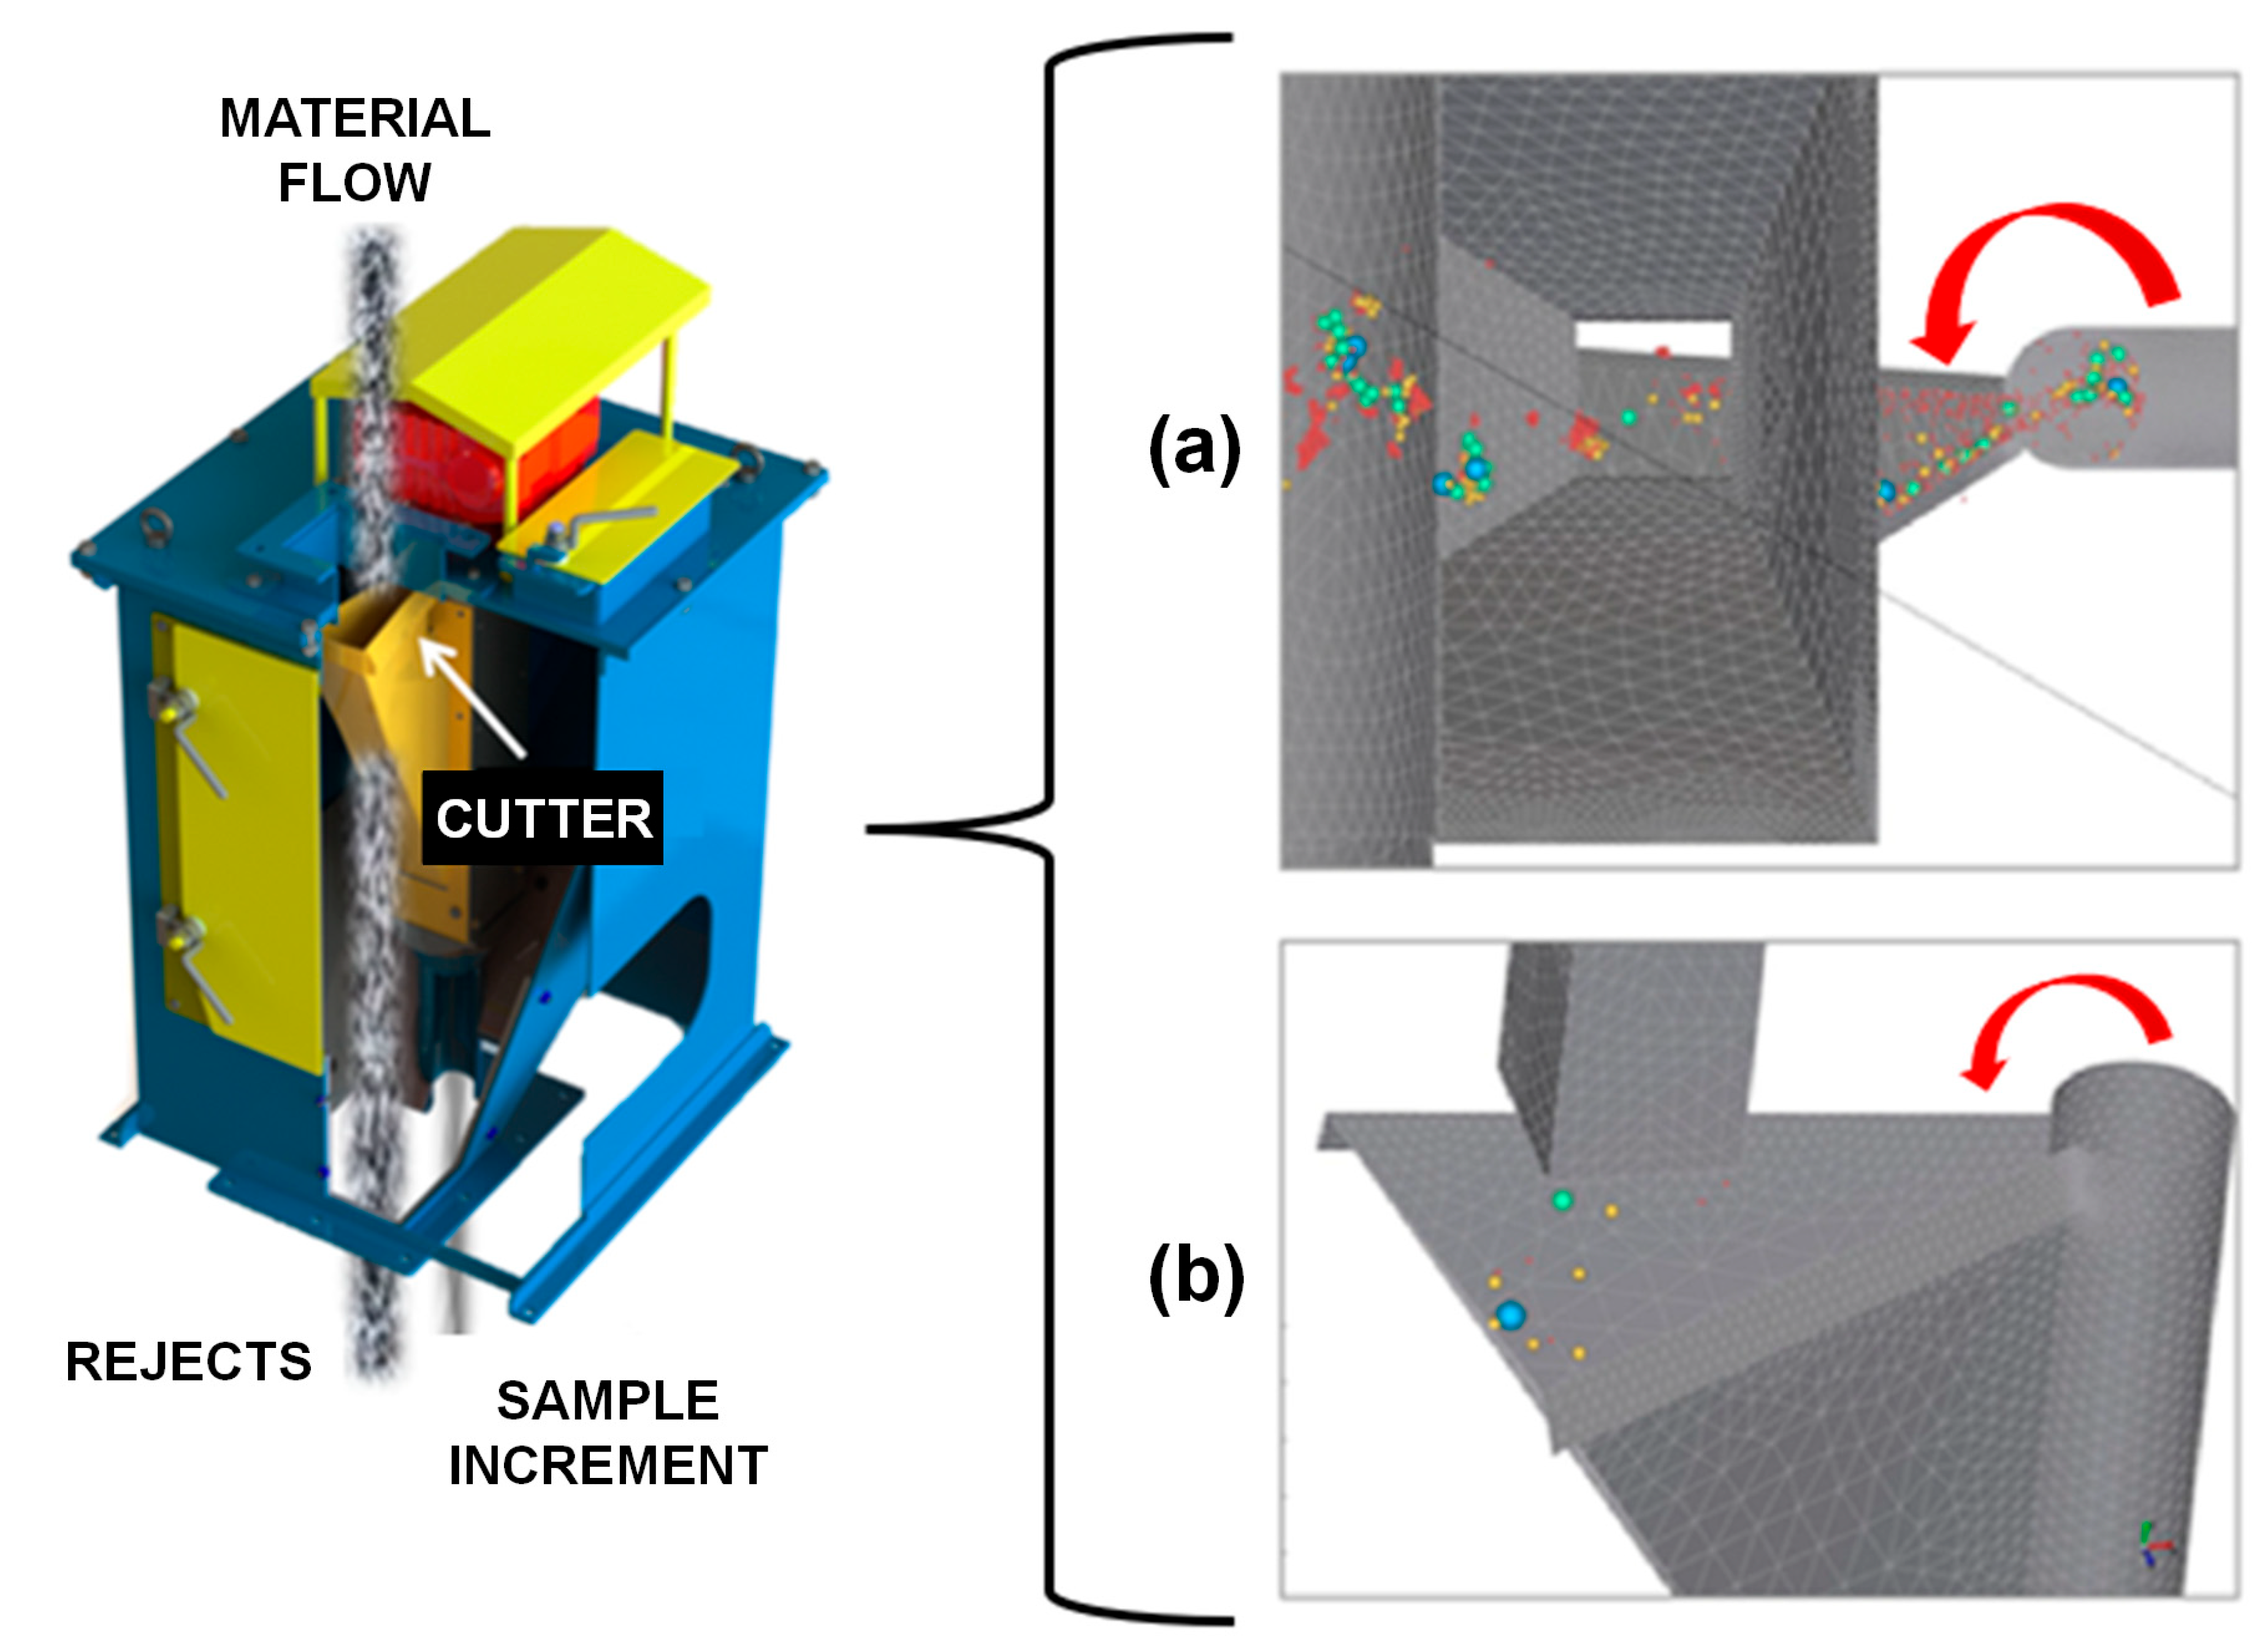
- Model: vezin rotary autosampler;
- Cutter movement: perpendicular to the flow direction;
- Cutter aperture (A): 60 mm;
- Cutter edge angle (γ): 70°;
- Cutter angle (α): 70°;
- Cutter velocity (Vmax): 45 cm/s.
3. Materials and Methods
- Cutter aperture (A);
- Cutter edge angle (γ);
- Cutter velocity (Vmax);
- Solid feed rate (Q).
4. Analyses and Results
4.1. Physical Property Characterisation
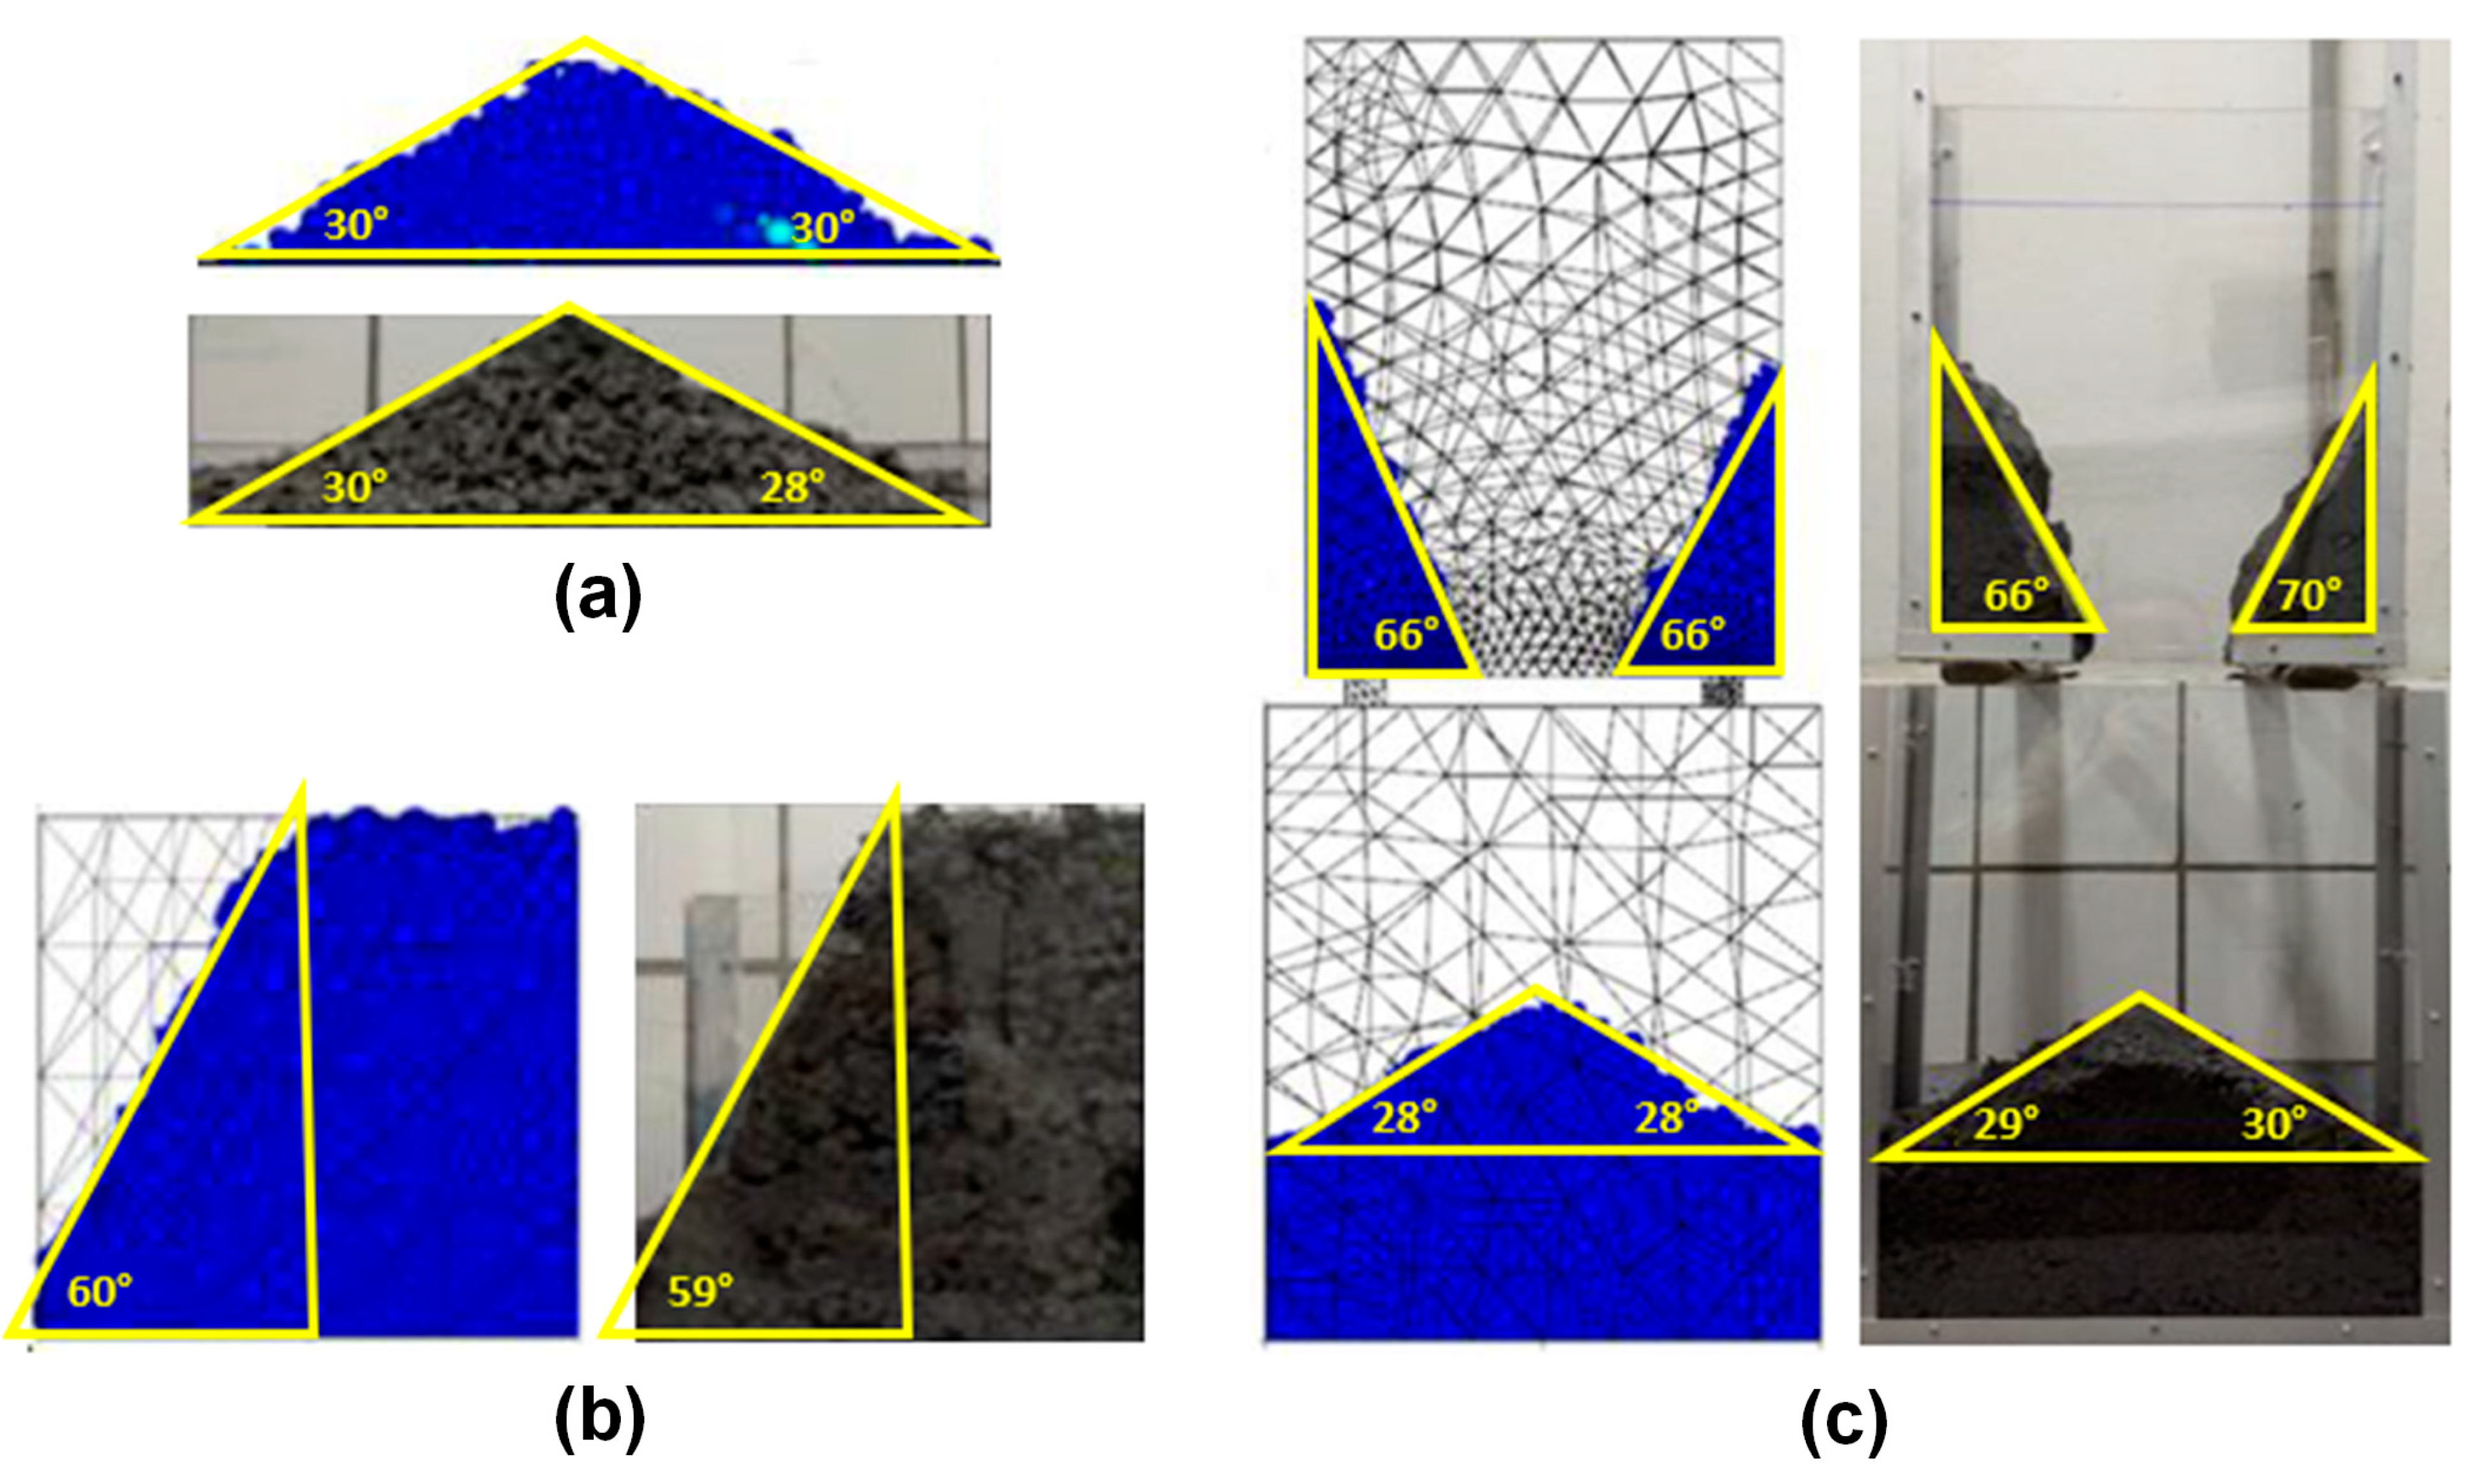
4.2. DEM Calibration
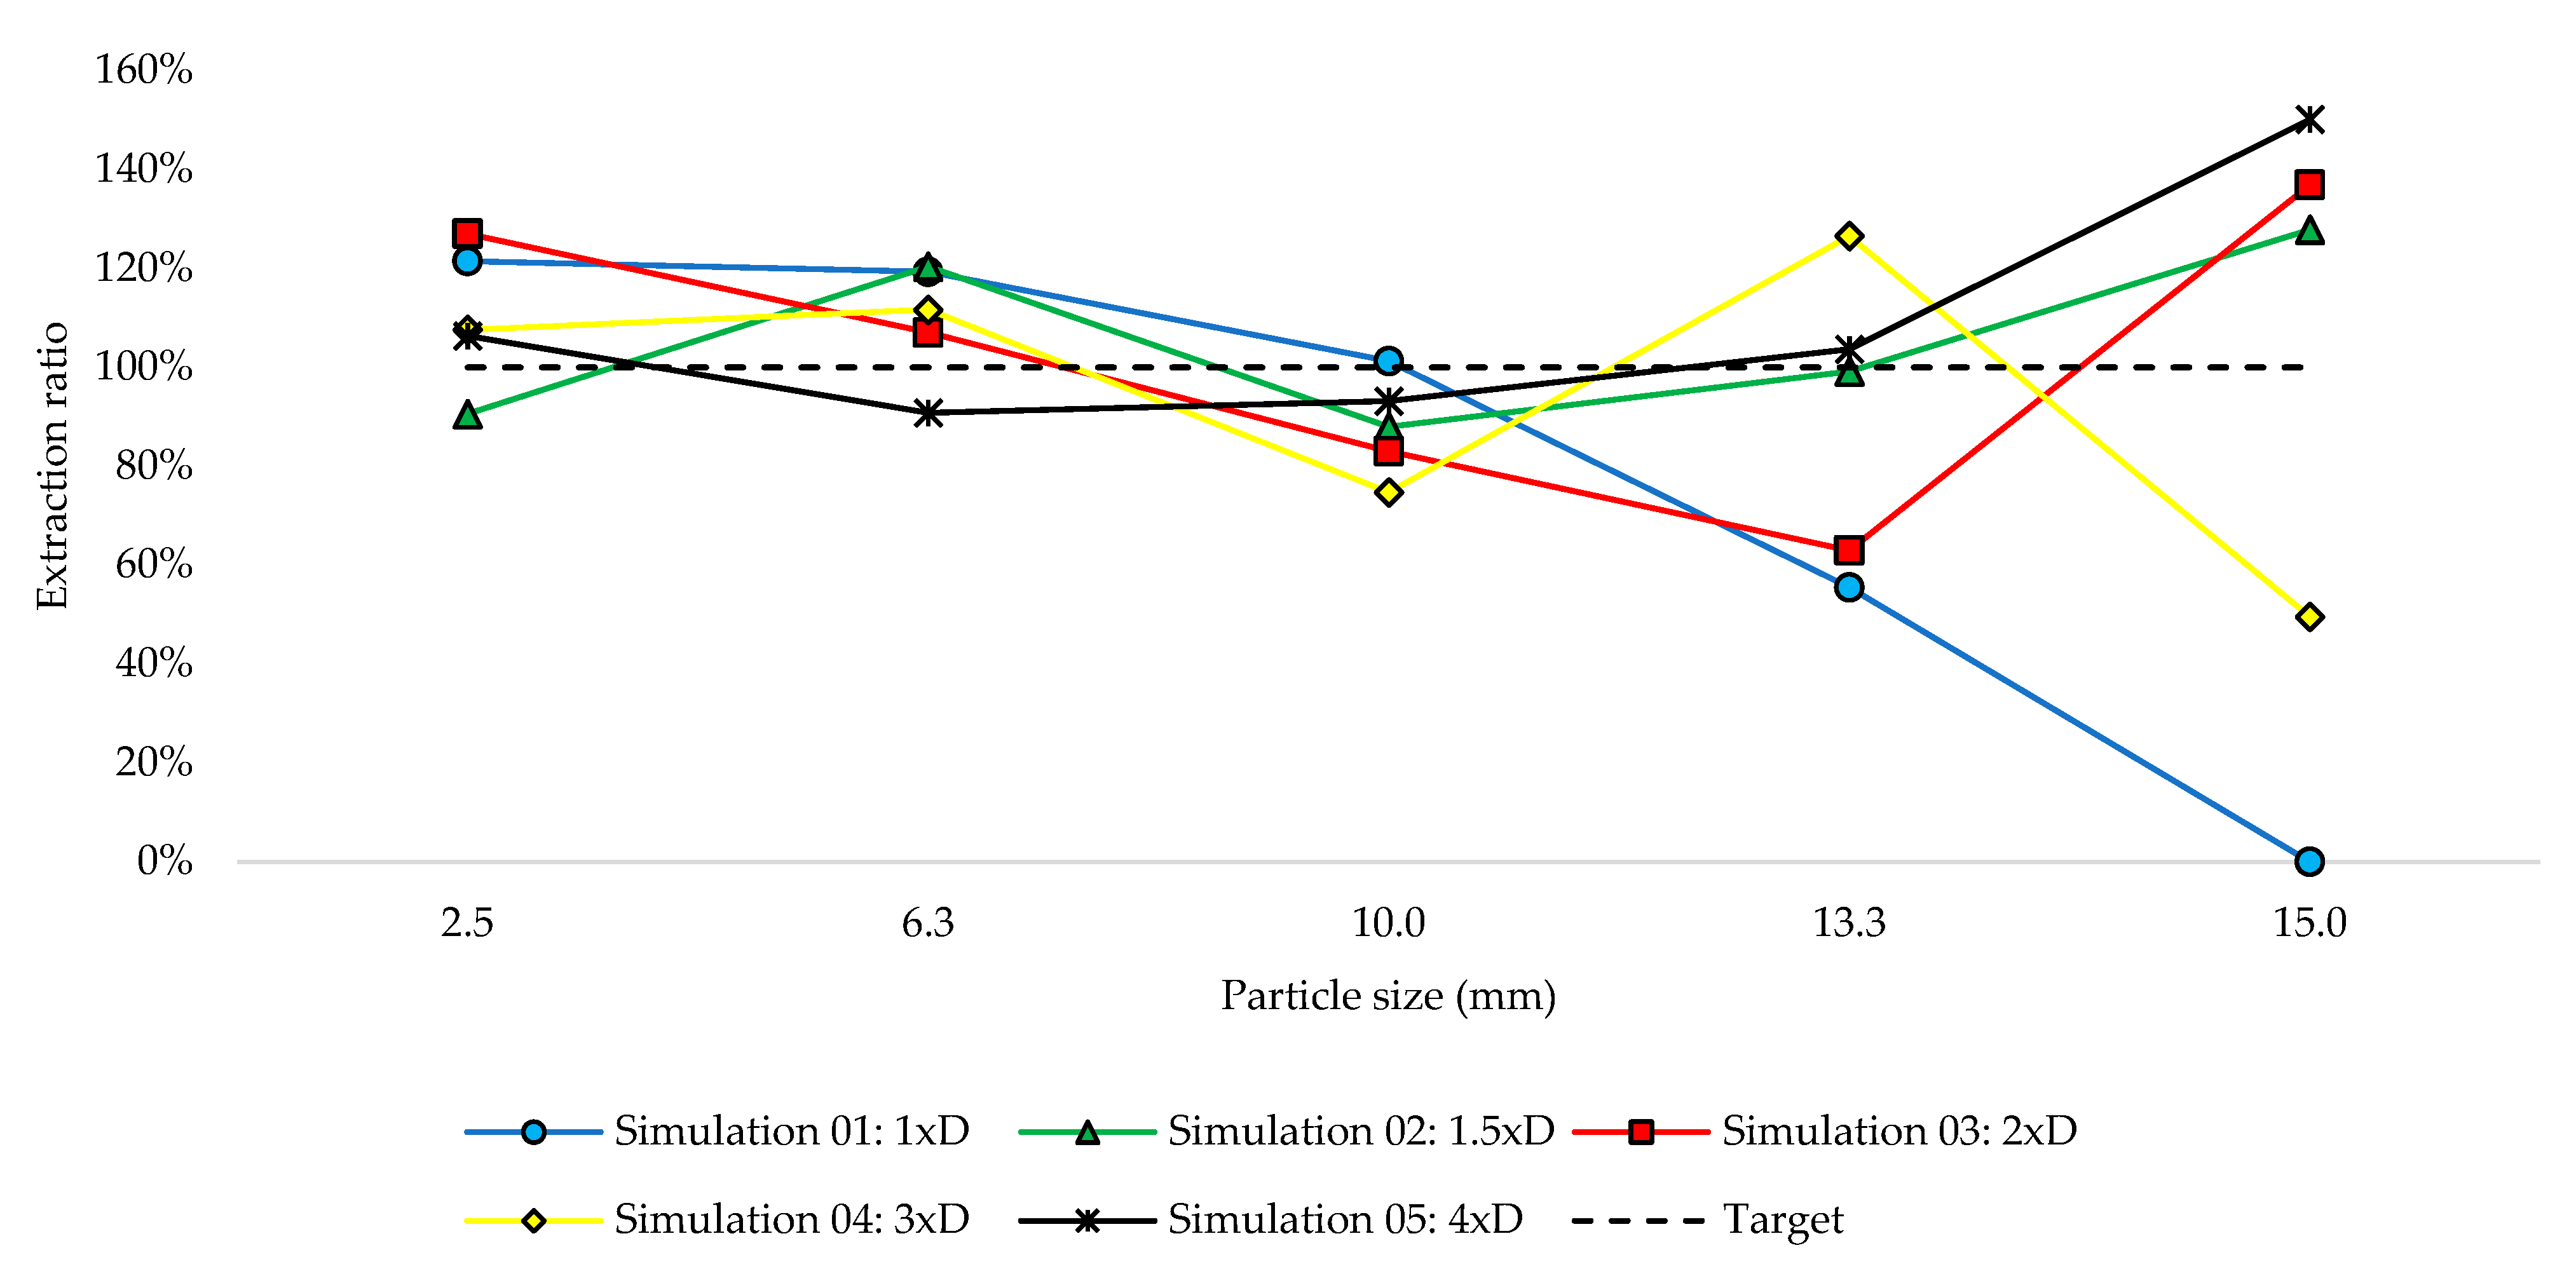
4.3. Cutter Aperture
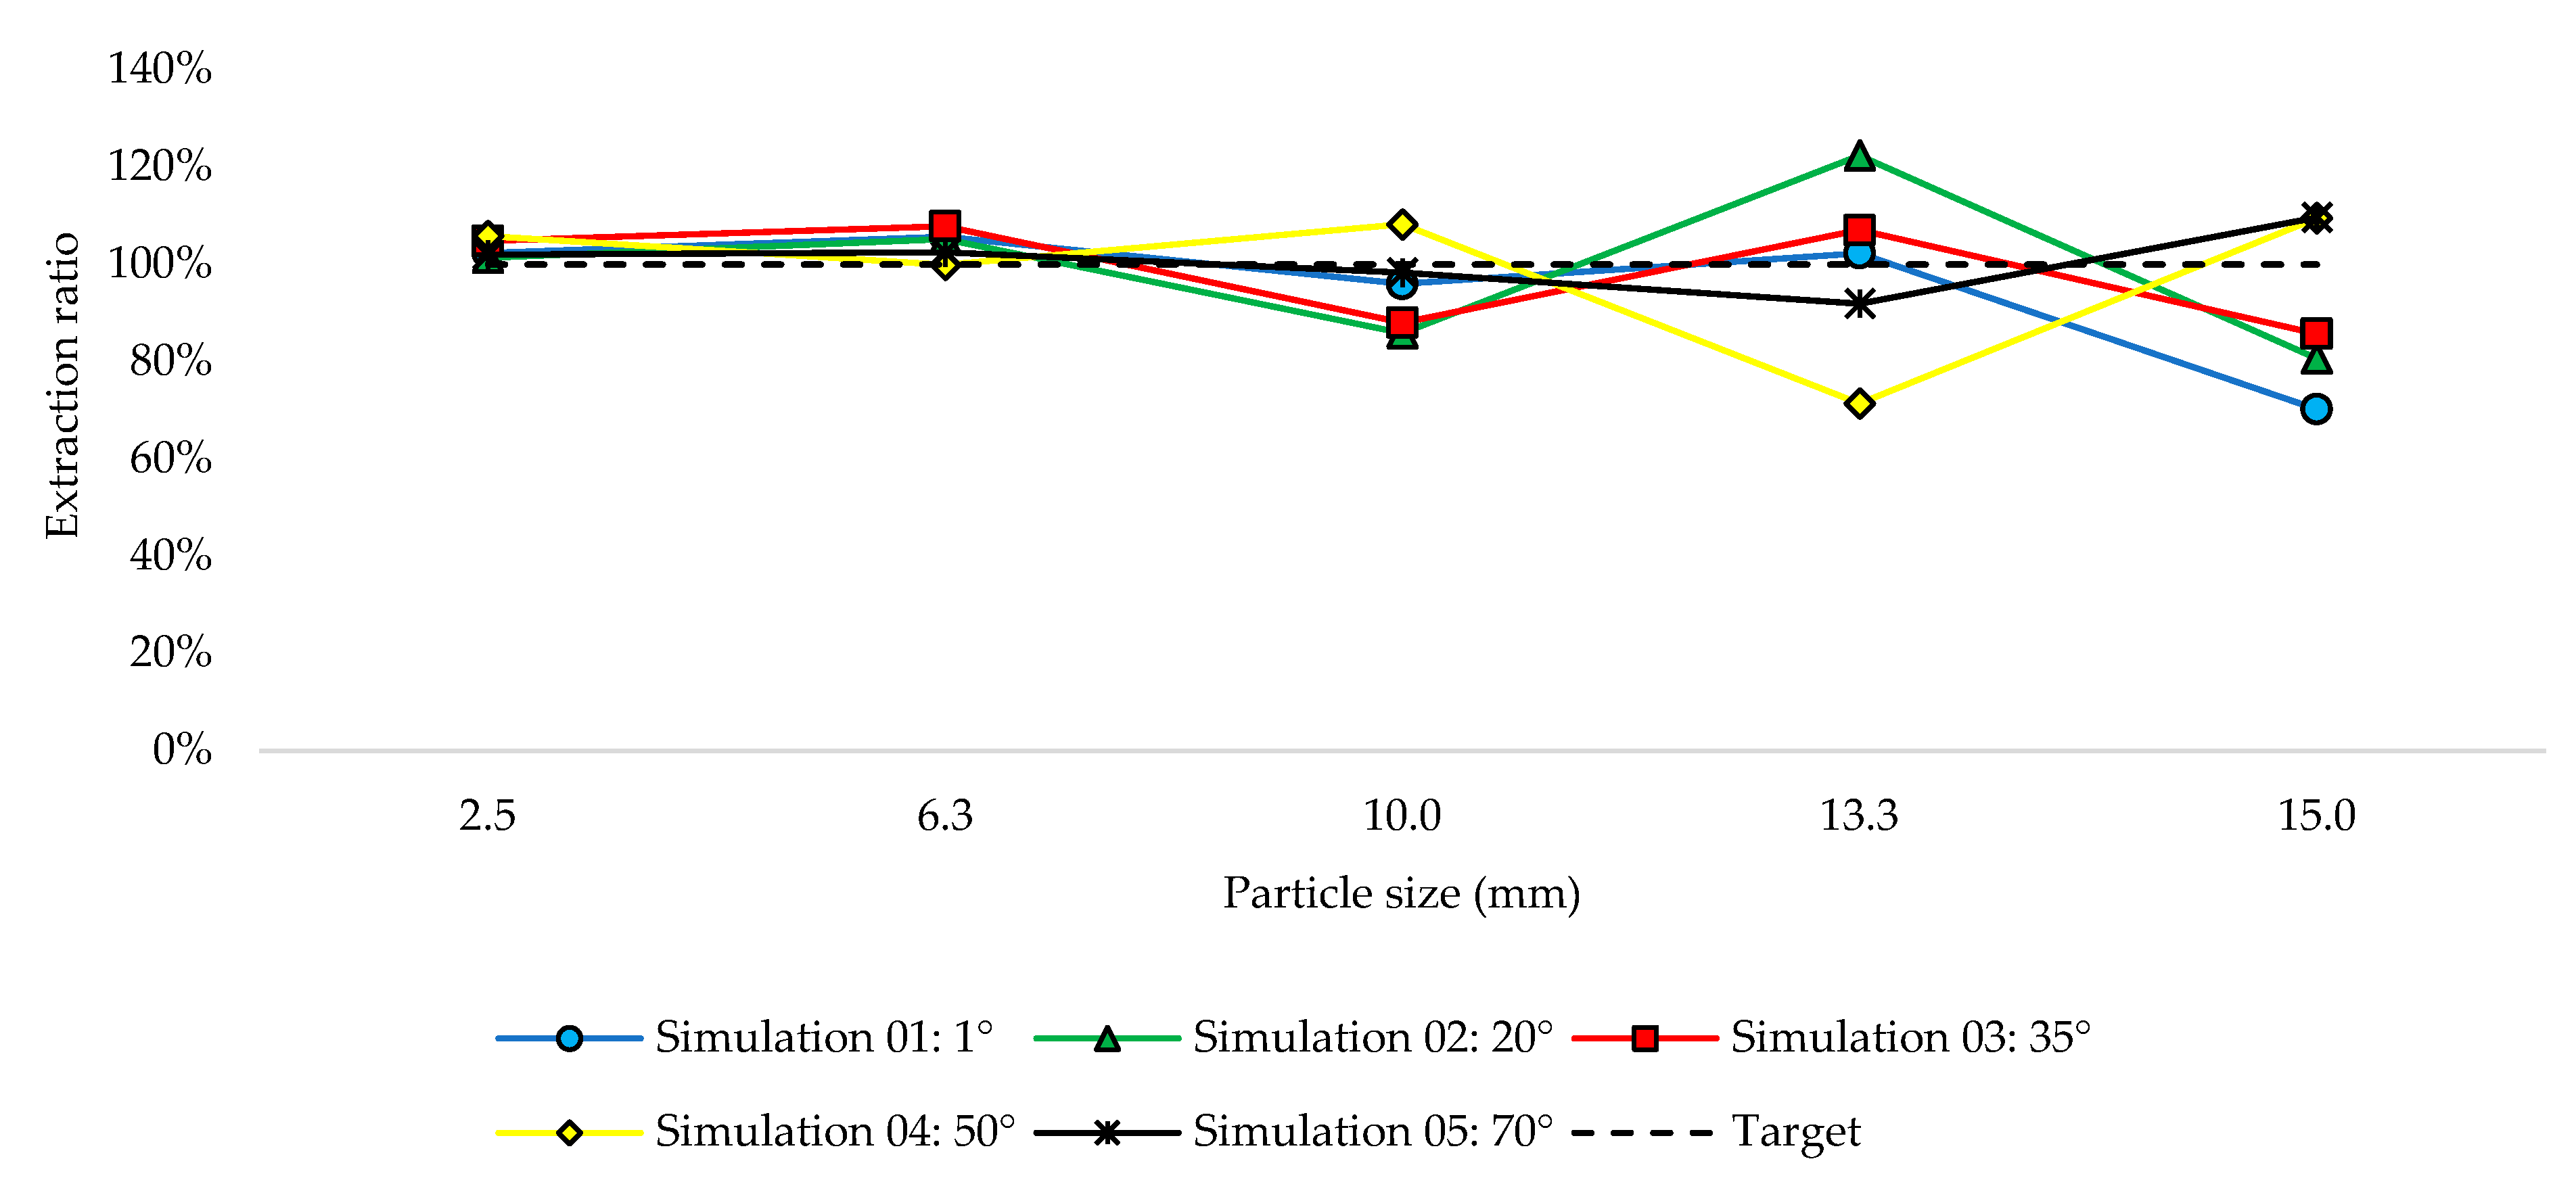
4.4. Cutter Edge Angle
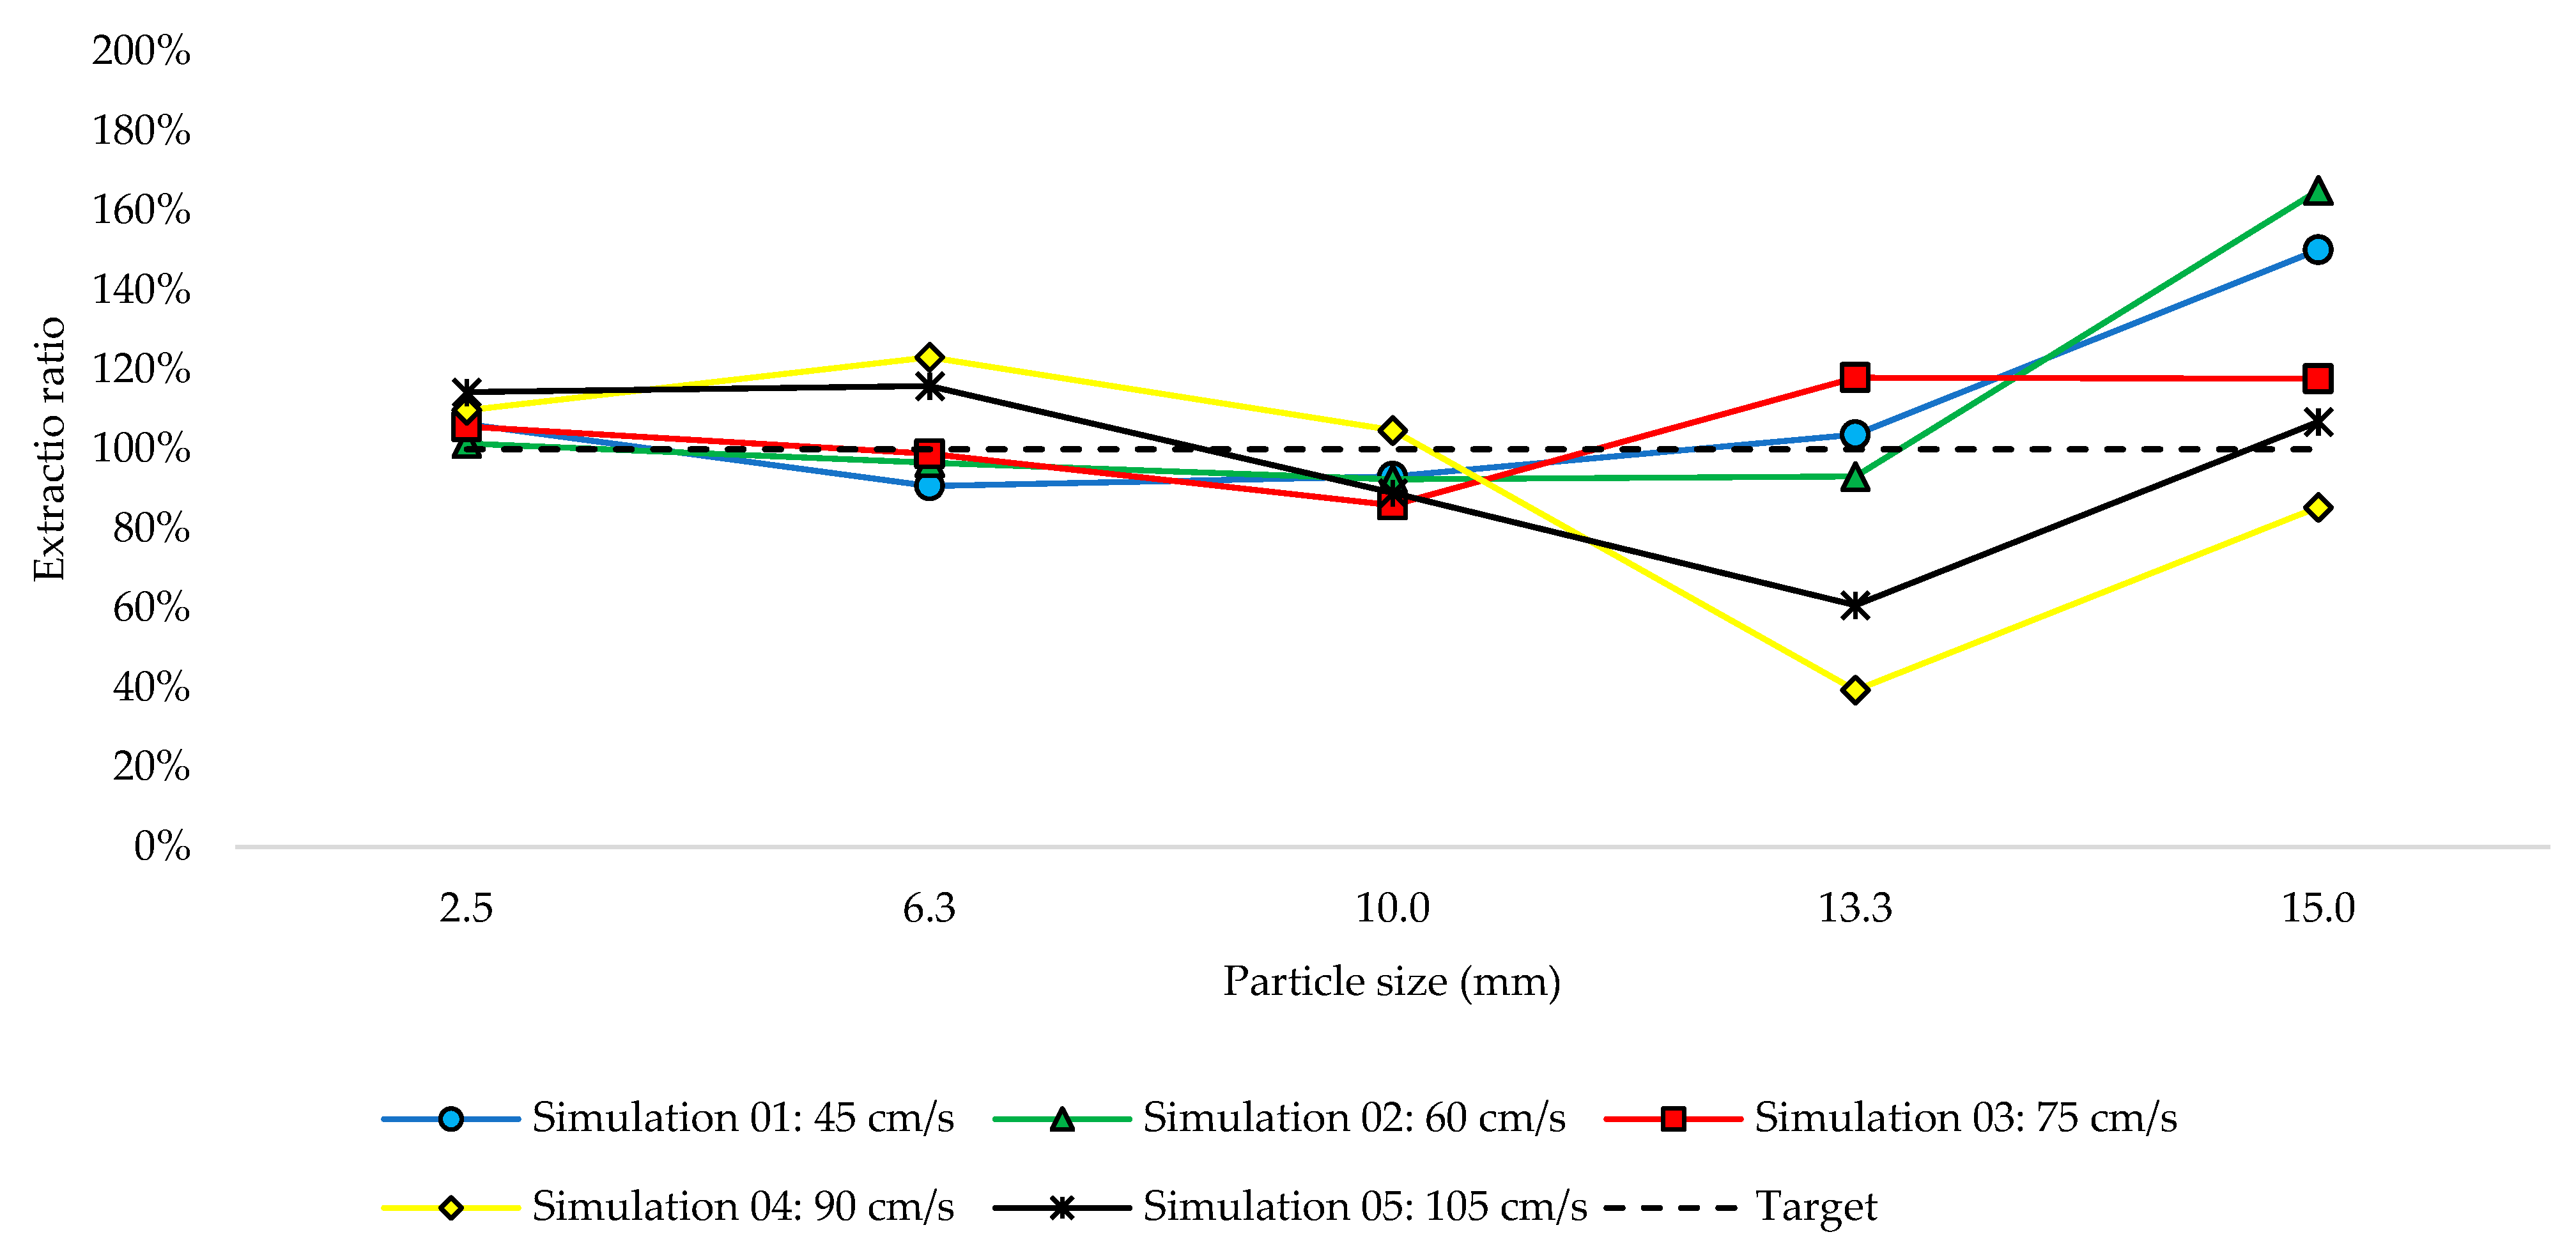
4.5. Cutter Velocity
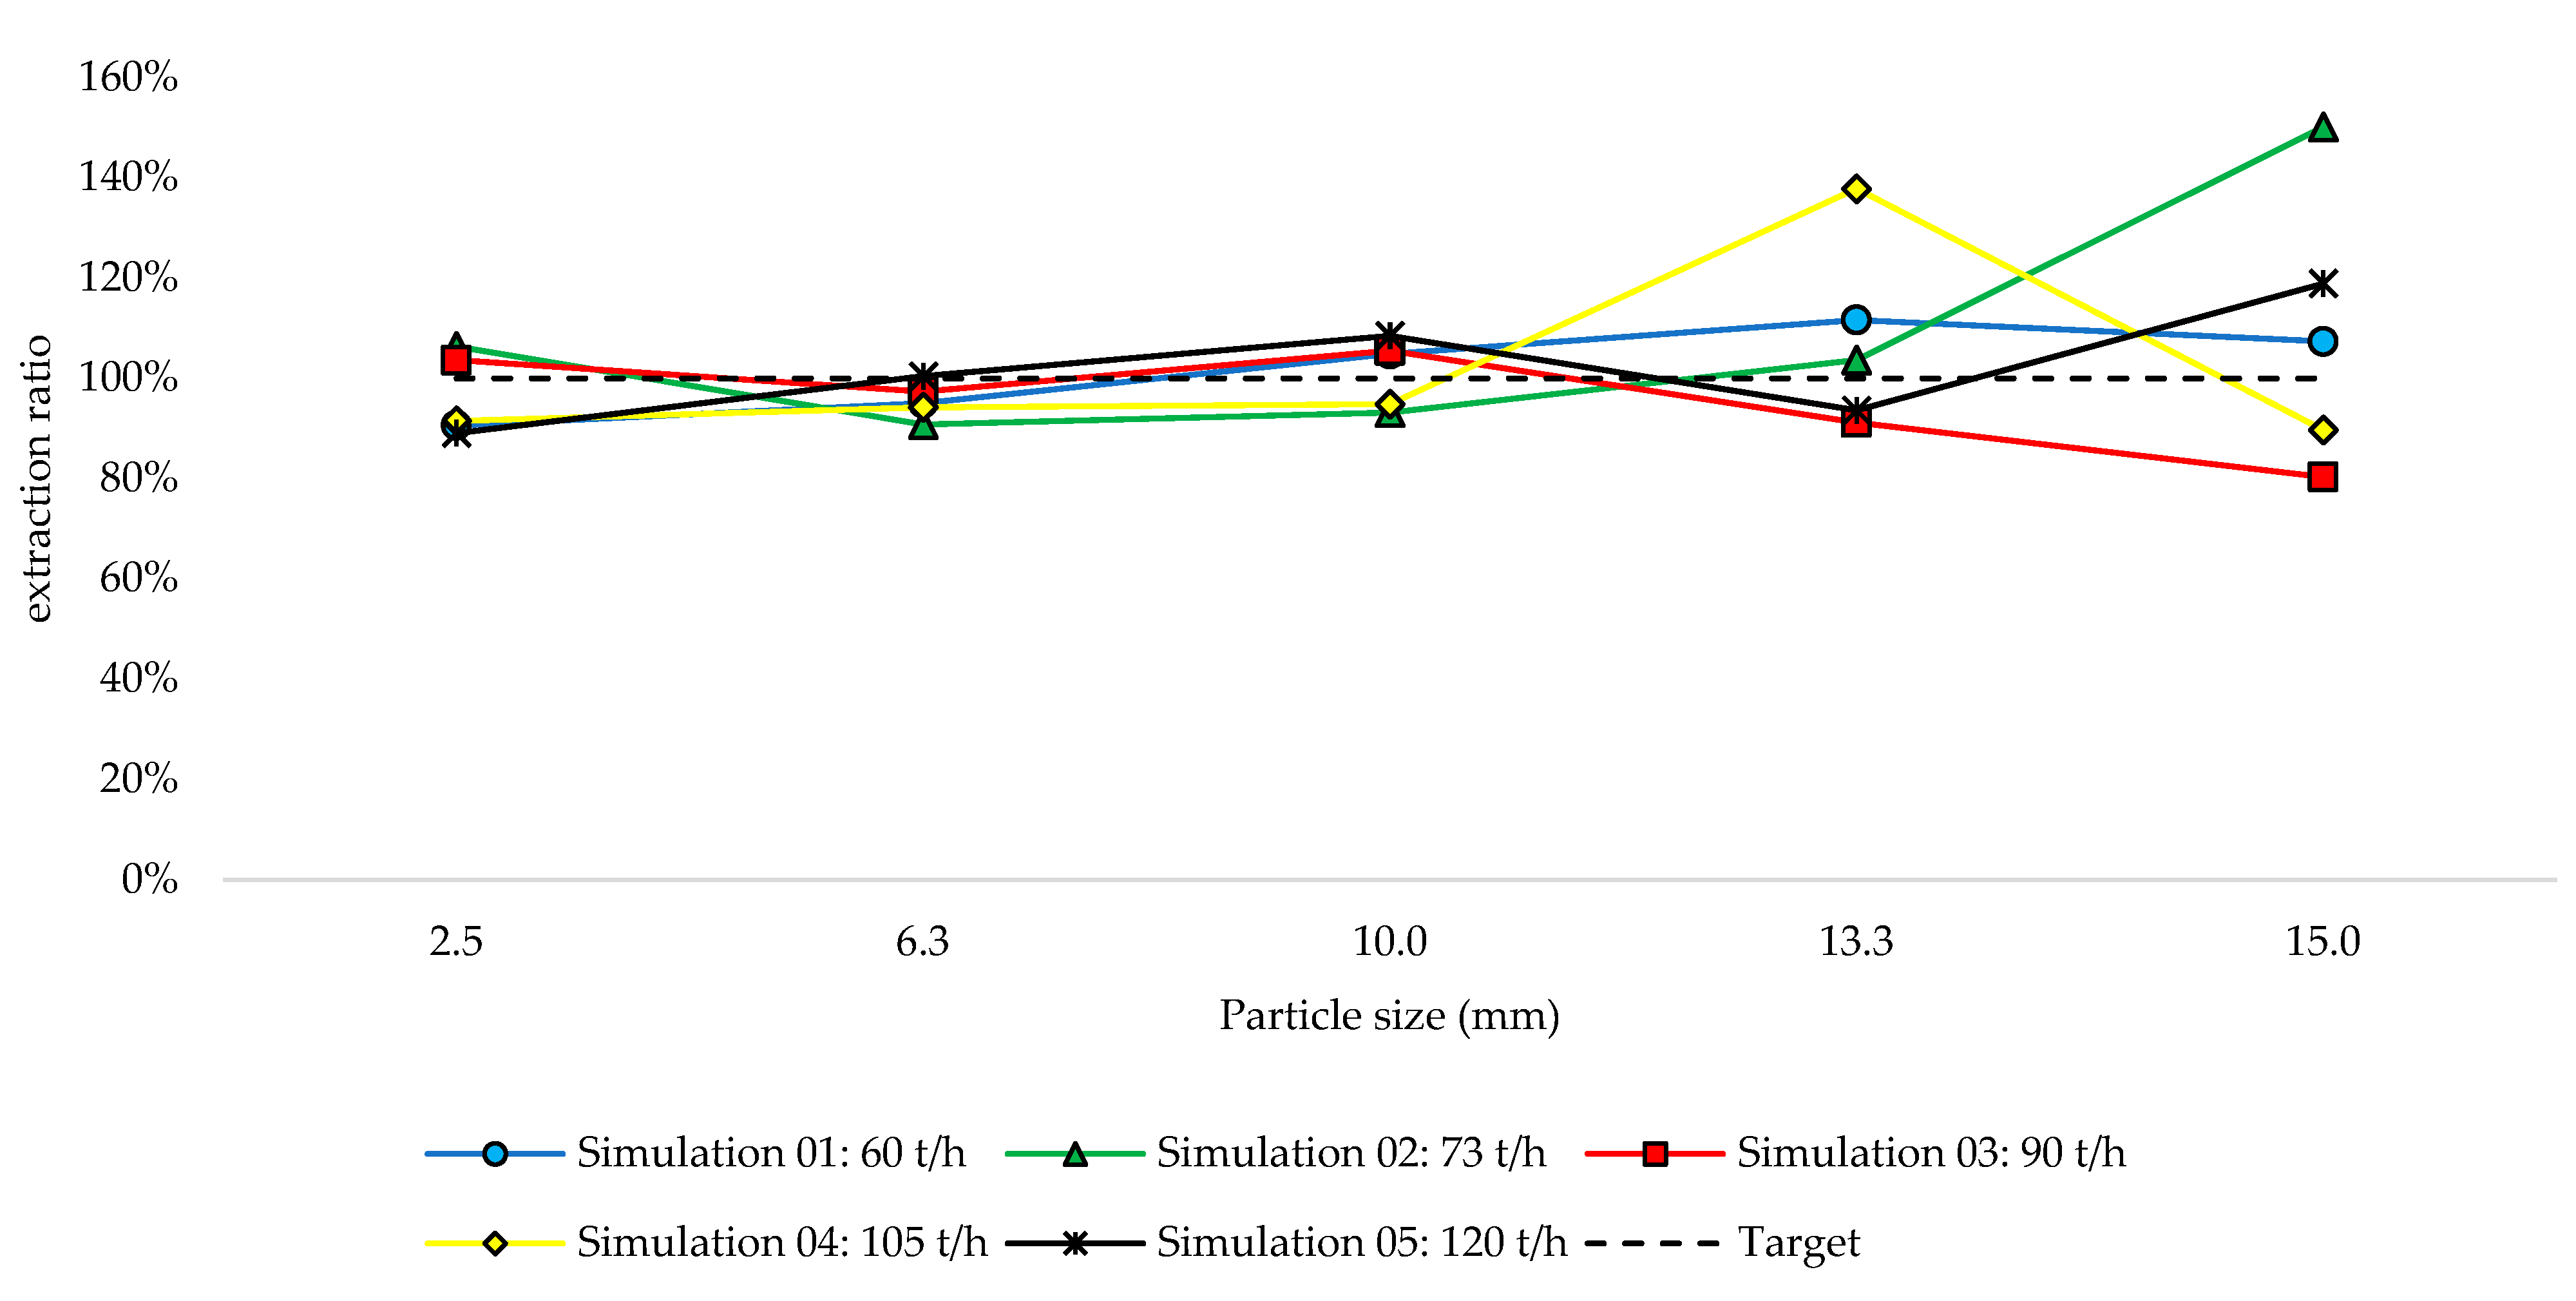
4.6. Solid Feed Rate
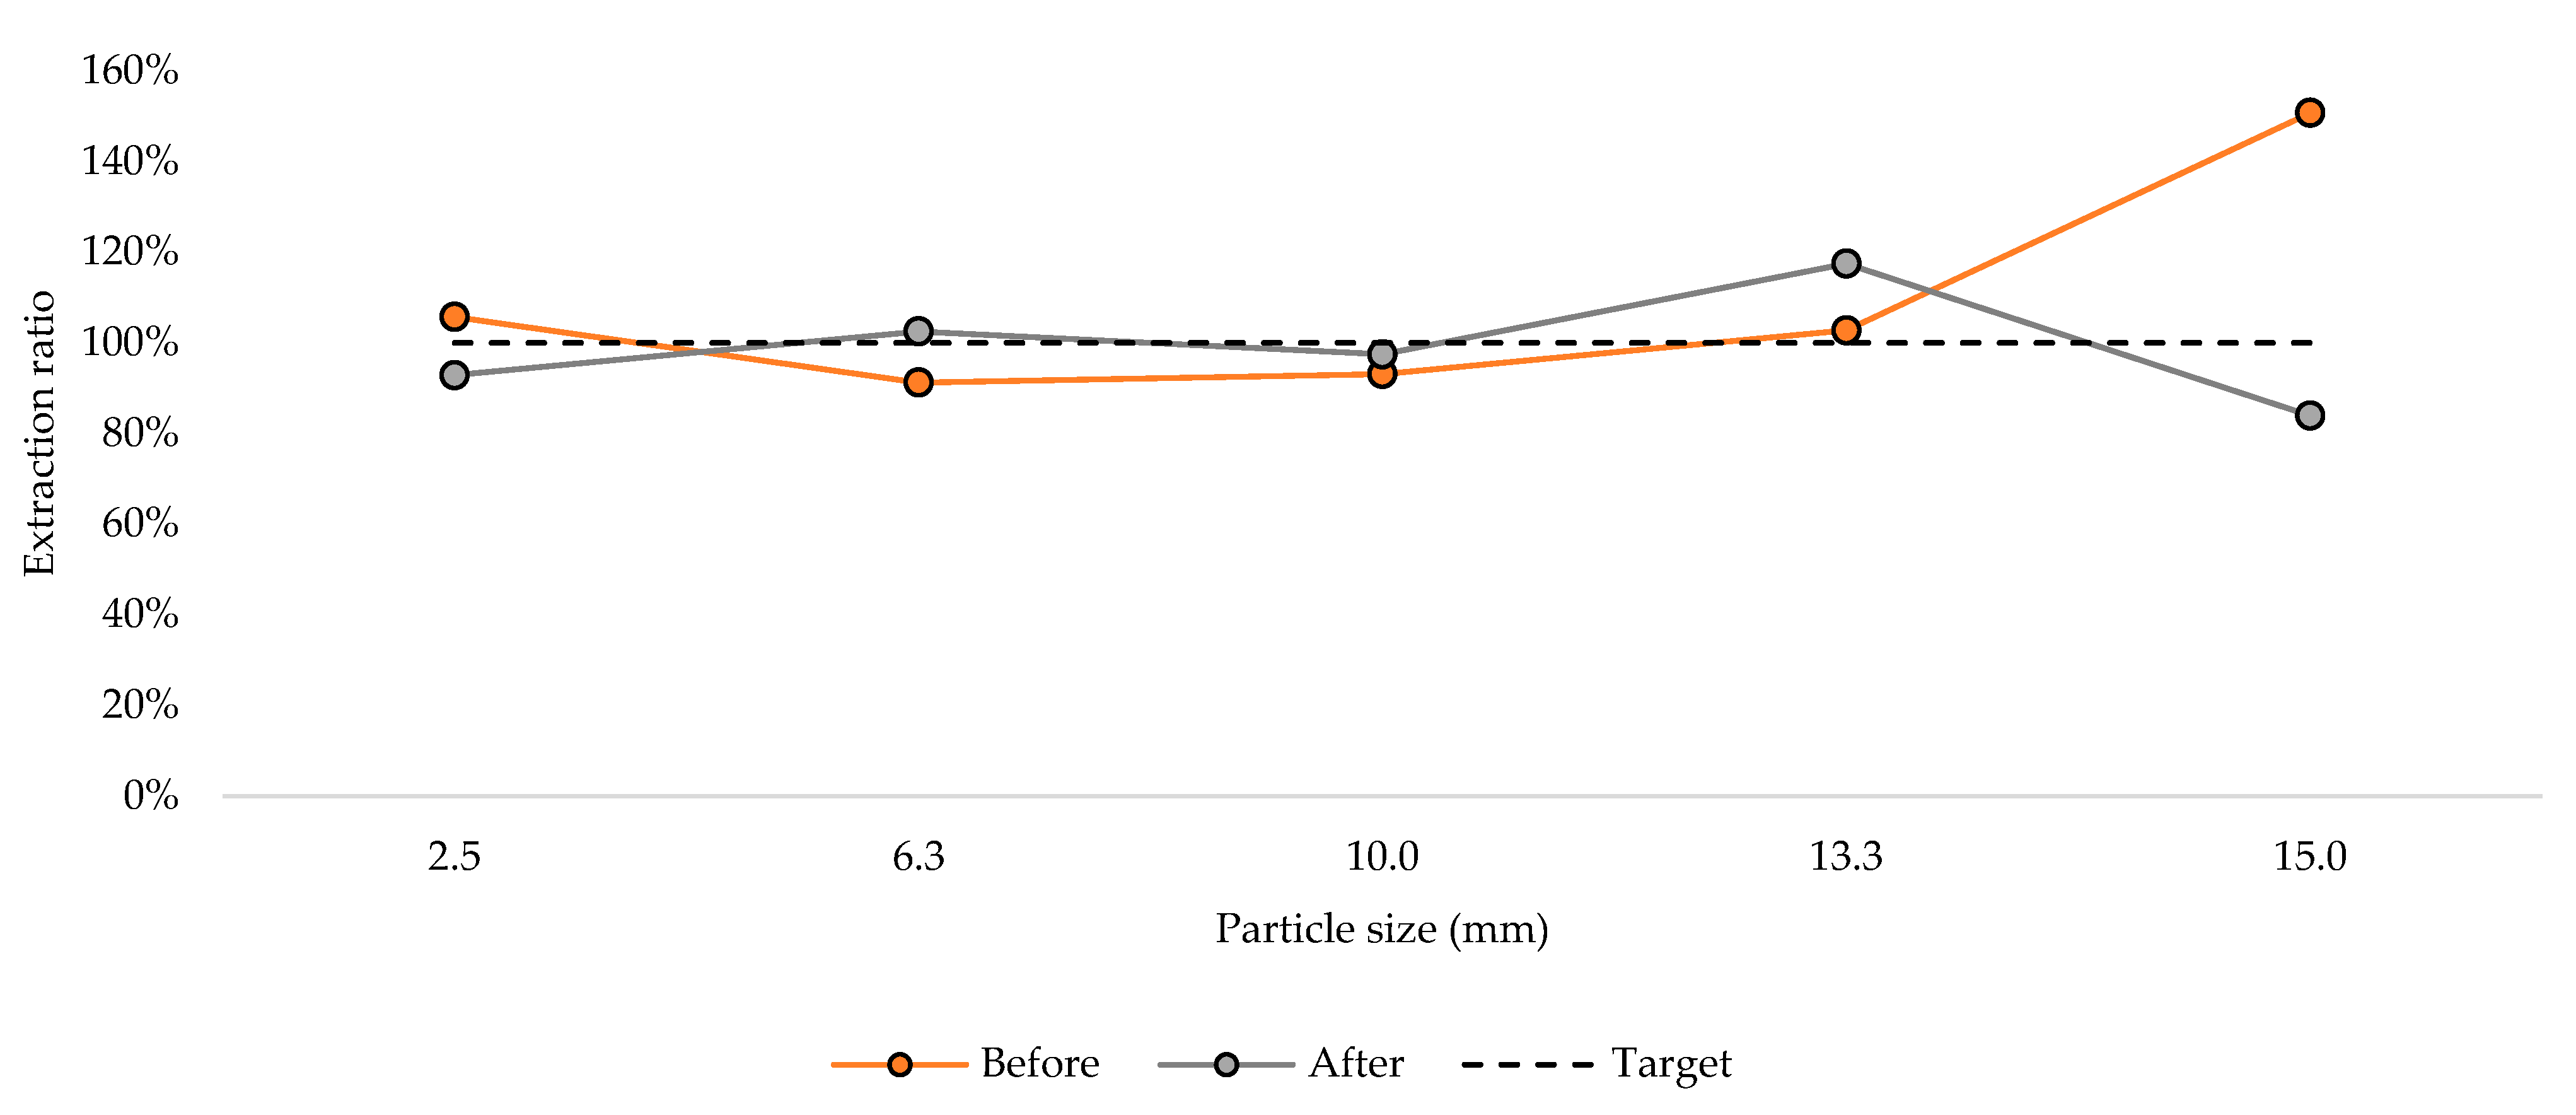
5. Improvements Implemented from Simulations
- A 25% reduction in the primary sampler speed (45 cm/s to 34 cm/s);
- A 50% reduction in the speed of the primary conveyor belt (3 cm/s to 1.5 cm/s);
- Feeder flow rate reduction to a maximum of 60 t/h.
6. Conclusions
Author Contributions
Funding
Data Availability Statement
Acknowledgments
Conflicts of Interest
References
- Gy, P.M. Sampling of Heterogeneous and Dynamic Material Systems: Theories of Heterogeneity, Sampling and Homogenizing; Elsevier: Amsterdam, The Netherlands, 1992; p. 653. [Google Scholar]
- Pitard, F.F. Pierre Gy’s Sampling Theory and Sampling Practice: Heterogeneity, Sampling Correctness, and Statistical Process Control, 2nd ed.; CRC Press: Boca Raton, FL, USA, 1993; p. 488. [Google Scholar]
- Chieregati, A.C.; Pitard, F.F. Amostragem. In Tratamento de Minérios, 6th ed.; Luz, A.B., França, S.C.A., Braga, P.F.A., Eds.; CETEM/MCTIC: Rio de Janeiro, Brazli, 2018; pp. 27–65. [Google Scholar]
- Cleary, P.W.; Robinson, G.K. Analysis of vezin sampler performance. Chem. Eng. Sci. 2011, 66, 2385–2397. [Google Scholar] [CrossRef]
- Cleary, P.W.; Robinson, G.K. Sampling of cohesive bulk materials by falling stream cutters. Chem. Eng. Sci. 2011, 66, 3991–4003. [Google Scholar] [CrossRef]
- Cleary, P.W.; Robinson, G.K.; Sinnott, M.D. Use of granular flow modelling to investigate possible bias of sample cutters. In Proceedings of the 2nd World Conference on Sampling and Blending, Sunshine Coast, QLD, Australia, 9–12 May 2005; Australasian Institute of Mining and Metallurgy: Carlton, VIC, Australia, 2005; pp. 69–81. [Google Scholar]
- Robinson, G.K.; Sinnott, M.D. Discrete element modelling of square cross-belt samplers with baffles. In Proceedings of the 5th World Conference on Sampling and Blending, Santiago, Chile, 25–28 October 2011; Gecamin: Santiago, Chile, 2011. [Google Scholar]
- Kruger, C.; van Tonder, E. Pitfalls in Vezin sampling for finely crushed materials by. J. S. Afr. Inst. Min. Metall. 2014, 114, 47–52. [Google Scholar]
- Catanoso, D.; Stucky, T.; Case, J.; Rogg, A. Analysis of Sample Acquisition Dynamics Using Discrete Element Method. In Proceedings of the 2020 IEEE Aerospace Conference, Big Sky, MT, USA, 7–14 March 2020; pp. 1–11. [Google Scholar]
- Naicker, N. Particle Segregation Associated with Sub-Sampling of Feed at a Typical UG2 Concentrator. Master’s Thesis, University of the Witwatersrand, Johannesburg, South Africa, 2017; p. 196. [Google Scholar]
- Kelly, S.E.; Pitard, F.F. Review of a non-probabilistic sampler versus a Vezin sampler on low weight percent solids slurries. In Proceedings of the 7th World Conference on Sampling and Blending, Bordeaux, France, 10–12 June 2015; pp. 129–136. [Google Scholar]
- Magalhães, M.F. Utilização de simulação de elementos discretos (DEM) para avaliação de parâmetros teoria da amostragem. Master’s Thesis, Universidade de São Paulo, São Paulo, Brazil, 2022; p. 141. [Google Scholar]
- Magalhães, M.F.; Chieregati, A.C.; Ilic, D.; Carvalho, R.M.; Lemos, M.G.; Delboni, H., Jr. Use of Discrete Element Modelling to evaluate the parameters of the sampling theory in the feed grade sampler of a sulphide gold plant. Minerals 2021, 11, 978. [Google Scholar] [CrossRef]
- Allan, T.; Khan, A.A. Critical Evaluation of Powder Sample Procedures. Chem. Eng. 1979, 238, 108–112. [Google Scholar]
- Rossow, J.; Coetzee, C.J. Discrete element modelling of a chevron patterned conveyor belt and a transfer chute. Powder Technol. 2021, 391, 77–96. [Google Scholar] [CrossRef]
- Schadler, M.; Schedler, M.; Knödl, M.; Prims, D.; Landschützer, C.; Katterfeld, A. Characteristics of “polybags” used for low-value consignments in the mail, courier, express and parcel industry. Logist. J. 2022. [Google Scholar] [CrossRef]
- Xie, Q.; Zhong, C.; Liu, D.; Fu, Q.; Wang, X.; Shen, Z. Operation Analysis of a SAG Mill under Different Conditions Based on DEM and Breakage Energy Method. Energies 2020, 13, 5247. [Google Scholar] [CrossRef]
- de Carvalho, R.M.; Thomazini, A.D.; da Cunha, E.R.; Tavares, L.M. Simulation of Classification and Stratification in Double-Deck Roller Screening of Green Iron Ore Pellets using DEM. Trans. Indian Inst. Met. 2023. [Google Scholar] [CrossRef]
- André, F.P. Validation and Application of Breakage Model in the Discrete element Method through the Simulation of Comminution Systems. Master’s Thesis, Universidade Federal do Rio de Janeiro, Rio de Janeiro, Brazil, 2019. [Google Scholar]
- Barrios, G.K.P.; de Carvalho, R.M.; Kwade, A.; Tavares, L.M. Contact parameter estimation for DEM simulation of iron ore pellet handling. Powder Technol. 2013, 248, 84–93. [Google Scholar] [CrossRef]
- Coetzee, C.J. Review: Calibration of the discrete element method. Powder Technol. 2017, 310, 104–142. [Google Scholar] [CrossRef]
- Ajmal, M.; Roessler, T.; Richter, C.; Katterfeld, A. Calibration of cohesive DEM parameters under rapid flow conditions and low consolidation stresses. Powder Technol. 2020, 374, 22–32. [Google Scholar] [CrossRef]
- Ilic, D.; McBride, W.; Katterfeld, A. Validation of continuum methods utilising discrete element simulations as applied to a slewing stacker transfer chute. In Proceedings of the 9th International Conference on Bulk Materials Storage, Handling and Transportation, ICBMH 2007, Newcastle, NSW, Australia, 9–11 October 2007. [Google Scholar]
- Ilic, D.; Roberts, A.; Wheeler, C. Modelling bulk solid interactions in transfer chutes: Accelerated flow. Chem. Eng. Sci. 2019, 209, 115197. [Google Scholar] [CrossRef]
- Ilic, D.; Lavrinec, A.; Orozovic, O. Simulation and analysis of blending in a conveyor transfer system. Miner. Eng. 2020, 157, 106575. [Google Scholar] [CrossRef]
- Antony, J. Design of Experiments for Engineers and Scientists, 2nd ed.; Elsevier: Amsterdam, The Netherlands, 2014; p. 220. [Google Scholar]
- El Kassem, B.; Salloum, B.; Brinz, T.; Heider, Y.; Markert, B. A semi-automated DEM parameter calibration technique of powders based on different bulk responses extracted from auger dosing experiments. KONA Powder Part. J. 2021, 38, 235–250. [Google Scholar] [CrossRef]
- Horn, E. The Calibration of Material Properties for Use in Discrete Element Models. Master’s Thesis, University of Stellenbosch, Stellenbosch, South Africa, 2012. [Google Scholar]
- Johnstone, M.W. Calibration of DEM Models for Granular Materials Using Bulk Physical Tests. Ph.D. Thesis, The University of Edinburgh, Edinburgh, UK, 2010. [Google Scholar]
- Pitard, F.F. Theory of Sampling and Sampling Practices, 3rd ed.; CRC Press: Boca Raton, FL, USA, 2019; p. 694. [Google Scholar]


| Values | Cutter Aperture | Cutter Velocity | Cutter Edge Angle | Solid Feed Rate |
|---|---|---|---|---|
| (mm) | (cm/s) | (°) | (t/h) | |
| 1 | 15 (1D) | 45 | 1 | 60 |
| 2 | 22.5 (1.5D) | 60 | 20 | 73 |
| 3 | 30 (2D) | 75 | 35 | 90 |
| 4 | 45 (3D) | 90 | 50 | 105 |
| 5 | 60 (4D) | 105 | 70 | 120 |
| Property | Unit | Value | ||||
|---|---|---|---|---|---|---|
| Moisture (w.b.) | % | 2.30 | ||||
| Particle density | g/cm3 | 2.83 | ||||
| Bulk density | g/cm3 | 1.70 | ||||
| Internal angle of friction | ° | 59 | ||||
| Angle of repose | ° | 29 | ||||
| Draw-down angle | ° | 67 | ||||
| Particle groups | n° | 5 | ||||
| Particle size | mm | 2.5 | 6.3 | 10.0 | 13.3 | 15.0 |
| Cumulative passing | % | 25 | 50 | 80 | 95 | 100 |
| Mass distribution | % | 25 | 25 | 30 | 15 | 5 |
| Parameter | Value |
|---|---|
| Young’s modulus (particles) | 1 × 10⁷ N/m2 |
| Young’s modulus (boundaries) | 1 × 10¹¹ N/m2 |
| Coefficient of restitution | 0.30 |
| Coefficient of rolling friction | 0.69 |
| Coefficient of sliding friction (particle–belt) | 0.70 |
| Coefficient of sliding friction (particle–sampler) | 0.50 |
| Coefficient of sliding friction (particle–particle) | 0.90 |
| Adhesive force distance | 0.00125 |
| Adhesive force fraction | 0.58 |
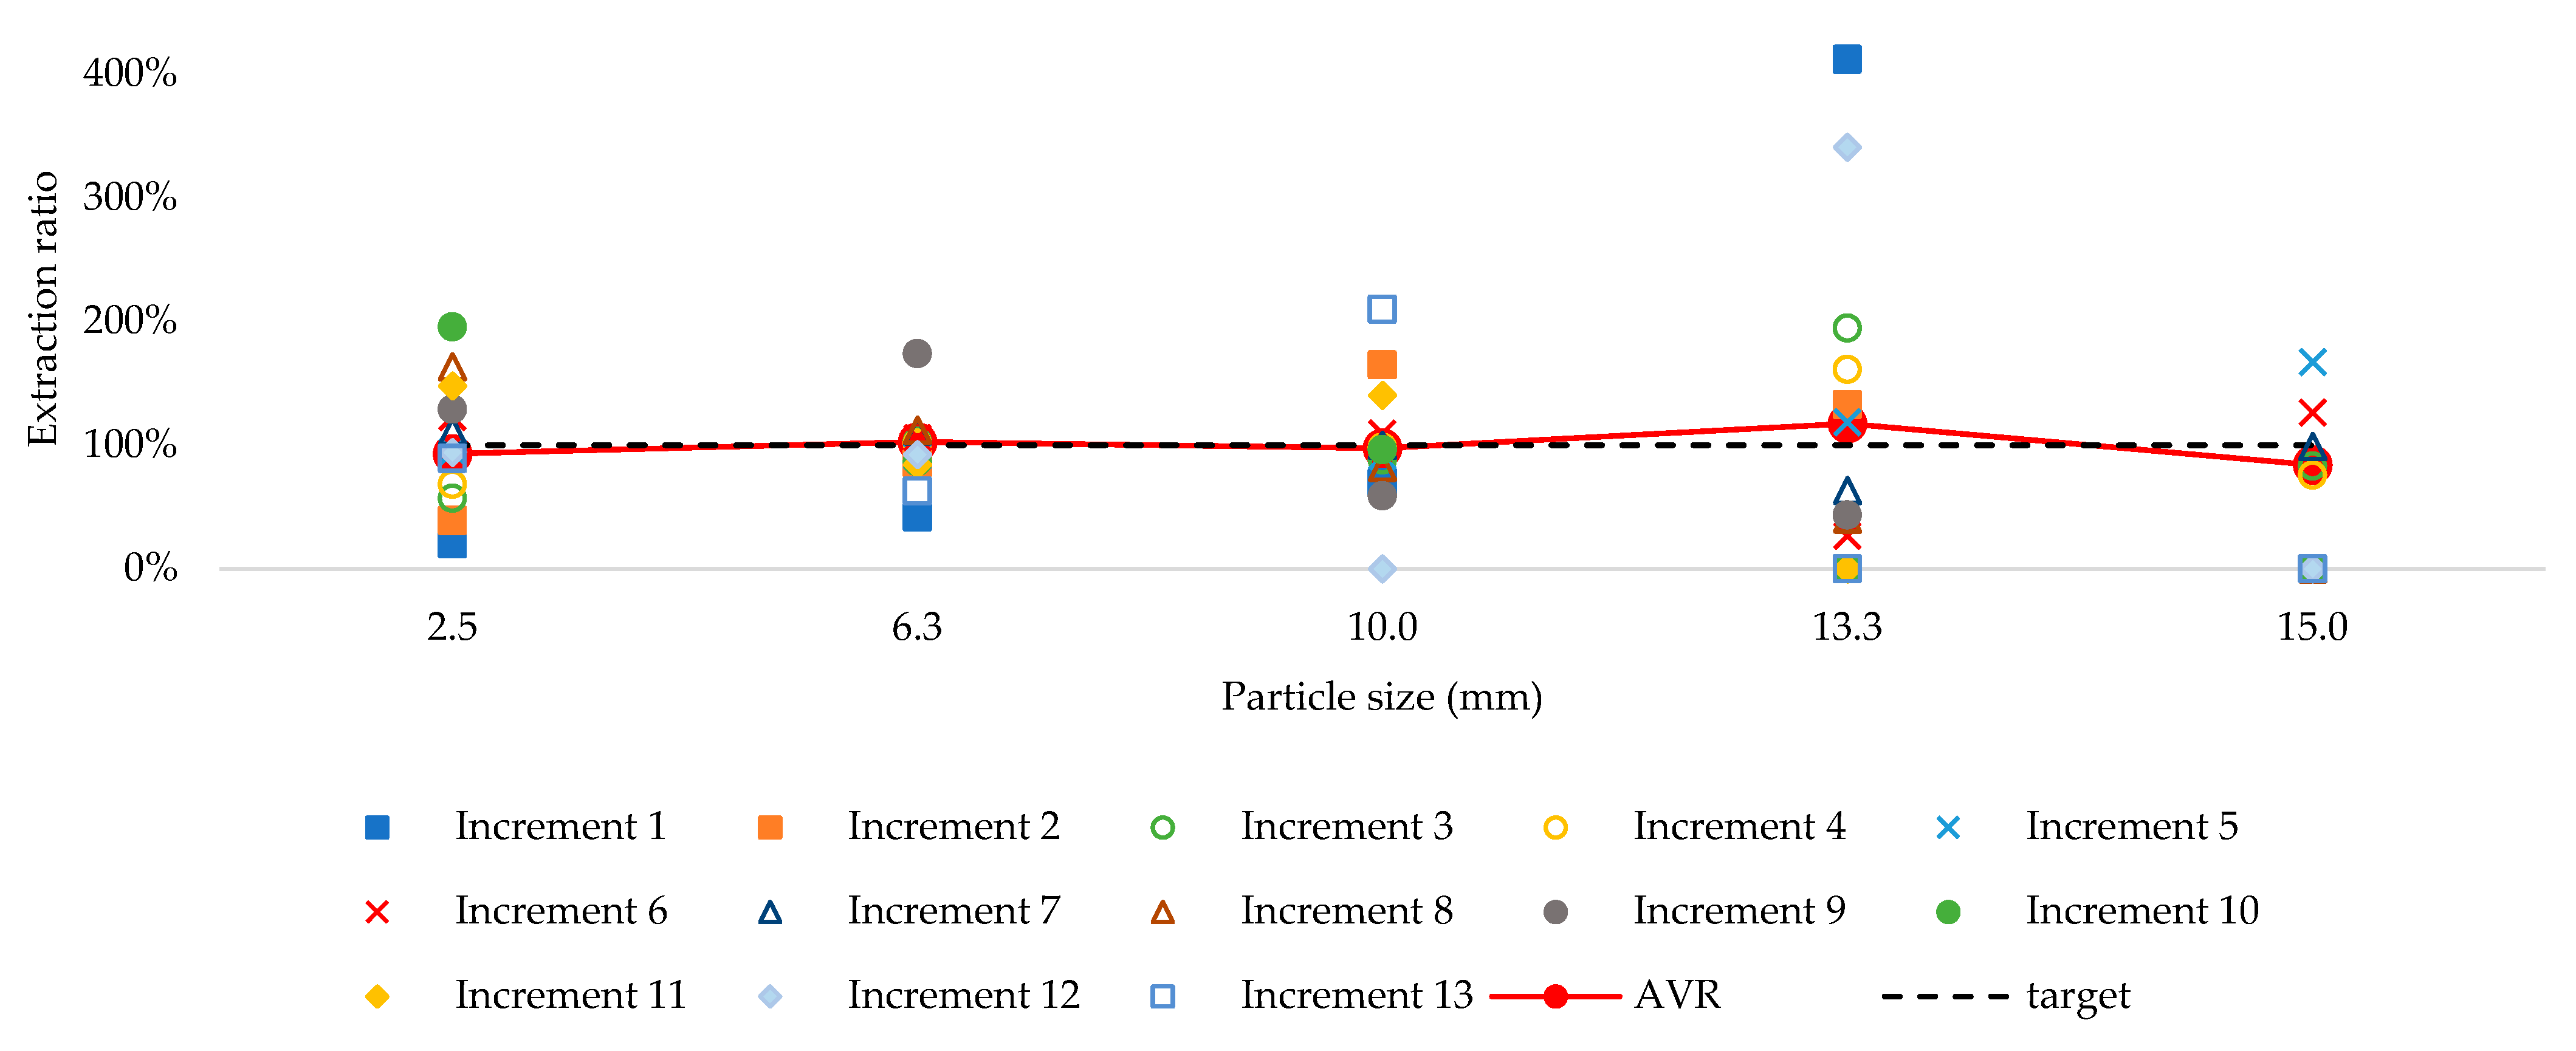
| Data | Particle Size (mm) | ||||
|---|---|---|---|---|---|
| 2.5 | 6.3 | 10.0 | 13.3 | 15.0 | |
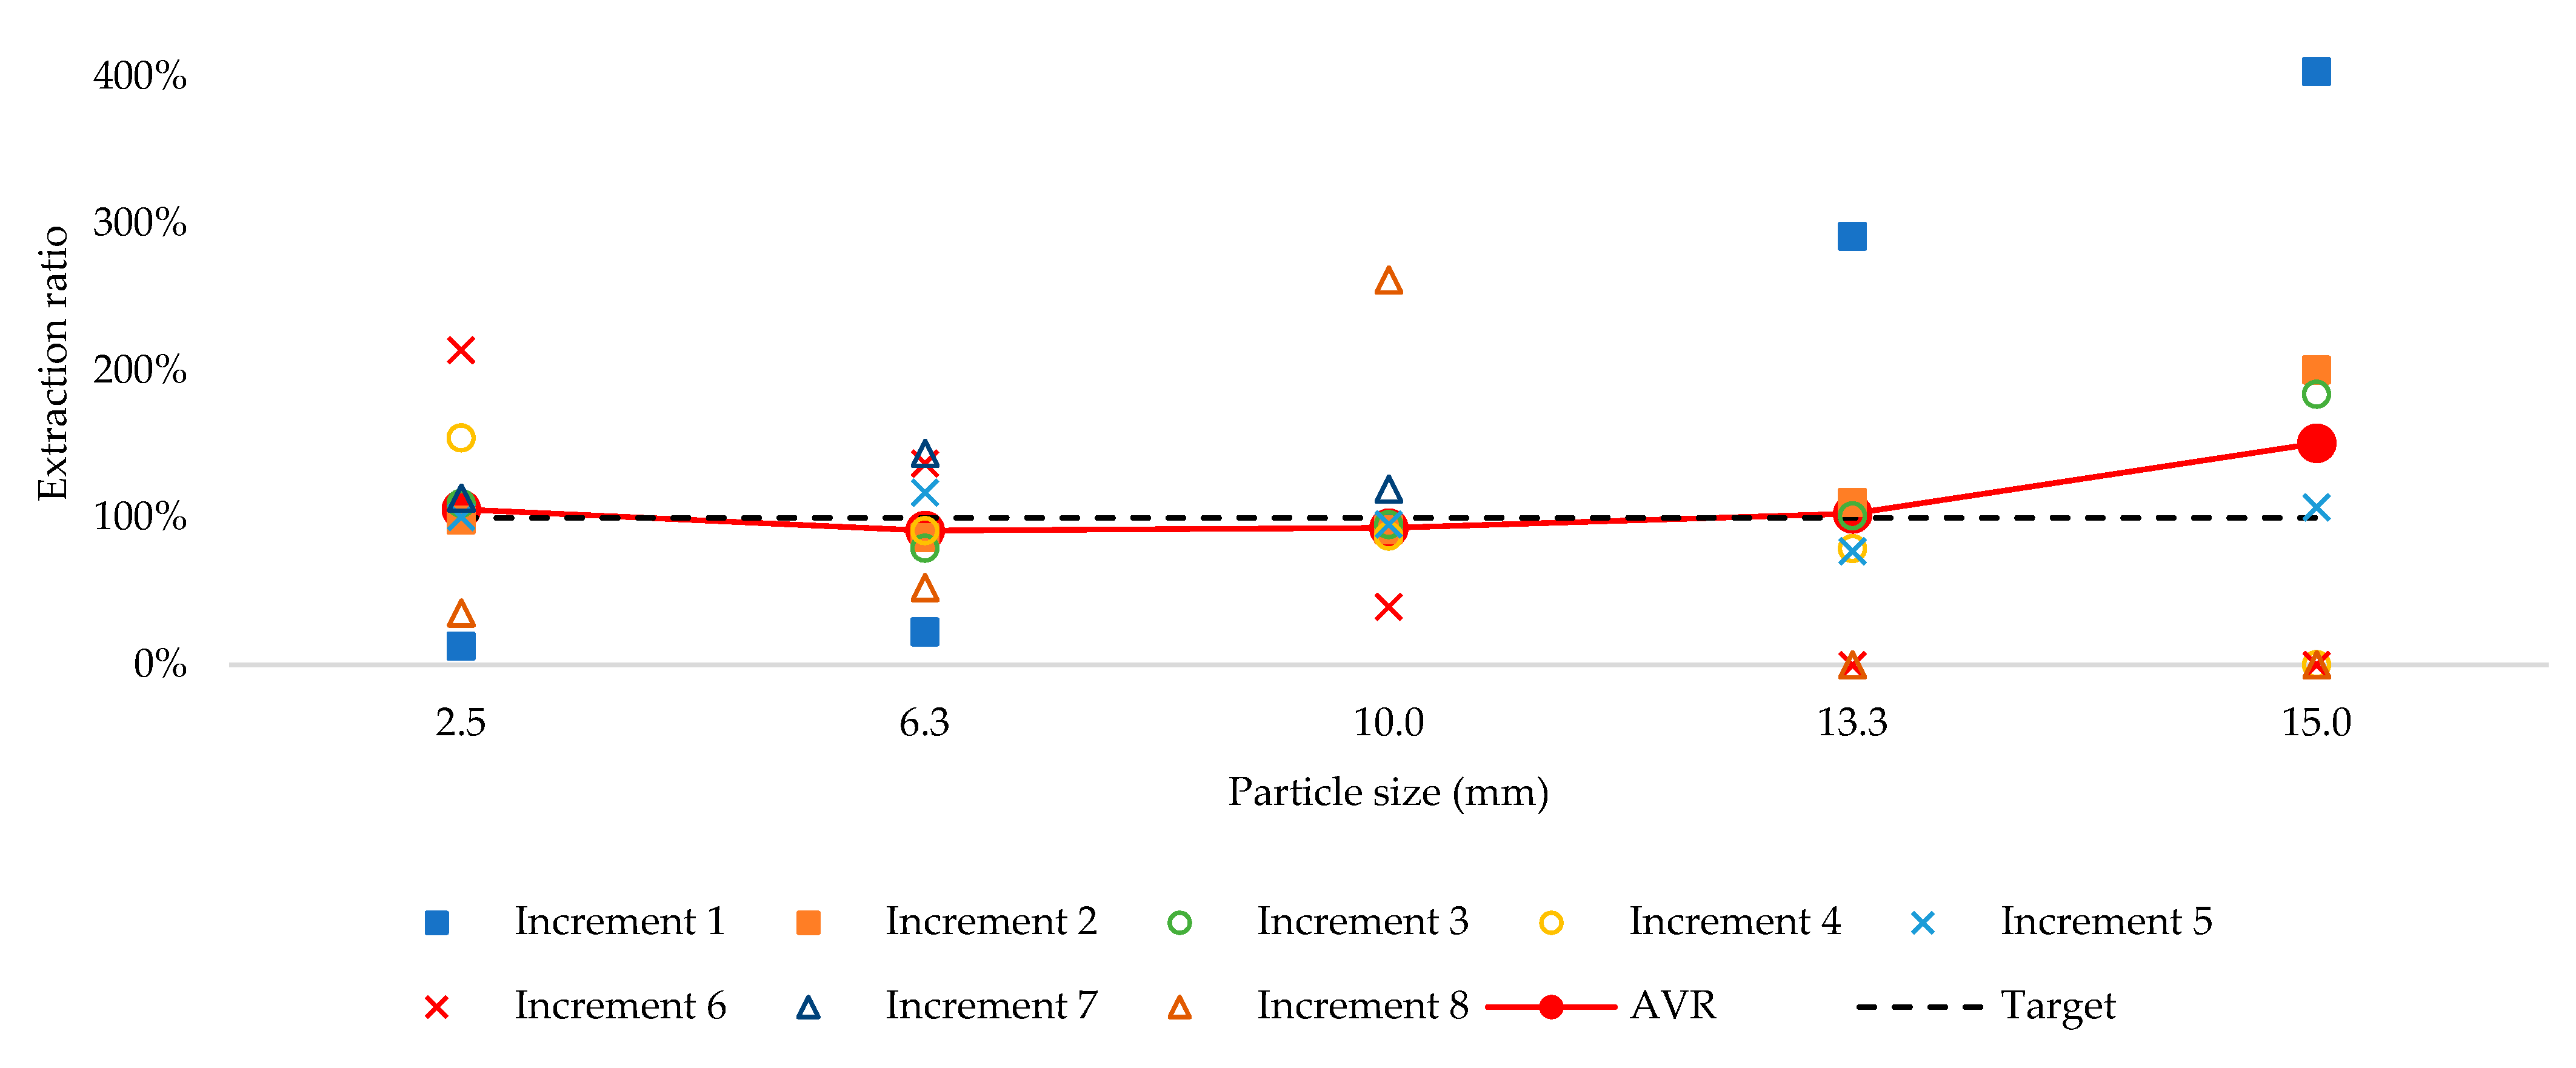
| Test 1 | 100.0% | 97.1% | 86.7% | 99.7% | 195.0% |
| Test 2 | 112.4% | 76.8% | 89.6% | 100.3% | 215.8% |
| Test 3 | 110.1% | 96.5% | 101.5% | 119.4% | 0.0% |
| Target | 100.0% | 100.0% | 100.0% | 100.0% | 100.0% |
| Deviation (95% confidence level) | 16.0% | 29.0% | 20.0% | 28.0% | 296.0% |
| Inferior limit | 123.9% | 118.8% | 112.1% | 134.2% | 432.7% |
| Average | 107.5% | 90.1% | 92.6% | 106.5% | 136.9% |
| Upper limit | 91.1% | 61.4% | 73.1% | 78.7% | −158.8% |
| Standard deviation | 6.6% | 11.6% | 7.9% | 11.2% | 119.0% |
| Variance | 0.4% | 1.3% | 0.6% | 1.3% | 141.7% |
| Data | Particle Size (mm) | ||||
|---|---|---|---|---|---|
| 2.5 | 6.3 | 10.0 | 13.3 | 15.0 | |
| Test 1 | 94.7% | 94.0% | 101.7% | 115.4% | 110.0% |
| Test 2 | 108.9% | 93.9% | 90.6% | 120.1% | 84.3% |
| Test 3 | 98.8% | 104.3% | 101.7% | 87.2% | 113.9% |
| Target | 100.0% | 100.0% | 100.0% | 100.0% | 100.0% |
| Deviation (95% confidence level) | 18.2% | 14.8% | 15.9% | 44.2% | 39.9% |
| Inferior limit | 119.0% | 112.2% | 113.9% | 151.7% | 142.6% |
| Average | 100.8% | 97.4% | 98.0% | 107.5% | 102.7% |
| Upper limit | 82.7% | 82.6% | 82.1% | 63.4% | 62.8% |
| Standard deviation | 7.3% | 6.0% | 6.4% | 17.8% | 16.1% |
| Variance | 0.5% | 0.4% | 0.4% | 3.2% | 2.6% |
Disclaimer/Publisher’s Note: The statements, opinions and data contained in all publications are solely those of the individual author(s) and contributor(s) and not of MDPI and/or the editor(s). MDPI and/or the editor(s) disclaim responsibility for any injury to people or property resulting from any ideas, methods, instructions or products referred to in the content. |
© 2023 by the authors. Licensee MDPI, Basel, Switzerland. This article is an open access article distributed under the terms and conditions of the Creative Commons Attribution (CC BY) license (https://creativecommons.org/licenses/by/4.0/).
Share and Cite
Magalhães, M.F.; Chieregati, A.C.; Ilic, D.; de Carvalho, I.T.B.; Lemos, M.G.; da Mata Filho, J.G.; Delboni, H., Jr. The Use of DEM for Optimising an Industrial Vezin Sampler Operation. Minerals 2023, 13, 1460. https://doi.org/10.3390/min13111460
Magalhães MF, Chieregati AC, Ilic D, de Carvalho ITB, Lemos MG, da Mata Filho JG, Delboni H Jr. The Use of DEM for Optimising an Industrial Vezin Sampler Operation. Minerals. 2023; 13(11):1460. https://doi.org/10.3390/min13111460
Chicago/Turabian StyleMagalhães, Marcus Félix, Ana Carolina Chieregati, Dusan Ilic, Isabella Targino Borges de Carvalho, Mariana Gazire Lemos, José Gregório da Mata Filho, and Homero Delboni, Jr. 2023. "The Use of DEM for Optimising an Industrial Vezin Sampler Operation" Minerals 13, no. 11: 1460. https://doi.org/10.3390/min13111460