Article

The Uptake of Actinides by Hardened Cement Paste in High-Salinity Pore Water

Department of Chemistry, Johannes Gutenberg-Universität Mainz, 55099 Mainz, Germany
*
Authors to whom correspondence should be addressed.
Minerals 2023, 13(11), 1380; https://doi.org/10.3390/min13111380
Submission received: 7 July 2023 / Revised: 23 October 2023 / Accepted: 24 October 2023 / Published: 28 October 2023

Abstract

:
The interaction of the actinides Pu(III), Am(III), Np(V), Np(VI), and U(VI) with hardened cement paste (HCP) prepared from ordinary Portland cement was investigated by batch experiments in a diluted caprock solution (I = 2.5 M) as a function of the solid-to-liquid (S/L) ratio (0.5–20.0 g L−1) and pH (10–13). Independent of the oxidation state of the actinides, strong sorption was observed with Rd values between 104 and 5 × 10⁵ L kg−1. For the hexavalent actinides U(VI) and Np(VI), a decrease in sorption was observed with increasing pH, which could be due to the formation of the AnO2(OH)42− species. CE-ICP-MS measurements of the supernatant solution from the U(VI) batch sorption experiment at pH ≥ 10 indicate that UO2(OH)3 and UO2(OH)42− dominate the speciation. Pu LIII-edge XANES and EXAFS measurements showed oxidation of Pu(III) to Pu(IV) when interacting with HCP. Calcium silicate hydrate (C-S-H) phases effectively immobilize Pu(IV) by incorporating it into the CaO layer. This was observed in a C-S-H sample with C/S = 1.65 and HCP at pH 12.7. Compared to data published in the literature on the retention of actinides on HCP at low ionic strength, the influence of high ionic strength (I = 2.5 M) on the sorption behavior was insignificant.

1. Introduction

In many countries, a repository for high-level radioactive waste is to be constructed in a deep geological formation with several protective barriers. In Germany, possible host rocks for such a repository are clay rock, salt rock, or granite as natural barriers. Suitable clay formations can be found, for example, in Northern Germany, a region with pore and formation waters of medium and high ionic strength [1,2], which is well above 1 M and even up to 4 M at appropriate depths [3]. These values are significantly higher than in other clay formations (e.g., Switzerland, France, Belgium) considered as host rocks for nuclear waste repositories. In addition to the natural barrier of the host rock, the technical components of the repository also have an influence on the confinement of the emplaced radiotoxic waste. Cementitious materials are used widely as construction materials and engineered barriers in high-level waste (HLW) repositories and possess a high capacity for actinide retention [4,5,6]. Hydrated cement consists of different phases, such as portlandite, calcium aluminate/ferrite phases, and calcium silicate hydrate (C-S-H) phases, the latter having a mass fraction of 50–70% [4,7]. Actinides can be retarded by these phases due to their large surface area, microcrystalline structure with defect sites, and the presence of binding sites. The actinides can be adsorbed on the surface or incorporated into their structure, where the C-S-H phases play an important part in the sorption process of actinides (or radionuclides) on hardened cement paste (HCP) [8,9,10,11,12,13]. Potential contact with aqueous solutions, such as the inflowing saline groundwater, can lead to degradation of the cement, where the pH of the inflowing water increases. Furthermore, corrosion of the solid containers with the radioactive waste leads to the release of actinides into the near field of the emplacement spaces [14,15,16]. For the corresponding safety assessment, studies on the retention of actinides by cementitious materials with regard to the high ionic strength of the pore water and its alkalinity (pH 10–13) in a cementitious environment are essential. It is important to know to what extent the findings obtained for low ionic strengths also apply to the description of actinide retention at high ionic strengths. Of particular interest are actinides with long half-lives that have a high contribution to the radiotoxicity of the waste, such as 239Pu (t1/2 = 2.411 × 10⁴ yr), as well as 238U (t1/2 = 4.468 × 10⁹ yr), 237Np (t1/2 = 2.144 × 10⁶ yr), and 241Am (t1/2 = 432.2 yr). Plutonium is very redox-sensitive and can occur in all oxidation states from +III to +VI in aqueous media. The low oxidation states +III and +IV are of particular interest due to reducing conditions in the repository, but the study of the higher oxidation states must also be included to gain a comprehensive insight into the chemical processes in a nuclear waste repository. The current literature contains mainly results of studies of actinide retention on cement at low ionic strength [14,17]. For tri-(Am(III)), tetra-(Th(IV), Np(IV)), and pentavalent (Np(V), Pu(V)) actinides, a strong sorption was reported with distribution ratios, Rd, between 105 L kg−1 and 107 L kg−1, as well as a fast (1–3 d) uptake kinetics. Also, for the hexavalent actinides (U(VI), Np(VI)), a strong sorption was observed with Rd values in the range of ~5 × 10² L kg−1–~3 × 10⁶ L kg−1, but decreasing Rd values were observed with an increasing calcium-to-silicon (C/S) ratio of C–S–H phases in alkali-free conditions, as well as slower sorption kinetics onto cement pastes within ~30 d [17]. It was further observed that the hydrolysis of the actinides has a major influence on their retention in cementitious materials. The associated affinity of the different actinides for cement paste and C-S-H phases was explained by the concept of electrostatic inter-ligand repulsion [18]. In this concept, it is predicted that for each actinide in each oxidation state, the number of OH groups in the first coordination sphere is limited [19]. The literature presents the following maximal number of hydroxyl groups for the investigated actinides: four (An(III)), four (An(IV)), two (An(V)), and four (An(VI)) [19]. Consequently, the actinide species An(III)(OH)4, An(V)O2(OH)2, and An(VI)(OH)42− are unable to form surface complexes with the silanol or silandiol groups of C-S-H phases. Therefore, these species are also described as non-sorbing species [18]. To our knowledge, there are only a few sorption investigations that have been performed at high ionic strength, e.g., on clay minerals, in the current literature. Stockmann et al. found no significant effect of ionic strength on the sorption of U(VI) onto montmorillonite [20].
In this work, the retention of Pu(III), Am(III), Np(V), Np(VI), and U(VI) on HCP prepared from ordinary Portland cement (OPC) was investigated by batch sorption experiments. The electrolyte was chosen to simulate the conditions expected for a nuclear waste repository in claystone formations of Northern Germany according to the “Standortmodell NORD” [1]. These pore waters are characterized by high salinity and an ionic strength of up to 2.5 M [1]. To identify the main processes involved in actinide retention and to obtain a molecular-level understanding, selected speciation measurements of the aqueous and solid phases were performed using CE-ICP-MS (capillary electrophoresis coupled to inductively coupled plasma mass spectrometry) and XANES/EXAFS spectroscopy (X-ray absorption near-edge structure/extended X-ray absorption fine-structure), respectively. The results obtained at 2.5 M ionic strength are compared with results at low ionic strength.

2. Materials and Methods

2.1. Materials

Experiments were performed in a glovebox under Ar atmosphere (Ar ≥ 99.99%, O2 < 0.1 ppm). Solutions were prepared in Milli-Q water (18.2 MΩ cm, SynergyTM Millipore water system, Millipore GmbH, Germany) previously degassed with Ar. All chemicals used were from p.a. (pro analysis) quality grade. As a background electrolyte, a diluted caprock solution (VGL, German acronym for Verdünnte Gipshutlösung) was chosen as a model solution for high saline pore water at the interface between clay and salt formations in Northern Germany [21]. It contains mainly 2.523 M NaCl (VWR Chemicals BDH Prolabo®, VWR Int., USA), 0.010 M CaCl2 (CaCl2 × 6H2O, Merck, Germany), 0.008 M Na2SO4 (Merck, Germany) and 0.005 M KCl (Merck, Germany) with a pH of 8.0. Furthermore, the preparation of HCP powder (particle size of Ø < 63 μm) as the solid phase was based on DIN EN 196–3 [22], which has been slightly modified. Briefly, Portland cement (PZ Doppel N CEM 1 42.5 N, Dyckerhoff, Germany) was mixed with Milli-Q water to achieve a water-to-cement ratio (w/c) of 0.5. The paste was used to fill cylindrical molds and hardened for 48 h before the blocks were demolded and further stored in Milli-Q water for at least 28 d. The obtained HCP was crushed with a vibrating disk mill and sieved to a particle size with a diameter of Ø < 63 μm. The HCP powder was characterized by XRF, XRD, XPS, N2-BET, and CEC measurements. A detailed description of these measurements and of the results can be found in the Supplementary Materials, Sections S1–S5.

2.2. Stock Solutions

A 1 × 10⁻⁵ M 239Pu(III) solution and a 6 × 10⁻⁶ M 241Am(III) solution, each in 1 M HClO4 (VWR Chemicals BDH, VWR Int., USA), were used for the Pu and Am sorption experiments, respectively. The preparation of these stock solutions is described in [23].
For sorption experiments with Np, 239Np was used as tracer in combination with a 6 × 10⁻⁴ M 237Np stock solution. The isotope 239Np was obtained by neutron irradiation of 238U (UO2(NO3)2 × 6 H2O diluted in Milli-Q water) at the research reactor TRIGA Mainz and separation of the 239Np from uranium and its fission products via anion exchange chromatography, as described in [24]. Hexavalent Np was prepared from the respective 237Np and 239Np stock solutions by fuming several times with 1 M HClO4 (not to complete dryness). This oxidation state was stabilized by the addition of aliquots of 2 M NaClO (VWR Chemicals BDH Prolabo®, VWR Int., USA) [25]. By adding NaNO2 to the Np(VI) solution after fuming with HClO4, Np(V) was obtained [24]. The stock solution of 4 × 10⁻⁵ M uranium was prepared by diluting an ICP-MS standard solution of 238U (Peak Performance, CPI International, USA) in 2% HNO3.

2.3. Batch Sorption Experiments

Batch sorption experiments were conducted to investigate the influence of various contact times and solid-to-liquid (S/L) ratios, as well as to comprehensively evaluate degradation stages I–III [14] of hardened cement paste (pH 10–13) and their impact on actinide immobilization. For all sorption samples, HCP powder was weighed into 40-mL polycarbonate centrifuge tubes (Beckman Coulter, USA) and filled with VGL (prepared from its chemicals dissolved in Milli-Q water as described in 2.1) to achieve the required S/L ratio. Samples were preconditioned by shaking in an end-over-end rotator (Stuart Rotator SB3, UK) for 72 h. During this time, the pH increased from 8.0 to ~12.2–12.8. Before the addition of the actinides to the HCP suspensions, the pH was adjusted for eight days until the desired pH (10–13) was stable. Adjustments of pH were made with freshly prepared solutions of NaOH (CO2-free; VWR Chemicals BDH Prolabo®, VWR Int., USA) and HCl (Fisher Scientific, UK) ranging from 0.01 M to 5 M. Subsequently, aliquots of the respective actinide stock solution were added to obtain the following initial concentrations: 1 × 10⁻⁸ M Am(III), 1 × 10⁻⁸ M Pu(III), 8 × 10⁻⁶ M and 1 × 10⁻⁸ M Np(V), 1 × 10⁻⁸ M Np(VI), and 1 × 10⁻⁶ M U(VI). The samples were again rotated in the end-over-end rotator for 72 h and afterward centrifuged for 15 min at 3770× g (SIGMA 3K30, SIGMA Laborzentrifugen GmbH, Germany) and ultracentrifuged for 1 h at 108,800× g (Avanti J30I, Beckman-Coulter, USA). Finally, the pH value was again measured in all samples immediately after centrifugation. The equilibrium concentrations of the analyte in the supernatant [An]eq [M] and the initial analyte concentration in the sample [An]0 [M] were determined as described in Section 2.4 and used to calculate the distribution ratio Rd [L kg−1] between the solid and liquid phases according to Equation (1), where V [L] is the sample volume and m [kg] is the total mass of the sorbent.
R d = V m · A n 0 A n e q A n e q
It should be noted that the phase composition of HCP changed during the course of the batch experiments. Due to contact with VGL, which is not in equilibrium with HCP pore fluid in stage I, HCP degraded to stage II, which is characterized by portlandite dissolution [14]. The C/S ratio of HCP powder before and after contact with VGL (S/L = 5 g L−1 for 72 h, final pH = 12.8) was determined by X-ray photoelectron spectroscopy (XPS) (see Supplementary Materials for details). The XPS data show that the C/S ratio decreased from 3.4 to 2.6 due to the degradation of hydrated cement in VGL solution. During the subsequent pH adjustments in the preconditioned suspensions and after addition of the actinide tracer solution, the cement phase might have degraded further. In the pH range of 10–12.5, degradation stage III is reached, which is controlled by soluble C-S-H phases [14]. The pH values of electrolytes in equilibrium with synthetic C-S-H phases with C/S of 1.65 and 0.8 were reported as 12.5 and 10, respectively [26].

2.4. Analytical Methods

To quantify the concentrations of 239Np and 241Am, γ-ray spectrometry was performed with an HPGe (GMX−13180-S, EG & G ORTEC, USA) coaxial γ-ray detector, Canberra InSpector 2000 (model IN2K, Canberra Industries, Inc., USA), in combination with the Genie 2000 Gamma acquisition and analysis software (Canberra Industries, Inc., USA). Calibration of the spectrometric system was carried out with a mixed radionuclide-γ-ray standard reference solution No: 7601 (Eckert und Ziegler, Germany). The resulting limits of detection (LOD) were 3 × 10⁻¹⁶ M for 239Np and 1 × 10⁻¹¹ M for 241Am, respectively.
Inductively coupled plasma mass spectrometry (ICP-MS) was performed with a 7500ce Series ICP-MS (Agilent Technologies, USA) to quantify 238U, 237Np, and 239Pu. For ICP-MS measurements, aliquots of the samples were diluted in 2% HNO3 (VWR Chemicals BDH Prolabo®, VWR Int., USA), and 200 ppt 193Ir was added as internal standard. The LOD of ICP-MS measurements of 238U and 239Pu were 1 × 10⁻¹¹ M and 2 × 10⁻¹⁰ M, respectively.
To determine the pH values, a pH meter (WTW ino Lab. pH Level 1, WTW GmbH, Germany) with a BlueLine 16 pH electrode (Schott Instruments GmbH, Germany) was used, calibrated with the certified commercial DIN buffers at pH 4.01, 6.87, and 9.18 (Schott Instruments GmbH, Germany). High pH values above this calibration range were checked with a certified DIN buffer at pH 13.00 (Hanna Instruments, USA), where the resulting pH value was 12.89, indicating an uncertainty of ΔpH = 0.11 by using this calibration. At high ionic strengths (I > 0.1 M), as in the VGL solution, the measured pH values must be corrected since deviations are caused by the activities of the ions in the electrolyte solution of the electrode and in the sample solution [27]. A correction parameter (A = 0.41) was empirically derived by using NaCl solutions with known H+ concentrations at different ionic strengths. This parameter was subsequently added to the experimentally measured pH (pHexp), resulting in the corrected pH (pHC), i.e., p H c = p H e x p + A . In the following, pH will be used as a representative for pHC.
Redox potentials were measured by connecting a redox electrode (BlueLine 31 RX, reference system: Ag/AgCl, Schott Instruments GmbH, Germany) to the pH meter, which was checked with standard solutions of known potential (+220, +470, and +640 mV; Schott Instruments GmbH, Germany). The Eh values reported here were converted to the standard hydrogen electrode (SHE) by adding 210 mV to the measured redox potential.

2.5. CE-ICP-MS Measurements

To determine the speciation of ~1 × 10⁻⁸ M U(VI) in the aqueous phase at pH values between 10 and 13, the electrophoretic mobility of U(VI) in the supernatant of the batch sorption experiments was measured by capillary electrophoresis (CE). This technique allows conclusions to be made regarding charge distribution and, thus, the complexation of uranium in solution. The CE (Agilent 7100, Agilent Technologies, USA) was coupled with the high sensitivity of ICP-MS (Agilent 7500ce, Agilent Technologies, USA) using a MiraMist CE nebulizer (Burgener Research, Canada), which led into a Scott-type spray chamber (AHF Analysentechnik, Germany). CE-ICP-MS experiments were performed as described in [28]. The high voltage U applied to the fused silica capillary (id. = 50 μm, l = 76 cm, Polymicro Technologies, USA) for the separation was set to 25 kV. To each sample, 2-bromopropane (Merck, Germany) was added as a marker for the electro-osmotic flow (EOF). To match the background electrolyte for CE as close as possible to that of the batch experiments, the electrolyte was prepared by contacting HCP (S/L = 10 g L−1) in VGL for at least one week. Due to the high salt content in this background electrolyte, it had to be diluted 1:100 in Milli-Q water for ICP-MS measurements. This resulted in an ionic strength of I ~ 0.025 M and a pH of 10.8. The sample (~16 nL) was introduced by hydrodynamic injection (100 mbar for 8 s) without prior dilution. The retention times in the electropherograms were obtained using MassHunter Workstation software (G7200B, Agilent Technologies, USA). The electrophoretic mobility µe of 238U was calculated from the retention times t and tEOF of the uranium species and the EOF, respectively, according to Equation (2).
μ e = l 2 U 1 t 1 t E O F

2.6. XAFS Measurements

To obtain information on the speciation of Pu after uptake by HCP, Pu LIII-edge X-ray absorption fine-structure (XAFS) spectroscopy was used. Two HCP samples were prepared by batch experiments following the procedure described in Section 2.3. For the spectroscopic measurements, the Pu uptake by HCP had to be increased by using a higher initial Pu concentration (5 × 10⁻⁶ M 239Pu(III)) and a lower S/L ratio (2.5 g L−1). The pH values of the HCP samples were 10.4, corresponding to aged cement (degradation stage III) and 12.7 for cement at stage II, respectively. Since C-S-H is the main constituent of HCP, one additional sample representative for cement degradation state II was prepared by contacting 5 × 10⁻⁶ M 239Pu(III) with a C-S-H (C/S = 1.65) suspension (S/L = 2.5 g L−1) at pH 12.5 under Ar atmosphere. The C-S-H phase was synthesized by the reaction of appropriate amounts of SiO2 (Aerosil 300, Evonik Industries AG, Germany) and CaO (ThermoFisher GmbH, Germany) in Milli-Q water for two weeks. For all samples, solid and liquid phases were separated by centrifugation, as described before. Afterward, the solids were dried under an Ar atmosphere at room temperature and placed as a homogenized powder into double-confinement oblong plastic holders transparent to X-rays. The samples were transported under a liquid nitrogen atmosphere to the European Synchrotron Radiation Facility (ESRF) in Grenoble (France). The Pu LIII-edge XAFS spectra were recorded at the Rossendorf Beamline (ROBL BM20) [29]. The ESRF storage ring was operated in 7/8 bunch mode. Samples were positioned in a closed-cycle He cryostat (CRYOVAC, Germany) and kept at 15 K during the entire measurement to prevent beam damage to the samples and to increase signal intensity. The tuneable synchrotron radiation beam was delivered by a Si(111) double-crystal monochromator (DCM). Two Rh-coated mirrors located before and after the DCM suppressed higher harmonic radiation. Multiple scans of Pu LIII-edge (18,057 eV) XAFS spectra were recorded in fluorescence mode using a 13-element Ge detector (Canberra, USA). For each scan, energy calibration was achieved by simultaneously recording the transmission spectrum of a Zr metal foil at the Zr K-edge (17,998 eV). The X-ray absorption near-edge structure (XANES) part of the XAFS spectrum was recorded with energy steps of 0.5 eV. The region of the extended X-ray absorption fine-structure (EXAFS) was recorded in k-space with 0.05 Å−1 steps and gradually increasing counting time (2–20 s).
To determine the Pu oxidation state in the samples, the XANES spectra were analyzed by two methods: (i) The energy of the Pu LIII-edge, defined as the first inflection point of the absorption spectrum, was determined from the zero-crossing of the second derivative of the XANES. (ii) The module ATHENA of the software package Demeter (version 0.9.25) [30] was used to analyze the Pu LIII-edge XANES spectra by least-squares fitting. After energy calibration, the averaged Pu LIII-edge XANES spectra were modeled using published reference spectra of Pu(III) [31] and Pu(IV) [32] to determine the fractions of these oxidation states in the samples.
The software packages EXAFSPAK [33] and FEFF9 (version 9.6) [34] were used to analyze the EXAFS data. To calculate FEFF scattering amplitudes and phases, a structural model based on density functional calculations of the sorption modes of U(IV) in the C-S-H phase was used [35], where U in the CaO layer of the C-S-H was substituted by Pu.

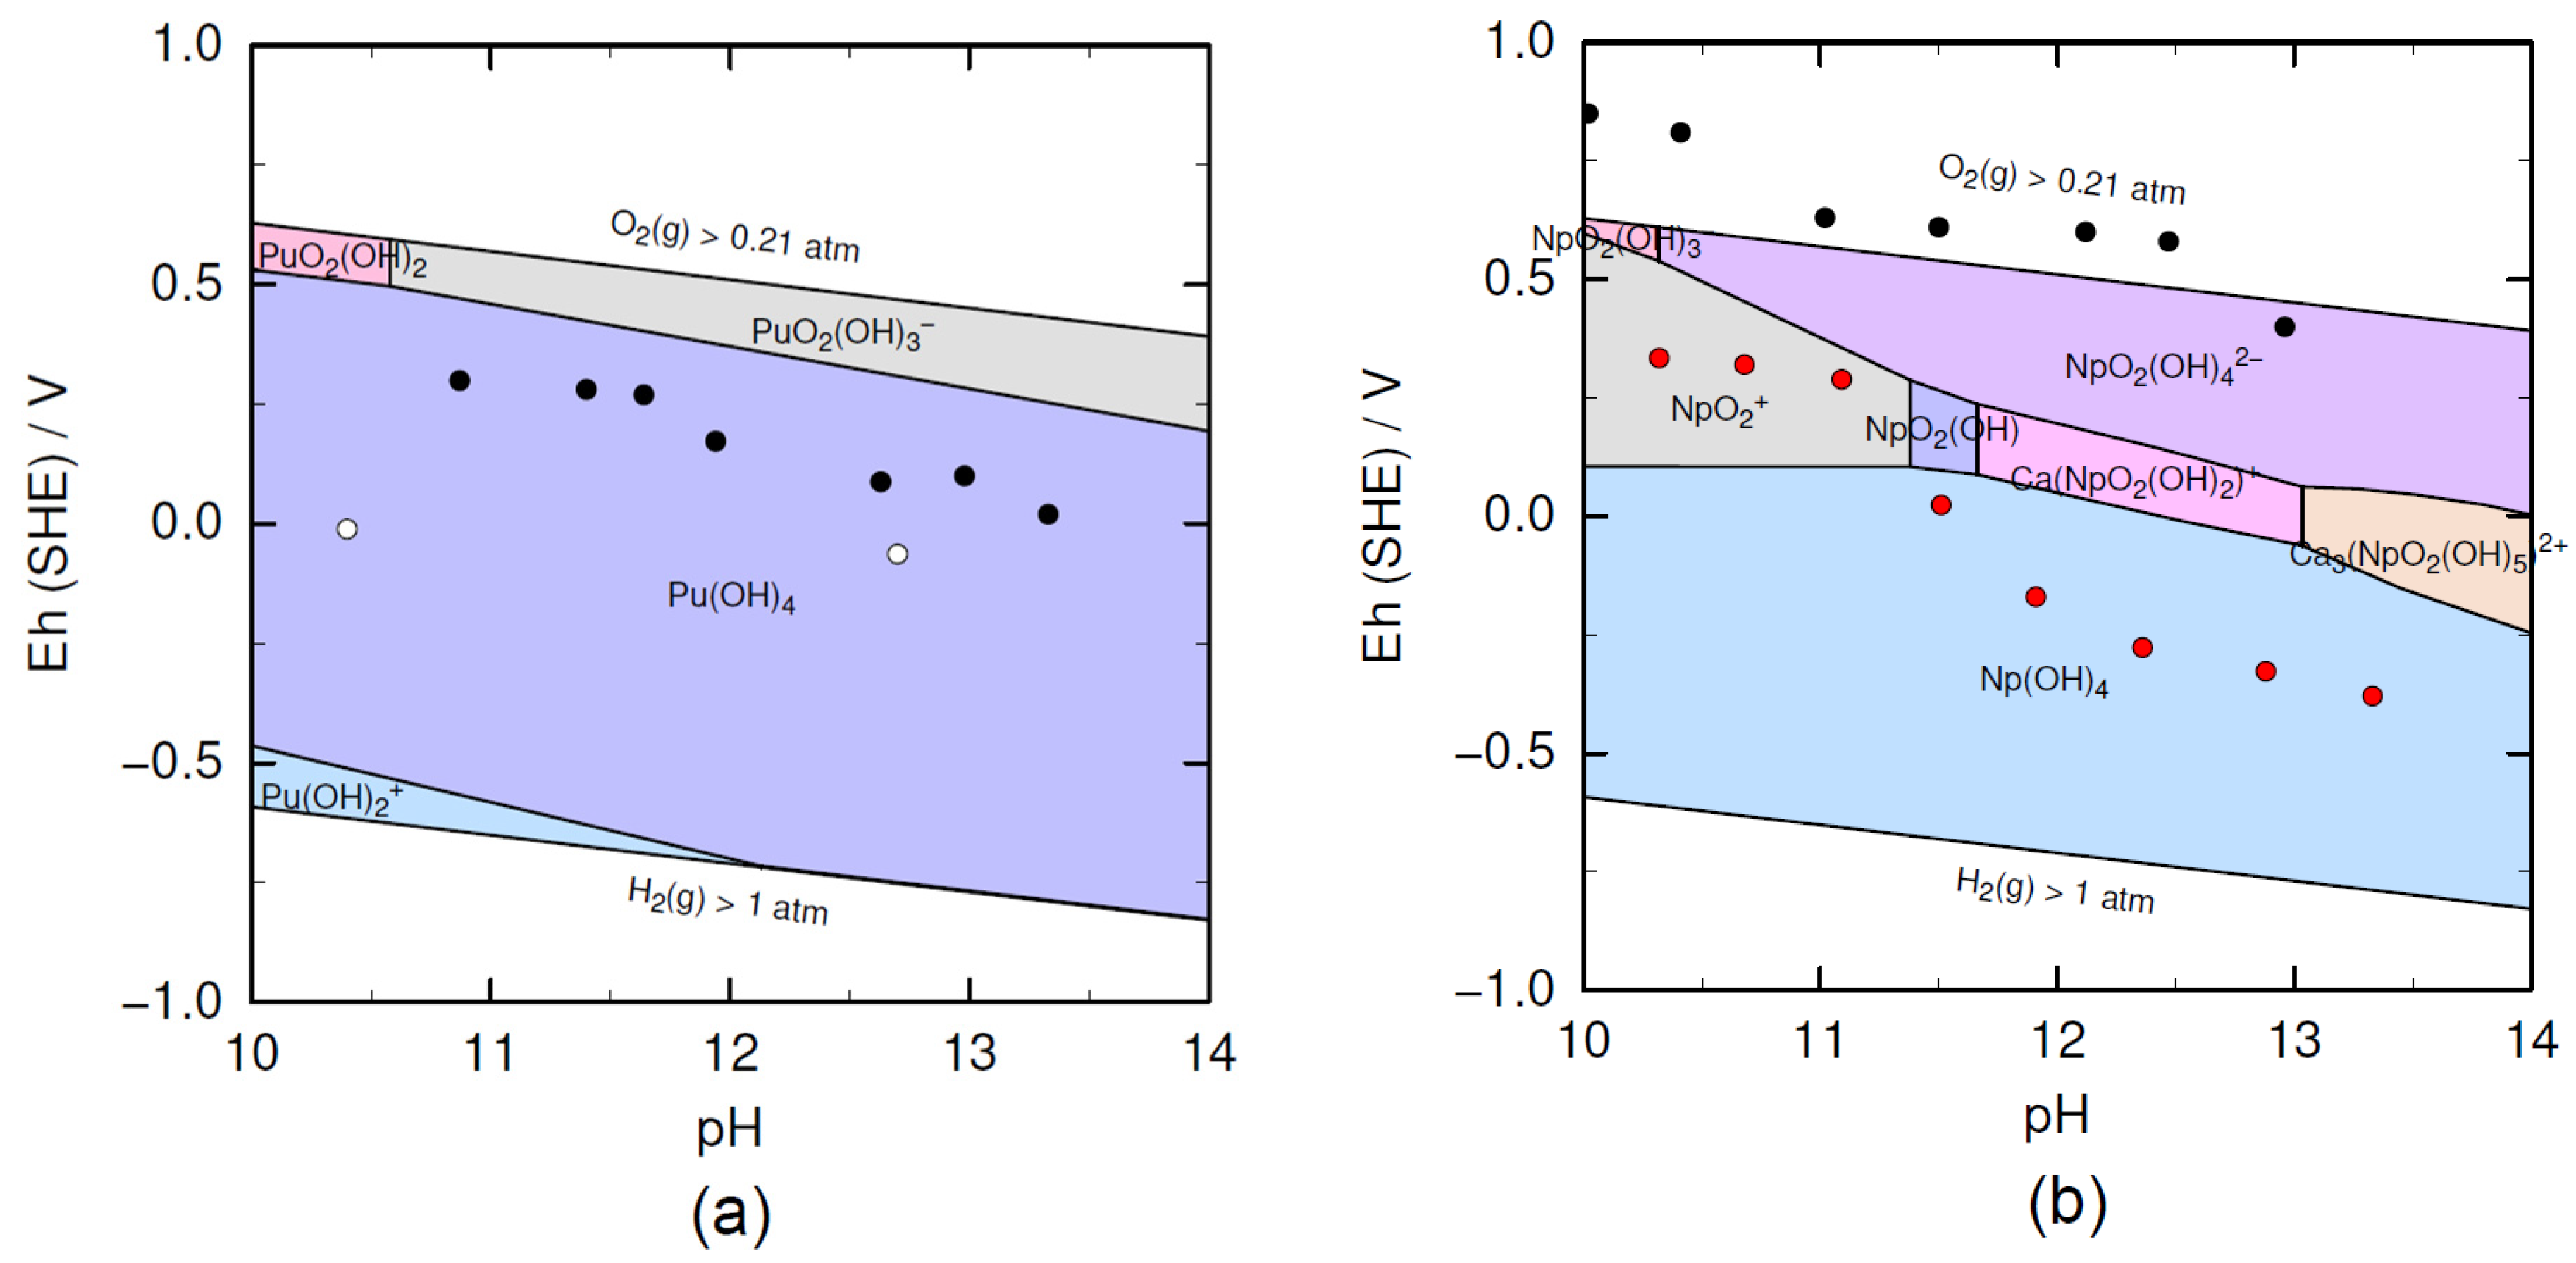
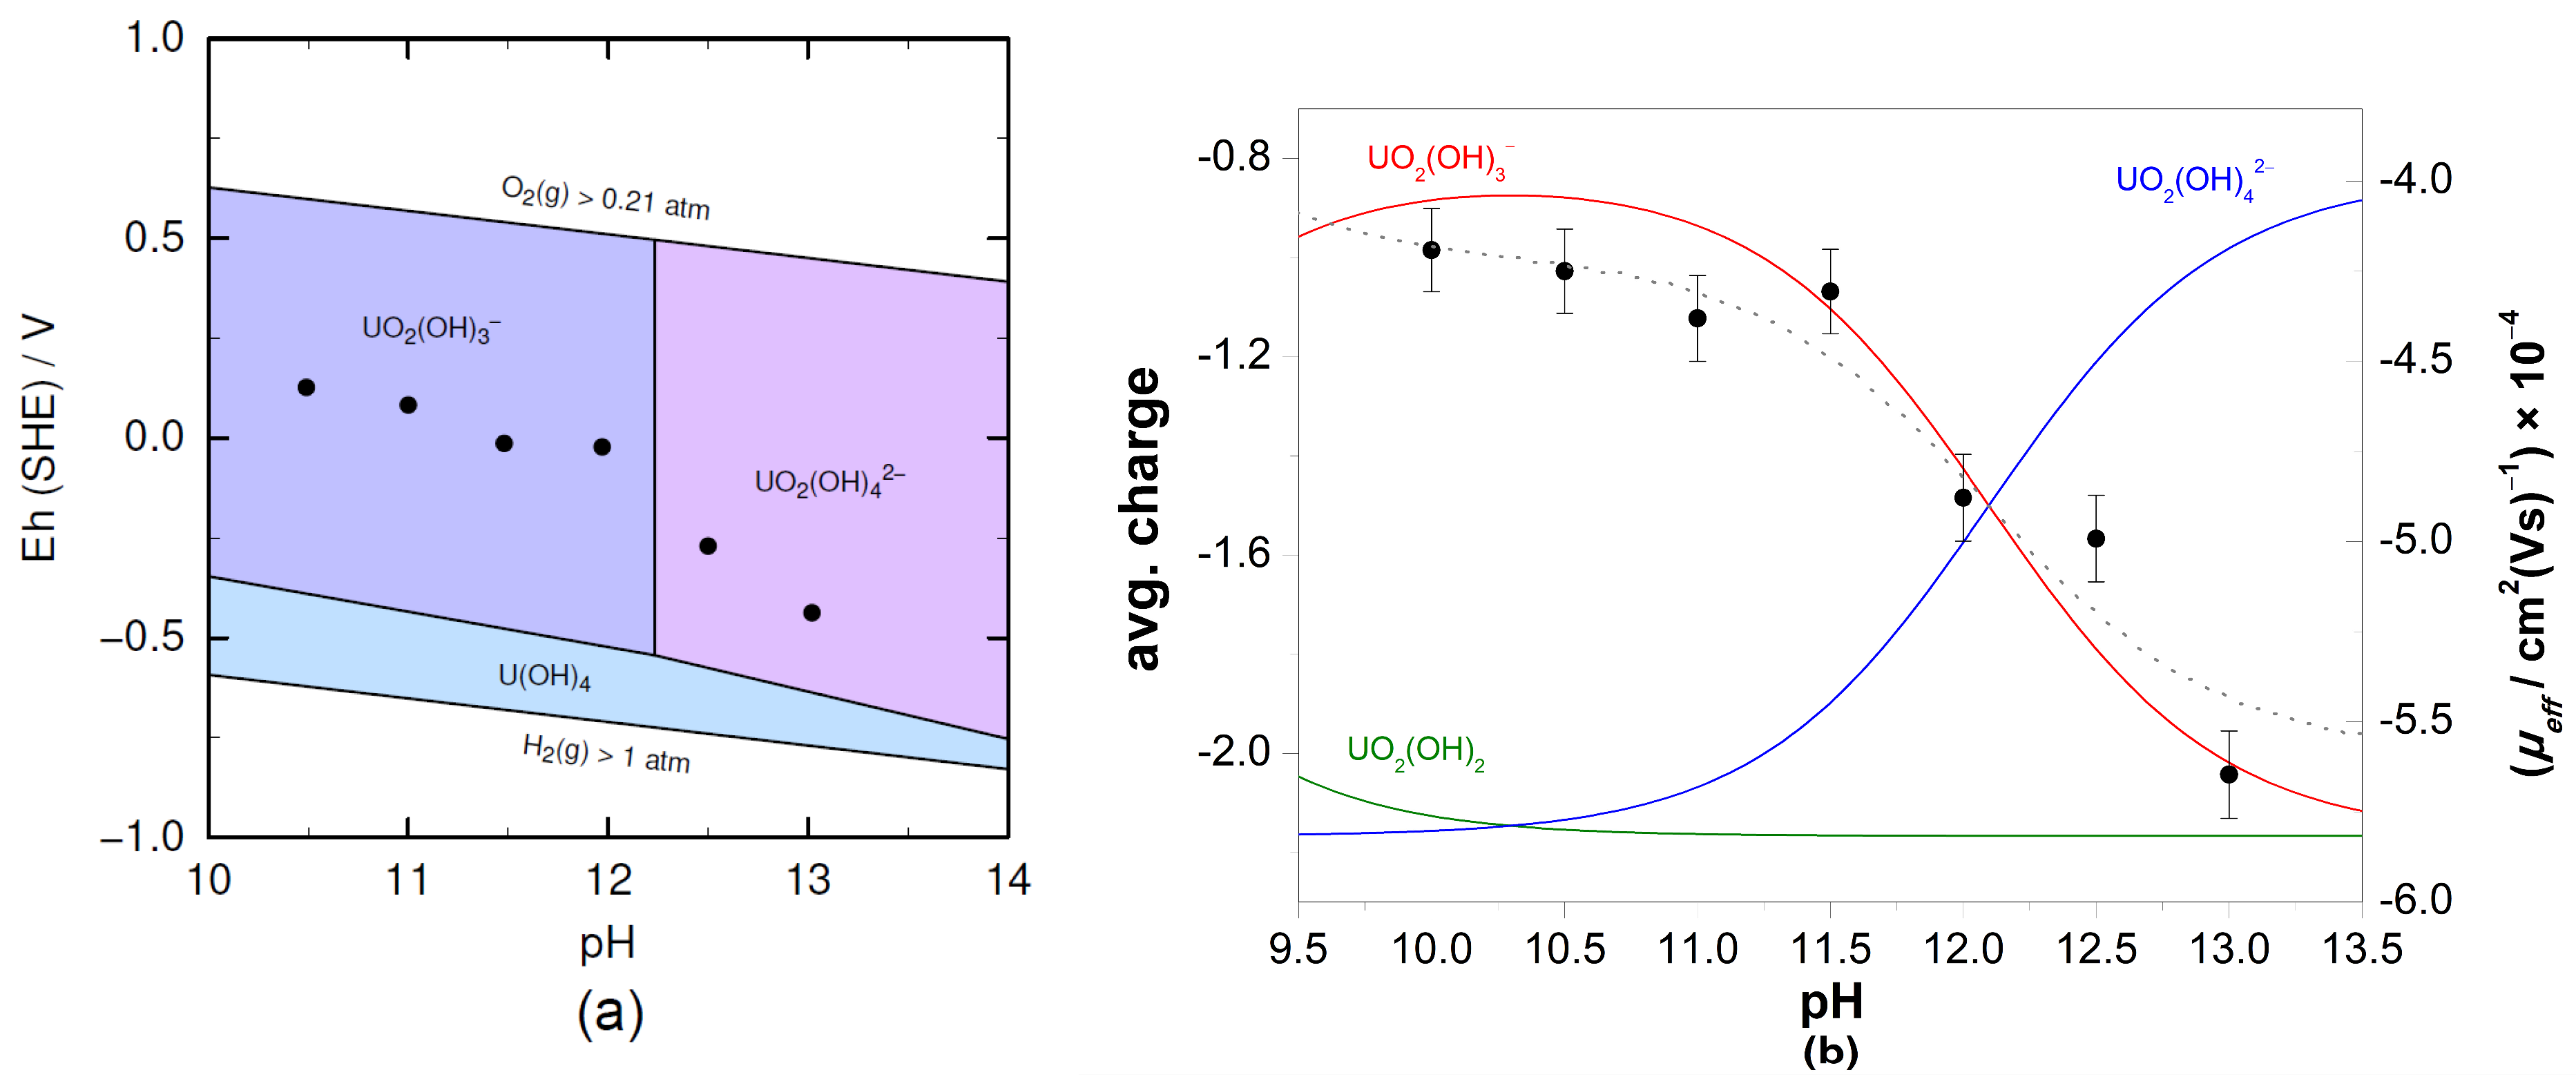
2.7. Speciation Calculations

The speciation of U, Np, Pu, and Am in VGL in the pH range 10–13 was calculated using PHREEQC [36] in combination with thermodynamic data of the ThermoChimie database 12a, version 7 August 2023 [37]. The high ionic strength of VGL was taken into account by using the specific ion interaction theory (SIT) as implemented in ThermoChimie. Since Si can be released into VGL due to HCP degradation, the influence of Si on the actinide speciation was considered by adding 4 × 10⁻³ M Si to the composition of VGL, as provided in Section 2.1. It should be noted that VGL (pH = 8.0) contains 0.01 M Ca2+. Therefore, the possible formation of ternary actinide complexes with Ca2+ was also included in the speciation calculations based on the available thermodynamic data.

3. Results and Discussion

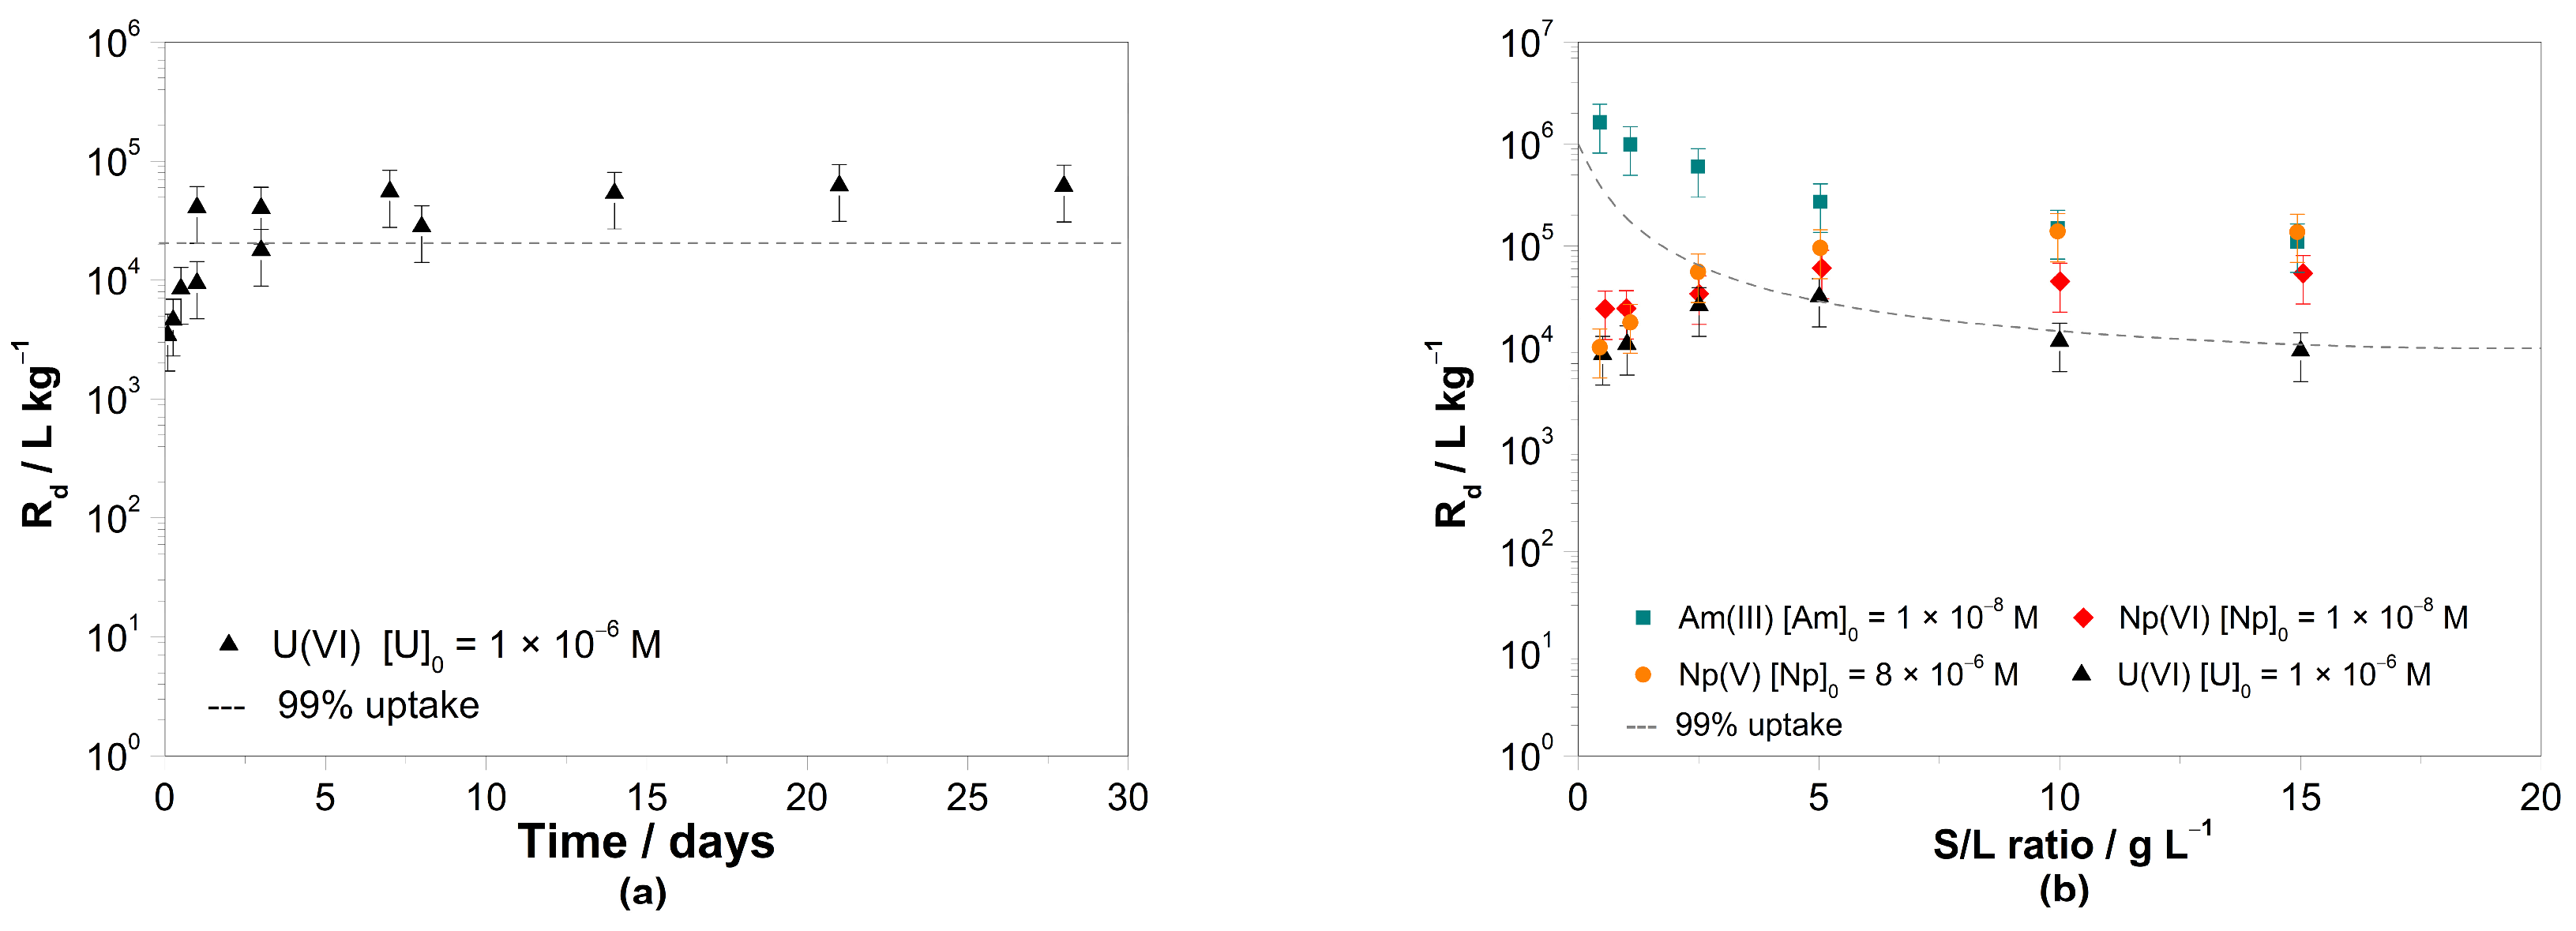
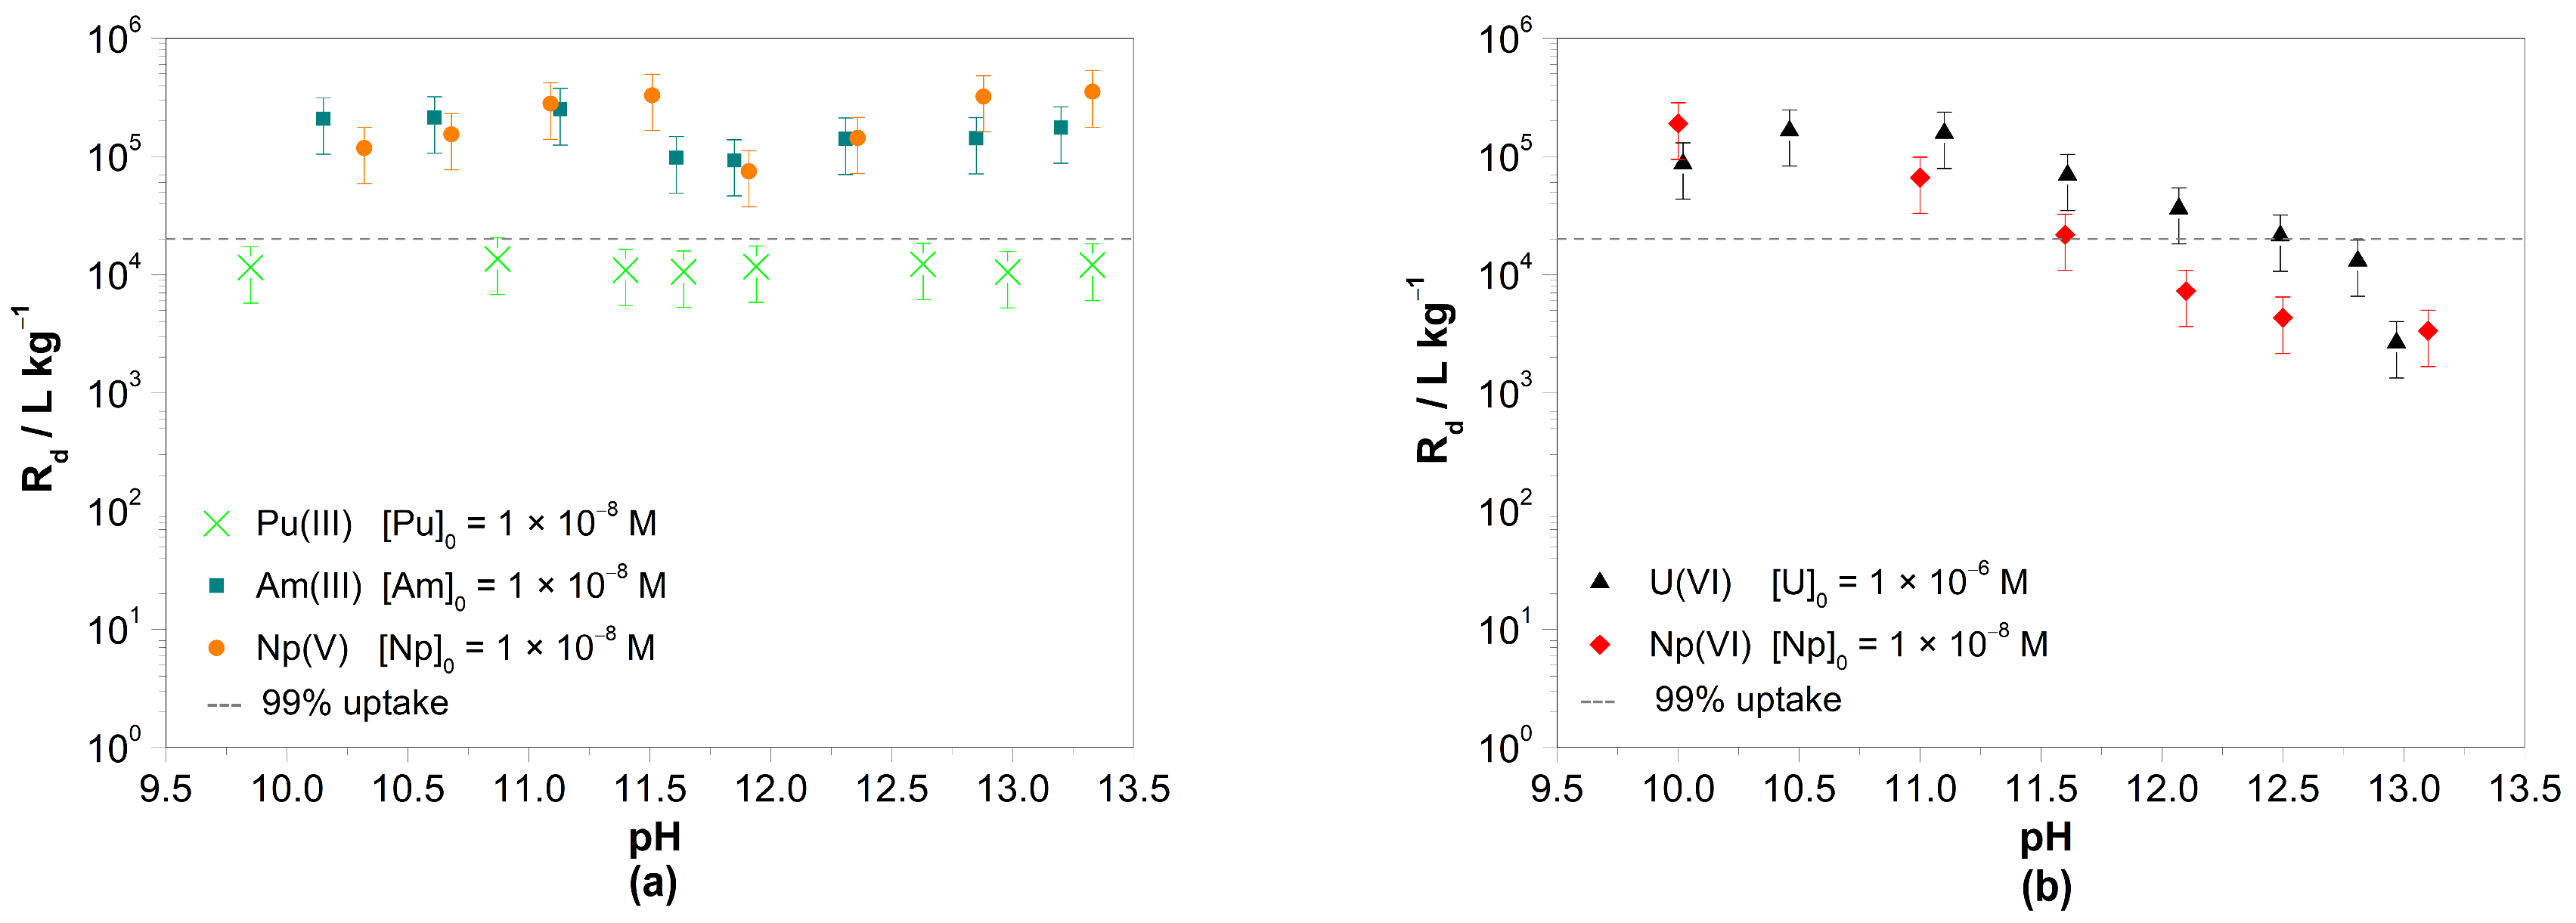
3.1. Batch Sorption Experiments

Sorption kinetics were studied using 1 × 10⁻⁶ M U(VI) and a S/L ratio of 1.0 g L−1 in VGL at pH 11.9. The experiments were performed over a period of 5 min to 28 d. As shown in Figure 1a, the Rd values increased from 3 × 10³ L kg−1 at 5 min contact time to 6 × 10⁴ L kg−1 at 24 h, after which the uptake remained > 99%. Note that the sorption equilibrium was reached after only three days of contact. Results from the literature for C-S-H phases (C/S = 1.65, pH = 11.4–12.5) at low ionic strength are about one order of magnitude higher, with Rd values between 5 × 10⁴ and 5 × 10⁵ L kg−1 [17]. It has been further described that the sorption proceeds in two steps [17]. After a very rapid initial uptake during about one day, Rd values continue to increase slightly until equilibrium is reached after about 30 days. For the C-S-H phases, the sorption kinetics is relatively fast, and a steady state is reached within about three days [17]. A similar observation was also made in previous studies of U(VI) uptake onto degraded cement pastes and C-S-H phases by Pointeau et al., which suggest that the initial uptake mechanism includes a surface sorption process, followed by a slow incorporation into the structure [38]. In addition, the literature reports that the sorption kinetics of U(VI) is very similar to that of pentavalent actinides but different from that of tri- and tetravalent actinides [17]. For the latter actinides, equilibrium was achieved within one day without a second slow sorption step [17]. Therefore, a contact time of three days was chosen for further experiments in this study.
The sorption of Am(III), Np(V), Np(VI), and U(VI) was studied at different S/L ratios from 0.5 to 15 g L−1. In all cases, the actinide uptake exceeded 85% (see Figure 1b). In this experiment, a quantitative uptake of Am(III) by HCP was observed, even at a low S/L ratio of 0.5 g L−1. Furthermore, both the pentavalent and hexavalent actinides show a similar sorption behavior after a contact time of three days.
In the sorption experiments at different pH values, an S/L ratio of 5.0 g L−1 was used for Pu(III), Am(III), and Np(V) and 1.0 g L−1 for U(VI), Np(VI), respectively. As can be seen in Figure 2a, pH has no effect on the uptake of Pu(III), Am(III), and Np(V). Independent of the actinide and its oxidation state, a high uptake of 99%, corresponding to Rd values in the range between 1 × 10⁴ and 2 × 10⁵ L kg−1, was observed. Note that for the experimental conditions of the batch experiments, the following upper limits for the determination of sorption values apply: Trivalent actinides—Rd,max = 2 × 10⁴ L kg−1; Np(V)—Rd,max = 2 × 10⁶ L kg−1).
A significant influence of pH on the uptake of the hexavalent actinides, especially at high pH values, was observed (Figure 2b). A steady decrease in Rd values at pH ≥ 11 from 1 × 10⁵ to 1 × 10³ L kg−1 (U(VI)—Rd,max = 5 × 10⁶ L kg−1; Np(VI)—Rd,max = 1 × 10⁷ L kg−1) is observed for both U(VI) and Np(VI), respectively. This observation at high ionic strength agrees well with the observations from the literature at low ionic strength [17].
The distribution coefficients for Am(III) (Rd(av) = 2 × 10⁵ L kg−1) determined in this study confirm the data known from the literature for the uptake of Am(III) by HCP at different degradation levels in the pH range 10–12 with Rd values between 2 × 10⁴ L kg−1 and 2 × 10⁵ L kg−1 [39]. Strong sorption of Am(III) on HCP at pH values of 12.5 and 13.3 was reported by Tits and Wieland, with Rd values between 105 and 106 L kg−1 [17]. Speciation calculations show that the dihydroxy species Am(OH)2+ dominates in the pH range between 10 and 11, and the trihydroxy species Am(OH)3(aq) dominates above pH 11 [36,37], as well as in calculations at high ionic strength. The theory of electrostatic inter-ligand repulsion predicts that the limited number (nlimit) of OH groups that fit into the first coordination sphere of trivalent actinides is four and that the formation constants for adding a third or fourth OH group into the first coordination sphere of the metal cation are similar [19]. This implies that the sorption of aquatic dihydroxy and trihydroxy Am(III) species is similar, agreeing with the observations shown in Figure 2a. The sorption of Am(III) on HCP at pH 10–13 is the same in all samples. For the redox-sensitive species Pu(III), values of Rd (av = 1 × 10⁴ L kg−1 were determined, which are about one order of magnitude lower than those for Am(III). However, the redox sensitivity of Pu required further considerations, so Eh and pH measurements of the supernatant solutions were performed. The Eh values obtained indicate that Pu(III) should be oxidized to Pu(IV) during the batch sorption experiment at pH 10–13, as can be seen in the predominance diagram in Figure 3a. This observation is discussed further in the following section using XAFS spectroscopy of Pu uptake on HCP.
The Rd values determined for Np(V) are shown in Figure 2a. Between pH 10 and pH 13, the Rd values range between 1 × 10⁵ L kg−1 and 4 × 10⁵ L kg−1. The measured Eh-pH values (red dots in Figure 3b) and the thermodynamic calculations indicate that the redox state of Np in VGL changed from Np(V) to Np(IV) with increasing pH, i.e., from NpO2+ at pH 10–11 to Np(OH)4(aq) at pH ≥ 11.5 (Figure 3b). However, the Np uptake by HCP does not seem to be affected by this change in speciation (Figure 2a). This agrees with the observation that the sorption of both Np(IV) and Np(V) on cementitious phases is very strong, with Rd values ranging from 105 L kg−1 to 107 L kg−1 [17]. To confirm the uptake of Np(IV) by HCP, XAFS measurements should be performed in the future.
The sorption of U(VI) and Np(VI) on HCP in VGL was also studied in the pH range 10–13 (Figure 2b). A pronounced effect of pH on actinide uptake by HCP can be seen for U(VI) and Np(VI), where the Rd values decrease in the pH range 11–13 by more than one order of magnitude (Figure 2b). For the discussion of these results, the speciation of both actinides should be considered.
Due to the addition of 5 × 10⁻³ M NaClO to the HCP suspensions, the measured Eh and pH values (black dots in Figure 3b) were outside the stability range of water, and the hexavalent Np oxidation state was stabilized in the pH range 10–13. This agrees with similar experiments performed by Gaona et al. [25].
In the case of uranium, the measured Eh and pH values (dots in Figure 4a) are in the stability field of U(VI). The dominating species are UO2(OH)3 and UO2(OH)42− with nearly equal contributions at pH 12 (Figure 4a,b). The calculated speciation could be confirmed by CE-ICP-MS measurements. In Figure 4b, the measured electrophoretic mobilities µeff of U(VI) for the batch samples in the pH range 10–13 are shown and compared with the average ionic charge derived from the calculated speciation of U(VI) [36,37]. The measured mobilities of U(VI) follow the trend of the average charge of all U(VI) species (Figure 4b). For example, at pH 13, the average ionic charge is approx. −1.95 since UO2(OH)42− is the dominating species at this pH. Consequently, the largest negative electrophoretic mobility of approx. −5.6 × 10⁻⁴ cm2(Vs)−1 was measured in the corresponding supernatant.
Several studies for the sorption of hexavalent actinides, especially U(VI) on cementitious phases, have been performed in the past. The Rd values for U(VI) sorption on different cement types in different degradation stages are relatively independent of salinity, pH, stage of degradation, and temperature and range from ~2 × 10³ L kg−1 to 104 L kg−1 [14,38,40]. In addition, the same effect observed in this study at high ionic strength was also observed in studies of U(VI) and Np(VI) on C-S-H phases at low ionic strength [17,18]. A decreasing Rd value with increasing pH is largely explained in the literature by hydrolysis effects, assuming that the species NpO2(OH)42− and UO2(OH)42− are non-sorbing species [18] (see Section 1). However, the observed sorption behavior could also be rationalized by the increase of electrostatic repulsion between the negatively charged U(VI)/Np(VI) species and the negative surface charge of HCP. Only for U(VI) and Np(VI) are species with a high negative charge formed by hydrolysis. For the other actinide oxidation states III–V, the hydrolysis species are positively charged or neutral (see Figure 3a,b). Therefore, the electrostatic repulsion from surface functional groups is less, and the sorption does not decrease with pH.

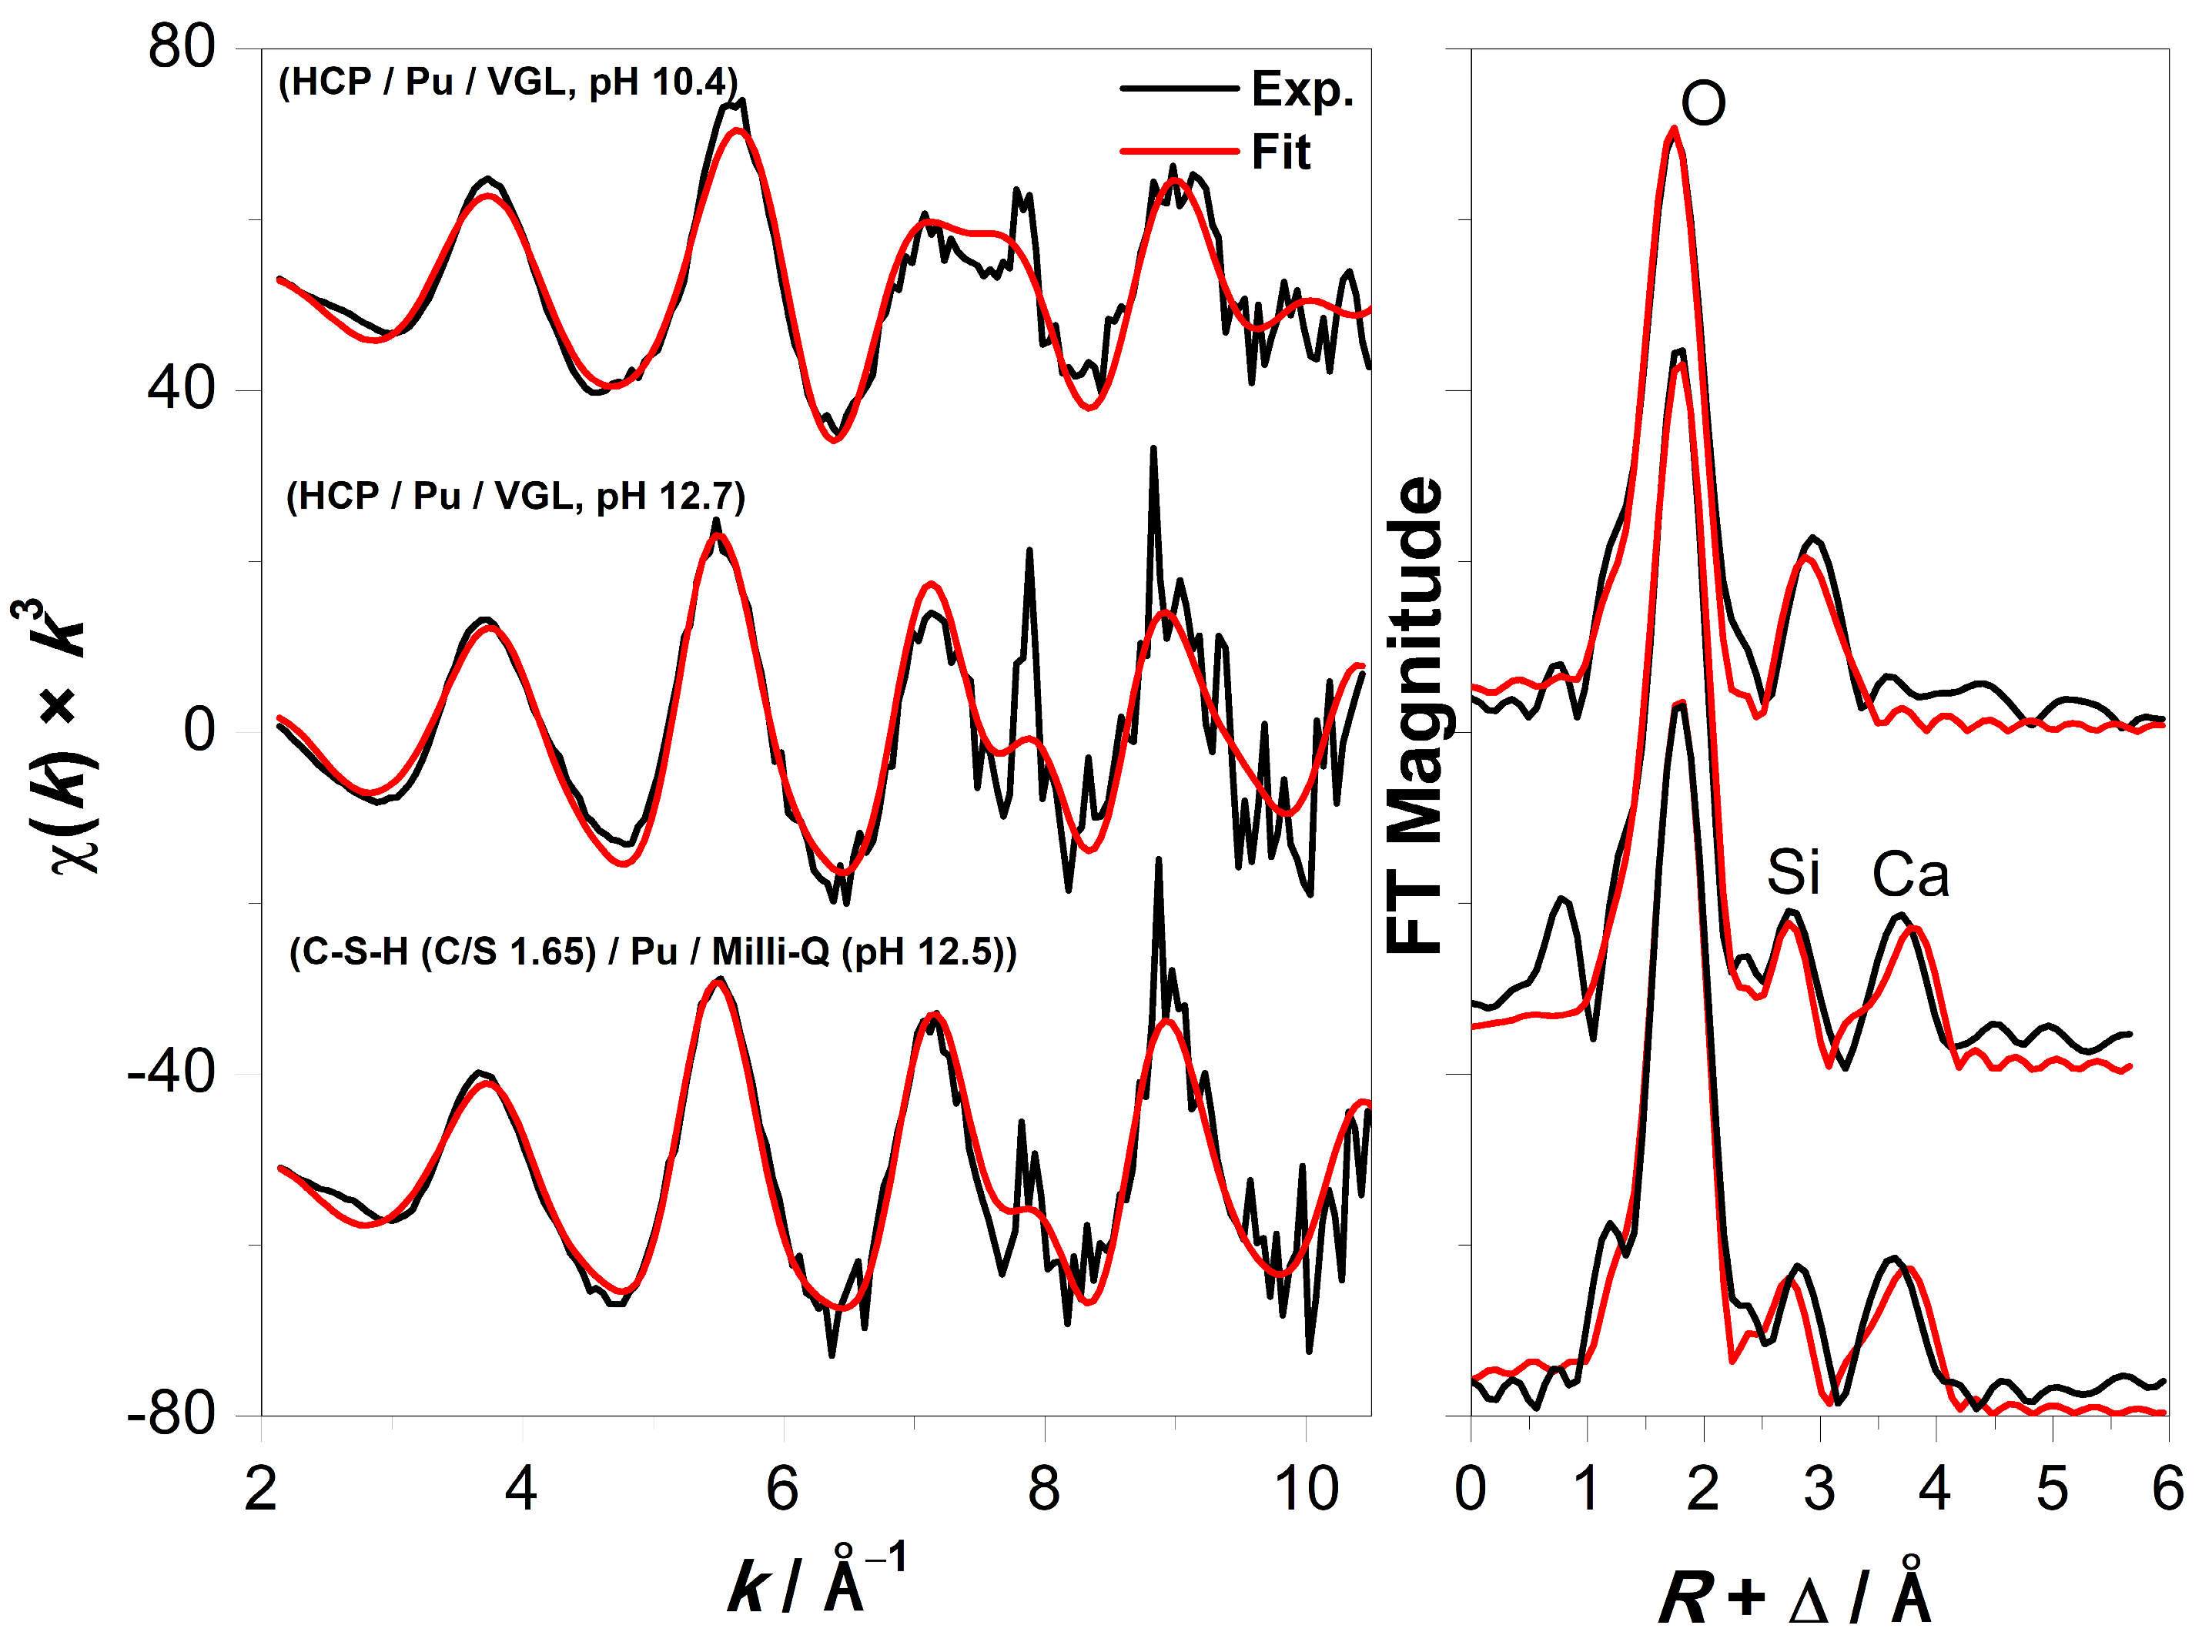
3.2. XAFS Measurements

Based on the Eh-pH measurements of the supernatant solution in the batch sorption experiments with Pu(III) (Figure 3a), its oxidation to Pu(IV) was expected. The Pu LIII-edge XANES was analyzed to obtain the Pu oxidation state after uptake from 5 × 10⁻⁶ M Pu(III) solution by HCP (S/L = 2.5 g/L, S% = 99%) in VGL at pH 10.4 and 12.7. In Table 1, the energies of the absorption edge for the samples and of reference spectra of Pu(III)(aq) and Pu(IV)(aq) are summarized [41]. The corresponding Pu LIII-edge XANES spectra are shown in Figure S3. Both the Pu LIII-edge energies and the least-squares fits (Figure S3) show the presence of Pu(IV) as the dominant species, indicating that the initial Pu(III) was oxidized to Pu(IV) during the uptake of HCP. The same results were observed for the uptake of Pu by C-S-H with C/S = 1.65 at pH 12.5 (Table 1) and previously also for C-S-H with C/S = 0.8 at pH 10 [42].
In addition, Pu LIII-edge k3-weighted EXAFS was analyzed to obtain structural and chemical information about the plutonium coordination environment after the uptake on HCP, including the identities and coordination numbers of the neighboring atoms and the bond distances to them. The EXAFS modeling was performed in k-space (2.1–10.9 Å−1) without a window function. The maximum number of independent fit parameters was ten. Figure 5 shows the Pu LIII-edge k3-weighted EXAFS spectra with applied fit and the corresponding Fourier transform magnitudes. Note a monochromator-induced glitch in the EXAFS data at k = 7.8 Å−1. In Table 2, the structural parameters are summarized. The raw EXAFS data could be best modeled with two coordination shells for the samples HCP/Pu/VGL (pH 10.4) and with three coordination shells for the samples of HCP/Pu/VGL (pH 12.7) and C-S-H (C/S 1.65)/Pu/Milli-Q (pH = 12.5). A Pu-Pu interaction indicative of polynuclear Pu species or precipitates was not observed in any sample. In all samples, the Pu-O distance ranges from 2.24 to 2.27 Å, indicating the tetravalent oxidation state of Pu, as reported previously [43]. This result agrees with the interpretation of the corresponding XANES analysis mentioned above. The sample of HCP/Pu/VGL at pH 12.7 could be modeled with two silicon atoms at 3.13 Å and four calcium atoms with an average Pu-Ca distance of 4.19 Å. This result fits well with the reference sample C-S-H (C/S 1.65)/Pu/Milli-Q (pH = 12.5) modeled with one silicon atom at 3.13 Å and five calcium atoms with an average distance of 4.17 Å. It is also consistent with the literature describing the incorporation of Pu(IV) into the CaO layer of the C-S-H phases by two Si atoms at 3.15 Å, five Si atoms at a larger distance of 3.54 Å, and six Ca atoms with 4.12 Å [42]. The observed Si and Ca coordination numbers of the samples HCP/Pu/VGL (pH 12.7) and C-S-H (C/S 1.65)/Pu/Milli-Q (pH = 12.5) agree well with the structural parameters obtained by density functional calculations for the incorporation of U(IV) into the CaO layer [35]. Furthermore, Gaona et al. [11] describe the uptake mechanism as the incorporation of Np(IV) into C-S-H phases based on the observed short distances for the Np-Si shell in combination with high coordination numbers of Si and Ca shells. The evaluation of the EXAFS measurements and the agreement of the spectra for HCP (pH = 12.7) with the spectra of the C-S-H phases also demonstrate that the C-S-H phase is the primary sorption phase of hardened cement paste, independent of ionic strength.
A considerable deviation was observed for sample HCP/Pu/VGL at pH 10.4, as no Pu-Si interaction could be modeled. In addition to the Pu-O shell, a Pu-Ca shell with two calcium atoms with an average Pu-Ca distance of 3.41 Å had to be included in the fit. An incorporation into the intermediate layers of the C-S-H phases, as observed for the other samples, seems unlikely here. This observation should be confirmed by additional EXAFS measurements.

4. Conclusions

The main objective of this work was the investigation of the influence of diluted caprock solution (VGL, I = 2.5 M) on the retention of actinides by HCP in degradation stages II and III. It was observed that actinides in oxidation states III–VI strongly interact with HCP in the pH range of 10–12.5. The corresponding Rd values determined after a contact time of three days range from 1 × 10⁴–5 × 10⁵ L kg−1. This corresponds to an actinide retention of ≥99%. This general observation agrees with published results obtained at lower ionic strengths in the range of 0.1 M. Regarding the safety analysis of a nuclear waste repository, one can conclude that the kinetics and the degree of actinide uptake by HCP are not significantly dependent on ionic strength of the cement pore water. For the specific situation of a future nuclear waste repository in Northern Germany with an argillaceous host rock, sorption data obtained at low ionic strengths might be used as an estimate for missing data for high ionic strength.
For plutonium, which determines the long-term radiotoxicity of the nuclear waste, XAFS measurements indicate that the incorporation of Pu(IV) into the C-S-H phase is the main retention mechanism of HCP at pH 12.5. The result obtained for degradation stage II of HCP should also be verified for stage III at pH < 12.5.

Supplementary Materials

The following supporting information can be downloaded at https://www.mdpi.com/article/10.3390/min13111380/s1. Figure S1: XRD pattern of the HCP sample with w/c = 0.5 (size fraction <63 μm) and assignment of the reflections to portlandite, alite, calcite, and ettringite. The tobermorite could show the theoretical position of the most significant reflexes of C-S-H phases; Figure S2: Result of the XPS measurements of HCP powder (w/c = 0.5) before and after contact with VGL at pH 12.8 for 72 h. Ca-LMM and O-KLL denote Auger transitions. The other signals were assigned to the XPS lines of the contained elements; Figure S3: Normalized Pu LIII-edge XANES spectra of the samples HCP/Pu at pH 10.4 and 12.7 and C-S-H (C/S 1.65)/Pu at pH 12.5. The largest residual of all fits is shown as blue line. The raw data for the reference spectrum of PuO2 were provided by P. Martin [32]; Table S1: Results of the XRF measurements for the main components of OPC and HCP in w%; Table S2: Results of the XRF measurements for the trace elements of OPC and HCP in ppm; Table S3: Atomic Ca/Si ratios of HCP before and after contact with VGL determined by XPS (the estimated uncertainty is about ±10%); Table S4: N2-BET specific surface areas of the HCP powder (w/c = 0.5 and size fraction <63 μm); Table S5: pH values, distribution coefficients Rd, percentage of sorption, CECNa with 22Na+, and HCP (S/L = 67 g L−1) in VGL and Milli-Q after 72 h contact time. The calculated site density for the surface areas is also listed. References [32,44,45,46] are cited in the supplementary materials.

Author Contributions

Conceptualization, S.A. and T.R.; investigations, S.A., V.H., R.S., J.S. and T.R.; formal analysis, J.S., S.A., V.H., R.S. and T.R.; writing—original draft preparation, J.S.; writing—review and editing, J.S., S.A. and T.R.; visualization, J.S., S.A. and T.R.; supervision, T.R. All authors have read and agreed to the published version of the manuscript.

Funding

This work was financially supported within the GRaZ project by the Federal Ministry for Economic Affairs and Energy (BMWi) under contract No. 02E11415A and the Federal Ministry for Environment, Nature Conservation, Nuclear Safety and Consumer Protection (BMUV) under contract No. 02E11860A.

Data Availability Statement

The data is available upon request to the corresponding author due to privacy reason.

Acknowledgments

We thank the anonymous reviewers for their helpful comments for improving the manuscript. We acknowledge the ESRF for the provision of synchrotron beam time and thank Damien Prieur as a local contact from the Helmholtz-Zentrum Dresden-Rossendorf, Germany, for the experimental support during the XAFS measurements at ROBL. The authors would like to thank Jakob Drebert (Department of Chemistry, Mainz) for the XPS measurements, Regina Walter (Institute of Geosciences, Mainz) for the BET measurements, and Ralf Meffert (Institute of Geosciences, Mainz) for the XRD measurements; Gianna Köhn for the support of the HCP characterization; Saskia Leidich and Janik Lohmann for CE-ICP-MS measurements; and Felix Berg for his support by speciation calculations.

Conflicts of Interest

The authors declare no conflict of interest.

References

  1. Lommerzheim, A.; Jobmann, M. Projekt ANSICHT-Endlagerkonzept sowie Verfüll- und Verschlusskonzept für das Standortmodell NORD; TEC-14-2015-TB; DBE Technology GmbH: Peine, Germany, 2015. [Google Scholar]
  2. Jobmann, M.; Bebiolka, A.; Burlaka, V.; Herold, P.; Jahn, S.; Lommerzheim, A.; Maßmann, J.; Meleshyn, A.; Mrugalla, S.; Reinhold, K.; et al. Safety assessment methodology for a German high-level waste repository in clay formations. J. Rock Mech. Geotech. Eng. 2017, 9, 856–876. [Google Scholar] [CrossRef]
  3. Brewitz, W. Eignungsprüfung der Schachtanlage Konrad für die Endlagerung radioaktiver Abfälle: Abschlussbericht (GSF-T 136); GSF: Neuherberg, Germany, 1982. [Google Scholar]
  4. Pointeau, I.; Piriou, B.; Fedoroff, M.; Barthes, M.G.; Marmier, N.; Fromage, F. Sorption mechanisms of Eu3+ on CSH phases of hydrated cements. J. Colloid Interface Sci. 2001, 236, 252–259. [Google Scholar] [CrossRef]
  5. Almendros-Ginestà, O.; Missana, T.; García-Gutiérrez, M.; Alonso, U. Analysis of radionuclide retention by the cement hydrate phase portlandite: A novel modelling approach. Prog. Nucl. Energy 2023, 159, 104636. [Google Scholar] [CrossRef]
  6. Wieland, E. Sorption Data Base for the Cementious Near Field of L/ILW and ILW Repositories for Provisional Safety Analyses for SGT-E2; Technical Report 14-08; NAGRA: Wettingen, Switzerland, 2014. [Google Scholar]
  7. Taylor, H.F.W. Cement Chemistry; Springer Inernational Publishing: London, UK, 1997. [Google Scholar]
  8. Schlegel, M.L.; Pointeau, I.; Coreau, N.; Reiller, P. Mechanism of europium retention by calcium silicate hydrates: An EXAFS study. Environ. Sci. Technol. 2004, 38, 4423–4431. [Google Scholar] [CrossRef]
  9. Stumpf, T.; Tits, J.; Walther, C.; Wieland, E.; Fanghänel, T. Uptake of trivalent actinides (curium(III)) by hardened cement paste: A time-resolved laser fluorescence spectroscopy study. J. Colloid Interface Sci. 2004, 276, 118–124. [Google Scholar] [CrossRef] [PubMed]
  10. Tits, J.; Stumpf, T.; Rabung, T.; Wieland, E.; Fanghänel, T. Uptake of Cm(III) and Eu(III) by calcium silicate hydrates: A solution chemistry and time-resolved laser fluorescence spectroscopy study. Environ. Sci. Technol. 2003, 37, 3568–3573. [Google Scholar] [CrossRef]
  11. Gaona, X.; Dähn, R.; Tits, J.; Scheinost, A.C.; Wieland, E. Uptake of Np(IV) by C-S-H phases and cement paste: An EXAFS study. Environ. Sci. Technol. 2011, 45, 8765–8771. [Google Scholar] [CrossRef]
  12. Macé, N.; Wieland, E.; Dähn, R.; Tits, J.; Scheinost, A.C. EXAFS investigation on U(VI) immobilization in hardened cement paste: Influence of experimental conditions on speciation. Radiochimi. Acta 2013, 101, 379–389. [Google Scholar] [CrossRef]
  13. Häußler, V.; Amayri, S.; Beck, A.; Platte, T.; Stern, T.A.; Vitova, T.; Reich, T. Uptake of actinides by calcium silicate hydrate (C-S-H) phases. Appl. Geochem. 2018, 98, 426–434. [Google Scholar] [CrossRef]
  14. Ochs, M.; Mallants, D.; Wang, L. Radionuclide and Metal Sorption on Cement and Concrete; Gheorghe, A.V., Ed.; Springer: Berlin/Heidelberg, Germany, 2016. [Google Scholar]
  15. Guo, X.; Gin, S.; Frankel, G.S. Review of corrosion interactions between different materials relevant to disposal of high-level nuclear waste. npj Mat. Degrad. 2020, 4, 34. [Google Scholar] [CrossRef]
  16. Duquette, D.J.; Latanision, R.M.; Di Bella, C.A.; Kirstein, B.E. Corrosion issues related to disposal of high-level nuclear waste in the Yucca Mountain repository–Peer reviewers’ perspective. Corrosion 2009, 65, 272–280. [Google Scholar] [CrossRef]
  17. Tits, J.; Wieland, E. Actinide Sorption by Cementitious Materials; Bericht Nr. 18-02; PSI: Villigen, Switzerland, 2018. [Google Scholar]
  18. Tits, J.; Gaona, X.; Laube, A.; Wieland, E. Influence of the redox state on the neptunium sorption under alkaline conditions: Batch sorption studies on titanium dioxide and calcium silicate hydrates. Radiochim. Acta 2014, 102, 385–400. [Google Scholar] [CrossRef]
  19. Fanghänel, T.; Neck, V. Aquatic chemistry and solubility phenomena of actinide oxides/hydroxides. Pure Appl. Chem. 2002, 74, 1895–1907. [Google Scholar] [CrossRef]
  20. Stockmann, M.; Fritsch, K.; Bok, F.; Fernandes, M.M.; Baeyens, B.; Steudtner, R.; Müller, K.; Nebelung, C.; Brendler, V.; Stumpf, T. New insights into U(VI) sorption onto montmorillonite from batch sorption and spectroscopic studies at increased ionic strength. Sci. Total Environ. 2022, 806, 150653. [Google Scholar] [CrossRef]
  21. Meleshyn, A. Mechanisms of Transformation of Bentonite Barriers—Testing a New Experimental Concept; Gesellschaft für Anlagen- und Reaktorsicherheit: Cologne, Germany, 2015; GRS-A-3844. [Google Scholar]
  22. DIN EN 196-3:2005+A1:2008; Prüfverfahren für Zement in Teil 3: Bestimmung der Erstarrungszeiten und der Raumbeständigkeit. Deutsche Fassung EN: Berlin, Germany, 2009.
  23. Amayri, S.; Fröhlich, D.R.; Kaplan, U.; Trautmann, N.; Reich, T. Distribution coefficients for the sorption of Th, U, Np, Pu, and Am on Opalinus Clay. Radiochim. Acta 2016, 104, 33–40. [Google Scholar] [CrossRef]
  24. Amayri, S.; Jermolajev, A.; Reich, T. Neptunium(V) sorption on kaolinite. Radiochim. Acta 2011, 99, 349–357. [Google Scholar] [CrossRef]
  25. Gaona, X.; Wieland, E.; Tits, J.; Scheinost, A.C.; Dähn, R. Np(V/VI) redox chemistry in cementitious systems: XAFS investigations on the speciation under anoxic and oxidizing conditions. Appl. Geochem. 2013, 28, 109–118. [Google Scholar] [CrossRef]
  26. Tits, J.; Fujita, T.; Tsukamoto, M.; Wieland, E. Uranium(VI) uptake by synthetic calcium silicate hydrates. MRS Online Proc. Libr. 2008, 1107, 467. [Google Scholar] [CrossRef]
  27. Fanghänel, T.; Neck, V.; Kim, J.I. The ion product of H2O, dissociation constants of H2CO3 and Pitzer parameters in the system Na+/H+/OH/HCO3/CO32−/ClO4/H2O at 25 °C. J. Solut. Chem 1996, 25, 327–343. [Google Scholar] [CrossRef]
  28. Willberger, C.; Amayri, S.; Häußler, V.; Scholze, R.; Reich, T. Investigation of the electrophoretic mobility of the actinides Th, U, Np, Pu, and Am in different oxidation states. Anal. Chem. 2019, 91, 11537–11543. [Google Scholar] [CrossRef]
  29. Scheinost, A.C.; Claussner, J.; Exner, J.; Feig, M.; Findeisen, S.; Hennig, C.; Kvashnina, K.O.; Naudet, D.; Prieur, D.; Rossberg, A. ROBL-II at ESRF: A synchrotron toolbox for actinide research. J. Synchrotron Radiat. 2021, 28, 333–349. [Google Scholar] [CrossRef]
  30. Ravel, B.; Newville, M. ATHENA, ARTEMIS, HEPHAESTUS: Data analysis for X-ray absorption spectroscopy using IFEFFIT. J. Synchrotron Radiat. 2005, 12, 537–541. [Google Scholar] [CrossRef]
  31. Schmeide, K.; Reich, T.; Sachs, S.; Bernhard, G. Plutonium(III) complexation by humic substances studied by X-ray absorption fine structure spectroscopy. Inorg. Chim. Acta 2006, 359, 237–242. [Google Scholar] [CrossRef]
  32. Martin, P.; Grandjean, S.; Valot, C.; Carlot, G.; Ripert, M.; Blanc, P.; Hennig, C. XAS study of (U1−yPuy)O2 solid solutions. J. Alloys Compd. 2007, 444, 410–414. [Google Scholar] [CrossRef]
  33. George, G.N.; Pickering, I.J. EXAFSPAK—A Suite of Computer Programs for Analysis of X-ray Absortion Spectra; Stanford Synchrotron Radiation Lightsource: Menlo Park, CA, USA, 2000. [Google Scholar]
  34. Rehr, J.J.; Kas, J.J.; Vila, F.D.; Prange, M.P.; Jorissen, K. Parameter-free calculations of X-ray spectra with FEFF9. Phys. Chem. Chem. Phys. 2010, 12, 5503–5513. [Google Scholar] [CrossRef] [PubMed]
  35. Chiorescu, I.; Kremleva, A.; Krüger, S. On the sorption mode of U(IV) at calcium silicate hydrate: A comparison of adsorption, absorption in the interlayer, and incorporation by means of density functional calculations. Minerals 2022, 12, 1541. [Google Scholar] [CrossRef]
  36. Parkhurst, D.L.; Appelo, C.A.J. PHREEQC (Version 3.3.5)—A Computer Program for Speciation, Batch-Reaction, One-Dimensional Transport, and Inverse Geochemical Calculations. Available online: http://wwwbrr.cr.usgs.gov/projects/GWC_coupled/phreeqc/index.html (accessed on 12 October 2023).
  37. Giffaut, E.; Grivé, M.; Blanc, P.; Vieillard, P.; Colàs, E.; Gailhanou, H.; Gaboreau, S.; Marty, N.; Madé, B.; Duro, L. Andra thermodynamic database for performance assessment: ThermoChimie. Appl. Geochem. 2014, 49, 225–236. [Google Scholar] [CrossRef]
  38. Pointeau, I.; Landesman, C.; Giffaut, E.; Reiller, P. Reproducibility of the uptake of U(VI) onto degraded cement pastes and calcium silicate hydrate phases. Radiochim. Acta 2004, 92, 645–650. [Google Scholar] [CrossRef]
  39. Pointeau, I.; Landesman, C.; Coreau, N.; Moisan, C.; Reiller, P. Am(III), Zr(IV), Pu(IV), Nb(V), U(VI) et Tc(IV) par les Matériaux Cimentaires Dégradés; CEA Report; Commissariat à l’énergie atomique: Gif sur Yvette, France, 2004; pp. 3–37. [Google Scholar]
  40. Wieland, E.; Lothenbach, B.; Glaus, M.A.; Thoenen, T.; Schwyn, B. Influence of superplasticizers on the long-term properties of cement pastes and possible impact on radionuclide uptake in a cement-based repository for radioactive waste. Appl. Geochem. 2014, 49, 126–142. [Google Scholar] [CrossRef]
  41. Conradson, S.D.; Abney, K.D.; Begg, B.D.; Brady, E.D.; Clark, D.L.; Den Auwer, C.; Ding, M.; Dorhout, P.K.; Espinosa-Faller, F.J.; Gordon, P.L. Higher order speciation effects on plutonium L3 X-ray absorption near edge spectra. Inorg. Chem. 2004, 43, 116–131. [Google Scholar] [CrossRef]
  42. Dettmann, S.; Huittinen, N.M.; Jahn, N.; Kretzschmar, J.; Kumke, M.U.; Kutyma, T.; Lohmann, J.; Reich, T.; Schmeide, K.; Shams Aldin Azzam, S.; et al. Influence of gluconate on the retention of Eu(III), Am(III), Th(IV), Pu(IV), and U(VI) by CSH (C/S = 0.8). Front. Nucl. Eng. 2023, 2, 4. [Google Scholar] [CrossRef]
  43. Reich, T.; Reich, T.Y.; Amayri, S.; Drebert, J.; Banik, N.L.; Buda, R.A.; Kratz, J.V.; Trautmann, N. Application of XAFS spectroscopy to actinide environmental science. AIP Conf. Proc. 2007, 882, 179–183. [Google Scholar] [CrossRef]
  44. Wedler, G.; Freund, H.-J. Lehrbuch der Physikalischen Chemie; Wiley–VCH: Weinheim, Germany, 2012. [Google Scholar]
  45. Odler, I. The BET-specific surface area of hydrated Portland cement and related materials. Cem. Concr. Res. 2003, 33, 2049–2056. [Google Scholar] [CrossRef]
  46. Hong, S.-Y.; Glasser, F.P. Alkali binding in cement pastes: Part I. The C-S-H phase. Cem. Concr. Res. 1999, 29, 1893–1903. [Google Scholar] [CrossRef]
Figure 1. (a) Distribution coefficients Rd for the sorption of U(VI) on HCP in VGL for S/L = 1.0 g L−1 and pH = 11.9 after contact times of 5 min to 28 d and (b) for the sorption of Am(III), Np(V), Np(VI), and U(VI) on HCP in VGL for S/L ratios between 0.5 and 15.0 g L−1 at pH ~10 after three days of contact. A calculated actinide uptake of 99% is represented by the dashed line.
Minerals 13 01380 g001
Figure 2. Distribution coefficients Rd for the sorption of (a) Pu(III), Am(III), and Np(V) at S/L = 5 g L−1 and (b) of U(VI) and Np(VI) at S/L = 1 g L−1 on HCP in VGL. A calculated actinide uptake of 99% is represented by the dashed line.
Minerals 13 01380 g002
Figure 3. (a) Predominance diagram for 1 × 10⁻⁸ M Pu in VGL. The dots mark the measured Eh and pH values of the batch sorption samples (black dots) and of EXAFS samples (white dots). (b) Predominance diagram for 1 × 10⁻⁸ M Np in VGL. The dots mark the measured Eh and pH values of the batch sorption samples of Np(V) (red dots) and Np(VI) (black dots) in presence of 5 × 10⁻³ M NaClO. (Graphic generated by PhreePlot (version 1.0) using PHREEQC [36] and the ThermoChimie database 12a, 2023 [37]).
Minerals 13 01380 g003
Figure 4. (a) Predominance diagrams for 1 × 10⁻⁶ M U in VGL. The dots mark the measured Eh and pH values of the batch sorption samples. (Graphic generated by PhreePlot (version 1.0) using PHREEQC [36] and the ThermoChimie database 12a, 2023 [37]). (b) Measured effective electrophoretic mobilities μeff of 238U (black points) in the supernatant of the U(VI) batch samples. The calculated speciation of U(VI) (colored lines) was used to derive the average ionic charge of uranium complexes in dependence on pH (dotted grey line).
Minerals 13 01380 g004
Figure 5. Pu LIII-edge k3-weighted EXAFS spectra (left) of Pu uptake on HCP and on C-S-H phases (C/S = 1.65) and the corresponding Fourier transform magnitudes (right). Black line: experimental; red line: best model.
Minerals 13 01380 g005
Table 1. Pu LIII-edge energies derived from the inflection points of the XANES spectra of the studied samples in comparison to that of the Pu(III)(aq) and Pu(IV)(aq) aquo ions [41].
SampleEnergy/eV
HCP/Pu/VGL (pH 10.4)18,062.0
HCP/Pu/VGL (pH 12.7)18,062.1
C-S-H (C/S 1.65)/Pu/Milli-Q (pH 12.5)18,062.0
Pu(III)(aq)18,060.0
Pu(IV)(aq)18,063.2
Table 2. Structural parameters of Pu of the measured samples determined by Pu LIII-edge EXAFS spectroscopy with N—coordination number; R—distance; and σ2—Debye–Waller factor (S02 = 0.9) and data from the literature for C-S-H with C/S = 0.8 [42]. * Linked to the Pu-O shell during the fit.
SampleShellNRσ22
HCP/Pu/VGL (pH 10.4)Pu-O6.0 (± 0.2)2.24 (± 0.01)0.011 (±0.001)
(norm. error = 0.2,
ΔE0 = 0.46 eV)
Pu-Ca2.1 (± 0.4)3.41 (± 0.01)0.008 (±0.002)
HCP/Pu/VGL (pH 12.7)Pu-O7.4 (± 0.4)2.27 (± 0.01)0.011 (±0.001)
(norm. error = 0.4,
ΔE0 = 2.11 eV)
Pu-Si1.7 (± 0.5)3.13 (± 0.01)0.008 (±0.003)
 Pu-Ca4.2 (± 1.3)4.19 (± 0.01)0.009 (±0.003)
C-S-H (C/S 1.65)/Pu/Milli-Q (pH = 12.5)Pu-O6.0 (± 0.3)2.27 (± 0.01)0.008 (±0.001)
(norm. error = 0.3,
ΔE0 = 1.31 eV)
Pu-Si1.2 (± 0.4)3.13 (± 0.01)0.006 (±0.002)
 Pu-Ca5.0 (± 1.3)4.17 (± 0.01)0.011 (±0.002)
C-S-H (C/S 0.8)/Pu/Milli-Q (pH = 10)Pu-O6.8 ± 0.32.25 (± 0.02)0.0119 (± 0.0004)
(norm. error = 0.9,
ΔE0 = 0.26 eV)
Pu-Si12.0 ± 0.33.15 (± 0.02)0.0119 *
 Pu-Si24.6 ± 0.53.54 (± 0.02)0.0119 *
 Pu-Ca6.3 ± 1.04.12 (± 0.02)0.0179 *
Disclaimer/Publisher’s Note: The statements, opinions and data contained in all publications are solely those of the individual author(s) and contributor(s) and not of MDPI and/or the editor(s). MDPI and/or the editor(s) disclaim responsibility for any injury to people or property resulting from any ideas, methods, instructions or products referred to in the content.

