Article

Research on Strength Model of Cemented Tailings Deposit Body in Underground Tailings Reservoir

1
Key Laboratory of Ministry of Education for High-Efficient Mining and Safety of Metal, University of Science and Technology Beijing, Beijing 100083, China
2
School of Civil and Resource Engineering, University of Science and Technology Beijing, Beijing 100083, China
3
School of Civil Engineering, Henan Polytechnic University, Jiaozuo 454003, China
4
Institut für Keramik, Glas- und Baustofftechnik der TU Bergakademie Freiberg, 09599 Freiberg, Germany
*
Author to whom correspondence should be addressed.
Minerals 2023, 13(11), 1377; https://doi.org/10.3390/min13111377
Submission received: 12 September 2023 / Revised: 22 October 2023 / Accepted: 25 October 2023 / Published: 28 October 2023

Abstract

:
Due to the lack of clarity in the strength design of underground tailings reservoirs, it is imperative to investigate the interaction between the tailings deposit body (TDB) and surrounding rock. Taking the TDB as the subject of analysis, a differential equation for vertical stress on the TDB is proposed, considering the stresses from the hanging wall of the surrounding rock and physical and structural parameters of the TDB. Considering the similarity between the underground tailings reservoir and one-step subsequent filling, in situ data of the one-step subsequent filling body from a mine was utilized to compare calculated values of the theoretical model. The resulting theoretical prediction error was less than 10%, thus verifying the reliability of the proposed model. According to the theoretical model analysis, the height of the TDB exerts the most significant influence on vertical stress, while the width and length of the TDB have a negligible impact. Moreover, internal friction angle has a more pronounced effect on vertical stress than cohesion force. A case study for a lead–zinc mine in China is presented in this work. Through uniaxial compressive strength and triaxial shear experiments, the key mechanical parameters of TDB at different ratios of cement to tailings are obtained. According to the theoretical model proposed herein, the distribution law of vertical stress in the height direction of TDB is determined for various ratios of cement to tailings. The original technical scheme of the mine has been optimized by using uniaxial compressive strength greater than vertical stress as the evaluation index, achieving both storage safety and cost reduction goals.

1. Introduction

With the rapid development of the economy, there has been a corresponding increase in resource consumption and mining activities for metal mine resources. As a result, a significant amount of tailings is generated during the process of extracting valuable minerals from ores [1,2]. According to statistics, the global annual production of tailings exceeds 14 billion tons, with China alone producing over 1.5 billion tons annually [3]. Part of the tailings is utilized for underground filling to enhance goaf stability, a small portion serves as construction materials, while the majority is stored in surface reservoirs as low-concentration slurry with a mass fraction ranging from 10% to 30%, posing significant safety hazards [4,5,6,7]. In recent years, there have been several incidents of tailings pond dam failures in countries such as Brazil and China, resulting in a significant number of casualties [8]. The waste rock, which can be utilized as construction materials after being crushed, is extracted from an area featuring favorable characteristics of the surrounding underground rock formations. The void space created by mining waste rock is utilized for tailings storage, which effectively addresses the issues of land occupation and surface tailings pond instability [9,10,11]. However, due to advancements in grinding technology, the particle size of tailings has become increasingly fine, resulting in a decrease in the permeability coefficient of tailings [12]. Therefore, the consolidation of fine-grade tailings through non-cementing technology poses a challenge, necessitating the addition of a small amount of cementitious material for underground tailings deposits. The precise calculation of underground deposit strength can effectively reduce costs and ensure the stability of the tailings deposit. The majority of the state-of-the-art strength models are based on theoretical models proposed for underground filling bodies, with limited literature available regarding strength models for underground tailings deposits.
The utilization of waste rock as a construction material and the discharge of ultra-fine tailings with a small amount of cementing agent into the gob area created by mining waste rock is an innovative technical concept. However, it is crucial to ensure the safety of tailings deposits. If the strength of the deposit body is insufficient, it may result in safety hazards such as roof collapse, ground subsidence, and barricade failure. Conversely, if the strength exceeds requirements, production costs will correspondingly increase. Safety conditions must be taken into account when considering the cost of tailings deposition, thus necessitating an investigation into the strength of the tailings deposit body. At present, many scholars have conducted extensive research on the strength of filling bodies. Terzaghi proposed a classical mechanical model for calculating stress distribution within sand bodies [13]. Since the strength properties of cemented backfill material is comparable to that of consolidated soil, this method is also employed for investigating the required strength in designing a cemented filling body. Thomas discussed the arch effect in filling bodies caused by friction between the filling material and surrounding rock and proposed a strength model for such bodies that accounts for this phenomenon [14]. Yang et al. developed a mechanical model to analyze the self-supporting strength of filling bodies in two-step mining processes, which was validated through numerical simulations [15]. Mitchell established the equation of the relationship between the strength of the filling body and the height and length of backfill through similar simulation experiments [16]. Wang et al. used FLAC3D software to simulate the three-dimensional numerical model of the stability of the side-exposed filling body in a metal mine considering secondary stope mining, and studied the failure mechanism and failure strength of the filling body [17]. Based on Marston theory, Kamash et al., considering the influence of the “arch effect” on the internal stress of the filling body, proposed a formula for calculating vertical stress at any depth in inclined backfill stope [18,19]. Wang et al. developed a strength model for open-stop, subsequently consolidated filling bodies, taking into account the contact conditions between the filling body and surrounding rock as well as the structural dimensions of the filling body [20]. Liu et al. established a three-dimensional arch stress analytical model of filling bodies based on Marston’s two-dimensional model of arch stress [21]. The aforementioned models all take into account the stability of the filling body during the two-step mining process and are not applicable for calculating the strength of a stored body in a closed state.
In summary, scholars have conducted abundant research on the theoretical model of filling body strength. However, the theoretical model of filling body strength is different from the tailings deposit mentioned in this paper. The theoretical model for the strength of filling bodies is based on a two-step mining process, wherein the filling body is established under both side-exposed and single side-exposed conditions. In the proposed tailings deposit method, the tailings are stored in a closed space without any mining operations conducted around it. Therefore, further force analysis based on the filling physical model is necessary to establish the strength model of the tailings deposit body within a closed space according to actual working conditions. Therefore, this paper aims to establish a strength model suitable for a tailings deposit body in the closed deposit space based on previous research on filling body strength theory. The measured vertical stress during filling and maintenance of two mines in China was obtained, the key factors affecting the vertical stress were analyzed, and the validity of the model was verified. Finally, a lead–zinc mine was selected as the background for analyzing the impact of structural parameters on vertical stress and optimizing the corresponding deposit composition.

2. Theory

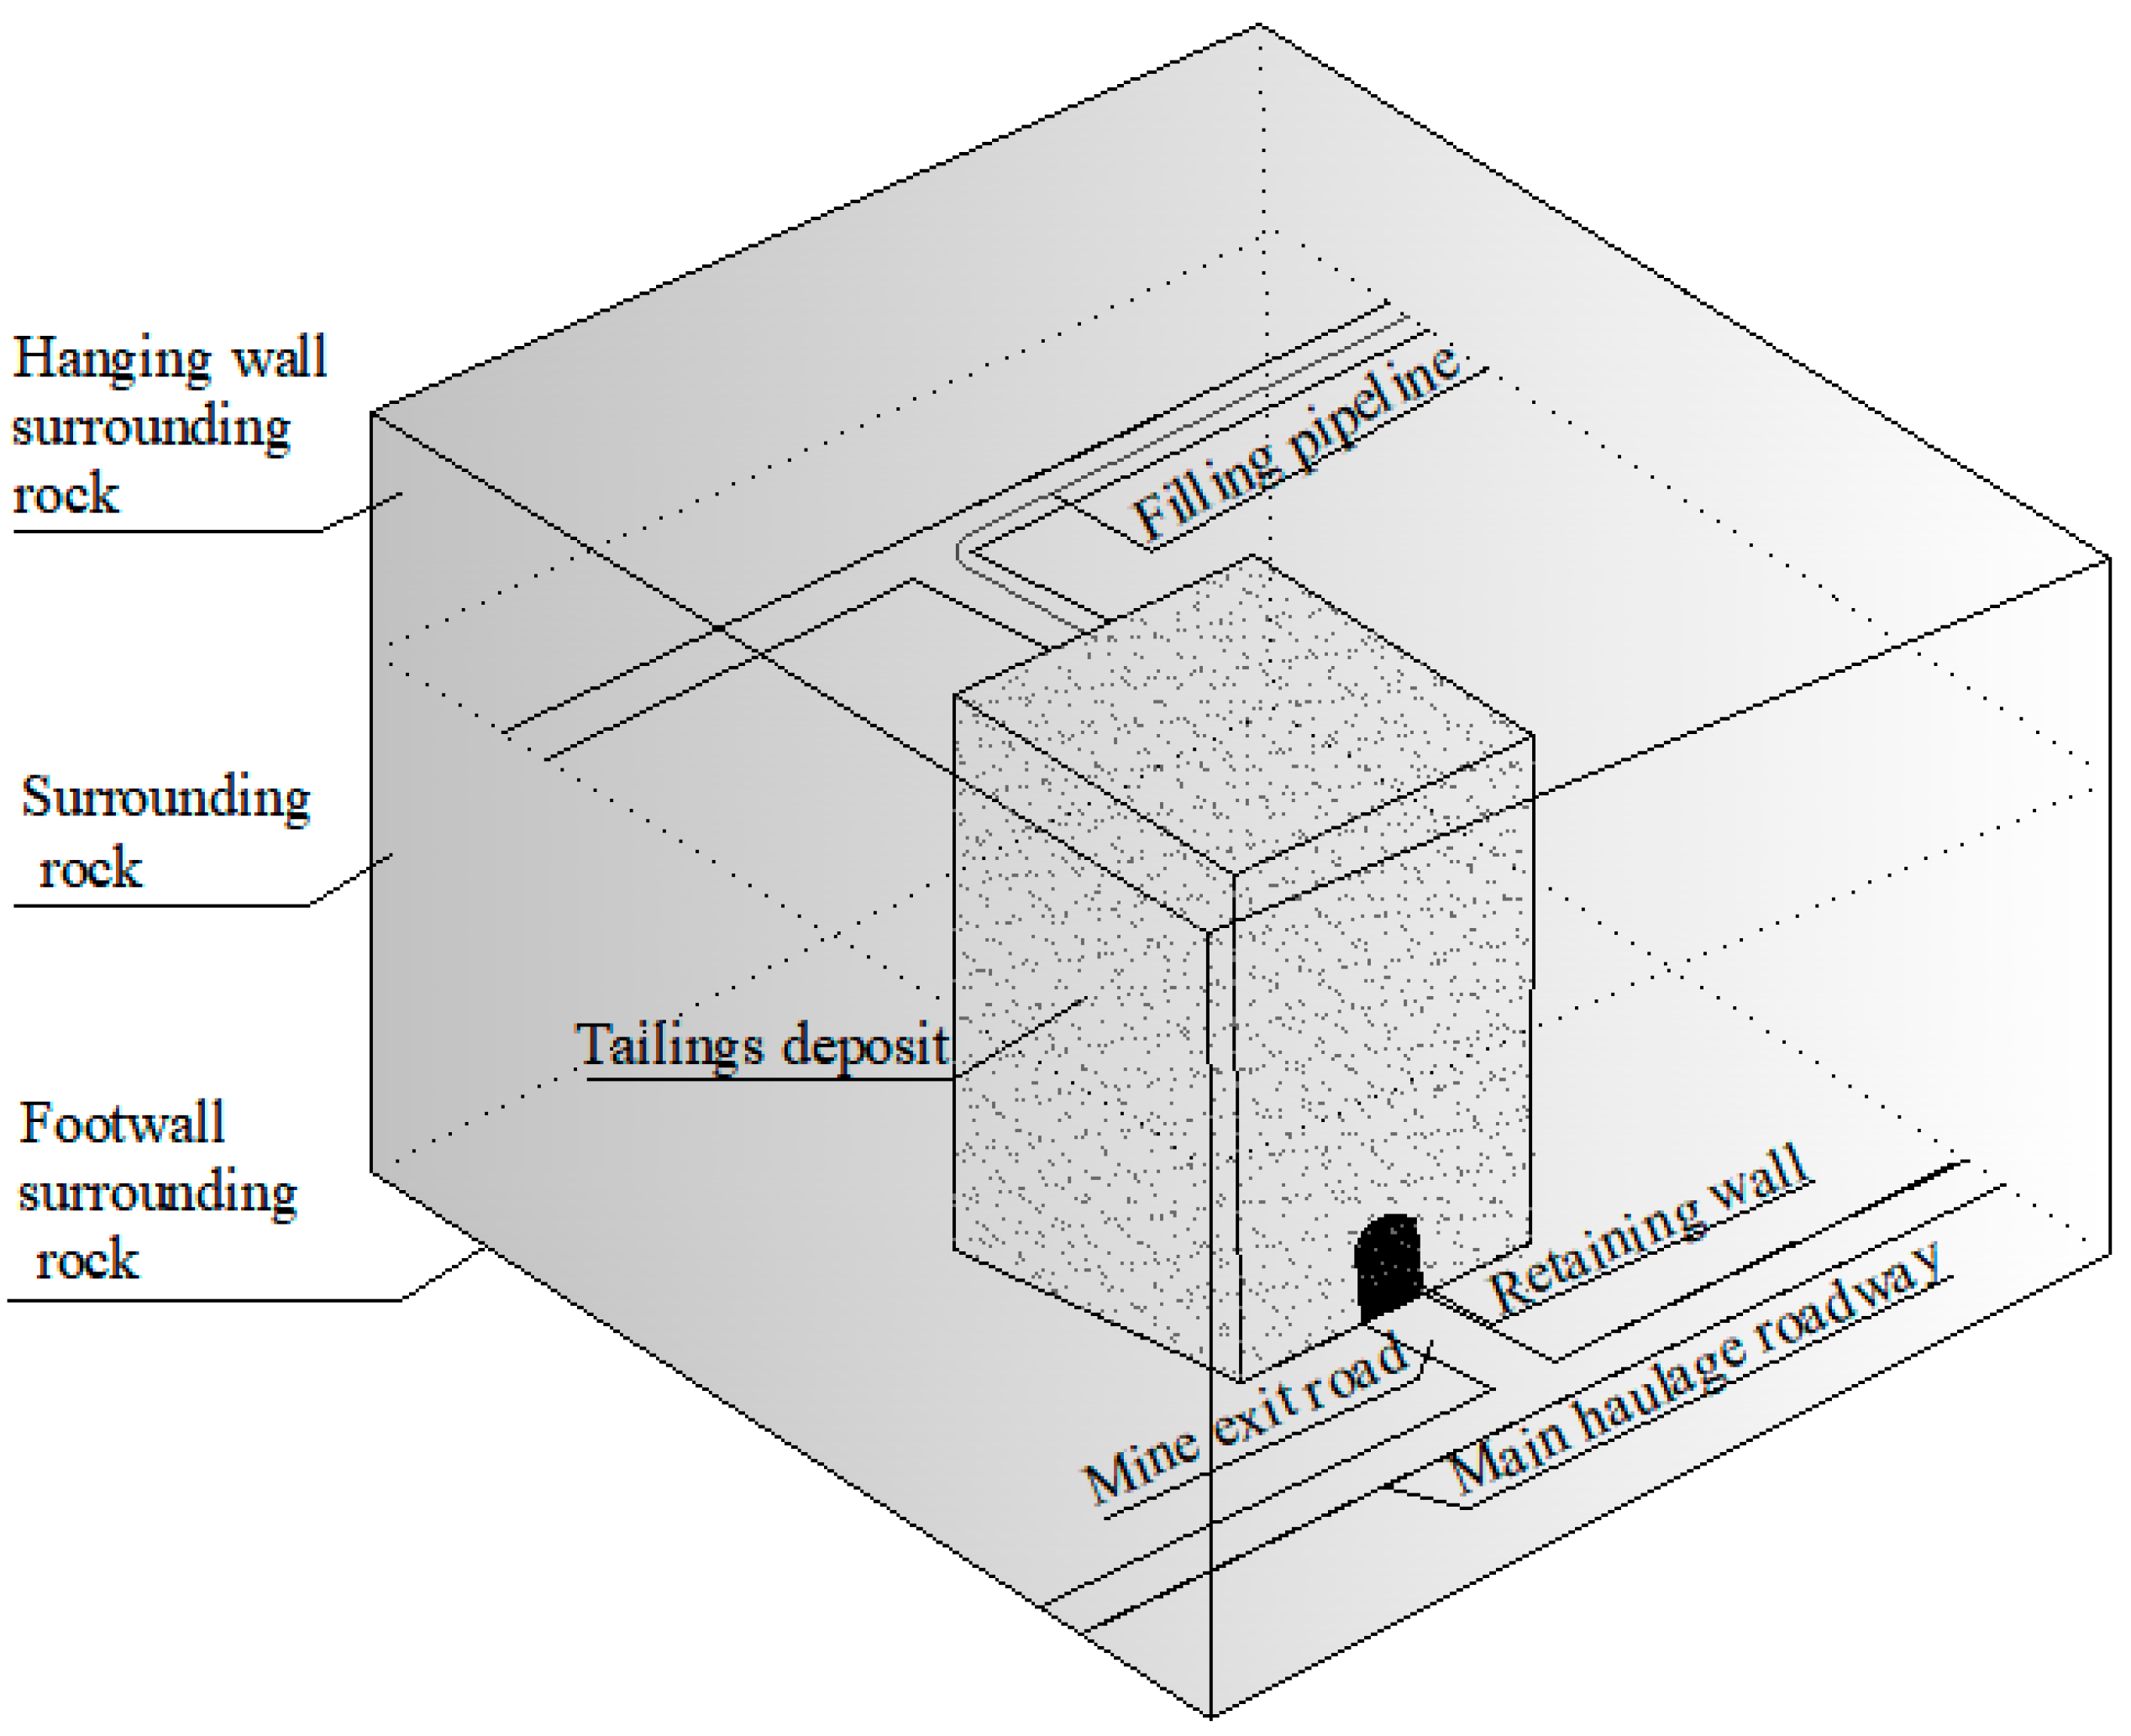
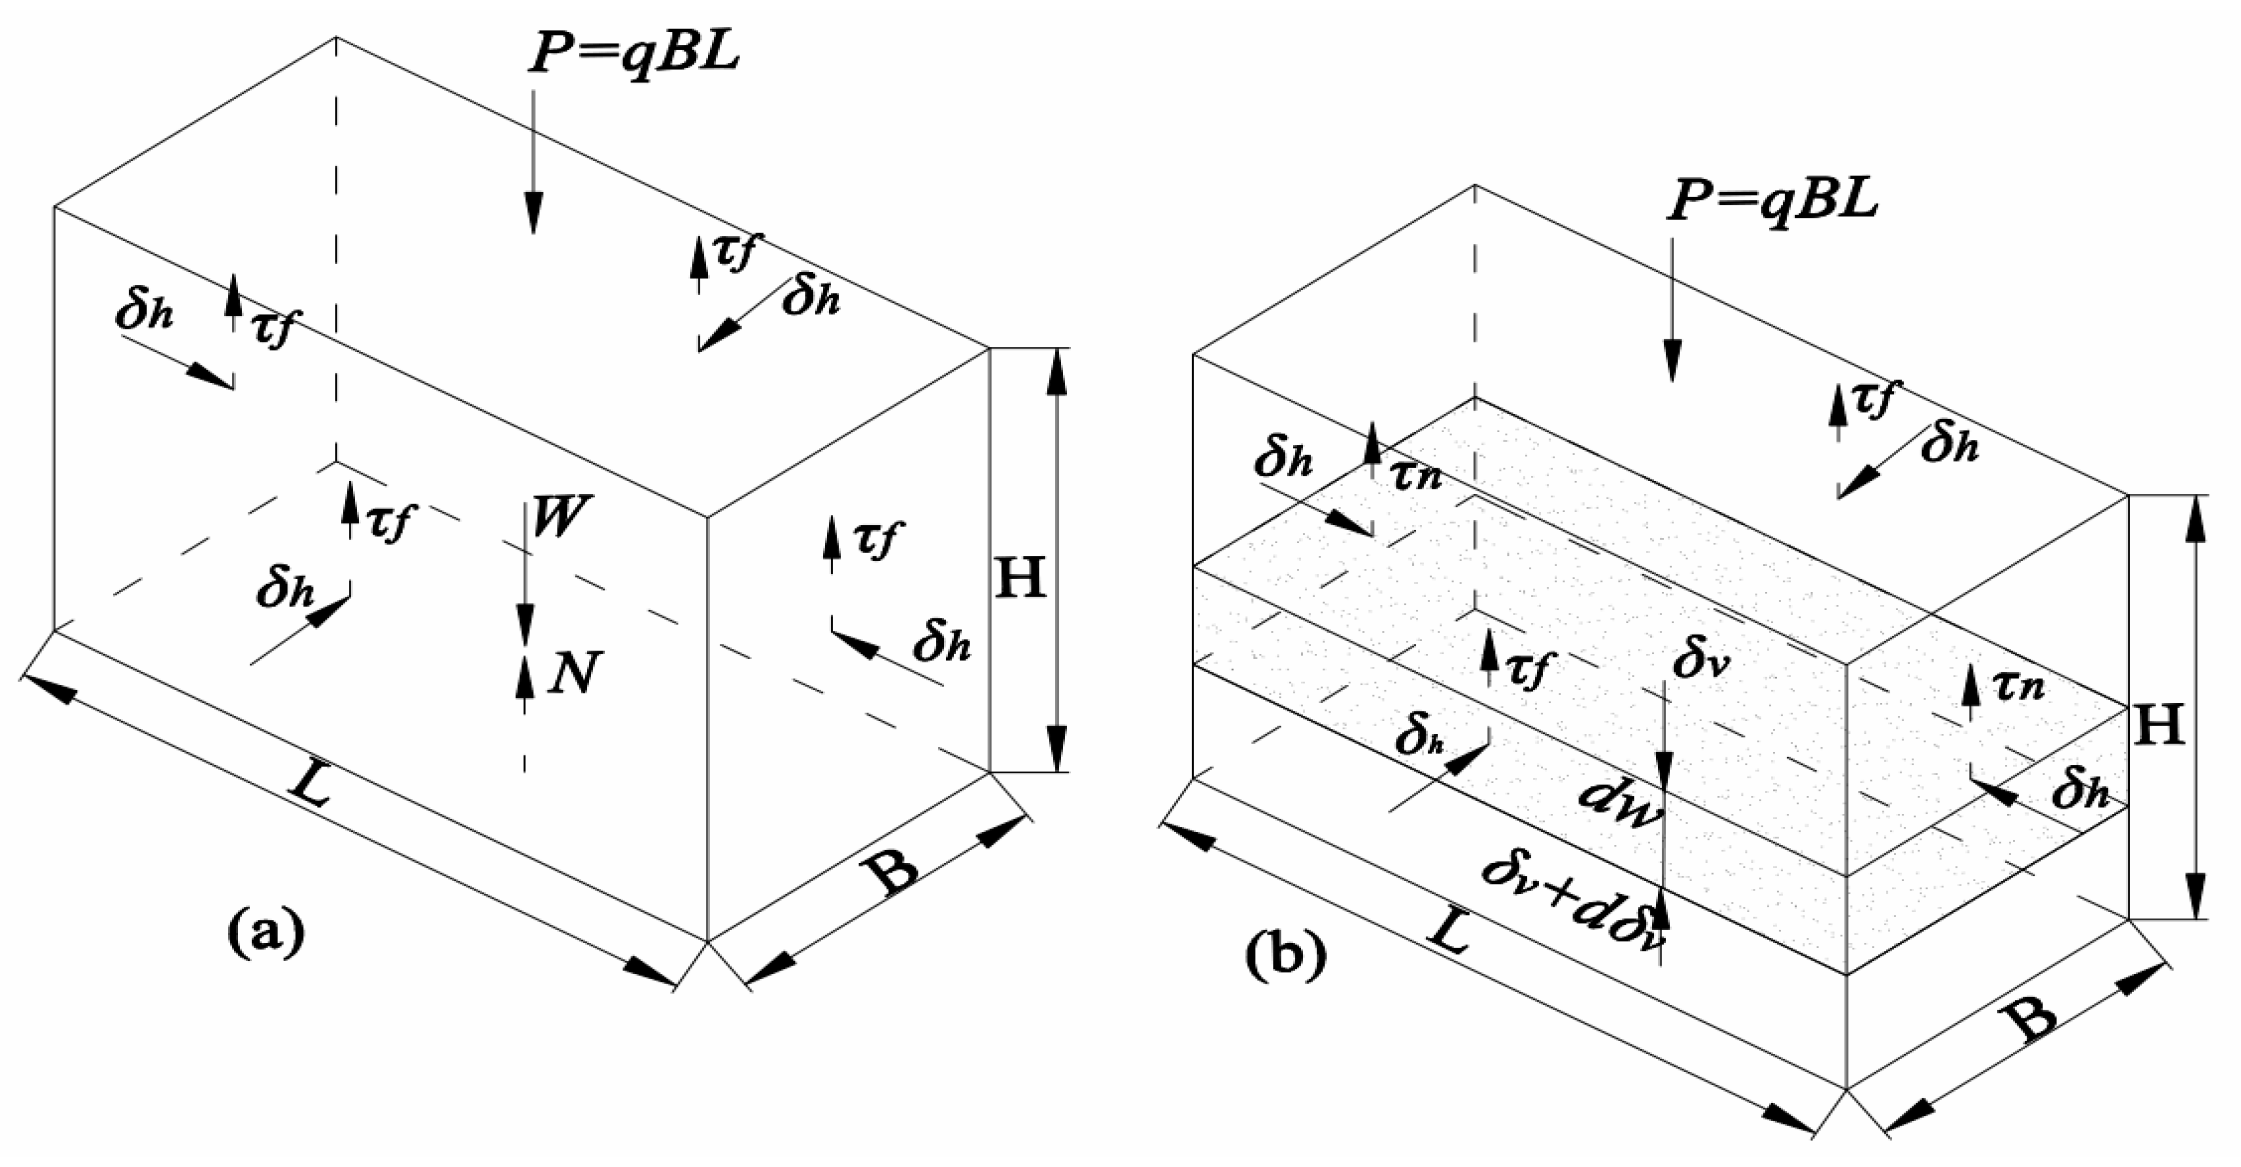
2.1. Mechanical Model of Tailings Deposit Body

An underground tailings reservoir, as shown in Figure 1, is the area where low-strength tailings materials, containing a small amount of cementing materials, are deposited after extracting waste rock or low-grade ore. The distinction between an underground tailings reservoir and conventional underground filling lies in the following aspects. (1) The structural parameters (length, width, and height) of underground tailings reservoirs are larger; (2) the underground tailings reservoir is situated in a closed environment, with no mining operations conducted around it; (3) higher barricade requirements are imposed on the underground tailings reservoir. The underground tailings reservoir’s tailings deposit body must possess sufficient strength to withstand the stress caused by dead weight, surrounding rock, and overlying rock movements. Due to the intricate hydrogeology and stress conditions underground, if the deposit’s strength is insufficient, it may undergo plastic failure under vertical stress, generating significant lateral stress on the barricade and posing a risk of barricade failure [22]. Therefore, in order to ensure the integrity and stability of the underground tailings pond, the cemented tailings slurry in the tailings pond must have a certain strength after solidification [23]. In order to study the required strength, it should be obtained through the internal force analysis after determining the stress conditions of the tailings deposit body and the structural parameters of the tailings reservoir.
The force analysis of the tailings deposit body is presented in Figure 2. The height, width, and length of the tailings deposit body are H, B, and L. As shown in Figure 2, the pressure from the upper surrounding rock is P. The lateral horizontal stress is  δ h . The vertical stress is  δ v . The dead weight of the tailings deposit body is  W . The friction force between the tailings deposit and surrounding rock is  τ f , which mainly includes the friction force along the length direction and along the width contact surface. The supporting force of the footwall to the tailings deposit body is N. The vertical stress varies with changes in the structural parameters of the tailings deposit. If the strength of the tailings deposit is insufficient to withstand this stress, compression damage may occur at its base. Once the underground deposit body comes into contact with the top plate, it is subjected to increasing overlying rock pressure over time, thereby elevating the risk of deposit failure.

2.2. Mechanical Analysis of Tailings Deposit Body

When analyzing the vertical stress  δ v  at any depth inside the tailings deposit body, an interval dz at the depth z of the upper surface of the deposit is chosen, and the stress analysis in Figure 2b is conducted in the process of model derivation. The body weight of the unit is
d W = L B γ d z
where  L  is the length of the tailings deposit body, m;  B  is the width, m;  γ  is the specific gravity of the tailings deposit body, kN·m−3 z  is the height, m;  W  is the body weight of the deposit body, N.
The pressure  P  on the upper part of the unit body is
P = L B δ v
The supporting force  N  to the element is
N = L B ( δ v + d δ v )
The lateral horizontal stress  δ h  can be expressed as
δ h = k δ v
where  k  is the lateral pressure coefficient. The frictional resistance  T  between the tailings deposit body and the surrounding rock is
T = 2 τ f L d z + 2 τ n B d z
where  τ f  is the shear stress in the direction of the longitudinal contact surface of the tailings deposit body, Pa.  τ n  is the shear stress acting on the contact surface of the tailings deposit body in the width direction. The relationship between shear stress and internal friction angle and cohesion force can be obtained according to Mohr–Coulomb theory. Assuming that the shear stress along the open field length section is equal to the shear stress along the open field width section, the following formula is obtained. Assuming that the shear stress along the open field length section is equal to that along the open field width section, the following formula is obtained:
τ n = τ f = k δ v tan φ + C
where  φ  and  C  are the internal friction angle and cohesive force on the contact surface between the tailings deposit body and the surrounding rock.
Combining Equations (6) and (7) provides
T = 2 ( k δ v tan φ + C ) ( L + B ) d z
Assuming  C = k C 0 φ = φ 0 , then  k = tan 2 ( 45 ° φ 0 / 2 )  [18].
The force balance in the vertical direction of element  d z  in the tailings deposit body can be expressed as
d W + P = N + T
Combining Equations (1)–(4), (7) and (8) provide
L B γ d z + L B δ v = L B ( δ v + d δ v ) + 2 ( k δ v tan φ + C ) ( L + B ) d z
Rewriting Equation (9) reads
d δ v = M 1 d z N 1 δ v d z
where
{ M 1 = γ 2 C ( L + B ) L B N 1 = 2 k ( L + B ) tan φ L B
The general solution of Equation (10) is
δ v = M 1 N 1 λ e N 1 z N 1
where λ is a constant. According to the boundary conditions, when z = 0, the upper surface of the tailings deposit body is subjected to the compressive stress of the caving surrounding rock, namely  δ v = q . Then the vertical stress at a depth of z in the tailings deposit body can be determined:
δ v = M 1 N 1 ( 1 e N 1 z ) + q e N 1 z
where  q  is the compressive stress of the surrounding rock on the upper surface of the tailings deposit body. If the value of  q  can be obtained in advance, it would enable the determination of the vertical stress within the tailings deposit body.
The roof rocks often experience tensile stress, causing them to fall and form an arch for stability. The caving height of the balanced arch at the top of the stope is determined by applying the following formula:
b 1 = B + 2 H cot θ 2 f
where  b 1  is the caving height of the balance arch, m;  f  is the Protodyakonov’s coefficient of the surrounding rock,  θ  is the slip angle,  θ = π / 4 + φ 1 / 2 , where  φ 1  is the internal friction angle of the surrounding rock.
The compressive stress at the top of the tailings deposit body is
q = γ 1 B + 2 H cot θ 2 f
where  γ 1  is the bulk density of rock mass, kN·m−3. Combining Equations (11), (13), and (15) provides
δ v = L B γ 2 k C 0 ( L + B ) 2 k ( L + B ) tan φ ( 1 e 2 k ( L + B ) tan φ L B z ) + γ 1 B + 2 H cot ( π 4 + φ 1 2 ) 2 f e 2 k ( L + B ) tan φ L B z
The vertical stress at any elevation within the tailings deposit can be determined using Equation (16). If the uniaxial compressive strength of the tailings deposit body exceeds the vertical stress at a certain elevation, then stability can be assumed for the tailings deposit body. Because the influence of groundwater on vertical stress is not considered in the model derivation, if the water inflow of the surrounding rock is large, further research is needed.

2.3. Mechanical Model Verification and Applicability Analysis

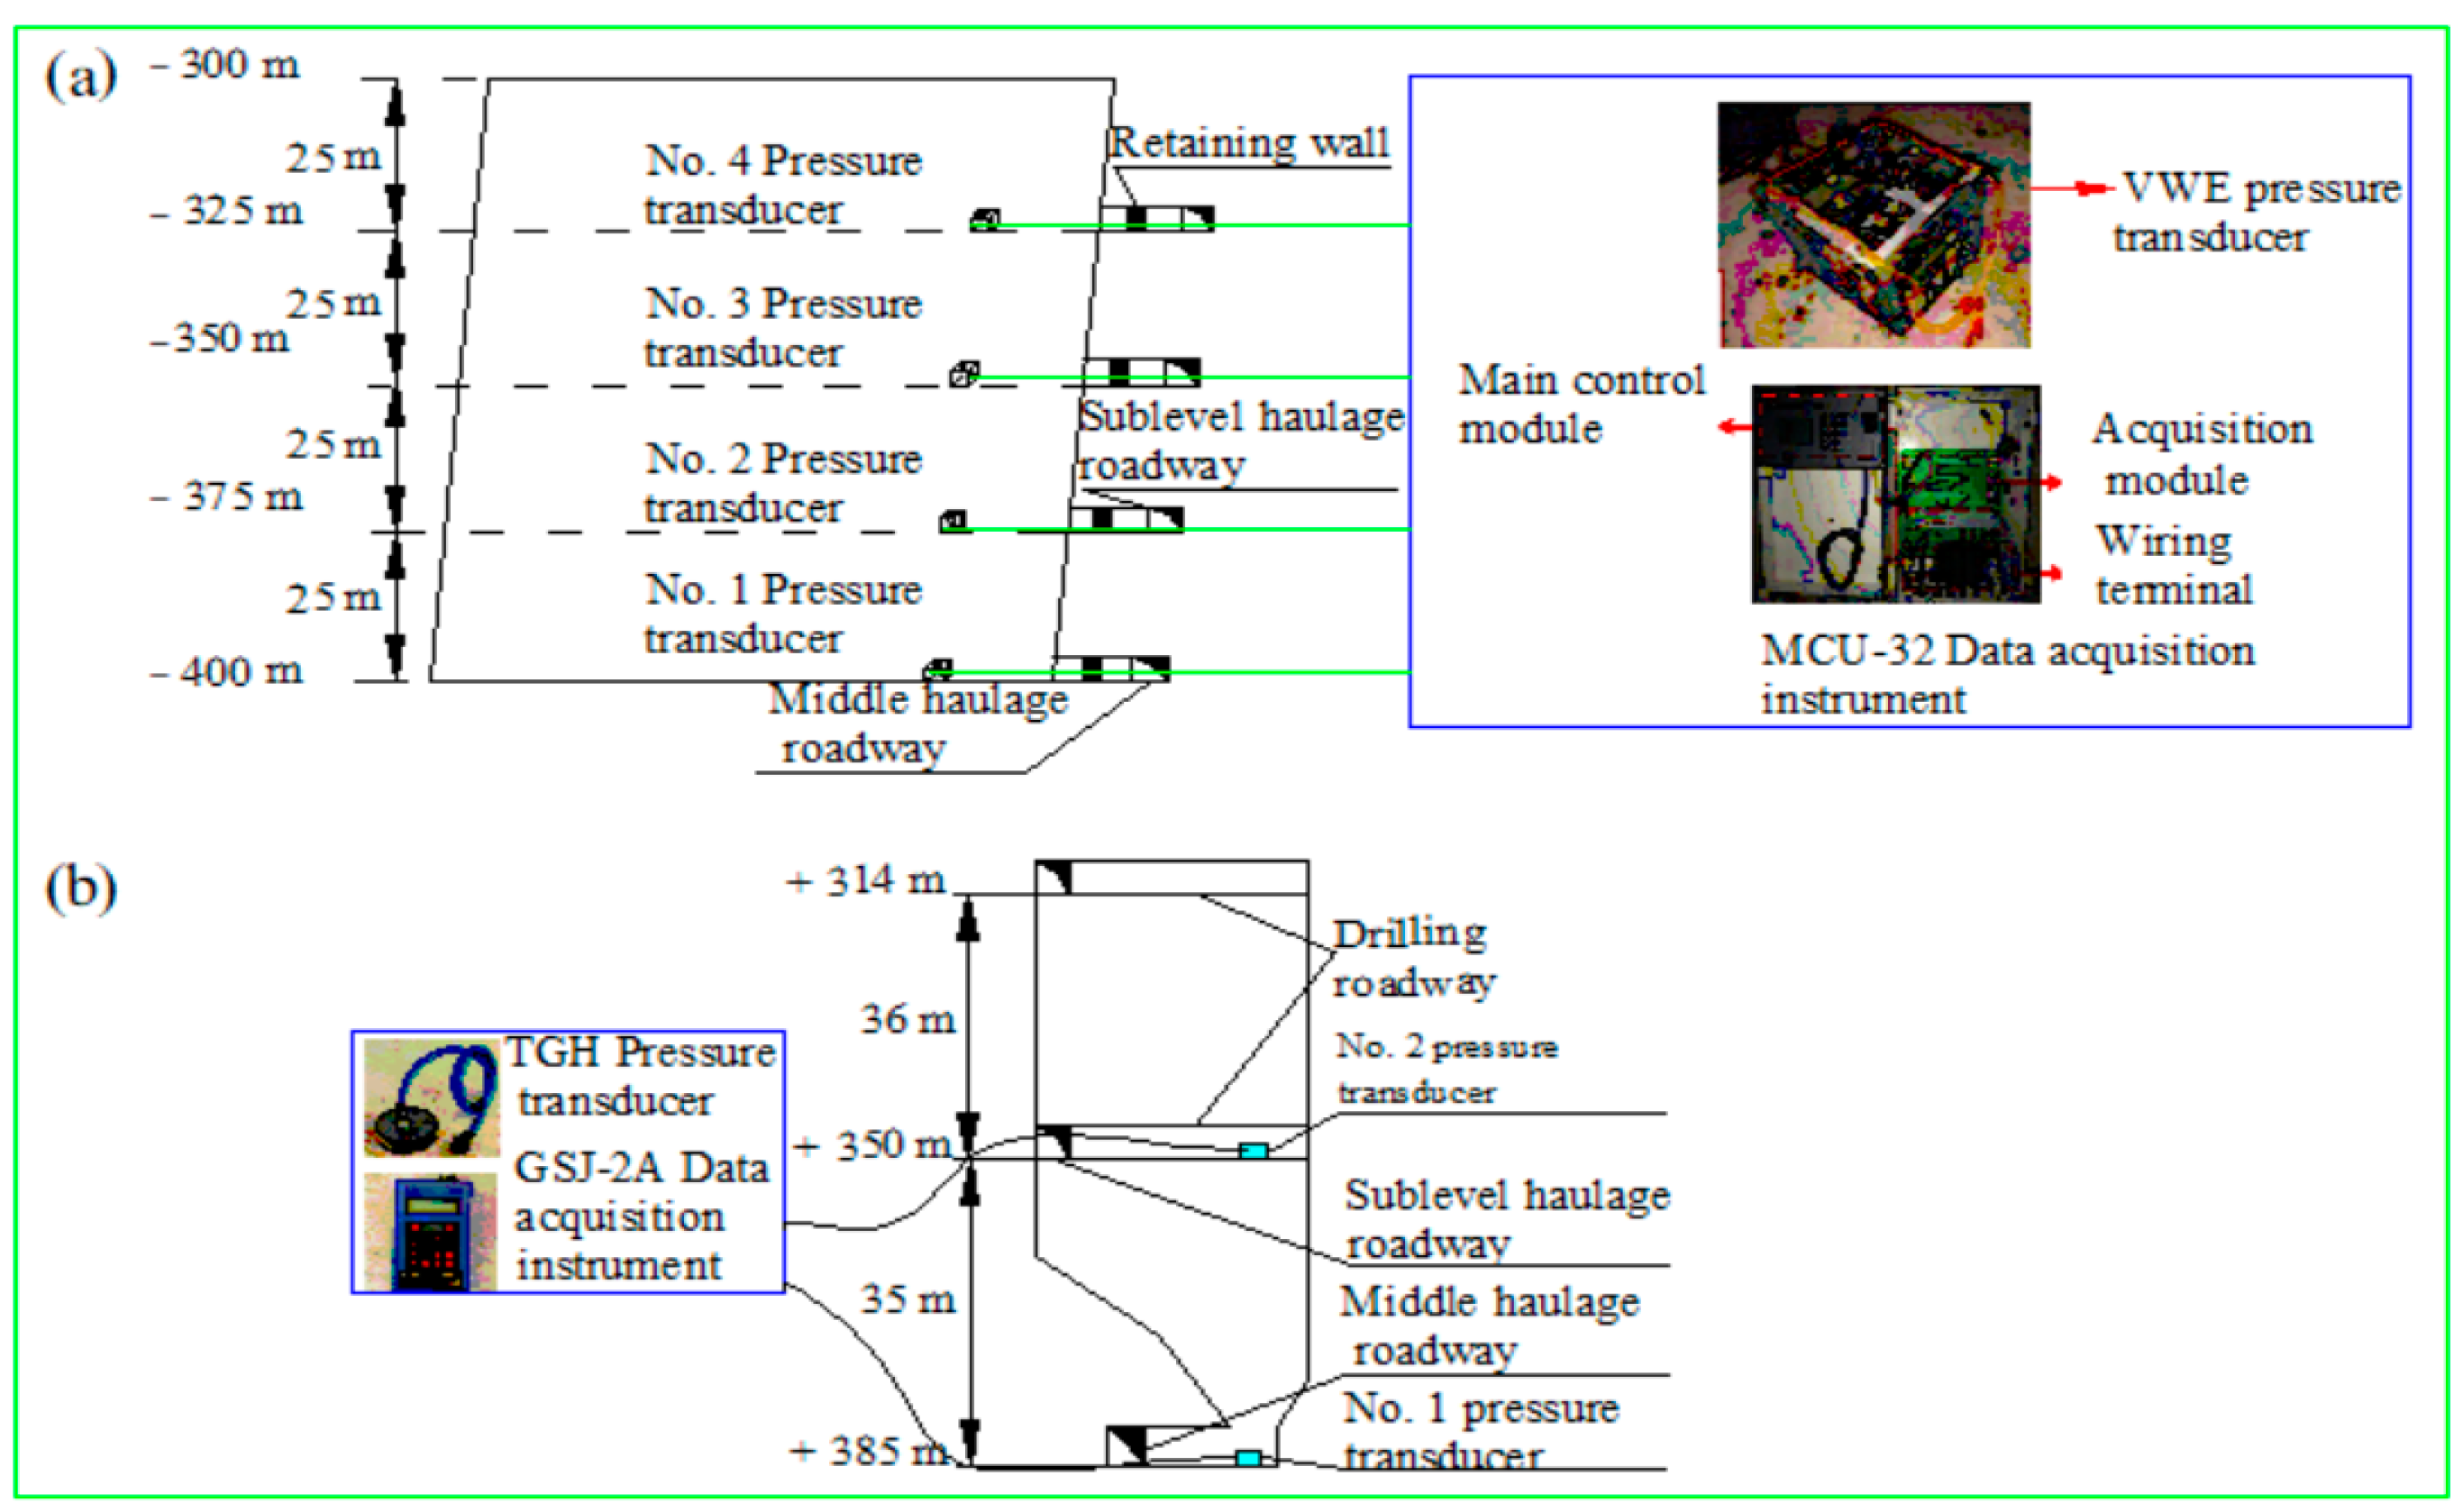
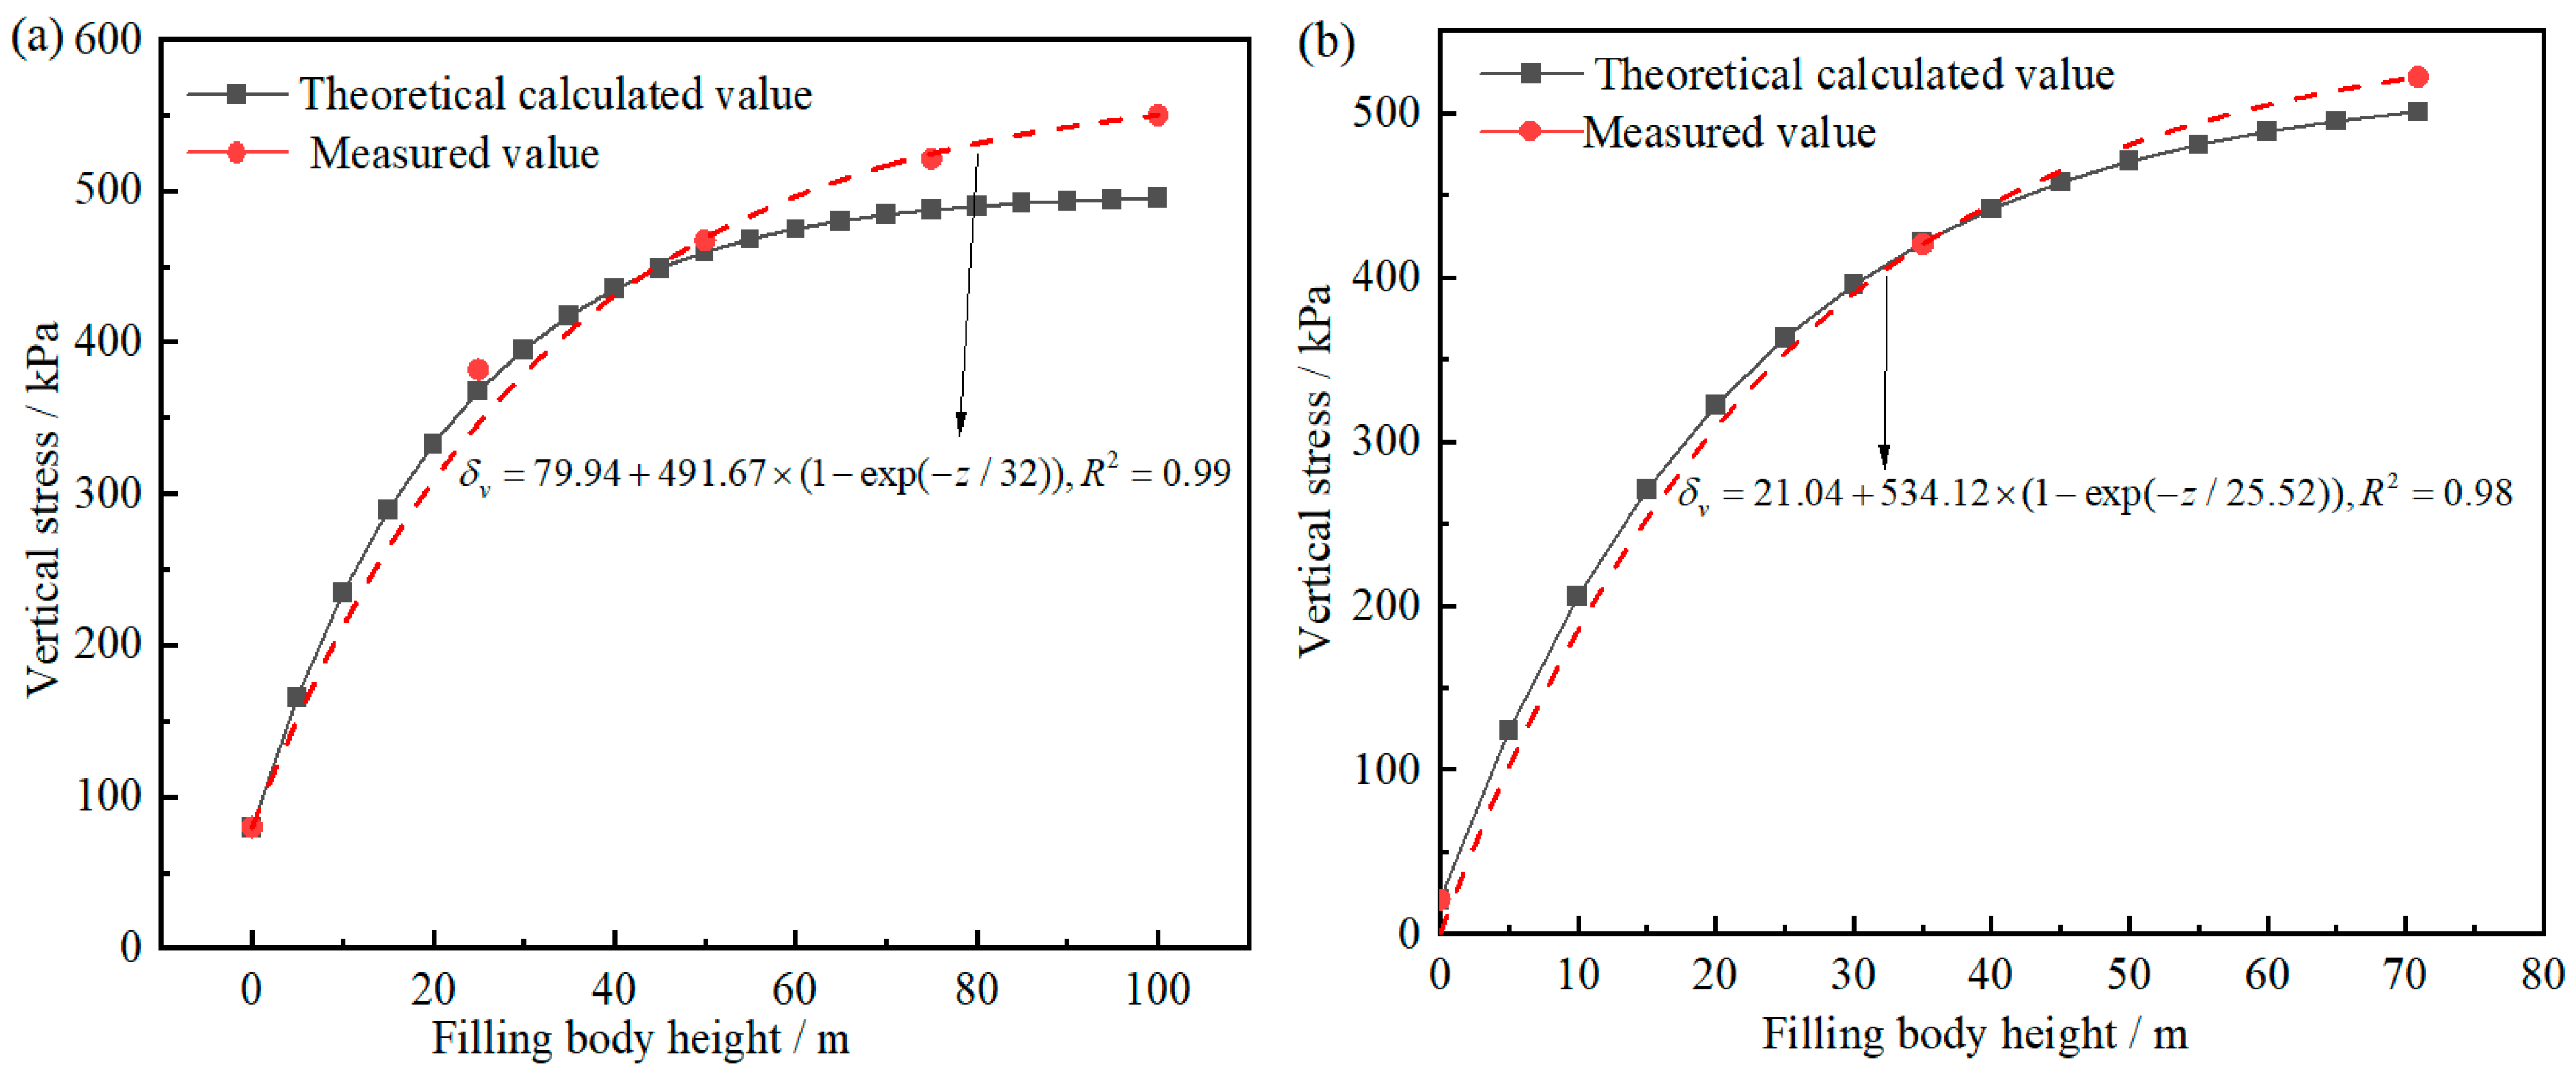
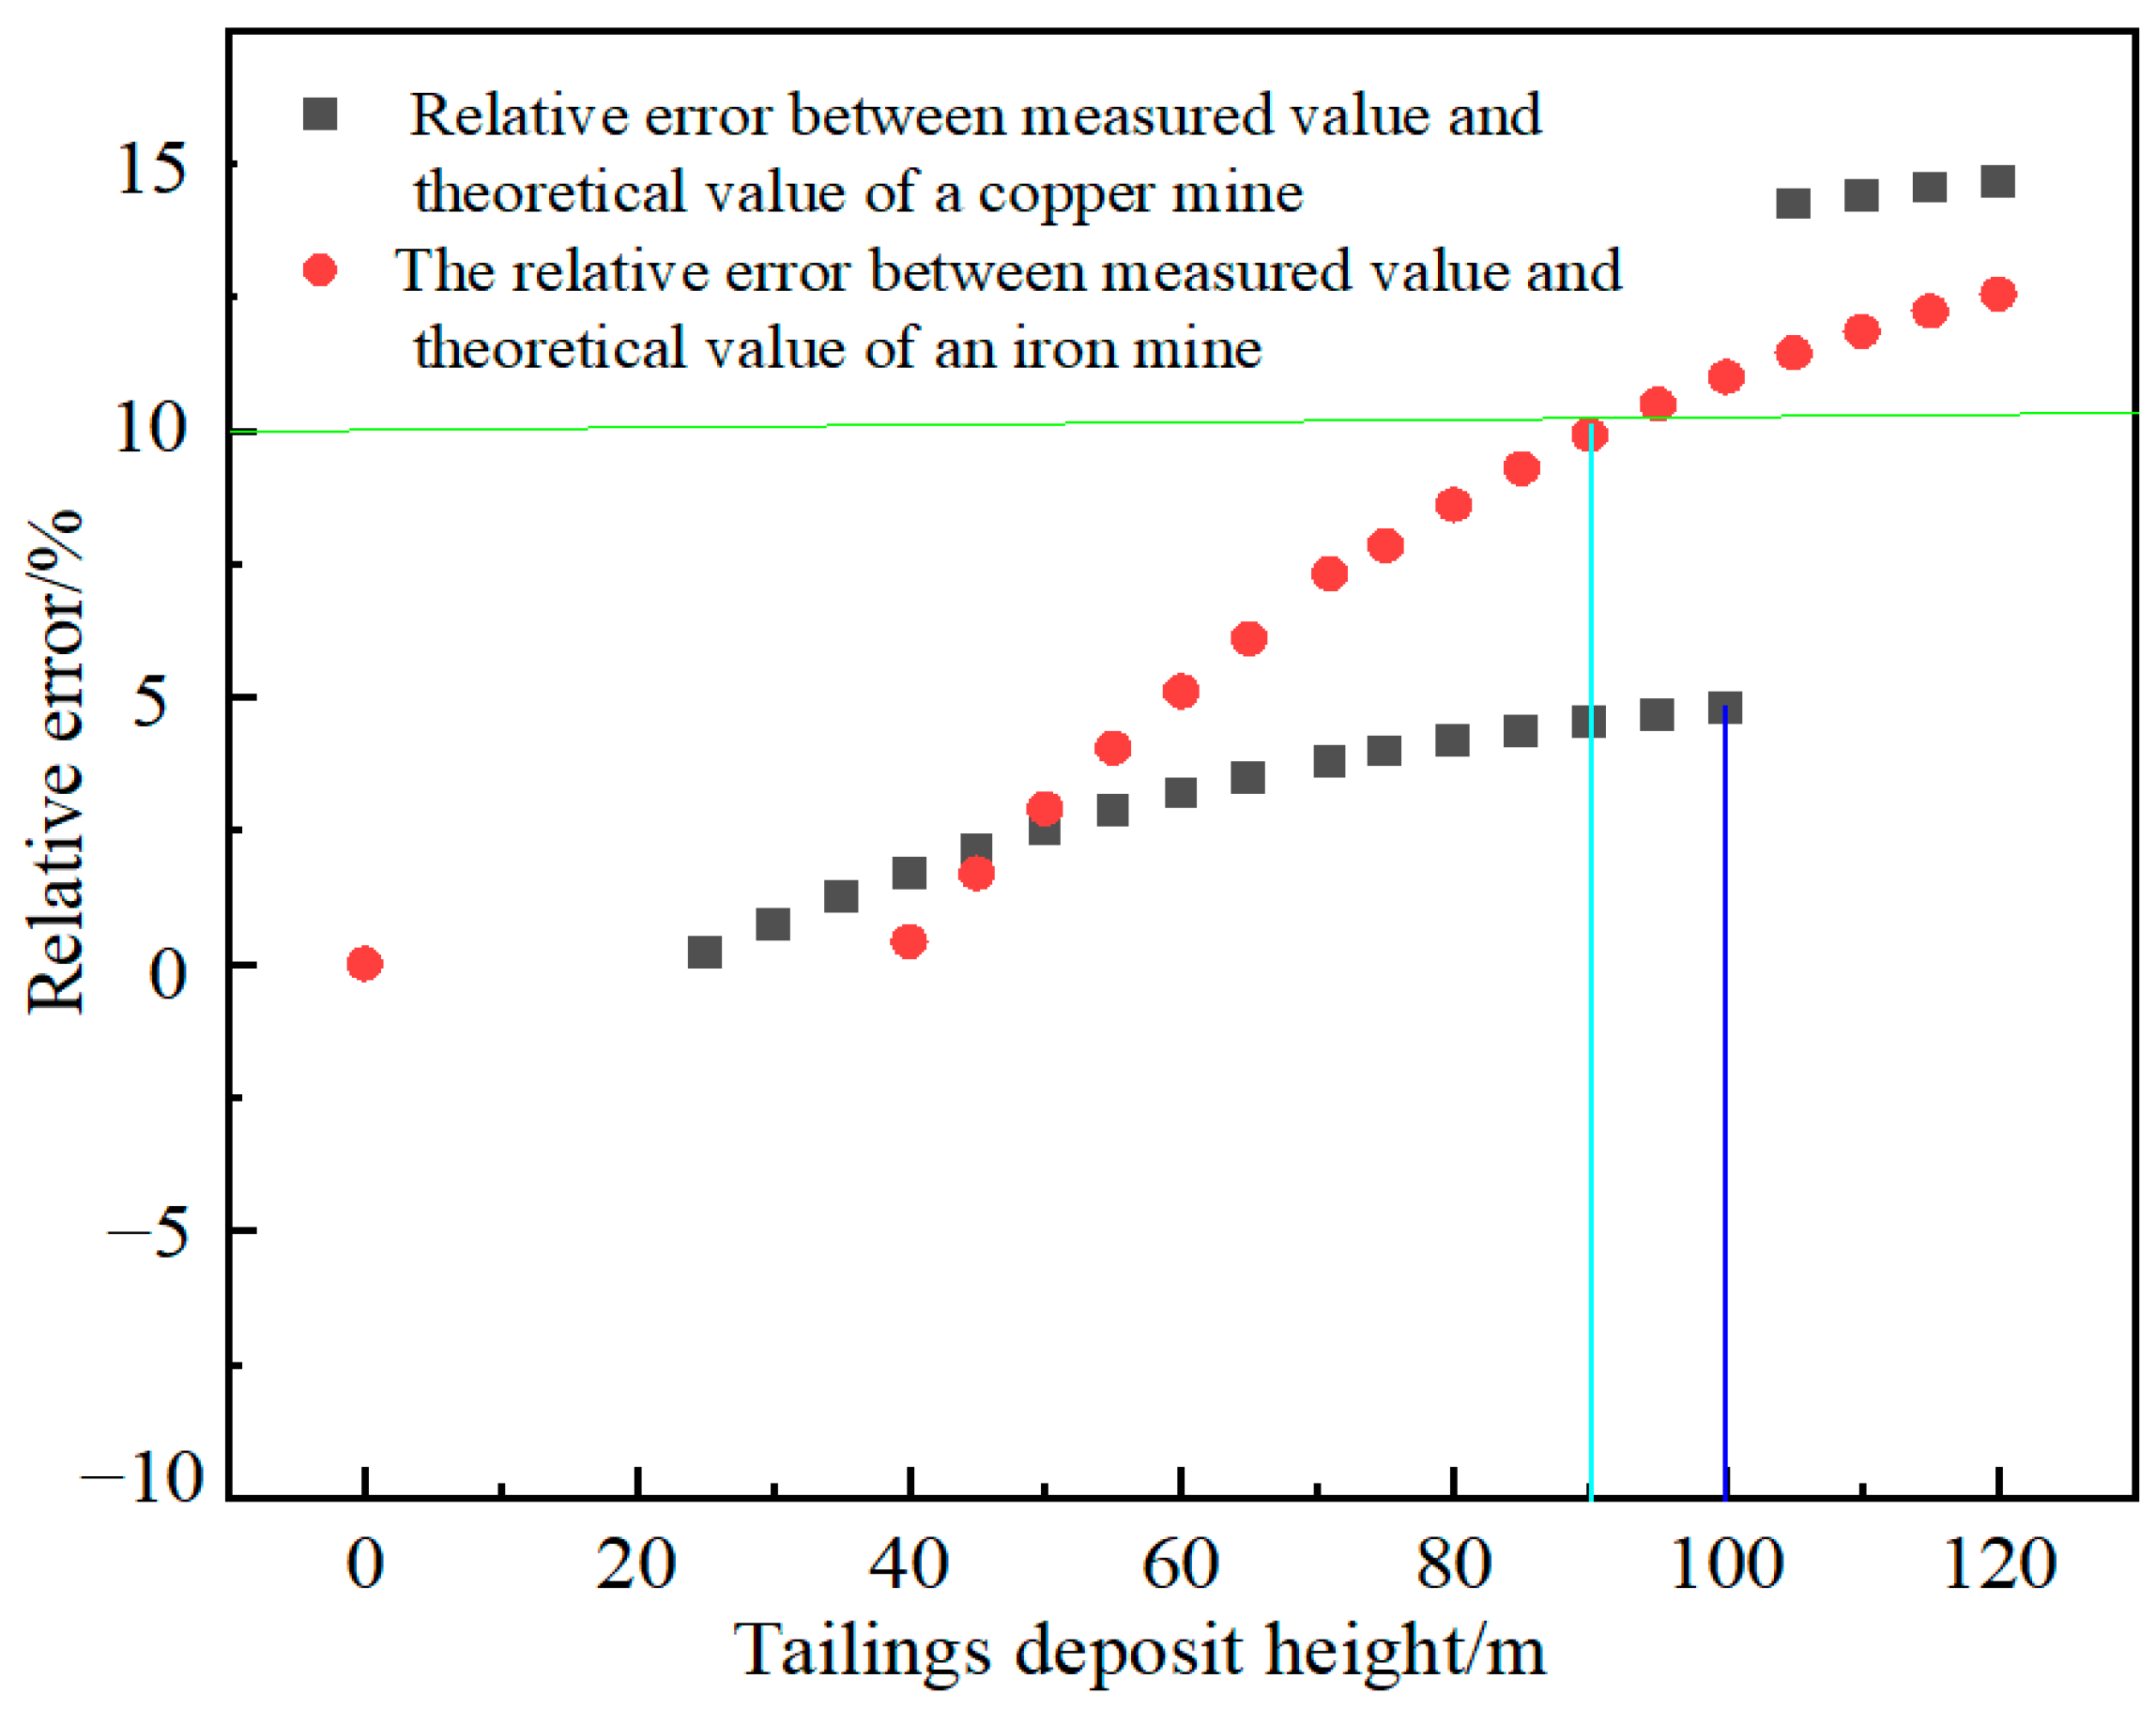
2.3.1. Mechanical Model Verification

An iron mine located in Anhui Province and a copper mine situated in Yunnan Province were utilized as case studies to validate the accuracy of the theoretical model [10,24]. The average thickness of an iron ore body is 85 m, and the dip angle of the ore body is about 20~30°. The surrounding rock is mainly composed of dolomitic limestone and sandy limestone. The uniaxial compressive strength of the surrounding rock is high and the stability is good, and the high-stage open-stope subsequent filling mining method is adopted. The stage height is 100 m, the section height is 25 m, and the width of the room and pillar is 20 m. The mining process involves a two-step approach, where the initial mining room is followed by filling operations. This entails a complete filling sequence that comprises slurry filling in the early stages and static maintenance during the middle stage. To monitor the stress evolution within the tailings deposit body throughout the entire filling operation, stope No. 26-1 ranging from −300 m to −400 m was selected as the designated test site. The concentration of filling slurry was 71%~72%, and the ratio of cement to tailings ranged from 1:10 to 1:12. The pressure monitors were installed at four levels: −400, −375, −350, −325 m, as presented in Figure 3a. A vibrating wire sensor of soil pressure with an accuracy of ±0.1% is utilized for the measurement of total stress in the tailings deposit body. The distributed data collector (MCU-32) was applied to real-time data acquisition and storage. Since Equation (16) was established with the research background of the underground tailings reservoir and there was no two-step mining, only the vertical stress collected in the tailings deposit body curing stage of the mine house was used to verify the proposed model.
The copper mine belongs to the submarine volcanic eruption sedimentary metamorphic medium-thick gently inclined deposit. The thickness of the ore body is 14~85 m, and the dip angle of the ore body is 20~35. The surrounding rock is mainly dolomite, and the rock is mostly hard and semi-hard rock with high compressive strength and good stability. The hydrogeological conditions of the mining area are dominated by weak fissure aquifer water filling, and the aquifer water volume is weak. The panel mining adopts the stage open stoping with subsequent filling method. The pillar is pre-extracted and subsequently backfilled. After the filling body has undergone the curing process, it is returned to the extraction room for subsequent tailings filling. The width, length, and height of the pillar are 11, 39.43, and 71 m, respectively. The industrial experiment primarily monitors the vertical stress of the filling body in the form of a pillar, with monitoring occurring during various stages including filling, curing, room extraction, and refilling. As presented in Figure 3b, the TGH pressure monitor, boasting an accuracy of 0.001 MPa, has been installed to acquire vertical stress data within the filling body at elevations of 385 and 350 m, synchronized with a GSJ-2A data collector. In order to correspond to the research object, only the data of the maintenance stage of the filling body of the pillar are quoted to verify the theoretical model.
The mechanical properties of the filling body and surrounding rock in the iron and copper mines are presented in Table 1. The parameters in Table 1 are incorporated in Equation (16) to calculate the vertical stress at various heights in the filling body. The relationship between vertical stress and the height of the filling body is shown in Figure 4. The findings suggest that the vertical stress exhibits a nonlinear increase as the filling body height increases. The rate of increase in vertical stress is higher for filling bodies with a height of 0–35 m, whereas it is slower for those exceeding 35 m. The vertical stress monitored during filling body curing in each mine is compared with the calculated value. The vertical stresses induced by the filling body of an iron mine at heights of 100, 75, 50, and 25 m are, respectively, calculated as 495, 487.37, 459.61, and 367.76 kPa, while the corresponding measured values are obtained as 550, 521, 467, and 382 kPa. The calculated values have a relative error of −3.66% to 11% compared to the measured values. The calculated vertical stress of the filling body in the copper mine at heights of 70.91 and 35 m is theoretically determined to be 500.9 and 421.21 kPa, respectively, while the measured values are found to be 522 and 420 kPa, respectively. The relative error between theoretical calculations and measurements is less than 4%. The above analysis results show that the theoretical model is in good agreement with the measured data.

2.3.2. Applicability Analysis of Mechanical Model

The model was verified by using the measured vertical stress of two mine filling stopes under closed conditions. It is not difficult to find that when the filling body height of a copper mine is 70.91 m, the relative error between the calculated value of the model and the measured value is less than 4%. When the filling height of an iron mine is 100 m, the relative error is between −3.66% and 11%. It can be inferred that the height of the filling body has a significant effect on the model error. In order to quantitatively analyze the variation law of the relative error between the measured value and the calculated value of the model with height, based on the measured data of the two mines, the empirical equations of the measured value with height are obtained by fitting, as shown in Figure 4. Through the fitting equation and the theoretical model, the relative error between the calculated value and the measured value of the filling height of the two mines at any height of 0~120 m can be calculated, as shown in Figure 5. The results show that for a copper mine, the filling height is between 0 and 100 m, and the relative error between the theoretical value and the measured value is between −2.03% and 4.78%. When the filling height is between 105 m and 120 m, the relative error is between 14.24% and 14.67%, and the relative error increases suddenly. Taking the relative error less than 10% as the evaluation index, when the filling height is not more than 100 m, the model calculation is more reliable. For an iron mine, when the filling height is between 0 and 90 m, the relative error between the theoretical value and the measured value is between −6.93% and 9.92%. When the height before filling is 95 m~120 m, the relative error between the theoretical value and the measured value is between 10.49% and 12.56%. Similarly, when the relative error is not more than 10% and the filling height is not more than 90 m, the model calculation is more reliable. In summary, the relative error between the theoretical value and the measured value increases with the increase in filling height. Therefore, when the model derived in this paper is used to design the strength of the storage body, when the height of the storage body is less than 90 m, the model constructed in this paper is reliable.

3. Discussions

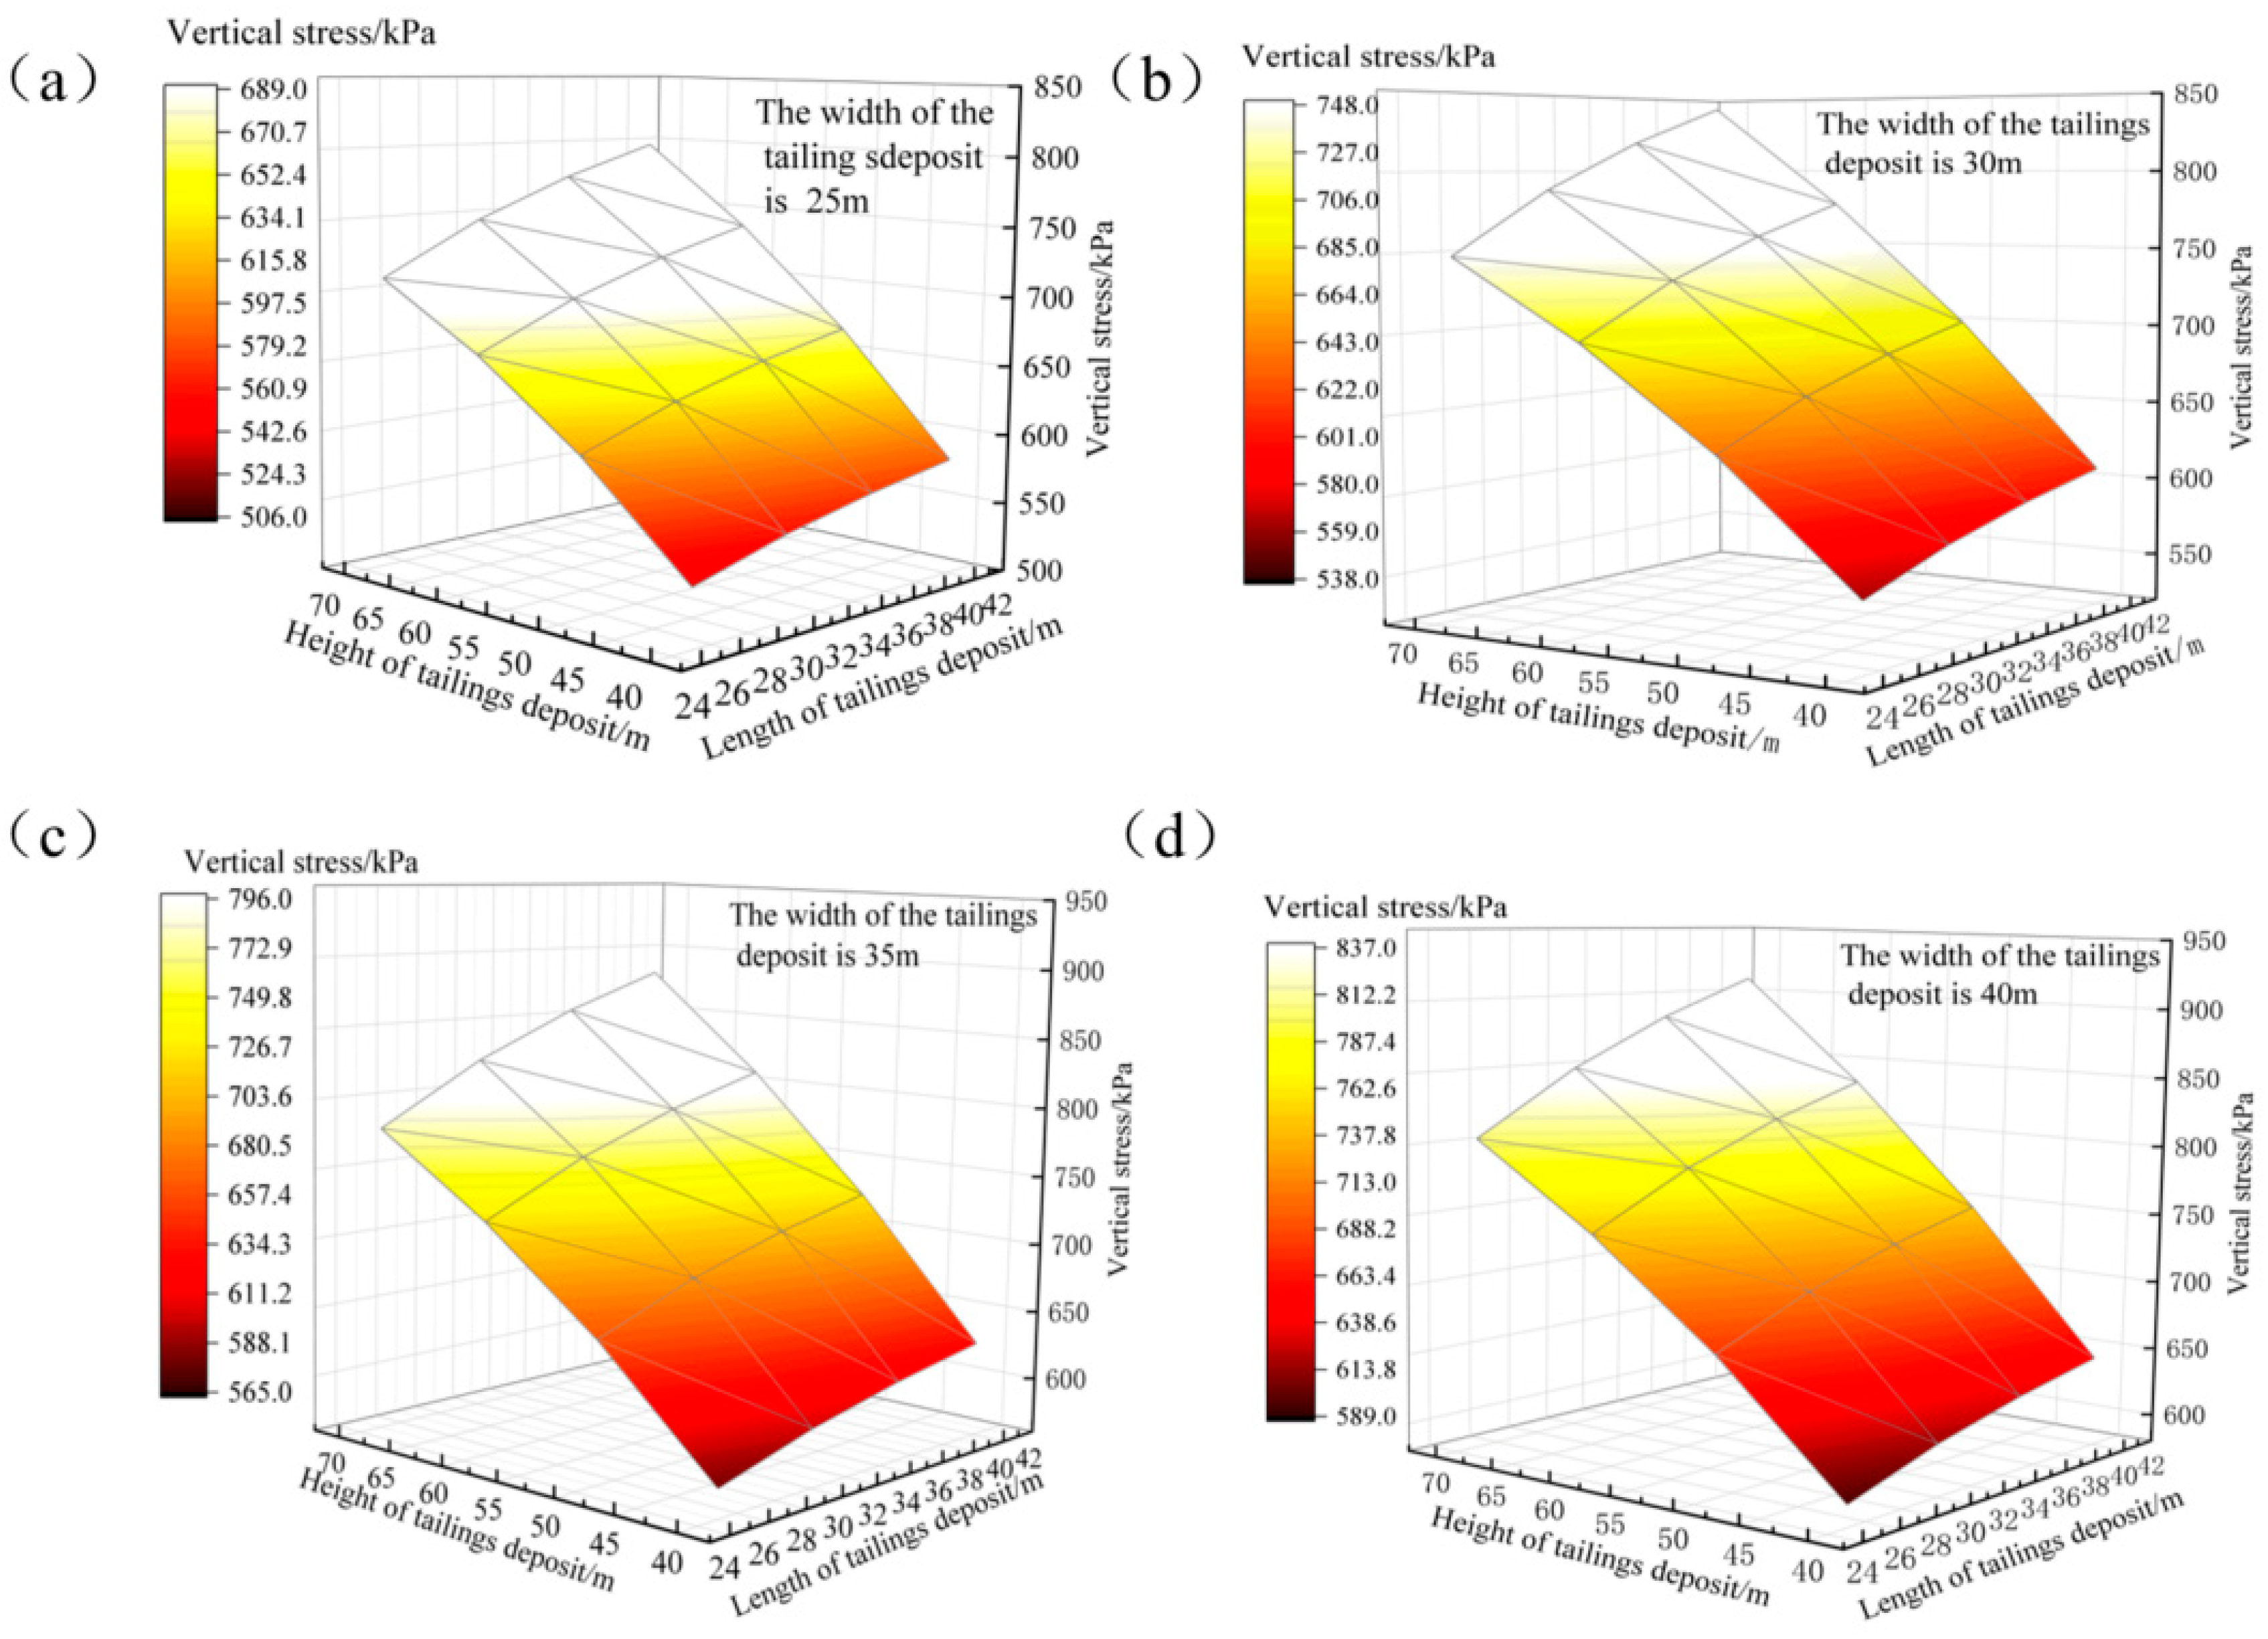
3.1. Effect of Tailings Deposit Body Geometry on Vertical Stress

We analyze the variation law of vertical stress in the tailings deposit body under the effect of tailings deposit body geometry. Taking a lead–zinc mine in Guangdong as an example, the construction site of the tailings reservoir selected by the mine has good stability of the surrounding rock and no large joint fissure distribution. The lateral exposed area of the surrounding rock is 3000~4000 m2, and the exposed area of the roof is 1600~2000 m2. By the engineering analogy method, it is assumed that the length and width of the tailings pond are designed to be 25, 30, 35, and 40 m, and the height of the tailings deposit body is designed to be 40, 50, 60, and 70 m. The experiment is designed according to the total experimental design theory, as presented in Table 2. The mechanical parameters of the tailings deposit body and surrounding rock are listed in Table 3. The vertical stress is calculated using Equation (16) and the results are shown in Figure 6.

3.1.1. Effect of Length on Vertical Stress

With the height and width of the tailings deposit body held constant, an analysis is conducted on how varying lengths affect the vertical stress at its base. As presented in Figure 6a, the width and height of the tailings deposit body are 25 and 40 m, respectively. When the length increases from 25 to 30 m, the vertical stress at its base increases from 541.14 to 559.54 kPa with a rate of increase of 3.68 kPa/m. When the length of the tailings deposit body increases from 30 to 35 m, the vertical stress at the base increases from 559.54 to 573.22 kPa with a rate of increase of 2.736 kPa/m. As the length increases from 35 to 40 m, the bottom vertical stress increases from 573.22 to 583.80 kPa with an increase rate of 2.12 kPa/m. With the increase in length of the tailings deposit body, the vertical stress at the base increases with a decreasing rate of growth. The patterns of change depicted in Figure 6a–c are identical. The primary reason is that an increase in the length of the tailings deposit body leads to a larger contact area between the tailings deposit body and side surrounding rock, resulting in increased frictional resistance between them. This ultimately causes less obvious vertical stress at the bottom of the tailings deposit body.

3.1.2. Effect of Width on Vertical Stress

The effect of the width of the tailings deposit body on vertical stress was analyzed, assuming the height and length of the tailings deposit body are constant. As presented in Figure 6, the height and length of the tailings deposit body are 40 and 25 m, respectively. As the width increases from 25 to 30 m, the vertical stress at the base of the tailings deposit body increases from 541.14 to 563.12 kPa, with an increase rate of 4.396 kPa/m. When the width increases from 30 to 35 m, the bottom vertical stress increases from 563.12 to 580.77 kPa with an increase rate of 3.52 kPa/m. As the width increases from 35 to 40 m, the bottom vertical stress increases from 580.77 to 595.56 kPa with an increase rate of 2.96 kPa. In summary, the vertical stress at the base of the tailings deposit body increases with a decreasing growth rate as the width increases. This is because the increase in width of the tailings deposit body leads to an increase in the friction resistance between the tailings deposit body and surrounding rock. Meanwhile, as the width increases, the radius between the tailings deposit body and surrounding rock also increases, resulting in a slight increase in vertical stress.

3.1.3. Effect of Height on Vertical Stress

The effect of height on vertical stress was analyzed, assuming the height and width of the tailings deposit body are constant. As presented in Figure 6a, the width and length of the tailings deposit body are selected as 25 and 25 m, respectively. When the height of the tailings deposit body increases from 40 to 50 m, the vertical stress at the base increases from 541.12 to 610.29 kPa with an increasing rate of 6.915 kPa/m. As the height increases from 50 to 60 m, the vertical stress increases from 610.29 to 665.43 kPa with an increasing rate of 5.512 kPa/m. When the height increases from 60 to 70 m, the vertical stress increases from 665.43 to 709.38 kPa with an increasing rate of 4.395 kPa/m. With the increase in height of the tailings deposit body, the vertical stress at its base increases with a decreasing growth rate. The main reason is that the increase in height of the tailings deposit body leads to a higher friction resistance between the tailings deposit body and surrounding rock. Meanwhile, the weight of the tailings deposit body increases with a significantly larger growth rate than friction resistance. Therefore, the vertical stress is most significantly affected by the height of the tailings deposit body, followed by its width and then length. Therefore, in the process of constructing a tailings reservoir, it is advisable to increase the length and width of the underground tailings deposit body as much as possible under the conditions of the surrounding rock to enhance tailings storage capacity.

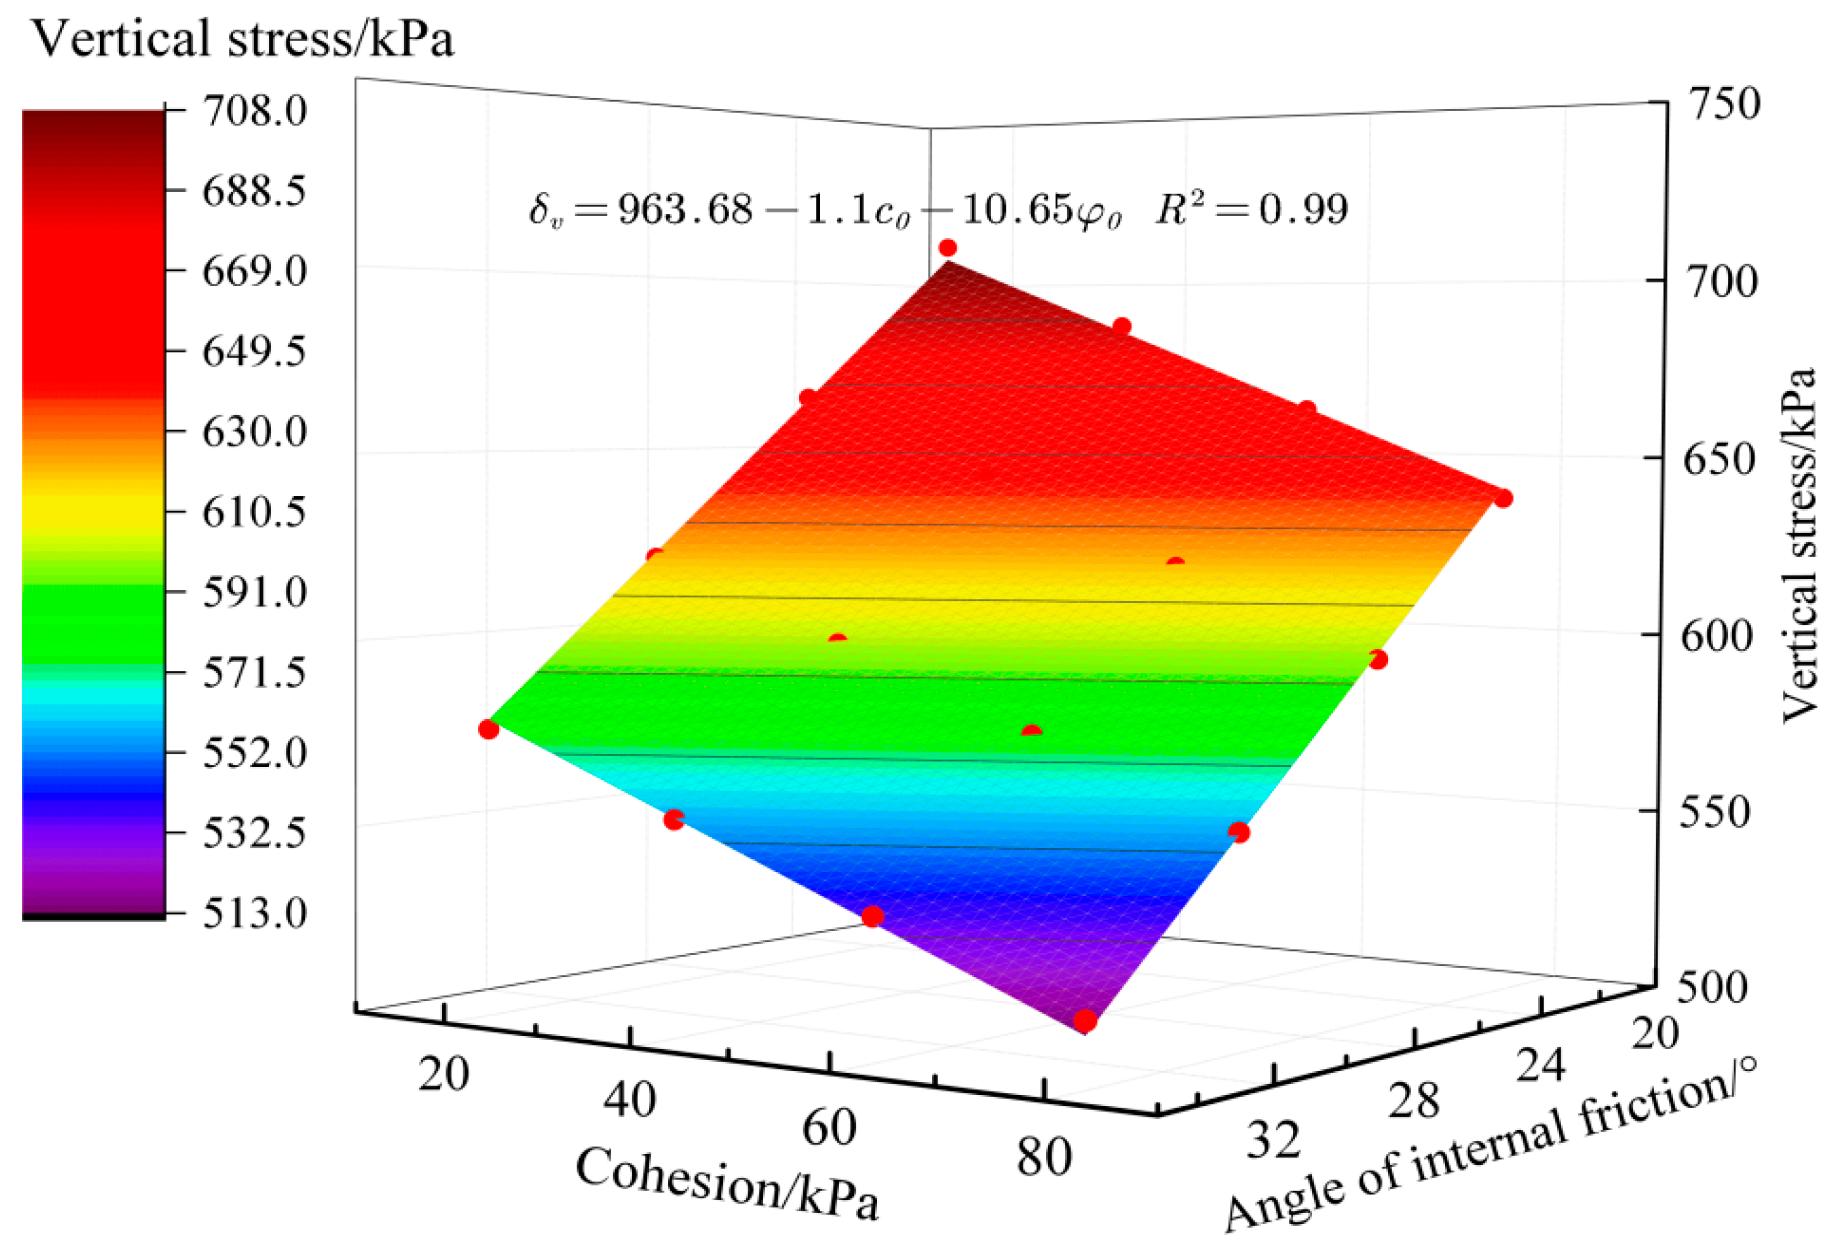
3.2. Effect of Mechanical Parameters on Vertical Stress

According to the mechanical model of the tailings deposit body, the vertical stress in the tailings deposit body is related with not only geometry, but also cohesive force  c 0  and internal friction angle  φ 0 . To investigate the effect of these two mechanical parameters on vertical stress, assume the length, width, and height are 30, 30, and 50 m, respectively. The mechanical parameters of the surrounding rock are presented in Table 3. Taking a lead–zinc mine in Guangdong as an example, the overflow tailings are used as the research object. The cement–sand ratio is designed to be 1/6~1/31, the slurry mass concentration is 60%, and the curing time is 28 d. The results of the triaxial test show that the cohesion is between 5.25 kPa and 106 kPa, and the internal friction angle is between 18° and 35°. Therefore, it is assumed that the cohesive forces are 20, 40, 60, and 80 kPa, respectively. The internal friction angles are 22, 26, 30, and 34°, respectively. The experiment is designed according to the total experimental design method, as shown in Table 4. Assuming the height of the tailings deposit body is 50 m, the vertical stresses at various cohesive forces and internal friction angles are calculated using Equation (16) and the results are presented in Figure 7.
As plotted in Figure 7, the vertical stress is linearly related with internal friction angle or cohesive force. With the increase in cohesive force and internal friction angle, vertical stress gradually decreases. Assuming the internal friction angle is equal to 22°, the vertical stress decreases from 710.98 to 665.05 kPa when the cohesive force increases from 20 to 80 kPa. When the cohesive force is equal to 20 kPa, the vertical stress decreases from 710.98 to 576.8 kPa, at which time the internal friction angle increases from 22 to 34°. To sum up, the internal friction angle and cohesive force lead to the decrease in vertical stress in the tailings deposit body. Moreover, the effect of internal friction angle on vertical stress is more significant. When the internal friction angle and cohesive force increase, the internal friction angle and cohesive force correspondingly increase, leading to the increase in friction resistance between the tailings deposit body and surrounding rock [25,26]. A larger internal friction angle leads to a stronger arch effect, indicating a more significant decrease in vertical stress [27]. The internal friction angle of the tailings deposit body is related with curing condition, curing time, and binder type. Selecting appropriate cementing materials and implementing a discontinuous filling operation are essential to ensure sufficient curing time for the tailings deposit body.

4. Engineering Application

A lead–zinc mine in Guangdong Province, China, is selected as the object of study. The mine plans to close its surface tailings reservoir. The −500 m~−450 m middle section of the Shilingnan section of the mining area is used as the site selection of the underground tailings reservoir. The site selection area is far away from the main ore body. The ore body distribution is dominated by sporadic small ore bodies, and the ore body dip angle is about 20°. The surrounding rock is mainly dolomite and limestone, and there is no fault. The joint fissure development of the rock mass is not obvious, the integrity of the rock mass is good, and there is no obvious water gushing phenomenon. Through the rock mechanics test, the results show that the uniaxial compressive strength is 80~120 MPa, which belongs to the stable rock mass. In this area, scattered small ore bodies are mined, and waste rocks are mined at the same time. The mined waste rocks are used as building materials. The ultra-fine tailings originally discharged to the surface tailings reservoir are discharged to the underground tailings reservoir generated by mining waste rock. According to the properties of the surrounding rock, the engineering analogy method is adopted, and the length, width, and height are 30, 30, and 50 m.
In order to withdraw from the surface tailings reservoir, tailings dehydration and concentration are the key. The process flow of hydrocyclone filter press deep cone thickening is adopted in the mine, and the tailings disposal process flow is shown in Figure 8. The φ24 m ordinary thickener is used to thicken all the tailings, and the underflow tailings enter the hydrocyclone for grading treatment. The underflow of the hydrocyclone is filtered to form a graded tailings filter cake (water content is about 10%). The overflow ultra-fine tailings of the ordinary thickener and the overflow tailings of the hydrocyclone are all concentrated in the φ24 m deep cone thickener, and the underflow mass concentration is about 60%. A part of the underflow tailings of the deep cone thickener is cemented and filled by mixing with the graded tailings, and a part is stored in the underground tailings pond by adding a small amount of cementing material.

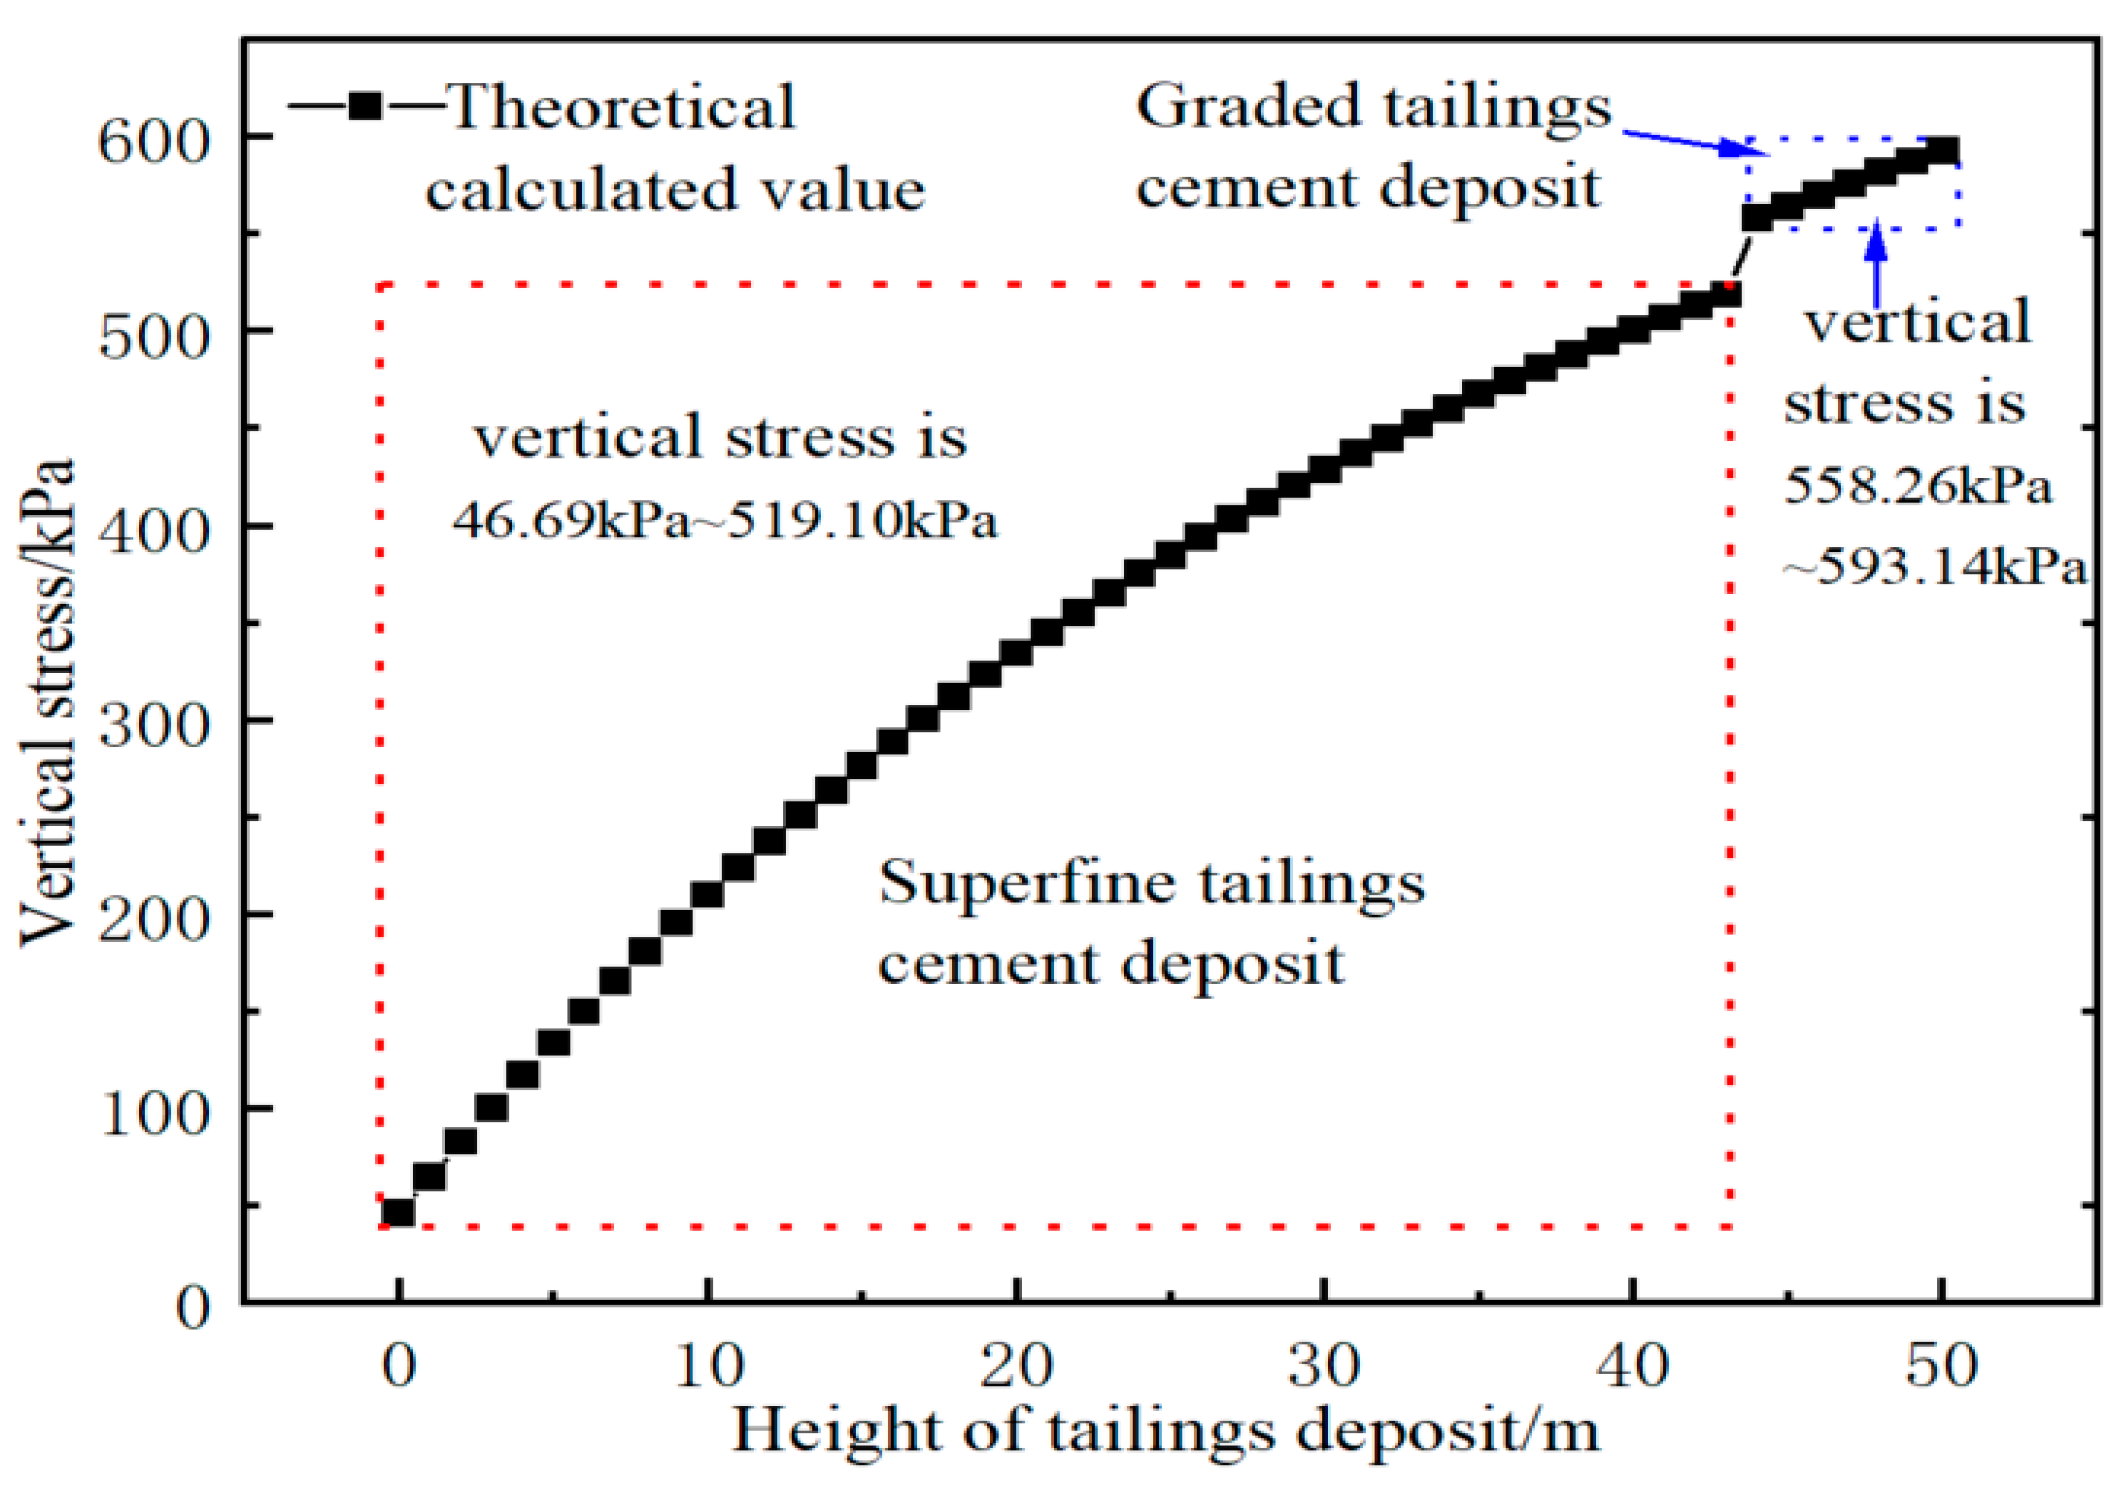
4.1. Strength Verification of the Tailings Deposit Body

The first layer with a height of 6 m in the tailings deposit body is filled using cemented classified tailings with a ratio of cement to tailings of 1:3 and a mass solid fraction of 76%. The remaining area is filled by cemented superfine tailings with a ratio of cement to tailings of 1:6 and a mass solid fraction of 60%. The uniaxial compressive strength (UCS) at 28 d and other parameters are listed in Table 5.
The calculated vertical stress using Equation (16) for the two kinds of filling materials are plotted in Figure 9. When the height of the tailings deposit body ranges from 44 to 50 m, cemented classified tailings are deposited with a vertical stress ranging from 558.26 to 593.14 kPa. The 28d UCS of the classified tailings deposit body is 11.1 MPa, which is remarkably larger than the theoretical value. When the height of the tailings deposit body ranges from 0 to 44 m, the cemented superfine tailings are deposited with a vertical stress ranging from 46.69 to 519.1 kPa and a 28d UCS of 0.771 MPa. The measured value of UCS is significantly larger than the theoretical value. Therefore, it is necessary to optimize the properties of the tailings deposit body to cut the deposit cost.

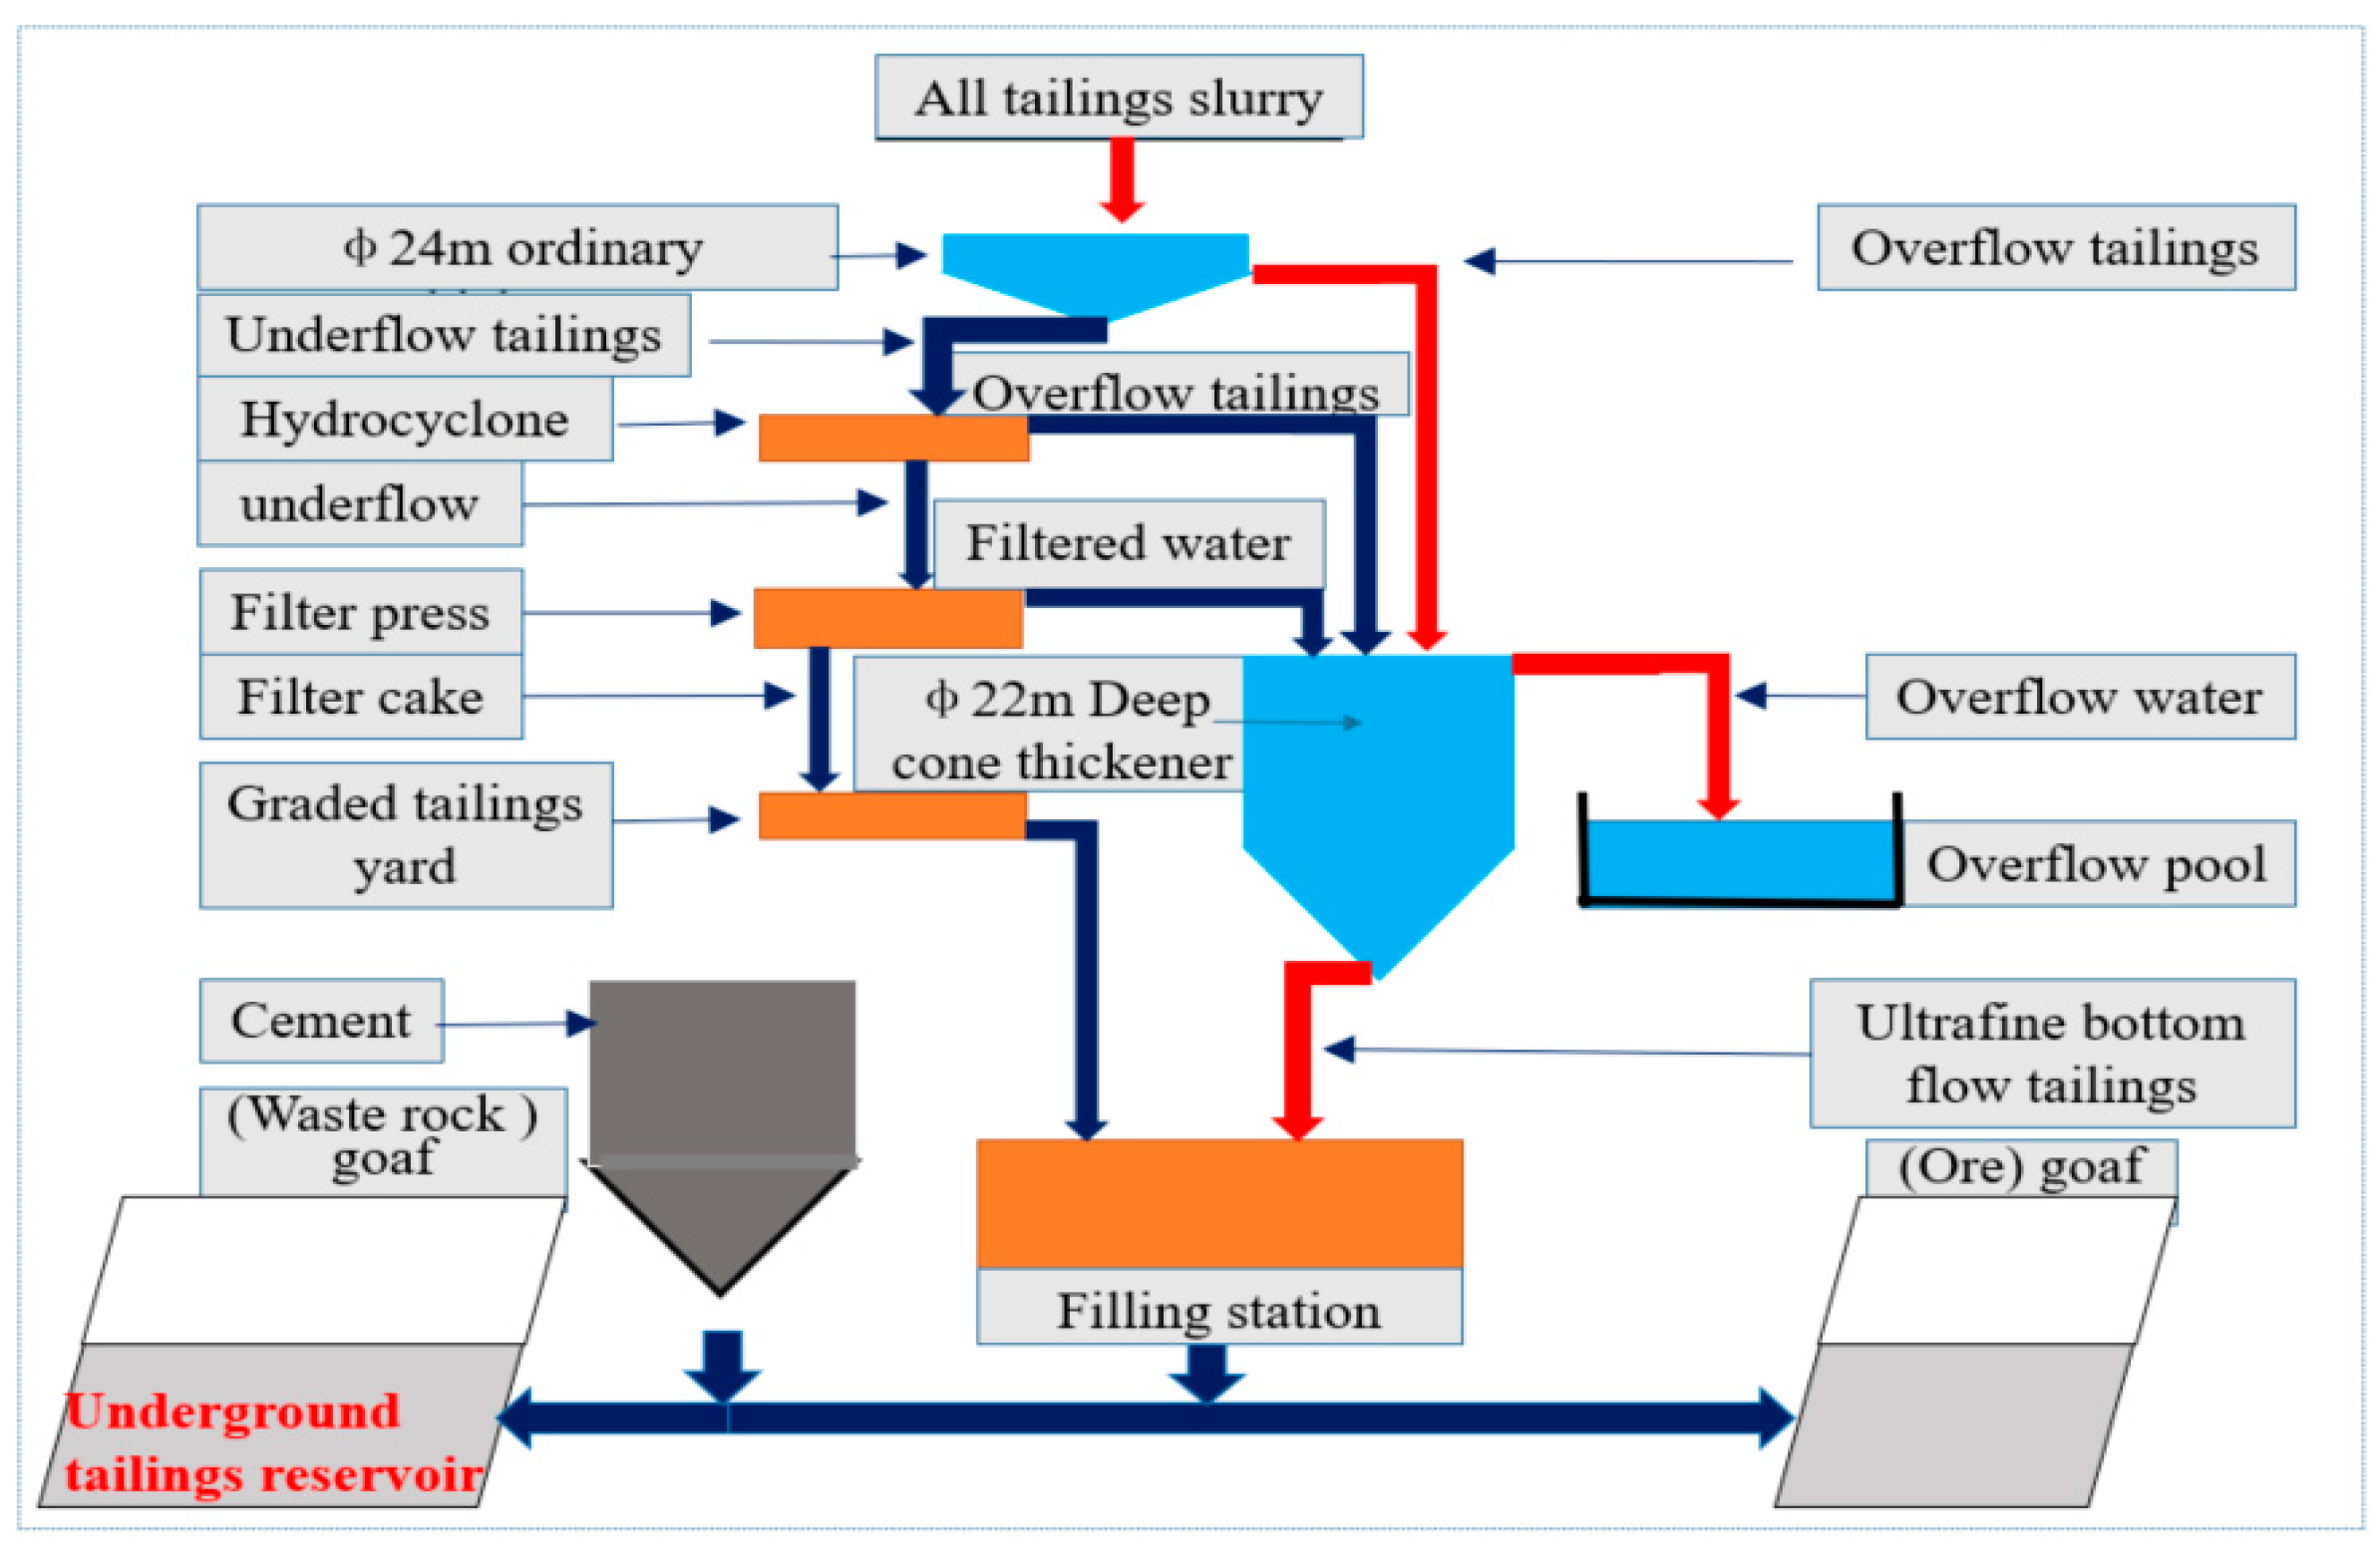
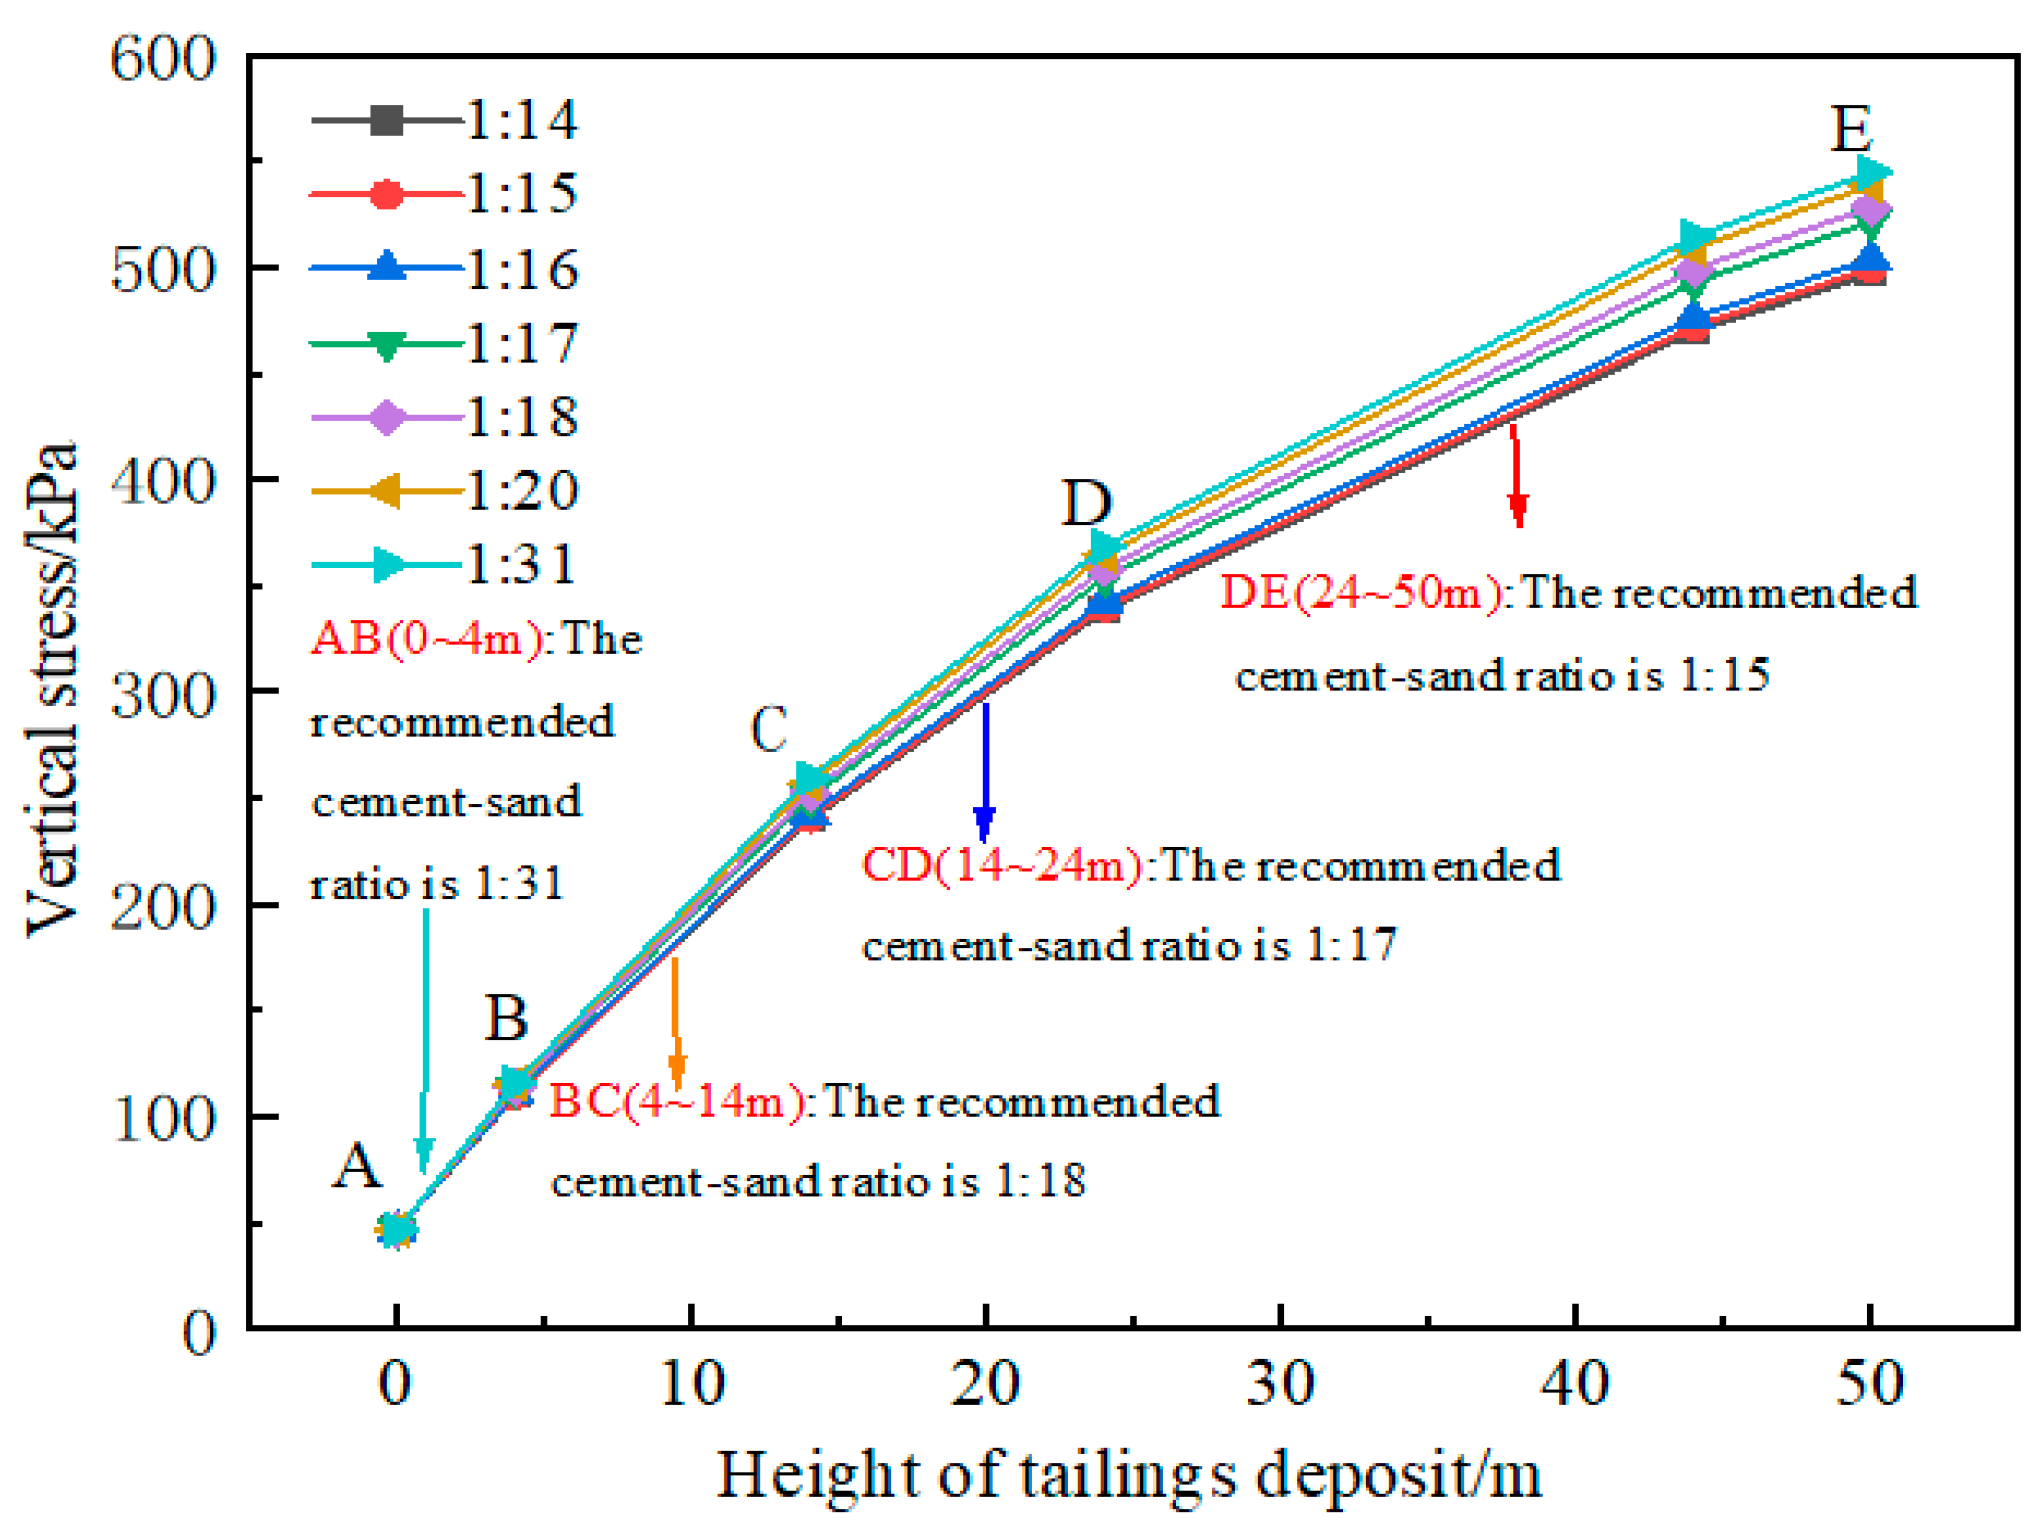
4.2. Property Optimization of Tailings Deposit Body

To optimize the strength of the tailings deposit body, unconfined compressive strength and triaxial undrained shear tests were carried out. The mass solid fraction of the slurry is 60%. The ratios of cement to tailings (c/t ratio) are 1:14, 1:15, 1:16, 1:17, 1:18, 1:20, and 1:31. The specimen is a cylindrical shape with a diameter of 50 mm and a height of 100 mm. The sample is cured for 28 d and the results are presented in Table 6.
The mechanical parameters in Table 6 are applied in Equation (16) to calculate the vertical stresses at various c/t ratios; see Figure 9. As c/t ratio increases, the vertical stress gradually decreases due to the increasing cohesive force and internal friction angle. The vertical stress increases faster at the height of 0–24 m and slower at the height of 24–50 m, which may be caused by the internal arch effect of the filling body. The greater the c/t ratio is, the more obvious the arch effect will be. By comparing the vertical stress distribution and uniaxial compressive strength in the vertical direction, the uniaxial compressive strength is greater than the vertical stress to meet the safety requirements. Combining Figure 9 and Figure 10, it is recommended that the c/t ratio be 1:31 for heights ranging from 0 to 4 m, 1:18 for heights of 4~14 m, 1:17 for heights of 14~24 m, and 1:15 for heights of 24~50 m.

4.3. Underground Tailings Deposit Cost Analysis

The cement consumptions using various deposit methods are presented in Table 7. The original deposit method has a cement dosage of 184.36 kg/m3. The cement dosage of the optimized deposit method is 56.96 kg/m3. The local cement price is USD 60 per ton, and according to the structural parameters of the tailings reservoir (30 m × 30 m × 50 m), the cost savings of a single tailings reservoir can be USD 344,800. According to the balance of mining and deposit, all the tailings discharged to the surface tailings reservoir will be deposited into the underground tailings reservoir. About four underground tailings reservoirs of the same specifications need to be dug every year to achieve zero surface tailings deposition, and the calculated annual cost saving is USD 1,379,200. Meanwhile, through the optimal deposit method design, the classified tailings deposit in the first layer of the original scheme is changed to a fine tailings deposit. Each underground tailings reservoir can increase the fine tailings processing capacity by 5600 m3, and the annual processing capacity is 21,600 m3. Therefore, the strength model proposed in this paper not only meets the safety requirements of the tailings deposit, but also achieves the purpose of reducing cost, saving energy, and reducing surface deposits.

5. Conclusions

Based on the stress model of the stockpiling body, this paper establishes a strength mechanical model suitable for the closed state stockpiling body. The measured data of the filling and maintenance stage of two mines are used to verify it, and the key influencing factors of the model are analyzed. Finally, a lead–zinc mine is taken as an example to optimize the mine stockpiling ratio parameters. The relevant conclusions are as follows:
(1)
A mechanical model for the tailings deposit body in an underground tailings reservoir was proposed, considering the structural parameters and mechanical properties of the tailings deposit body.
(2)
The measured vertical stresses in two mines were utilized in the comparison with the theoretical values determined by the model proposed in this work. The results indicate that the deviation between the two is less than 11%. The relative error increases with the change in the height of the deposit. Taking the relative error of 10% as the evaluation index, when using this model to design the storage body, the height of the storage body is not more than 90 m.
(3)
The effects of structural parameters (length, width, and height) of the tailings deposit body were discussed. The effect of height on vertical stress is the most significant. As the height increases, the vertical stress increases with a decreasing growth rate. The effects of mechanical parameters on vertical stress were also investigated. Vertical stress decreases when the cohesive force and internal friction angle increase.
(4)
A lead–zinc mine was used as a case to analyze the vertical stress distribution in the tailings deposit body. Taking uniaxial compressive strength greater than vertical stress as the assessment index, the original tailings deposit method is optimized. The optimized deposit method could save USD 1,379,200 and increase fine tailings processing capacity to 21,600 m3 per year. The strength model proposed in this paper can satisfy the safety requirements and reduce the cost of underground tailings deposits.
In the use of underground mining waste rock as a building material, the tailings discharged to the tailings pond are discharged to the empty area generated by mining waste rock (building an underground tailings pond). This method is a win-win technical scheme for mines, which can effectively ensure the withdrawal of the surface tailings pond. The establishment of the mechanical model provides a theoretical basis for the strength design of the cemented deposit of the underground tailings reservoir and lays the foundation for the construction of a tailings-free mine and energy savings and emission reductions of the mine.

Author Contributions

X.Z.: Writing—original draft, Data curation, Investigation, Methodology, Formal analysis, Visualization; H.W.: Writing—review and editing, Conceptualization, Resources, Funding acquisition; L.Y.: Writing—review and editing, Conceptualization, Resources, Visualization; T.A.B.: Formal analysis, Conceptualization. All authors have read and agreed to the published version of the manuscript.

Funding

This research was supported by the National Natural Science Foundation of China (no. 51834001 and 52104129).

Data Availability Statement

Data files are not available due to privacy.

Conflicts of Interest

The authors declare no conflict of interest.

References

  1. Gao, T.; Sun, W.; Li, Z.Y.; Fan, K.; Jiang, M.G.; Cheng, H.Y. Study on Shear Characteristics and Failure Mechanism of Inclined Layered Backfill in Mining Solid Waste Utilization. Minerals 2022, 12, 1540. [Google Scholar] [CrossRef]
  2. Wang, H.; Wang, X.; Wu, A.; Peng, Q. A wall slip pressure gradient model of unclassified tailings paste in pipe flow: Theoretical and loop test study. J. Non-Newtonian Fluid Mech. 2021, 298, 104691. [Google Scholar] [CrossRef]
  3. Yang, L.H.; Li, J.C.; Jiao, H.Z.; Wu, A.; Yin, S. Research on the Homogenization Evaluation of Cemented Paste Backfill in the Preparation Process Based on Image Texture Features. Minerals 2022, 12, 1622. [Google Scholar] [CrossRef]
  4. Pullum, L.; Boger, D.V.; Sofra, F. Hydraulic mineral waste transport and storage. Annu. Rev. Fluid Mech. 2018, 50, 157–185. [Google Scholar] [CrossRef]
  5. Ponsot, I.; Bernardo, E. Self glazed glass ceramic foams from metallurgical slag and recycled glass. J. Clean Prod. 2013, 59, 245–250. [Google Scholar] [CrossRef]
  6. Shettima, A.U.; Hussin, M.W.; Ahmad, Y.; Mirza, J. Evaluation of iron ore tailings as replacement for fine aggregate in concrete. Constr. Build. Mater. 2016, 120, 72–79. [Google Scholar] [CrossRef]
  7. Yang, L.H.; Jia, H.W.; Jiao, H.Z.; Dong, M.M.; Yang, T. The Mechanism of Viscosity-Enhancing Admixture in Backfill Slurry and the Evolution of Its Rheological Properties. Minerals 2023, 13, 1045. [Google Scholar] [CrossRef]
  8. Da Silva Souza, T.; da Silva Figueira Barone, L.; Lacerda, D.; Vergilio, C.D.S.; de Oliveira, B.C.V.; de Almeida, M.G.; Thompson, F.; de Rezende, C.E. Cytogenotoxicity of the water and sediment of the Paraopeba River immediately after the iron ore mining dam disaster (Brumadinho, Minas Gerais, Brazil). Sci. Total Environ. 2021, 775, 145193. [Google Scholar] [CrossRef]
  9. Wu, A.X.; Jiao, H.Z.; Wang, H.J.; Yang, S.K.; Li, L.F.; Yan, Q.W.; Liu, H.J. Status and development trends of paste disposal technology with ultra-fine unclassified tailings in China. In Proceedings of the 14th International Seminar on Paste and Thickened Tailings, Australian Centre for Geomechanics, Perth, Australia, 5–7 April 2011; pp. 477–489. [Google Scholar]
  10. Wang, J.; Zhang, C.; Fu, J.; Song, W.; Zhang, Y. Effect of water saturation on mechanical characteristics and damage behavior of cemented paste backfill. J. Mater. Res. Technol. 2021, 15, 6624–6639. [Google Scholar] [CrossRef]
  11. Akkaya, U.G.; Cinku, K.; Yilmaz, E. Characterization of strength and quality of cemented mine backfill made up of lead-zinc processing tailings. Front. Mater. 2021, 8, 740116. [Google Scholar] [CrossRef]
  12. Kong, L.; Li, X.; Tian, H. Effect of fines content on permeability coefficient of sand and its correlation with state parameters. Rock Soil Mech. 2011, 32, 21–26. [Google Scholar]
  13. Terzaghi, K. Theoretical Soil Mechanics; Wiley & Sons: New York, NY, USA, 1943. [Google Scholar]
  14. Thomas, E.G. Fill Technology in Underground Metalliferous Mines; Australian Mineral Foundation: Glenside, ON, Australia, 1976. [Google Scholar]
  15. Yang, Z.; Zhai, S.; Gao, Q.; Li, M. Stability analysis of large-scale stope using stage subsequent filling mining method in Sijiaying iron mine. J. Rock Mech. Geotech. 2015, 7, 87–94. [Google Scholar] [CrossRef]
  16. Mitchell, R.J. Model studies on the stability of confined fills. Can. Geotech. J. 1989, 26, 210–216. [Google Scholar] [CrossRef]
  17. Wang, R.; Zeng, F.; Li, L. Stability analyses of side-exposed backfill considering mine depth and extraction of adjacent stope. Int. J. Rock Mech. Min. Sci. 2021, 142, 104735. [Google Scholar] [CrossRef]
  18. Kamash, W.E.; Naggar, H.E.; Nagaratnam, S. Novel adaptation of Marston’s stress solution for inclined backfilled stopes. Alex. Eng. J. 2022, 61, 8221–8239. [Google Scholar] [CrossRef]
  19. Marston, A. The Theory of External Loads on Closed Conduits in the Light of the Latest Experiments; Iowa State College: Ames, IA, USA, 1930. [Google Scholar]
  20. Wang, J.; Qiao, D.; Li, G.; Sun, H.; Tong, R. Dead weight compression model and application of tailings filling body in large goaf. Rock Soil Mech. 2016, 37, 403–409. [Google Scholar] [CrossRef]
  21. Liu, G.; Yang, X.; Guo, L. Models of three-dimensional arching stress and strength requirement for the backfill in open stoping with subsequent backfill mining. J. China Coal Soc. 2019, 44, 1391–1403. [Google Scholar] [CrossRef]
  22. Chen, D.; Chen, J.; Zavokni, Z.M. Stability analysis of sublevel open stopes at great depth. In Proceedings of the 24th U.S. Symposium on Rock Mechanics (USRMS), College Station, TX, USA, 20–23 June 1983. [Google Scholar]
  23. Tesarik, D.R.; Seymour, J.B.; Yanske, T.R. Long-term stability of a backfilled room-and-pillar test section at the Buick Mine, Missouri, USA. Int. J. Rock Mech. Min. Sci. 2009, 46, 1182–1196. [Google Scholar] [CrossRef]
  24. Wei, X.; Guo, L.; Zhou, X.; Li, C.; Zhang, L. Full sequence stress evolution law and prediction model of high stage cemented backfill. Rock Soil Mech. 2020, 41, 3613–3620. [Google Scholar] [CrossRef]
  25. Tikou, B.; Benzaazoua, M.; Bussière, B. Mechanical behaviour of cemented paste backfill. In Proceedings of the 53rd Canadian Geotechnical Conference, Montreal, QC, USA, 15–18 October 2000; Volume 1. [Google Scholar]
  26. Wang, J.; Zhang, H.; Tang, S.; Liang, Y. Effects of particle size distribution on shear strength of accumulation soil. J. Geotech. Geoenviron. Eng. 2013, 139, 1994–1997. [Google Scholar] [CrossRef]
  27. Yan, B.; Zhu, W.; Hou, C.; Jia, H. A Comparative Study on the Stress Distribution in Mine Backfill Through Theoretical and Numerical Analysis. J. Northeast. Univ. Nat. Sci. 2019, 40, 1773–1778. [Google Scholar] [CrossRef]
Figure 1. Schematic of underground tailings reservoir.
Minerals 13 01377 g001
Figure 2. (a) Mechanical analysis schematic of cemented tailings deposit body. (b) The schematic diagram of the force of the micro unit of the deposit body.
Minerals 13 01377 g002
Figure 3. The pressure monitor distribution in the (a) iron mine and (b) copper mine.
Minerals 13 01377 g003
Figure 4. The theoretical and measured vertical stresses at various heights of filling body in the (a) iron mine and (b) copper mine.
Minerals 13 01377 g004
Figure 5. The relative error corresponding to the height of the deposit body.
Minerals 13 01377 g005
Figure 6. (a) The width is 25 m, and the vertical stress varies with the width and height. (b) The width is 30 m, and the vertical stress varies with the width and height. (c) The width is 35 m, and the vertical stress varies with the width and height. (d) The width is 40 m, and the vertical stress varies with the width and height.
Minerals 13 01377 g006
Figure 7. Variations in vertical stress at various cohesive forces and internal friction angles.
Minerals 13 01377 g007
Figure 8. Tailings disposal process.
Minerals 13 01377 g008
Figure 9. Variation in vertical stress at various heights of the tailings deposit body.
Minerals 13 01377 g009
Figure 10. Variation in vertical stress under different c/t ratios.
Minerals 13 01377 g010
Table 1. Mechanical properties of the filling body and surrounding rock in the iron and copper mines.
Structural Parameter of Filling BodyMechanical Parameters of Filling BodyMechanical Parameters of Surrounding Rock
LWHγφ0C0   k φ1fγ1
Iron Mine39.4311.070.9122400.0320.2236830.61
Copper Mine202010018.6370.0280.2542.193.4427.5
Table 2. The factors and levels considered in the total experimental design.
FactorLength/mWidth/mHeight/m
Level 1252540
Level 2303050
Level 3353560
Level 4404070
Table 3. Mechanical parameters of tailings deposit body and surrounding rock.
Tailings Deposit BodySurrounding Rock
γ/(kN/m3)φ0/(°)C0/(MPa)kφ1/(°)fγ1 (kN/m3)
18.6280.0280.3636830.61
Table 4. The factors and levels considered in the total experimental design.
FactorC0/kPaφ0/(°)
Level 12022
Level 24026
Level 36030
Level 48034
Table 5. Mechanical parameters of surrounding rock and cemented tailings deposit body.
Cemented Classified TailingsCemented Superfine Tailings
γ
(kN/m3)
φ0/(°)C0/(MPa)UCS
(MPa)
kγ
(kN/m3)
φ0/(°)C0/(MPa)UCS
(MPa)
k
19.3421.811.10.218.6320.1060.7710.31
Table 6. Mechanical parameters of the tailings deposit body.
c/t RatioUCS/kPaC0/kPaφ0
1:14591.745.6829.41
1:15531.942.5728.79
1:16378.838.9228.62
1:17311.525.6928.56
1:18264.620.5628.53
1:20195.712.8128.37
1:31122.78.2528.20
Table 7. Cement consumption in tailings deposit body using various methods.
Height/mOriginal Deposit MethodOptimized Deposit MethodAmount of Saved Cement
(kg/m3)
c/t RatioCement Dosage
(kg/m3)
c/t RatioCement Dosage
(kg/m3)
44~50 m1:3(classified tailings)386.451:1562.64323.81
24~44 m1:6(superfine tailings)157.16143.17
14–24 m1:1756.68100.48
4~14 m1:1852.75104.41
0~4 m1:3131.32125.84
Average value184.16 56.96127.71
Disclaimer/Publisher’s Note: The statements, opinions and data contained in all publications are solely those of the individual author(s) and contributor(s) and not of MDPI and/or the editor(s). MDPI and/or the editor(s) disclaim responsibility for any injury to people or property resulting from any ideas, methods, instructions or products referred to in the content.

