Article

Geochemistry, Zircon U–Pb Geochronology, and Geological Significance of Late Mesozoic Magmatic Rocks in Guangxi Region (Southeastern China)

1
College of Earth Sciences, Guilin University of Technology, Guilin 541000, China
2
Collaborative Innovation Center for Exploration of Nonferrous Metal Deposits and Efficient Utilization of Resources by the Province and Ministry, Guilin University of Technology, Guilin 541000, China
*
Author to whom correspondence should be addressed.
Minerals 2023, 13(10), 1341; https://doi.org/10.3390/min13101341
Submission received: 18 September 2023 / Revised: 15 October 2023 / Accepted: 18 October 2023 / Published: 20 October 2023

Abstract

:
The geodynamic mechanisms that controlled magmatic activity in South China during the late Mesozoic have been a cutting-edge focus of recent research. Southeastern Guangxi, which is located at the juncture between the Pacific and Neo-Tethyan tectonic domains, is a transitional zone characterized by the occurrence of widespread Jurassic–Cretaceous magmatic rocks. Investigation of this region can shed light on the late Mesozoic tectonic setting of South China. We conducted U–Pb geochronological and geochemical analyses of the Liuwang granodiorite and quartz porphyry, which are exposed in southeastern Guangxi. Zircon U–Pb dating yielded an age of 161.8 ± 1.2 Ma for the granodiorite and 97.89 ± 0.68 Ma for the quartz porphyry, indicating that they formed during the Late Jurassic and Late Cretaceous, respectively. The Liuwang granodiorites are weakly peraluminous high-K calc-alkaline rocks characterized by enrichment in large ion lithophile elements (including Rb) and high field strength elements (including Th, U, Pb, and Ta) and depletion in Ba, Nb, and Sr. The granodiorites also exhibit weak rare earth element (REE) fractionation and slightly negative Eu anomalies. Conversely, the Liuwang quartz porphyry is weakly peraluminous and belongs to the potassic syenite series, transitioning into the high-K calc-alkaline series. It is characterized by enrichment in Rb and high field strength elements (including Th, U, Pb, and Ta), with depletion in Ba, Nb, Sr, and Zr. It does not exhibit REE fractionation but does yield prominent negative Eu anomalies. The granodiorite and quartz porphyry yield εHf(t) values of −23.26 to −2.48 and −4.4 to +0.8, respectively, with tDM2 ages of 2642–1270 and 1411–1081 Ma, respectively. These data suggest that the Liuwang granodiorite formed under a background of Late Jurassic lithospheric extension–thinning and was derived from partial melting of Palaeoproterozoic–Mesoproterozoic metasedimentary sandstones with a minor contribution from mantle-derived melts. In contrast, the Liuwang quartz porphyry was derived from partial melting of Mesoproterozoic pelitic rocks and formed in a Late Cretaceous tectonic setting linked to the northward subduction of the Neo-Tethys Ocean beneath South China.

1. Introduction

The South China continent formed through the amalgamation of the Yangtze and Cathaysia blocks during the Neoproterozoic [1,2]. Over the course of the Phanerozoic, the continent recorded a succession of tectonic events, including the Caledonian, Indosinian, Yanshanian, and Himalayan orogenies, resulting in extensive intracontinental deformation. The late Mesozoic was a pivotal phase in the structural evolution of South China, characterized by a complex tectonic setting influenced by both the Tethyan and Pacific tectonic domains. Large-scale extensional rift basins, magmatic intrusions, volcanic activity, and polymetallic mineralization developed throughout South China during the late Mesozoic. Deformation, magmatism, and mineralization have unique features within the broader context of global tectonic evolution during the Mesozoic and have attracted much attention from geologists worldwide. Recognizing the importance of the late Mesozoic in understanding the tectonic evolution of South China, numerous researchers have proposed diverse models for its tectonic evolution. Most researchers have suggested that South China was influenced primarily by the subduction of the Paleo-Pacific Plate during the late Mesozoic. Multiple subduction models have been proposed, including flat subduction and steepening, delamination, and lithospheric extension [3,4,5,6,7,8,9,10]. However, others have emphasized the long-term influence of the Tethyan tectonic domain on South China during the late Mesozoic [11,12,13,14,15,16].
In southeastern Guangxi, widespread late Mesozoic magmatic rocks, closely associated with Pb–Zn, Cu, W, Au, and other mineral deposits, are products of late Mesozoic tectonic activity. We aim to unravel the tectonic evolution of South China during the late Mesozoic and shed light on the relationships between the South China continent and the Tethyan and Paleo-Pacific domains by investigating the petrology and geochemistry of the magmatic rocks and determining their formation ages and sources. Ultimately, we aim to provide a geodynamic model for regional ore formation patterns and mineral exploration.

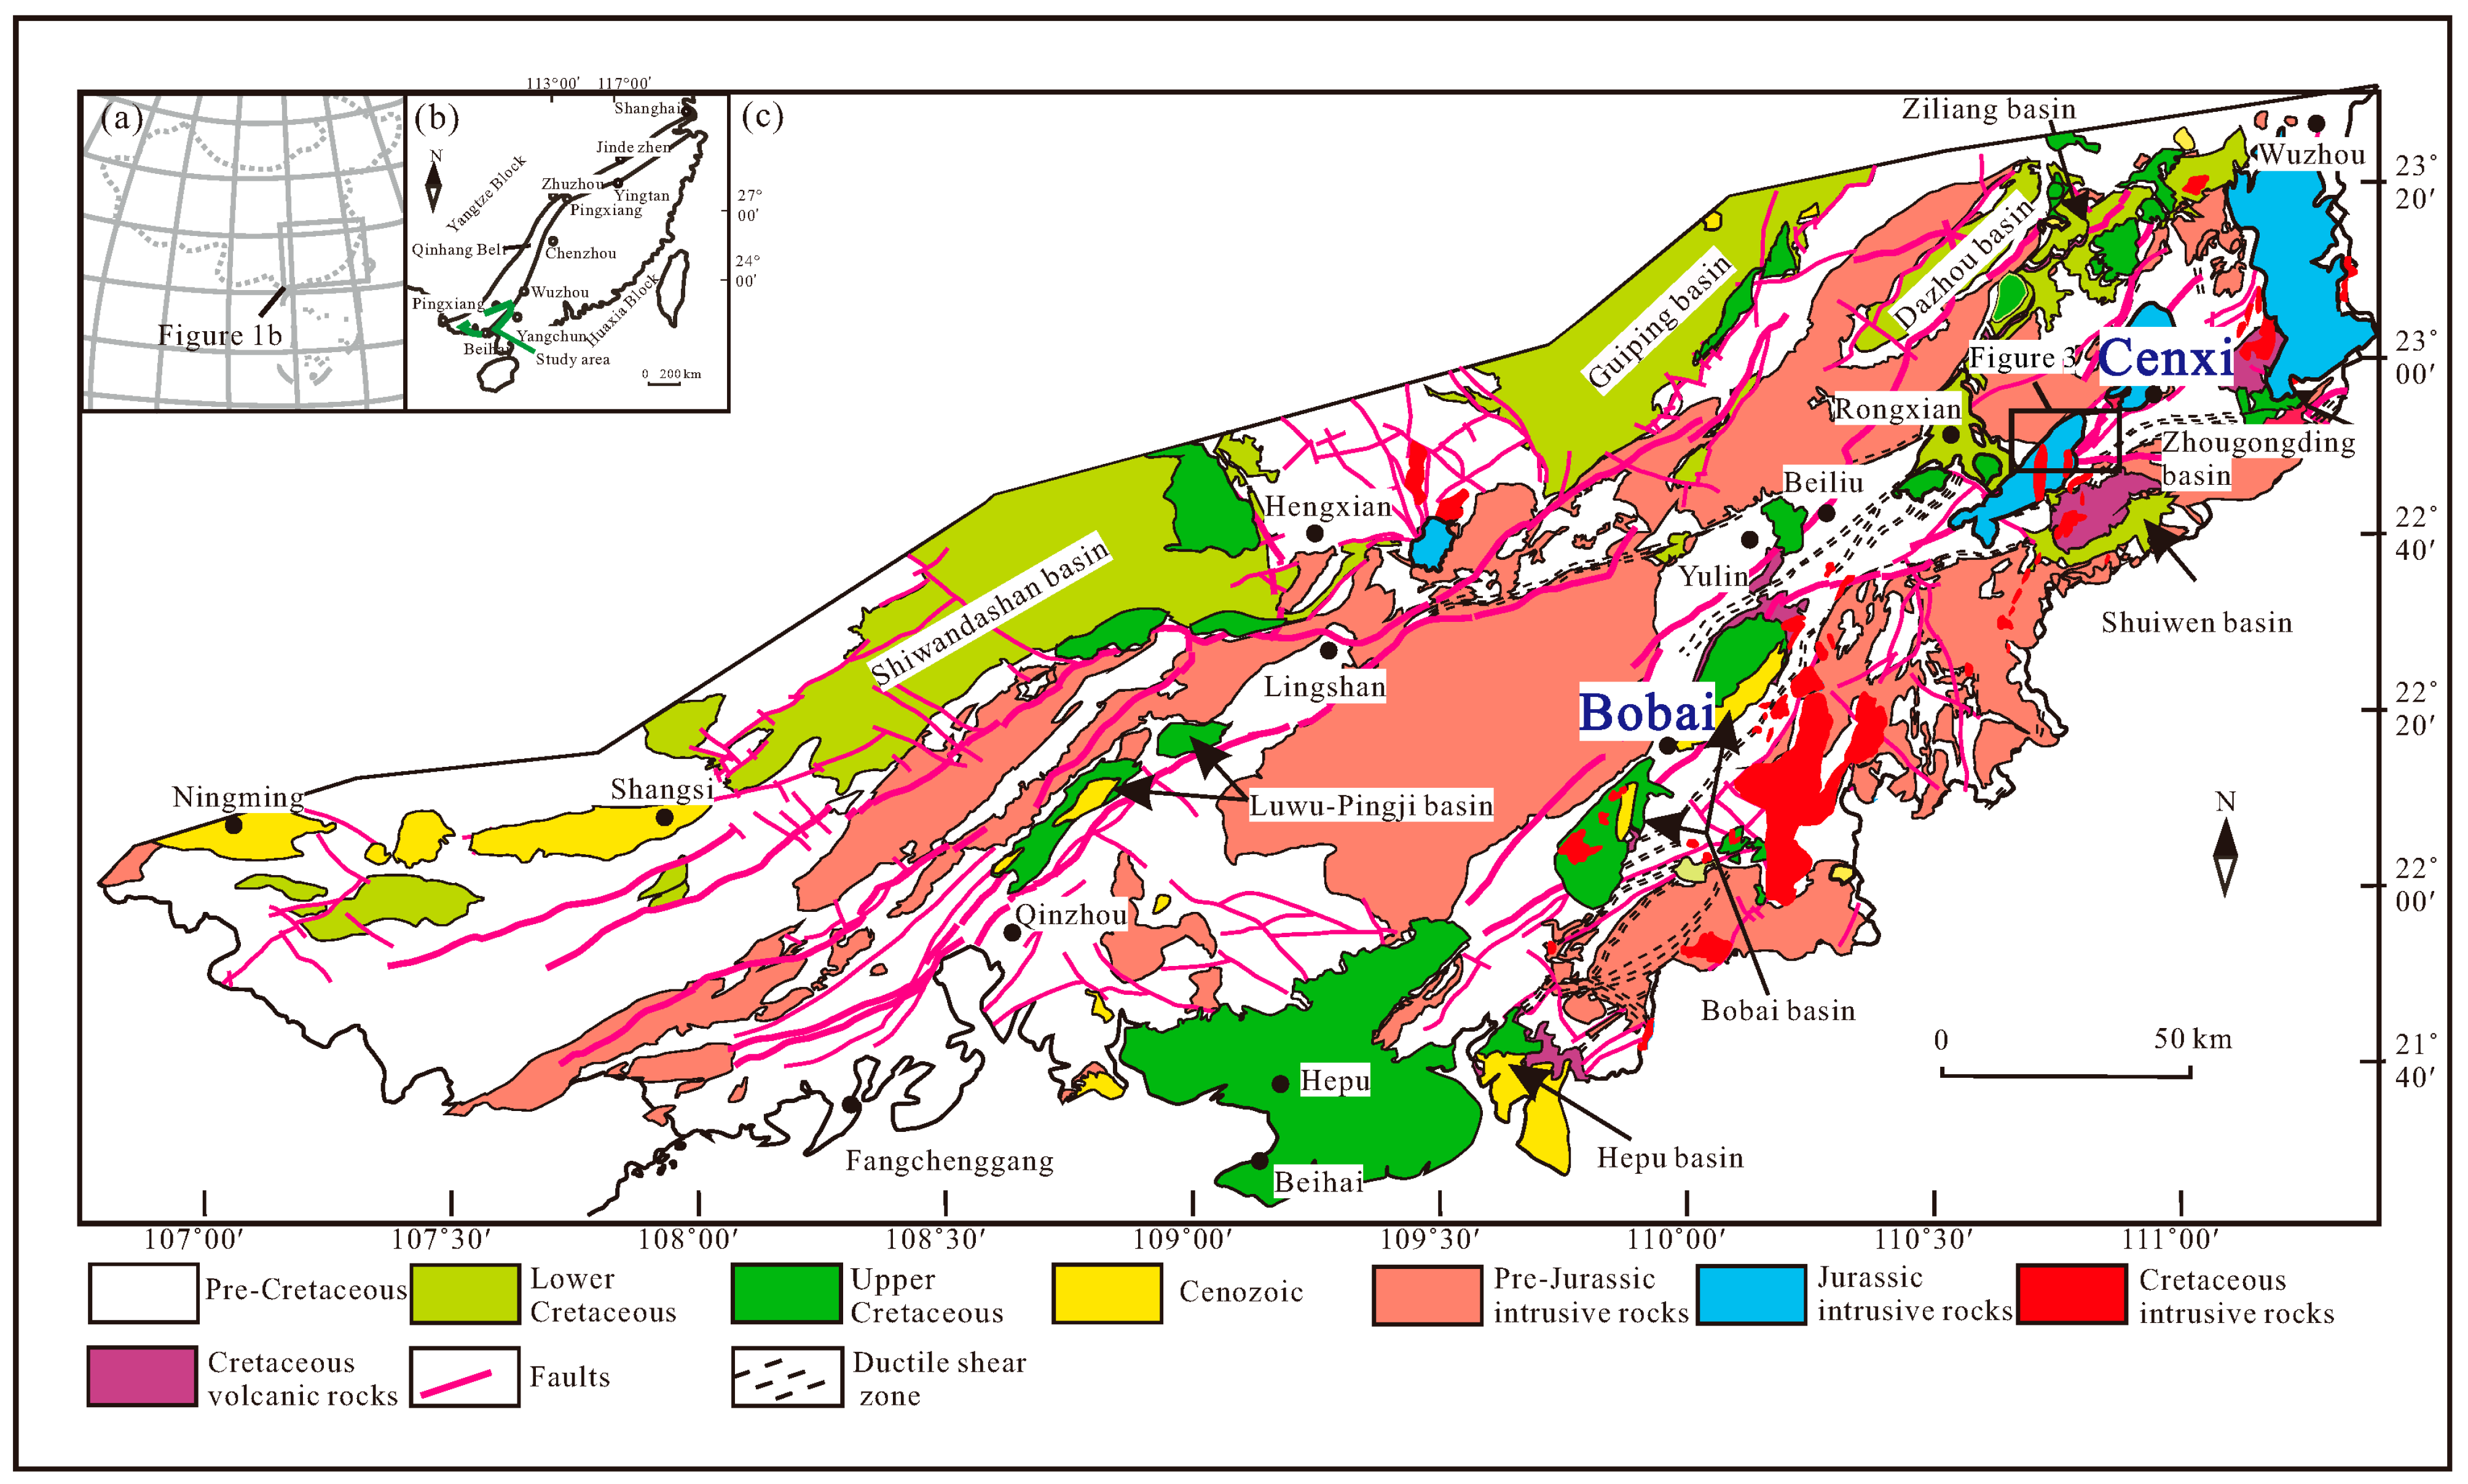
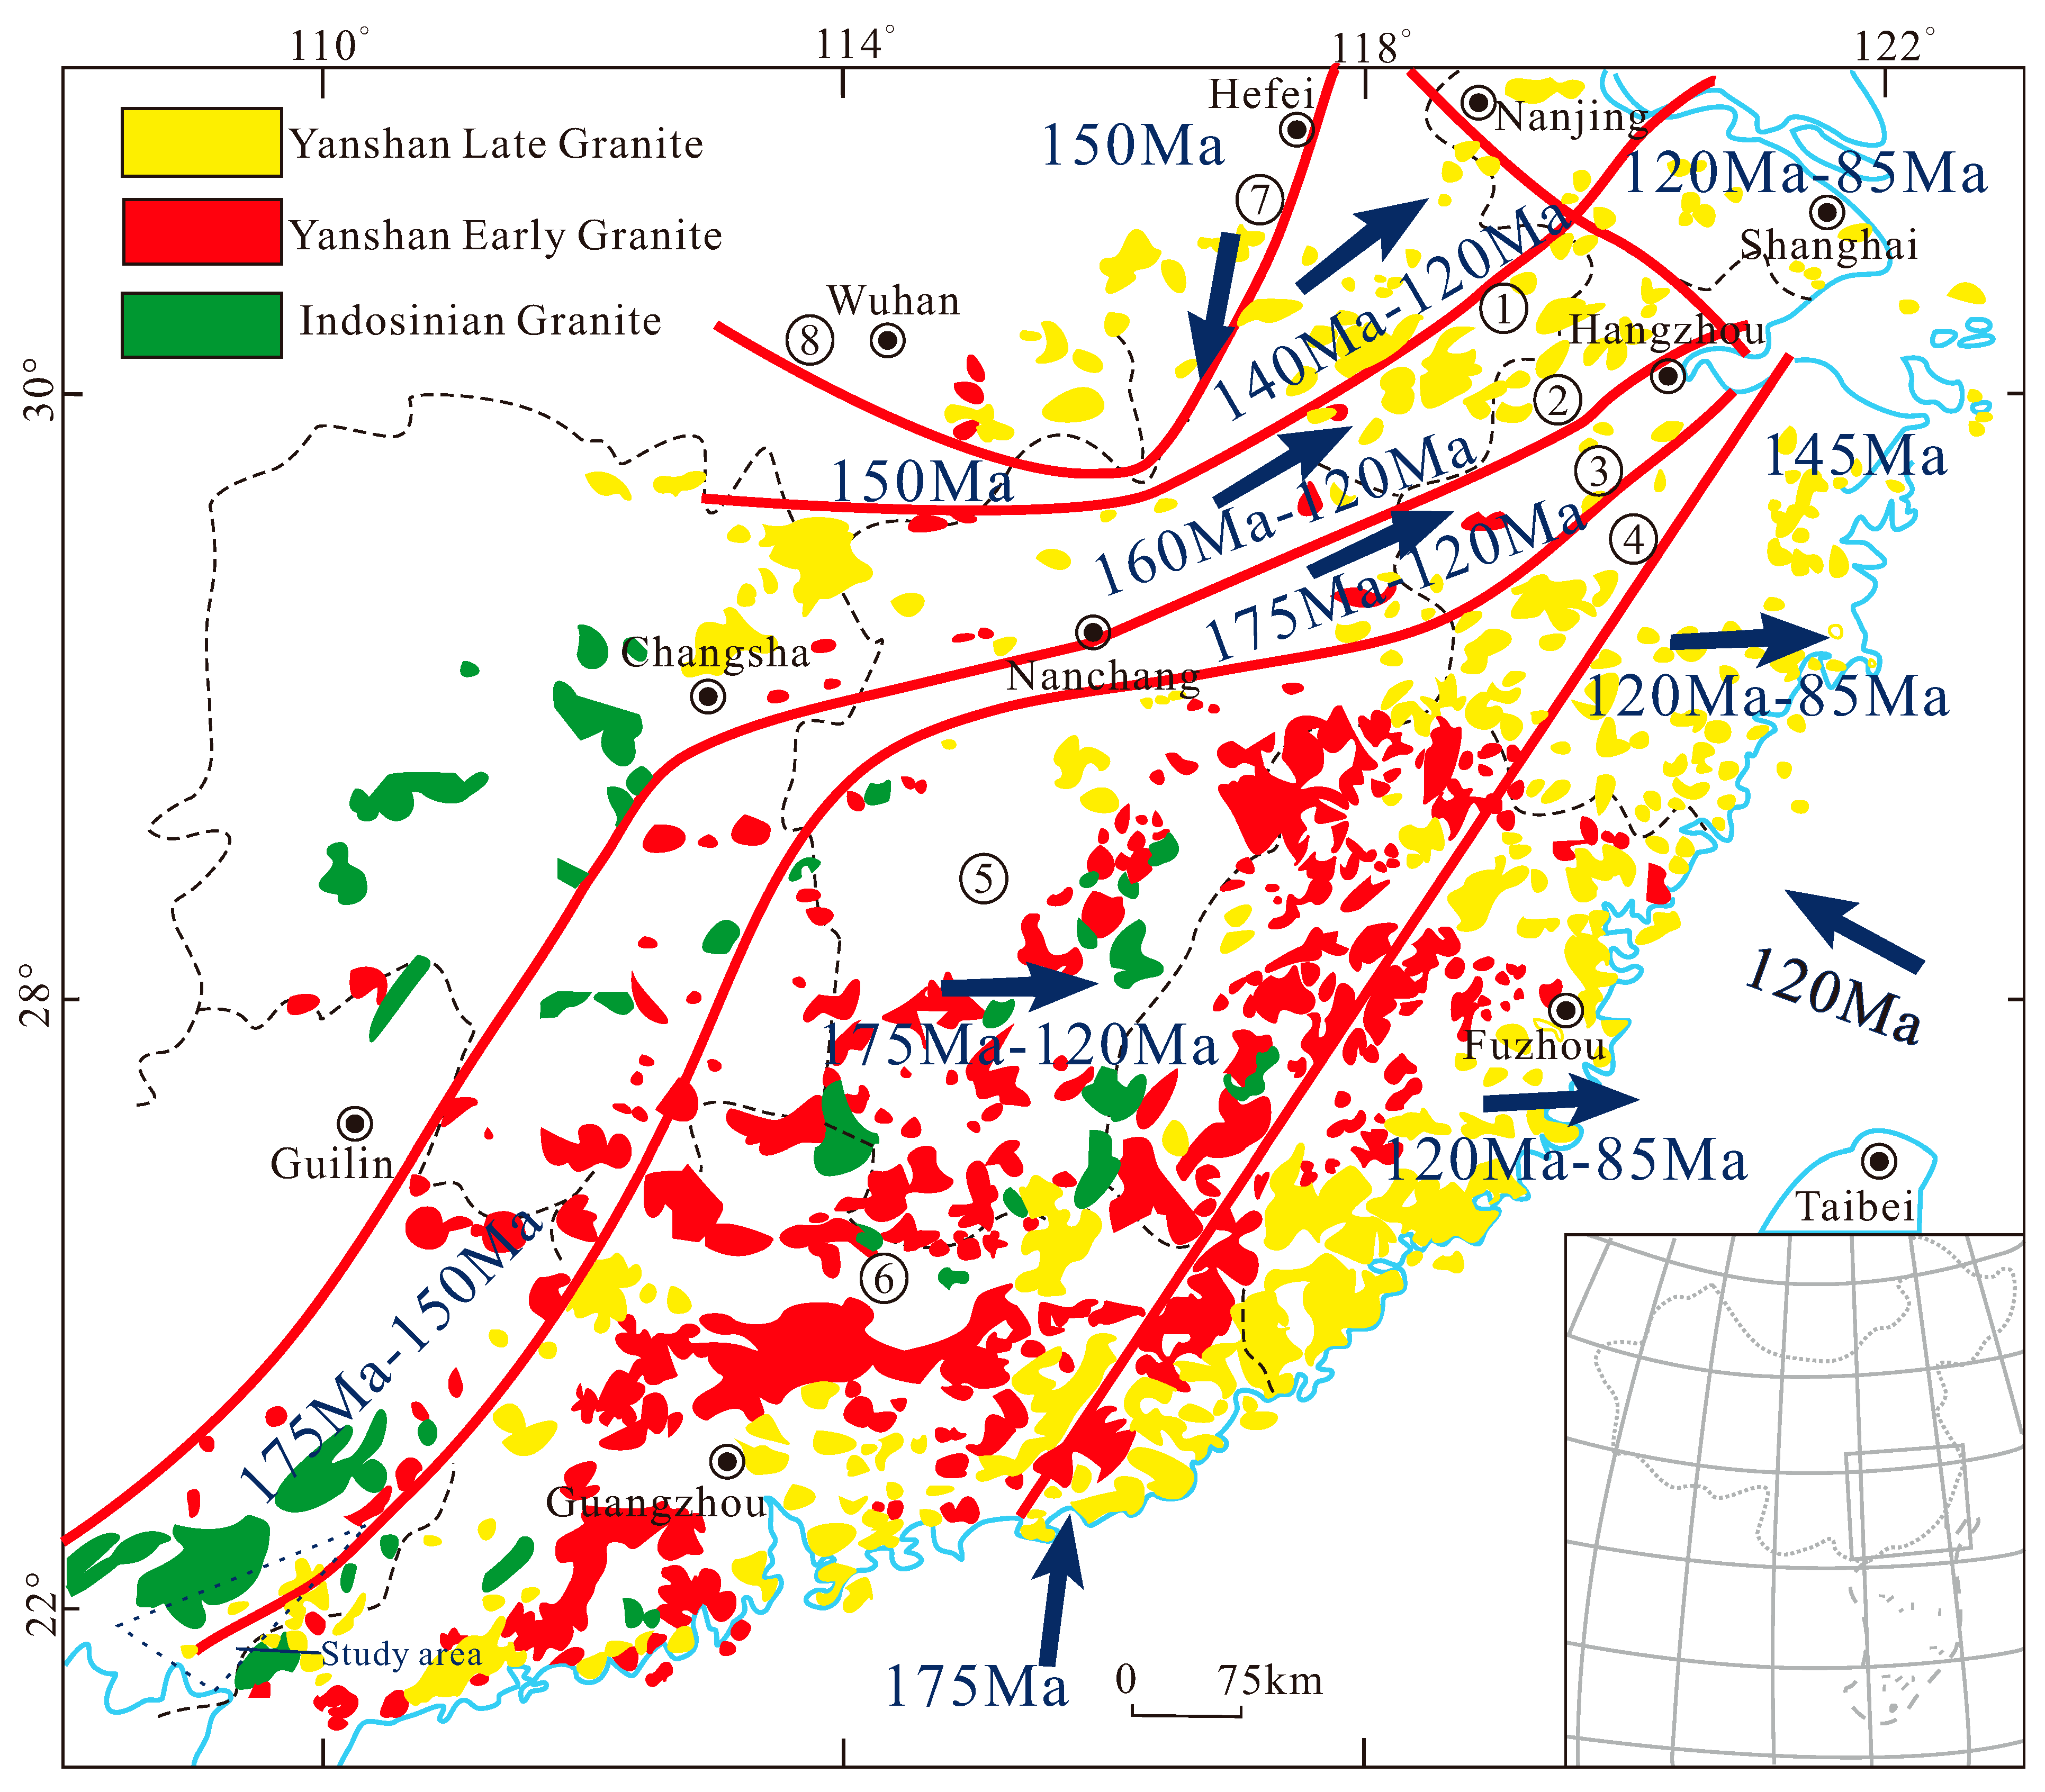
2. Geological Setting

The southeastern Guangxi is situated at the southwestern end of the Qinhang Metallogenic Belt in South China, at the boundary between the Cathaysia and Yangtze blocks (Figure 1a). This area boasts a relatively complete stratigraphic sequence, from the Neoproterozoic to the Quaternary, with the exception of Permian and Triassic strata. The Palaeozoic strata include Ordovician coastal–shallow-marine fine sandstones and mudstones and Silurian shallow–deep-marine fine sandstones, siltstones, and shales. Mesozoic strata are characterized by Cretaceous fluvial red sandstones, and Cenozoic strata consist of Pliocene piedmont conglomerates and variably graded sandstones. These sedimentary units overlay the Precambrian metamorphic basement. Throughout the Phanerozoic, the region experienced numerous tectonic and magmatic events, notably during the Guangxi, Indosinian, and Yanshanian orogenies. These events profoundly altered the local stratigraphy, with the intrusion of numerous intermediate to felsic rock bodies and concurrent large-scale mineralization.
Regional-scale NE–SW-trending faults play a pivotal role in the geological framework of southeastern Guangxi (Figure 1b). They control the distribution of Mesozoic magmatic rocks and basins and have undergone multiple stages of activity. The nature and orientation of these faults have varied over time. During the Jurassic–Cretaceous, the intrusions in the area were concentrated along the Bobai–Cenxi Fault Zone and were composed predominantly of granites, which were emplaced as small plutons, dikes, and wall-like bodies (Figure 1b).
In geological terms, there are mainly two types of distribution patterns for granite. One type is oriented in an east–west (EW) direction in the Nanling Mountains, and the other type is distributed in a north–east (NE) direction on both sides of the Wuyi Mountain fold belt (Figure 2). Late Cretaceous magmatic rocks in southern China are primarily found along the southeast coastal region. During this period, magmatic rocks can be classified into three groups:
1: Mid-Early Cretaceous (120~115 Ma)
Gneissic Peraluminous Granodiorite–Granite–Tonalite Suite: Formed in the tectonic setting of continental collision during the mid-Early Cretaceous period.
2: Late Early Cretaceous (110~99 Ma)
Medium Potassium High Aluminum Diorite: Formed in the post-collisional tectonic setting during the late Early Cretaceous period. High Potassium I-Type Granite: Formed in the same post-collisional tectonic setting during the late Early Cretaceous period.
3: Late Cretaceous (94~85 Ma)
A-Type Granite: Formed in a non-collisional tectonic setting during the Late Cretaceous period. Bimodal Dykes and Basic Dyke Swarms: Formed during the same non-collisional tectonic setting [17].
Figure 2. Distribution and age variation trend chart of Mesozoic granites in South China. [18] ① Nantong–Liyang South–Lushan South–Ruichang–Chongyang Fault, ② Hangzhou–Xiangtan–Jinxiu–Pingxiang Fault (northwestern margin of the Qinhang Belt, ③ Shaoxing–Jiangshan–Pingxiang–Wuzhou–Hepu Fault (southeastern margin of the Qinhang Belt), ④ Yuyao–Zhenghe–Dapu Fault, ⑤ Qiyang–Ninggang–Guangchang–Nanping (northern Nanling) Fault, ⑥ Jinxiu–Xinfeng–Xingning–Yunxiao (southern Nanling) Fault, ⑦ Tancheng–Lujiang Fault, and ⑧ Southern Dabie Mountains Fault. The dark blue numbers represent the range of age variation. The red solid line represents the approximate distribution of different age volcanic belts; the blue solid line represents the coastline; the gray dashed line in the small map represents the territorial boundary of China, and the gray solid line represents the meridian lines.
Minerals 13 01341 g002

3. Analytical Methods

Our primary aim was to perform zircon U–Pb isotope dating and analyze the Hf isotopic compositions of one sample of the Liuwang granodiorite and one sample of the quartz porphyry. The sample locations are shown in Figure 3. In addition, we analyzed the major, trace, and rare earth element (REE) compositions of Six samples of the Liuwang granodiorite and quartz porphyry.
Conventional heavy liquid and magnetic methods were employed for zircon separation; then, zircon grains that were large and well-shaped were hand-picked under a binocular microscope and mounted in epoxy resin. Cathodoluminescence (CL) and transmitted and reflected light imaging were conducted by the Yujin Technology Company in the city of Chongqing. Zircon grains with well-defined crystal shapes, oscillatory zoning, and minimal fractures and inclusions were selected for U–Pb dating and Hf isotope analyses based on CL and transmitted and reflected light images.
Zircon U–Pb dating was conducted at the Guangxi Key Laboratory of Hidden Metallic Ore Deposit Exploration, Guilin University of Technology, China. We used a laser ablation–inductively coupled plasma–mass spectrometer (LA–ICP–MS) system consisting of an Agilent 7500cx ICP–MS coupled with an NWR193 laser ablation system with a wavelength of 193 nm, a beam diameter of 32 μm, and a shot frequency of 5 Hz. To calibrate our results, we used the TEM standard zircon (416.75 ± 0.24 Ma) as an external age standard and the US National Institute of Standards and Technology (NIST) 610 synthetic silicate glass as an external standard for element contents. We processed the data, including calculating the U–Th–Pb isotopic ratios and ages, using ICPMSDataCal version 7.2. Individual error bars represent 1σ errors, and the confidence level for the weighted mean ages is 94%.
In situ zircon Hf isotope analyses were also carried out at the Guangxi Key Laboratory of Hidden Metallic Ore Deposit Exploration, using an LA–multi-collector (MC)–ICP–MS. The laser spot size was 43 μm, the shot frequency was 8 Hz, and the ablation duration was ~30 s. The GJ-1 standard zircon was used to correct for isotope fractionation. Multiple analyses of the GJ-1 standard yielded a mean 176Hf/177Hf ratio of 0.281992 (2σ, n = 7) [19].
Major, trace, and REE analyses of the samples were performed at the Guangxi Key Laboratory of Hidden Metallic Ore Deposit Exploration. Major element contents were measured using X-ray fluorescence (XRF) on alkali fusion glass disks, using a Rigaku ZSX Primus II X-ray fluorescence spectrometer [20]. Trace element contents were determined using high-temperature, high-pressure acid digestion and an Agilent 7500cx ICP–MS. The analytical accuracy for major element contents was better than 2%–5%, and that for trace elements was better than 5%–10%. The methodologies of these analyses have been described in detail by [21].

4. Results

4.1. Petrographic Features

4.1.1. Liuwang Granodiorite

The Liuwang granodiorite is located along the Bobai–Cenxi Fault Zone (Figure 1b). It intrudes Ordovician and Silurian strata, with an outcrop area of ~8 km2 (Figure 3). It is light gray (Figure 4a), medium to fine-grained, and has a blocky structure. It consists of quartz (25%), plagioclase (40%), biotite (15%), and hornblende (20%). The accessory minerals are mainly sphene, zircon, apatite, and magnetite. The quartz consists of xenomorphic grains that are 2–4 mm in length. The plagioclase crystals are 2–3 mm in length, subhedral, and prismatic with evidence of chloritization and frequently contain biotite inclusions. The hornblende has undergone chloritization and actinolitization, and biotite appears as subhedral flakes that are <5 mm in length (Figure 4c).

4.1.2. Liuwang Quartz Porphyry

The Liuwang quartz porphyry is exposed near Liuwang Town in southeastern Guangxi and occurs as N–S-oriented veins within the Liuwang granodiorite (Figure 4b). The veins are 10–15 m wide and 0.8–1.2 km in length. Distinctive flow structures and lines are visible on the surface of the veins, with localized pyrite mineralization and chloritization (Figure 4b). The quartz porphyry is pink–red with a patchy texture and blocky structure. Quartz is the dominant phenocryst type (20%–30%) and occurs as subhedral to xenomorphic grains that are 0.5–2.5 mm in length. K-feldspar phenocrysts of 0.3–0.6 mm in length are observed locally. The matrix represents 70%–80% of the rock and is microcrystalline or fine-grained with variable degrees of crystallinity. Identifying minerals in the matrix is challenging, as the grains are <0.1 mm (Figure 4d).

4.2. Geochemistry

4.2.1. Major Elements

The Liuwang granodiorite samples have contents of SiO2 = 59.33–62.87 wt.% (mean = 61.96 wt.%), Na2O = 2.98–3.29 wt.% (mean = 3.20 wt.%), K2O = 3.48–4.13 wt.% (mean = 3.72 wt.%), and CaO = 3.37–3.83 wt.% (mean = 3.58 wt.%). The contents of Al2O3 are relatively high (16.04–16.70 wt.%), and its aluminum saturation index [ASI; the molar Al/(Ca + Na + K) ratio] values are 0.98–1.07 (mean = 1.04). The samples have K2O/Na2O ratios of 1.07–1.39. On a SiO2 versus K2O diagram (Figure 5b), all samples plot along the high-K calc-alkaline series (Table 1).
On an A/CNK versus A/NK diagram (Figure 6a), most of the samples plot within the peraluminous field, which is typical of I-type granites. The Liuwang quartz porphyry samples have relatively high contents of SiO2 (74.61–78.28 wt.%; mean = 76.30 wt.%), with Na2O = 2.53–3.68 wt.% (mean = 3.08 wt.%), K2O = 3.14–5.73 wt.% (mean = 4.65 wt.%), and CaO = 0.4–1.43 wt.% (mean = 0.79 wt.%). The contents of Al2O3 are relatively low (11.37–12.82 wt.%; mean = 12.06 wt.%), and the ASI values are 0.93–1.11 (mean = 1.05). On an A/CNK versus A/NK diagram (Figure 6a), most of the samples plot within the peraluminous field, indicating a weakly peraluminous nature. On a SiO2 versus K2O diagram (Figure 5b), two samples plot in the high-K calc-alkaline field, and four samples plot in the shoshonite field.

4.2.2. Trace Elements

The Liuwang granodiorite samples have nearly uniform trace element distribution curves (Figure 6a), indicating consistent magma evolution and a homogeneous source. The samples exhibit substantial enrichment in large ion lithophile elements (LILEs), including Rb, and high field strength elements (HFSEs), including Th, U, Pb, and Ta, with depletion in Ba, Nb, and Sr. The Liuwang quartz porphyry samples also have uniform trace element distribution curves (Figure 6a), signifying consistent magma evolution and a shared source. The samples exhibit significant enrichment in LILEs and HFSEs and depletion in Ba, Nb, Sr, and Zr (Table 1).

4.2.3. REE

The total REE (ΣREE) contents of the samples of Liuwang granodiorite are 205.36–252.22 ppm (mean = 228.89 ppm). The samples yield light to heavy REE ratios (LREE/HREE) of 3.16–4.98 (mean = 4.23), (La/Yb)N ratios of 8.05–15.96 (mean = 12.76), and (Gb/Yb)N ratios of 1.88–2.36 (mean = 2.13). No significant fractionation is observed between the LREEs and HREEs across all samples (Figure 6b). The samples yield δEu values of 0.79–1.00 (mean = 0.93), indicating a slight negative Eu anomaly.
The ΣREE contents of the samples of Liuwang quartz porphyry are 162.74–288.95 ppm (mean = 219.47 ppm), and the samples yield LREE/HREE ratios of 8.72–12.86 (mean = 10.57), (La/Yb)N ratios of 0.8–1.23 (mean = 1.04), and (Gb/Yb)N ratios of 0.81–0.96 (mean = 0.89). The samples have a clear negative Eu anomaly, with δEu values of 0.04–0.06 (mean = 0.05). There is no discernible fractionation between the LREEs and HREEs in any sample (Figure 6b).

4.3. Zircon Data

4.3.1. Zircon Imaging and Chemistry

The zircon grains in the Liuwang granodiorite (sample CX14, GPS: 22°47′18.81″ N, 110°45′13.76″ E) are brown with well-defined shapes, 200–250 μm in length, and have aspect ratios of 1:1 to 2:1 and distinct oscillatory zoning, characteristic of magmatic zircon (Figure 7a) [25,26].
The zircon grains have contents of U = 627–2826 ppm and Th = 361–1224 ppm, with Th/U ratios of 0.23–0.58 (mean = 0.39), indicating a strong positive correlation. The elevated Th and U contents and Th/U ratios of >0.1 [27] support a magmatic origin for the zircons [22,28].
The 206Pb/238U ages of 15 analyses are concentrated at 165–160 Ma ago (Table 2). On a Concordia diagram, all the analyses lie on the Concordia. The concordance rate of 4 measurement points (1, 4, 8, 9) is less than 95% [29]. The weighted mean 206Pb/238U age is 161.8 ± 1.2 Ma (MSWD = 0.37; Figure 7c), which represents the formation age of the Liuwang granodiorite pluton.
The zircon grains in the Liuwang quartz porphyry (sample CX15, GPS: 22°47′12.75″ N, 110°45′07.55″ E) are brown, euhedral–subhedral, 90–140 μm in length, and mostly have short prismatic shapes with aspect ratios of 1:1 to 1:2. The grains have poorly defined oscillatory zoning (Figure 7b) and contents of Th = 5272–30,688 ppm and U = 14,639–45,199 ppm, with Th/U ratios of 0.36–0.68 (mean = 0.47). The grains appear black in the CL images due to their high U contents. All grains have Th/U values of >0.1 [27], which indicates a magmatic origin [28].
The 206Pb/238U ages of the 13 zircon grains in this sample (with a concordance of ≥96%) cluster around 100–96 Ma (Table 2). On a Concordia plot, all the analyses lie on or close to the Concordia. The concordance rate of 7 measurement points (1, 2, 3, 6, 10, 12, and 13) is less than 95% [29]. The weighted mean 206Pb/238U age of the 13 zircon grains is 97.89 ± 0.68 Ma (MSWD = 1.2; Figure 7d), which represents the intrusion age of the Liuwang quartz porphyry.

4.3.2. Zircon U–Pb Geochronology

In situ Hf isotope analyses were performed on magmatic zircons from the samples (Table 3). The analysis locations were close to those used for the U–Pb dating analysis (Figure 7). Fifteen zircon grains from the Liuwang granodiorite and eight from the Liuwang quartz porphyry yield 176Hf/177Hf ratios of 0.282026–0.282648 and 0.282605–0.282754, respectively. Based on the zircon U–Pb ages, the calculated zircon εHf(t) values for the Liuwang granodiorite zircons range from −23.26 to −1.37, and those for the Liuwang quartz porphyry zircons range from −4.4 to +0.8. The two-stage Hf model ages (tDM2) are 2642–1270 Ma for the Liuwang granodiorite and 1411–1081 Ma for the Liuwang quartz porphyry.

5. Discussion

5.1. Petrogenesis

5.1.1. Petrogenesis of the Liuwang Granodiorite

Granitic rocks can be divided into I, S, M, and A types based on their origin [30]. The negative εHf(t) values of the Liuwang granodiorite (Table 3) suggest that its source was primarily continental crust or enriched mantle material, which rules out direct formation from a juvenile mantle-derived source, which is a characteristic feature of M-type granitic rocks. On Zr versus SiO2 and (Na2O + K2O)/CaO versus Zr + Nb + Ce + Y diagrams (Figure 8a,b), the samples plot close to the boundaries of the I-, S-, and A-type fields. The Liuwang granodiorite plots within the high-K calc-alkaline series and is weakly peraluminous (A/CNK = 0.98–1.07). Furthermore, the Liuwang granodiorite lacks peraluminous minerals and typically includes amphibole, which are typical characteristics of I-type granitic rocks.
The Liuwang granodiorite yields Nb/Ta ratios of 8.66–13.61 (mean = 11.52), which fall between the average Nb/Ta ratios of continental crust (11) and the mantle (25). The granodiorite yields Rb/Sr ratios of 0.33–0.43 (mean = 0.35), suggesting crust–mantle interaction, and Zr/Hf ratios of 28.4–35.8 (mean = 33.8), which fall between those of the mantle (36.3) and the crust (33.0). These features suggest that the Liuwang granodiorite was produced by interaction between crustal and mantle-derived magmas, with a dominant contribution from crustal material [31]. The εHf(t) values of the Liuwang granodiorite are −23.26 to −1.37, corresponding to the tDM2 model ages of 2642–1270 Ma. This suggests that its source rocks were composed primarily of Palaeoproterozoic–Mesoproterozoic continental crustal material. On an A/MF versus C/MF diagram (Figure 8c), the samples plot predominantly in the overlapping fields of metasedimentary and mafic rock partial melts. Therefore, it is likely that the Liuwang granodiorite originated from the partial melting of Palaeoproterozoic–Mesoproterozoic metasedimentary rocks, with the addition of some mantle-derived melt.
Figure 8. (a) Zr versus SiO2, (b) (K2O + Na2O)/CaO versus Zr + Ce + Nb + Y, and (c) molar CaO/(MgO + TFeO) versus molar Al2O3/(MgO + TFeO) diagrams for the Liuwang granodiorite [32].
Minerals 13 01341 g008

5.1.2. Petrogenesis of the Liuwang Quartz Porphyry

The Liuwang quartz porphyry has relatively high contents of SiO2 (74.61–78.28 wt.%) and total alkali (Na2O + K2O) contents of 6.82%–8.33 wt.%, ASI values of 0.93–1.11, and low contents of P2O5, TiO2, and MgO. The Liuwang quartz porphyry is enriched in LILEs and HFSEs and depleted in Ba, Nb, Sr, and Zr, with Nb/Ta ratios of 8.22–8.75. These characteristics indicate that the Liuwang quartz porphyry has undergone significant fractional crystallization, suggesting that it is a highly differentiated granitic rock [33,34].
Distinguishing the genetic type of highly differentiated granitic rocks can be challenging [30]. However, the crystallization temperature is a crucial feature for distinguishing between different types of granite. The zircon saturation thermometer is a widely accepted method for calculating the crystallization temperature of granitic rocks. Applying the zircon saturation thermometer proposed by [35] yields a crystallization temperature of 774–788 °C for the quartz diorite, notably lower than the crystallization temperatures typically associated with A-type granitic rocks, and is closer to the crystallization temperatures commonly associated with I- and S-type granitic rocks.
The total Zr + Nb + Ce + Y contents of the Liuwang quartz porphyry are lower than the lower limit for A-type granitic rocks (350 ppm). On various geochemical diagrams, including TFeO/MgO versus SiO2 (Figure 9a) and Zr + Nb + Ce + Y versus (K2O + Na2O)/CaO (Figure 8b) diagrams, the samples plot in the I- and S-type granitic rock fields. On an AFC diagram (Figure 9c), all samples plot in the S-type granitic rock field. Therefore, the Liuwang quartz porphyry is classified as a highly differentiated S-type granitic rock.
The incompatible element Rb tends to accumulate in mature crustal material, whereas Sr is enriched in less mature and less evolved crustal material; therefore, Rb/Sr ratios can reflect the characteristics of the source area. The Rb/Sr ratios of the Liuwang quartz porphyry are higher than the average ratio of the upper crust (0.32), suggesting that its source region consists of mature crustal material. On magma source discrimination diagrams, the quartz porphyry samples all plot in the fertile sedimentary rock field (Figure 9d,e). The εHf(t) values of the samples range from −4.4 to +0.8, indicating the involvement of mantle-derived material. The corresponding two-stage model ages (tDM2) are 1411–1081 Ma, suggesting that the magma originated primarily from the partial melting of fertile Mesoproterozoic sedimentary rocks.
Data from previous studies indicate that regional asthenospheric upwelling and lithospheric extension and thinning began in southeastern Guangxi during the Late Jurassic [3,36,37]. The Bobai–Cenxi Fault Zone, where the study area is located, is a region of crustal weakness, which does not support the hypothesis of ancient crustal remelting caused by thickening of the continental crust. Previous studies on contemporaneous intrusive rocks in southern China have shown that granitic magmas emplaced during this period incorporated varying proportions of mantle-derived material [13,15,38,39]. Therefore, hot, upwelling mantle-derived material triggered partial melting of the fertile Mesoproterozoic sedimentary rocks in the lower crust.

5.2. Tectonic Setting

5.2.1. Middle–Late Jurassic

The intrusion age of the Liuwang granodiorite is 161.8 ± 1.2 Ma, placing its formation during the transition from the Middle to Late Jurassic. The granodiorite is enriched in LILEs and LREEs, with no negative Nb and Ta anomalies. On Ta versus Yb and Yb versus Nb tectonic discrimination diagrams (Figure 10), the Liuwang granodiorite samples are clearly associated with an intra-plate tectonic environment.
During the Middle–Late Jurassic period, there was a notable absence of island-arc magmatism in the southeastern Guangxi, which was located within the South China Craton. Instead, a substantial volume of potassic syenites and adakite were emplaced, mainly during 165–150 Ma. These potassic xenoliths are typically enriched in large ion lithophile elements (LILEs) and light rare earth elements (LREEs) and do not show characteristics such as Nb-Ta depletion. These syenitic intrusions formed within an intra-plate tectonic setting, away from subduction zones. This is likely related to regional processes, such as asthenospheric upwelling or lithospheric extension and thinning [3,36,37,41,42,43,44]. Adakites were originally characterized as the outcome of partial melting in dehydrated oceanic crust. However, subsequent research suggests that Adakites exhibiting high Sr/Y ratios may stem from the partial melting of garnet amphibolite or garnet granulite facies rocks in the lower crust, rather than being the result of melting caused by subducted slab dehydration.
During the Middle–Late Jurassic, the South China Craton was influenced primarily by the western Pacific margin [16,45,46,47,48]. Deep-seated geophysical data suggest that the Bobai–Cenxi Fault Zone has the thinnest crust in Guangxi. The Moho exhibits undulating patterns characterized by alternating mantle uplift and depression. Steeper subduction angles or rollback of the Paleo-Pacific Plate led to post-arc extension [49,50,51], resulting in lithospheric thinning, asthenospheric upwelling, and the ascent of mantle material along the Bobai–Cenxi Fault Zone. This led to significant crust–mantle material exchange and triggered magmatic activity, ultimately giving rise to the widespread potassic rocks and the formation of the Liuwang granodiorite (Figure 12a).

5.2.2. Late Cretaceous

The Liuwang quartz porphyry formed during the Late Cretaceous and is enriched in LILEs and the highly incompatible elements Th, U, Pb, and Ta and depleted in Ba, Nb, Sr, and Zr. On a Y versus Zr tectonic discrimination diagram (Figure 11a), the samples plot in the arc magmatic rock field. On a Th/Ta versus Yb tectonic discrimination diagram (Figure 11b), the samples plot in the active continental margin field. Contemporaneous rocks exposed in southeastern Guangxi include granite porphyries, Yulin andesites, Luchuan diorites, Maqigang quartz diorite porphyries, and rhyolites [13,15,38,52] and other rock assemblages consistent with an active continental arc [22,53]. This suggests that the Liuwang quartz porphyry formed in an active continental margin setting, likely associated with subduction.
Reference [56] suggested that oblique subduction of the ancient Pacific Plate during the Early Cretaceous induced left-lateral strike-slip faulting in South China, leading to the formation of NE–SW-oriented rift basins and concurrent magmatism. East–west extension occurred during the Late Cretaceous, resulting in the development of nearly N–S-oriented sedimentary basins. This extension could have been a consequence of either Andean-type continental margin extension or collision and subduction between the Indian and Eurasian plates. The latter explanation can more easily explain the widespread Late Cretaceous sedimentary basins and regional unconformities in South China.
Through structural analysis, [57,58] identified multiple phases of NW–SE extension and compression in South China during the Early Cretaceous, which they attributed to the subduction of the ancient Pacific Plate. After 78.5 Ma, South China entered a phase of N–S extension. However, during this phase, the ancient Pacific Plate was moving nearly parallel to the direction of extension, suggesting that the N–S extensional stress was unrelated to the subduction of the ancient Pacific Plate and may have been associated with the back-arc tectonic setting resulting from the northward subduction of the Neo-Tethys Plate [12]. Previous studies of structural deformation and basin formation have suggested that N–S extension or compression in South China may have commenced as early as the late Early Cretaceous, at ~100 Ma [16,59].
During the Late Cretaceous, magmatism related to the subduction of the ancient Pacific Plate was distributed predominantly NE–SW along the southeastern coastal areas of China. An E–W-trending magmatic belt that formed during the Middle–Late Cretaceous (<110 Ma) has been identified in the southern part of South China, extending westward into Yunnan. This magmatic belt intersects with a contemporaneous NE–SW-trending magmatic belt along the southeastern coast. The E–W-oriented magmatic belt is thought to be linked to the northward subduction of the Neo-Tethyan oceanic crust [13,15,60,61,62,63].
The results of geochemical studies also support a transition from the subduction of the Paleo-Pacific Plate to the eastward subduction of the Neo-Tethys Plate in the southwestern Pacific at ~110 Ma [15,64]. Although the trench between the Neo-Tethys Plate and South China currently lies far from the mainland in the southern part of the South China Sea, given the extrusion of the Indochina Block, the opening of the South China Sea, and the southward movement of Borneo, the trench is thought to have been much closer to South China during the Cretaceous [15]. Thus, the southeastern Guangxi of South China was situated near the convergence of the northward subduction of the Neo-Tethys and Eurasian plates during the Late Cretaceous.
References [15,52] reconstructed paleo-plate positions during the Cretaceous and studied Cretaceous magmatic rocks and related ore deposits in the Yangchun Basin in western Guangxi. They suggest that the southern part of South China was influenced by the Neo-Tethyan tectonic domain during this time [62] and proposed a tectonic model in which the northward subduction of the Neo-Tethyan oceanic crust began at ~125 Ma, the Neo-Tethyan ridge was subducted beneath South China at ~104 Ma, and a back-arc tectonic setting developed as the Neo-Tethyan slab retreated at ~80 Ma. [13] suggested that Cretaceous andesites (93.38 ± 0.83 Ma) and diorites (107.6 ± 1.2 Ma) in the southeastern Guilin region were related to the northward subduction of the Neo-Tethys Plate. The southeastern Guilin region is located along the E–W-trending magmatic belt, and the numerous Middle–Late Cretaceous magmatic rocks, including the Liuwang quartz porphyry, are likely related to the northward subduction of the Neo-Tethys Plate (Figure 12b).

6. Conclusions

(1)
The zircon U–Pb ages of the Liuwang granodiorite and quartz porphyry from southeastern Guangxi are 161.8 ± 1.2 and 97.89 ± 0.68 Ma, respectively.
(2)
The Liuwang granodiorite belongs to the high-K calc-alkaline series, whereas the Liuwang quartz porphyry is transitional between the K-diorite and high-K calc-alkaline series. The Liuwang granodiorite is enriched in large ion lithophile elements, including Rb, and high field strength elements, including Th, U, Pb, and Ta, and is depleted in Ba, Nb, and Sr. The Liuwang quartz porphyry is enriched in large ion lithophile elements and high field strength elements and relatively depleted in Ba, Nb, Sr, and Zr. The chemical and Hf isotopic compositions of these rocks suggest that the Liuwang granodiorite resulted from the partial melting of Palaeoproterozoic–Mesoproterozoic metasandstone, with the addition of a small amount of mantle-derived melt. In contrast, the Liuwang quartz porphyry formed owing to the partial melting of Mesoproterozoic pelitic rocks in the lower crust, which was triggered by upwelling hot mantle-derived material.
(3)
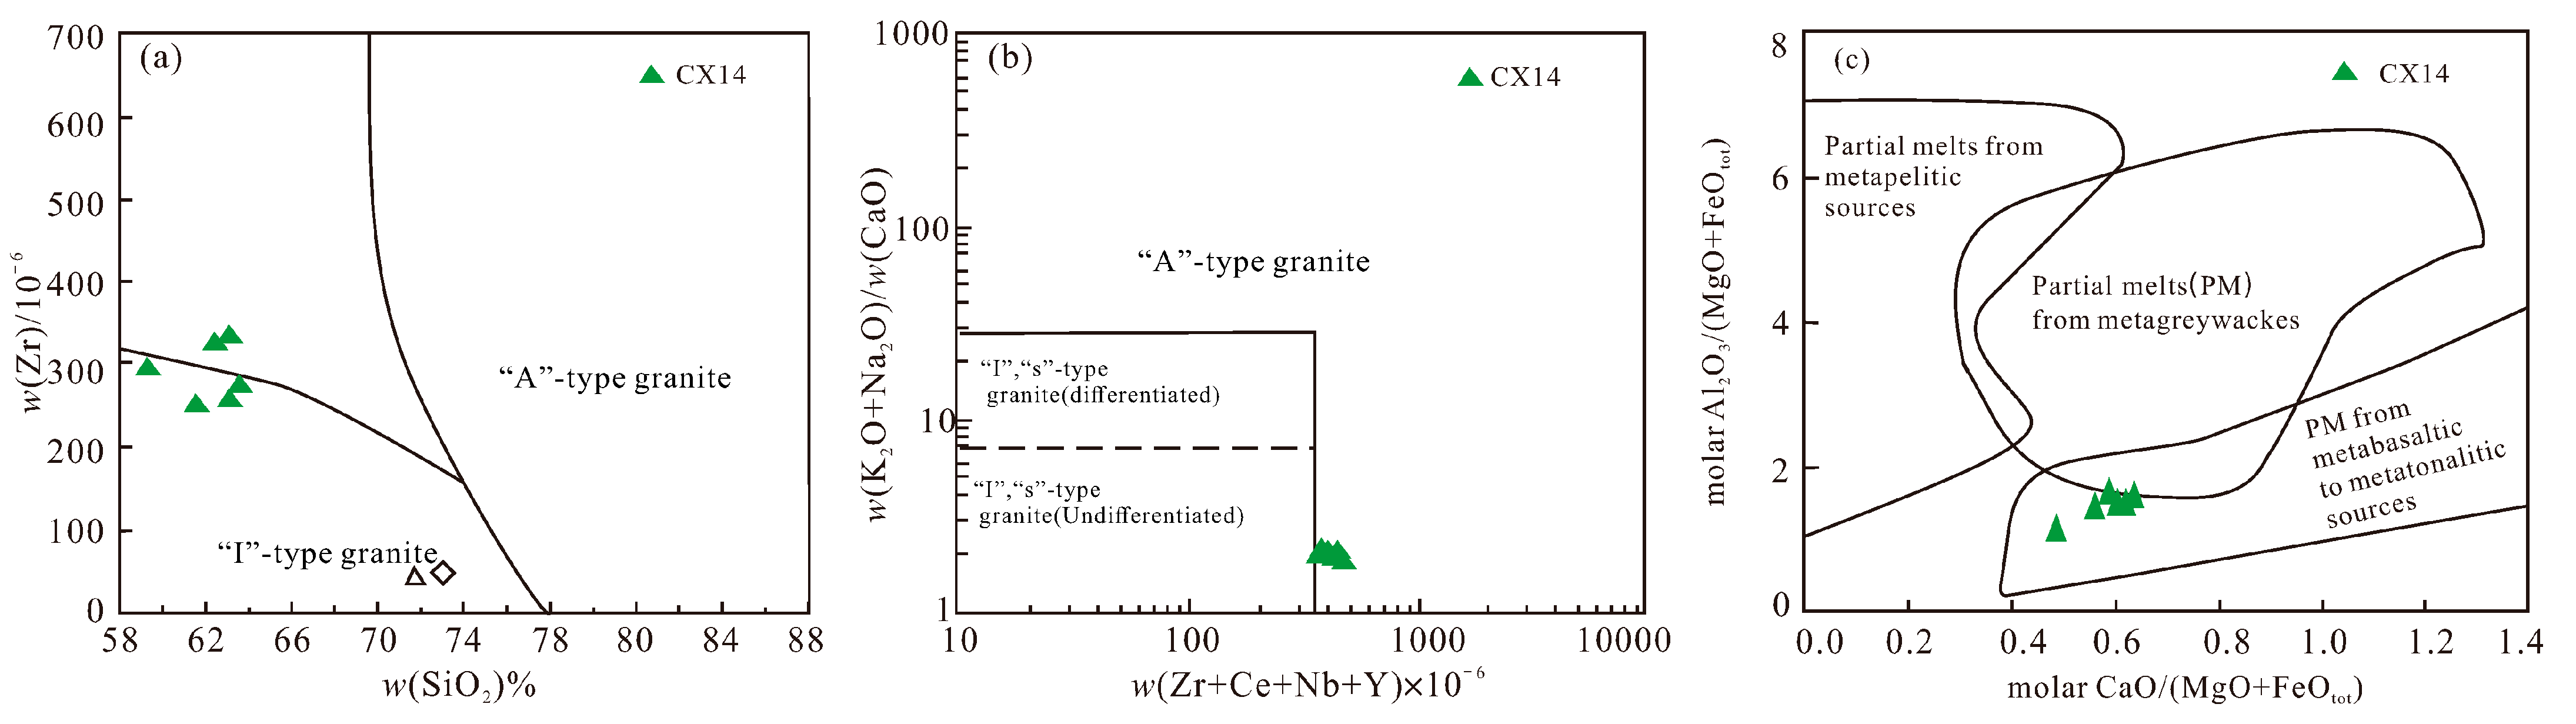
The Liuwang granodiorite in southeastern Guangxi has characteristics typical of I-type granite. In the southeastern region of Guangxi, there is a notable presence of potassic syenites and Adakite rocks. Geochemical analyses suggest that these potassic syenites originated in an intraplate setting, distant from the subduction zone. Likewise, Adakite rocks did not arise from the melting of subducted plates. Consequently, it can be inferred that Liuwang granodiorite syenite formed within an intraplate tectonic environment, far removed from the subduction zone.
In contrast, the Liuwang quartz porphyry has features consistent with continental margin arc magmatic rocks and formed during the Late Cretaceous in a tectonic setting associated with the northward subduction of the Neo-Tethyan oceanic crust beneath South China.

Author Contributions

Writing—original draft preparation, Q.-G.M.; writing—review and editing, S.-S.L.; resources, X.-Y.L.; software, J.-B.W., C.-J.Y., K.L. and W.-Q.H. All authors have read and agreed to the published version of the manuscript.

Funding

This research was funded by [the Natural Science Foundation of Guangxi] grant number [2020GXNSFAA297091] and The APC was funded by [the National Natural Science Foundation of China] grant number [42262026].

Data Availability Statement

Data available on request due to restrictions eg privacy or ethical. The data presented in this study are available on request from the corresponding author.

Acknowledgments

This study was supported by the Natural Science Foundation of Guangxi (Grant Number 2020GXNSFAA297091) and the National Natural Science Foundation of China (Grant Number 42262026).

Conflicts of Interest

The authors declared that they have no conflict of interest to this work. We declare that we do not have any commercial or associative interest that represents a conflict of interest in connection with the work submitted.

References

  1. Liu, Z.; Jiang, Y.; Wang, G.; Ni, C.; Qing, L.; Zhang, Q. Middle Neoproterozoic (~845 Ma) continental arc magmatism along the northwest side of the Jiangshan–Shaoxing suture, South China: Geochronology, geochemistry, petrogenesis and tectonic implications. Precambrian Res. 2015, 268, 212–226. [Google Scholar] [CrossRef]
  2. Zhao, G. Jiangnan Orogen in South China: Developing from divergent double subduction. Gondwana Res. 2015, 27, 1173–1180. [Google Scholar] [CrossRef]
  3. Duan, R.; Ling, W.; Li, Q.; Qiu, X.; Yang, H.; Liu, C.; Lu, S. Geochemical and Zircon U-Pb Geochronological Characteristics of the Mashan Complex from Southeastern Guangxi Province and Their Significance to the Tectonic Setting. Acta Geol. Sin. 2013, 87, 1221–1232. [Google Scholar]
  4. Hua, R.; Chen, P.; Zhang, W.; Lu, J. Three major metallogenic events in Mesozoic in South China. Miner. Depos. 2005, 24, 99–107. [Google Scholar]
  5. Luo, J.; Che, Z.; Guo, A.; Cheng, S.; Pei, X. Late Cretaceous lithospheric extension in the Nandan-Hechi tectonic zone of northern Guangxi Province and its influence on hydrocarbon accumulation conditions. Oil Gas Geol. 2009, 30, 619–625. [Google Scholar]
  6. Mao, J.; Xie, G.; Guo, C.; Yuan, S.; Cheng, Y.; Chen, Y. Spatial-Temporal Distribution of Mesozoic Ore Deposits in South China and Their Metallogenic Settings. Geol. J. China Univ. 2008, 14, 510–526. [Google Scholar]
  7. Wang, J.; Ma, X.; Li, Y.; Lu, C.; Chen, L.; Chen, B.; Wang, Z. Petrogenesis of Granitic Complexes and Implications for the W-Mo Mineralization: A Case Study from the Youmapo Pluton, Guangxi Province. Acta Geol. Sin. 2014, 88, 1219–1235. [Google Scholar]
  8. Wei, C.; Cai, M.; Cai, J.; Wang, X.; Che, Q.; Du, H.Y. Characteristics of structural control of ore deposition in South China in the mesozoic. J. Geomech. 2004, 10, 113–121. [Google Scholar]
  9. Xu, D.; Lin, Z.; Luo, X.; Zhang, K.; Zhang, X.; Huang, H. Metallogenetic series of major metallic deposits in the Qinzhou—Hangzhou metallogenic belt. Earth Sci. Front. 2015, 22, 7–24. [Google Scholar]
  10. Zhou, X. My Thinking about Granite Geneses of South China. Geol. J. China Univ. 2003, 9, 556–565. [Google Scholar]
  11. Li, J.; Zhang, Y.; Dong, S.; Johnston, S.T. Cretaceous tectonic evolution of South China: A preliminary synthesis. Earth-Sci. Rev. 2014, 134, 98–136. [Google Scholar] [CrossRef]
  12. Liang, C.; Xu, X.; Li, Q.; Gui, L.; Tang, S. Inversion and Tectonic Implications of Fault-Slip Data of NE-SW-Striking Fault Zones in Eastern Jiangnan Area. Earth Sci. Front. 2019, 44, 1761–1772. [Google Scholar]
  13. Liu, Y.; Fang, N.; Qiang, M.; Jia, L.; Song, C. The Cretaceous igneous rocks in southeastern Guangxi and their implication for tectonic environment in southwestern South China Block. Open Geosci. 2020, 12, 518–531. [Google Scholar] [CrossRef]
  14. Wang, Y.; Fan, W.; Zhang, G.; Zhang, Y. Phanerozoic tectonics of the South China Block: Key observations and controversies. Gondwana Res. 2013, 23, 1273–1305. [Google Scholar] [CrossRef]
  15. Zhang, L.; Hu, Y.; Liang, J.; Ireland, T.; Chen, Y.; Zhang, R.; Sun, W. Adakitic rocks associated with the Shilu copper–molybdenum deposit in the Yangchun Basin, South China, and their tectonic implications. Acta Geochim. 2017, 36, 132–150. [Google Scholar] [CrossRef]
  16. Zhang, Y.; Dong, S.; Li, J.; Cui, J.; Shi, W.; Su, J.; Li, Y. The New Progress in the Study of Mesozoic Tectonics of South China. Acta Geosci. Sin. 2012, 33, 257–279. [Google Scholar]
  17. Mao, J. The mesozoic—Cenozoic magmatism and geodynamics of crustal and mantle evolution in southeast China continent. East China Geol. 1994, 15, 1–11. [Google Scholar]
  18. Liu, K.; Li, Z.-L.; Xu, W.-G.; Ye, H.-M.; Zhao, X.-L. The Spatial-Temporal Distributions and Migrations of Mesozoic Magmaism in South China and Subduction Process of the Paleo-Pacific Plate. Bull. Mineral. Petrol. Geochem. 2016, 35, 1141–1151. [Google Scholar]
  19. Griffin, W.L.; Pearson, N.J.; Belousova, E.; Jackson, S.E.; Van Achterbergh, E.; O’reilly, S.Y.; Shee, S.R. The Hf isotope composition of cratonic mantle: LAM-MC-ICPMS analysis of zircon megacrysts in kimberlites. Geochim. Cosmochim. Acta 2000, 64, 133–147. [Google Scholar] [CrossRef]
  20. Li, X.; Liu, Y.; Tu, X.; Hu, G.; Zeng, W. Precise determination of chemical compositions in silicate rocks using ICP-AES and ICP-MS: A comparative study of sample digestion techniques of alkali fusion and acid dissolution. Geochimica 2002, 31, 289–294. [Google Scholar]
  21. Liu, Y.; Liu, H.; Li, X. Simultaneous and precise determination of 40 trace elements in rock samples using ICP-MS. Geochimica 1996, 25, 552–558. [Google Scholar]
  22. Maniar, P.D.; Piccoli, P.M. Tectonic discrimination of granitoids. Geol. Soc. Am. Bull. 1989, 101, 635–643. [Google Scholar] [CrossRef]
  23. Peccerillo, A.; Taylor, S.R. Geochemistry of Eocene Calc-Alkaline Volcanic Rocks from the Kastamonu Area, Northern Turkey. Open J. Geol. 1976, 6, 63–81. [Google Scholar] [CrossRef]
  24. Sun, S.S.; McDonough, W.F. Chemical and isotopic systematics of oceanic basalts: Implications for mantle composition and processes. Geol. Soc. Lond. Spec. Publ. 1989, 42, 313–345. [Google Scholar] [CrossRef]
  25. Corfu, F.; Hanchar, J.M.; Hoskin, P.W.O.; Kinny, P. Atlas of zircon textures. Rev. Mineral. Geochem. 2003, 53, 469–500. [Google Scholar] [CrossRef]
  26. Fornelli, A.; Piccarreta, G.; Micheletti, F. In situ U-Pb Dating Combined with SEM Imaging on Zircon—An Analytical Bond for Effective Geological Recontructions. In Geochronology: Methods and Case Studies; inTECH: London, UK, 2014; pp. 109–139. [Google Scholar]
  27. Rubatto, D. Zircon: The Metamorphic Mineral. Rev. Mineral. Geochem. 2017, 83, 261–295. [Google Scholar] [CrossRef]
  28. Hoskin, P.W.O.; Black, L.P. Metamorphic zircon formation by solid-state recrystallization of protolith igneous zircon. J. Metamorph. Geol. 2000, 18, 423–439. [Google Scholar] [CrossRef]
  29. Fornelli, A.; Festa, V.; Micheletti, F.; Spiess, R.; Tursi, F. Building an Orogen: Review of U-Pb Zircon Ages from the Calabria–Peloritani Terrane to Constrain the Timing of the Southern Variscan Belt. Minerals 2020, 10, 944. [Google Scholar] [CrossRef]
  30. Wu, F.; Li, X.; Yang, J.; Zheng, Y. Discussions on the petrogenesis of granites. Acta Petrol. Sin. 2007, 6, 1217–1238. [Google Scholar]
  31. Sylvester, P.J. Post-collisional strongly peraluminous granites. Lithos 1998, 45, 29–44. [Google Scholar] [CrossRef]
  32. Whalen, J.B.; Currie, K.L.; Chappell, B.W. A-type granites: Geochemical characteristics, discrimination and petrogenesis. Contrib. Mineral. Petrol. 1987, 95, 407–419. [Google Scholar] [CrossRef]
  33. Chappell, B.W.; Bryant, C.J.; Wyborn, D. Peraluminous I-type granites. Lithos 2012, 153, 142–153. [Google Scholar] [CrossRef]
  34. Miller, C.F. Are strongly peraluminous magmas derived from pelitic sedimentary sources? J. Geol. 1985, 93, 673–689. [Google Scholar] [CrossRef]
  35. Watson, E.B.; Harrison, T.M. Zircon saturation revisited: Temperature and composition effects in a variety of crustal magma types. Earth Planet. Sci. Lett. 1983, 64, 295–304. [Google Scholar] [CrossRef]
  36. Li, X. U-Pb zircon ages of granites from northern Guangxi and their tectonic significance. Geochimica 1999, 28, 1–9. [Google Scholar]
  37. Chen, X.; Wang, Y.; Zhang, Y.; Zhang, A.; Cao, Y. Geochronology and Geochemical Characteristics of the Nandu Syenite in SE Guangxi and its Implications. Geotecton. Metallog. 2013, 37, 284–293. [Google Scholar]
  38. Geng, H.; Xu, X.; O’Reilly, S.Y.; Zhao, M.; Sun, T. Cretaceous Volcanic and Intrusive Magmatic Activities in Western Guangdong: Their Geological Significance. Sci. Sin. (Terrae) 2006, 36, 601–617. [Google Scholar]
  39. Wang, X. Late Yanshanian Magmatism and W-Mineralization in Yunkai Region, Guangxi Province. Ph.D. Thesis, China University of Geosciences, Wuhan, China, 2017. [Google Scholar]
  40. Pearce, J.A. Role of the Sub-continental Lithosphere in Magma Genesis at Active Continental Margins. In Continental Basalts and Mantle Xenoliths; Shiva Publications: Nantwich, UK, 1983; pp. 230–249. [Google Scholar]
  41. Lao, M.; Zou, H.; Du, X.; Ding, R. Geochronology and geochemistry of the Mashan Late Jurassic shoshonitic intrusives in Hengxian, Guangxi: With a discussion on Yanshanian tectonic settings of the southwestern segment of Qinzhou—Hangzhou metallogenic belt. Earth Sci. Front. 2015, 22, 95–107. [Google Scholar]
  42. Song, J. Petrogenesis and geological implications of the Mashan shoshonitic complex in NE Guangxi (SW China). 2016. [Google Scholar]
  43. Xin, X.; Chen, J.; Zhang, X.; Tang, J.; Xie, Z.; Zhou, T.; Liu, Y. Nd isotopic ratios of K-enriched magmatic complexes from southeastern Guangxi province: Implications for upwelling of the mantle in southeastern China during the Mesozoic. Acta Petrol. Sin. 2001, 17, 19–27. [Google Scholar]
  44. Xu, H.; Han, S.; Zhang, F.; Huang, Q.; Bai, X.; Chen, Z. Characteristics, petrogenesis and tectonic implications of the Jurassic adakitic granites at southeast edge of Dayao Mountain, Guangxi. Acta Petrol. Mineral. 2021, 40, 1074–1092. [Google Scholar]
  45. Dong, S.; Zhang, Y.; Long, C.; Yang, Z.; Ji, Q.; Wang, T.; Chen, X. Jurassic Tectonic Revolution in China and New Interpretation of the Yanshan Movement. Acta Geol. Sin. 2007, 82, 1449–1461. [Google Scholar]
  46. Xing, G.; Lu, Q.; Chen, R.; Zhang, Z.; Nie, T.; Li, L.; Lin, M. Study on the Ending Time of Late Mesozoic Tectonic Regime Transition in South China—Comparing to the Yanshan Area in North China. Acta Geol. Sin. 2008, 82, 451–463. [Google Scholar]
  47. Xing, G.; Yang, Z.; Mao, J.; She, L.; Shen, J.; Sun, Q.; Tao, K. Characteristics of Early Jurassic igneous rocks on the continental margin of southeastern China and their tectonic significance. Geol. Bull. China 2002, 21, 384–391. [Google Scholar]
  48. Zhao, Y.; Xu, G.; Zhang, S.; Yang, Z.; Zhang, Y.; Hu, J. Yanshanian movement and conversion of tectonic regimes in East Asia. Earth Sci. Front. 2004, 11, 319–328. [Google Scholar]
  49. Shu, L. An analysis of principal features of tectonic evolution in South China Block. Geol. Bull. China 2012, 31, 1035–1053. [Google Scholar]
  50. Xu, X.; Dong, C.; Li, W.; Zhou, X. Late Mesozoic intrusive complexes in the coastal area of Fujian, SE China: The significance of the gabbro-diorite–granite association. Lithos 1999, 46, 299–315. [Google Scholar] [CrossRef]
  51. Zhou, X.; Li, W. Origin of Late Mesozoic igneous rocks in Southeastern China: Implications for lithosphere subduction and underplating of mafic magmas. Tectonophysics 2000, 326, 269–287. [Google Scholar] [CrossRef]
  52. Zhang, L. The Closure of Tethys and Cretaceous Mineralization: A Case Study of the Yangchun Basin. 2017. [Google Scholar]
  53. Deng, J.; Xiao, Q.; Su, S.; Liu, C.; Zhao, G.; Wu, Z.; Liu, Y. Igneous Petrotectonic Assemblages and Tectonic Settings: A Discussion. Geol. J. China Univ. 2007, 13, 392–402. [Google Scholar]
  54. Poli, G. Potassic Igneous Rocks and Associated Gold-Copper Mineralization. Litos, in Mineral Resource Reviews; Springer: Berlin/Heidelberg, Germany, 2001; pp. 265–266. [Google Scholar]
  55. Gorton, M.P.; Schandl, E.S. From continents to island arcs: A geochemical index of tectonic setting for Arc-related and within-plate felsic to intermediate volcanic rocks. Can. Mineral. 2000, 38, 1065–1073. [Google Scholar] [CrossRef]
  56. Gilder, S.A.; Gill, J.; Coe, R.S.; Zhao, X.; Liu, Z.; Wang, G.; Wu, H. Isotopic and paleomagnetic constraints on the Mesozoic tectonic evolution of south China. J. Geophys. Res. Solid Earth 1996, 101, 16137–16154. [Google Scholar] [CrossRef]
  57. Li, J.; Ma, Z.; Zhang, Y.; Dong, S.; Li, Y.; Lu, M.A.; Tan, J. Tectonic evolution of Cretaceous extensional basins in Zhejiang Province, eastern South China: Structural and geochronological constraints. Int. Geol. Rev. 2014, 56, 1602–1629. [Google Scholar] [CrossRef]
  58. Li, J.; Zhang, Y.; Dong, S.; Li, H. Late Mesozoic–Early Cenozoic deformation history of the Yuanma Basin, central South China. Tectonophysics 2012, 570–571, 163–183. [Google Scholar]
  59. Li, S.; Feng, Z.; Shan, Y.; Fu, W.; Le, X.; Liu, W.; Xu, W. Fracture structural analysis of Nongtun Pb-Zn deposit in Xidamingshan, Guangxi. Miner. Depos. 2017, 36, 275–290. [Google Scholar]
  60. Fang, N. A new model on the Mesozoic “South China Sea”(SCS): Reconstructing the Hainan marginal arc and recognizing the Tethyan SCS. Earth Sci. Front. 2016, 23, 107–119. [Google Scholar]
  61. Qiang, M. The Basic Characteristics of Cretaceous Andesites in the Northern Margin of South China Sea and Its Comparison with the Andesites of Southeast China. Master’s Thesis, China University of Geosciences, Beijing, China, 2016. [Google Scholar]
  62. Sun, W. Initiation and evolution of the South China Sea: An overview. Acta Geochim. 2016, 35, 215–225. [Google Scholar] [CrossRef]
  63. Sun, W.; Lin, C.; Zhang, L.; Liao, R.; Li, C. The formation of the South China Sea resulted from the closure of the Neo-Tethys: A perspective from regional geology. Acta Petrol. Sin. 2018, 34, 3467–3478. [Google Scholar]
  64. Deng, J.; Yang, X.; Zartman, R.E.; Qi, H.; Zhang, L.; Liu, H.; Sun, W. Early cretaceous transformation from Pacific to Neo-Tethys subduction in the SW Pacific Ocean: Constraints from Pb-Sr-Nd-Hf isotopes of the Philippine arc. Geochim. Cosmochim. Acta 2020, 285, 21–40. [Google Scholar] [CrossRef]
Figure 1. (a) Simplified map of China (b) Tectonic framework of South China. (c) Geologic map of southeastern Guangxi, South China.
Minerals 13 01341 g001
Figure 3. Geological sketch map of the Liuwang area.
Minerals 13 01341 g003
Figure 4. (a,b) Outcrop photographs and (c,d) photomicrographs of the granodiorite and quartz porphyry. Qtz: quartz, Pl: plagioclase, Ep: epidote, Chl: chlorite, Ser: sericite, Am: amphibolite.
Minerals 13 01341 g004
Figure 5. (a) A/NK versus A/CNK [22] and (b) K2O versus SiO2 [23] diagrams for the Liuwang granodiorite and quartz porphyry. A/NK: molar Al/(Na + K), A/CNK: molar Al/(Ca + Na + K).
Minerals 13 01341 g005
Figure 6. (a) Primitive mantle-normalized trace element spider diagram and (b) chondrite-normalized REE patterns for the Liuwang granodiorite and quartz porphyry. The primitive mantle and chondrite values are from [24].
Minerals 13 01341 g006
Figure 7. (a,b) Representative zircon cathodoluminescence images showing locations of LA–ICP–MS analyses (circles) and associated U–Pb ages (c,d) 206Pb/238U versus 207Pb/235U Concordia diagrams showing the results of zircon LA–ICP–MS U–Pb analysis.
Minerals 13 01341 g007
Figure 9. (a) FeO/MgO versus SiO2, (b) Zr + Ce + Nb + Y versus (K2O + Na2O)/CaO, (c) molar CaO/(MgO + TFeO) versus molar Al2O3/(MgO + TFeO) [32], (d) CaO/Na2O versus Al2O3/TiO2, SP:strongly peraluminous, and (e) Rb/Ba versus Rb/Sr diagrams for the Liuwang quartz porphyry [31].
Minerals 13 01341 g009
Figure 10. (a) Nb versus Y and (b) Ta versus Yb diagrams for the Liuwang granodiorite. WPG: within plate granite, syn-COLG: syn-collision granite, VAG: volcanic arc granite, ORG: ocean ridge granite [40].
Minerals 13 01341 g010
Figure 11. (a) Y versus Zr diagram [54] and (b) Th/Ta versus Yb diagram for the Liuwang quartz porphyry. WPVZ: within-plate volcanic zones, MORB: mid-ocean ridge basalts, WPB: within-plate basalts [55].
Minerals 13 01341 g011
Figure 12. Tectonic model for the formation of the Liuwang granodiorite and quartz porphyry. (a) represents the tectonic model of Jurassic Liuwang granodiorite, and (b) represents the tectonic model of Cretaceous Liuwang quartz porphyry.
Minerals 13 01341 g012
Table 1. Zircon U–Pb data for the granodiorite and quartz porphyry samples.
ωB/ppm Isotopic RatiosApparent Ages (Ma)
AnalysisThUTh/U207Pb/206Pb207Pb/235U206Pb/238U207Pb/206Pb207Pb/235U206Pb/238UConcordance
CX14-N1-013616270.580.04820.00340.16680.01210.02510.000510915615710160393%
CX14-N1-0285128260.30.04890.00160.16910.00530.02520.0003143761595161297%
CX14-N1-0365715740.040.04650.00270.16010.00890.02520.00042001461518160298%
CX14-N1-0436412250.30.04840.00240.17120.00840.02570.00041171111607164293%
CX14-N1-054188660.480.05170.00330.18120.01190.02540.000527214416910162399%
CX14-N1-063999040.440.0470.0030.16260.00980.02540.00055613915309162397%
CX14-N1-0758811210.520.04570.00250.15940.00870.02540.00045311515007162395%
CX14-N1-08122425580.480.04640.00170.16530.00610.02590.000317851555165294%
CX14-N1-0990420810.430.05010.00250.17140.00790.02510.00031981131617160292%
CX14-N1-1050913830.370.05020.00290.17530.00970.02560.00042111331648163296%
CX14-N1-1139317240.230.04870.00250.17070.00850.02550.00042001191607163294%
CX14-N1-1283815750.530.0510.00230.17940.00830.02550.0003243711687162299%
CX14-N1-1374716970.440.04890.00210.17040.00720.02550.00041431001606162299%
CX14-N1-14100321490.470.05080.00240.17560.00780.02530.00032321121647161299%
CX14-N1-1565628170.230.05030.00210.17370.00750.02520.0004209961637160296%
CX15-N1-019543150500.630.05150.00140.11160.00330.01570.0002265651073100184%
CX15-N1-029902224050.440.05120.00130.1080.00290.01520.000225059104397193%
CX15-N1-039974264810.380.04850.00110.10310.00250.01540.00021245299.7298193%
CX15-N1-0430688451990.680.04860.00110.10330.00250.01530.00021325599.9298198%
CX15-N1-055272146390.360.05260.00130.10910.00310.0150.000232257105396198%
CX15-N1-0611026293740.380.04870.00120.10350.00270.01540.000220057100298190%
CX15-N1-0727578405890.680.04830.0010.10160.00240.01520.00021225098.2297198%
CX15-N1-0811353271420.420.04810.0010.10110.00230.01520.00011065097.8297199%
CX15-N1-0911322261760.430.04890.00110.10370.00240.01540.000214345100298199%
CX15-N1-1014732321990.460.050.0010.10560.00230.01530.000119546102298168%
CX15-N1-1110534228000.460.0520.00120.10850.00280.01510.000228356105397198%
CX15-N1-1213311324440.410.04710.0010.10050.00240.01540.00025351.897.2299188%
CX15-N1-1310921262980.420.04780.00120.10260.00290.01550.0002875899.2299174%
Table 2. Zircon Hf isotopic data for the granodiorite and quartz porphyry samples.
AnalysisAge176Hf/177Hf±1σ176Lu/177Hf176Yb/177HfεHf(t)±1σtDM1tDM2
CX14-N1
11600.2825160.0000160.0011030.038980−6.060.5710431565
21610.2824640.0000170.0009910.034605−7.720.611071670
31600.2825310.0000120.0007720.027099−5.50.410131530
41640.2824800.0000130.0010170.036305−7.270.4610921645
51620.2825500.0000170.0010450.038180−4.830.589941489
61620.2826480.0000160.0012610.041615−1.370.578601270
71620.2825480.0000140.0006820.023804−4.840.479871490
81650.282026 0.0000150.000501 0.017941−23.260.5217022642
91600.2825010.0000140.0014850.054293−6.660.4710751602
101630.2823770.0000180.0013130.045657−10.960.6212461875
111630.2825620.0000170.0012940.043163−4.40.589831462
121620.2826310.0000150.0022510.076835−2.080.539091315
131620.2822960.0000120.0013420.045162−13.830.4113612054
141610.2826160.0000150.0008240.026431−2.480.518951340
151600.2820720.0000110.000260 0.009521−21.680.416282541
CX15-N1
1980.2827210.0000170.0058700.221097−0.50.68641162
2970.2826610.0000140.0057880.216137−2.60.59581295
3990.2826890.0000150.0053560.199650−1.50.59021231
41000.2826430.0000140.0038800.144519−3.10.59341328
5980.2827540.0000160.0042940.164720+0.80.67731081
6980.2826050.0000160.0032850.122893−4.40.69751411
7960.2826700.0000160.0034380.129864−2.20.68811267
8980.2826570.0000160.0058510.217048−2.70.69671305
Table 3. Geochemical data for the studied samples.
SampleCX14-N1-H1CX14-N1-H2CX14-N1-H3CX14-N1-H4CX14-N1-H5CX14-N1-H6
Major elements (wt.%)
SiO259.3362.8762.462.7261.2763.15
TiO21.070.790.780.820.860.77
Al2O316.0416.5316.3216.416.716.21
TFe2O37.445.395.45.535.885.34
MnO0.150.110.120.120.120.12
MgO1.941.41.451.431.571.39
CaO3.833.383.573.743.573.37
Na2O2.983.293.223.263.23.26
K2O4.133.533.93.483.763.55
P2O50.50.250.310.310.290.26
LOI1.631.951.871.822.442.00
Total99.0599.599.3599.6399.6699.42
K2O/Na2O1.391.071.211.071.171.09
Mg#37.7837.7338.5537.5738.3137.79
FeO5.694.124.134.234.54.08
A/CNK0.981.071.021.031.061.06
A/NK1.711.791.721.81.791.76
Trace elements (ppm)
V10270.1467.2375.1573.7665.78
Cr38.4423.729.8726.629.26.62
Co17.1611.9912.1413.5212.811.73
Ni9.3611.548.437.627.136.49
Rb158139143141144141
Sr364426412421416425
Y34.2520.7725.2922.8724.0823.41
Zr293251324330249267
Nb38.112928.9529.429.9828.77
Ba938827927772952820
La40.3444.8940.3248.1338.9352.72
Ce80.1682.6676.2988.8672.6694.68
Pr10.129.329.0710.048.5910.57
Nd49.9534.6635.414533.8742.95
Sm8.846.156.876.536.586.82
Eu2.251.992.131.972.072.01
Gd8.185.936.416.256.086.56
Tb1.340.8710.910.950.95
Dy7.394.515.434.765.134.98
Ho1.380.8310.880.940.91
Er3.882.322.852.552.672.6
Tm0.560.320.410.360.380.37
Yb3.592.082.642.372.422.37
Lu0.590.330.420.390.380.38
Hf8.978.889.259.237.137.52
Ta4.43.062.392.332.22.27
Pb17.6517.5613.0115.8913.6615.79
Th17.1815.0315.0315.9713.1916.46
U4.022.135.152.842.633.24
ΣLREE191.65179.67170.09200.54162.71209.76
ΣHREE60.5737.6345.0240.9542.6542.14
ΣREE252.22217.29215.11241.5205.36241.9
ΣLREE/ΣHREE3.164.783.784.93.824.98
(La/Yb)N8.0515.5110.9614.5511.5315.96
(La/Sm)N2.954.713.794.763.824.99
(Gd/Yb)N1.882.362.012.182.072.29
δEu0.7910.970.930.990.91
Rb/Sr0.430.330.350.330.350.33
Zr/Hf32.7728.3635.0635.843535.53
Nb/Ta8.669.4812.1212.6213.6112.66
La/Ta9.1714.6816.8820.6617.6823.2
SampleCX15-N1-H1CX15-N1-H2CX15-N1-H3CX15-N1-H4CX15-N1-H5CX15-N1-H6
Major element (wt.%)
SiO278.2876.5376.4674.6174.9976.98
TiO20.040.040.040.040.040.03
Al2O311.3711.3912.112.8212.7211.95
Fe2O31.151.470.831.621.510.98
MnO0.070.080.070.070.070.07
MgO0.150.20.160.20.180.16
CaO0.491.430.561.170.690.4
Na2O3.683.482.723.522.62.53
K2O3.143.685.524.435.735.43
P2O50.010.010.010.010.010.01
LOI1.121.111.181.261.221.17
Total99.4999.499.6599.7599.7699.71
K2O/Na2O0.851.062.031.262.22.14
Mg#23.3723.6830.6822.0821.6527.6
FeO0.881.120.631.231.160.75
A/CNK1.10.931.051.011.081.11
A/NK1.21.171.161.211.211.19
Minor element (ppm)
V121.13117.61118.0191.65117.06128.40
Cr19.1022.6714.7240.2420.6714.38
Co20.0222.0723.1415.7819.9828.77
Ni12.3511.9311.4313.3410.9212.75
Rb141.61148.13162.73127.44176.98173.46
Sr306.51338.80326.36309.27339.91325.10
Y41.9138.1240.5122.7537.6841.42
Zr262.70331.06268.55259.88284.10320.00
Nb43.9542.2244.1522.5145.7447.73
Ba741.49818.93928.39685.70926.121049.9
La73.8151.1355.3743.8039.4949.85
Ce143.45100.97111.2884.1282.50101.72
Pr16.7612.4213.699.3610.8012.72
Nd80.6562.0067.8343.7255.6664.18
Sm12.2610.0710.946.479.7310.83
Eu2.422.182.141.672.252.19
Gd11.359.1810.015.648.669.75
Tb1.721.471.570.891.441.58
Dy9.017.968.574.797.908.71
Ho1.631.451.550.861.441.58
Er4.604.104.412.434.094.45
Tm0.620.560.610.340.560.61
Yb3.893.523.782.123.513.84
Lu0.580.520.570.320.520.57
Hf7.728.987.606.867.798.73
Ta2.812.752.940.652.883.16
Pb17.1815.9511.749.6115.1718.28
Th22.1916.5419.0511.1114.8321.38
U4.204.194.682.004.1215.53
∑LREE266.89196.82215.89150.99169.60201.39
∑HREE22.0619.5821.0511.7419.4621.33
∑REE288.95216.40236.94162.74189.06222.73
∑LREE/∑HREE12.1010.0510.2612.868.729.44
(La/Yb)N1.031.040.81.131.231.02
(La/Sm)N0.910.820.750.860.990.93
(Gd/Yb)N0.820.930.840.960.950.81
δEu0.050.060.040.040.050.05
Rb/Sr5.746.6613.598.1912.2111.17
Zr/Hf15.7916.7515.6716.1115.7115.78
Nb/Ta8.228.758.368.668.748.42
La/Ta2.9132.183.183.52.77
Disclaimer/Publisher’s Note: The statements, opinions and data contained in all publications are solely those of the individual author(s) and contributor(s) and not of MDPI and/or the editor(s). MDPI and/or the editor(s) disclaim responsibility for any injury to people or property resulting from any ideas, methods, instructions or products referred to in the content.

