

NdFeB Permanent Magnet Uses, Projected Growth Rates and Nd Plus Dy Demands across End-Use Sectors through 2050: A Review

Abstract
:1. Introduction
2. NdFeB Permanent Magnets
3. Motivation
4. Permanent Magnet (PM) Uses
4.1. Wind
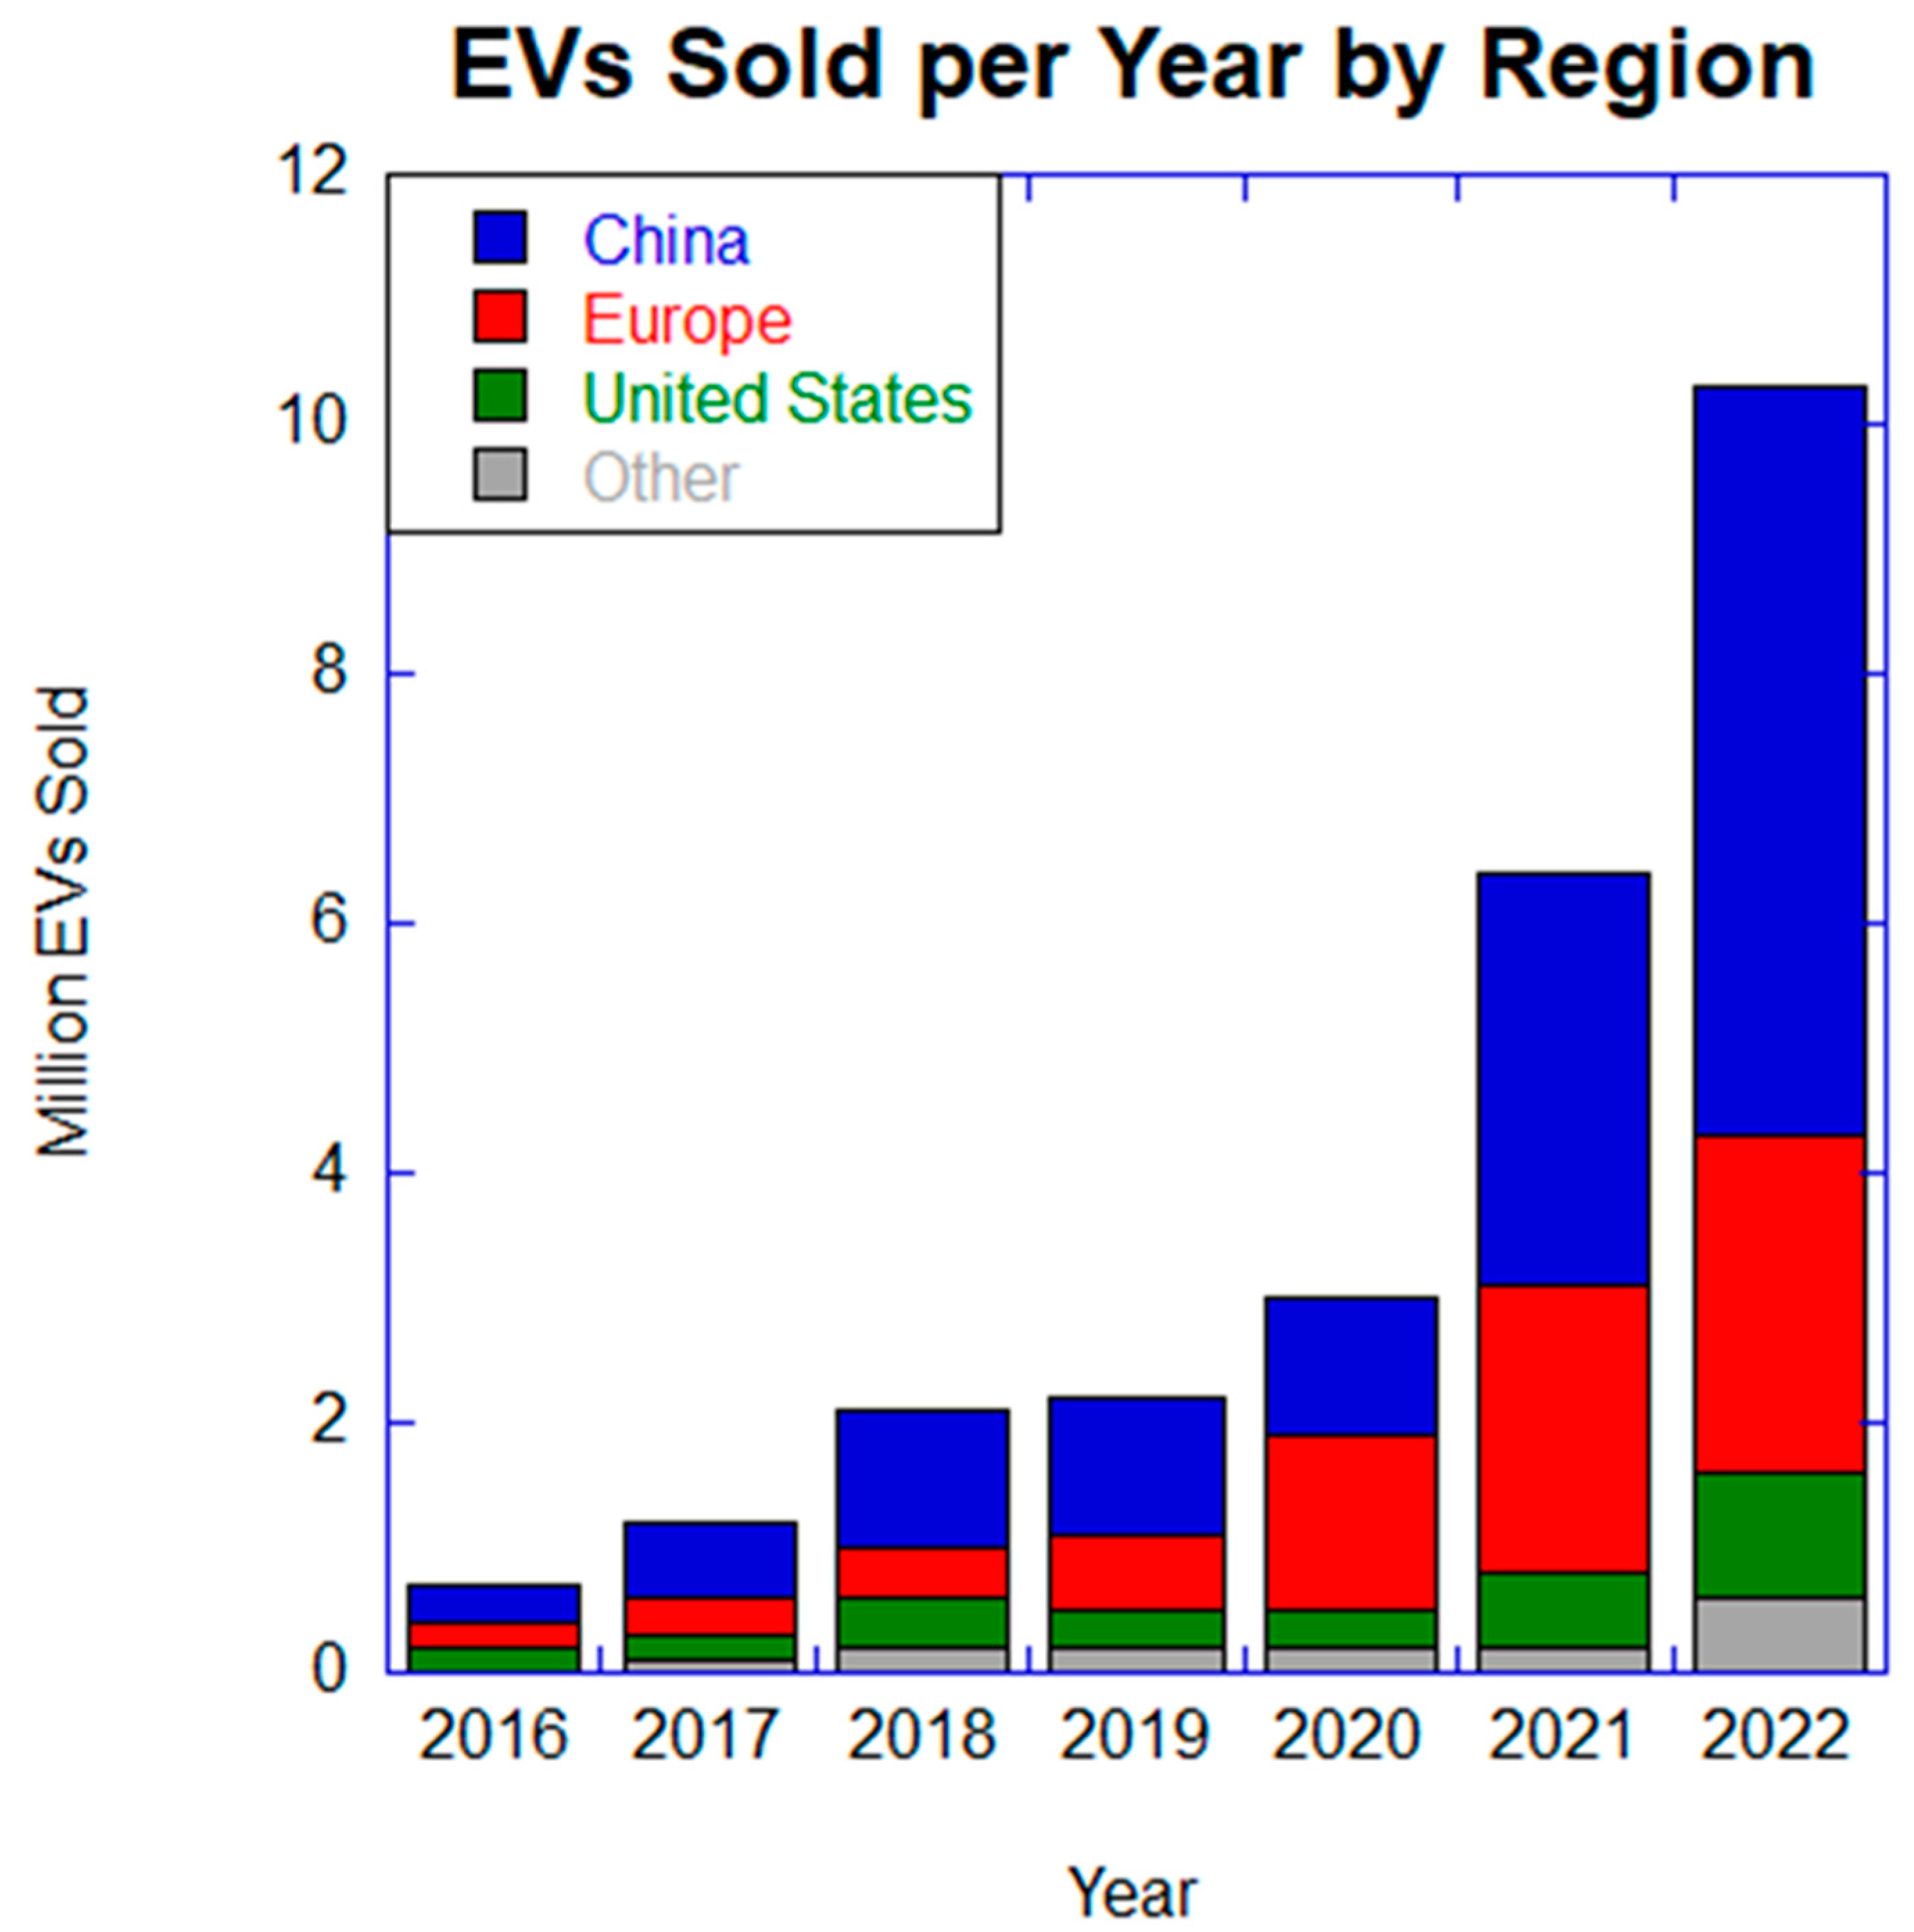
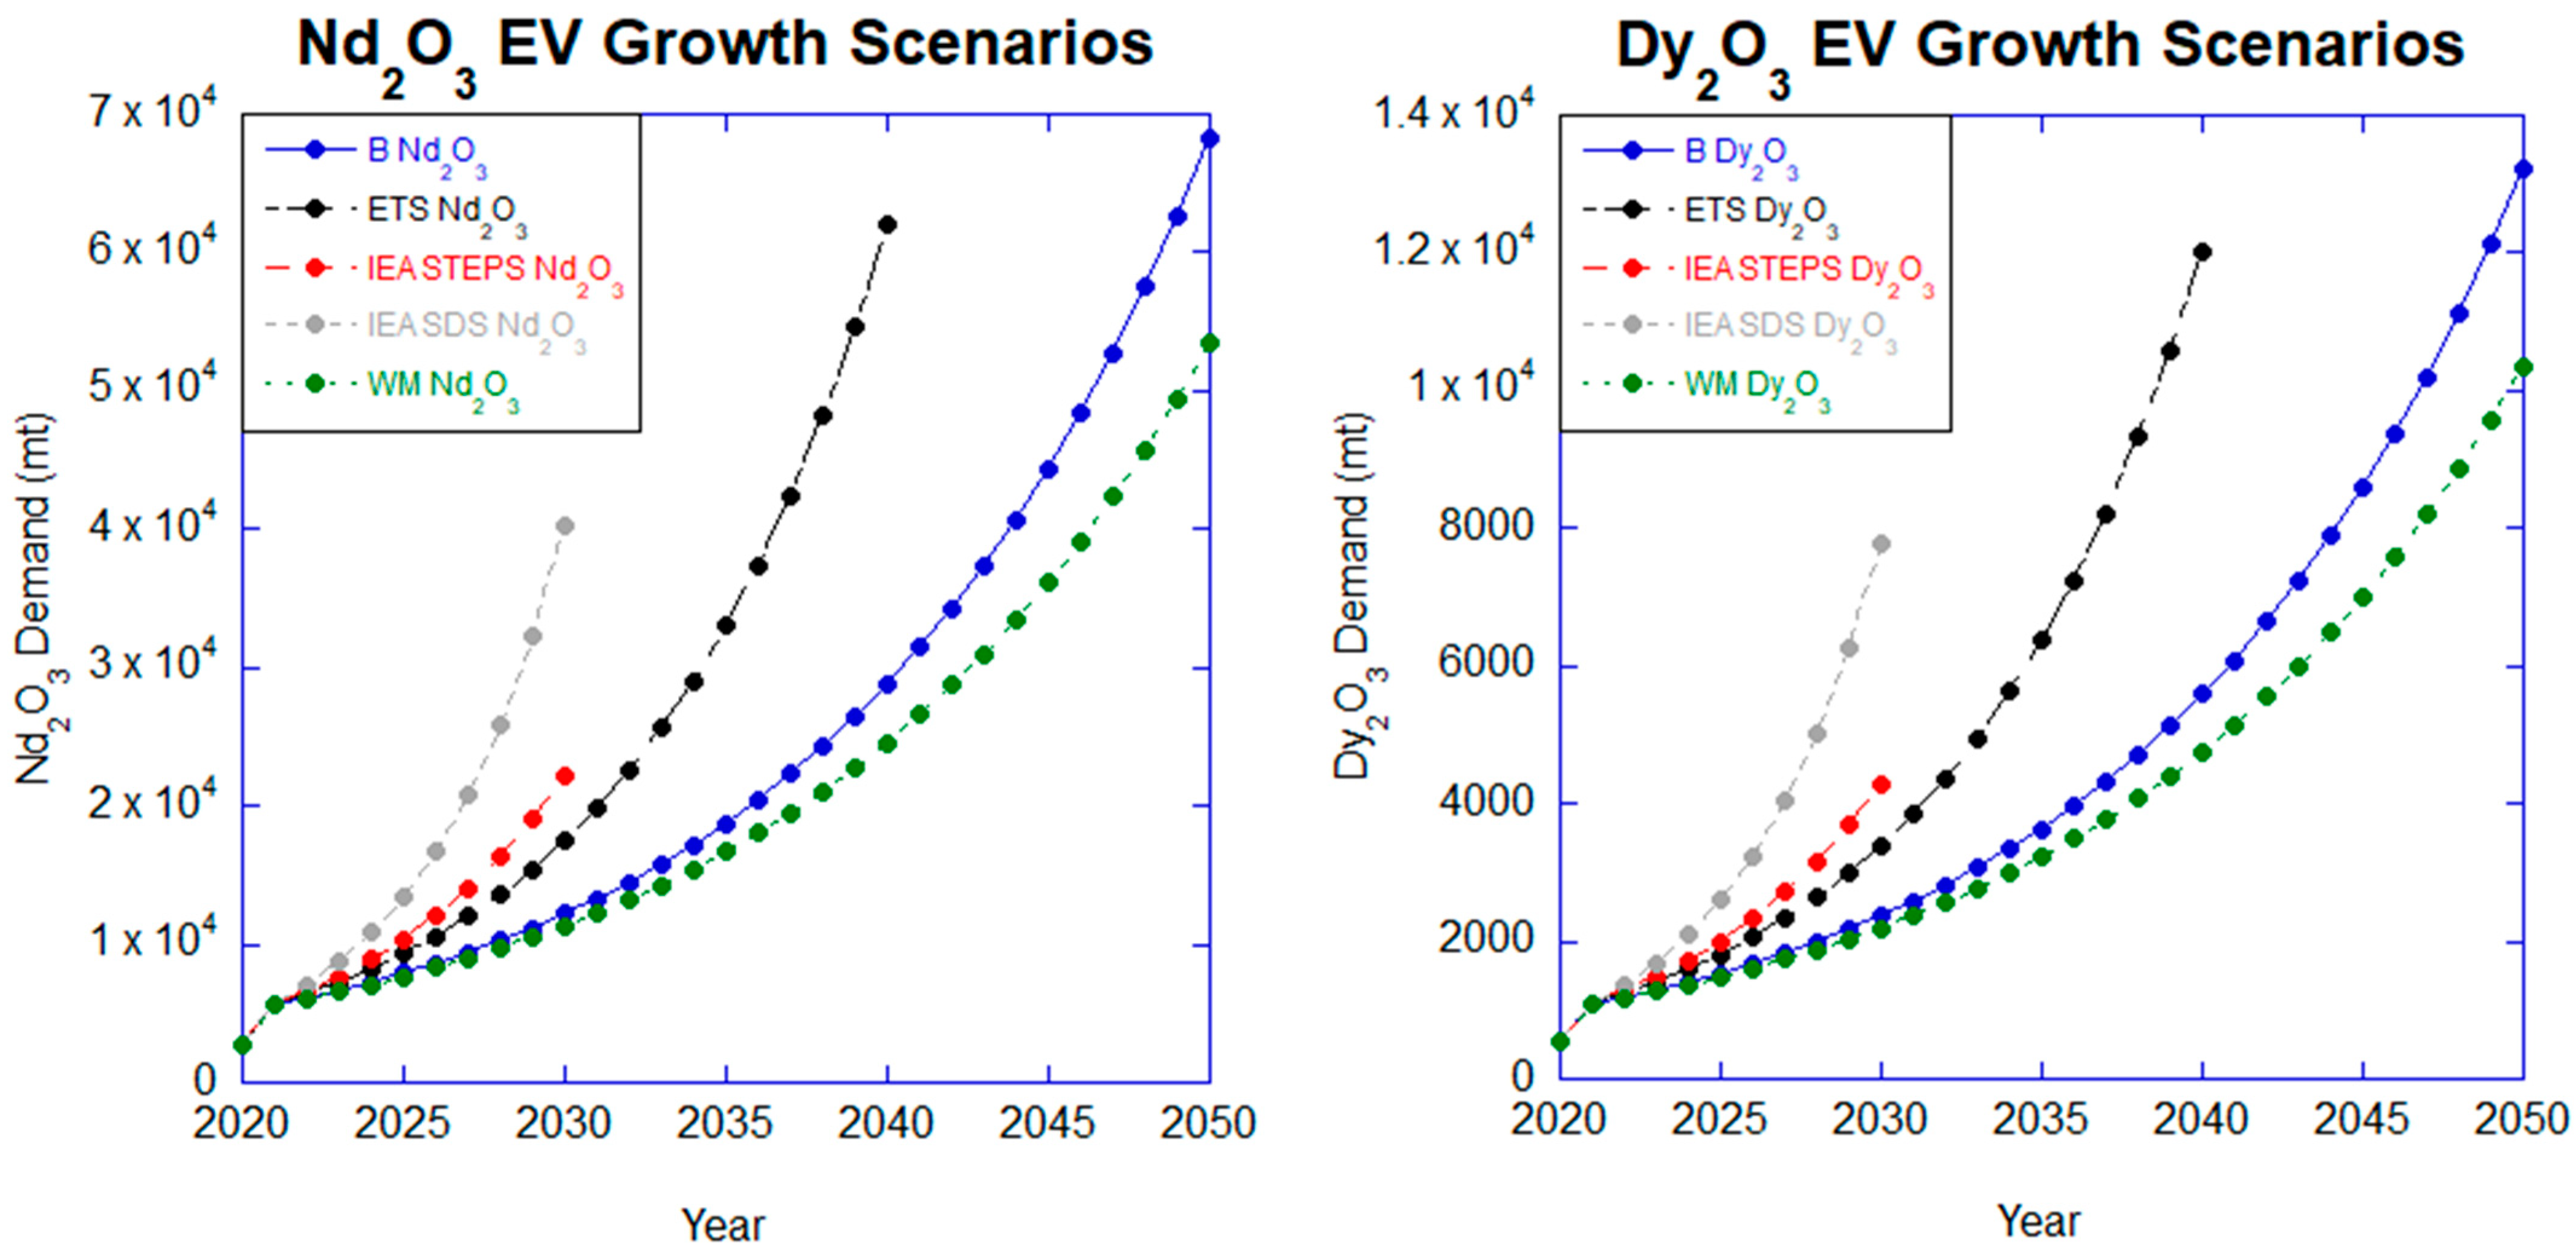
4.2. Electric Vehicles
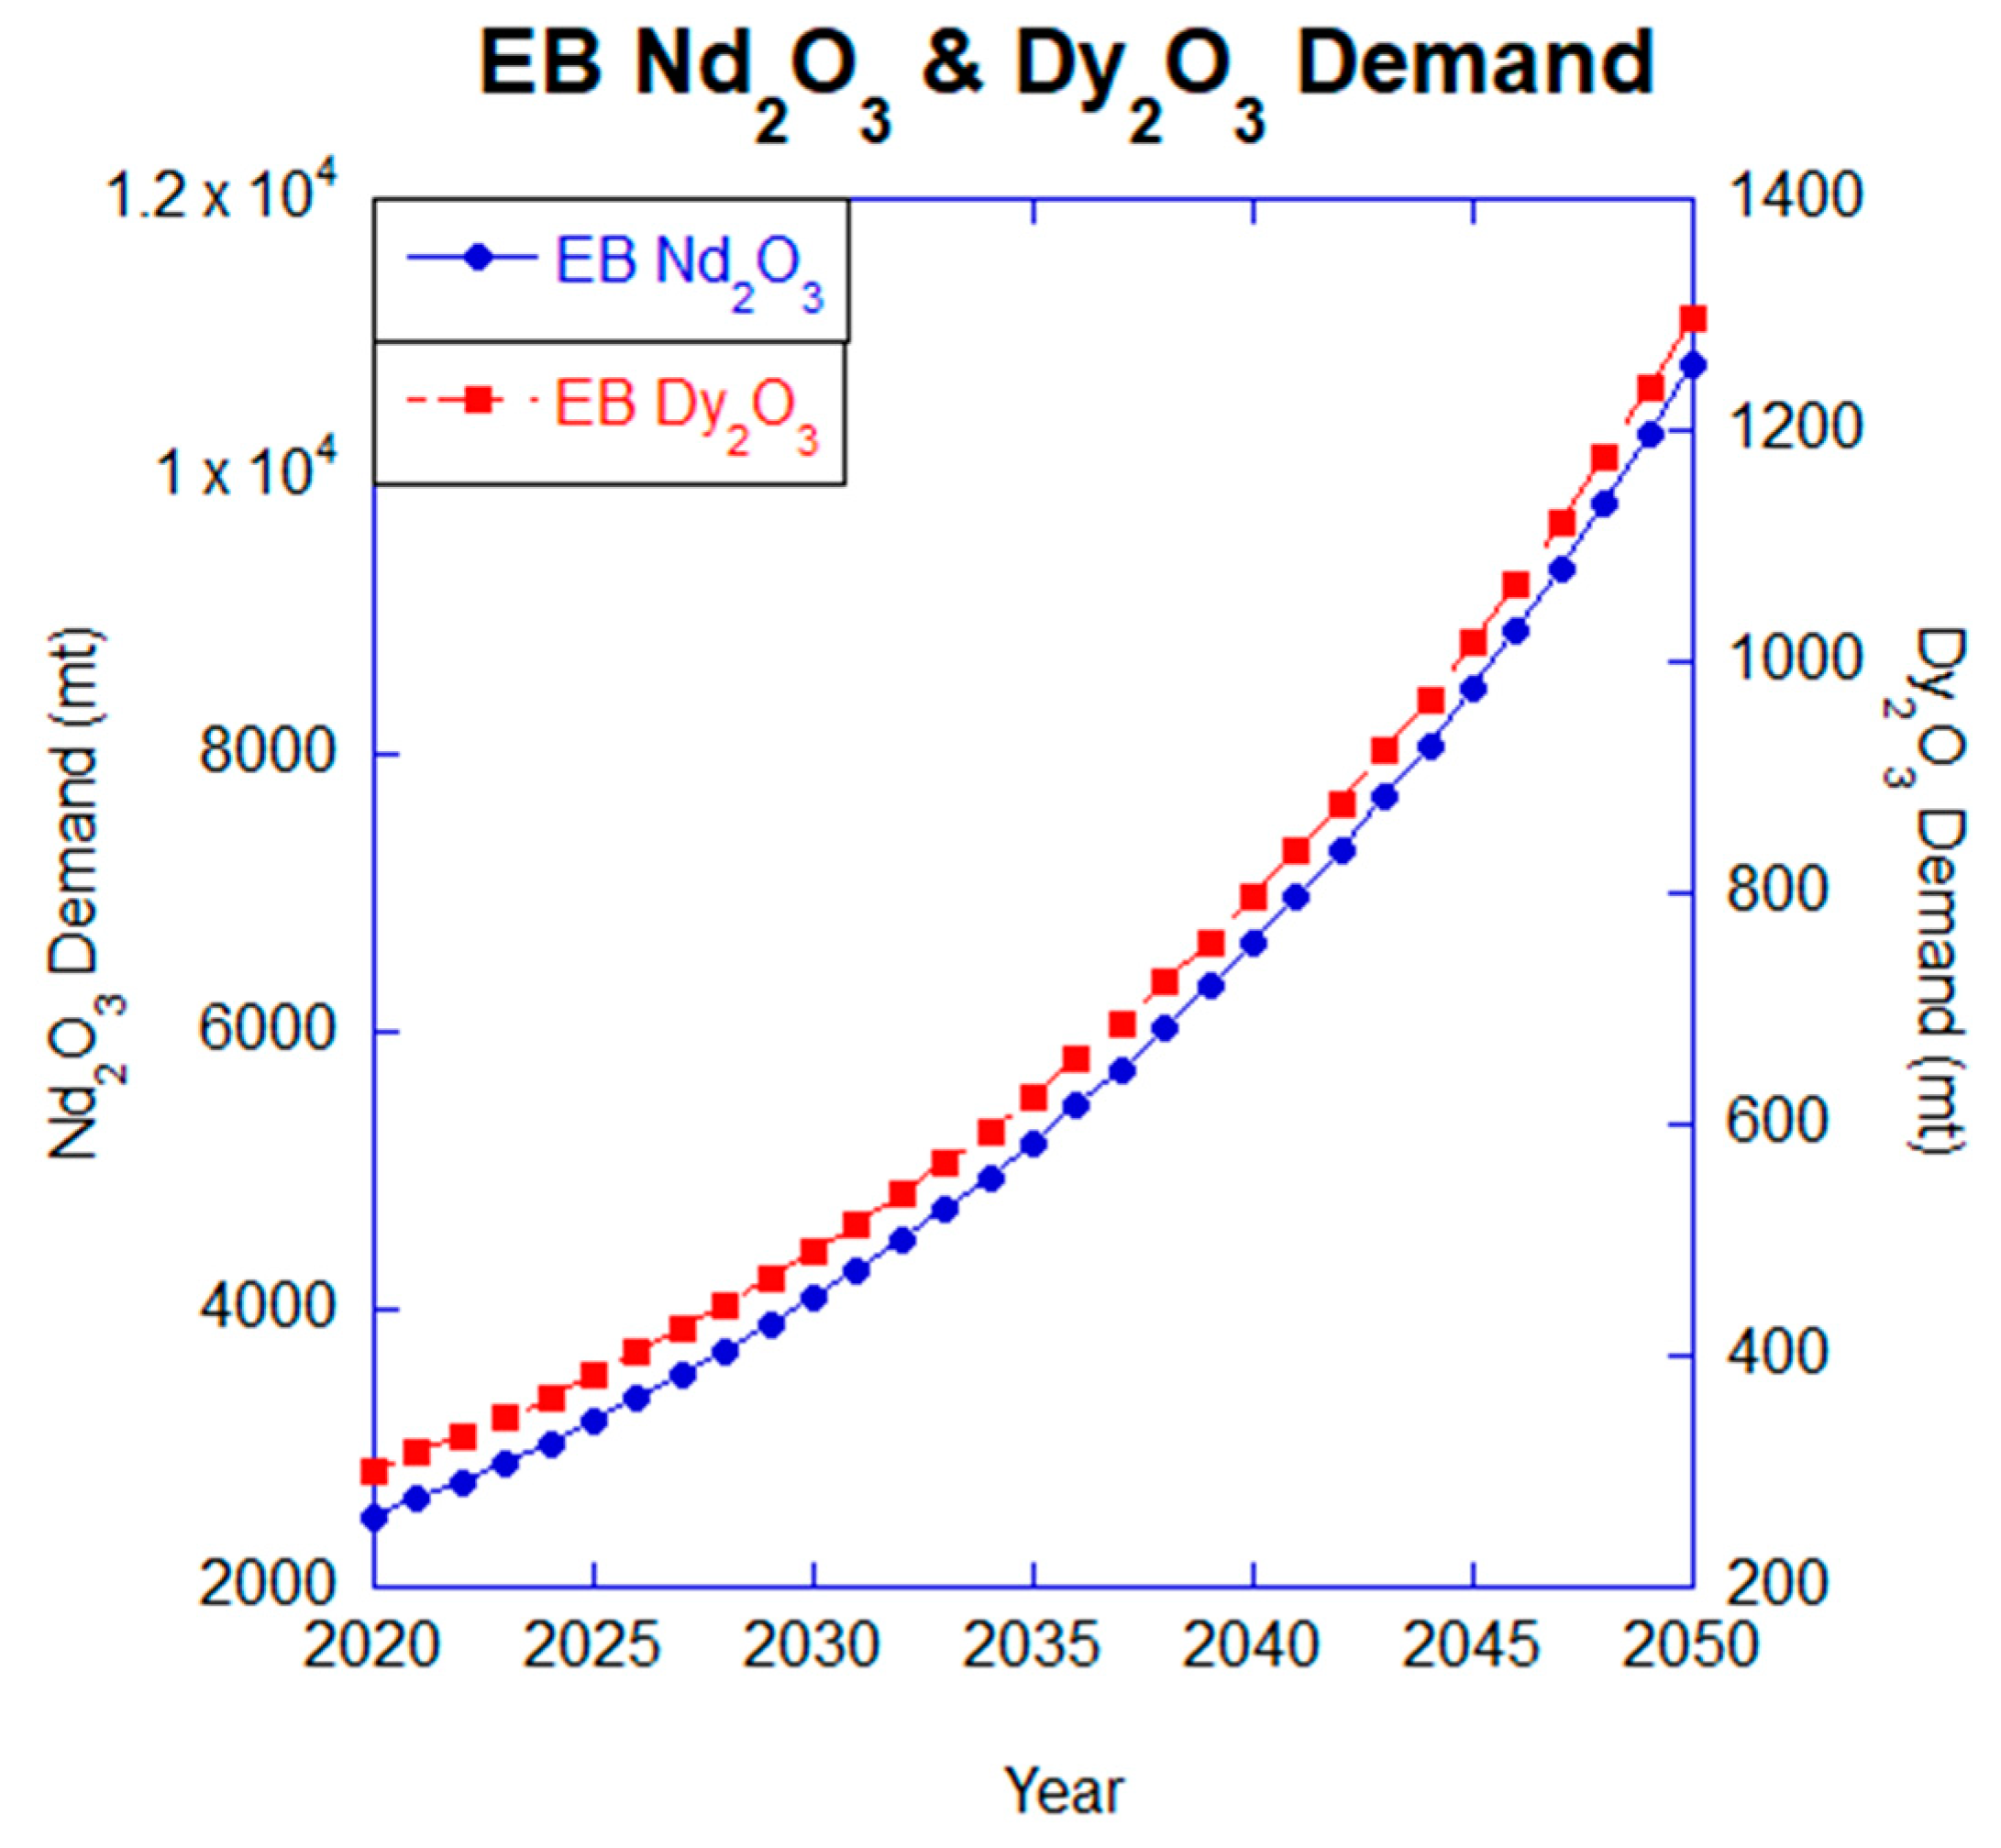
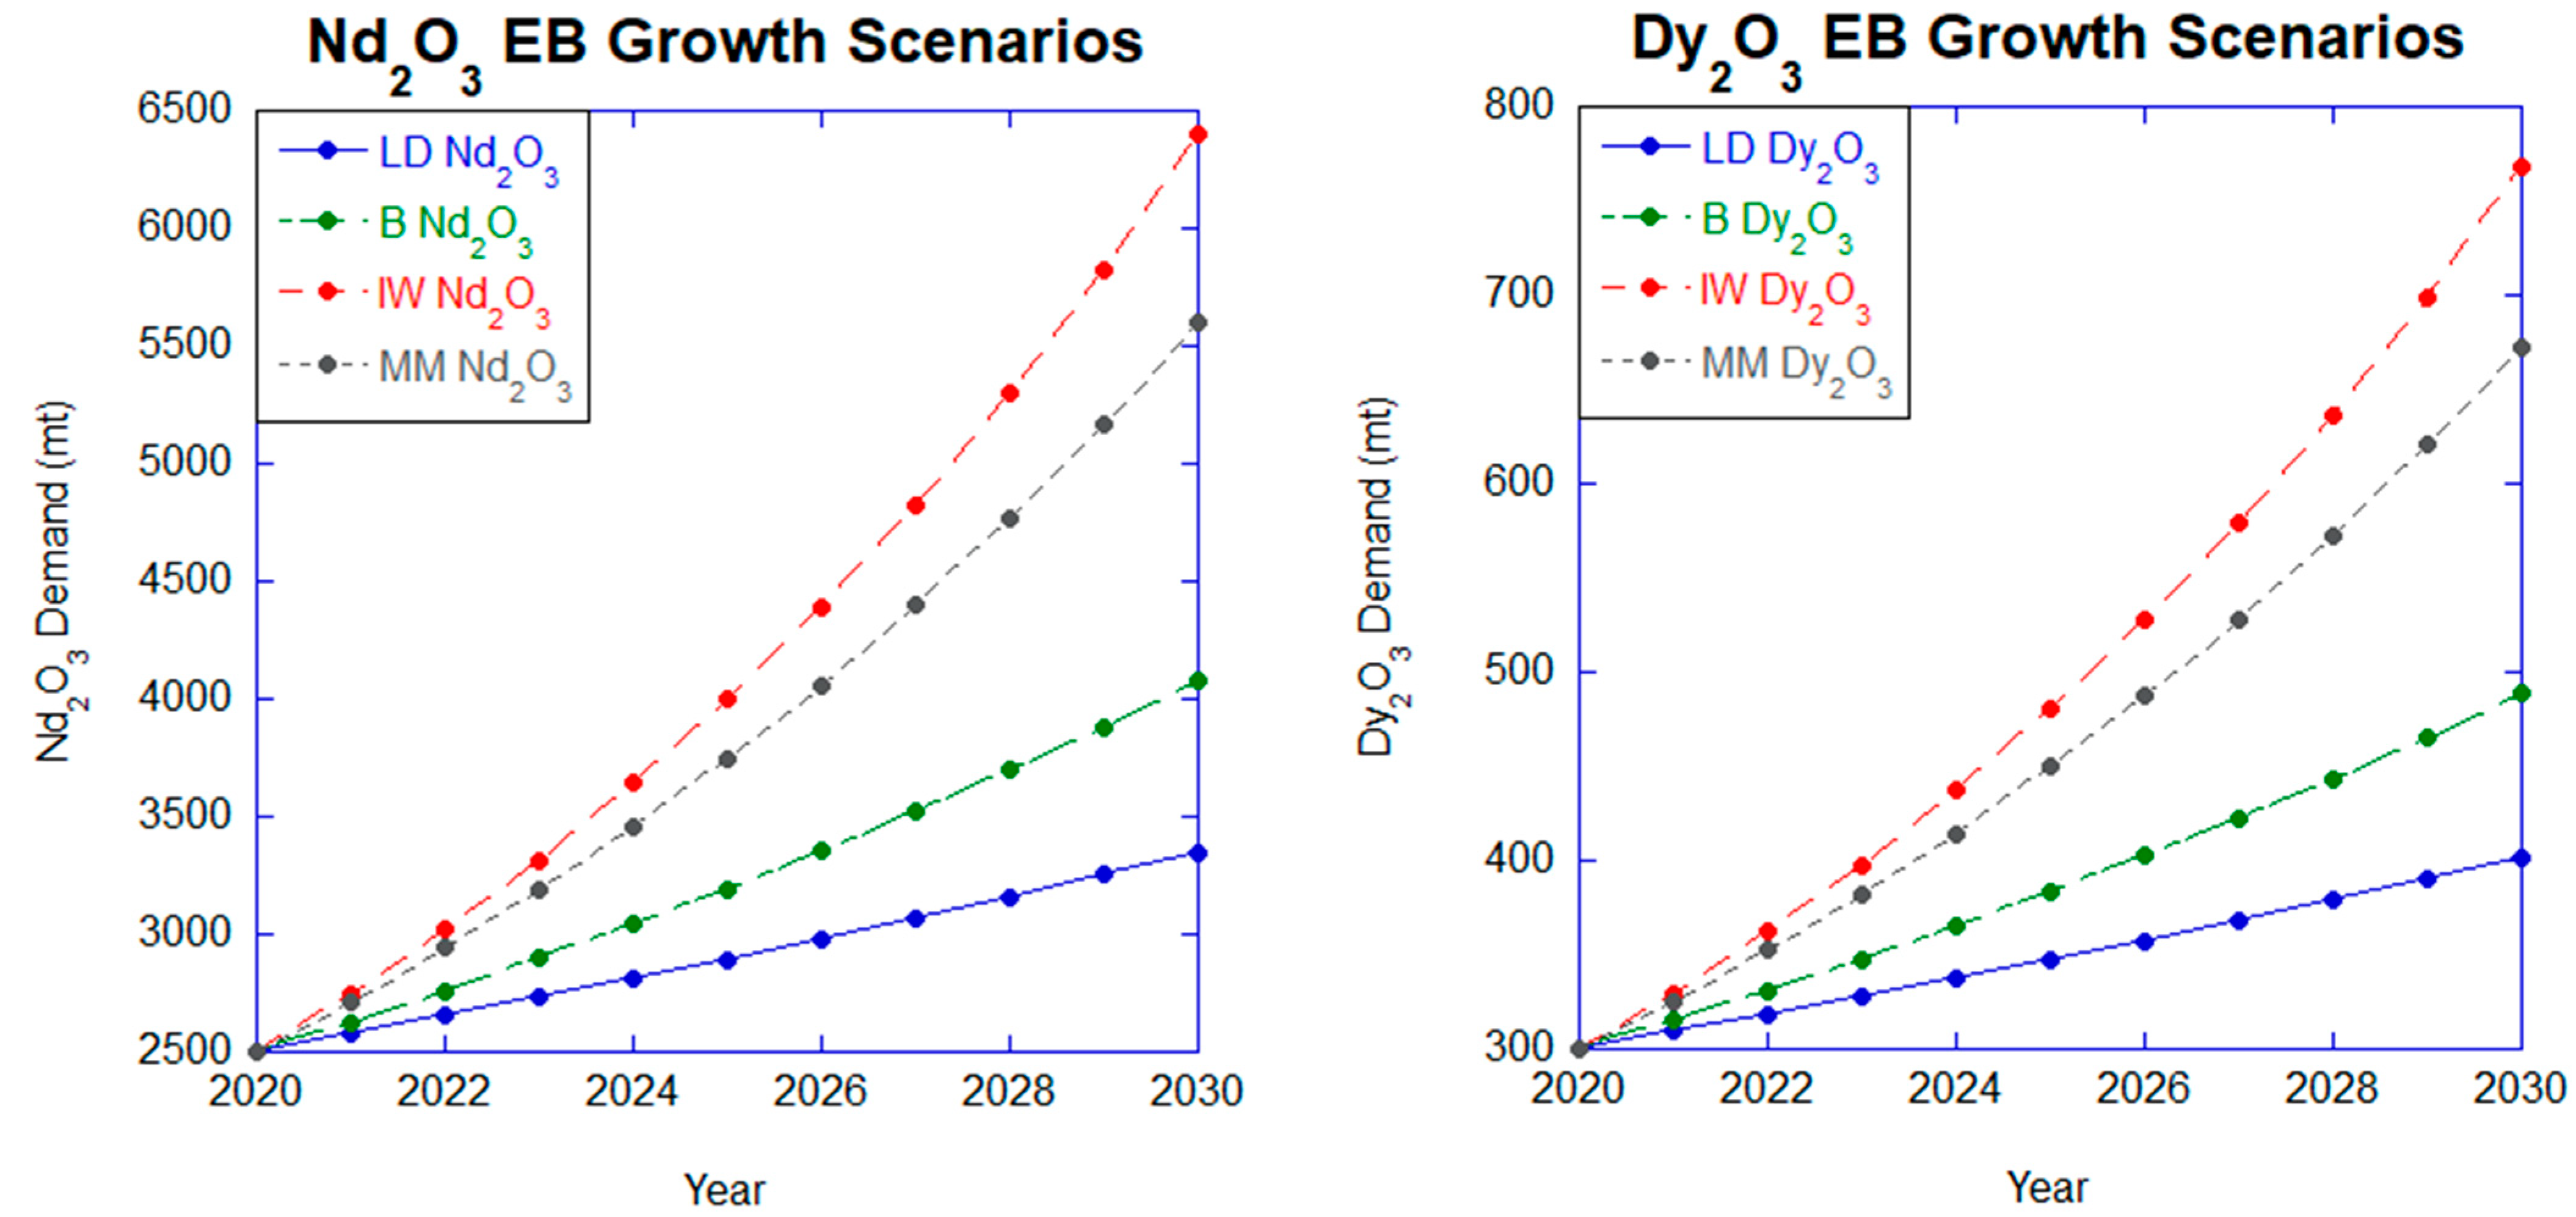
4.3. Electric Bicycles
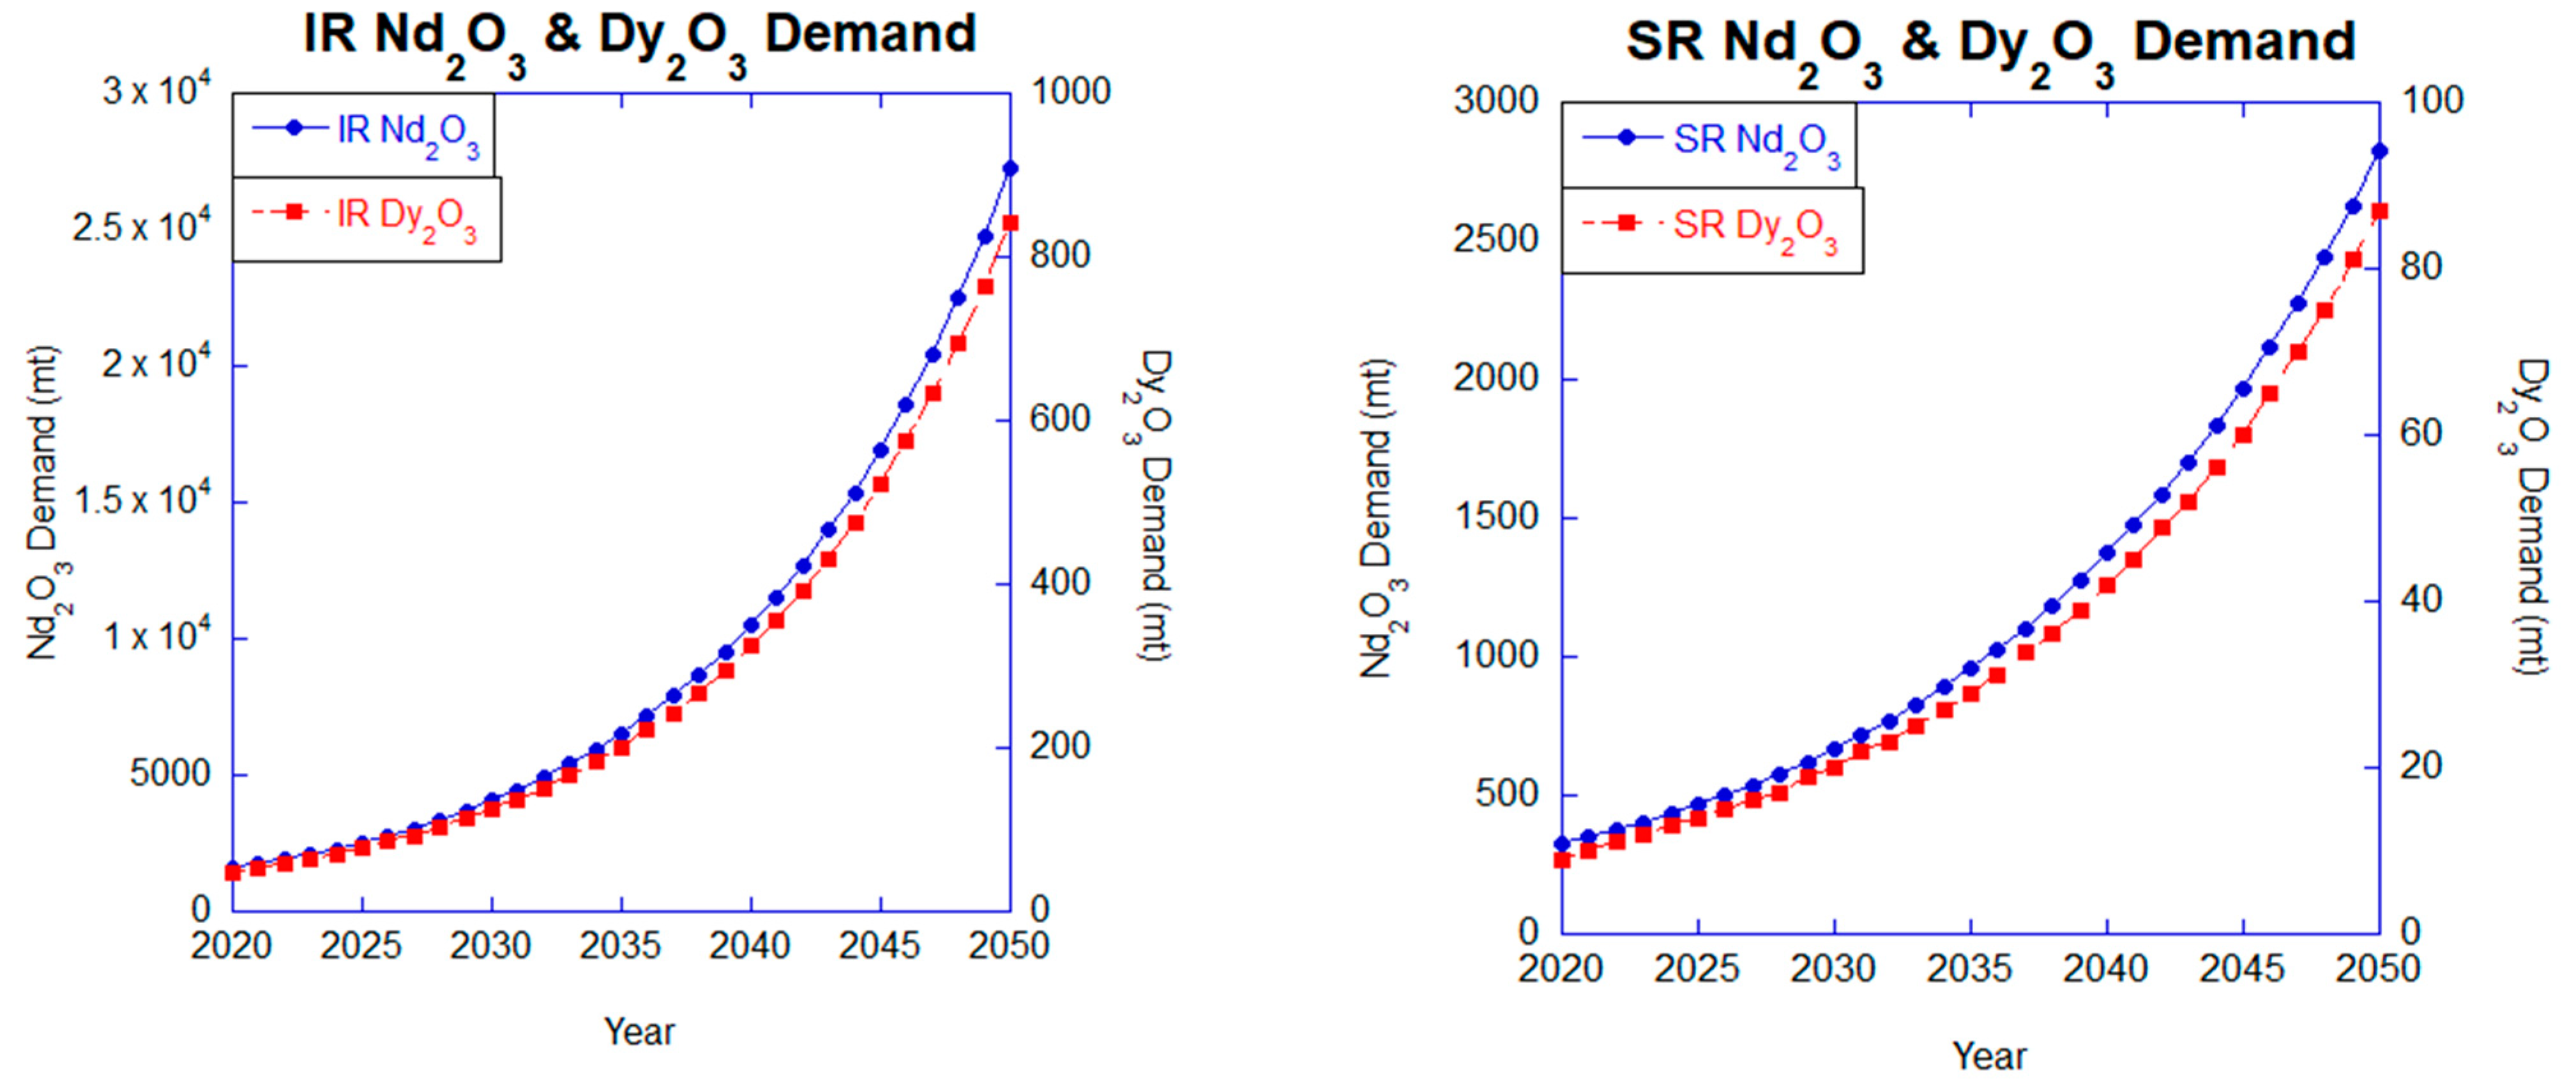
4.4. Robots
4.5. Consumer Electronics
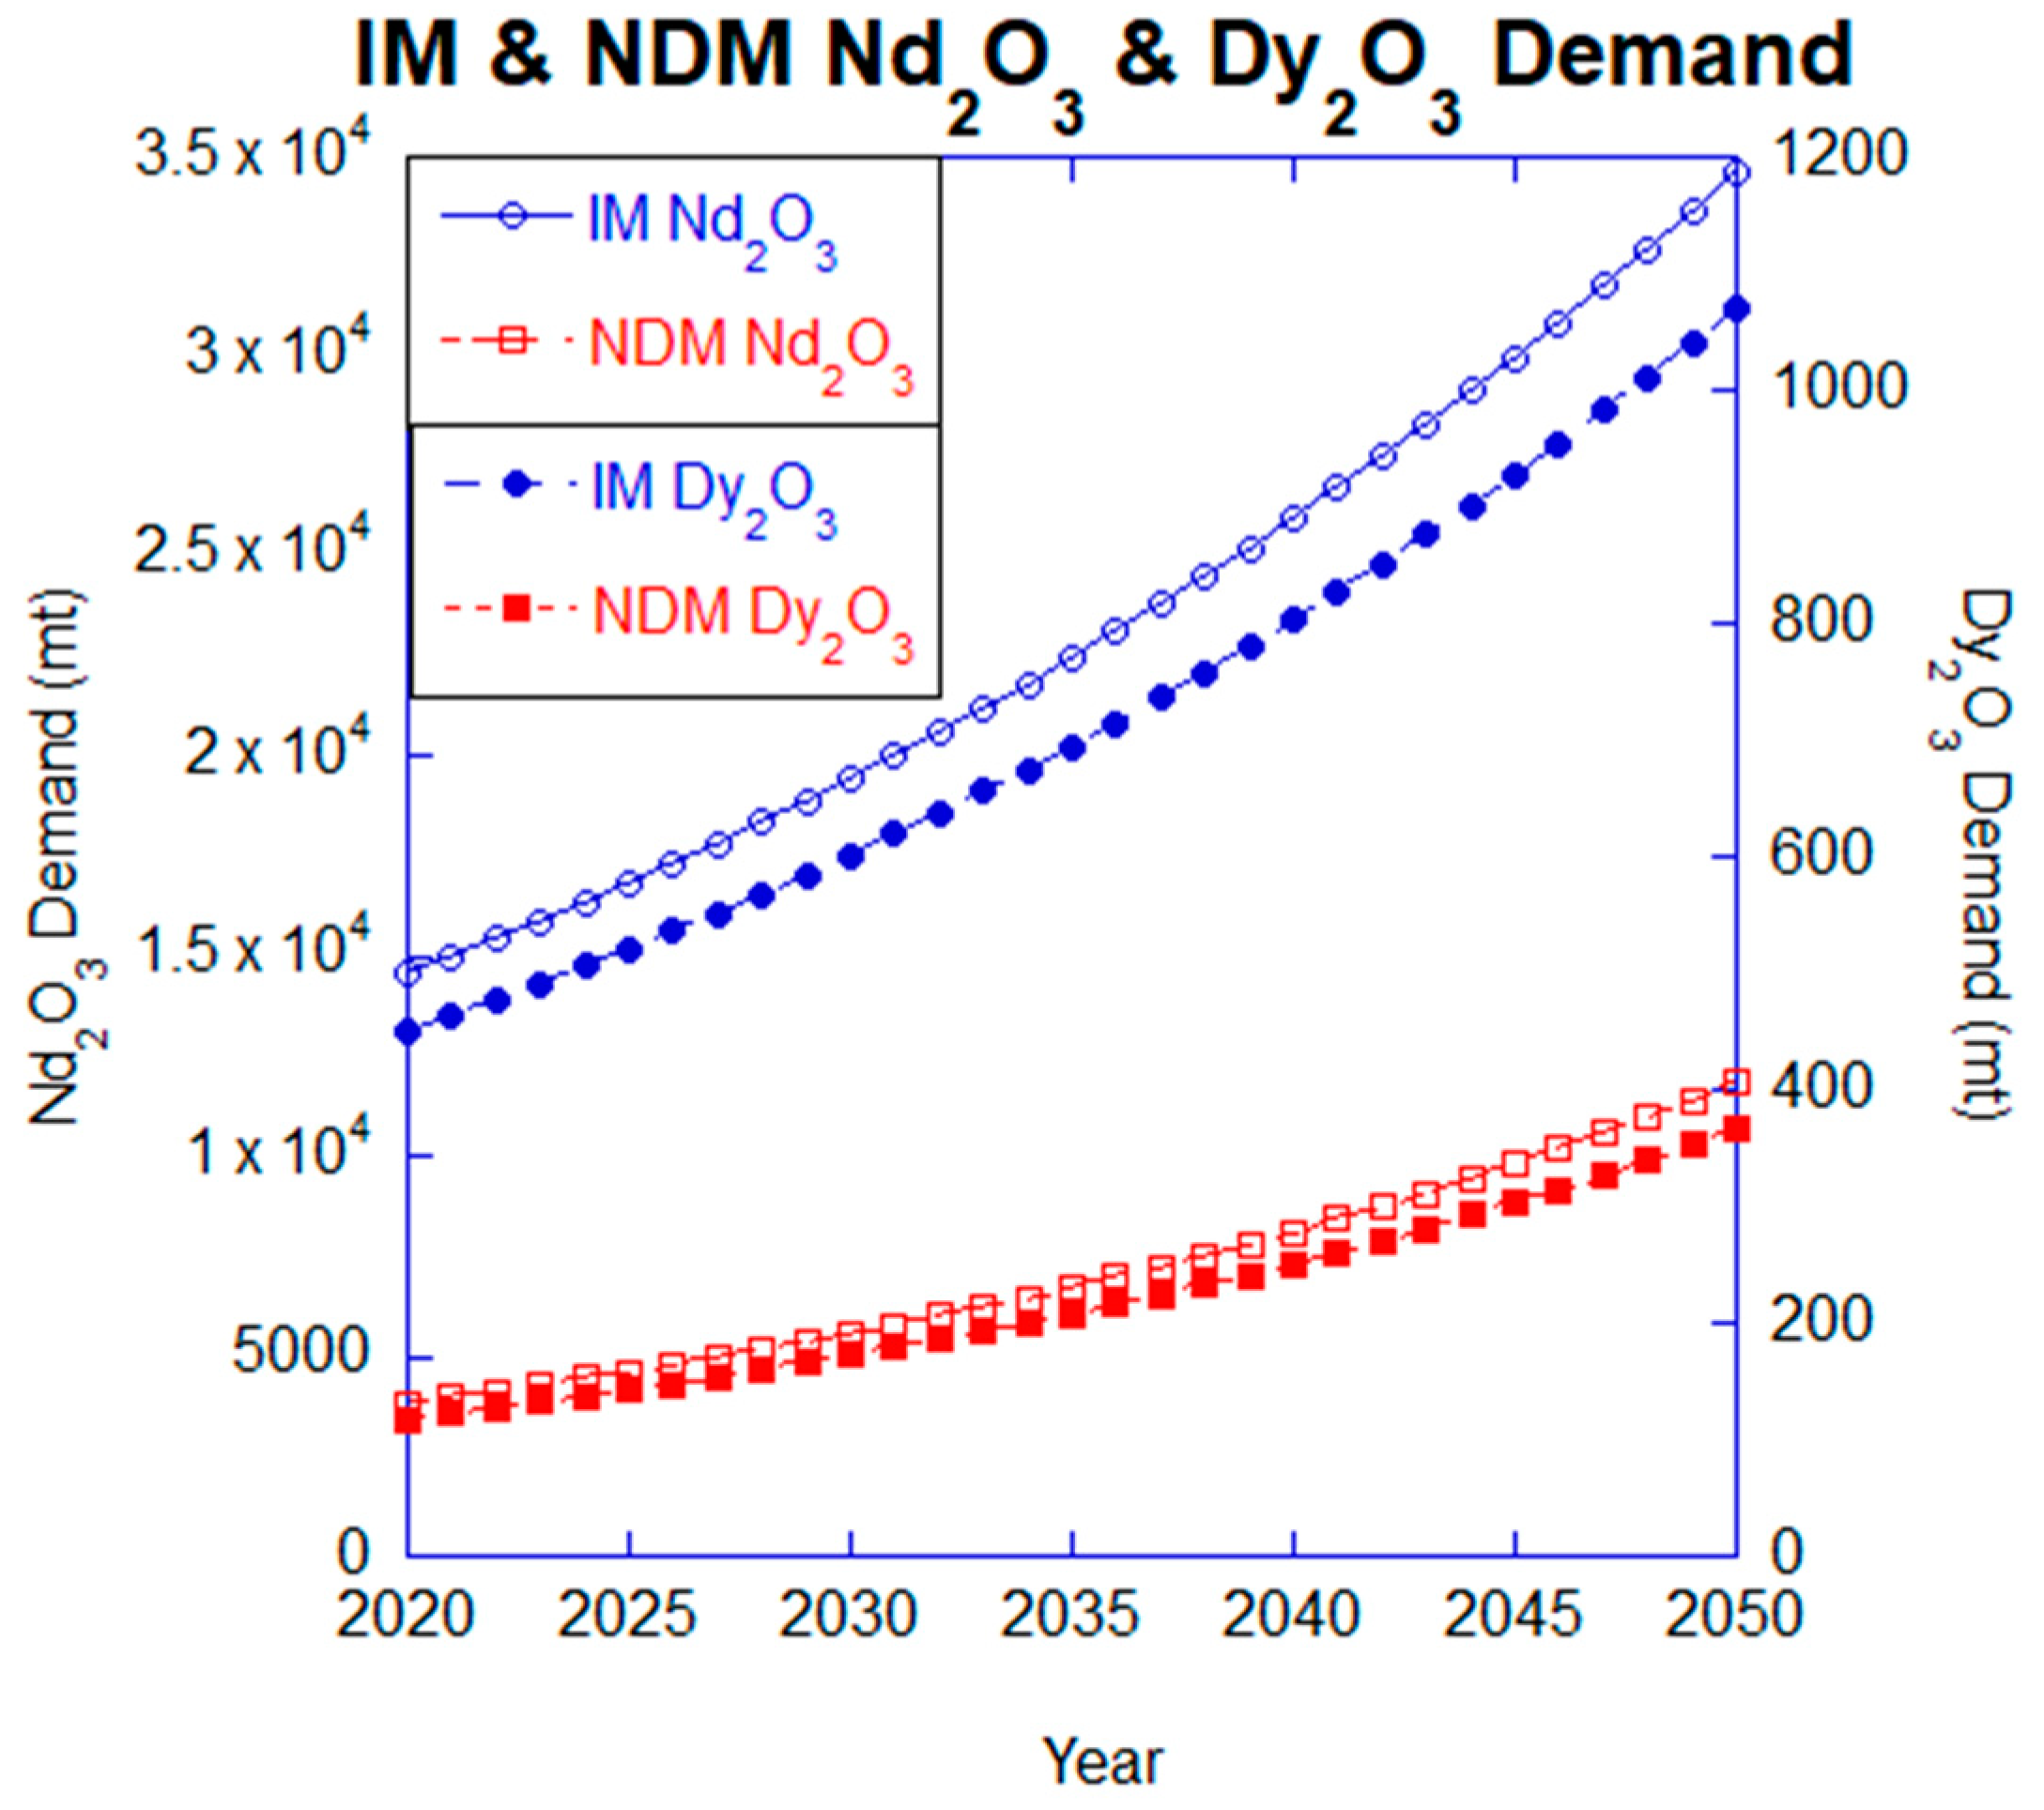
4.6. Industrial and Non-Drivetrain Motors
5. Discussion
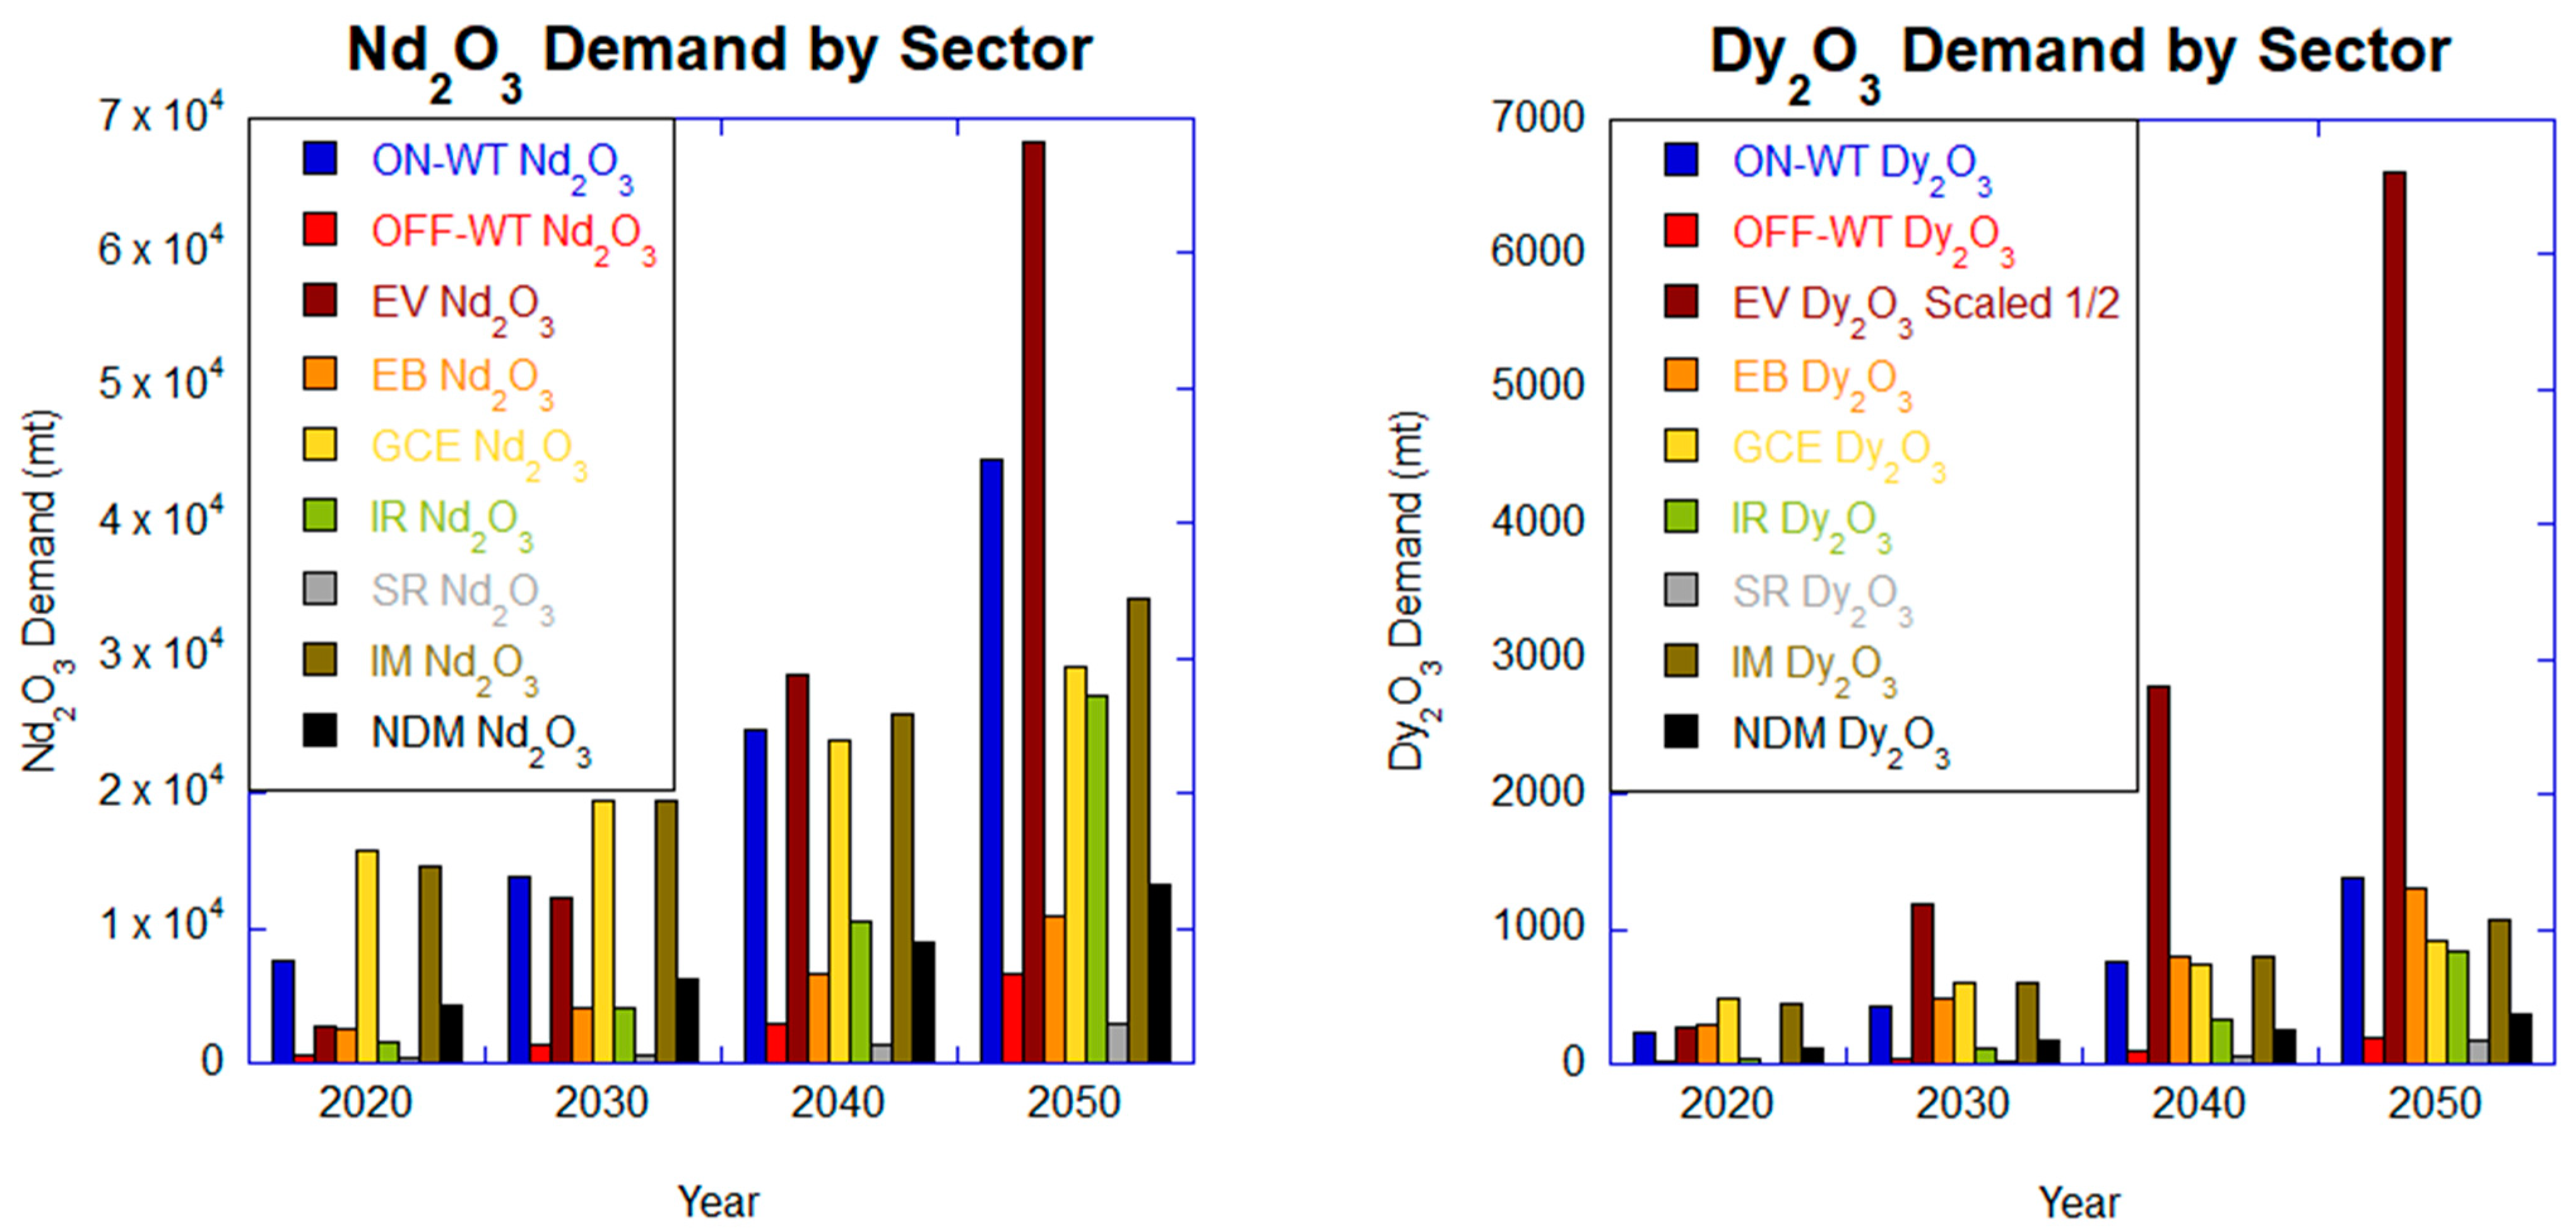
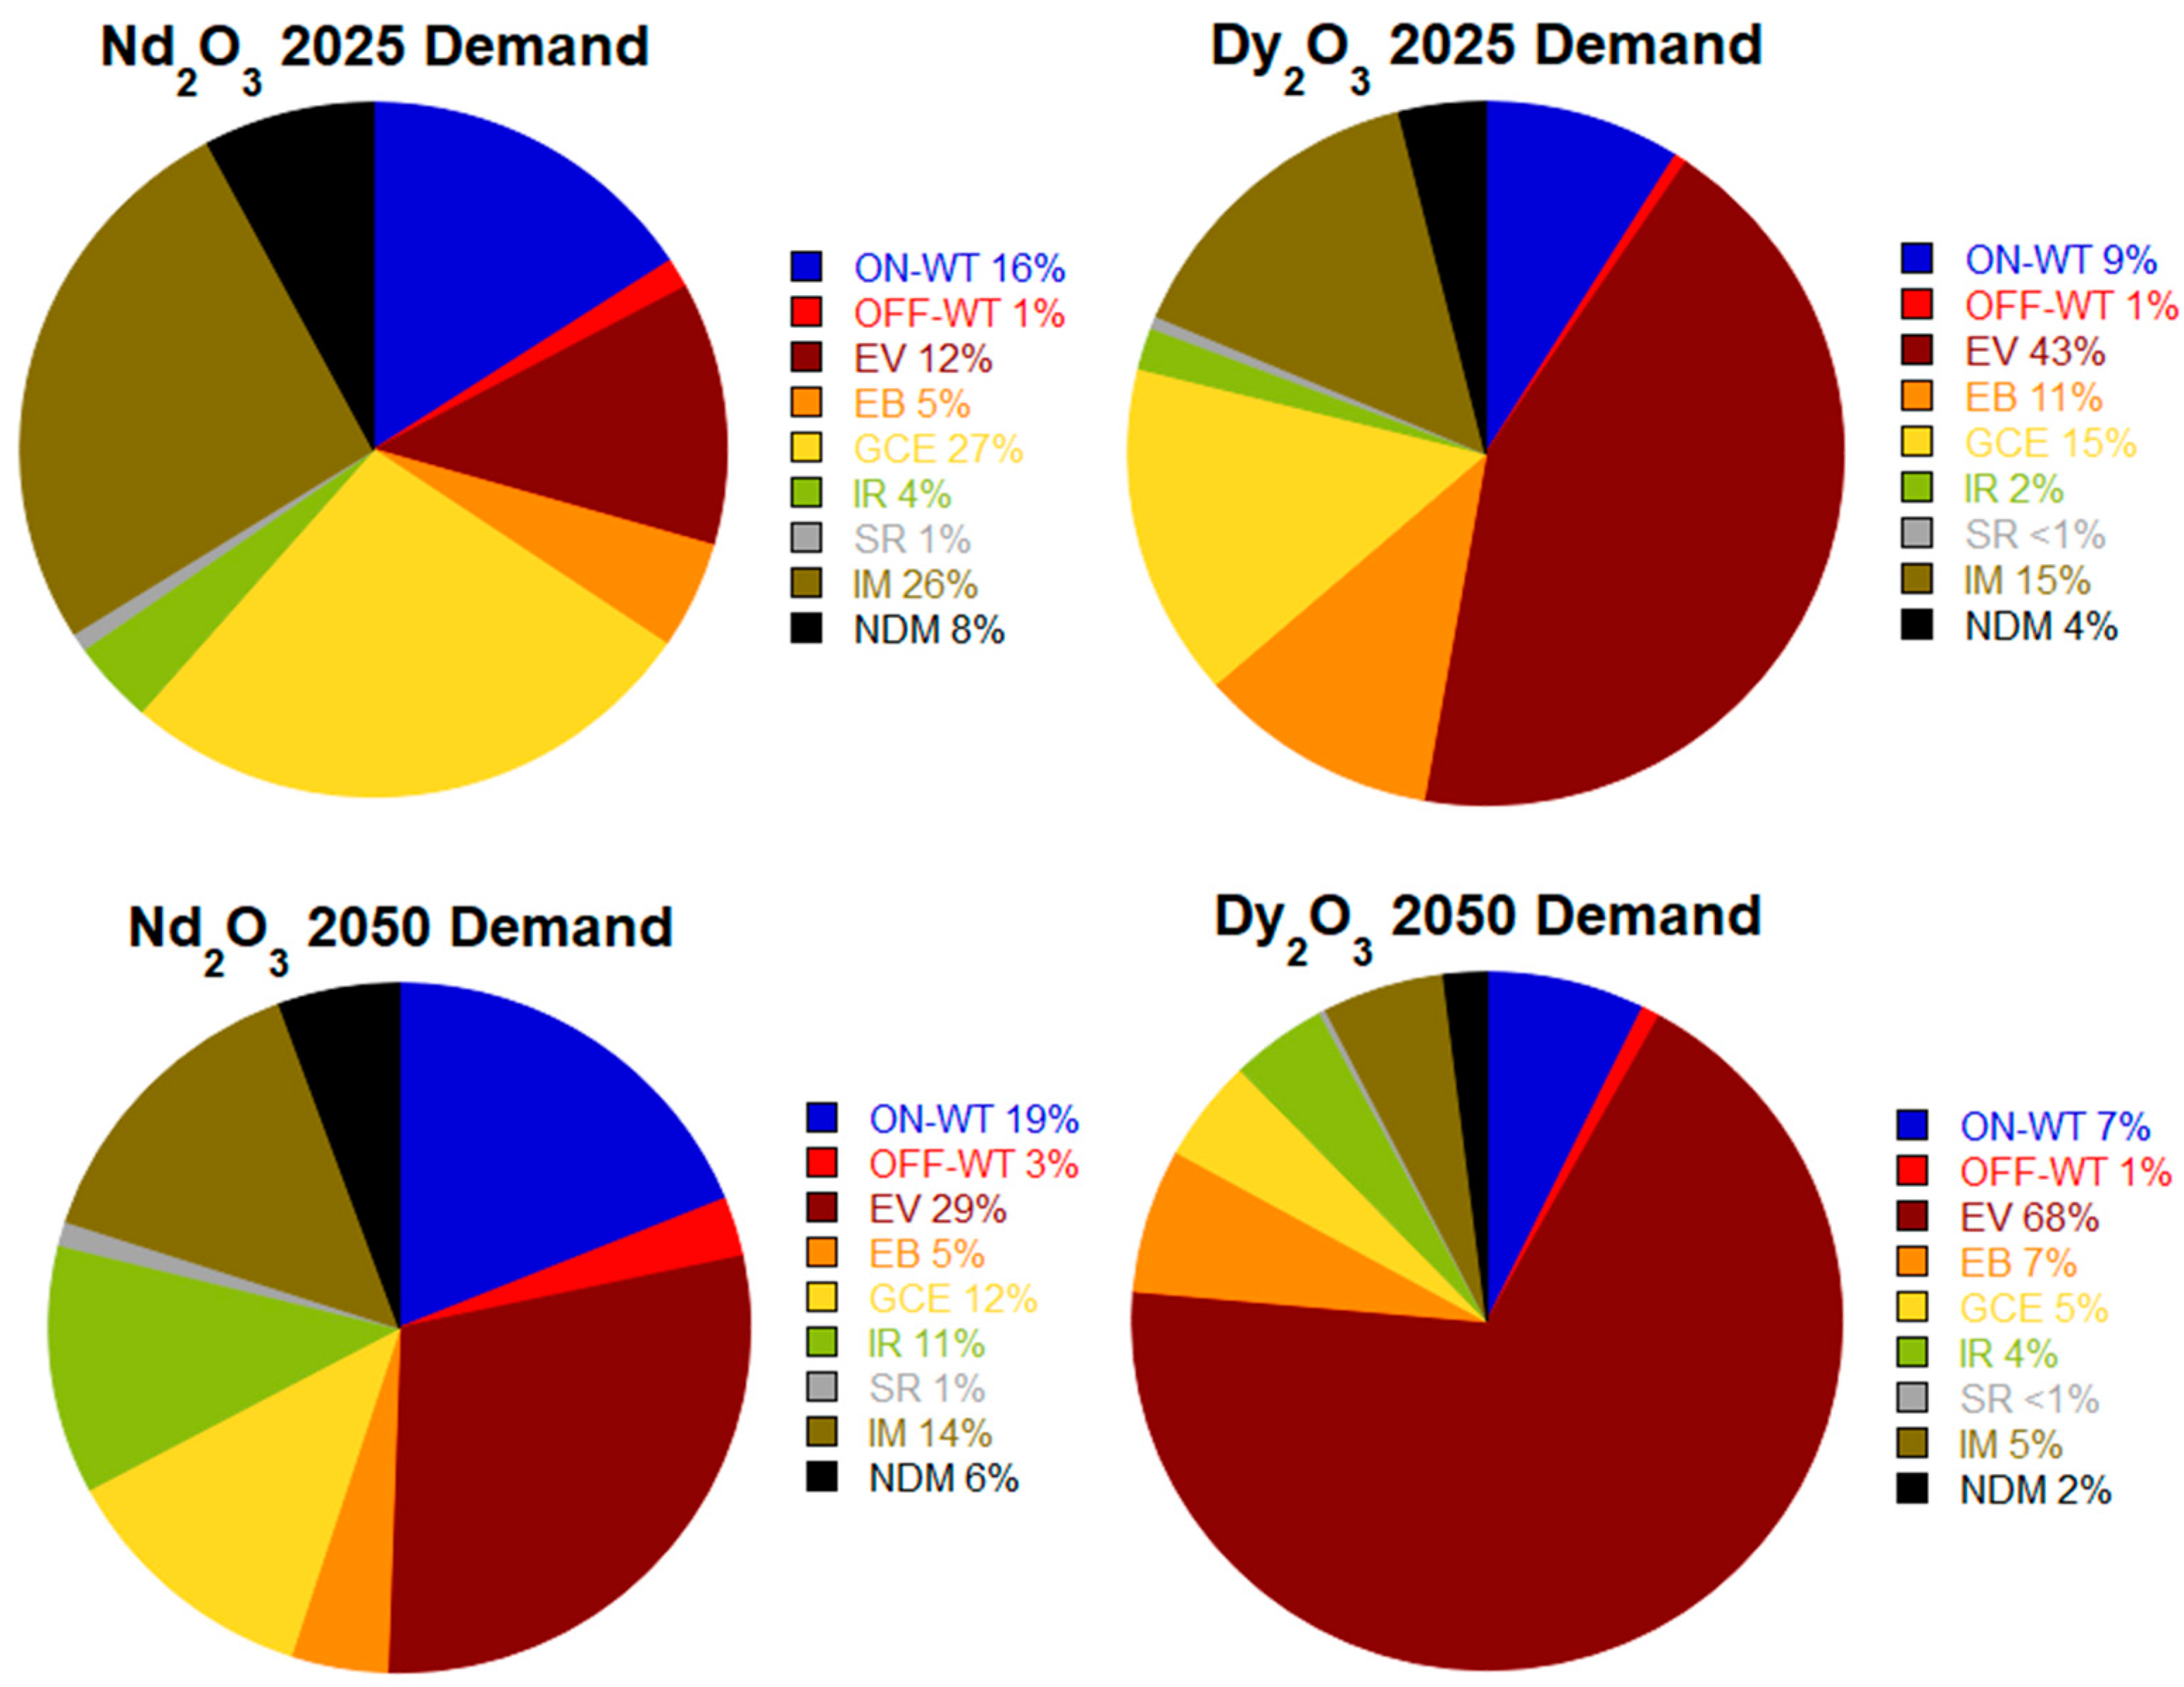
5.1. NdFeB Demand Growth across Sectors
5.2. Dysprosium Considerations
5.3. Rare Earth Value
5.4. Other Demand Considerations and REE Recycling
6. Conclusions
Author Contributions
Funding
Data Availability Statement
Conflicts of Interest
Appendix A

| Industry | NdFeB Content | Nd Content | Dy Content | Losses | Market Share |
|---|---|---|---|---|---|
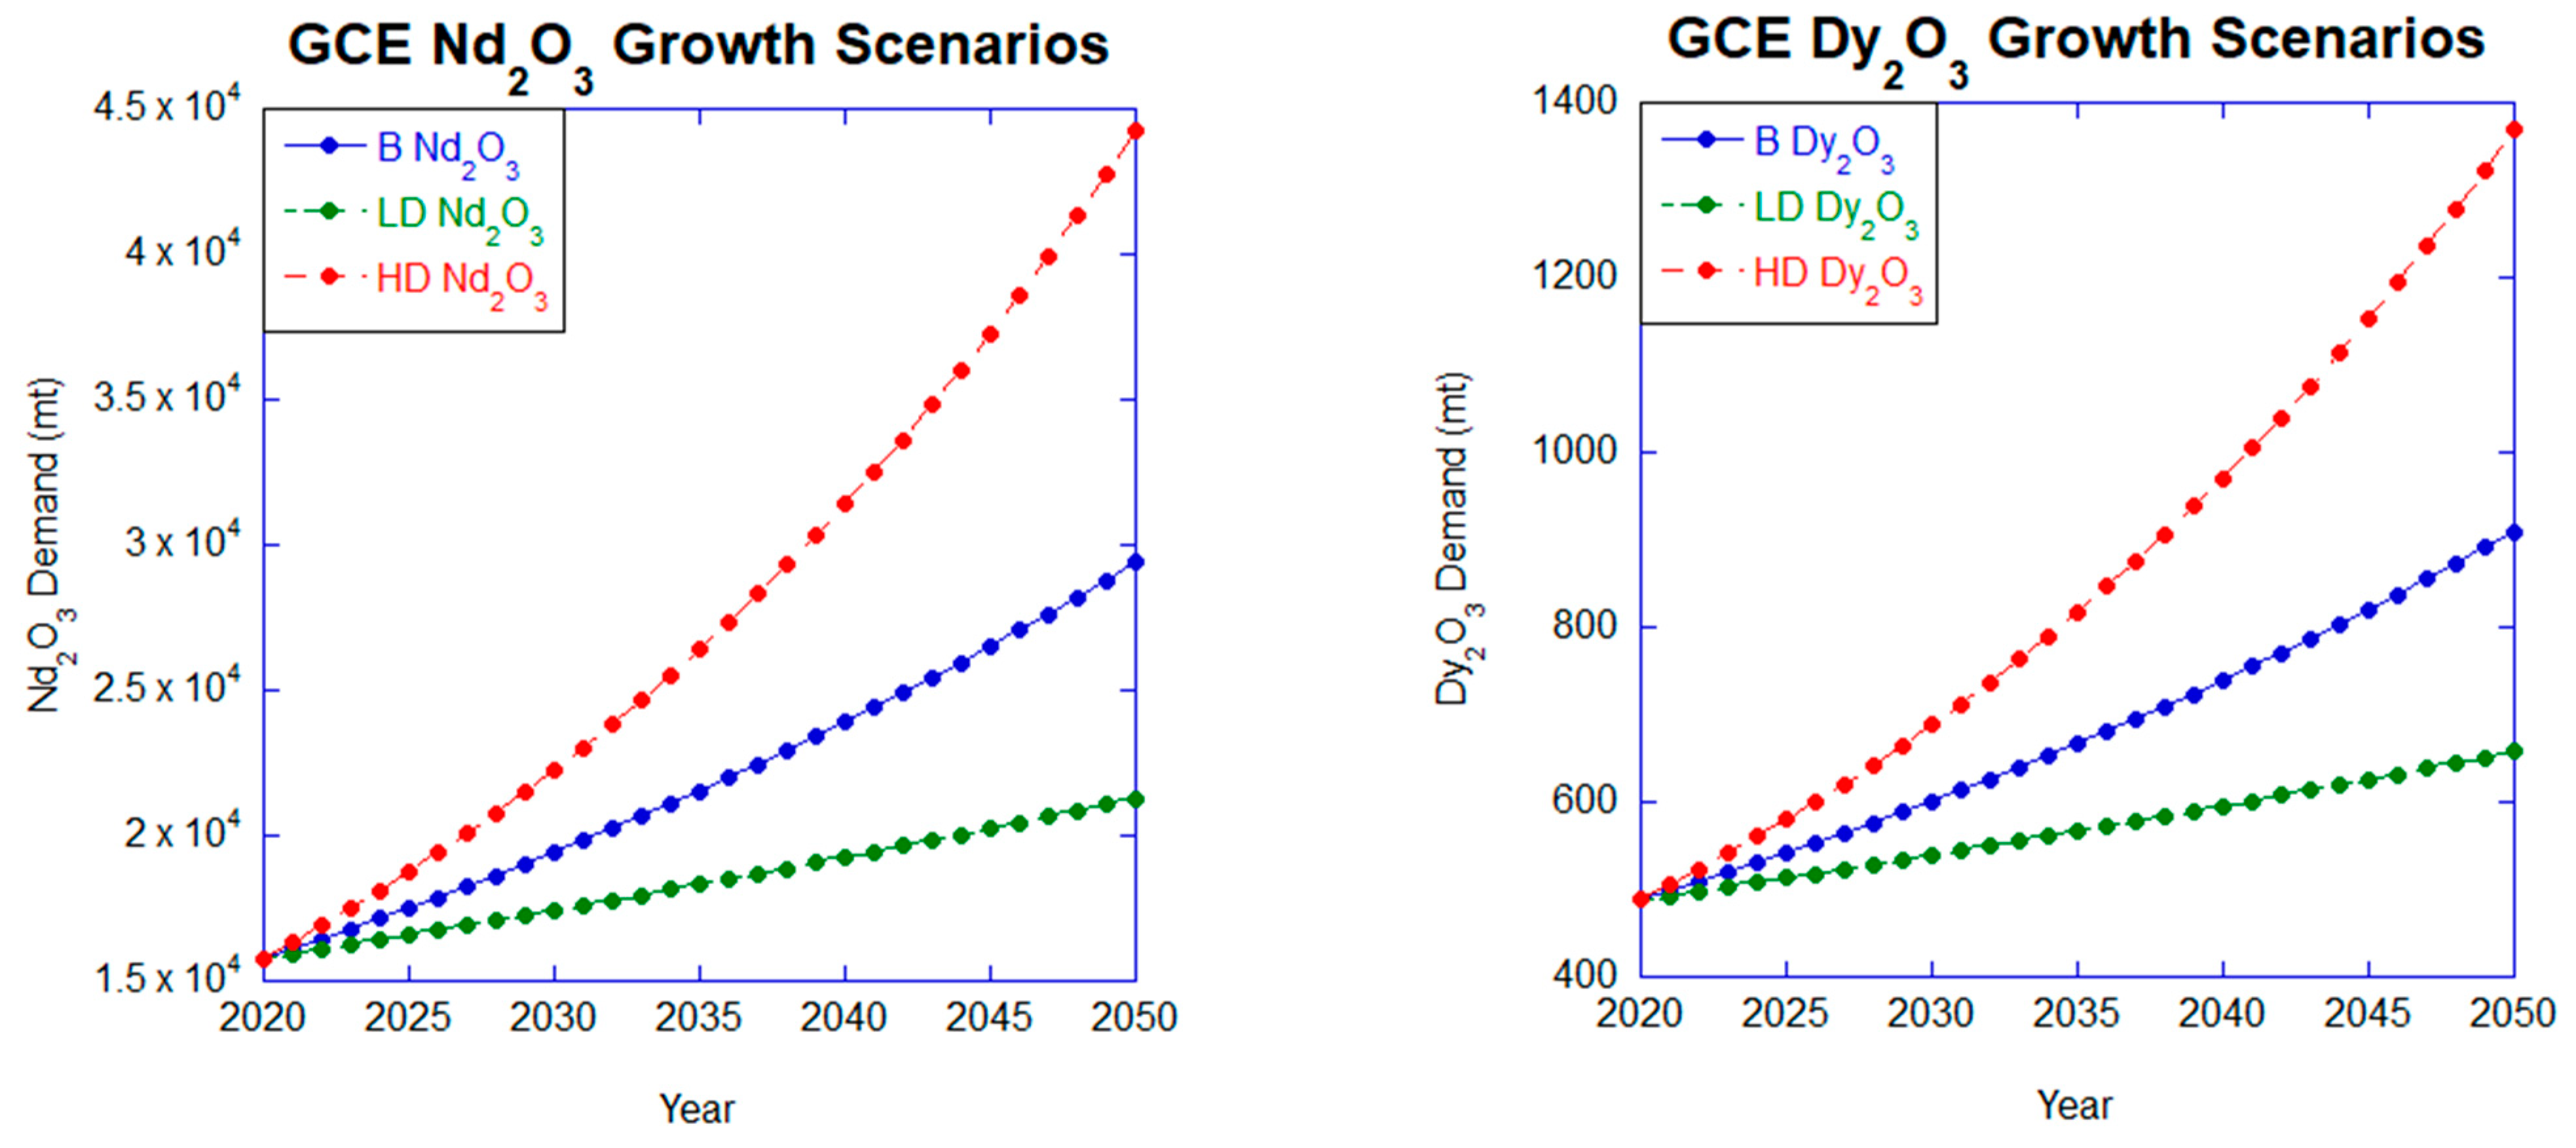
| On-shore Wind Turbines | 500 ton/GW, 30% Nd and Dy | 97% | 3% | 1.39 | 50% (Baseline) 32%−40% by 2050 (Low demand) a 32% to 68% (High demand) a |
| Off-shore Wind Turbines | 500 ton/GW, 30% Nd and Dy | 97% | 3% | 1.39 | 50% (Baseline) 76% to 41% (Low Demand) a 76% (High Demand) a |
| Electric Vehicles | 2 kg/EV b | 31% b | 6% b | 1.39 | 100% |
| Electric Bicycles | 0.2 kg/EB c | 30% b | 3% b | 1.39 | 100% Nd, 90% Dy c |
| Global Consumer Electronics | N/A (Given in tons of NdFeB, 30% is Nd and Dy) | 97% | 3% | 1.39 | 100% |
| Industrial Robots | 15 kg/unit, 30% is Nd and Dy d | 97% | 3% | 1.39 | 50% d |
| Service Robots | 0.6 kg/unit d, 30% is Nd and Dy | 97% | 3% | 1.39 | 70% d |
| Industrial Motors | N/A (Given in tons of NdFeB) | 97% | 3% | 1.39 | 100% |
| Non-drivetrain Motors | N/A (Given in tons of NdFeB) | 97% | 3% | 1.39 | 100% |

Appendix B
Market Growth
References
- Research and Markets. Global Permanent Magnet Market by Type (Neodymium Iron Boron Magnet, Ferrite Magnet, Samarium Cobalt Magnet), End-Use Industry (Consumer Electronics, General Industrial, Automotive, Medical Technology, Environment & Energy), and Region–Forecast to 2026. August 2021. Available online: https://www.researchandmarkets.com/reports/5401674/global-permanent-magnet-market-by-type (accessed on 6 July 2023).
- Mordor Intelligence. Permanent Magnet Market Size & Share Analysis–Industry Research Report–Growth Trends. 2023. Available online: https://www.mordorintelligence.com/industry-reports/permanent-magnet-market (accessed on 25 June 2023).
- Grand View Research. Permanent Magnets Market Size & Share Report, 2023–2030. 2023. Available online: https://www.grandviewresearch.com/industry-analysis/permanent-magnets-industry (accessed on 25 June 2023).
- Smith, B.J.; Riddle, M.E.; Earlam, M.R.; Iloeje, C.; Diamond, D. Rare Earth Permanent Magnets Supply Chain Deep Dive Assessment. 24 February 2022. Available online: https://www.energy.gov/sites/default/files/2022-02/Neodymium%20Magnets%20Supply%20Chain%20Report%20-%20Final.pdf (accessed on 2 July 2023).
- Yang, Y.; Walton, A.; Sheridan, R.; Güth, K.; Gauß, R.; Gutfleisch, O.; Buchert, M.; Steenari, B.-M.; Van Gerven, T.; Jones, P.T.; et al. REE recovery from end-of-life NDFEB permanent magnet scrap: A critical review. J. Sustain. Metall. 2016, 3, 122–149. [Google Scholar] [CrossRef]
- United States Geological Survey. Rare Earths Statistics and Information. 2023. Available online: https://www.usgs.gov/centers/national-minerals-information-center/rare-earths-statistics-and-information (accessed on 2 July 2023).
- United States Geological Survey. U.S. Geological Survey Mineral Commodity Summaries 2016. 2016. Available online: https://d9-wret.s3-us-west-2.amazonaws.com/assets/palladium/production/mineral-pubs/lithium/mcs-2016-lithi.pdf (accessed on 2 July 2023).
- United States Geological Survey. U.S. Geological Survey Mineral Commodity Summaries 2017. 2017. Available online: https://d9-wret.s3.us-west-2.amazonaws.com/assets/palladium/production/mineral-pubs/rare-earth/mcs-2017-raree.pdf (accessed on 2 July 2023).
- United States Geological Survey. U.S. Geological Survey Mineral Commodity Summaries 2018. 2018. Available online: https://d9-wret.s3.us-west-2.amazonaws.com/assets/palladium/production/mineral-pubs/rare-earth/mcs-2018-raree.pdf (accessed on 2 July 2023).
- United States Geological Survey. U.S. Geological Survey Mineral Commodity Summaries 2019. 2019. Available online: https://d9-wret.s3-us-west-2.amazonaws.com/assets/palladium/production/atoms/files/mcs-2019-raree.pdf (accessed on 2 July 2023).
- United States Geological Survey. U.S. Geological Survey Mineral Commodity Summaries 2020. 2020. Available online: https://pubs.usgs.gov/periodicals/mcs2020/mcs2020-rare-earths.pdf (accessed on 2 July 2023).
- United States Geological Survey. U.S. Geological Survey Mineral Commodity Summaries 2021. 2021. Available online: https://pubs.usgs.gov/periodicals/mcs2021/mcs2021-rare-earths.pdf (accessed on 2 July 2023).
- United States Geological Survey. U.S. Geological Survey Mineral Commodity Summaries 2022. 2022. Available online: https://pubs.usgs.gov/periodicals/mcs2022/mcs2022-rare-earths.pdf (accessed on 2 July 2023).
- United States Geological Survey. U.S. Geological Survey Mineral Commodity Summaries 2023. 2023. Available online: https://pubs.usgs.gov/periodicals/mcs2023/mcs2023-rare-earths.pdf (accessed on 2 July 2023).
- Roskill Information Services (Londra). Rare Earths: Global Industry, Markets and Outlook, 18th ed.; Roskill Information Services: London, UK, 2018. [Google Scholar]
- Burja, S. China Refines the World’s Rare Earth Elements. 24 August 2022. Available online: https://brief.bismarckanalysis.com/p/china-refines-the-worlds-rare-earth (accessed on 10 July 2023).
- Gauß, R.; Burkhardt, C.; Carencotte, F.; Gasparon, M.; Gutfleisch, O.; Higgins, I.; Karajić, M.; Klossek, A.; Mäkinen, M.; Schäfer, B.; et al. Rare Earth Magnets and Motors: A European Call for Action. A Report by the Rare Earth Magnets and Motors Cluster of the European Raw Materials Alliance. 2021. Available online: https://eit.europa.eu/sites/default/files/2021_09-24_ree_cluster_report2.pdf (accessed on 10 July 2023).
- Prassas, M. Neodymium and Praseodymium (NdPr): The Biggest Blind Spot in the Global Commodity Market. Peak Resources. 2018. Available online: https://dokumen.tips/documents/neodymium-and-praseodymium-ndpr-too-believe-this-is-the-future-of-our-society.html (accessed on 24 September 2023).
- Wikimedia Foundation. Neodymium Magnet. 20 May 2023. Available online: https://en.wikipedia.org/wiki/Neodymium_magnet (accessed on 22 June 2023).
- Widmer, J.D.; Martin, R.; Kimiabeigi, M. Electric vehicle traction motors without rare earth magnets. Sustain. Mater. Technol. 2015, 3, 7–13. [Google Scholar] [CrossRef]
- What Is Maximum Energy Product (BH) Max? Stanford Magnets. 9 September 2020. Available online: https://www.stanfordmagnets.com/what-is-maximum-energy-product-bhmax.html (accessed on 11 July 2023).
- An, D.L. Critical Rare Earths, National Security, and U.S.-China Interactions: A Portfolio Approach to Dysprosium Policy Design (Dissertation); RAND Corporation: Santa Monica, CA, USA, 2014. [Google Scholar]
- Goonan, T.G. Rare Earth Elements: End Use and Recyclability (p. 19Disponível); US Department of the Interior, US Geological Survey: Reston, VA, USA, 2011. [Google Scholar]
- Tasman Metals Ltd. Principal Uses of Rare Earth Elements. 2 February 2014. Available online: https://www.tasmanmetals.com/s/PrincipalUses.asp (accessed on 22 June 2023).
- U.S. Department of Commerce Bureau of Industry and Security Office of Technology Evaluation. The Effect of Imports of Neodymium-Iron-Boron (NdFeB) Permanent Magnets on the National Security. 14 February 2023. Available online: https://www.bis.doc.gov/index.php/documents/section-232-investigations/3141-report-1/file (accessed on 9 July 2023).
- Pavel, C.C.; Lacal-Arántegui, R.; Marmier, A.; Schüler, D.; Tzimas, E.; Buchert, M.; Jenseit, W.; Blagoeva, D. Substitution strategies for reducing the use of rare earths in wind turbines. Resour. Policy 2017, 52, 349–357. [Google Scholar] [CrossRef]
- Moss, R.L.; Tzimas, E.; Kara, H.; Willis, P.; Kooroshy, J. The potential risks from metals bottlenecks to the deployment of Strategic Energy Technologies. Energy Policy 2013, 55, 556–564. [Google Scholar] [CrossRef]
- Constantinides, S. Demand for Rare Earth Materials in Permanent Magnets. 2012. Available online: https://magmatllc.com/PDF/Demand%20for%20rare%20earth%20materials%20in%20permanent%20magnets_Constantinides_120409.pdf (accessed on 11 July 2023).
- Hoenderdaal, S.; Tercero Espinoza, L.; Marscheider-Weidemann, F.; Graus, W. Can a dysprosium shortage threaten green energy technologies? Energy 2013, 49, 344–355. [Google Scholar] [CrossRef]
- Neodymium Magnets in Wind Turbines & Generators. Stanford Magnets. 26 February 2019. Available online: https://www.stanfordmagnets.com/neodymium-magnets-in-wind-turbines-generators.html (accessed on 25 June 2023).
- Antle, H. Magnets and Their Role in Wind Power. 25 March 2022. Available online: https://amazingmagnets.com/magnets-and-wind-power/ (accessed on 25 June 2023).
- Moss, R.L.; Tzimas, E.; Kara, H.; Willis, P.; Kooroshy, J. Critical Metals in Strategic Energy Technologies: Assessing Rare Metals as Supply-Chain Bottlenecks in Low-Carbon Energy Technologies; JRC Scientific and Technical Reports; Institute for Energy and Transport IET: Petten, The Netherlands, 2011. [Google Scholar] [CrossRef]
- Gielen, D.; Lyons, M. Critical Materials for the Energy Transition: Rare Earth Elements; IRENA: Abu Dhabi, United Arab Emirates, 2022. [Google Scholar]
- Lee, J.; Zhao, F. Global Wind Report 2022; Global Wind Energy Council: Brussels, Belgium, 2022. [Google Scholar]
- Global Wind Energy Council. Global Wind Report—Annual Market Update 2016; Global Wind Energy Council: Brussels, Belgium, 2022. [Google Scholar]
- Alves Dias, P.; Bobba, S.; Carrara, S.; Plazzotta, B. The Role of Rare Earth Elements in Wind Energy and Electric Mobility; EUR 30488 EN; Publications Office of the European Union: Luxembourg, 2020; ISBN 9789276270164. [Google Scholar] [CrossRef]
- IEA. Wind Electricity—Analysis. September 2022. Available online: https://www.iea.org/reports/wind-electricity (accessed on 10 July 2023).
- Dow, J. Tesla Is Going (Back) to EV Motors with No Rare Earth Elements. 1 March 2023. Available online: https://electrek.co/2023/03/01/tesla-is-going-back-to-ev-motors-with-no-rare-earth-elements/ (accessed on 20 May 2023).
- Adamas Intelligence. Implications: Tesla Announces Next Generation Rare-Earth-Free PMSM. 2 March 2023. Available online: https://www.adamasintel.com/tesla-rare-earth-free-motor/ (accessed on 20 May 2023).
- Mining.com. World’s Electric Vehicle Fleet to Reach 145 Million by 2030. 29 April 2021. Available online: https://www.mining.com/worlds-electric-vehicle-fleet-to-reach-145-million-by-2030-report/ (accessed on 11 July 2023).
- International Energy Agency. Global EV Outlook 2023—Catching up with Climate Ambitions. April 2023. Available online: https://iea.blob.core.windows.net/assets/dacf14d2-eabc-498a-8263-9f97fd5dc327/GEVO2023.pdf?stream=top (accessed on 10 July 2023).
- IEA. Global EV Outlook 2021—Trends and Developments in Electric Vehicle Markets. 2021. Available online: https://www.iea.org/reports/global-ev-outlook-2021/trends-and-developments-in-electric-vehicle-markets (accessed on 11 July 2023).
- Carlier, M. Electric Vehicles in the United States. 15 June 2023. Available online: https://www.statista.com/topics/4421/the-us-electric-vehicle-industry/#topicOverview (accessed on 25 June 2023).
- IEA. Electric Vehicles. September 2022. Available online: https://www.iea.org/reports/electric-vehicles (accessed on 25 June 2023).
- IEA. Electric Car Sales, 2016–2023. April 2023. Available online: https://origin.iea.org/data-and-statistics/charts/electric-car-sales-2016-2023 (accessed on 30 July 2023).
- Habib, K.; Wenzel, H. Exploring rare earths supply constraints for the emerging clean energy technologies and the role of Recycling. J. Clean. Prod. 2014, 84, 348–359. [Google Scholar] [CrossRef]
- Adamas Intelligence. Rare Earth Elements: Market Issues and Outlook. 28 September 2020. Available online: https://www.adamasintel.com/unfathomable-rare-earth-demand-growth/ (accessed on 2 July 2023).
- Adamas Intelligence. Rare Earth Elements: Small Market, Big Necessity. 2019. Available online: https://www.adamasintel.com/wp-content/uploads/2019/06/Adamas-Intelligence-Rare-Earths-Small-Market-Big-Necessity-Q2-2019.pdf (accessed on 2 July 2023).
- Reddall, B.; Gordon, J. Analysis: Search for Rare Earth Substitutes Gathers Pace. 22 June 2012. Available online: https://www.reuters.com/article/uk-rareearths-alternatives-idUKBRE85L0YK20120622 (accessed on 30 July 2023).
- Nguyen, R.T.; Imholte, D.D.; Matthews, A.C.; Swank, W.D. NDFEB content in ancillary motors of U.S. conventional passenger cars and light trucks: Results from the field. Waste Manag. 2019, 83, 209–217. [Google Scholar] [CrossRef] [PubMed]
- Bauer, D.; Diamond, D.; Li, J.; Sandalow, D.; Telleen, P.; Wanner, B. U.S. Department of Energy—Critical Materials Strategy. December 2010. Available online: https://www.energy.gov/sites/prod/files/edg/news/documents/criticalmaterialsstrategy.pdf (accessed on 10 July 2023).
- Wood Mackenzie. 700 Million Electric Vehicles Will Be on the Roads by 2050. 8 February 2021. Available online: https://www.woodmac.com/press-releases/700-million-electric-vehicles-will-be-on-the-roads-by-2050/ (accessed on 9 July 2023).
- IEA. Global EV Sales by Scenario, 2020–2030—Charts—Data & Statistics. 20 April 2021. Available online: https://www.iea.org/data-and-statistics/charts/global-ev-sales-by-scenario-2020-2030 (accessed on 9 July 2023).
- IEA. Innovation Needs in the Sustainable Development Scenario—Clean Energy Innovation. July 2020. Available online: https://www.iea.org/reports/clean-energy-innovation/innovation-needs-in-the-sustainable-development-scenario (accessed on 9 July 2023).
- IEA. Stated Policies Scenario (STEPS). December 2022. Available online: https://www.iea.org/reports/global-energy-and-climate-model/stated-policies-scenario-steps (accessed on 9 July 2023).
- Bloomberg Finance, L.P. Evo Report 2023: BloombergNEF. 2023. Available online: https://about.bnef.com/electric-vehicle-outlook/ (accessed on 9 July 2023).
- Mordor Intelligence. E-Bike Market Size & Share Analysis—Growth Trends & Forecasts (2023–2028). 2023. Available online: https://www.mordorintelligence.com/industry-reports/e-bike-market (accessed on 26 July 2023).
- BloombergNEF. Two-Wheelers on a Steeper Path to Zero Emissions by 2050. 14 June 2022. Available online: https://about.bnef.com/blog/two-wheelers-on-a-steeper-path-to-zero-emissions-by-2050/#:~:text=To%20reach%202050%20net%2Dzero,achieved%20over%20the%20past%20decade (accessed on 26 July 2023).
- Crompton, P. 200 Million E-Bikes Ridden Today—Poised to Grow to 2 Billion by 2050. 22 January 2016. Available online: https://www.bestmag.co.uk/200-million-e-bikes-ridden-today-poised-grow-2-billion-2050/ (accessed on 26 July 2023).
- Cycles News. Electric Bikes Could Grow to 2 Billion by 2050—News. Local Bike Shop Day. 10 May 2017. Available online: https://localbikeshopday.co.uk/news/?id=2094&name=Electric%2Bbikes%2Bcould%2Bgrow%2Bto%2B2%2Bbillion%2Bby%2B2050 (accessed on 26 July 2023).
- Inkwood Research. Global E-Bike Market Forecast: 2022–2030. 14 July 2023. Available online: https://inkwoodresearch.com/reports/e-bike-market/ (accessed on 26 July 2023).
- International Federation of Robotics. World Robotics 2022. October 2022. Available online: https://ifr.org/downloads/press2018/2022_WR_extended_version.pdf (accessed on 2 July 2023).
- International Federation of Robotics. World Robotics 2021. October 2021. Available online: https://ifr.org/downloads/press2018/2021_10_28_WR_PK_Presentation_long_version.pdf (accessed on 9 July 2023).
- Alsop, T. Global PC Vendor Sales by Quarter 2023. 26 April 2023. Available online: https://www.statista.com/statistics/263393/global-pc-shipments-since-1st-quarter-2009-by-vendor/ (accessed on 10 July 2023).
- Coherent Market Insights. Consumer Electronics Market Size. Consumer Electronics Market Size, Trends and Forecast to 2028. October 2021. Available online: https://www.coherentmarketinsights.com/market-insight/consumer-electronics-market-4722 (accessed on 9 July 2023).
- Cucchiella, F.; D’Adamo, I.; Lenny Koh, S.C.; Rosa, P. Recycling of WEEEs: An Economic Assessment of present and future E-waste streams. Renew. Sustain. Energy Rev. 2015, 51, 263–272. [Google Scholar] [CrossRef]
- Precedence Research. Consumer Electronics Market Size to Surpass US$ 1.13 Trillion by 2030. 28 March 2022. Available online: https://www.globenewswire.com/fr/news-release/2022/03/28/2411214/0/en/Consumer-Electronics-Market-Size-to-Surpass-US-1-13-Trillion-by-2030.html (accessed on 2 July 2023).
- Fortune Business Insights. The Global Consumer Electronics Market Size Was USD 729.11 Billion in 2019. The Market is Projected to Grow from USD 689.45 billion in 2020 to USD 989.37 Billion in 2027. 2021. Available online: https://www.fortunebusinessinsights.com/consumer-electronics-market-104693 (accessed on 9 July 2023).
- United Nations. Population. 2022. Available online: https://www.un.org/en/global-issues/population#:~:text=Our%20growing%20population&text=The%20world’s%20population%20is%20expected,billion%20in%20the%20mid%2D2080s (accessed on 9 July 2023).
- PwC. The World in 2050. February 2017. Available online: https://www.pwc.com/gx/en/research-insights/economy/the-world-in-2050.html#data (accessed on 9 July 2023).
- Oregon State University. Common Industrial Motor Types. 15 January 2020. Available online: https://eec.oregonstate.edu/common-industrial-motor-types (accessed on 9 July 2023).
- Maxwell Ford. What’s the Difference between Powertrain and Drivetrain? 2023. Available online: https://www.maxwellford.com/powertrain-and-drivetrain/ (accessed on 9 July 2023).
- Constantinides, S. The Important Role of Dysprosium in Modern Permanent Magnets. 2015. Available online: http://businessdocbox.com/Metals/80628414-The-important-role-of-dysprosium-in-modern-permanent-magnets.html (accessed on 9 July 2023).
- Garside, M. Rare Earths: Global Reserves by Country 2022. 28 February 2023. Available online: https://www.statista.com/statistics/277268/rare-earth-reserves-by-country/#:~:text=According%20to%20estimates%2C%20the%20total,Vietnam%2C%20Brazil%2C%20and%20Russia (accessed on 10 September 2023).
- Detry, E.; Gauduel, A.; Geurts, F.; Ivers, L.; McAdoo, M.; Möncks, T.; Butler, T. Five Steps for Solving the Rare-Earth Metals Shortage. BCG Global. 7 July 2023. Available online: https://www.bcg.com/publications/2023/five-steps-for-solving-the-rare-earth-metals-shortage (accessed on 10 September 2023).
- Morimoto, S.; Kuroki, H.; Narita, H.; Ishigaki, A. Scenario assessment of neodymium recycling in Japan based on Substance Flow Analysis and future demand forecast. J. Mater. Cycles Waste Manag. 2021, 23, 2120–2132. [Google Scholar] [CrossRef]
- Daly, M.; Krisher, T. New Biden Administration Pollution Rules Would Require almost 10 Times as Many EV Sales in 2032 as Today. 12 April 2023. Available online: https://fortune.com/2023/04/12/new-biden-administration-epa-pollution-rules-require-10x-ev-sales-2032/ (accessed on 10 September 2023).
- Mock, P.; Yang, Z. A 2022 Update on Electric Car Sales: China Taking the Lead, the U.S. Catching up, and Europe Falling behind. 19 August 2022. Available online: https://theicct.org/2022-update-ev-sales-us-eu-ch-aug22/ (accessed on 10 September 2023).
- Bown, C.P. Industrial Policy for Electric Vehicle Supply Chains and the US-EU Fight Over the Inflation Reduction Act. Peterson Institute for International Economics; Working Paper No. 23-1; Peterson Institute for International Economics Working Paper; Centre for Economic Policy Research (CEPR): Washington, DC, USA, 2023. [Google Scholar]
- Turner, J.M. Recycling Lead-Acid Batteries Is Easy. Why Is Recycling Lithium-ion Batteries Hard? 24 July 2022. Available online: https://cleantechnica.com/2022/07/24/recycling-lead-acid-batteries-is-easy-why-is-recycling-lithium-ion-batteries-hard/ (accessed on 10 September 2023).
- Pearce, F. Getting the Lead Out: Why Battery Recycling Is a Global Health Hazard. 2 November 2020. Available online: https://e360.yale.edu/features/getting-the-lead-out-why-battery-recycling-is-a-global-health-hazard (accessed on 10 September 2023).
- Ballantyne, A.D.; Hallett, J.P.; Riley, D.J.; Shah, N.; Payne, D.J. Lead acid battery recycling for the twenty-first century. R. Soc. Open Sci. 2018, 5, 171368. [Google Scholar] [CrossRef] [PubMed]
- Turner, J.M. Charged: A History of Batteries and Lessons for a Clean Energy Future. In Weyerhaeuser Environmental Books; Sutter, P.F., Ed.; University of Washington Press: Seattle, WA, USA, 2023. [Google Scholar]
- U.S. Energy Information Administration—EIA. Independent Statistics and Analysis. Use of Gasoline. 2022. Available online: https://www.eia.gov/energyexplained/gasoline/use-of-gasoline.php (accessed on 25 July 2023).


| NdFeB Elements | Weight Percent |
|---|---|
| Iron (Fe) | 64.2%–68.5% |
| Neodymium and Praseodymium (NdPr) | 29%–32% |
| Boron (B) | 1%–1.2% |
| Dysprosium (Dy) | 0.8%–1.2% |
| Niobium (Nb) | 0.5%–1% |
| Nd Market | % Share | Dy Market | % Share |
|---|---|---|---|
| On-shore | 18% | On-shore | 8% |
| Off-shore | 2% | Off-shore | 1% |
| EV | 21% | EV | 59% |
| EB | 5% | EB | 8% |
| GCE | 19% | GCE | 8% |
| IR | 8% | IR | 3% |
| SR | 1% | SR | <1% |
| IM | 20% | IM | 9% |
| NDM | 6% | NDM | 3% |
Disclaimer/Publisher’s Note: The statements, opinions and data contained in all publications are solely those of the individual author(s) and contributor(s) and not of MDPI and/or the editor(s). MDPI and/or the editor(s) disclaim responsibility for any injury to people or property resulting from any ideas, methods, instructions or products referred to in the content. |
© 2023 by the authors. Licensee MDPI, Basel, Switzerland. This article is an open access article distributed under the terms and conditions of the Creative Commons Attribution (CC BY) license (https://creativecommons.org/licenses/by/4.0/).
Share and Cite
Heim, J.W., II; Vander Wal, R.L. NdFeB Permanent Magnet Uses, Projected Growth Rates and Nd Plus Dy Demands across End-Use Sectors through 2050: A Review. Minerals 2023, 13, 1274. https://doi.org/10.3390/min13101274
Heim JW II, Vander Wal RL. NdFeB Permanent Magnet Uses, Projected Growth Rates and Nd Plus Dy Demands across End-Use Sectors through 2050: A Review. Minerals. 2023; 13(10):1274. https://doi.org/10.3390/min13101274
Chicago/Turabian StyleHeim, James W., II, and Randy L. Vander Wal. 2023. "NdFeB Permanent Magnet Uses, Projected Growth Rates and Nd Plus Dy Demands across End-Use Sectors through 2050: A Review" Minerals 13, no. 10: 1274. https://doi.org/10.3390/min13101274