Article

An Integrated Geophysics and Isotope Geochemistry to Unveil the Groundwater Paleochannel in Abydos Historical Site, Egypt

by
Abdelbaset M. Abudeif
1,*,
Gamal Z. Abdel Aal
2,
Nessreen F. Abdelbaky
3,4,
Mohamed H. Ali
1 and
Mohammed A. Mohammed
1
1
Geology Department, Faculty of Science, Sohag University, Sohag 1682511, Egypt
2
Geology Department, Faculty of Science, Assiut University, Assiut 2071515, Egypt
3
Geophysics Exploration, Dessert Research Center, Al Mataria 4540064, Egypt
4
Biology Department Yanbu Branch, Taibah University, Al Madina 4246424, Saudi Arabia
*
Author to whom correspondence should be addressed.
Minerals 2023, 13(1), 64; https://doi.org/10.3390/min13010064
Submission received: 23 November 2022 / Revised: 15 December 2022 / Accepted: 21 December 2022 / Published: 30 December 2022

Abstract

:
The scientific controversy among archaeologists about the existence of paleochannels under the Abydos archaeological site, Sohag, Egypt connecting the Osirion (cenotaph of Seti I) with the Nile River has been explained in this study. This study is an attempt to address this issue using integrating a near-surface geophysical approach with stable isotopic geochemistry on this site. Particularly, the stable oxygen and hydrogen isotopes on the water samples collected from the surface and the groundwater in the study area were analyzed and interpreted. The isotopes result showed that the Osirion water is a mixture of three different types of water: Old Nile Water (ONW) before the construction of the High Dam, Recent Nile Water (RNW) after the construction of the High Dam, and Paleowater (PW) from deeper aquifers. Field observations of the Osirion and nearby water cannot explain the presence and direction of this water. Therefore, the next step in this study is determining the location and the direction of the paleochannel connecting the Osirion with the Nile River which was proven using the electric resistivity tomography (ERT) technique. By using the results of the isotope of all types of water near the Osirion and its surrounding wells and the water of the Nile River, in addition to the near-surface geophysical measurements, the results indicated that the 3D view of the ERT data revealed a prospective paleochannel in the direction of the northeast and its location, where this channel is in charge of providing groundwater from the Nile River to the Osirion location.

1. Introduction

The ancient Egyptian city of Abydos represents one of the most cherished and well-known sites of worship. This place gained attention as the sacred place of the Osiris cult because the First Dynasty pharaohs were honored by being buried there. Additionally, Abydos was mentioned in numerous ancient pharaonic writings, including the book of the dead and the pyramid texts [1].
The presence of groundwater close to the Osirion site is the key problem in this study since it negatively affects the erosion of the old stones that formed the temple. As a result, the current study is attempting to find practical solutions to determine the source of this groundwater and its trends in order to develop critical solutions to prevent it from having these significant effects. The geochemical analysis using the isotope was used to determine the origin of this water. Near-surface geophysical tool, namely ERT, was also employed to determine the location and direction of these waters.
Abydos is situated in the El-Balyana district, 70 km southwest of Sohag town, about 450 km south of Cairo, 150 km north of Luxor, and about 13 km west of the Nile River. The study area surrounding the Osirion at Abydos is represented between latitudes 26°10′54.17″ N and 26o11′9.92″ N and longitudes 31°55′3.48″ E and 31°55′4.07″ E (Figure 1).
The Osirion is located to the west of the Nile River, close to the Eocene Plateau, between the cultivated land and the borders of limestone plateau cliffs that are inhabited by sediment terraces of variable levels. The earliest sediments are 150 m high above the mean sea level (amsl). The youngest one rises up to 5–10 m above the nearby cultivated plains and is located at a height of roughly 70 m amsl (Figure 2).
The use of geochemistry as a tool for recognizing and locating archaeological sites, as well as discovering the locations of hidden buried cavities, is dependent on the extent to which the relationship between geochemistry of earth materials (i.e., soil, rocks, water, etc.) and the presence of archaeological remains [2,3,4]. Stable isotope geochemistry, on the other hand, is a powerful scientific tool in archaeological research. The study of stable oxygen (δ18O) and hydrogen (δ2H) isotopes in water resources may have significantly advanced the field of archaeological exploration [5,6,7,8].
One of the most advanced and most popular geophysical investigation approaches is the electrical resistivity approach [9,10]. Electrical resistivity tomography (ERT) is a non-invasive procedure that allows for the rapid collection of a large quantity of resistivity measurements. One of the key strategies that is extensively used in hydro-geophysical research and groundwater management is ERT. A change in the resistivity values both vertically and horizontally implies a change in the lithology of the subsurface and the amount of groundwater present. This method has demonstrated its dependability in locating and identifying groundwater aquifers. Electrical resistivity tomography has been extensively utilized in environmental and engineering assessments [11,12,13,14,15,16,17,18,19], hydrological [12,20,21,22,23], visualizing the structures at scales ranging from millimeter to kilometer [3,24], and defining the saline-freshwater interface [25,26,27,28], mineral prospecting [29,30,31], and the discoveries of groundwater in limestone aquifers that are karstified and fractured [32,33,34]. Additionally, this approach is chosen for employment in heritage excavations due to the difficulties of drilling, which harms both known and unknown artifacts. ERT has been used extensively over the past few decades for archaeological purposes to find and identify ancient structures, as well as to distinguish the local geological features and provide useful information about the building’s hidden foundations [35,36,37,38,39,40,41,42,43]. This comparatively recent geophysical method has also been applied to stone exposures [44,45,46].
This paper aims to prove the effectiveness of the integration between geochemical and geophysical investigations in detecting the hidden paleochannel linking the cenotaph of Seti I and the Nile River.

2. Historical Background of the Old Channel

Over the past century, a lot of expeditions made trips to Abydos and carried out excavations there. The first was made by Mariette in 1859, who dug up Seti I Temple at the Khedive’s cost [47]. According to Wallis Budge’s writing, a waterway formed of single stones that are outstanding for its size and craftsmanship connects the Nile River to the Memnon Palace [48]. During the time of Strabo, this channel was also mentioned on the Stele of Menthuhetep (Xlth Dynasty). When Edouard Naville, the field leader of the Abydos investigations from 1911 to 1914, dug up the cenotaph of Seti I, he verified what Budge had found in 1911 [49].
The Seti I temple was partially built on a backfill filling a deep trench hewn in the rock, for a mystery cause, which runs along the central axis of the central portion of the second court, according to Rostem [50], who included this in his report. Rostem adds that Abdel Salam M. Husein, an architect and the director of works for the Egyptian Antiquities Department, took core samples along the main axis of the Seti I temple in the first court in order to test the Barazie hypothesis. From these samples, Husein concluded that a channel carried water from the Nile to the cenotaph of Seti I. The filled pit was mentioned by Rosalie David in his memoirs as well [51].
Using GPR profiles, Abdel Hafez [52] found slight ground subsidence in the first and second Courts of the Temple. The depression, which was noticed both inside and outside of the Abydos Temple on the side nearest to the Nile, was interpreted by him as a channel under the temple (Figure 3). The groundwater levels in the Seti I cenotaph may have increased as a result of increased hydraulic conductivity brought on by this channel.
Figure 4 provides a full translation of the Osirion’s ancient scenes and inscriptions, which claim that the king built a channel to transport the boats of the Abydene gods [53].

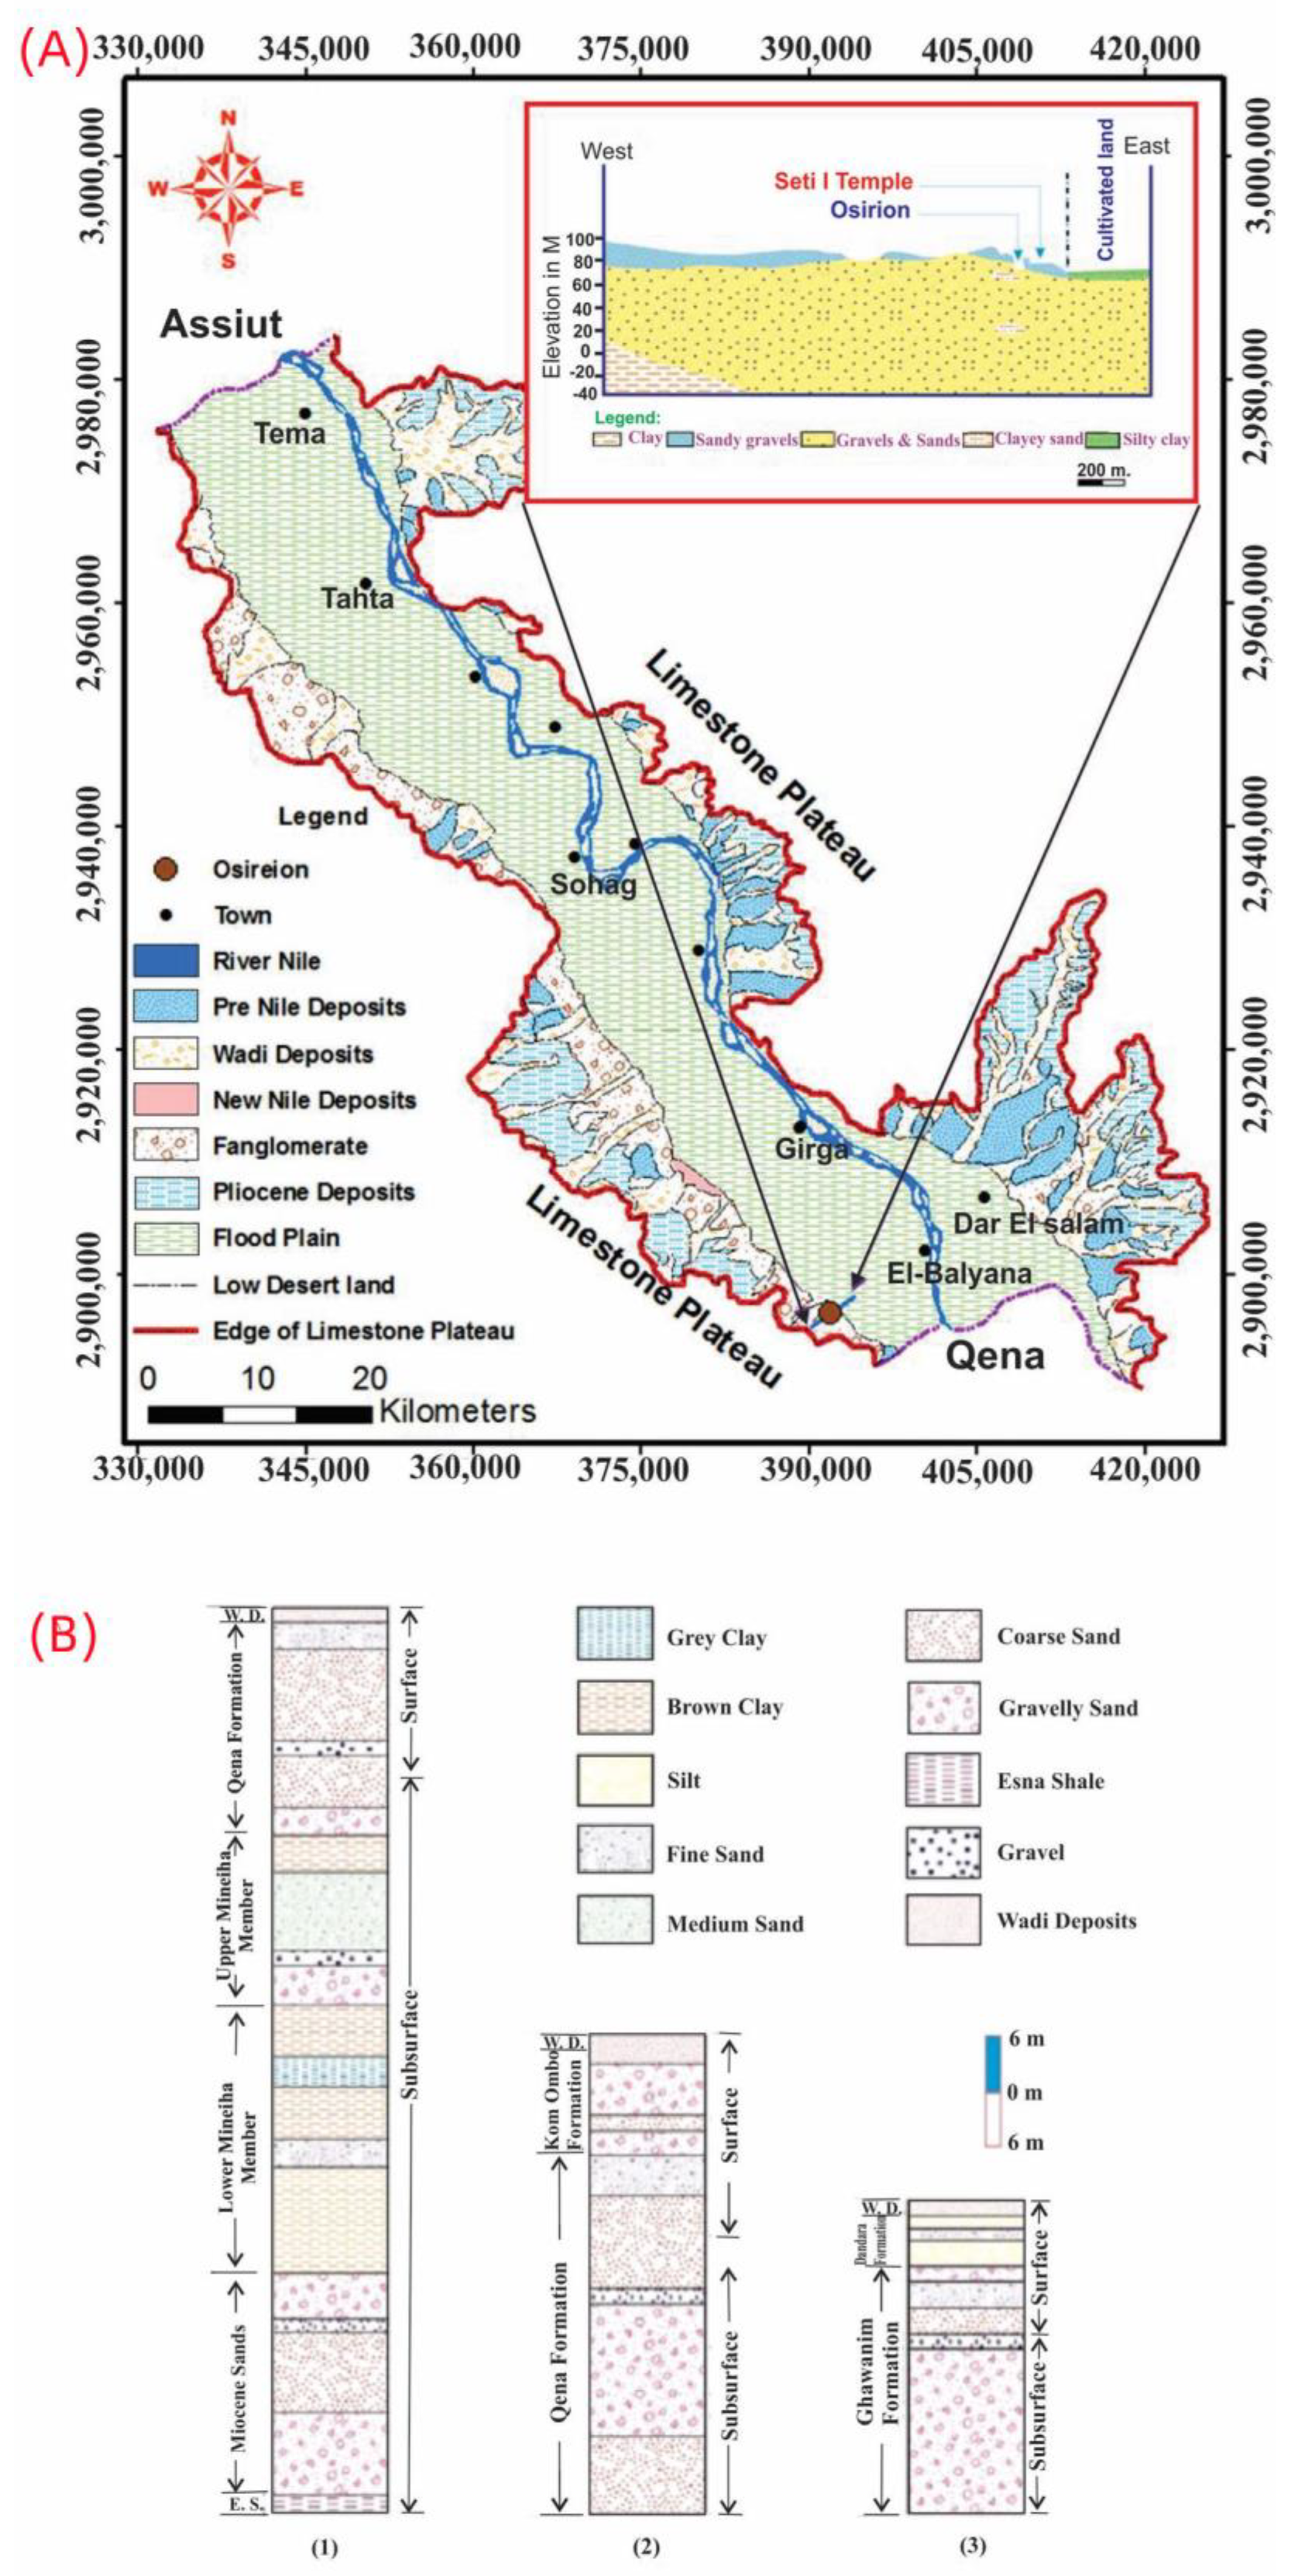
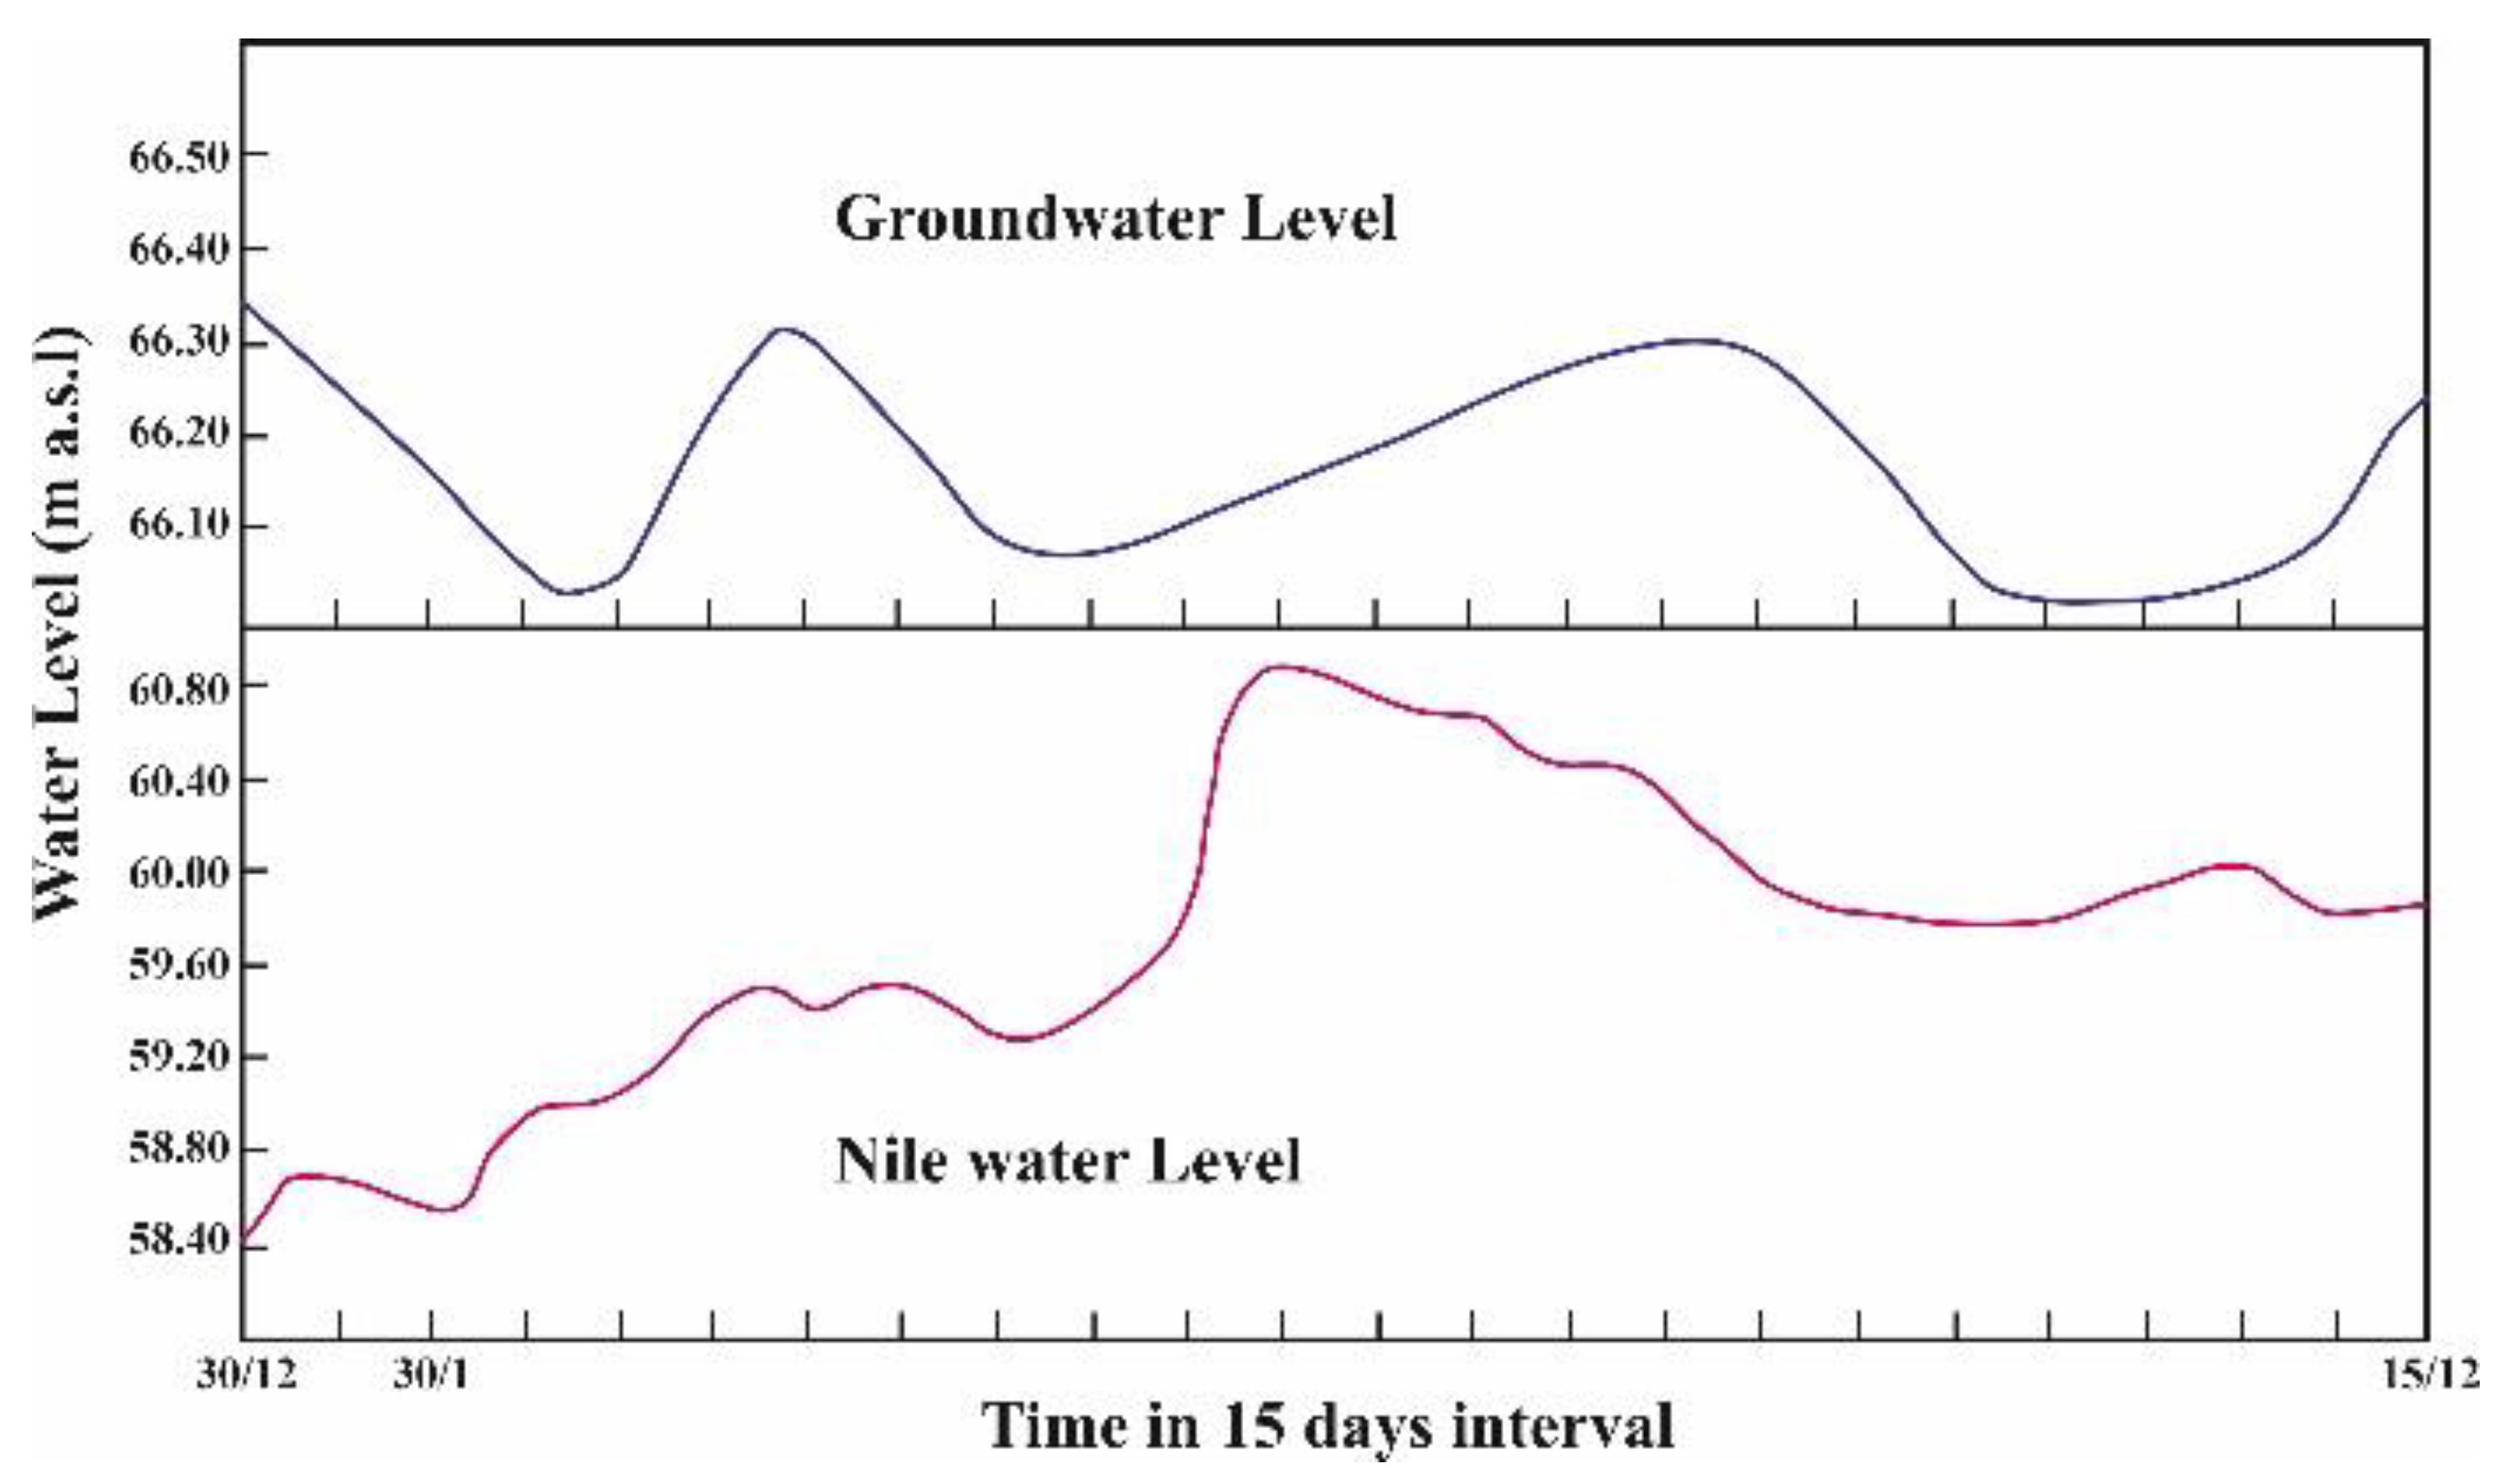
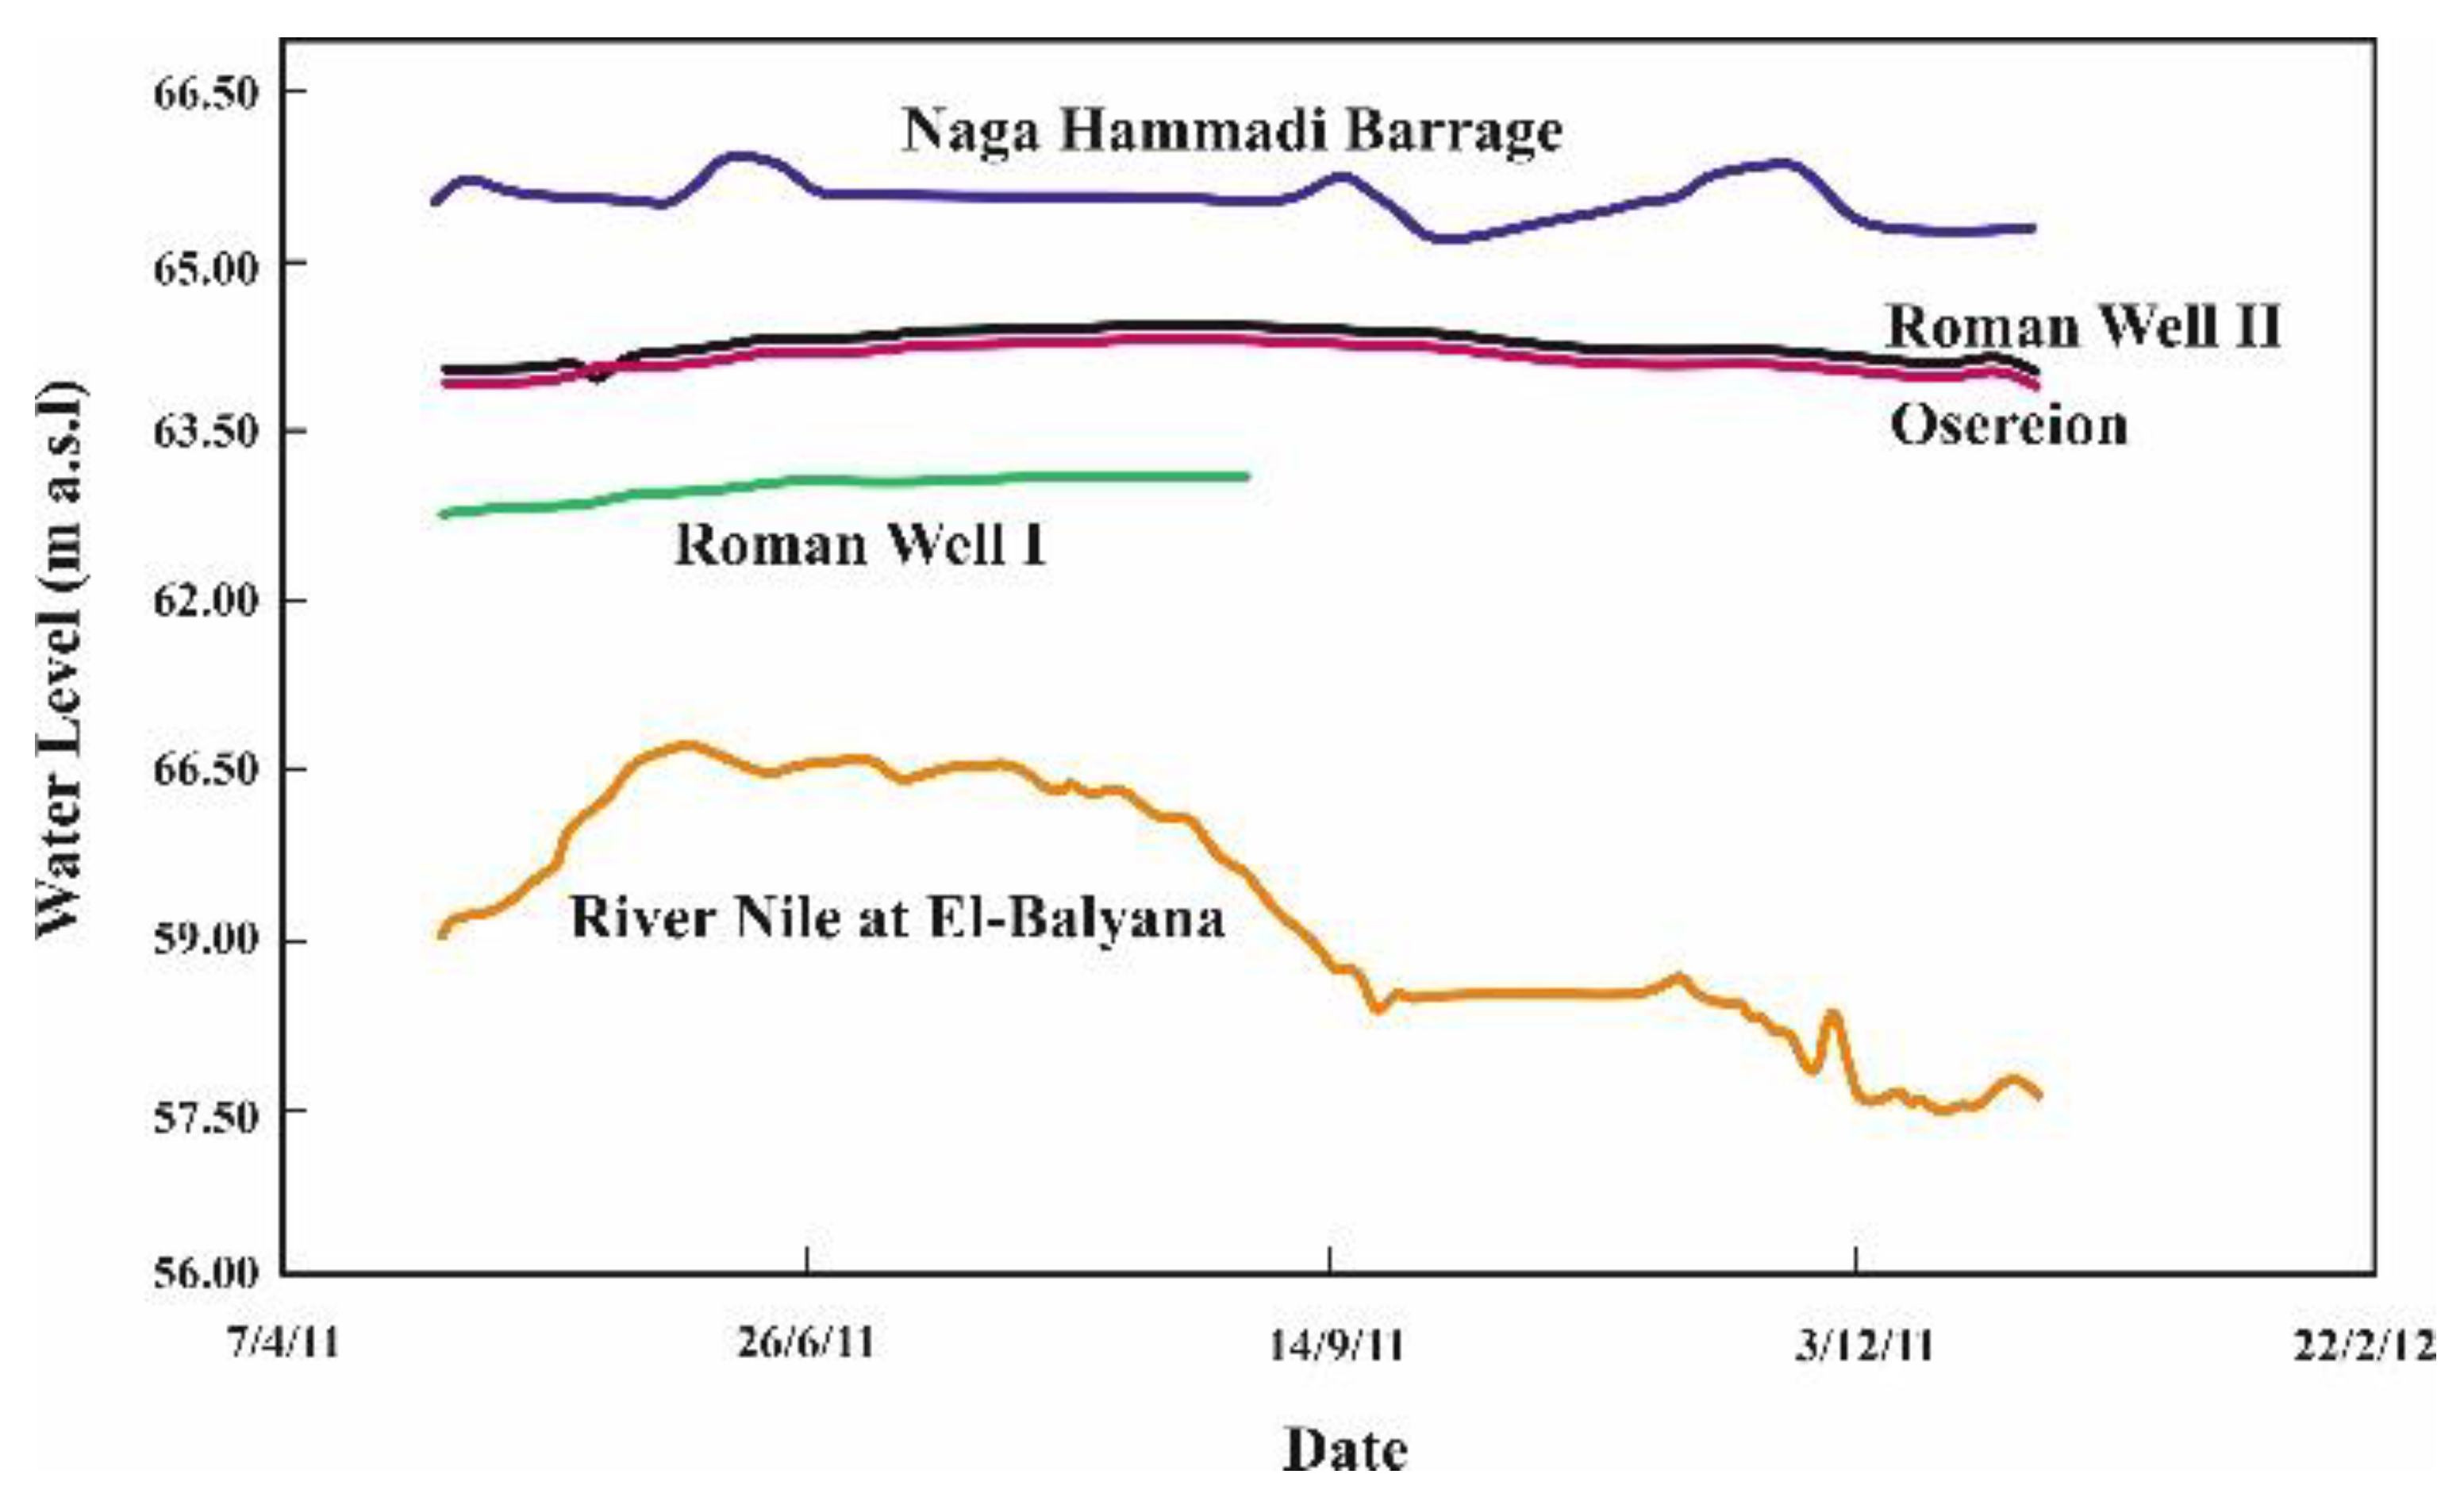
3. Geology, Hydrology, and Water Level Measurements

The study area is a section of the Nile Valley that has been geologically examined by several authors [54,55,56]. The different rock units that are visible in the Abydos area (Figure 5) are entirely made up of sedimentary succession and are arranged from base to top as follows: (a) Pliocene Clay; (b) Qena Sands (Upper Pliocene to Lower Pleistocene); (c) Kom Ombo Gravel; (d) Ghawanim Formation; and (e) the Dandara Formation, which spans from Pliocene to Recent [57]. At Abydos, the region is divided by deeply incised drainage channels and is bounded to the west by a limestone plateau. Many straight wadies oriented frequently either NW-SE or NE-SW imply an underlying tectonic influence of regional drainage patterns [58].
In the Abydos region, several scientists have conducted geophysical and groundwater investigations and prosecutions [52,58,60,61,62,63]. Qena Sands are the main deposit that holds water in the researched area. They become sparser in the direction of the west, where they meet the Paleocene to Lower Eocene Limestone Plateau. Due to the absence of Nile silt, this aquifer is present in semi-confined circumstances in old agricultural lands and also in unconfined conditions at the boundaries of the desert. Surface water (the Nile River and irrigation channels) is the primary source of this aquifer’s recharge, while its outflow occurs through evaporation, well drilling, and leaking to older, deeper aquifers.
According to Brooks and Issawi [60], it appears to be untrue that the groundwater in the Abydos region is obtained by infiltration from the Nile south of the Nag Hammadi Barrage. According to his relevant data, the water level south of the Barrage is 65 m, while the water level in the Osirion varies between 65.7 and 66 m at the same time. As a result, the hydrology associated with the water table topography in the Abydos area renders the Nile water seepage from the south an impossibility source.
Abdel Moneim [58] noted that in his research there is no hydraulic connection between the groundwater near the Seti I Temple and the waters of the Nile River in Balyana city (Figure 6). This theory was supported by Abu El-Magd [7] investigation of the Osirion region, and Figure 7 shows that the Nile water levels at Nag Hammadi Barrages are different from those at Osirion. The measurements made during this work are consistent with those made previously, where the Nile River’s water level at El-Balyana was 61 m (sample number 12), and at the same time (June 2021), the average water level measurements of the six dewatering wells surrounding the Osirion were about 62.75 m.

4. Materials and Methods

The authors have gathered a lot of information about the region, including maps of the geomorphology, geology, and geophysics as well as the history of the area’s archaeology and all the data from the Egyptian Antiquities Authority. Two approaches were employed in this study: isotope geochemistry and ERT. Below are details of the two methods.

4.1. Isotope Geochemistry

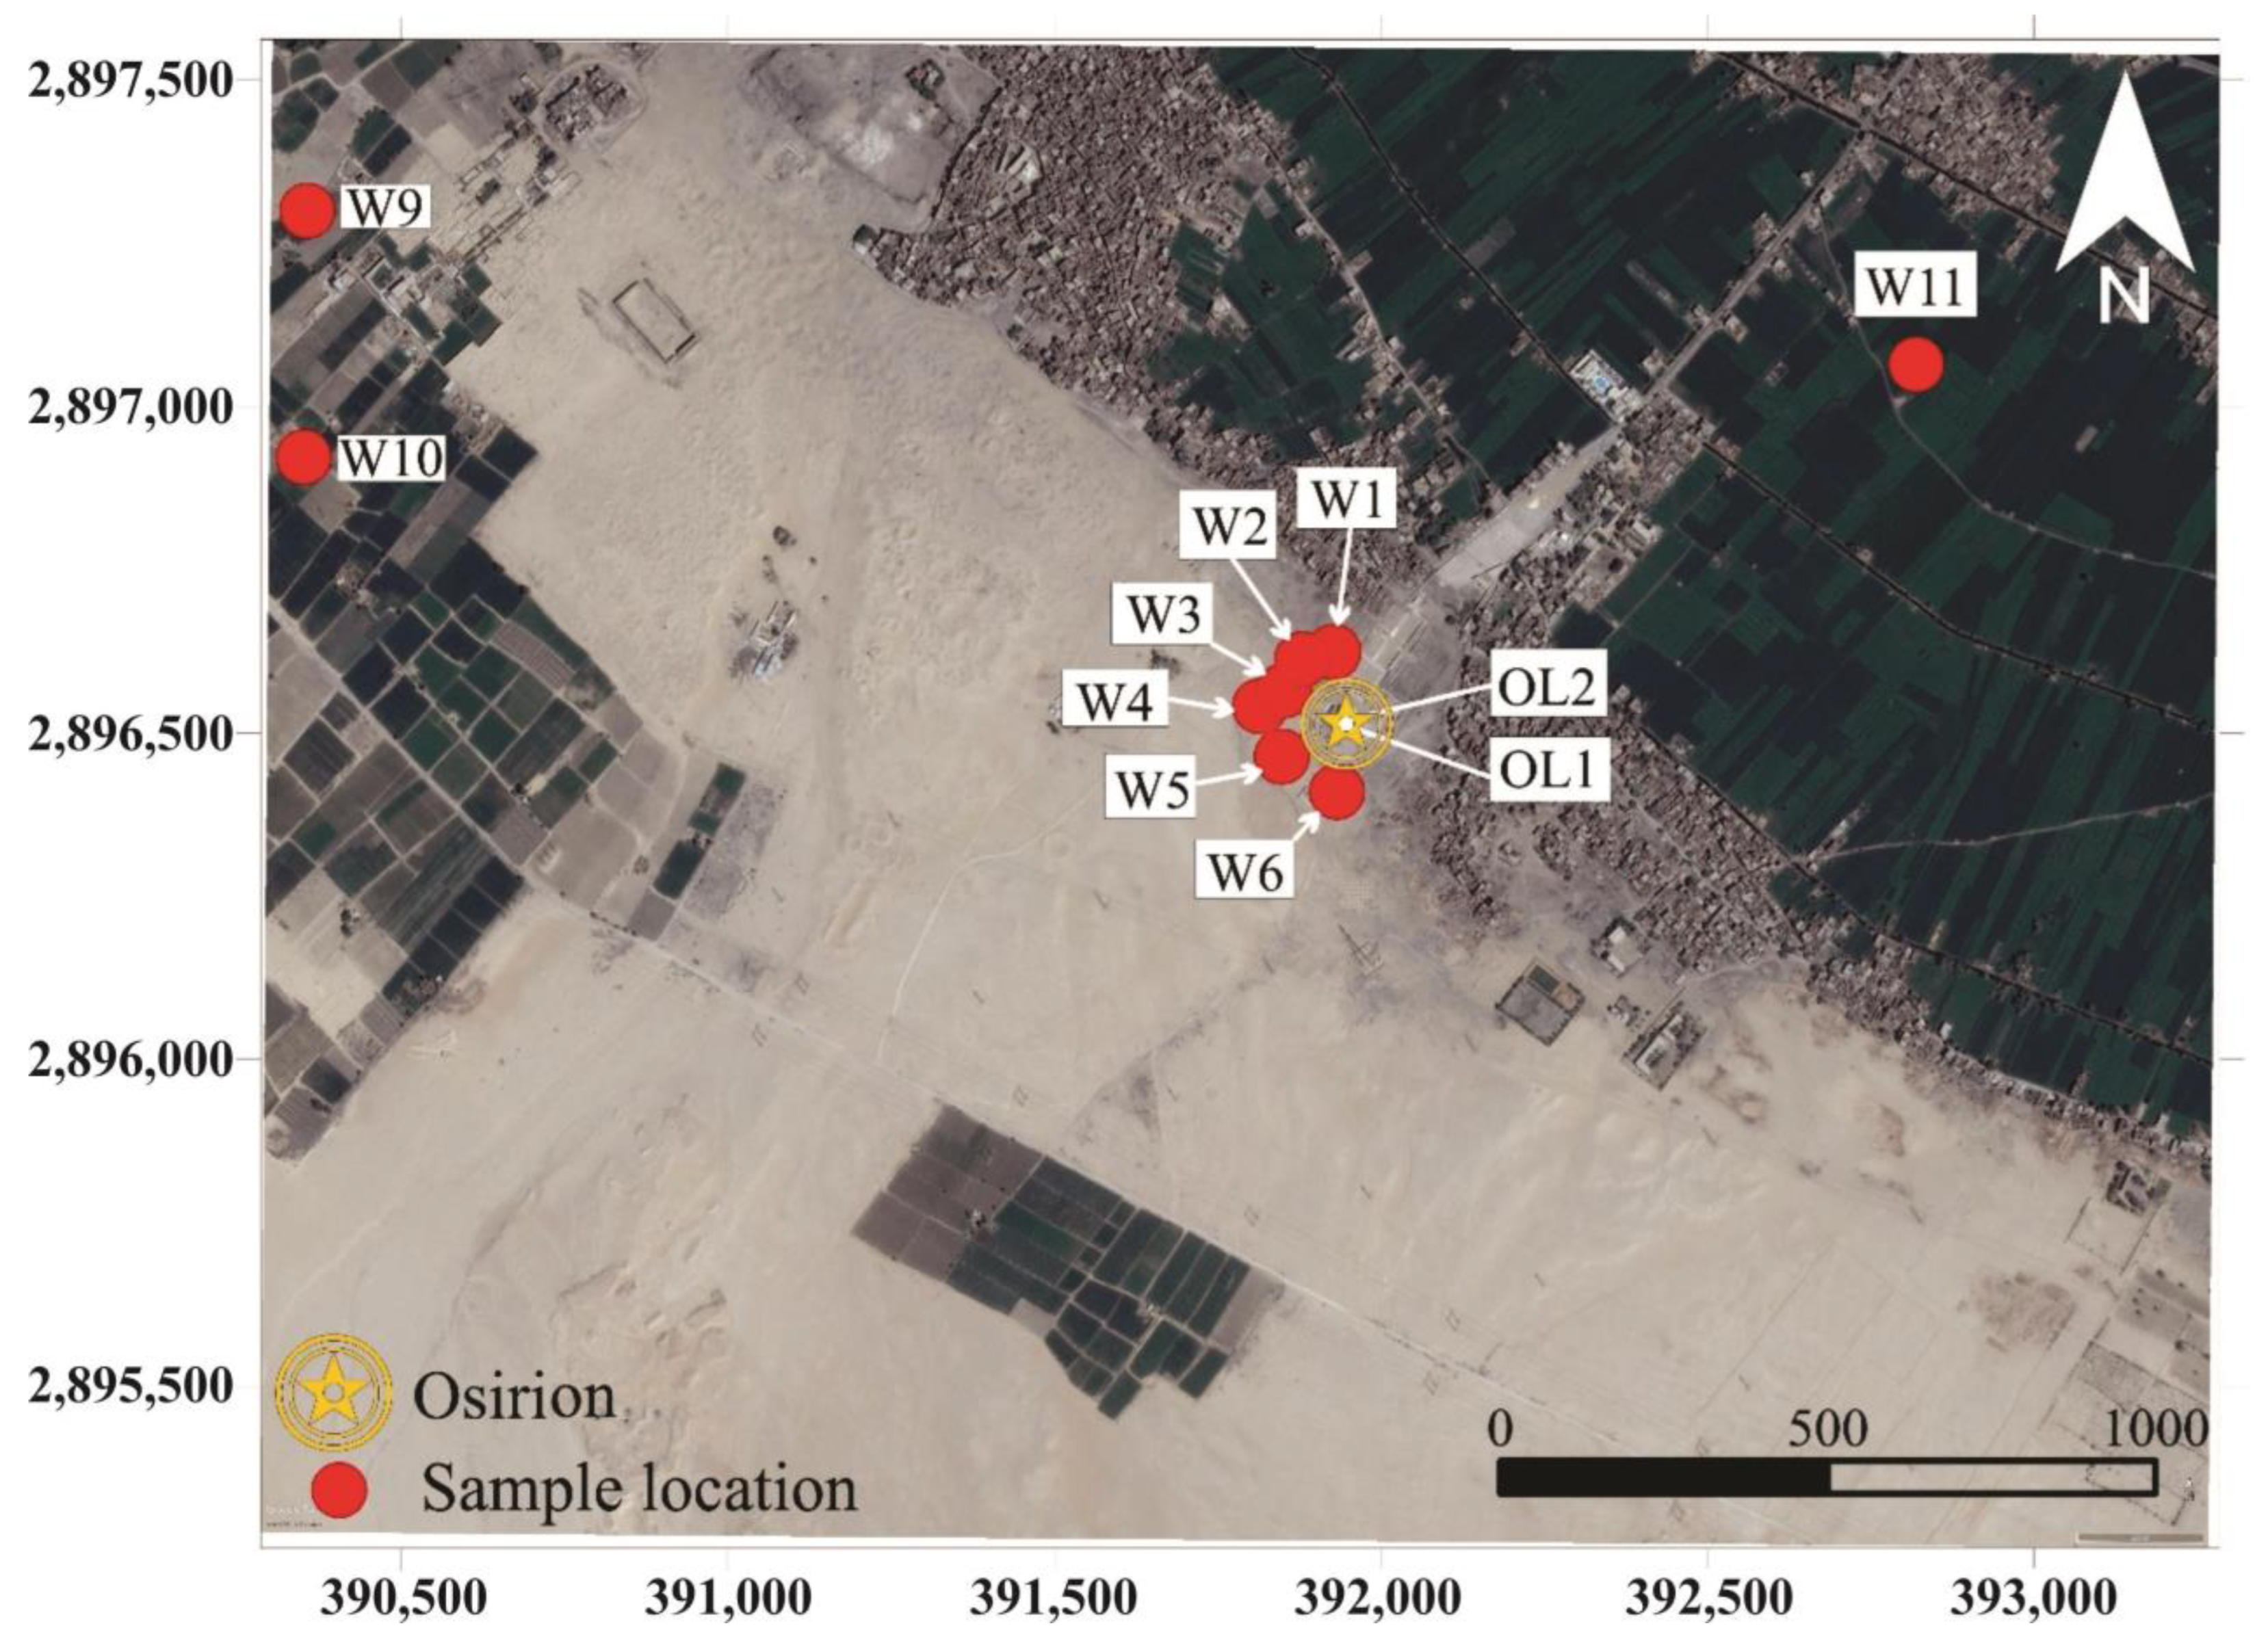
Sampling of Stable Isotopes and Data Used

The data used in this study depends mainly on twelve water samples collected from surface and groundwater samples and consisting of Nile water (one sample), groundwater from the semiconfined aquifer (one sample, W11), groundwater from the unconfined aquifer (8 samples, W1, W2, W3, W4, W5, W6, W9, and W10), as well as two samples from the Osirion lake water (OL1 and OL2, see Figure 8). In addition, the results of this study are combined with the data from previous investigations to help the interpretation of the obtained results from the current study and to perform modeling calculations. Traditional hydrochemical data (not presented here) are used in the statistical analysis along with the isotopic data as variables.
Stable isotopes of oxygen-18 (18O) and deuterium (2H) were examined in collected samples from the study area and stored in a refrigerator in sealed bottles according to the International Atomic Energy Agency [64] guidelines. The analysis was performed at the National Center for Nuclear Safety and Radiation Control (NCNSRC), the Egyptian Atomic Energy Authority (EAEA) in Cairo.
Stable isotopes of 18O and 2H were measured in water samples by Isotope Ratio Mass Spectrometry (IRMS) (Thermo Finnigan Quest Deltaplus XL mass spectrometer) following the conventional equilibration method [65,66,67]. The obtained results of both δ18O and δ2H values are expressed in delta notation (δ) which is relative to the international Vienna Standard Mean Ocean Water (VSMOW) [68]. The measurement precision is about 0.33‰ and 2‰ for δ18O and δ2H, respectively.
Two multivariate statistical methods, Hierarchical cluster analysis (HCA) and Factor analysis (FA) are used to examine the acquired data and identify Osirion water sources. The similarity of isotopic data along with the conventional hydrochemical data (data not represented here) between the different water sources was qualitatively analyzed by Q-mode HCA and Q-mode FA techniques.

4.2. Electrical Resistivity Tomography (ERT)

The near-surface geophysical tool used is the ERT, which is an appropriate site investigation of the subsurface structures and lithology with lateral and vertical resistivity variations. Additionally, it is used to look for the level of the groundwater table, find out exactly the pattern of groundwater flow, and recognize water-bearing formations [14,15,18,69,70]. During the resistivity assessments, the ground is injected with direct current using a pair of current electrodes, and a pair of potential electrodes are utilized to detect the potential difference between them. These measurements enable the determination of the true subsurface resistivity. The main benefits of the ERT are that it is simple to use, less expensive, quick, and time-consuming when looking into engineering difficulties and groundwater investigation, as well as its capacity to be visualized as 2-D and 3-D subsurface models.

ERT Data Acquisition and Processing

To offer detailed information about the subsurface, the gathered data contains Fourteen 2D resistivity imaging profiles (Figure 9) using the pole–dipole arrangement with 2.5 m electrode interval and multi-Electrodes system (ARES- GF Instrument) [71]. These data were collected during project work including miscellaneous geophysical methods in the study site.
Around the Osirion, eleven profiles covering 360 m in length were surveyed; six (P1–P6) of them were carried out in the direction of NW-SE, whereas the remaining five (P7–P11) profiles are in the direction of NE-SW, forming a shape approximating a grid. The three next profiles (P12–P14) show a NW–SE trend. Based on the reachability of profile locations, P12, P13, and P14 are 360 m, 140 m, and 73 m long, consecutively (Figure 9).
RES2DINV Software was used for processing these data. Before inverting the data, the entire set of apparent resistivity measurements was once more verified for out-of-the-ordinary data points using the robust-inversion and smoothness-constrained least squares techniques.

5. Results and Discussion

5.1. Isotopic Geochemical Interpretation

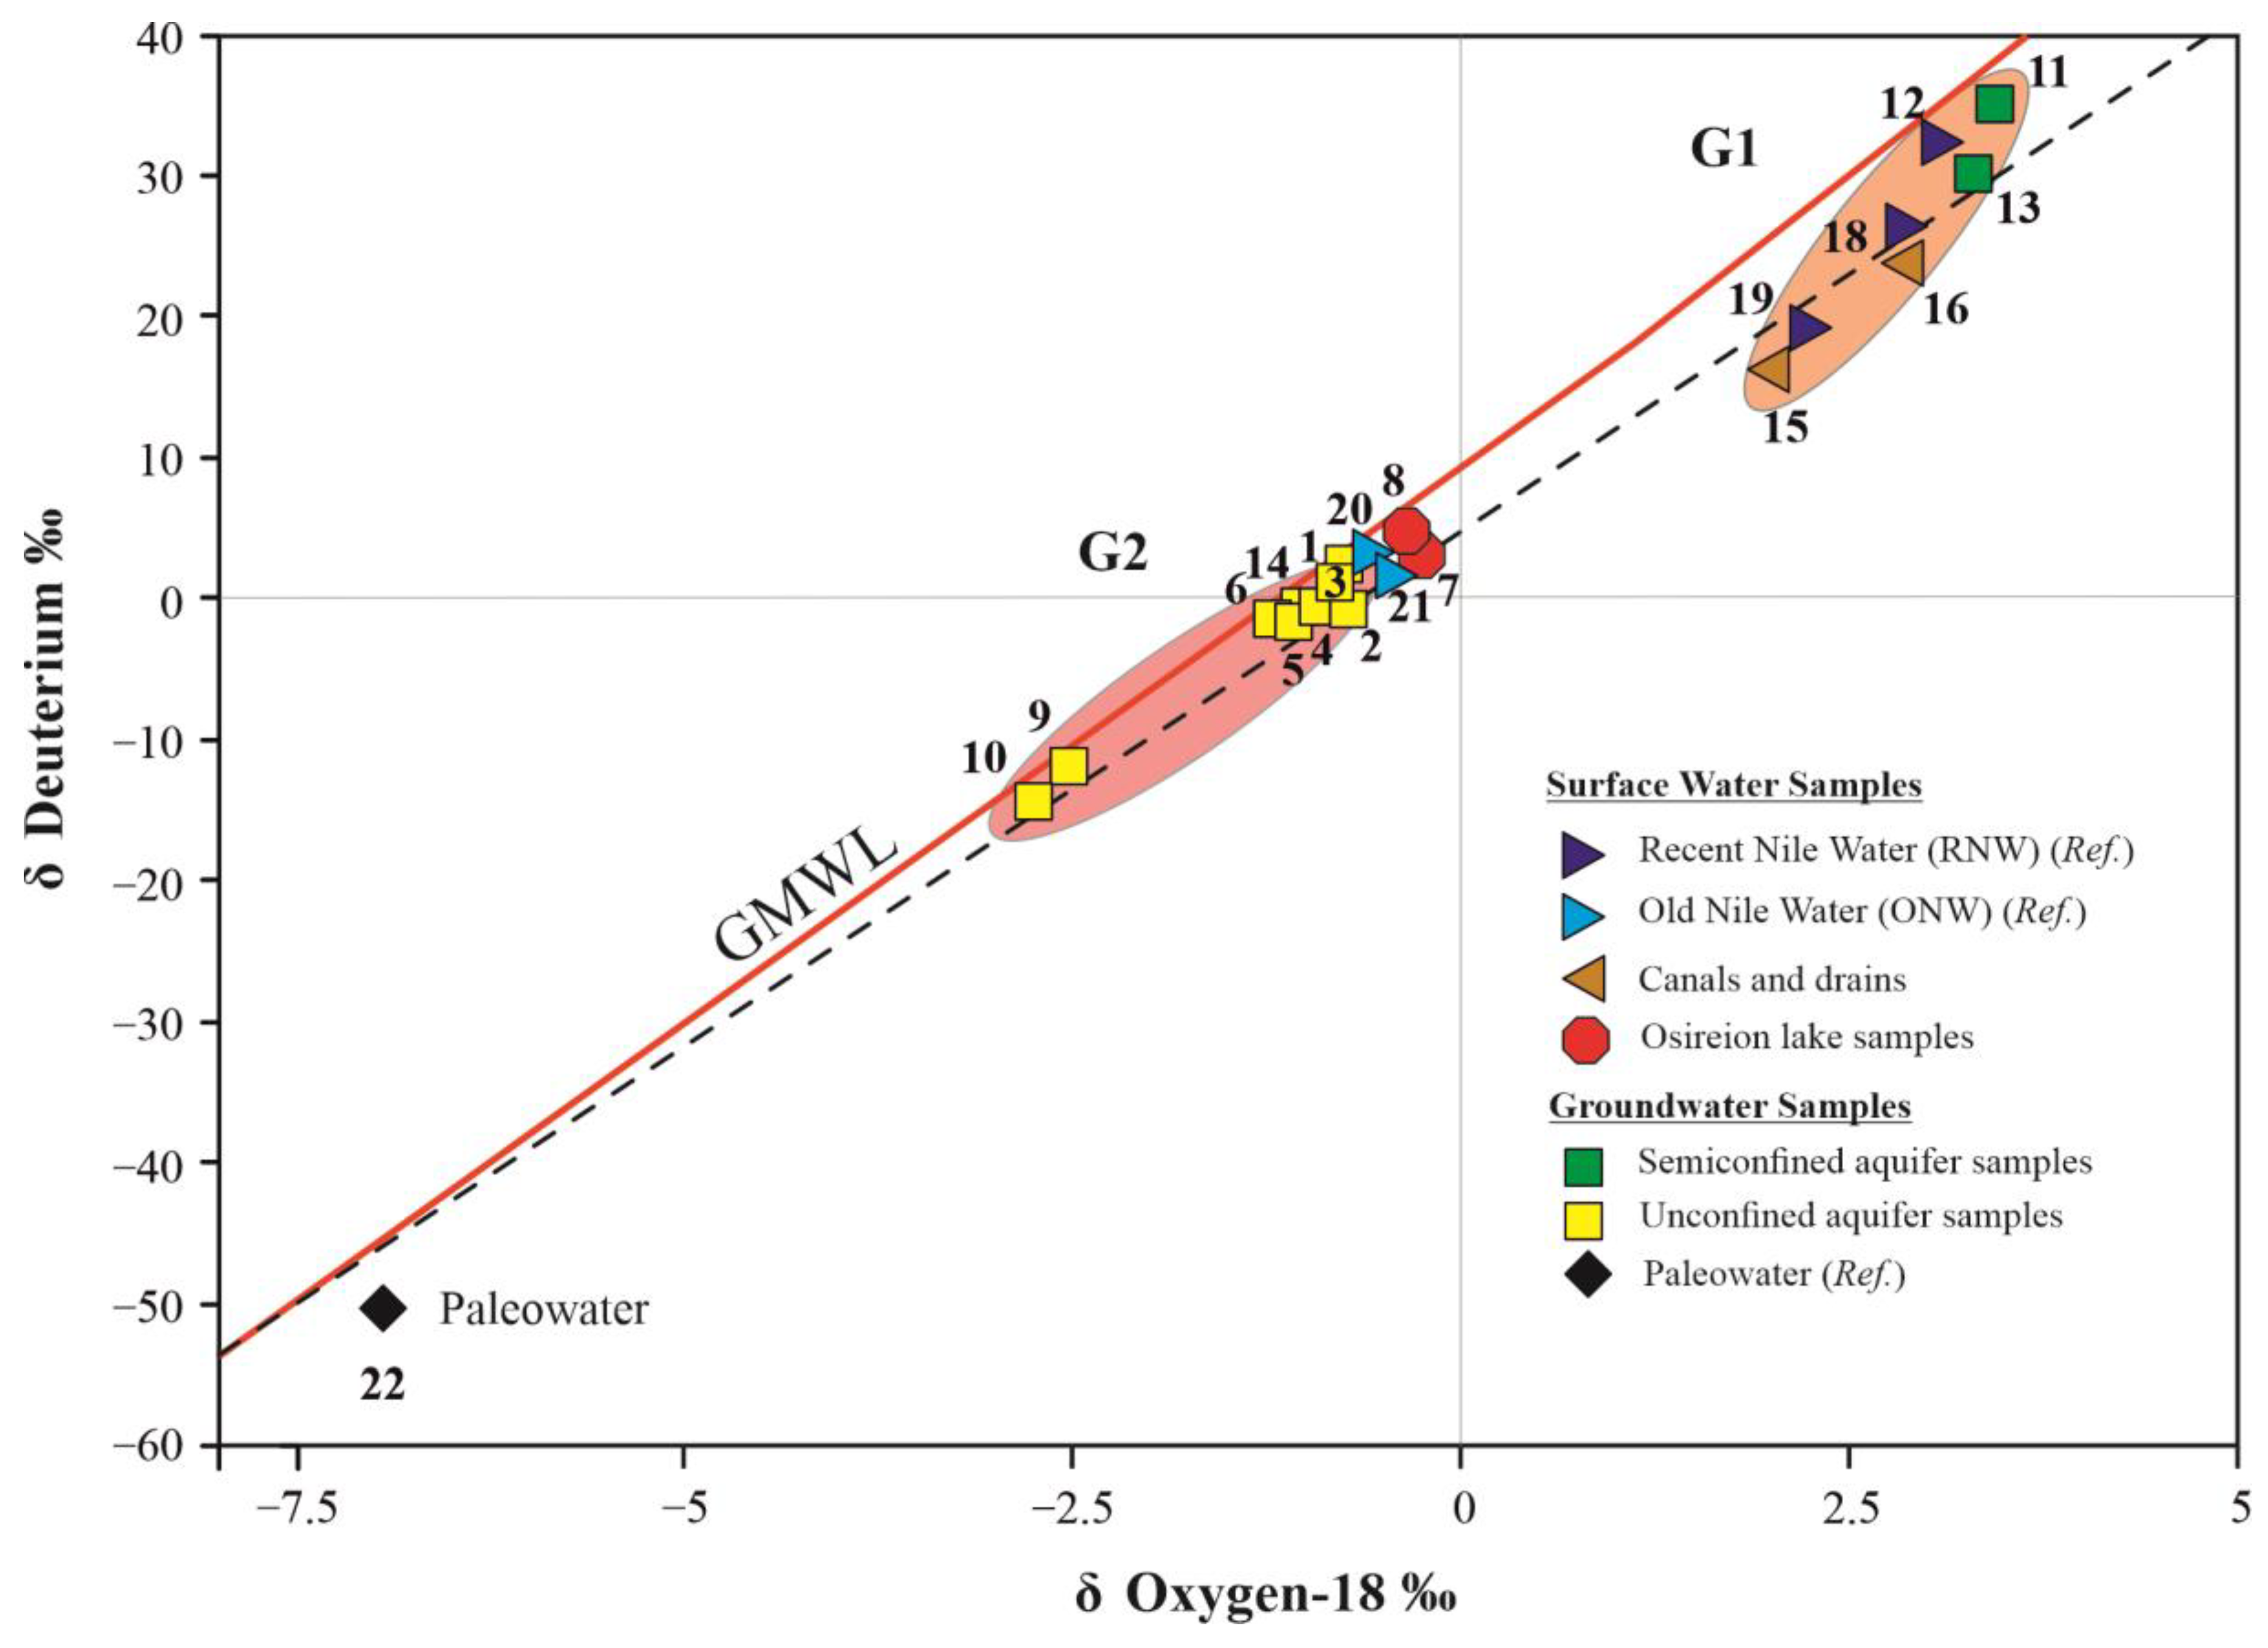
5.1.1. Isotopic Composition of Water

The results of δ18O and δ2H analysis for the selected samples and that from the previous studies are compiled by origin to facilitate discussion in Table 1 and graphically given in Figure 10 together with the Global Meteoric Water Line (GMWL) by Craig [72].
Figure 10 provides information on the groundwaters origin which shows a wide range of variation from −4.95 to +3.3‰ and from −29.8 to +36.3‰ for δ18O and δ2H, respectively [78]. The stable isotope compositions of most of the water samples within the study area fit a line comparable and depart, somewhat, from the global meteoric water line (GMWL) defined by Craig [72] (with R2 = 95.4%) in accordance with the least-square regression Equation (1):
δD = 7.111*δ18O + 5.479
As illustrated in Figure 10, all values of δ2H and δ18O are plotted fall below and close to the GMWL and the trend line converge near δ2H of -54 with slope less than the slope of the GMWL (7.111). In terms of correlation, δ2H and δ18O have a high-positive relationship (r = 0.98). These results indicated that the samples are enriched in the heavy isotope forms relative to precipitation indicating the meteoric origin of groundwater of the study area.
Isotopic compositions were observed to vary spatially. Mean isotope compositions became depleted by moving away from the Nile River water (32.44‰ δ2H and 3.07‰ δ18O, sample No. 12), towards groundwater wells in desert fringes (−29.8‰ δ2H and −4.95‰ δ18O, sample No. 10).

5.1.2. Isotopic Differences between Water Types

Two distinct groups of water samples were identified based on the δ18O and δ2H isotopic data as shown in Figure 10. The first group (Gl) has higher isotopic compositions that resembles today’s Nile water which were characterized by a δ18O value between +2.05 and +3.60 and a δ2H value varying between 19.00 and +36.32. The second group (G2) shows lower δ18O and δ2H values lie on the mixed straight line. It is characterized by a δ18O value between −2.71 and −0.31 and a δ2H value between −1.8 and −14.02 versus standard mean ocean water.
The first group G1 displays the surface water samples represented by the modern Nile River water and its main irrigation channels and drains. The isotope analyses indicated that the surface waters in the study area are enriched in heavy isotopes in comparison with the old pre-High Dam Nile water. This is mainly due to the storage of the Nile water in Nasser Lake behind the High Dam, and consequently exposed to more evaporation processes. The irrigation channel sample is depleted with respect to recent water Nile suggesting that the channel water mixes with portions of water Nile from periods before the construction of the Aswan High Dam and/or is recharged from groundwater [73,79,80]. This group also includes groundwater wells installed within the agricultural lands under semiconfined aquifer conditions (samples No. 11) scattering around the surface water values (Figure 10). This behavior suggests that the main recharge to the aquifer is the recent water Nile (last few decades) and its irrigation water network (permanent irrigation system). These waters are located along this network and can reach the Western Desert fringe, recently irrigated after land reclamation. The much higher values of the heavy isotopes in the water of this group reflect the evaporation effects during irrigation and before infiltration to the aquifer.
The isotope data of the second group (G2) comprises groundwater samples (samples No. 1–6, and 9–10) situated in the western desert fringes under the confined aquifer conditions. This water is attributed to the old Nile water inundation before the construction of the Aswan High Dam [75]. It is less affected by evaporation due to the high discharges of the water Nile and the near absence of a reservoir upstream. Some contributions from paleowater cannot be excluded from this water, especially in those wells, which show more depletion in the stable isotopes. Samples No. 9 and 10 have the most depleted isotopic composition, suggesting a possible recharging from the paleowater sources during the pluvial period with colder climatic conditions many thousands of years ago as explained by Zephyrus et al., [81]. Palaeowater was presumed to have seeped from adjacent aquifers through the fault systems and upwards leakage due to excessive pumping in the newly reclaimed lands in the study area. Generally, the recharge source for this group represents a mixing case between old Nile water prior to the construction of the Aswan High Dam (AHD) with δ18O = −0.6 3‰ and δ2H = +4.3‰, [75] and recent Nile water with isotopic content of δ18O = −3.07 3‰ and δ2H = 32.44 3‰ (the current study). However, the mixing cases between paleowater with isotopic content of δ18O = −7.14‰ and δ2H = −50.00‰ must not be overlooked [77] and old Nile water prior to the construction of the Aswan High Dam (AHD), which may appear clearly in the groundwater wells located in the desert fringes which should be studied separately.
The water lake of the present study at the Osirion site (samples No.7 and 8) belongs to the second group isotopic signature. The δ18O values in these samples range between −0.31 and −0.42 and were plotted between Global Meteoric Water Line (GMWL), and the trend line of the studied water samples close to groundwater samples tapping the unconfined aquifer. Samples from Osirion lake are slightly isotopically enriched than the adjacent groundwater wells (ONW) and have more depleted values when compared with the isotopic fingerprint of the surface water samples (RNW) which makes the recent Nile water a very possible source. This depletion in the isotopic composition reflects; (1) the mixing with old Nile water recharged to the quaternary aquifer before the construction of Aswan High Dam in 1969, and (2) the recharge from the paleowater from the deeper aquifers.

5.1.3. Multivariate Statistical Analysis

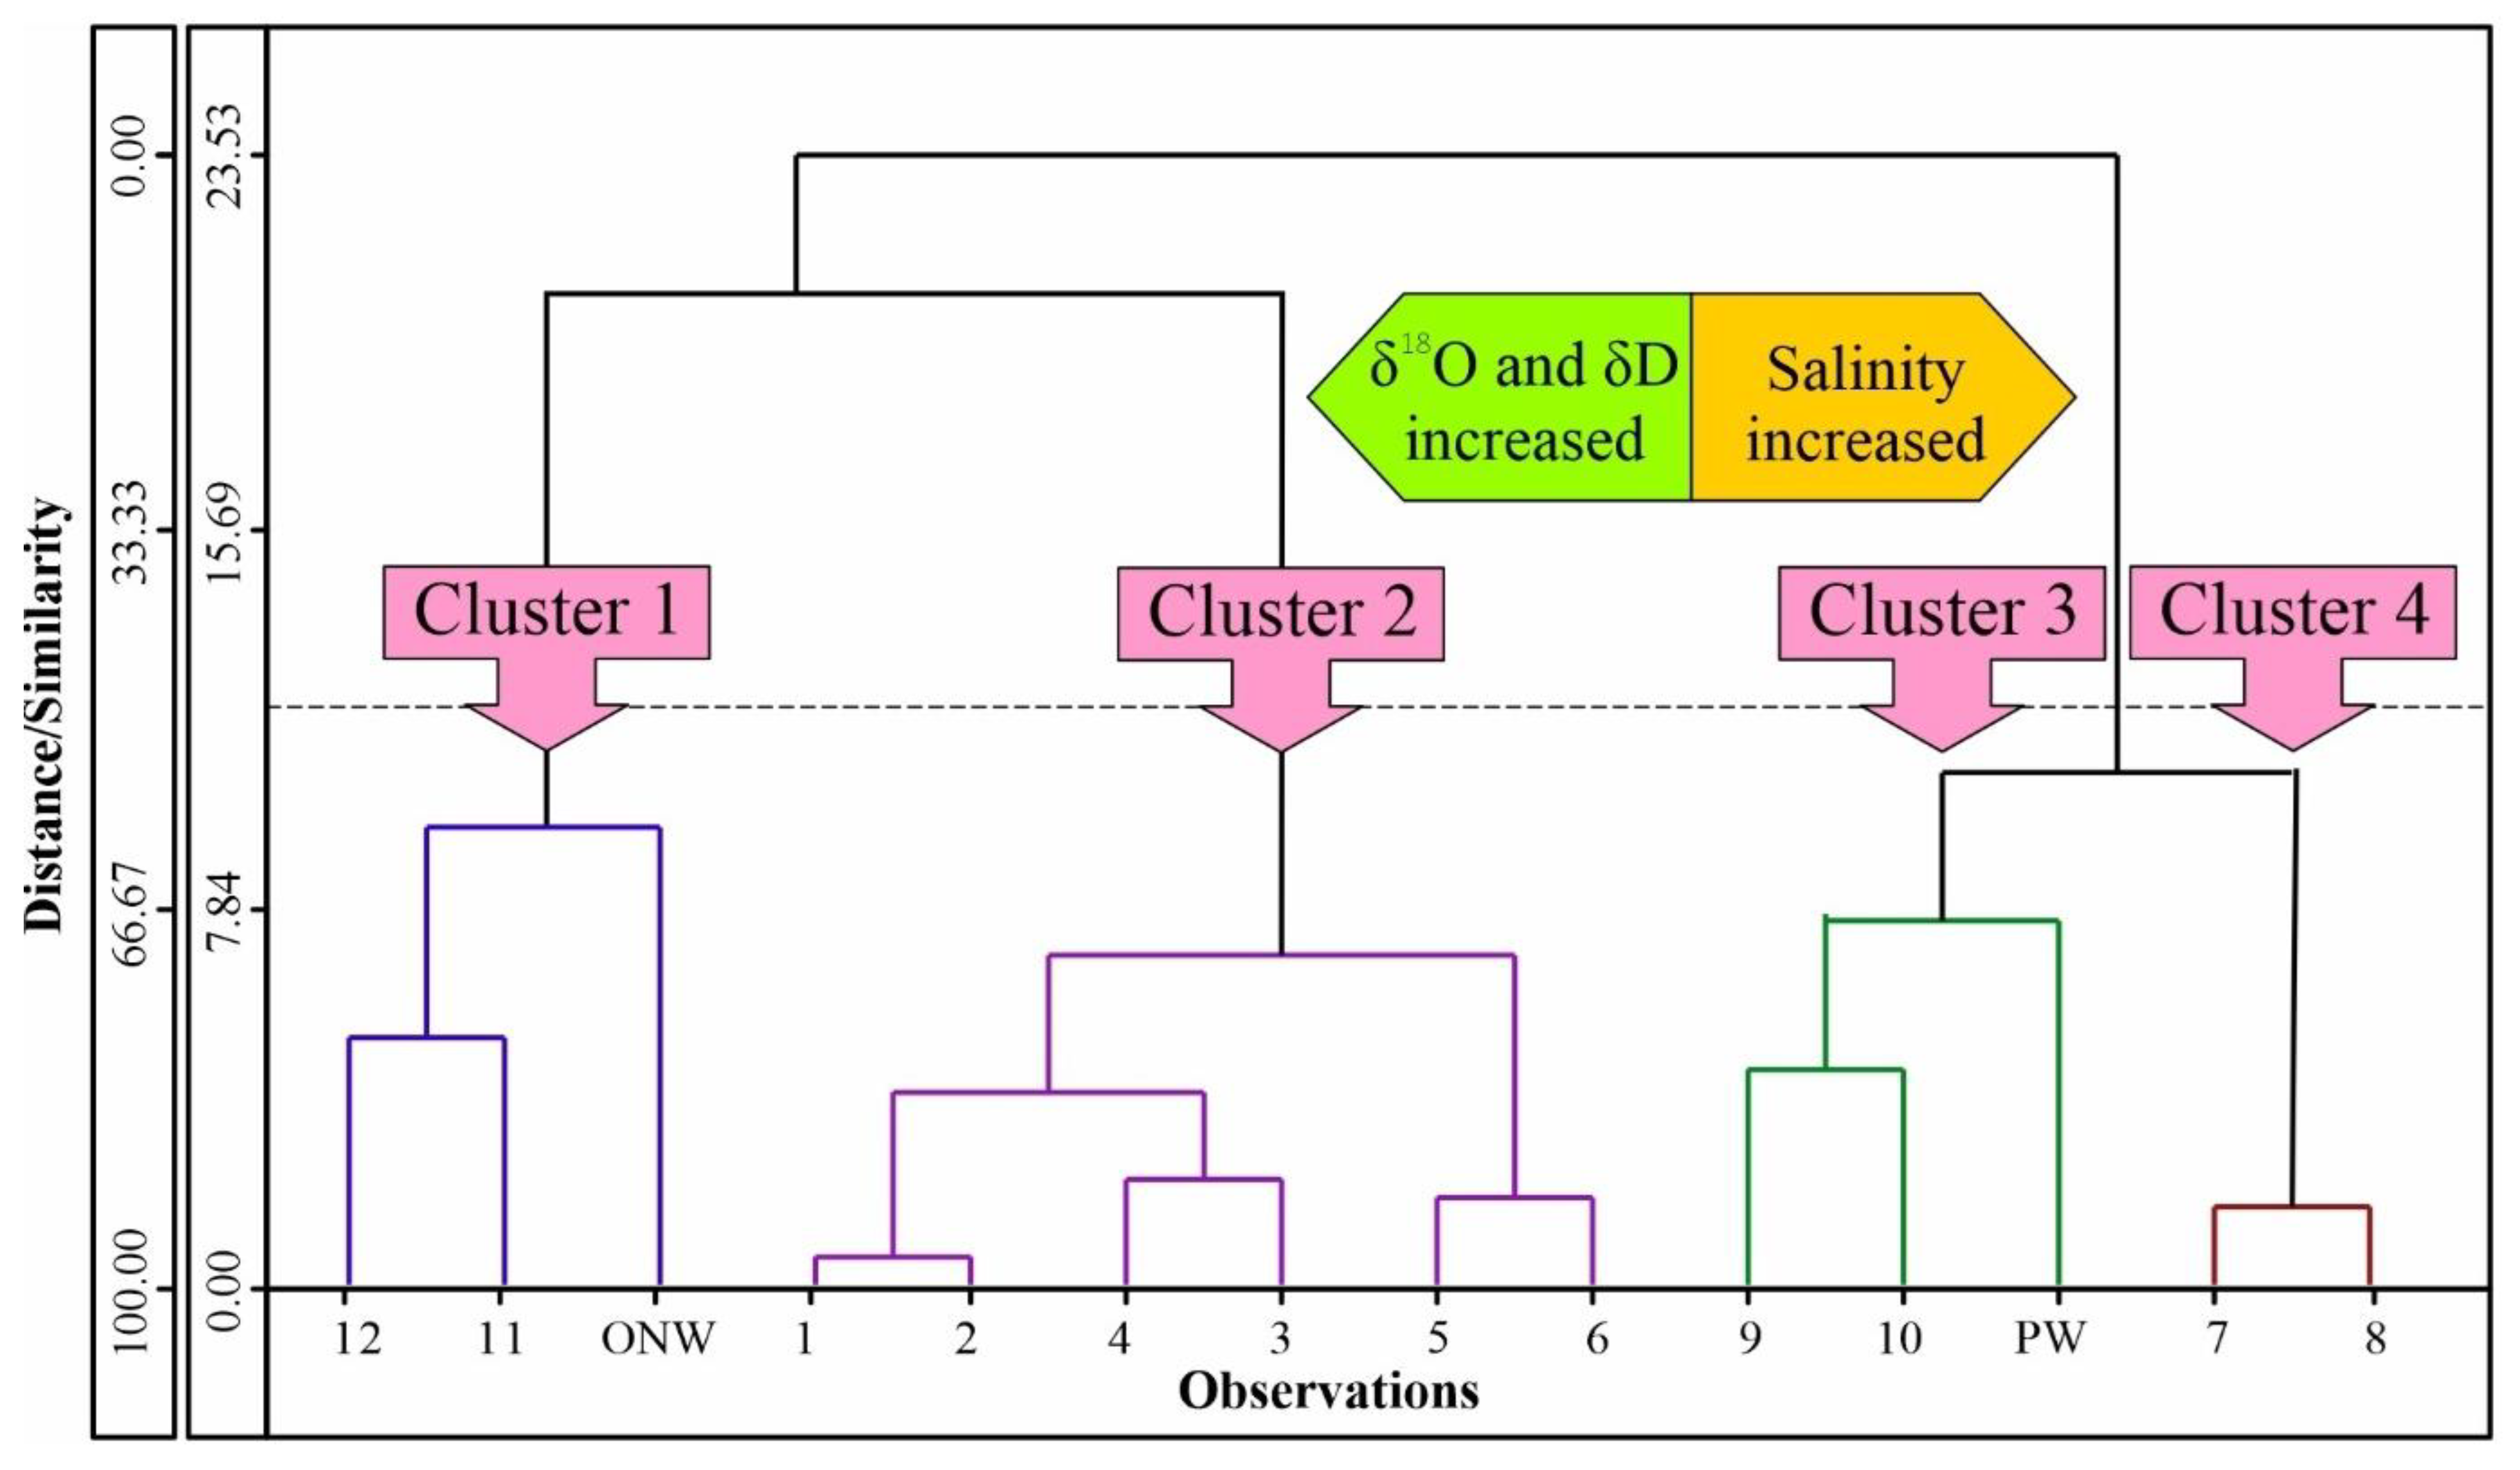
Q-Mode Hierarchical Cluster Analysis (Q-HCA)

The Q-HCA was carried out using the complete linkage method as the amalgamation rule and the Manhattan distance as the similarity measure on the standardized surface and Quaternary groundwater dataset (12 samples). Based on the dendrogram (Figure 11), four major clusters were identified. Table 2 summarizes the main hydrochemical and isotopic properties of four specific clusters of water samples examined in the study area (groundwater samples from the Quaternary aquifer, ONW and PW samples). Table 2 makes it clear that clusters 1 and 2, are hydrochemically and isotopically comparable with the ONW. The same could be said for clusters 3 and 4, which have similar hydrochemical properties and isotopic composition to paleowater.

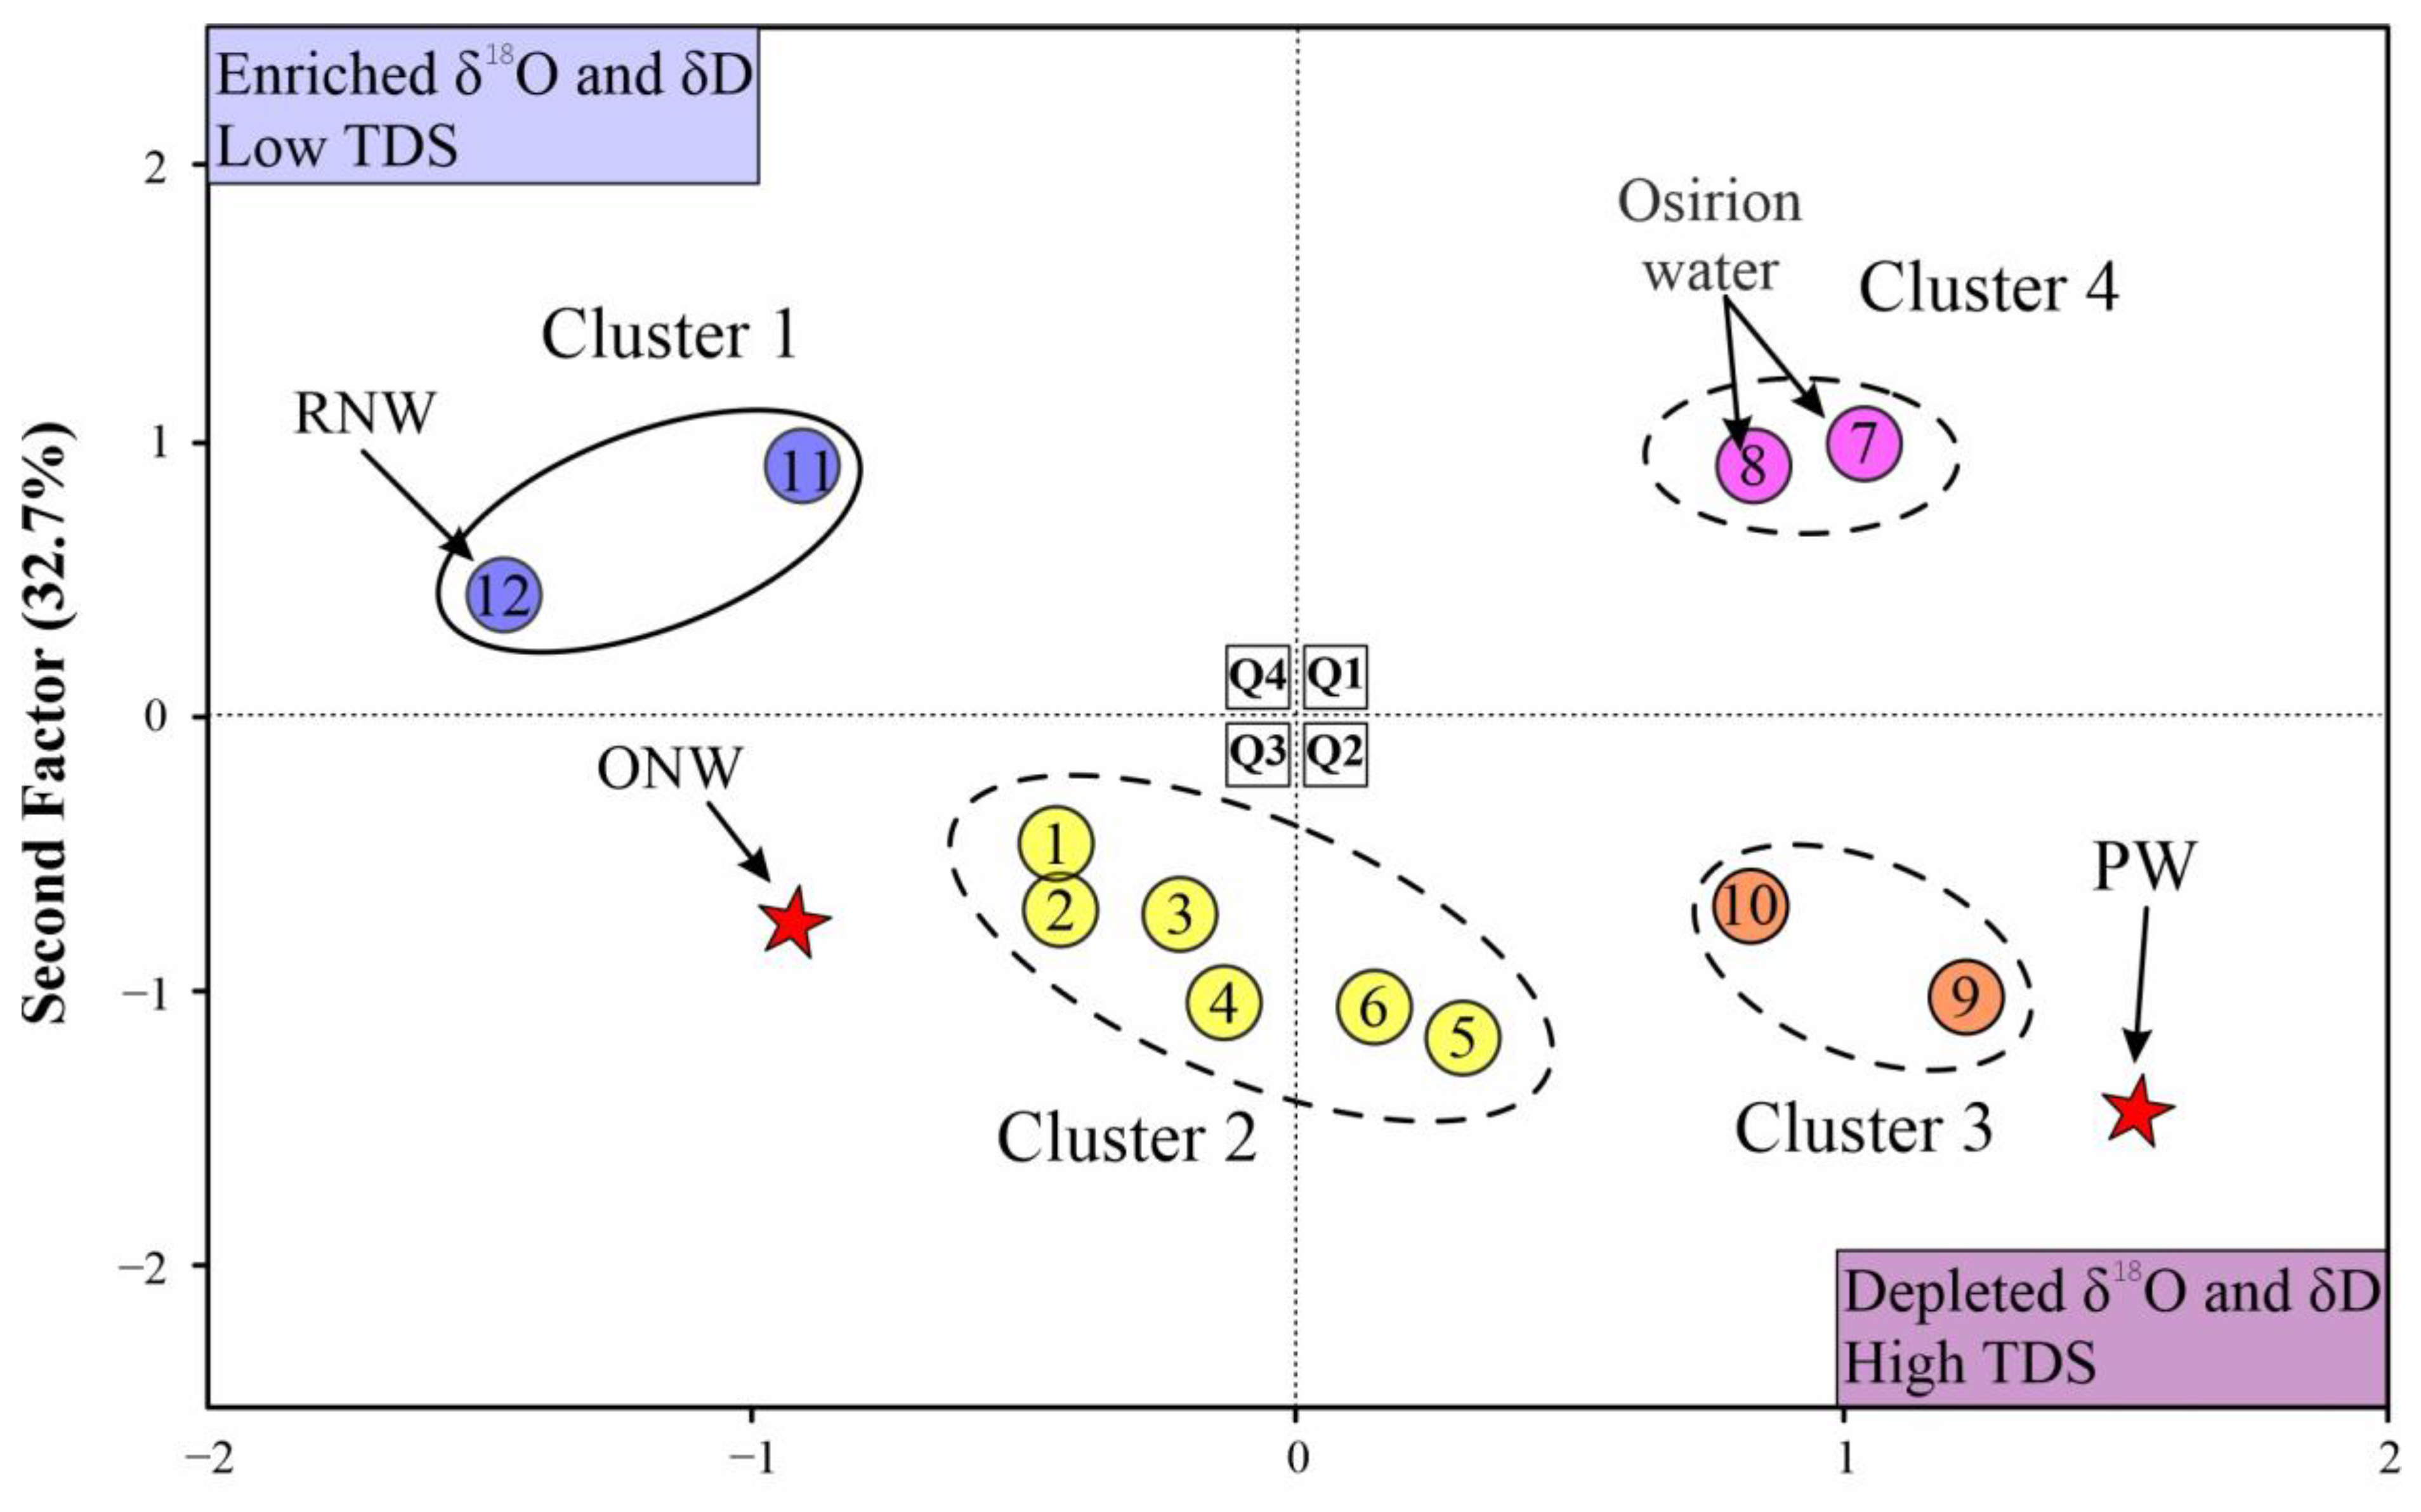
Q-Mode Factor Analysis (Q-FA)

In order to identify the variables that best represent the differences among the four clusters that were detected using HCA and to investigate the connections between the clusters in the groundwater of the Quaternary aquifer, Q-mode FA of the 12 water samples was employed. The first factor (F1) characterizes the largest proportion, i.e., 55.2% of the total variance within the dataset and is described as “salinity factor”. The second factor (F2) (i.e., “alkalinity factor” explains 32.7% of the total variance within the dataset. The loadings of these parameters for F1 and F2 plot extremely closely, indicating that the processes influencing these variables’ concentrations and variability in groundwater are similar [82].
Figure 12 shows reasonable statistical discrimination among four major clusters as well-defined by Q-HCA. These clusters occupy different zones in FA space. Samples of cluster 1 are plotted in quadrant 4, which represents the groundwater of the Quaternary aquifer beneath the old cultivated lands, as well as the surface waters of the Nile River and its channels branching from it. Groundwater samples represent the Western Desert fringes form clusters 2 and 3 along with reference values of the ONW and PW are distributed between quadrants 2 and 3. Osirion lake samples, which are assigned to cluster 4, are plotted in quadrant 1 and have high positive scores on both F1 and F2.
Figure 12 shows that, despite their close spatial distribution (Figure 8), water samples from the Western Desert fringes are distributed among three clusters (clusters 2, 3, and 4), reflecting chemical and isotopic differences. This indicates that there are different sources recharging the water type for each cluster in the study area with different mixing ratios. The second cluster consists of six dewatering wells drilled around the Osirion Lake which are located in quadrants 2 and 3. This cluster is plotted close to the ONW of Awad et al., [75] and accordingly, shows the significant contribution of ONW based on their stable isotope content. On the other hand, the proximity of clusters 3 and 4 to the highly depleted value of the PW makes it the most effective recharge source of both clusters coming from the deep Nubian Sandstone aquifer through the upward leakage from the deep faults. In addition, the proximity of cluster 3 to cluster 4 reinforces the idea that there is a contribution of ONW to the Osirion water (the fourth cluster).
The location of the plotted water clusters relative to the ONW and PW are shown in Figure 11 and Figure 12, giving information on the possible mixing and recharge sources of the water samples. This implied that the Quaternary aquifer’s groundwater in the western portion of the research region, i.e., clusters 2 and 3, and cluster 4 (Osirion lake), are hydraulically connected in different degrees with the PW according to the subsurface structure conditions of the aquifer, where the location of each sample reflects its relative degree of mixing.
Samples assigned to clusters 1 and 2 have lower TDS, and therefore, low F1 Scores (quadrants 3 and 4) in FA space together with the ONW. With respect to the F2 axis, most of cluster 2’s samples, and the ONW were plotted in quadrant 3, whereas cluster 1 was plotted in quadrant 4.
Samples from clusters 3 and some of cluster 2 are characterized by relatively higher EC values, reflecting their high positive F1 scores (quadrant 2). In addition, their highly depleted δ18O and δ2H values make them close to PW (quadrant 2) and in the δ18O-δ2H diagram. Accordingly, the groundwater from PW is an end-member for the groundwater of the Quaternary aquifer in the western desert fringes of the study region.
The expected over-exploitation of the groundwater in wells No. 9 and 10 might be the reason for the contribution of the paleowater from the Nubian Sandston (NSS) aquifer to cluster 3 samples and portend from the possible negative consequences of future uses of groundwater at these well fields.
Despite showing a chemical composition that is very comparable to that of cluster 3 samples, cluster 4 samples (Osirion water) are plotted to higher positive F2 scores (quadrant 1) in FA space and to the heavier δ18O in the δ18O-δ2H diagram, suggesting additional influence from distinct component (end-member) Salinization effects, particularly in cluster 4, are thought to be caused by mixing with PW.

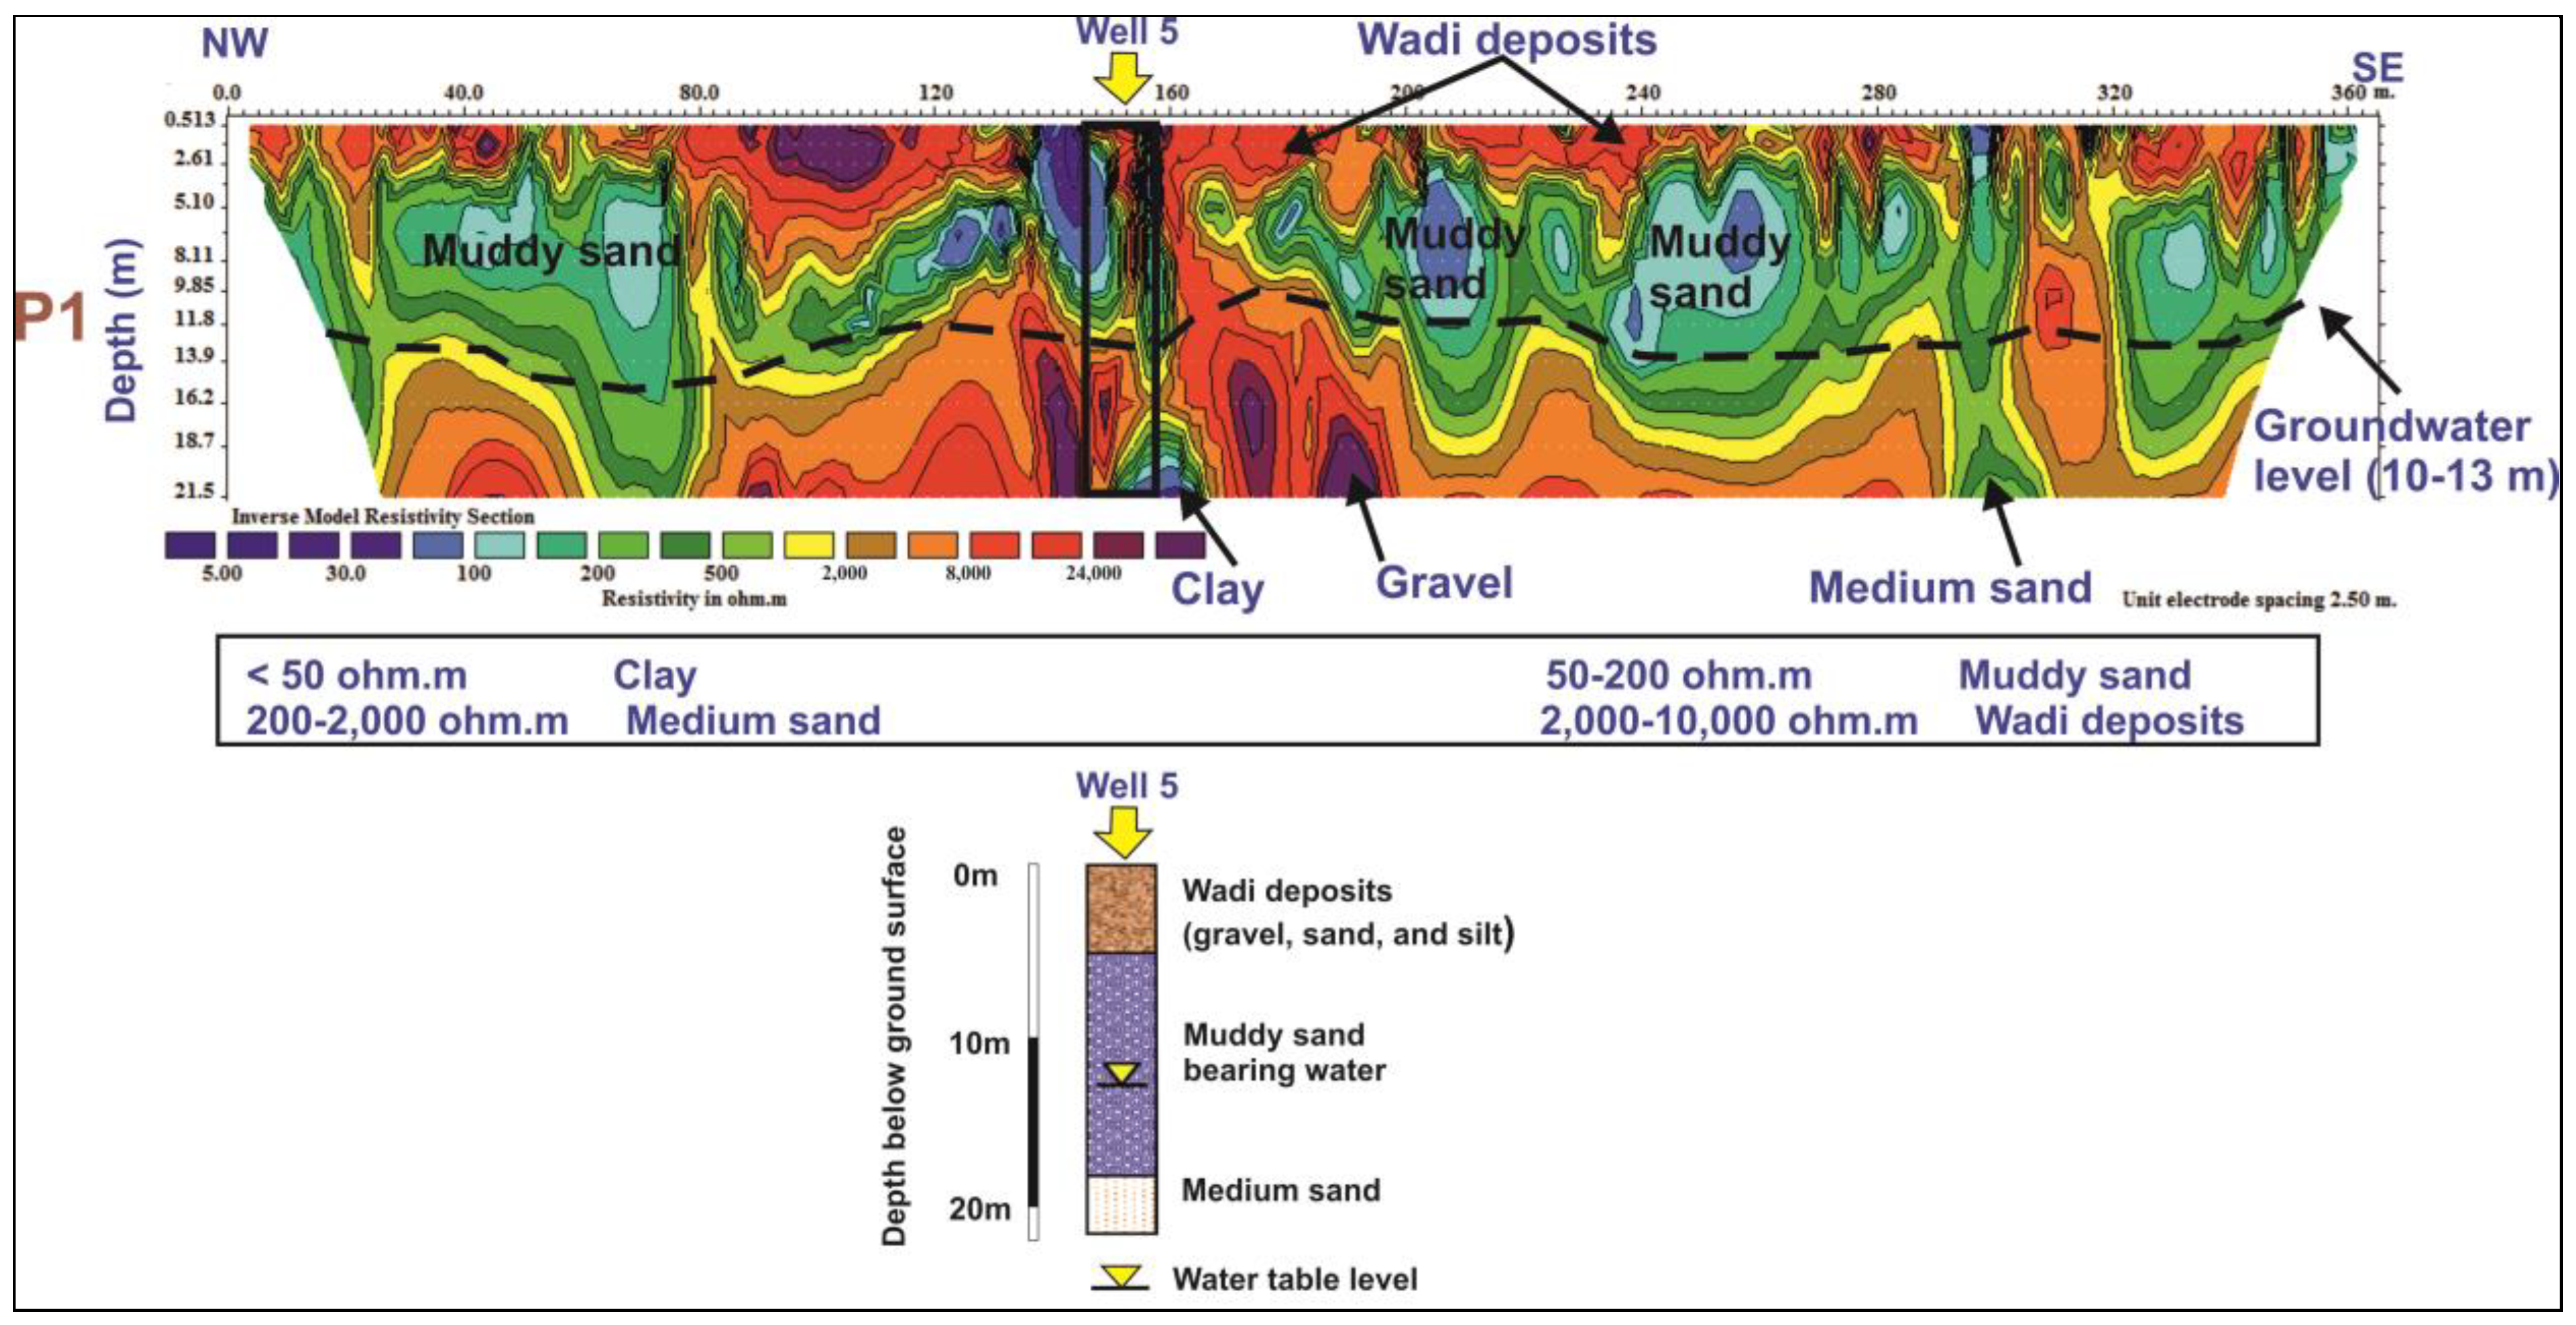
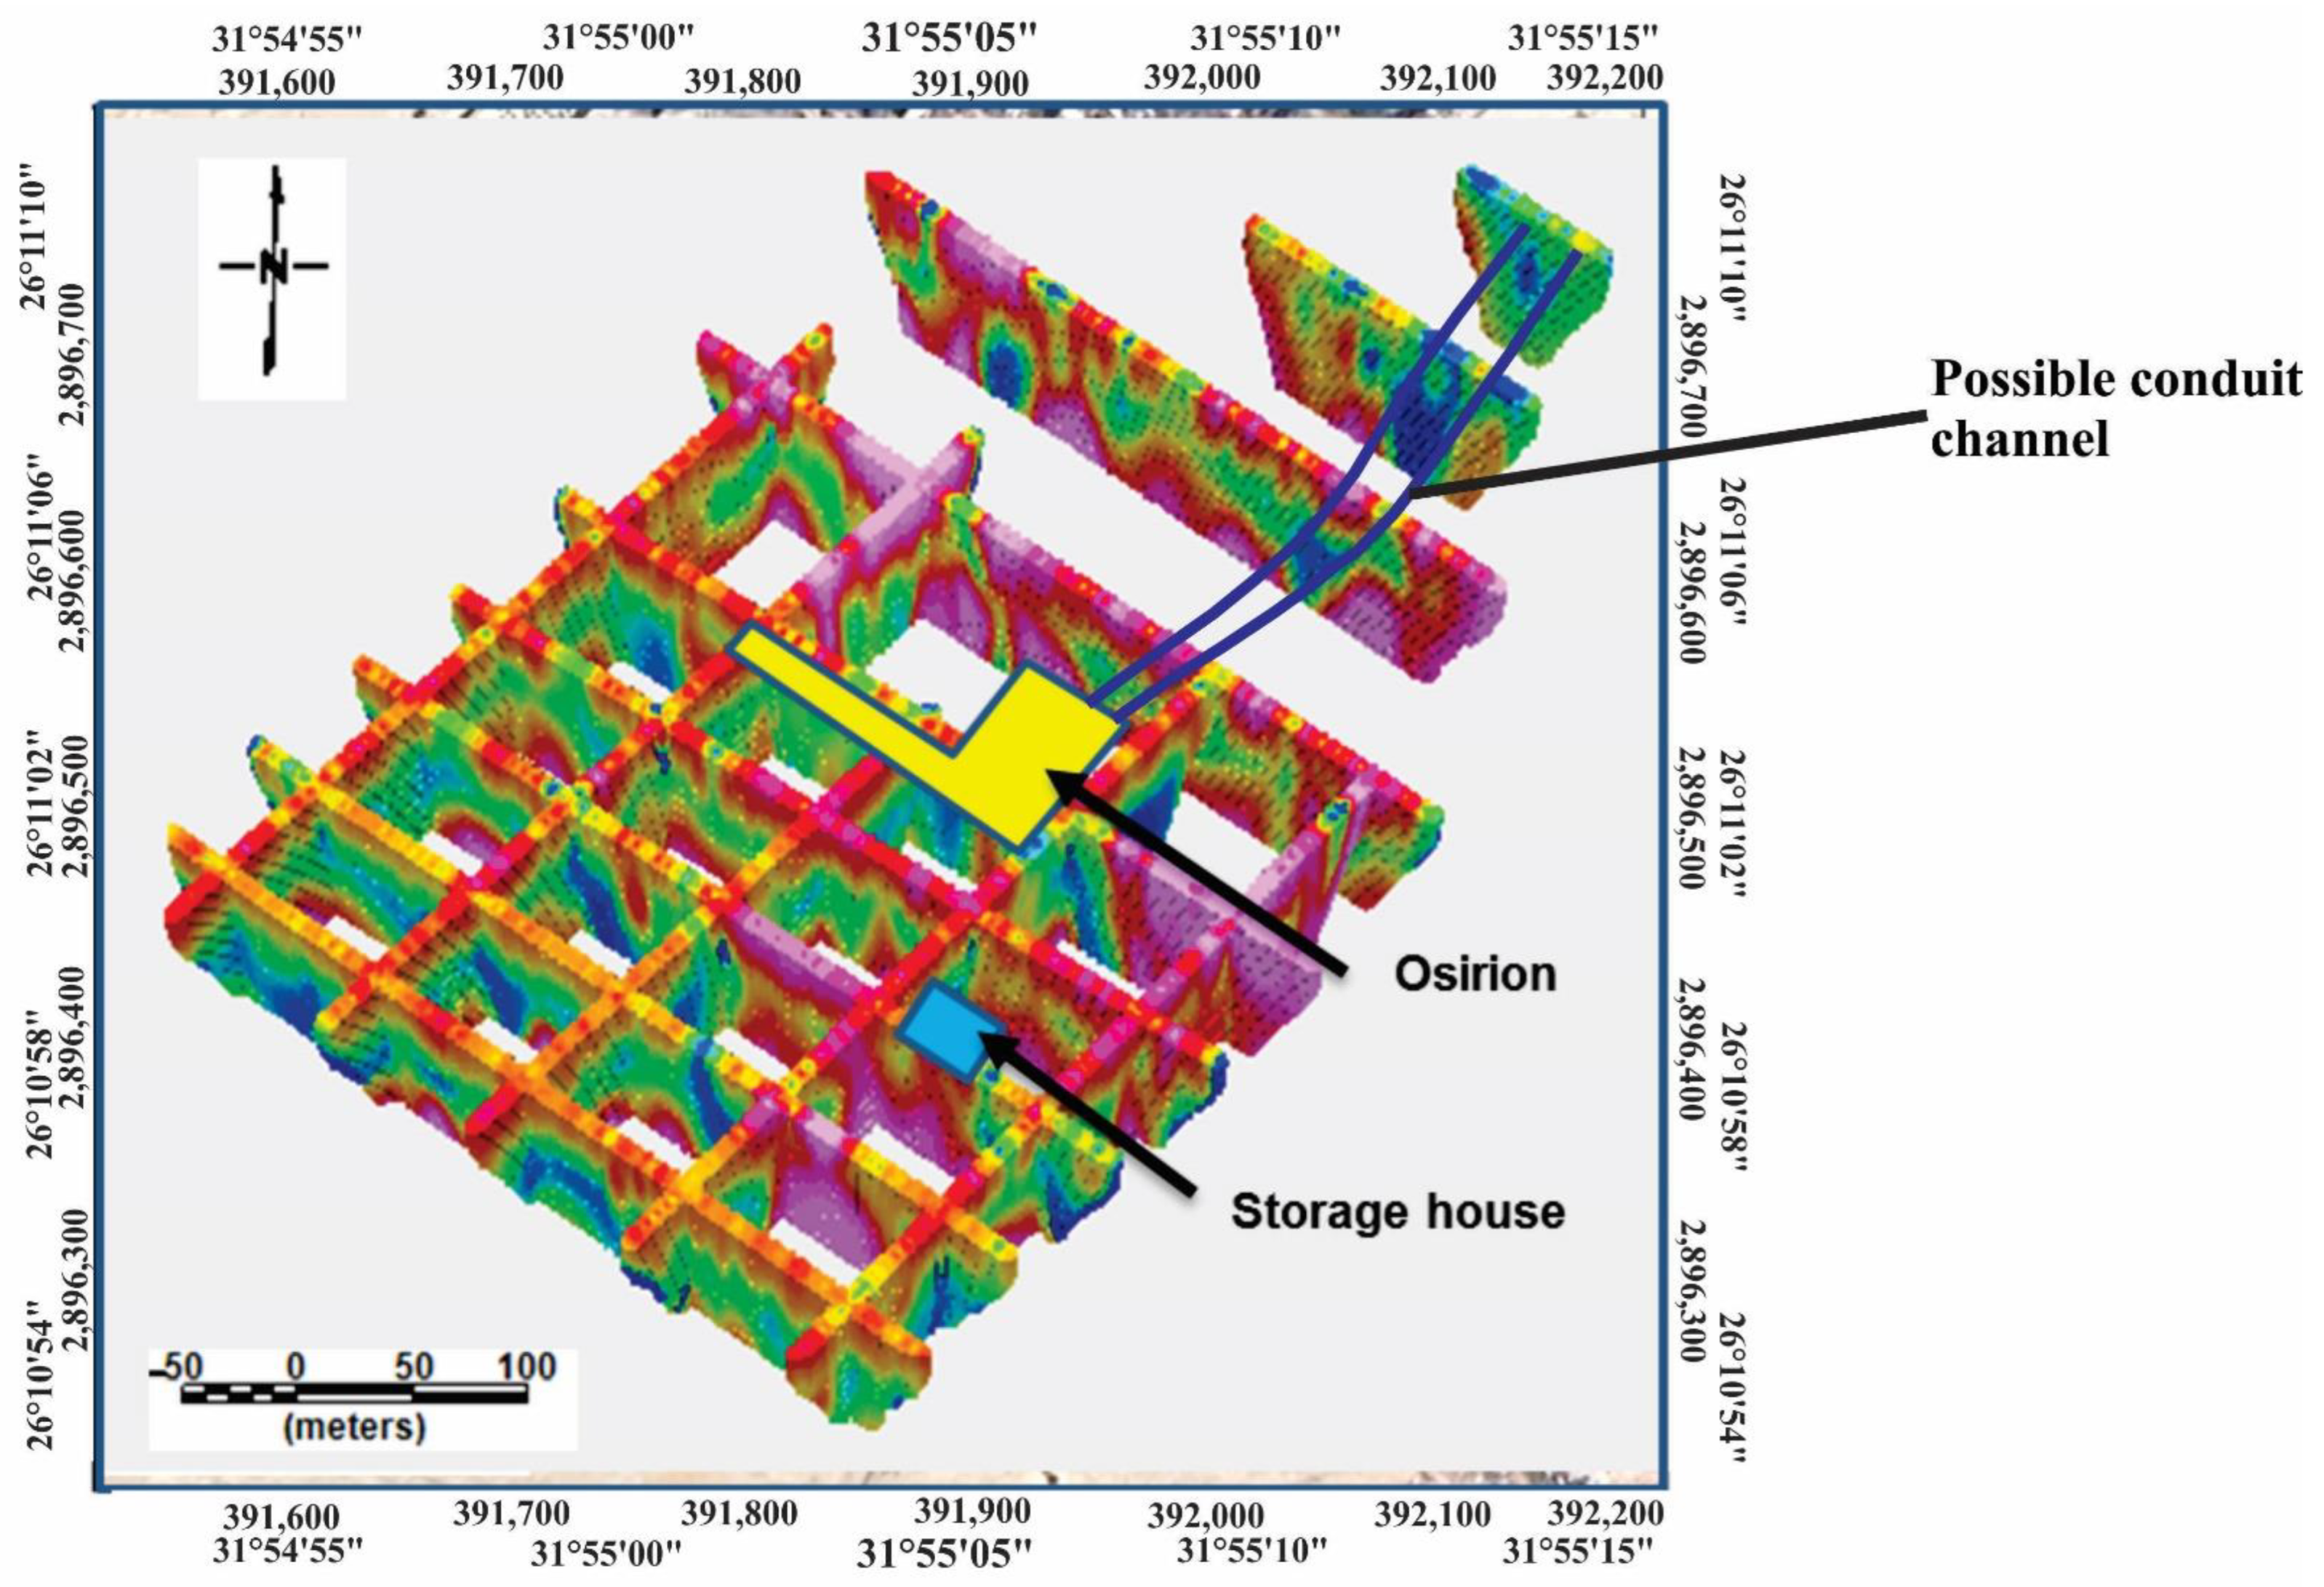
5.2. Electric Resistivity Tomography Interpretation

The lithology and the thickness of the subsurface sequence were estimated using 2D resistivity measurements, and the findings were validated utilizing data from accessible wells nearby the investigated profiles. The interpretation includes all the 2D ERT sections, for illustration, only one profile No. 1 includes a well location is used (Figure 13). Based on the predominant variations in resistivities, the results indicated that the subsurface lithology was divided into four geoelectric zones: very low (less than 50 ohm.m) resistivity zone, low (between 50 and 200 ohm.m) resistivity zone, moderate (between 200 and 2000 ohm.m) resistivity zone, and high (more than ohm.m) resistivity zone. The underlying lithology can be categorized into four different units attributable to these zones: (1) wadi deposits, which are predominantly composed of gravel, sand, and silt; (2) medium sand deposits; (3) muddy sand deposits; and (4) clay deposits. The third unit of muddy sands’ identity as a groundwater aquifer has been confirmed by surrounding wells. The study area’s water table level ranges from 5 m to 14 m, which is supported by all ERT profiles and the accessible borehole information [35].
The results of the inverted 2D ERT profiles, namely profiles 1 to 11 west of the Osirion site, were used to build a 3D VOXEL model using Geosoft Oasis Montaj software version 8.3, excluding the other profiles (P12–P14). Figure 14 exhibits a three-dimensional representation of the water-bearing muddy sand formation in the survey area. It highlights the position of a conduit channel, particularly in profiles 12, 13, and 14. These profiles comprise an expected paleochannel that could be construed as a water conduit pathway to the Osirion building flowing from the northeastern side of the Nile River. This paleochannel is the main reason which is responsible for connecting the groundwater to the Osirion site. Additionally, these findings are consistent with the opinion of some authors [50,52]. Previous archaeological studies conducted at the Osirion site, such as those by Damarant [53], where there are ancient archaeological depictions and writings on the walls of the temple, refer to this discovery. The direction of this channel has been found by our findings in the current investigation.

6. Summary and Conclusions

Unfortunately, many of the previous works did not include a comprehensive understanding of the water-flow process in Osirion floors. However, the integration of near-surface geophysical techniques and isotopic geochemistry addressed this issue and helped the identification of the groundwater recharge sites. The purpose of the isotopic study in this work is to identify groundwater sources in Osirion. For this reason, water samples including Osirion water, groundwater, and surface water were analyzed for stable hydrogen and oxygen isotope compositions (i.e., δ18O and δ2H). Isotopic values of Osirion waters which are between −0.31 and −0.42‰, and 5.06 and 2.69‰ for δ18O and δ2H, respectively, alongside multivariate data analysis, support previous opinions that Recent Nile Water is one of the major recharge sources of Osirion water. The purpose of the geophysical approach is to identify the location and the direction of the paleochannel which connects the groundwater from its source to the Osirion site. The authors concluded that the natural flow or seepage from the Nile River to the floor of the temple is not possible nowadays, and that there must be an unnatural waterway linking the Nile River and the Osirion. The findings deduced from conducting fourteen ERT profiles in the study site have proven that there is an artificial paleochannel connecting the Nile River and the Osirion site. It is very probable that this artificial paleochannel and its sediments are isolated from the prevailing hydrological conditions in the Quaternary aquifer by impermeable flood sediments of clay and/or silt.
This study is expected to help stakeholders develop a new conceptual model defining water management policies for the area of interest. In order to establish a sound conceptual model, future research should include an analysis of radioactive isotopes and hydrogeochemical data.

Author Contributions

Conceptualization, A.M.A. and G.Z.A.A.; methodology, N.F.A., M.H.A. and M.A.M.; software, N.F.A., M.H.A. and M.A.M.; validation, A.M.A., G.Z.A.A. and M.A.M.; formal analysis, M.A.M.; investigation, M.H.A. and M.A.M.; data curation, A.M.A.; writing—original draft preparation, N.F.A., M.H.A. and M.A.M.; writing—review and editing, A.M.A. and G.Z.A.A.; visualization, M.H.A. and M.A.M. All authors have read and agreed to the published version of the manuscript.

Funding

This research was funded by the Science, Technology, and Innovation Funding Authority (STIFA) of Egypt, grant number 37087.

Data Availability Statement

The data is available upon request from the authors.

Acknowledgments

The funding for this project was granted by the Science, Technology, and Innovation Funding Authority (STIFA) of Egypt (Grant No. 37087), for which the authors are grateful.

Conflicts of Interest

The authors declare no conflict of interest.

References

  1. Abdelrahiem, M. Chapter 144 of the book of the dead from the temple of Ramesses II at Abydos. Stud. Zur Altägyptischen Kult. 2006, 34, 1–16. [Google Scholar]
  2. Lucchetti, C. Valutazione Dell’influenza di Cavità Sotterranee e Campi di Fratturazione Sulle Concentrazioni di Radon e Thoron Nel Suolo in Aree Idrotermali e Perivulcaniche Della Regione Lazio. Ph.D. Thesis, Universitàdeglistudi Roma Tre, Rome, Italy, 2014. [Google Scholar]
  3. Linderholm, J. Soil chemical surveying: A path to a deeper understanding of prehistoric sites and societies in Sweden. Geoarchaeology Int. J. 2007, 22, 417–438. [Google Scholar] [CrossRef]
  4. Haslam, R.; Tibbett, M. Sampling and analyzing metals in soils for archaeological prospection: A critique. Geoarchaeology Int. J. 2004, 19, 731–751. [Google Scholar] [CrossRef]
  5. Masoud, A.M.; El-Magd, S.A.A. Integration of hydrochemical and isotopic characteristics for identifying groundwater recharge sources of the Eocene carbonate aquifer, Western Desert, Egypt. J. Afr. Earth Sci. 2022, 187, 104449. [Google Scholar] [CrossRef]
  6. Stantis, C.; Kharobi, A.; Maaranen, N.; Nowell, G.M.; Bietak, M.; Prell, S.; Schutkowski, H. Who were the Hyksos? Challenging traditional narratives using strontium isotope (87sr/86sr) analysis of human remains from ancient Egypt. PLoS ONE 2020, 15, e0235414. [Google Scholar] [CrossRef]
  7. Abu El-Magd, S. Groundwater Management Surrounding Abydos Archeological Site Using Numerical Simulation Model. Ph.D. Thesis, Sohag University, Sohag, Egypt, 2016. [Google Scholar]
  8. Parizek, A.; Abdel Moneim, A.; Fantle, M.; Westerman, J.; Issawi, B. Isotopic data: Implications for the source (s) of Osireion groundwater, Abydos, Egypt. Egypt J. Archaeol. Restor. Stud. 2011, 1, 61–72. [Google Scholar]
  9. Abudeif, A.; Mohammed, M.; Fat-Helbary, R.; El-Khashab, H.; Masoud, M. Integration of 2D geoelectrical resistivity imaging and boreholes as rapid tools for geotechnical characterization of construction sites: A case study of new Akhmim city, Sohag, Egypt. J. Afr. Earth Sci. 2020, 163, 103734. [Google Scholar] [CrossRef]
  10. Reynolds, J.M. An Introduction to Applied and Environmental Geophysics; Wiley-Blackwell: Chichester, UK, 2011. [Google Scholar]
  11. Abudeif, A.; AbdelAal, G.; Mohammed, M.; Gaber, H.; Abbas, S. Application of electrical resistivity tomography (ERT) for engineering characterization of the area surrounding the Osirion at Abydos archeological site, Sohag, Upper Egypt. In Proceedings of the Fifth International Conference on New Horizons in Basic and Applied Sciences, Hurghada, Egypt, 26–29 September 2021. [Google Scholar]
  12. Mohammed, M.; Ali, M.; Abudeif, A.; Abdel Aal, G. Geochemical and electrical resistivity characters of the sediments irrigated with sewage water at Sohag governorate, Upper Egypt. In Proceedings of the 13th International Geological Conference, Jeddah, Saudi Arabia, 3–5 March 2020. [Google Scholar]
  13. Vásconez-Maza, M.D.; Martínez-Segura, M.A.; Bueso, M.C.; Faz, Á.; García-Nieto, M.C.; Gabarrón, M.; Acosta, J.A. Predicting spatial distribution of heavy metals in an abandoned phosphogypsum pond combining geochemistry, electrical resistivity tomography and statistical methods. J. Hazard. Mater. 2019, 374, 392–400. [Google Scholar] [CrossRef]
  14. Mohammed, M.A.; Abudeif, A.M. Geoelectrical characterization of the Al-Kawamil new settlement, Sohag, Egypt. J. Environ. Eng. Geophys. 2019, 24, 327–332. [Google Scholar] [CrossRef]
  15. Mohammed, M.; Senosy, M.; Abudeif, A. Derivation of empirical relationships between geotechnical parameters and resistivity using electrical resistivity tomography (ERT) and borehole data at Sohag University site, Upper Egypt. J. Afr. Earth Sci. 2019, 158, 103563. [Google Scholar] [CrossRef]
  16. Rosales, R.M.; Martinez-Pagan, P.; Faz, A.; Bech, J. Study of subsoil in former petrol stations in se of Spain: Physicochemical characterization and hydrocarbon contamination assessment. J. Geochem. Explor. 2014, 147, 306–320. [Google Scholar] [CrossRef]
  17. Rosales, R.M.; Martínez-Pagan, P.; Faz, A.; Moreno-Cornejo, J. Environmental monitoring using electrical resistivity tomography (ERT) in the subsoil of three former petrol stations in se of Spain. Water Air Soil Pollut. 2012, 223, 3757–3773. [Google Scholar] [CrossRef]
  18. Martín-Crespo, T.; Gómez-Ortiz, D.; Martínez-Pagán, P.; De Ignacio-San José, C.; Martín-Velázquez, S.; Lillo, J.; Faz, A. Geoenvironmental characterization of riverbeds affected by mine tailings in the Mazarrón district (Spain). J. Geochem. Explor. 2012, 119, 6–16. [Google Scholar] [CrossRef]
  19. Rucker, D.; Loke, M.; Levitt, M.; Noonan, G. Electrical-resistivity characterization of an industrial site using long electrodes. Geophysics 2010, 75, 95–104. [Google Scholar] [CrossRef]
  20. Chekirbane, A.; Gasmi, O.; Mlayah, A.; Gabtni, H.; Khadhar, S.; Lachaal, F.; Zghibi, A.; Taupin, J.-D. Anthropogenic aquifer recharge effect on groundwater resources in an agricultural floodplain in northeastern Tunisia: Insights from geochemical tracers and geophysical methods. Nat. Resour. Res. 2022, 31, 315–334. [Google Scholar] [CrossRef]
  21. Eissa, M.A. Application of multi-isotopes and geochemical modeling for delineating recharge and salinization sources in Dahab basin aquifers (South Sinai, Egypt). Hydrology 2018, 5, 41. [Google Scholar] [CrossRef]
  22. Eissa, M.A.; Mahmoud, H.H.; Shouakar-Stash, O.; El-Shiekh, A.; Parker, B. Geophysical and geochemical studies to delineate seawater intrusion in Bagoush area, Northwestern Coast, Egypt. J. Afr. Earth Sci. 2016, 121, 365–381. [Google Scholar] [CrossRef]
  23. Atwia, M.; Masoud, A. Hydrochemical and geoelectrical investigation of the coastal shallow aquifers in El-Omayed area, Egypt. Environ. Monit. Assess. 2013, 185, 7065–7080. [Google Scholar] [CrossRef]
  24. Storz, H.; Storz, W.; Jacobs, F. Electrical resistivity tomography to investigate geological structures of the earth’s upper crust. Geophys. Prospect. 2000, 48, 455–472. [Google Scholar] [CrossRef]
  25. Gabarrón, M.; Martínez-Pagán, P.; Martínez-Segura, M.A.; Bueso, M.C.; Martínez-Martínez, S.; Faz, Á.; Acosta, J.A. Electrical resistivity tomography as a support tool for physicochemical properties assessment of near-surface waste materials in a mining tailing pond (El Gorguel, se Spain). Minerals 2020, 10, 559. [Google Scholar] [CrossRef]
  26. Chabaane, A.; Redhaounia, B.; Gabtni, H. Combined application of vertical electrical sounding and 2D electrical resistivity imaging for geothermal groundwater characterization: Hammam Sayala hot spring case study (NW Tunisia). J. Afr. Earth Sci. 2017, 134, 292–298. [Google Scholar] [CrossRef]
  27. McInnis, D.; Silliman, S.; Boukari, M.; Yalo, N.; Orou-Pete, S.; Fertenbaugh, C.; Sarre, K.; Fayomi, H. Combined application of electrical resistivity and shallow groundwater sampling to assess salinity in a shallow coastal aquifer in Benin, west Africa. J. Hydrol. 2013, 505, 335–345. [Google Scholar] [CrossRef]
  28. Bauer, P.; Supper, R.; Zimmermann, S.; Kinzelbach, W. Geoelectrical imaging of groundwater salinization in the Okavango Delta, Botswana. J. Appl. Geophys. 2006, 60, 126–141. [Google Scholar] [CrossRef]
  29. Legault, J.M.; Carriere, D.; Petrie, L. Synthetic model testing and distributed acquisition dc resistivity results over an unconformity uranium target from the Athabasca basin, Northern Saskatchewan. Lead. Edge 2008, 27, 46–51. [Google Scholar] [CrossRef]
  30. Bauman, P. 2-D resistivity surveying for hydrocarbons—A primer. CSEG Rec. 2005, 30, 25–33. [Google Scholar]
  31. White, R.; Collins, S.; Denne, R.; Hee, R.; Brown, P. A new survey design for 3D IP inversion modelling at copper hill. Explor. Geophys. 2001, 32, 152–155. [Google Scholar] [CrossRef]
  32. Mahmoud, H.H.; Barseem, M.S.M.; Youssef, A.M.A. Application of the two dimensional geoelectric imaging technique to explore shallow groundwater in wadi el gerafi basin, eastern Central Sinai–Egypt. Arab. J. Geosci. 2015, 8, 3589–3601. [Google Scholar] [CrossRef]
  33. Van Dam, R.L.; Eustice, B.P.; Hyndman, D.W.; Wood, W.W.; Simmons, C.T. Electrical imaging and fluid modeling of convective fingering in a shallow water-table aquifer. Water Resour. Res. 2014, 50, 954–968. [Google Scholar] [CrossRef]
  34. Satriani, A.; Loperte, A.; Proto, M. Electrical resistivity tomography for coastal salt water intrusion characterization along the Ionian coast of Basilicata region (southern Italy). Int. Water Technol. J. 2011, 1, 83–90. [Google Scholar]
  35. Abudeif, A.M.; Abdel Aal, G.Z.; Masoud, A.M.; Mohammed, M.A. Detection of groundwater pathways to monitor their level rise in Osirion at Abydos archaeological site for reducing deterioration hazards, Sohag, Egypt using electrical resistivity tomography technique. Appl. Sci. 2022, 12, 10417. [Google Scholar] [CrossRef]
  36. Cardarelli, E.; De Donno, G.; Scatigno, C.; Oliveti, I.; Martinez, M.P.; Prieto-Taboada, N. Geophysical and geochemical techniques to assess the origin of rising Damp of a Roman building (Ostia Antica archaeological site). Microchem. J. 2016, 129, 49–57. [Google Scholar] [CrossRef]
  37. Simyrdanis, K.; Papadopoulos, N.; Kim, J.H.; Tsourlos, P.; Moffat, I. Archaeological investigations in the shallow seawater environment with electrical resistivity tomography. Near Surf. Geophys. 2015, 13, 601–611. [Google Scholar] [CrossRef]
  38. Goodman, D.; Piro, S. GPR Remote Sensing in Archaeology; Springer: Berlin/Heidelberg, Germany, 2013; Volume 9. [Google Scholar]
  39. Cardarelli, E.; Di Filippo, G. Integrated geophysical methods for the characterization of an archaeological site (Massenzio Basilica—Roman Forum, Rome, Italy). J. Appl. Geophys. 2009, 68, 508–521. [Google Scholar] [CrossRef]
  40. Gaffney, C. Detecting trends in the prediction of the buried past: A review of geophysical techniques in archaeology. Archaeometry 2008, 50, 313–336. [Google Scholar] [CrossRef]
  41. Cardarelli, E.; Godio, A.; Morelli, G.; Sambuelli, L.; Santarato, G.; Socco, L. Integrated geophysical surveys to investigate the scarsella vault of st. John’s baptistery in Florence. Lead. Edge 2002, 21, 467–470. [Google Scholar] [CrossRef]
  42. Maierhofer, C.; Leipold, S. Radar investigation of masonry structures. NDT E Int. 2001, 34, 139–147. [Google Scholar] [CrossRef]
  43. Flint, R.; Jackson, P.; McCann, D. Geophysical imaging inside masonry structures. NDT E Int. 1999, 32, 469–479. [Google Scholar] [CrossRef]
  44. Sass, O.; Viles, H. Wetting and drying of masonry walls: 2D-resistivity monitoring of driving rain experiments on historic stonework in Oxford, UK. J. Appl. Geophys. 2010, 70, 72–83. [Google Scholar] [CrossRef]
  45. Mol, L.; Preston, P. The writing’s in the wall: A review of new preliminary applications of electrical resistivity tomography within archaeology. Archaeometry 2010, 52, 1079–1095. [Google Scholar] [CrossRef]
  46. Sass, O. Rock moisture measurements: Techniques, results, and implications for weathering. Earth Surface Processes and Landforms. J. Br. Geomorphol. Res. Group 2005, 30, 359–374. [Google Scholar]
  47. Mariette, A. Abydos: Description Des Fouilles Exécutées sur L’emplacement de Cette Ville. Temple de Séti (Supplément), Temple de Ramsès, Temple D’osiris, Petit Temple de L’ouest, Nécropole. Tome deuxième. The New York Public Library Digital Collections 1869–1880. Available online: https://digitalcollections.Nypl.Org/items/510d47e2-93e0-a3d9-e040-e00a18064a99 (accessed on 24 June 2021).
  48. Budge, E.A.W. Osiris and the Egyptian Resurrection: Illustrated after Drawings from Egyptian Papyri and Monuments; Philip Lee Warner: London, UK, 1911; Volume 2. [Google Scholar]
  49. Naville, E. Abydos. J. Egypt. Archaeol. 1914, 1, 2–8. [Google Scholar] [CrossRef]
  50. Rostem Osman, R. The Scheme Planned by the Late Abdel Salam Mohamed Husein for the Protection of the Monuments of Seti I at Abydos; An Appreciation; Imprimerie de l’Institut Français d’Archéologie Orientale; Annales du Service Des Antiquities de l’Egypt (ASAE): Le Caire, Egypt, 1950; pp. 65–71. [Google Scholar]
  51. David, A.R.; David, A.R. A Guide to Religious Ritual at Abydos; Aris and Phillips Ltd.: Warminster, UK, 1981; p. 182. [Google Scholar]
  52. Abdel-Hafez, T.M.M. Geophysical and Geotechnical Studies in Pharaonic and Urban Egypt; University of Bern: Bern, Switzerland, 2004. [Google Scholar]
  53. Damarant, A.; Abd el-Raziq, Y.; Okasha, A.; Wegner, J.; Cahail, K.; Wegner, J. A new temple: The Mahat of Nebhepetre at Abydos. Egypt. Archaeol. 2015, 46, 3–7. [Google Scholar]
  54. Omer, A. Geological, Mineralogical and Geochemical Studies on the Neogene and Quaternary Nile Basin Deposits, Qena-Assiut Stretch. Ph.D. Thesis, South Valley University, Sohag, Egypt, 1996. [Google Scholar]
  55. Mahran, T. Sedimentology of upper Pliocene–Pleistocene sediments of the Nile valley area: A model around Aulad Toq Sharq Environs, se of Sohag, Egypt. Bull. Fac. Sci. Assiut Univ. Egypt 1993, 22, 1–25. [Google Scholar]
  56. Issawi, B.; McCauley, J. The Cenozoic Rivers of Egypt: The Nile Problem. In The Followers of Horus: Studies in Memory of MA Hoffman: Egyptian Studies Association Publication; Friedman, R., Adams, B., Eds.; Oxbow Books: Oxford, England, 1992. [Google Scholar]
  57. RIGW; IWACO. Second Interim Report; Annex c, Recharge of Groundwater in Reclaimed Desert Area in the Eastern Nile Delta, Egypt. Internal Report No. 71; Research Institute for Groundwater, National Water Research Center: El Kanater El Khairia, Egypt, 1986. [Google Scholar]
  58. Abdel Moneim, A. Groundwater studies in and around Abydos temples, upper Egypt. Jour. Geol. Surv. Egypt 1999, 22, 357–368. [Google Scholar]
  59. Conoco, C. Geological Map of Egypt, Scale 1: 500,000-nf 36 Ne-Bernice, Egypt; The Egyptian General Petroleum Corporation: Cairo, Egypt, 1987. [Google Scholar]
  60. Brooks, J.E.; Issawi, B. Groundwater in the Abydos Areas, Egypt; the Flooding of the Osireion; Water Paper, Egyptian Journal of Archaeological and Restoration Studies “EJARS”: Cairo, Egypt; Volume 5–7, 1992. [Google Scholar]
  61. Abdel Moneim, A. Numerical Simulation and Groundwater Management of the Sohag Aquifer, the Nile Valley, Egypt. Ph.D. Thesis, Civil Eng. Department, University of Strathclyde, Glasgow, Scotland, 1992. [Google Scholar]
  62. Abdel Moneim, A. Hydrogeology of the Nile Valley at Sohag Province. Master’s Thesis, Faculty of Science, Sohag, Assiut University, Asyut, Egypt, 1988; 150 p. [Google Scholar]
  63. Mostafa, H. Geology of the Area Northeast of Sohag. Master’s Thesis, Assiut University, Asyut, Egypt, 1979. [Google Scholar]
  64. International Atomic Energy Agency (IAEA). Isotope Hydrology (Vienna, 12–16 September. 1983); Proceedings Series; International Atomic Energy Agency (IAEA): Vienna, Austria, 1983. [Google Scholar]
  65. Horita, J.; Ueda, A.; Mizukami, K.; Takatori, I. Automatic δd and δ18o analyses of multi-water samples using H2-and CO2-water equilibration methods with a common equilibration set-up. Int. J. Radiat. Appl. Instrumentation. Part A Appl. Radiat. Isot. 1989, 40, 801–805. [Google Scholar] [CrossRef]
  66. Ohsumi, T.; Fujino, H. Isotope exchange technique for preparation of hydrogen gas in mass spectrometric D/H analysis of natural waters. Anal. Sci. 1986, 2, 489–490. [Google Scholar] [CrossRef] [Green Version]
  67. Epstein, S.; Mayeda, T. Variation of o18 content of waters from natural sources. Geochim. Cosmochim. Acta 1953, 4, 213–224. [Google Scholar] [CrossRef]
  68. Coplen, T.B. Discontinuance of Smow and Pdb. Nature 1995, 375, 285. [Google Scholar] [CrossRef]
  69. Mohamaden, M.; El-Sayed, H.; Hamouda, A. Combined application of electrical resistivity and GIS for subsurface mapping and groundwater exploration at El-themed, southeast Sinai, Egypt. Egypt. J. Aquat. Res. 2016, 42, 417–426. [Google Scholar] [CrossRef] [Green Version]
  70. Loke, M.H.; Acworth, I.; Dahlin, T. A comparison of smooth and blocky inversion methods in 2D electrical imaging surveys. Explor. Geophys. 2003, 34, 182–187. [Google Scholar] [CrossRef] [Green Version]
  71. Athanasiou, E.; Tsourlos, P.; Papazachos, C.; Tsokas, G. Combined weighted inversion of electrical resistivity data arising from different array types. J. Appl. Geophys. 2007, 62, 124–140. [Google Scholar] [CrossRef]
  72. Craig, H. Isotopic variations in meteoric waters. Science 1961, 133, 1702–1703. [Google Scholar] [CrossRef] [PubMed]
  73. Ahmed, M. Geochemical and isotopic characteristics of quaternary aquifer in Sohag district, upper Egypt. Arab. J. Nucl. Sci. Appl. 2008, 41, 129–146. [Google Scholar]
  74. Hamza, M.; El-Hemamy, S.; Salem, W. Geo electrical and environmental isotope studies of ground water along El-Menia governorate, Upper (EG). Arab. J. Nucl. Sci. Appl. 2001, 34, 41–55. [Google Scholar]
  75. Awad, M.; Hamza, M.; Farid, M. Studies on the recharge of the aquifer systems in the southern portion of the Nile delta using radioisotopes and hydro chemistry. Isot. Radiat. Res. 1994, 26, 21–25. [Google Scholar]
  76. Awad, M.A.; El Arabi, N.E.; Hamza, M.S. Use of solute chemistry and isotopes to identify sources of ground-water recharge in the Nile aquifer system, upper Egypt. Groundwater 1997, 35, 223–228. [Google Scholar] [CrossRef]
  77. Awad, M.; Hamza, M.; Atwa, S.; Sallouma, M. Isotopic and hydrogeochemical evaluation of groundwater at Qusier-Safaga area, Eastern desert, Egypt. Environ. Geochem. Health 1996, 18, 47–54. [Google Scholar] [CrossRef]
  78. Gat, J.R.; Gonfiantini, R. Stable Isotope Hydrology. Deuterium and Oxygen-18 in the Water Cycle; IAEA Technical Report Series #210; IAEA: Vienna, Austria, 1981; p. 337. [Google Scholar]
  79. Shivanna, K. Isotopes in Groundwater Resources Development. Technical Backstopping to Field Activities—Report on Expert Mission: Rafj8/022. Project: Project RAF 8022: Egyptian Atomic Energy Authority; IAEA: Cairo, Egypt, 1996; p. 23. [Google Scholar]
  80. El-Bakri, A.; Tantawi, M.; Hamza, M.; Awad, M. Estimation of groundwater inflow to irrigation drains in Minia, upper Egypt, based on a deuterium and oxygen-18 evaporation pan technique. Hydrol. Sci. J. 1996, 41, 41–48. [Google Scholar] [CrossRef]
  81. Sonntag, C.; Thorweihe, U.; Rudolph, J.; Lohnert, E.; Junghans, C.; Munnich, K.; Klitzsch, E.; El-Shazly, E.; Swailen, F. Isotopic Identification of Saharian Groundwaters, Groundwater Formation in the Past; Arbeitstagung “Isotope in the Nature”: Leipzig, Germany, 1979; pp. 5–9. [Google Scholar]
  82. Iranmanesh, A.; Ii, R.A.L.; Wimmer, B.T. Multivariate statistical evaluation of groundwater compliance data from the Illinois basin–Decatur project. Energy Procedia 2014, 63, 3182–3194. [Google Scholar] [CrossRef]
Figure 1. Location map of the Abydos archaeological site, El-Balyana city, Sohag, Egypt, where (a) the global map of Egypt, (b) a location of El-Balyana town, Sohag Governorate, Egypt which contains Abydos archeological site, and (c) a map of the Abydos site, which displays the nearby boreholes and the Osirion site.
Minerals 13 00064 g001
Figure 2. Elevation contour map of the study area.
Minerals 13 00064 g002
Figure 3. The identified subsurface discontinuities under Abydos Temple, modified [52].
Minerals 13 00064 g003
Figure 4. (a) A picture of the wall after excavation, showing Menit, often regarded as “the mooring post,” on the left and Neshmet, on the right; (b) The building’s dedication text, which is written on the west wall. This picture was created in collaboration between Kevin Cahail and Jennifer Wegner; and (c) a comprehensive description of the hieroglyphic text that claims the monarch excavated a channel to transport the boats of the Abydene gods [53].
Minerals 13 00064 g004
Figure 5. (A) Simplified surface geologic map of Sohag Governorate, [59] and cross-section along the study area [58] and (B) Three stratigraphic sequence west of Abydos area [54].
Minerals 13 00064 g005
Figure 6. Hydrograph of the Nile River at El-Balyana and the groundwater levels in the Roman well [58].
Minerals 13 00064 g006
Figure 7. Hydrograph shows the water level in the Nag Hammadi upstream and water level within the study area [7].
Minerals 13 00064 g007
Figure 8. Location map of the Osirion lake samples (OL1 and OL2) and drilled wells around it.
Minerals 13 00064 g008
Figure 9. Map indexing the 14 ERT lines that were represented at the intended site during the survey utilizing 2D electrical resistivity tomography. Additionally, two accessible borehole locations are displayed.
Minerals 13 00064 g009
Figure 10. Deuterium and Oxygen-18 of different local groundwater and surface water samples collected from the study area. The long solid line indicates global meteoric water line (GMWL), [72], while the broken line suggests the local meteoric water line (δD = 7.111*δ18O + 5.479). Data by previous researchers of groundwater and surface water in the EI-Balyana drain (15), Nag-Hammadi EI-Garbia Channel (16), and Nile River (18 and 19) [73,74], and the old Nile water (20 and 21) [75,76] are also shown.
Minerals 13 00064 g010
Figure 11. The four identified basic clusters’ primary physical, hydrochemical, and isotopic features for the water samples under investigation.
Minerals 13 00064 g011
Figure 12. Four clusters on the Q-mode factor analysis plan.
Minerals 13 00064 g012
Figure 13. Interpreted 2D inverted resistivity model of profile No 1. Four distinct geoelectric zones were identified based on the resistivity data.
Minerals 13 00064 g013
Figure 14. A 3D voxel representation gathering profiles 1–14 of the inverted electrical resistivity tomography. This model explains the vertical and the horizontal variations in the resistivity values due to lithology and fluid contents.
Minerals 13 00064 g014
Table 1. Overview of data used for isotope study in the investigated area. Both δ18O and δ2H values are expressed in part per mil (‰).
Location and IDδ18Oδ2HReference
Quaternary (semiconfined) aquifer under cultivated lands
11W113.3036.32This study
13 * 3.1429.90 [73]
Plio-Pliestocene (unconfined) aquifer under desert fringes
9W9−2.49−11.10This study
10W10−2.71−14.02This study
1W1−0.452.49This study
2W2−0.603.40This study
3W3−0.503.12This study
4W4−0.95−0.80This study
5W5−1.09−1.80This study
6W6−1.23−1.50This study
14 * −1.05−0.80 [73]
Surface water samples (irrigation channels and drains)
15 *EI-Baliana Drain2.0416.40 [73]
16 *Nag-Hammadi EI-Gharbia Channel2.9022.95 [73]
Osirion lake samples
7OL1−0.312.69This study
8OL2−0.425.06This study
Nile River Water as reference samples
121Recent Nile Water (RNW)3.0732.44This study
18 *1Recent Nile Water (RNW)2.8426.50 [73]
19 *1Recent Nile Water (RNW)2.1919.00 [74]
20 *2Old Nile Water (ONW)−0.604.30 [75]
21 *2Old Nile Water (ONW)−0.481.81 [76]
22 *3Paleowater (PW)−7.14−50.00 [77]
Asterisk (*) denotes data from previous studies. 1 Recent Nile Water (RNW) = Nile River water after construction of Aswan Dam 1967. 2 Old Nile Water (ONW) = Nile River water before construction of Aswan Dam 1967.
Table 2. An overview table showing the TDS, hydrochemical, isotopic, and geographic locations of the several clusters identified in the confined or semiconfined Quaternary aquifer groundwater in the study region.
Water GroupsSample IDClusterTDS ppmWater Type
(Hydrochemical Characteristics)
Stable Isotope CharacteristicsSpatial Location
δ18O ‰δD ‰
Groundwater from semiconfined aquiferW11I<1000Na-HCO33.07 to 3.3032.44 to 36.32EnrichedCultivated lands
Groundwater from unconfined aquiferW1, W2,II<1000Na-HCO3−1.23 to −0.451.8 to 3.04DepletedWestern Desert Fringes
W3, W4, W5, W6>1000Na-Cl
W9, W10III−2.71 to −2.49−14.02 to −11.10More depleted
Osirion lake waterOL1, OL2IV>1000Na-HCO3−0.42 to −0.312.69 to 5.06Depleted
Reference water samples
The Old Nile WaterONWI<1000Ca-HCO3−0.64.30DepletedNile River
The Recent Nile WaterRNW3.0732.44EnrichedNile River
PaleowaterPWIII>1000 −7.14−50.00Highly DepletedWestern Desert
Disclaimer/Publisher’s Note: The statements, opinions and data contained in all publications are solely those of the individual author(s) and contributor(s) and not of MDPI and/or the editor(s). MDPI and/or the editor(s) disclaim responsibility for any injury to people or property resulting from any ideas, methods, instructions or products referred to in the content.

