Article

Reservoir Quality Prediction of Gas-Bearing Carbonate Sediments in the Qadirpur Field: Insights from Advanced Machine Learning Approaches of SOM and Cluster Analysis

1
Institute of Geophysics and Geomatics, China University of Geosciences, Wuhan 430074, China
2
Institute for Ecological Research and Pollution Control of Plateau Lakes, School of Ecology and Environmental Science, Yunnan University, Kunming 650500, China
3
School of Earth Resources, China University of Geosciences, Wuhan 430074, China
4
State Key Laboratory of Geomechanics and Geotechnical Engineering, Institute of Rock and Soil Mechanics, Chinese Academy of Sciences, Wuhan 430071, China
5
University of Chinese Academy of Sciences, Beijing 100049, China
6
School of Earth Resources, Department of Minerology, Petrology and Ore Deposits, China University of Geosciences, Wuhan 430074, China
7
Department of Oil and Gas Technologies, Perm National Research Polytechnic University, 614990 Perm, Russia
8
Laboratory for Computational Mechanics, Institute for Computational Science and Artificial Intelligence, Van Lang University, Ho Chi Minh City 700000, Vietnam
9
Faculty of Mechanical-Electrical and Computer Engineering, Van Lang University, Ho Chi Minh City 700000, Vietnam
*
Authors to whom correspondence should be addressed.
Minerals 2023, 13(1), 29; https://doi.org/10.3390/min13010029
Submission received: 9 November 2022 / Revised: 15 December 2022 / Accepted: 22 December 2022 / Published: 24 December 2022

Abstract

:
The detailed reservoir characterization was examined for the Central Indus Basin (CIB), Pakistan, across Qadirpur Field Eocene rock units. Various petrophysical parameters were analyzed with the integration of various cross-plots, complex water saturation, shale volume, effective porosity, total porosity, hydrocarbon saturation, neutron porosity and sonic concepts, gas effects, and lithology. In total, 8–14% of high effective porosity and 45–62% of hydrocarbon saturation are superbly found in the reservoirs of the Eocene. The Sui Upper Limestone is one of the poorest reservoirs among all these reservoirs. However, this reservoir has few intervals of rich hydrocarbons with highly effective porosity values. The shale volume ranges from 30 to 43%. The reservoir is filled with effective and total porosities along with secondary porosities. Fracture–vuggy, chalky, and intracrystalline reservoirs are the main contributors of porosity. The reservoirs produce hydrocarbon without water and gas-emitting carbonates with an irreducible water saturation rate of 38–55%. In order to evaluate lithotypes, including axial changes in reservoir characterization, self-organizing maps, isoparametersetric maps of the petrophysical parameters, and litho-saturation cross-plots were constructed. Estimating the petrophysical parameters of gas wells and understanding reservoir prospects were both feasible with the methods employed in this study, and could be applied in the Central Indus Basin and anywhere else with comparable basins.

1. Introduction

In the oil industry, one of the most important tasks is the analysis of well-log data, which can be a time-consuming process [1,2]. Geoscientists have worked diligently over the past few decades to reduce the expense of obtaining these data. It is possible to evaluate the potential for oil and gas production by analyzing important indicators, including reservoir permeability, and by utilizing data through petrophysical logging techniques, which is both time- and cost-efficient [3]. The use of neural networks to simulate complicated systems in geosciences has become increasingly popular in recent years [4,5]. Machine learning (ML) is a branch of artificial intelligence (AI) that involves numerous methods for analyzing data, such as clustering, classification, and regression [6,7]. The field of machine learning can be divided into two primary categories: unsupervised and supervised approaches [2,8]. Unsupervised machine learning heavily relies on the input parameters and predicted values [9,10]. It is becoming increasingly common practice in the petroleum industry to employ machine-led tools that make use of wire-line logs in order to address geoscientific problems [11]. The present study will examine ways in which the unsupervised ML can enhance the reservoir characteristics and identify petrotypes by employing well-log data. Faster and more accurate object classification can be trained to a computer via machine learning. Since the 1990s, nonparametric methods including principal component analysis, artificial neural networks, fuzzy logic, and other strategies have been widely used to determine facies [12]. While core samples provide the most important physical data for classifying facies, they are typically only collected from a limited number of wells within a producing reservoir due to their high cost. Since core samples are rarely collected, the facies projection method employs non-linear statistical methods. The self-organizing maps (SOM) model may be preferable when there is a lack of facies information or when dealing with unskilled geologists [2]. Cluster analysis (CA) is an ML approach designed to automatically categorize large datasets into relevant subgroups, wherein the statistics inside every subset have similar qualities while still being distinguishable from one another. It has various potential applications including data compression, data mining, and vector quantization. For persistent data, k-means CA is frequently applied. Discovering significant patterns hidden inside vast datasets is the objective of the clustering technique. K-mean cluster analysis is a fast and reliable approach for clustering which is also considerably simpler, and it is particularly useful for large datasets [13].
As shown in Figure 1, the Qadirpur gas field is located in the Central Indus Basin (CIB), which is partitioned from the Upper Indus Basin through the Sargodha High, as well as the Pezu Uplift in the north [14,15]. National and multinational oil and gas corporations have conducted substantial geological and geophysical examinations inside the Indus basin, as it is a key hydrocarbon-producing region in Pakistan [5,16]. However, there is an extreme limitation with regards to the fairly insignificant amount of published material that addresses the reservoir characterization of the Indus Basin of Pakistan obtained via wireline logging [17,18]. This is due to the fact that petroleum exploration corporations prefer to keep the information they obtain private; as a result, this information is not easily accessible for the sake of academic and scientific investigation. Wireline logs have been widely utilized nowadays in hydrocarbon exploration to assess the reservoir capacity of drilled rocks [19]. For the purpose of potential oil and gas field progression as well as prospective assessment, an accurate description of reservoir characteristics is necessary [20,21,22]. In the field of petroleum and natural gas exploration, petrophysics provides the most cutting-edge technique for evaluating reservoir properties including rock–fluid interactions [23]. Petrophysics is also a one-dimensional research approach that investigates hydrocarbon and reservoir dynamics within geological formations [24]. In order to analyze the primary attributes of the reservoir, petrophysical investigations are performed on core samples or outcrop data, either in laboratories or in open boreholes [25,26]. This helps to improve awareness surrounding lithology, permeability, porosity, as well as fluid saturation within rocks [27]. In addition to this, evaluation methods can be used to identify possible reservoir zones, determine the type of fluid present inside a reservoir, and compute the amount of oil resources [28,29]. Although the Central Indus Basin is a key hydrocarbon source, there is limited information about its reservoirs from a petrophysical perspective [30].
Since the study area is in such high demand for forthcoming oil and gas explorations, our study will provide a comprehensive evaluation of the petrophysical assessment that can be used to find new possibilities, establish the dependability of reservoirs, and more comprehensively evaluate the hydrocarbon potential. The spatial distribution of porosity, permeability, gas saturation, water saturation, and shale volume is still not properly addressed. In addition, the distribution of clustering and lithofacies in a heterogeneous environment is also complicated which makes it challenging to identify the adequate reservoir quality and potential. Henceforth, the current study is focused on the identification of rock typing, spatial distribution evaluation, and reservoir quality prediction, which is still missing in the study area. The present study will integrate SOM and CA with the logging data to predict lithotypes, reservoir rock types, and zones of interest; decrease the probability of errors occurring when interpreting well logs; and yield more precise results. Furthermore, the outcomes of this study can be utilized to reduce the dangers associated with upcoming development and exploration throughout the Indus Basin.

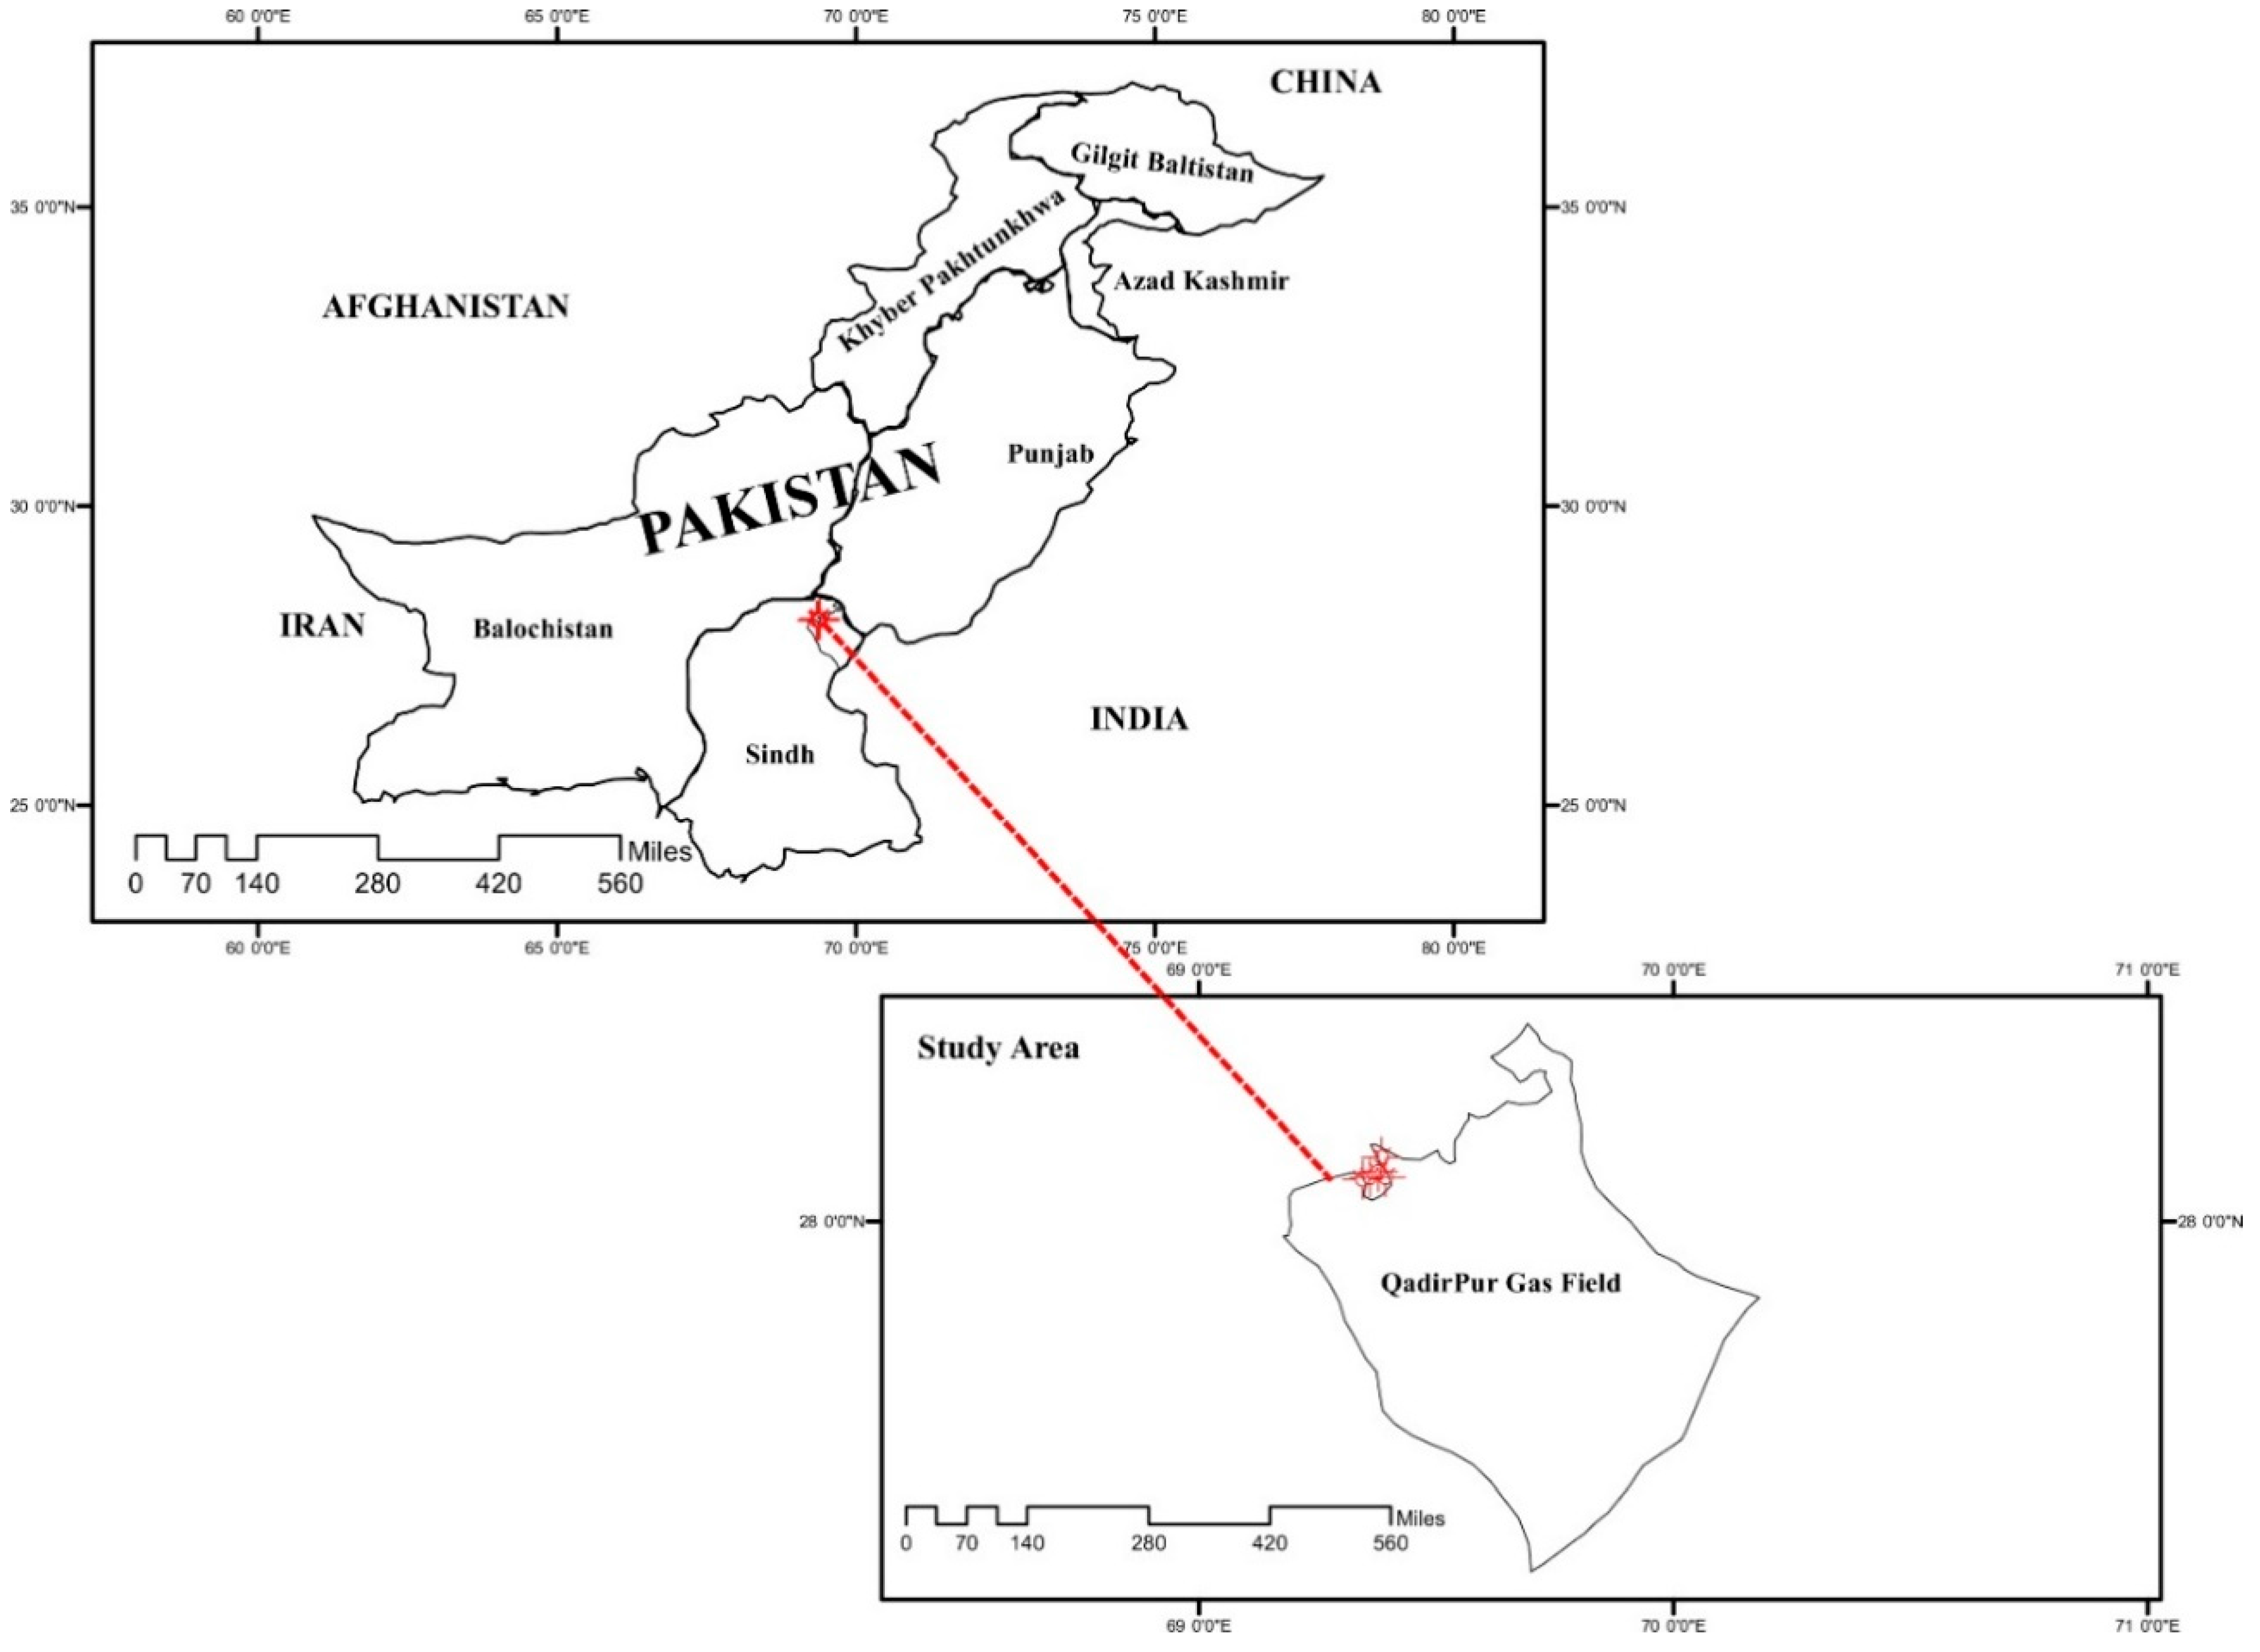
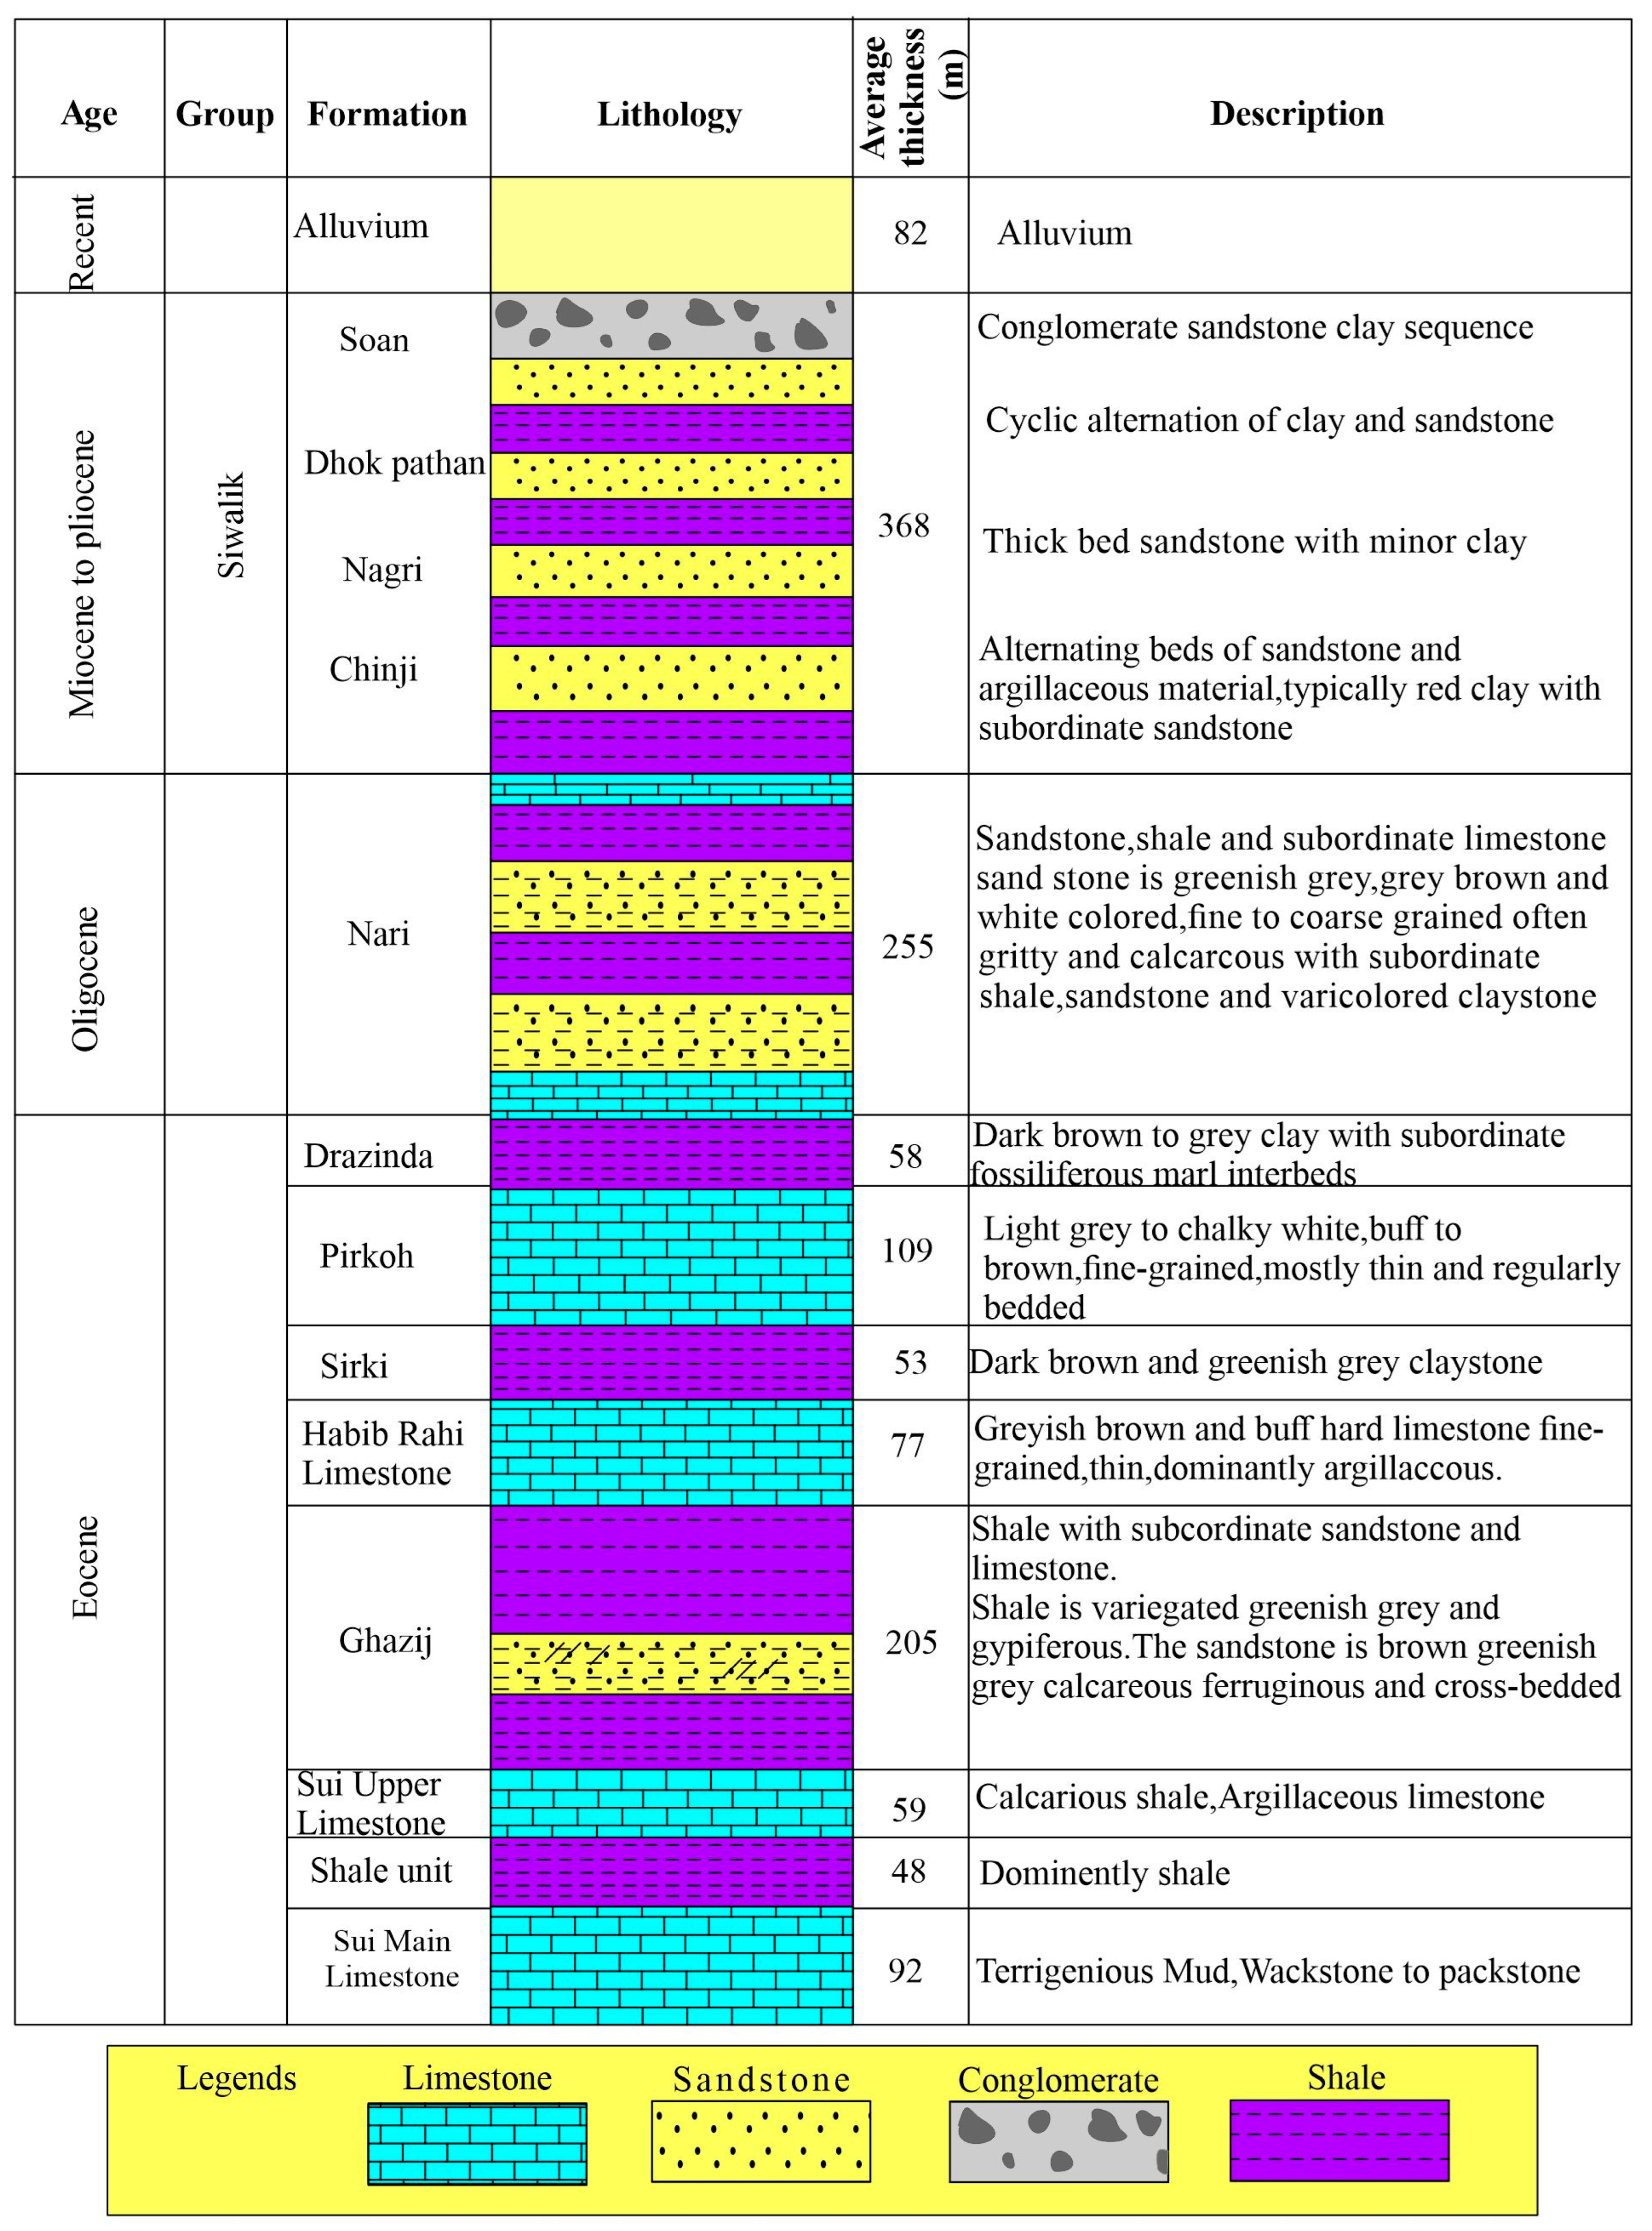
2. Geological Background of the Study Area

The research area is located in the Middle Indus Basin. The major hydrocarbon-producing area of Pakistan is the Central Indus Basin [31]. The Sember shale, the Mughalkot shale, and the Ranikot shale are the source rocks in the Qadirpur region. Additionally, for their source potential, the Sirki Formation was taken into consideration [32]. The Sui Main Limestone is not evident anywhere in Pakistan [33]. The Pirkoh and Habib Rahi Limestones represent secondary reservoirs, whereas the Sui Main Limestone as well as the Sui Upper Limestone are the primary reservoir and source of gas, respectively [34]. The cap rocks inside the field of research comprise Ghazij shale along with Sirki shale, as shown in Figure 2. The Indian Shield is located to the east of the Central Indus Basin, while the marginal zone of the Indian Plate can be found to the west and the Sukkar Rifle can be discovered in the south [35]. Rifting of the Indian Plate from Gondwanaland is the primary tectonic activity that influences the Middle Indus Basin’s structural trends and sedimentary patterns (Jurassic to Early Cretaceous) [36]. In addition to the rifting, isostatic uplift along the borders of the recently established ocean triggered uplift and eastward tilting during the start of the Cretaceous period. Cretaceous plate tectonics could have caused some sinistral strike-slip faulting, hot spots, and thermal doming along the Madagascar–Indian plate border during this time period. As a consequence of this movement, the Deccan flood basalts and the NNW striking normal faults were uplifted [37]. Sinistral transpression occurred in the western part of the Middle Indus Basin as a result of the collision of the Himalayas throughout the Oligocene and the present day, including fold-thrust structures being overprinted with sinistral flower structures [38]. The tilting fault blocks inside the horst–graben structural framework were the primary structural forces within the region. The geological and tectonic phenomena in the Middle Indus Basin could be subdivided between pre-rift and post-rift eras [39]. The Indian subcontinent was a component of Gondwanaland before the rupture between the two tectonic plates. During the Triassic period, the Afghan and Iranian blocks split off from Gondwanaland. Mesozoic sedimentation occurred in the platform region, and the gap in sedimentation was caused by movements of orogenic plates [40]. Three key factors, i.e., tectonic activity, sea level variations, and sedimentation rates, govern the facies variations inside the Middle Indus Basin [41]. These elements are listed in the order of the most essential to the least important. In the area under investigation, rifting was the cause of fast marine transgression, which led to marine sedimentation. Paleocene is the time period in which the tectonic activities of the Sulaiman Fold Belt occurred [42]. During the Eocene time period, thrust faults formed along the eastern boundary of a Sulaiman region and further south in the Marri-Bugti zone. The displacement of the Indian plate and the tectonic forces of the Afghan block led to the formation of a Sulaiman Foredeep [43]. The portion of the Punjab Platform that is not prone to instability can be found in the eastern part of the Sulaiman Foredeep area, as displayed in Figure 3.

3. Data and Methods

Wire-line log data were used for the petrophysical analysis which incorporates bulk density (RHOB), neutron porosity (NPHI), deep resistivity (LLD), shallow resistivity (LLS), photoelectric effect (PEF), sonic (DT), self-potential (SP), and gamma-ray (GR) [27,44]. During the study of the Qadirpur gas field (QGF), the geophysical log data were taken from five wells (QGF-03, QGF-11, QGF-15, QGF-16, and QGF-17) within the concerned block. With permission from Pakistan’s Directorate General of Petroleum Concession (DGPC), we analyzed data from five wells’ las files, which contained geophysical responses to carry out current investigations. The stacked geological strata are represented by their depth-dependent physical characteristic in the borehole logging. Table 1 contains important data variables. These include the log type, the estimated physical attributes at the appropriate tool, and the log interval of the QGF gas field, as observed in the existing study wells.
The study was conducted to investigate the target-zone lithology, pore-fluid types, effective porosity, and permeability [45]. Data quality is associated with the typical matters of mud type and borehole circumstance, by which there are log interpretation impacts on both, i.e., the log stationary reading results are subsequently prominent to misinterpretations in the logs [46]. Well-log data analysis and optimum results compilation were performed using Interactive Petrophysics (IP) software version 2019. The Sui Main Upper Limestone Formation log response is displayed in Figure 4. Several methods were utilized to analyze the data in this study, and are discussed below.

3.1. Environmental Corrections

Mathematical relationships including Schlumberger charts were used to correct logging data for a variety of unfavorable environmental influences [31]. Before executing the analyses described in the present study, preliminary corrections were conducted for wellbore impacts, temperature alterations in geologic formation when depth increases, GR modifications for borehole variations, and NPHI log adjustments for matrix fluctuations.

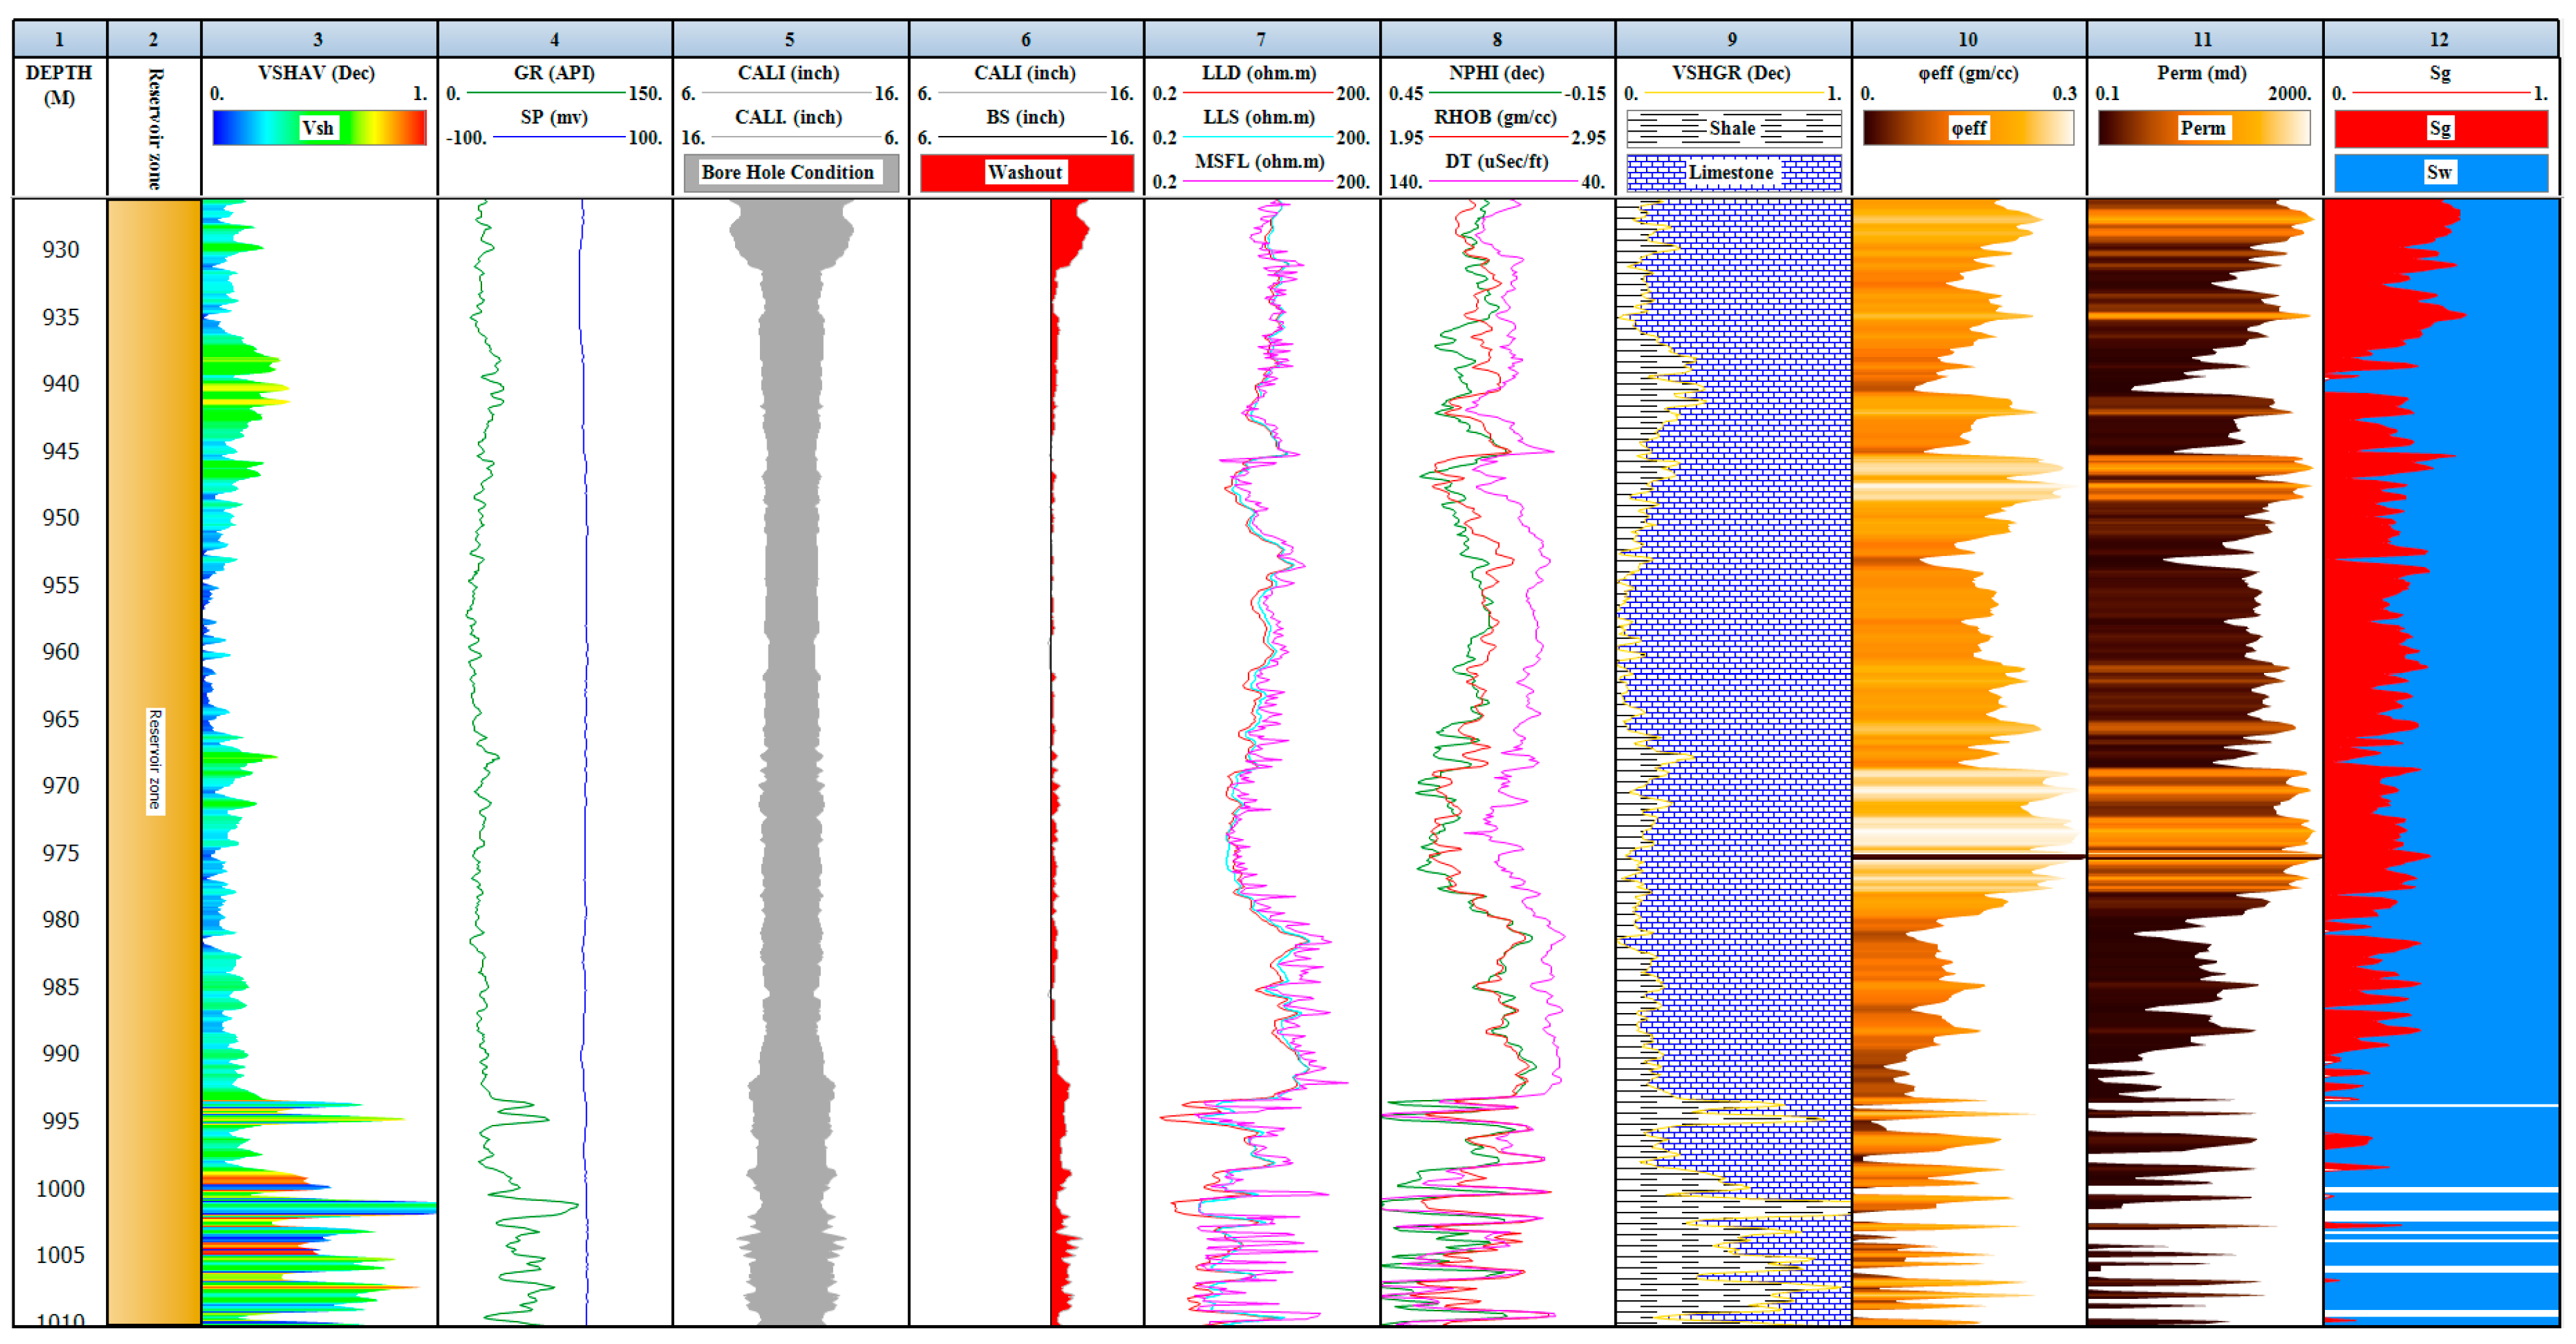
3.2. Petrophysical Parameters

3.2.1. Volume of Shale

The volume of shale must be analyzed in petrophysical examinations to address the findings of water saturation (Sw), permeability, and porosity for the affected consequences of the shale [27,47]. The volume of shale in the reservoir was used to determine its quality [15,48]. Various shale indicators were used to determine the quality of the shale. The gamma-ray technique was employed to characterize the amount of shale in this study.
To calculate the shale volume, the equation given below was used.
V sh = GR GR matrix GR shale GR matrix
where the GR log denotes the actual borehole-corrected GR response/reading in the study zone. In clean zones, GRmin is the smallest borehole-corrected GR response/reading. In the shale zone, GRmax is the maximal borehole-corrected GR response/reading.

3.2.2. Porosity Calculation

Porosity can be determined using a specific porosity log (sonic, neutron, or density concepts) or a composite of porosity logs [49]. Porosity is considered as the total porosity when the clay content is directly obtained from logs without amendment [50]. The effective porosity is the porosity that remains after the clay effect is eliminated. Total and effective porosity values were calculated using sonic logs in the current study. The process uses the subsequent equation to investigate effective and total porosity.
Sonic   porosity =   ϕ s = ( Δ Δ T ma ) ( Δ T f Δ T ma )
Shale   porosity ϕ sh = ( Δ T sh Δ T ma ) ( Δ T f Δ T ma )
where ϕs denotes sonic-derived porosity, ϕsh denotes Shale porosity, ΔT log indicates the interval transit time in formation, ΔTma denotes the interval transit time in the matrix, and ΔTfl is the interval transit time in the fluid in formation (saltwater mud = 185 us/ft; freshwater mud = 189 us/ft)

3.2.3. Permeability Calculation

There was a lack of core data for all of the wells accessed in the investigation. Consequently, the present petrophysical study relied on determining permeability via equations. In the absence of core data, a commonly used method is the Wyllie–Rose approach [37]. The following equation was used for calculation purposes.
K =   a   P hi b S wi c
where K is permeability, Phi is porosity, and Swi is irreducible water saturation. The constants a, b, and c (Timur) are 8581, 4.4, and 2, respectively.

3.2.4. Water Saturation

The reservoir pores contain numerous liquids which are saturated with water. Poupon and Leveaux provided the Indonesian formula as an analytical model in 1971 [51]. This idea was inspired by the extreme shaliness and freshwater characteristics of oil reservoirs in Archie.
The analytical relation is expressed as follows:
Sw = ( a × R w R t × Φ t m ) 1 n
where Sw is water saturation, Rt denotes true formation resistivity, Rw is formation water resistivity, Vsh denotes shale volume, Rsh is the resistivity of shale, ϕe denotes effective porosity, m denotes the cementation factor, and a = the Archie constant (for limestone it is 0.71).

3.2.5. Hydrocarbon Saturation

Shepherd used the following equation to estimate the hydrocarbon saturation that is widely used in current research (Shc) [52].
S hc = 1 -   S w

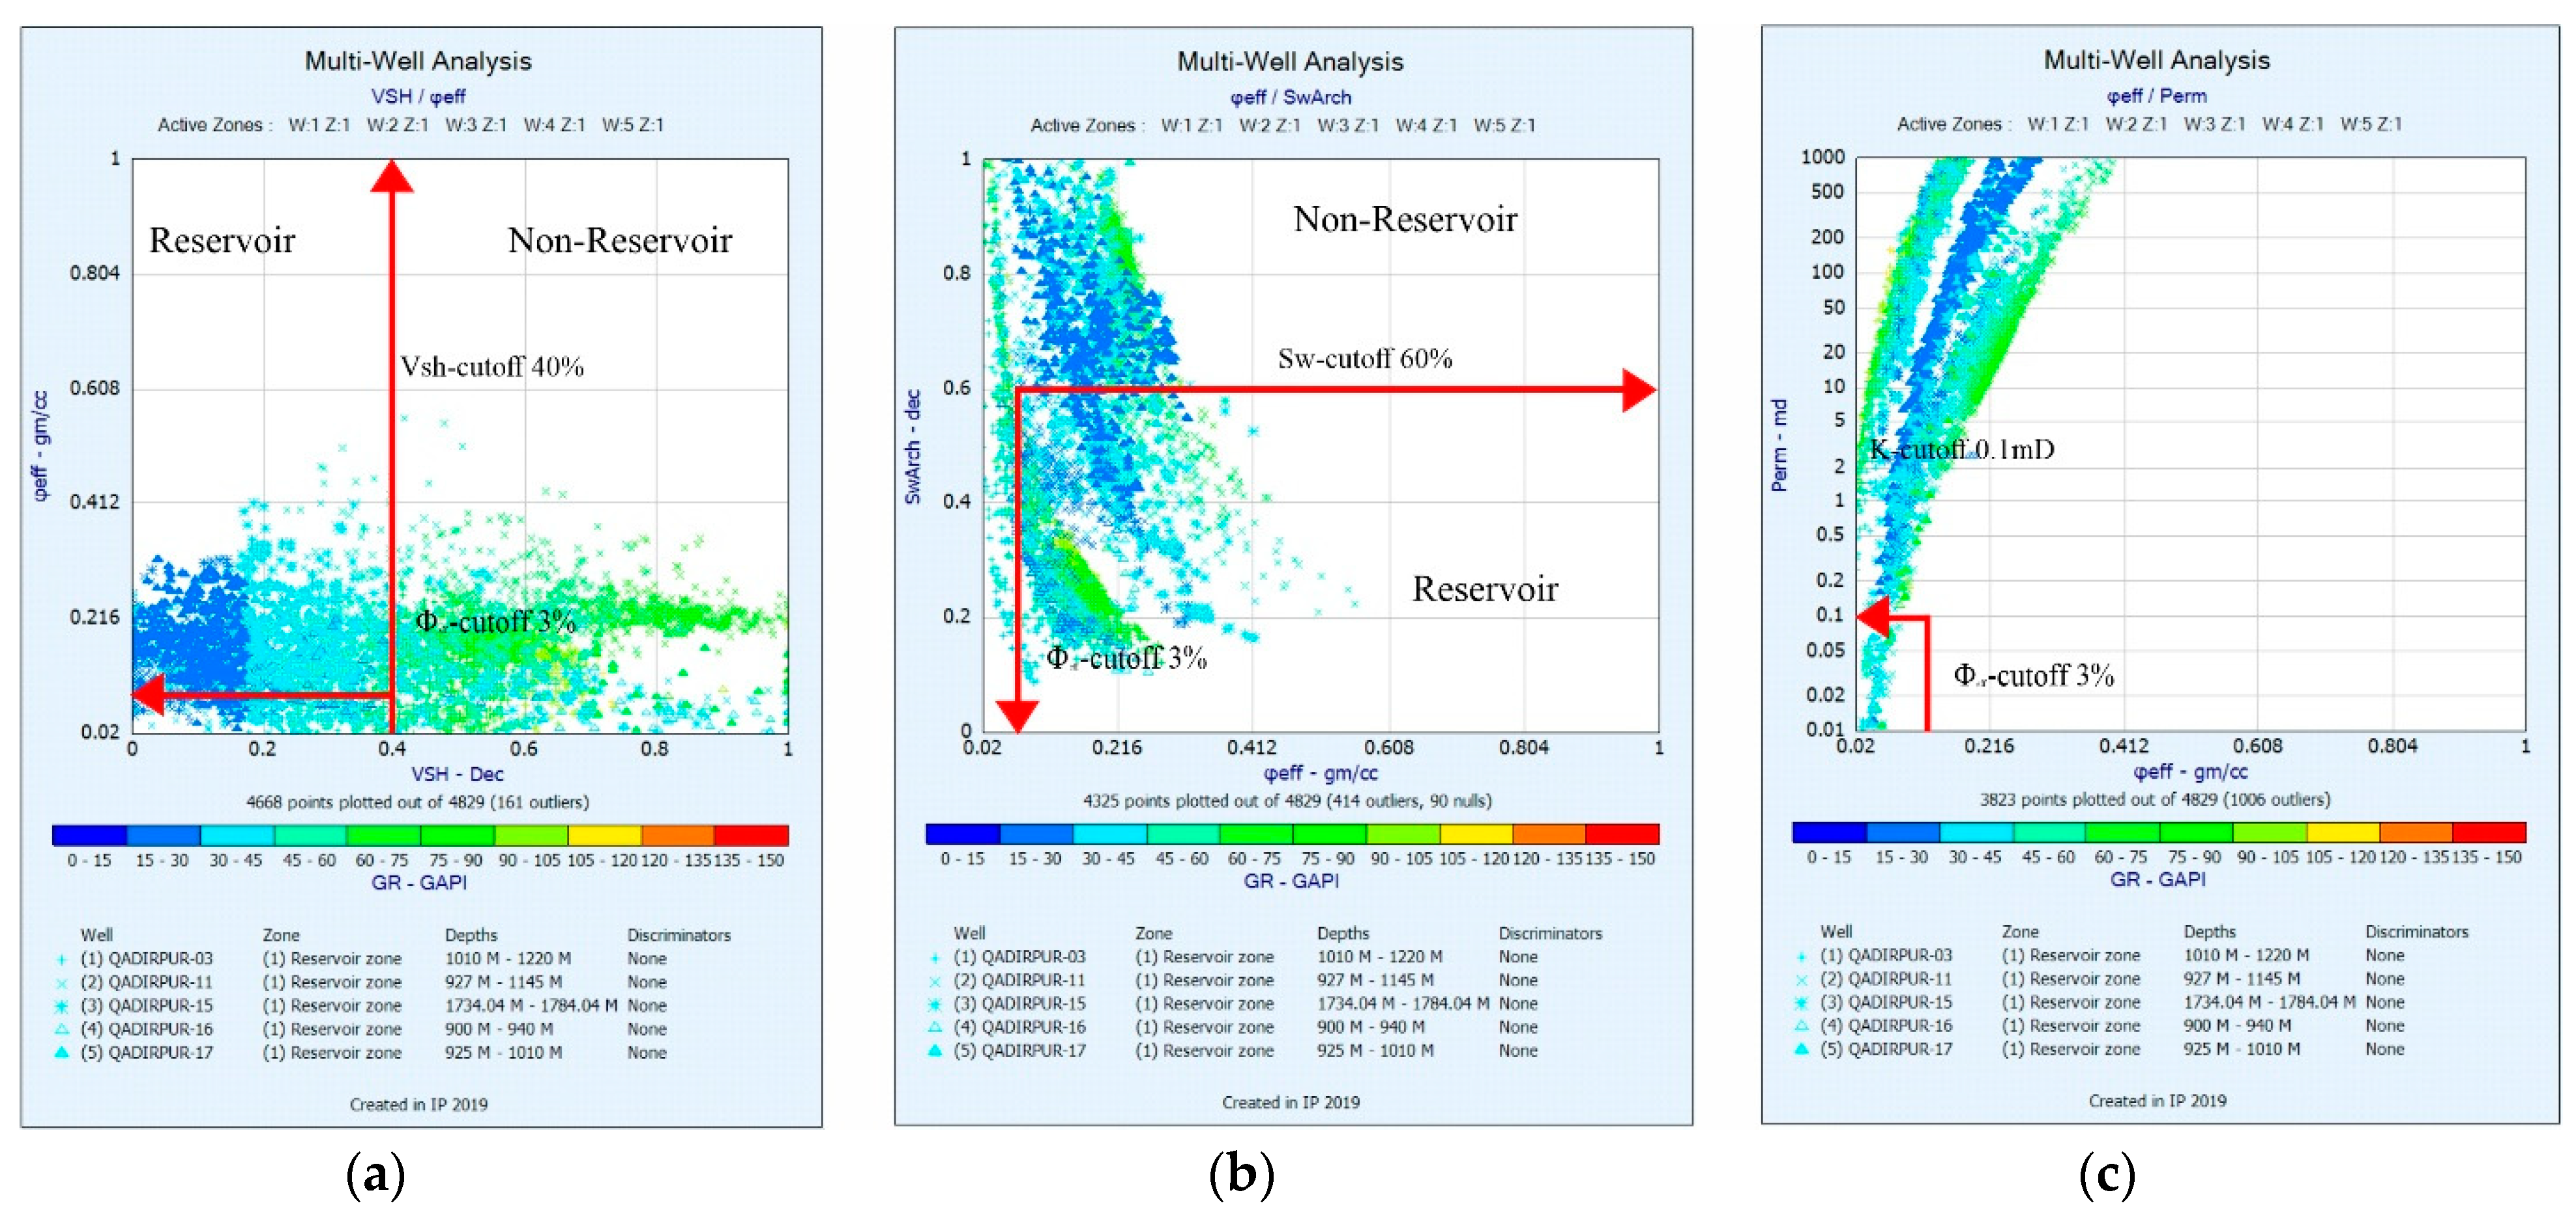
3.3. Cut-off Estimation

In order to accurately calculate the originating oil in place and also the reservoir net pay, it is necessary to establish cutoff values such as the shale concentration, water content, porosity, and permeability values.

3.4. Determination of Lithology Using Cross-Plots and the SOM

3.4.1. M–N Cross-Plot

This approach is based on log and fluid characteristics, which are integrated into three logs of porosity: density, neutron, and sonic concepts. Around 1997, Schlumberger reported that the M–N cross-plot, also known as the tri-porosity cross-plot, is frequently used in complicated lithology to depict the combination of minerals. The lithology becomes more apparent when the displayed M and N components are combined; these functions were computed using density, neutron, and sonic concepts which are insensitive to fundamental porosity. The following equations that give these two parameters are porosity-independent [53].
M = ( Δ T fluid Δ T log ) ( ρ matrix ρ fluid )   ( 0.01 )
N = ( ϕ Nfluid ϕ Nlog ) ( ρ matrix ρ fluid )  

3.4.2. PEF and RHOB Crossplot

It is hard to assess a reservoir without first identifying its lithological characteristics. The term “lithology” is commonly used to describe the solid (matrix) portion of a rock. By utilizing a PEF-versus-RHOB cross-plot, a comprehensive investigation of the lithology feature of the current research region was carried out.

3.4.3. Determination of Lithology Using SOM

Recognizing the lithotype is a primary task within reservoir identification. Traditional approaches to lithotype identification using core data are both time-consuming and resource-intensive, and they present significant obstacles when applied to uncored wells. The most significant benefit of a SOM is its simplicity in terms of data interpretation and comprehension [54]. The elimination of unnecessary dimensions and the utilization of grid clustering make it easy to recognize patterns of similarity within the data [55]. These clusters are generated by SOMs, taking into account all of the information in the input, and the weight given to various types of data can be adjusted to achieve the desired results [56]. The SOM can summarize the data in a way that is informative, interactive, and easy to understand, and it can handle multiple categorization tasks at once [57]. The primary drawback of a SOM is that it needs adequate data to create significant clusters [58]. Information that can properly categorize and differentiate inputs is required for the weight vectors. Groupings will be more disorganized if the weight vectors are incomplete or contain irrelevant information. Finding the right information requires identifying the important components, which might be challenging or even unattainable in some cases. When considering the decision to utilize a SOM, the ability to identify a high-quality set of data is crucial [59]. An additional issue associated with using SOMs is that it can be challenging to obtain a proper mapping in which each cluster truly stands alone [60]. Instead, mapping irregularities emerge when two distinct clusters share an identical map. Multiple sub-clusters of specific neurons can emerge when a larger cluster is separated. This can be avoided with proper map initialization, but not if the ultimate map configuration is not immediately apparent. This study presents a far less costly technique for the objective and systematic assessment of lithotype from well-log data using Kohonen’s self-organizing maps. SOMs are artificial neural networks that organize the input vector into subgroups in a topology-like architecture that is formed in accordance with alternations in the input data and they do not require supervision [61,62].
The empirical relationship can be defined this way:
E d = 1 n   i = 1 n j = 1 w h b i , j x i w j 2 j = 1 w hb i , j

3.5. Clusters Analysis

A reliable evaluation of the reservoir rock type is crucial for the oil and gas industry as it determines the reservoir’s rate of production [12]. Rock type quality in the Sui main limestone reservoir is evaluated using a technique called cluster analysis. Throughout the several stages of this method, clusters can be relied upon to perform multiple functions. The three most essential methods are the nearest neighbor method, the farthest neighbor method, and the mean method. The distance between two points can be calculated using the Euclidean method formula, as follows [12,63].
xy = i = 1 n ( xi yi ) 2
where x and y represent two points in the n-dimensional Euclidean space, xi and yi reflect the Euclidean vectors extending outward from the space’s beginning point, and n symbolizes the n-dimensional Euclidean space.

4. Results

In order to estimate the petrophysical parameters of the current research region, well-log data were employed. Based on the hydrocarbons, porosity values, gas effect, and GR response, a petrophysical interpretation was accomplished for the Habib Rahi Limestone between 836 and 1342 m in depth, as well as for the zone of interest between 1010 and 1220 m in the QG well 03, as shown in Figure 4.

4.1. Lithology

As shown in Figure 5, the Eocene reservoir in the research area prominently comprises limestone along with the content of subordinate argillaceous, revealed by the cross-plots of lithology (bulk density vs. photo-electric effect). There are dolomitic zones in the Habib Rahi and Sui Main Limestones.
A comprehensive analysis of borehole lithology (LLD, CALI, LLS, GR, MSFL, SP, DT, NPHI, and RHOB) was provided by the wire-line log evaluation from the information of primary significance [8,27]. The bit-size log and caliper log always coincide with each other. When the caliper log displays values that are smaller compared to the bit size, a permeable formation is generated; conversely, it represents an impermeable formation (Figure 4 Track-6). The clean limestone deposited on shale is distinguished by natural gamma rays, which are utilized to analyze the lithological formation. Shale concentrations are shown to be greater in impermeable zones. The lower the permeability and effective porosity, the higher the shale content. Sandstone, limestone, and dolomite are common lithologies in permeable zones. However, the majority of rocks in this research region are limestone [64]. Increasing resistivity logs can be traced to high neutron log, gamma ray, and density log values, all of which contribute to favorable conditions for the development of shale. The diagenetic process i.e., compaction or cementation without water, causes an increment in the resistivity log (Figure 4).
The uniformity of the M–N cross-plots was identical, the calcite point had a significant concentration of data points, and a few points were pushed more toward the shale zone, confirming the non-clastic character of the reservoir. The data points moved to the north and west, indicating the presence of the gas effect. According to this explanation, the primary lithology of the Eocene reservoir of the present study is limestone, with some shale intercalations present in all wells. Secondary porosity can be observed in each well based on a small number of data points; this is caused by tectonic forces that lead to local fractures [14,65], as shown in Figure 6.
In addition, this study developed and trained the SOM. The SOM was developed with the intention of elaborating the electrical well-log estimations that were acquired throughout the Qadirpur gas field in order to establish the lithological segment and identify various lithotype classes. It is also possible to determine the quality of the SOM map by computing the quantization error. The color coordinate codes of this kind of facies were established as horizontal and vertical distribution functions to proceed with the lithology characterization of the anticipated wells. Facies coded in brown indicate pure limestone, whereas those in fuchsia and aqua indicate the presence of shaly limestone and shale. The SOM model also demonstrates the magnitude and scope of the variability within hydrocarbons, as previously established. Pure limestone displays a highly effective gas-bearing lithotype, while limestone containing a middle–low-gas-bearing lithotype is distinguished by its low shale percentage. This strategy makes it relatively simple to determine whether the particular group has favorable or unfavorable facies characteristics for the log’s potential, as shown in Figure 7 and Figure 8.

4.2. Water Saturation Assessment
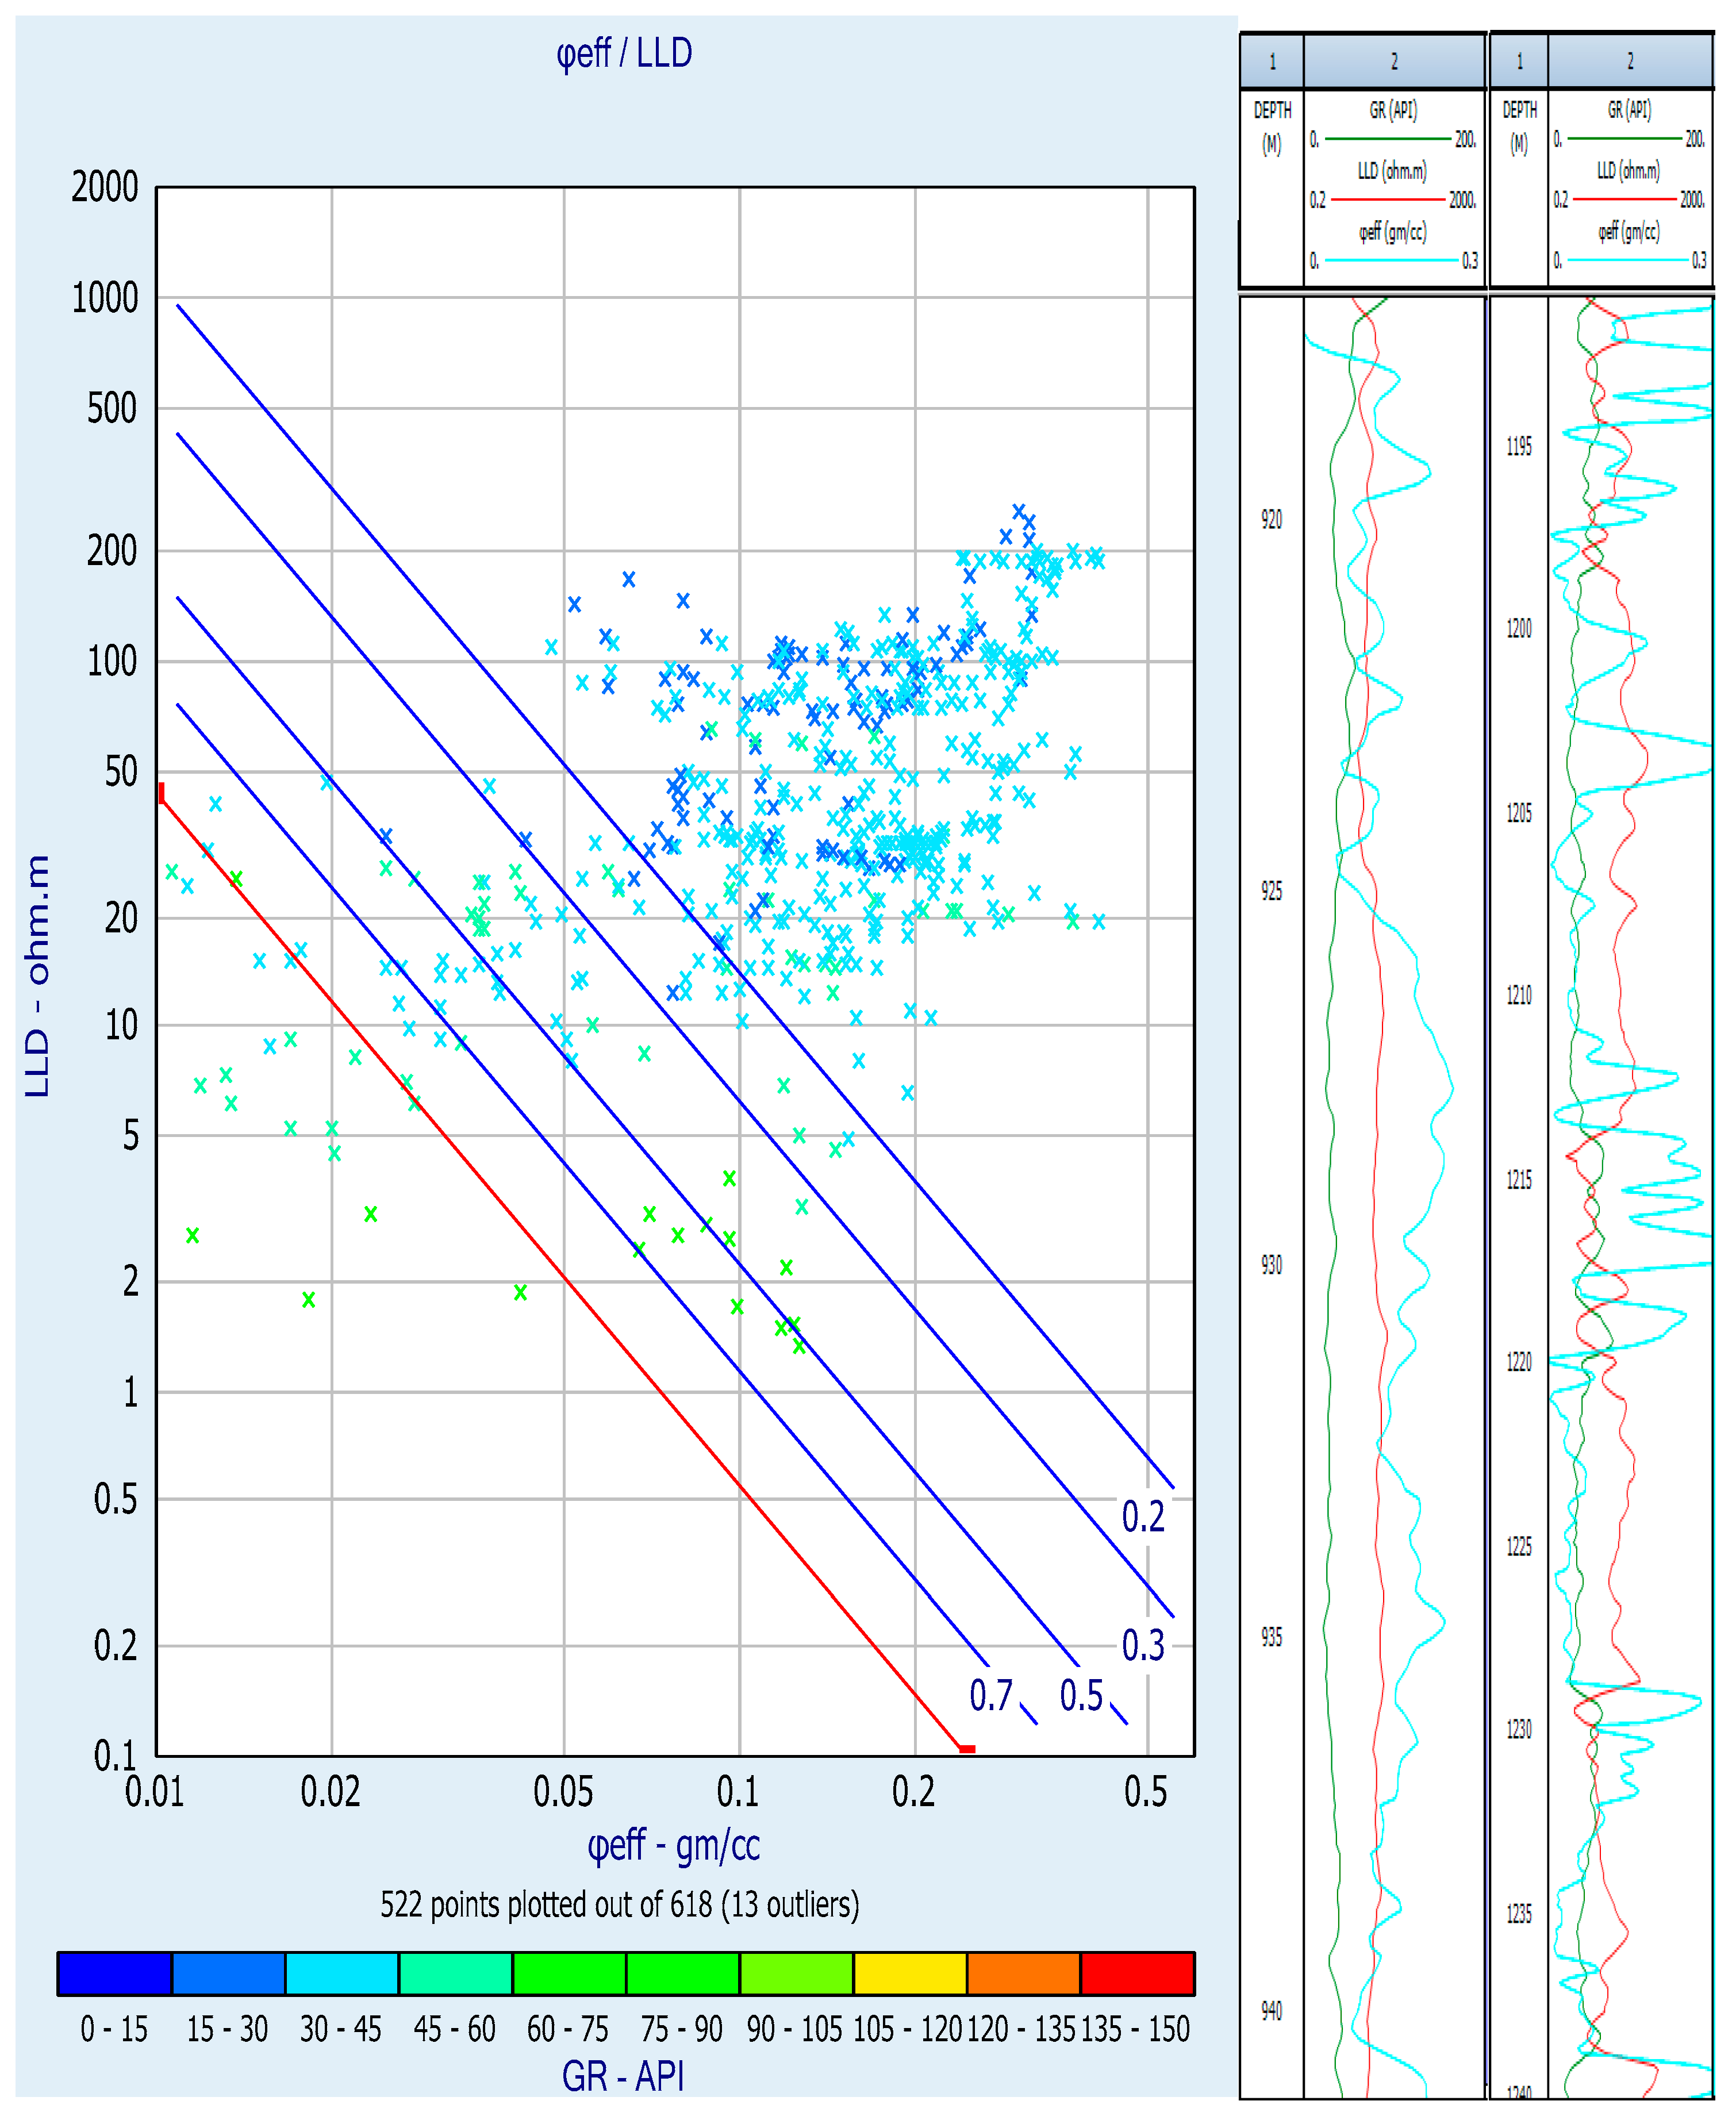
For the QGF, the essential components of the Archie equation—namely, a, m, n, and Rw, were not accessible. Because temperature logs and data on the resistivity of the mud filtrate were not available, the Pickett template method was used to determine a, m, and n for every well, in addition to the salinity of the formation water. The reliability of water saturation estimates relies on the accuracy of these unspecified Archie’s parameters. The results of a, m, n, and Rw within the rock interval that was analyzed are shown in Table 2, which can be used to estimate the precise water saturation values inside the wells that are currently investigated. The significant findings of the Eocene reservoir’s Pickett plot are presented in Figure 9. The existence of higher gas-bearing sections was denoted by clusters that shifted to the northeast and are occupied among water content divisions of 50% and 20% within the ordinal scale of a resistivity log. This indicates the presence of better zones. The computed Sw color coding of the z-axis displays a realistic agreement between the displaying results and the quantitative procedures. Data points that lie below the line depicting 100% water saturation represent the Sw 100%.

4.3. Buckles Plot

In the current investigation, a succession on bulk volume water (BVW) hyperbola confirmed the series of examined reservoirs via plotting porosity, mostly as the factor of Sw, while a BVW value of 0.04 indicated the presence of some Swirr prospects and oil production without water. The highest values indicated that only water was produced, whilst the lower values revealed that oil and water were produced together. These values suggested that oil and water were produced together as the values grew. The lower the BVW value, the more reliable the reservoir, which is characterized by higher permeability, larger coarse-grained particle sizes, and higher pore interconnectivity (Figure 10).

4.4. Cut-off Determination

For the purpose of separating productive and unproductive zones in the Eocene reservoir, several cross-plot frameworks were utilized to characterize reservoir cutoffs. Specifically, the thresholds for water saturation, shale volume (Vsh), permeability, and effective porosity were set at 40%, 3%, 60%, and 0.1 mD, respectively (Figure 11). In essence, a large proportion of net pay effective zones of interest exhibited effective porosity above 3%, shale content below 40%, water content below 60%, and permeability above 0.1 mD.

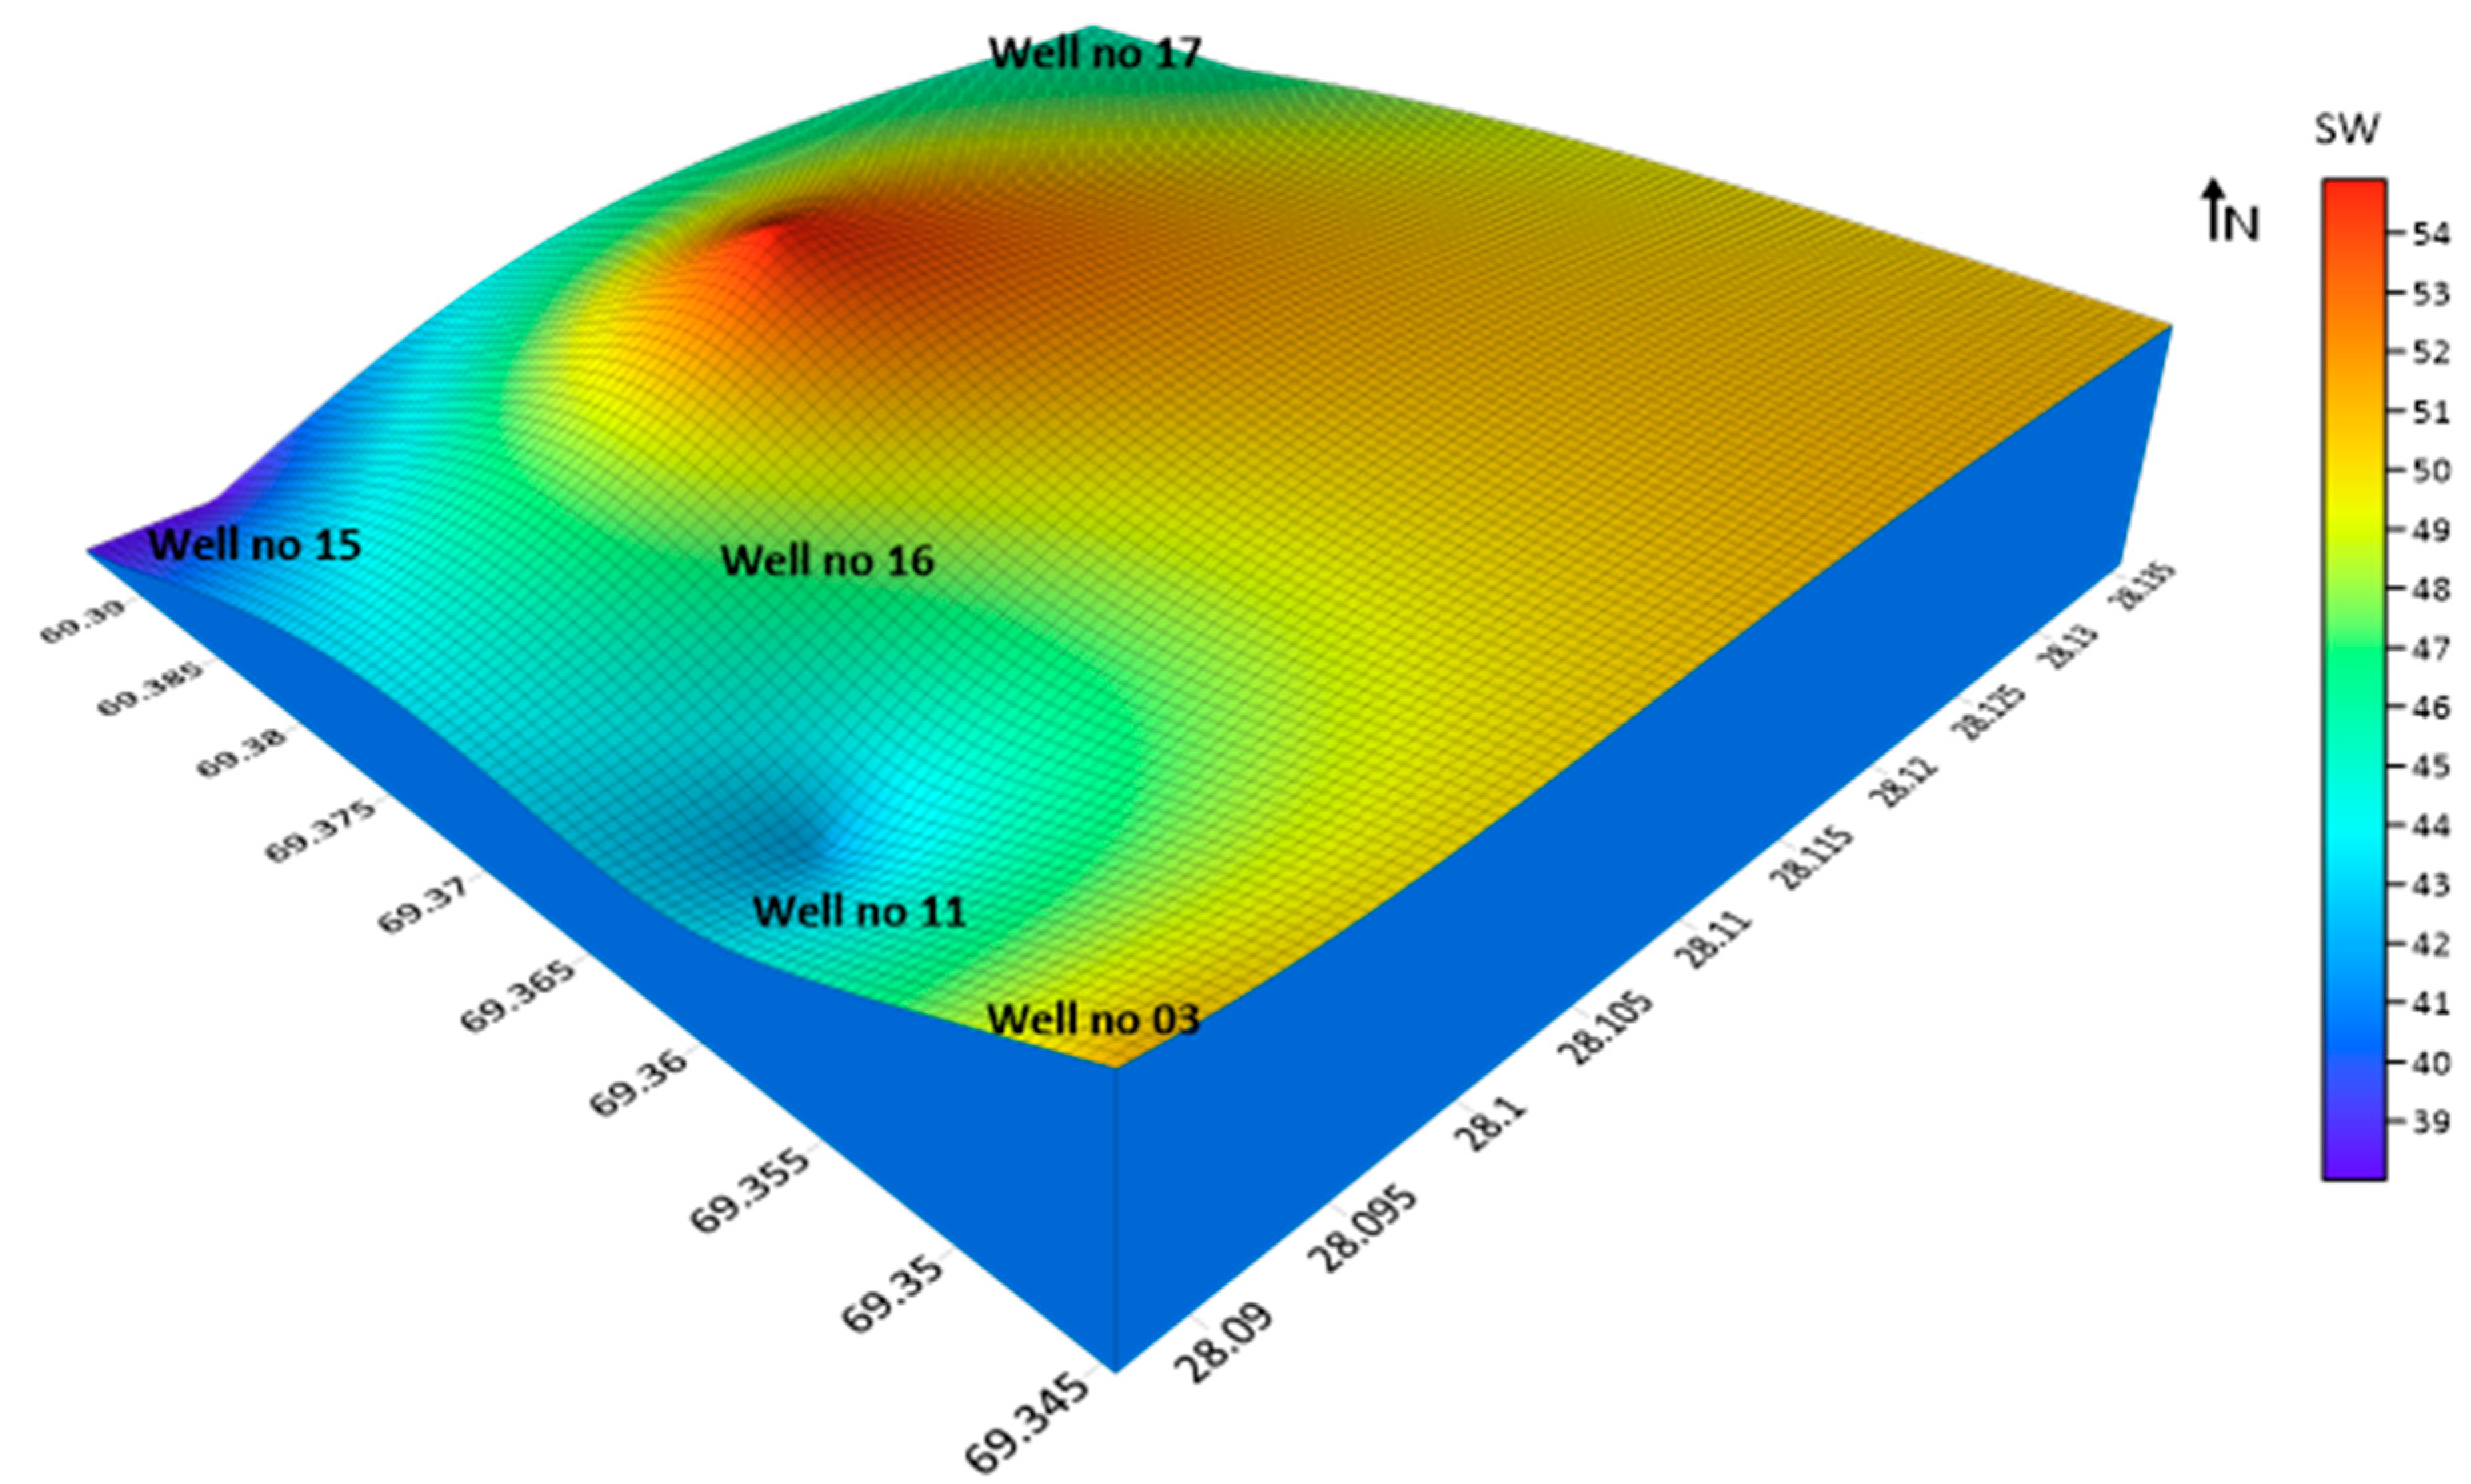
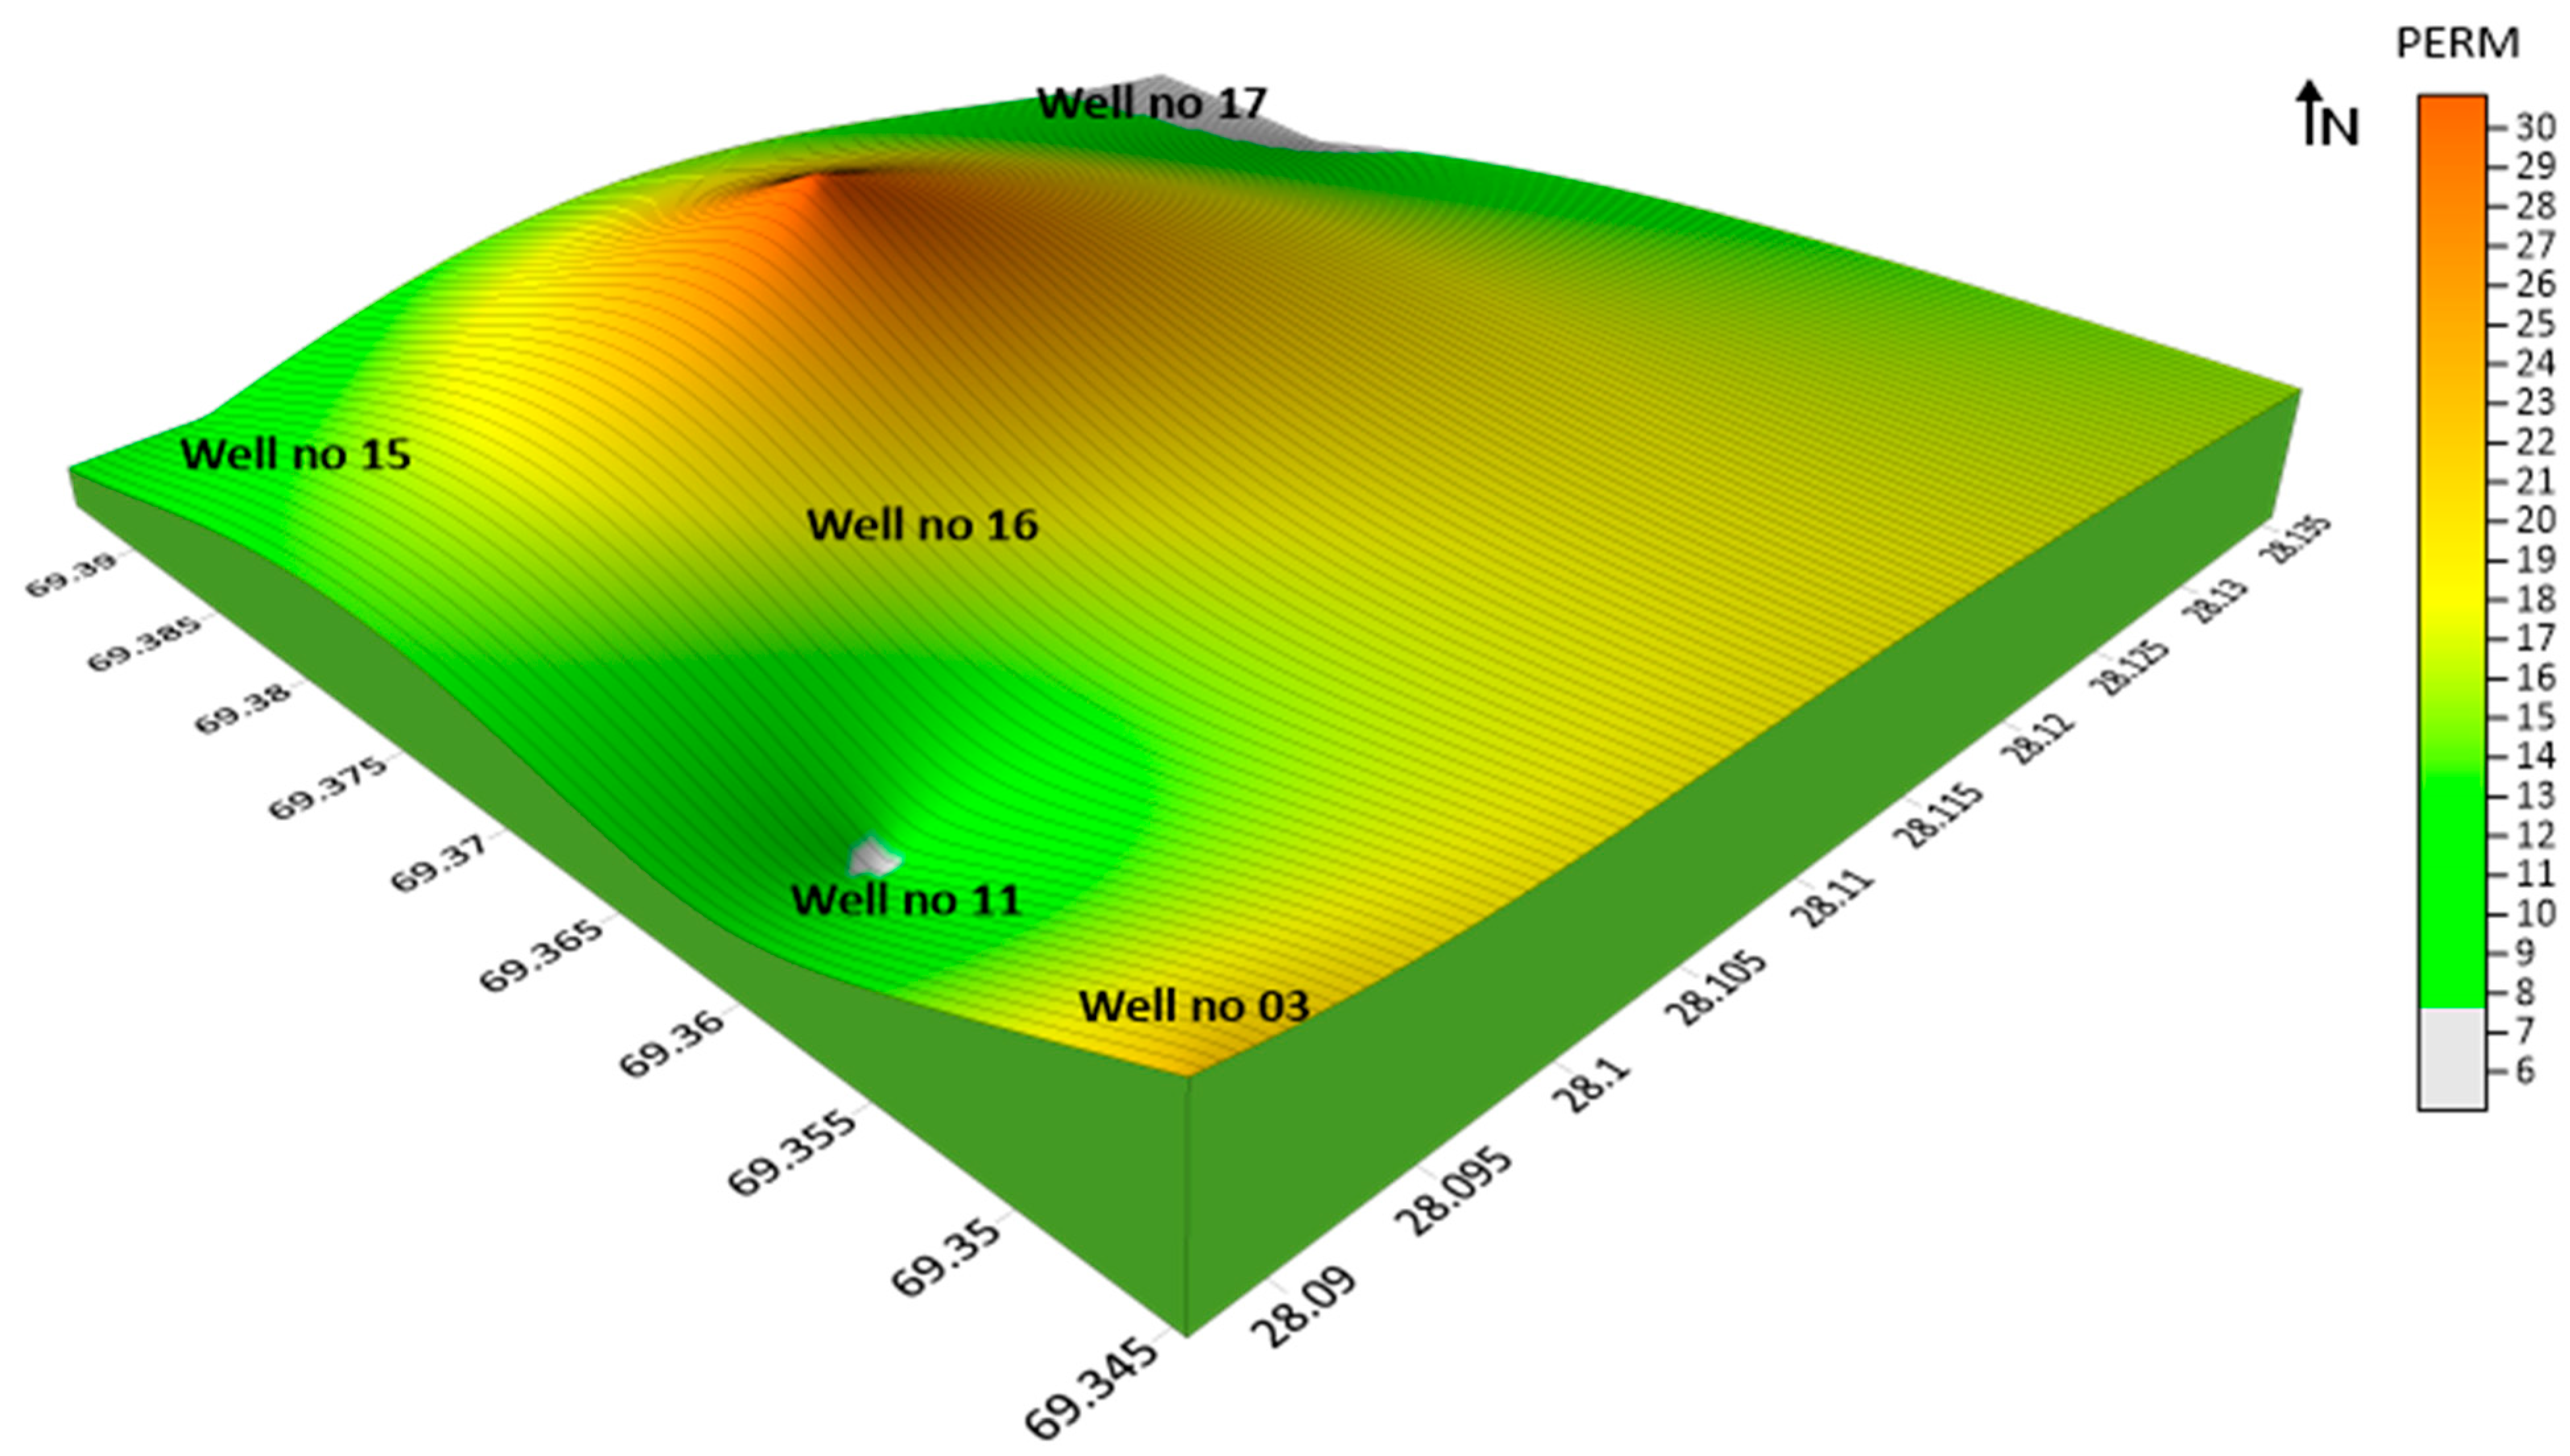
4.5. Spatial Variations

The petrophysical parameters of the Eocene reservoir can be seen in a vertical and horizontal orientation, respectively, using litho-saturation cross-plots with iso-parametersetric visualizations. The horizontal distribution of petrophysical parameters is depicted in Figure 12, Figure 13, Figure 14, Figure 15 and Figure 16, and their vertical distribution is depicted in Figure 17. For contouring and upscaling, a map is shown with mean mathematical data from several wells inside the reservoir interval. The results of the numerical analysis for every conceivable interval are summarized in Table 3. One of the most useful indicators of reservoir quality is the presence or absence of shale, which can be used to separate reservoir rock from other rock types [66]. A lower shale concentration signifies a more sustainable reservoir. According to the projected geographical distribution of shale volume, the smallest amount of shale was found in well QGF-5 (30%), whilst the largest amount was found in well QGF-17 (43%). The shale percentage was particularly low in the northwest and southwest. In contrast, it increased in the southeast and northeast of the study region, as displayed in Figure 12. A deeper examination of the effective porosity distribution map reveals that the reservoir had a higher porosity overall. It varied between 8% and 14% in the QGF-11 and QGF-17 wells, as shown in Figure 14. The analysis demonstrates that Sw values changed between 38% in QGF-15 and 51% in QGF-3. The reservoir’s water level dropped in the northwest and southwest of the research region, whereas it increased in the northeast and the southwest, as indicated by the water saturation map shown in Figure 15. There was a wide variation in the amount of gas accumulation (Sg) in the Eocene reservoir, ranging from 45% at well QGF-16 to 62% at well QGF-16. Considerable Sg closures were found in the northwest and southwest of the studied region, while the rest of the region showed a significant decrease in gas saturation, as shown in Figure 15. There was a wide range in K values between wells, with 5 mD in well QGF-17 and 31 mD in well QGF-16, as shown on the permeability map. The proximity of high permeability was evident on the southwest side of the field, as demonstrated by the permeability map. Permeability was lowest in the north, as shown in Figure 16.

4.6. Cluster Analysis

Results from the cluster analysis indicate that the studied rock sections could be divided into four distinct lithotypes. Table 4 displays the “cluster means” results for every well, which were used to describe individual facies based on the average value of the parent log curves. The results of the cluster evaluation show that log facies 1 and 2 inside the Sui main limestone reservoir represented the most significant areas for the area under investigation. The histograms and cross-plots among the input curves that were created through the use of k means clustering for the different facies’ groups are displayed in Figure 18. Additionally, the log facies feature of reservoir rock types is given in Table 5.

5. Discussion

Wire-line log investigations that rely on previously established formulas and computations, cross-plots, and charts are included in the petrophysical analysis, revealed the hydrocarbon potential outcomes of the Eocene reservoir. Variations in the lithology and existence of shale can be detected using the DIA porosity (PEF/NPHI) cross-plot. Nevertheless, there are a few limitations with the well-log data. Since multiple companies evaluated and analyzed the log curves, numerous charts were employed in this study to estimate several parameters that could have an impact on the accuracy of the findings. Because of this, it is necessary to make a comparison including a tri-porosity (M-N) cross-plot to validate the accuracy of the data. Petrophysical variables confirmed that the Habib Rahi Limestone is a natural gas-bearing reservoir (Table 3). QGF well 03 is a highly productive net pay zone in the upper and lower parts of Habib Rahi Limestone. Although the Sui Upper Limestone in its entirety is not a reservoir, a 210 m-thick section was found with a depth ranging between 1010 and 1220 m containing a significant amount of hydrocarbon (59%), as shown in Table 3. Hydrocarbon-rich strata in the Habib Rahi Limestone were discovered at a depth of 927 to 1145 m and a thickness of 218 m in QGF well 11. (Table 3). The confirmation of gas existence is supported by the gas effect and significant formation resistivity. The zone was characterized by a low shale volume and high effective porosity (8%). The hydrocarbon saturation reached up to 58%. It is suggested that mud filtrate in the flushed zone with movability to the well bore was displaced due to 58% hydrocarbon. With QGF-15, the Sui Main Limestone had low water saturation (38%) reservoir zones ranging from 1734 to 1784 m. The average hydrocarbon saturation reached up to 62% (Table 3). With QGF-16, the Habib Rahi Limestone was the source of the most abundant hydrocarbon-saturated zone with a depth of 900 to 940 m and a thickness of 40 m. This zone included up to 45% hydrocarbon. This zone was validated as a net pay zone by the presence of values of effective porosity (10%), water saturation (55%), and shale volume (30%) (Table 3). The water–gas transition zone could be identified by the absence of a gas effect, as well as a dramatic decrease between the sonic and neutron porosities. Gas–water contact was found at a depth of 940 m. The presence of high shale content in the Sui Upper Limestone was attributed to non-reservoirs, causing diminutive hydrocarbon saturation, as well as poorly effective and total porosities. QGF-17, the key reservoir zone in Habib Rahi Limestone, had a thickness of 85 m (in the rage of 925–1010 m). The net pay zones were marked where the presence of gas was clear from gas effects, high hydrocarbon saturation (54%) and low water saturation (46%), low volume of shale (43%), and high effective porosity (14%), as exhibited in Table 3. The current findings suggest that the Eocene reservoir is a minimal shale volume reservoir, validating the adoption of the Pickett method. The Pickett plot technique provides a constant framework for assessing Archie’s parameters and determining the Sw under these conditions. Unsupervised machine learning was used in the investigation of the QGF in Pakistan in order to classify the various lithotype. The primary findings of this study were found with a simplified technique to categorize the lithotypes in the QGF in Pakistan by utilizing the SOM approach; an assessment of every different classifier of unsupervised learning methods; higher precision outcomes; and an evaluation of log-facies classification grounded on unsupervised learning. The results obtained by the SOM in the lithotype categorization were more reliable. Additionally, the machine learning model accurately predicted lithotype values reflecting changes in rock physical attributes throughout depth zones due to variations in compaction as well as diagenetic mechanisms [11]. The specificity of this finding can fluctuate at deeper intervals in relation to the post-depositional events because of each formation endured; however, the machine learning model has an enormously high performance and efficiently supports geological examinations within a significantly shorter period of time [67]. Most crucially, our research has shown that the efficacy of the SOM could be assessed from both a geological as well as a machine learning aspect. It is common practice that determining the quality of the reservoir rock types is essential for oil and gas firms, considering that these assessments determine the rates of reservoir production. The performance of the zones of interest was evaluated using a hierarchical clustering method to analyze the reservoir rock type (RRT) [68]. The different kinds of rocks represent reservoir formations with a well-defined correlation among effective porosity, deliverability, gas and oil storage capacity, and the volume of a specific water content [69,70]. This method provides an accurate estimation of the total amount of oil present inside the reservoir as well as the amount that can be extracted [71]. Based on the petrophysical characteristics computed and the type of rock that operates as the reservoir, it is clear that there are commercially extractable quantities of hydrocarbons within four linked reservoir limestone units.

6. Conclusions

The Eocene sequence in the Central Indus Basin of the Qadirpur area was studied with the potential of the reservoir using various parameters of petrophysics, and a detailed study for the cut-off factor was performed. The findings and conclusions are mentioned below.
The criteria for estimating the depth of oil and gas deposits were set by the cutoff. The volume of shale, water saturation, permeability, and porosity were approximately 40%, 60%, 0.01 mD, and 3%, respectively. If a rock’s petrophysical properties are less than these threshold values, it is not considered a good reservoir.
The primary goal of the SOM is to classify the reservoir’s underlying lithotype. It is a highly effective technique used for determining the lithology of complex geological structures. This study classifies the reservoir’s lithotype into three groups, each with its unique degree of heterogeneity (limestone, shaly limestone, and shale).
  • In terms of lithology, the reservoir is mainly composed of Sui main limestone with little shale, while in terms of mineralogy, it is made up of calcite, as evidenced by the cross-plot results.
  • The results of the cluster analysis show that the most intriguing parts of the Eocene reservoir for the Sui man limestone are in log facies 1 and 2.
  • The effective thickness of a QGF rises within the northwest and southwest regions of the research area, whereas water saturation increases in the northeast and southwest parts, as a result of spatial variations throughout petrophysical features. Furthermore, the petrophysical information obtained from the QGF provides crucial data on regional geologic variations to facilitate future studies in the research area’s SW and NW onshore blocks.

Author Contributions

M.R.; Conceptualization; Formal analysis; Methodology; Software; Roles/Writing—original draft, M.L.; Funding acquisition; Investigation; Project administration, U.A.; Resources; Supervision; Validation; Writing—review & editing, W.H.; Data curation; Software, N.A.; Formal analysis; Formal analysis; Methodology; Investigation N.R.; Visualization; Data curation, Sartaj Hussain; Data curation, D.A.M.; review & editing, H.V.T.; Grammar checking; review & editing, A.A.; Grammar checking; review & editing. All authors have read and agreed to the published version of the manuscript.

Funding

The work reported in this paper is financially supported by the Provincial Postdoc Funding of the Yunnan Province, No. C615300504013, and Yunnan Provincial Government Leading Scientist Program, No. 2015HA024.

Data Availability Statement

The original data presented in the study are confidential and cannot be made available publicly.

Conflicts of Interest

The authors declare no conflict of interest.

References

  1. Ehsan, M.; Gu, H.; Ali, A.; Akhtar, M.M.; Abbasi, S.S.; Miraj, M.A.F.; Shah, M. An integrated approach to evaluate the unconventional hydrocarbon generation potential of the Lower Goru Formation (Cretaceous) in Southern Lower Indus basin, Pakistan. J. Earth Syst. Sci. 2021, 130, 90. [Google Scholar] [CrossRef]
  2. Hussain, M.; Liu, S.; Ashraf, U.; Ali, M.; Hussain, W.; Ali, N.; Anees, A. Application of machine learning for lithofacies prediction and cluster analysis approach to identify rock type. Energies 2022, 15, 4501. [Google Scholar] [CrossRef]
  3. Milad, M.; Junin, R.; Sidek, A.; Imqam, A.; Tarhuni, M. Huff-n-puff technology for enhanced oil recovery in shale/tight oil reservoirs: Progress, gaps, and perspectives. Energy Fuels 2021, 35, 17279–17333. [Google Scholar] [CrossRef]
  4. Alalimi, A.; AlRassas, A.M.; Vo Thanh, H.; Al-qaness, M.A.; Pan, L.; Ashraf, U.; AL-Alimi, D.; Moharam, S. Developing the efficiency-modeling framework to explore the potential of CO2 storage capacity of S3 reservoir, Tahe oilfield, China. Geomech. Geophys. Geo-Energy Geo-Resour. 2022, 8, 128. [Google Scholar] [CrossRef]
  5. Ashraf, U.; Zhang, H.; Anees, A.; Mangi, H.N.; Ali, M.; Zhang, X.; Imraz, M.; Abbasi, S.S.; Abbas, A.; Ullah, Z. A core logging, machine learning and geostatistical modeling interactive approach for subsurface imaging of lenticular geobodies in a clastic depositional system, SE Pakistan. Nat. Resour. Res. 2021, 30, 2807–2830. [Google Scholar] [CrossRef]
  6. Safaei-Farouji, M.; Thanh, H.V.; Dai, Z.; Mehbodniya, A.; Rahimi, M.; Ashraf, U.; Radwan, A.E. Exploring the power of machine learning to predict carbon dioxide trapping efficiency in saline aquifers for carbon geological storage project. J. Clean. Prod. 2022, 372, 133778. [Google Scholar] [CrossRef]
  7. Thanh, H.V.; Zamanyad, A.; Safaei-Farouji, M.; Ashraf, U.; Hemeng, Z. Application of hybrid artificial intelligent models to predict deliverability of underground natural gas storage sites. Renew. Energy 2022, 200, 169–184. [Google Scholar] [CrossRef]
  8. Graciolli, V.M. A Novel Classification Method Applied to Well Log Data Calibrated by Ontology Based Core Descriptions. Master’s Thesis, Universidade Federal do Rio Grande do Sul, Porto Alegre, Brazil, 2018. [Google Scholar]
  9. Ali, M.; Jiang, R.; Ma, H.; Pan, H.; Abbas, K.; Ashraf, U.; Ullah, J. Machine learning-A novel approach of well logs similarity based on synchronization measures to predict shear sonic logs. J. Pet. Sci. Eng. 2021, 203, 108602. [Google Scholar] [CrossRef]
  10. Jiang, R.; Ji, Z.; Mo, W.; Wang, S.; Zhang, M.; Yin, W.; Wang, Z.; Lin, Y.; Wang, X.; Ashraf, U. A Novel Method of Deep Learning for Shear Velocity Prediction in a Tight Sandstone Reservoir. Energies 2022, 15, 7016. [Google Scholar] [CrossRef]
  11. Shehata, A.A.; Osman, O.A.; Nabawy, B.S. Neural network application to petrophysical and lithofacies analysis based on multi-scale data: An integrated study using conventional well log, core and borehole image data. J. Nat. Gas Sci. Eng. 2021, 93, 104015. [Google Scholar] [CrossRef]
  12. Ali, N.; Chen, J.; Fu, X.; Hussain, W.; Ali, M.; Iqbal, S.M.; Anees, A.; Hussain, M.; Rashid, M.; Thanh, H.V. Classification of reservoir quality using unsupervised machine learning and cluster analysis: Example from Kadanwari gas field, SE Pakistan. Geosystems Geoenvironment 2023, 2, 100123. [Google Scholar] [CrossRef]
  13. Ikotun, A.M.; Ezugwu, A.E.; Abualigah, L.; Abuhaija, B.; Heming, J. K-means Clustering Algorithms: A Comprehensive Review, Variants Analysis, and Advances in the Era of Big Data. Inf. Sci. 2022, 622, 178–210. [Google Scholar] [CrossRef]
  14. Khan, M.; Arif, M.; Ali, N.; Yaseen, M.; Ahmed, A.; Siyar, S.M. Petrophysical parameters and modelling of the Eocene reservoirs in the Qadirpur area, Central Indus Basin, Pakistan: Implications from well log analysis. Arab. J. Geosci. 2016, 9, 425. [Google Scholar] [CrossRef]
  15. Ali, N.; Jamil, S.; Zaheer, M.; Hussain, W.; Hussain, H.; Muhammad Iqbal, S.; Ullah, H. Exploration and development of Shale gas in China: A review. Iran. J. Earth Sci. 2022, 14, 87–103. [Google Scholar]
  16. Muther, T.; Qureshi, H.A.; Syed, F.I.; Aziz, H.; Siyal, A.; Dahaghi, A.K.; Negahban, S. Unconventional hydrocarbon resources: Geological statistics, petrophysical characterization, and field development strategies. J. Pet. Explor. Prod. Technol. 2021, 12, 1463–1488. [Google Scholar] [CrossRef]
  17. Shar, A.M.; Mahesar, A.A.; Abbasi, G.R.; Narejo, A.A.; Hakro, A.A.A.D. Influence of diagenetic features on petrophysical properties of fine-grained rocks of Oligocene strata in the Lower Indus Basin, Pakistan. Open Geosci. 2021, 13, 517–531. [Google Scholar] [CrossRef]
  18. Ali, N.; Fu, X.; Ashraf, U.; Chen, J.; Thanh, H.V.; Anees, A.; Riaz, M.S.; Fida, M.; Hussain, M.A.; Hussain, S. Remote Sensing for Surface Coal Mining and Reclamation Monitoring in the Central Salt Range, Punjab, Pakistan. Sustainability 2022, 14, 9835. [Google Scholar] [CrossRef]
  19. Mahmoud, A.A.; Elkatatny, S.; Abdulraheem, A. Machine Learning Applications in the Petroleum Industry. In Handbook of Energy Transitions; CRC Press: Boca Raton, FL, USA, 2022; pp. 287–304. [Google Scholar]
  20. Ashraf, U.; Zhang, H.; Anees, A.; Ali, M.; Zhang, X.; Shakeel Abbasi, S.; Nasir Mangi, H. Controls on reservoir heterogeneity of a shallow-marine reservoir in Sawan Gas Field, SE Pakistan: Implications for reservoir quality prediction using acoustic impedance inversion. Water 2020, 12, 2972. [Google Scholar] [CrossRef]
  21. Bashir, Y.; Faisal, M.A.; Biswas, A.; Ali, S.H.; Imran, Q.S.; Siddiqui, N.A.; Ehsan, M. Seismic expression of miocene carbonate platform and reservoir characterization through geophysical approach: Application in central Luconia, offshore Malaysia. J. Pet. Explor. Prod. 2021, 11, 1533–1544. [Google Scholar] [CrossRef]
  22. Khalil Khan, H.; Ehsan, M.; Ali, A.; Amer, M.A.; Aziz, H.; Khan, A.; Bashir, Y.; Abu-Alam, T.; Abioui, M. Source rock geochemical assessment and estimation of TOC using well logs and geochemical data of Talhar Shale, Southern Indus Basin, Pakistan. Front. Earth Sci. 2022, 10, 1593. [Google Scholar] [CrossRef]
  23. Gozel, M.E.; Uysal, S.; Ayan, C.; Yuce, U.; Ozturk, E.; Gune, H.K.; Yilmaz, I.S.; Oymael, M.; Eswein, E. Acid Fracturing Experience In Naturally Fractured–Heavy Oil Reservoir, Bati Raman Field. In Proceedings of the SPE Annual Technical Conference and Exhibition, Dubai, United Arab Emirates, 21–23 September 2021. [Google Scholar]
  24. Yao, Y.; Sun, X.; Zheng, S.; Wu, H.; Zhang, C.; Liu, Y.; Chang, Y. Methods for petrological and petrophysical characterization of gas shales. Energy Fuels 2021, 35, 11061–11088. [Google Scholar] [CrossRef]
  25. Tamaki, M.; Fujimoto, A.; Boswell, R.; Collett, T.S. Geological reservoir characterization of a gas hydrate prospect associated with the Hydrate-01 stratigraphic test well, Alaska North Slope. Energy Fuels 2022, 36, 8128–8149. [Google Scholar] [CrossRef]
  26. Ullah, S.; Jan, I.U.; Hanif, M.; Latif, K.; Mohibullah, M.; Sabba, M.; Anees, A.; Ashraf, U.; Vo Thanh, H. Paleoenvironmental and bio-sequence stratigraphic analysis of the cretaceous pelagic carbonates of eastern tethys, sulaiman range, Pakistan. Minerals 2022, 12, 946. [Google Scholar] [CrossRef]
  27. Ali, N.; Chen, J.; Fu, X.; Hussain, W.; Ali, M.; Hussain, M.; Anees, A.; Rashid, M.; Thanh, H.V. Prediction of Cretaceous reservoir zone through petrophysical modeling: Insights from Kadanwari gas field, Middle Indus Basin. Geosystems Geoenvironment 2022, 1, 100058. [Google Scholar] [CrossRef]
  28. Wang, E.; Feng, Y.; Guo, T.; Li, M. Oil content and resource quality evaluation methods for lacustrine shale: A review and a novel three-dimensional quality evaluation model. Earth-Sci. Rev. 2022, 232, 104134. [Google Scholar] [CrossRef]
  29. Ali, J.; Ashraf, U.; Anees, A.; Peng, S.; Umar, M.U.; Vo Thanh, H.; Khan, U.; Abioui, M.; Mangi, H.N.; Ali, M. Hydrocarbon potential assessment of carbonate-bearing sediments in a meyal oil field, Pakistan: Insights from logging data using machine learning and quanti elan modeling. ACS Omega 2022, 7, 39375–39395. [Google Scholar] [CrossRef]
  30. Talib, M.; Durrani, M.Z.A.; Palekar, A.H.; Sarosh, B.; Rahman, S.A. Quantitative characterization of unconventional (tight) hydrocarbon reservoir by integrating rock physics analysis and seismic inversion: A case study from the Lower Indus Basin of Pakistan. Acta Geophys. 2022, 70, 2715–2731. [Google Scholar] [CrossRef]
  31. Durrani, M.Z.A.; Talib, M.; Ali, A.; Sarosh, B.; Naseem, N. Characterization and probabilistic estimation of tight carbonate reservoir properties using quantitative geophysical approach: A case study from a mature gas field in the Middle Indus Basin of Pakistan. J. Pet. Explor. Prod. Technol. 2020, 10, 2785–2804. [Google Scholar] [CrossRef]
  32. Malkani, M.S.; Mahmood, Z. Revised stratigraphy of Pakistan. Geol. Surv. Pak. Rec. 2016, 127, 1–87. [Google Scholar]
  33. Tainsh, H.; Stringer, K.; Azad, J. Major gas fields of West Pakistan. AAPG Bull. 1959, 43, 2675–2700. [Google Scholar]
  34. Dar, Q.U.; Pu, R.; Baiyegunhi, C.; Shabeer, G.; Ali, R.I.; Ashraf, U.; Sajid, Z.; Mehmood, M. The impact of diagenesis on the reservoir quality of the early Cretaceous Lower Goru sandstones in the Lower Indus Basin, Pakistan. J. Pet. Explor. Prod. Technol. 2022, 12, 1437–1452. [Google Scholar] [CrossRef]
  35. Jadoon, S.-U.-R.K.; Lin, D.; Ehsan, S.A.; Jadoon, I.A.; Idrees, M. Structural styles, hydrocarbon prospects, and potential of Miano and Kadanwari fields, Central Indus Basin, Pakistan. Arab. J. Geosci. 2020, 13, 97. [Google Scholar] [CrossRef]
  36. Khan, M.; Abdelmaksoud, A. Unfolding impacts of freaky tectonics on sedimentary sequences along passive margins: Pioneer findings from western Indian continental margin (Offshore Indus Basin). Mar. Pet. Geol. 2020, 119, 104499. [Google Scholar] [CrossRef]
  37. Naseer, M.T.; Radwan, A.E.; Naseem, S. Seismic attributes and static reservoir simulation applications for imaging the thin-bedded stratigraphic systems: A case study of the Lower-Cretaceous Lower Goru fluvial resources, Pakistan. J. Asian Earth Sci. 2022, 240, 105409. [Google Scholar] [CrossRef]
  38. Qureshi, M.A.; Ghazi, S.; Riaz, M.; Ahmad, S. Geo-seismic model for petroleum plays an assessment of the Zamzama area, Southern Indus Basin, Pakistan. J. Pet. Explor. Prod. 2021, 11, 33–44. [Google Scholar] [CrossRef]
  39. Maqsood, T.; Kelly, J.; Ahmad, S.; Ahsan, N.; Tahir, R. Speculative Tectonic Model and Hydrocarbon Play System in Outer Himalyian Foldbelt of Kashmir. In Proceedings of the SPE Annual Technical Conference, Islamabad, Pakistan, 25–26 November 2014. [Google Scholar]
  40. GHAZI, J.M.; Moazzen, M. Geodynamic evolution of the Sanandaj-Sirjan zone, Zagros orogen, Iran. Turk. J. Earth Sci. 2015, 24, 513–528. [Google Scholar] [CrossRef]
  41. Shahzad, K.; Betzler, C.; Ahmed, N.; Qayyum, F.; Spezzaferri, S.; Qadir, A. Growth and demise of a Paleogene isolated carbonate platform of the Offshore Indus Basin, Pakistan: Effects of regional and local controlling factors. Int. J. Earth Sci. 2018, 107, 481–504. [Google Scholar] [CrossRef]
  42. Kassi, A.M.; Kelling, G.; Kasi, A.K.; Umar, M.; Khan, A.S. Contrasting Late Cretaceous–Palaeocene lithostratigraphic successions across the Bibai Thrust, western Sulaiman Fold–Thrust Belt, Pakistan: Their significance in deciphering the early-collisional history of the NW Indian Plate margin. J. Asian Earth Sci. 2009, 35, 435–444. [Google Scholar] [CrossRef]
  43. Iqbal, M.; Khan, M.R. Impact of Indo-Pakistan and Eurasian Plates Collision in the Sulaiman Fold Belt, Pakistan. Search Discov. Artic. 2012, 2012, 50575. [Google Scholar]
  44. Aziz, E.A.; Gomaa, M.M. Petrophysical analysis of well logs and core samples for reservoir evaluation: A case study of southern Issaran Field, Gulf of Suez province, Egypt. Environ. Earth Sci. 2022, 81, 341. [Google Scholar] [CrossRef]
  45. Abdolahi, A.; Chehrazi, A.; Kadkhodaie, A.; Seyedali, S. Identification and modeling of the hydrocarbon-bearing Ghar sand using seismic attributes, wireline logs and core information, a case study on Asmari Formation in Hendijan Field, southwest part of Iran. Model. Earth Syst. Environ. 2022, 1–18. [Google Scholar] [CrossRef]
  46. Ong, D.E.L.; Barla, M.; Cheng, J.W.-C.; Choo, C.S.; Sun, M.; Peerun, M.I. Investigation Techniques: Pipe Jacking in Complex Geology. In Sustainable Pipe Jacking Technology in the Urban Environment; Springer: Berlin/Heidelberg, Germany, 2022; pp. 7–41. [Google Scholar]
  47. Hussain, W.; Ali, N.; Sadaf, R.; Hu, C.; Nykilla, E.E.; Ullah, A.; Iqbal, S.M.; Hussain, A.; Hussain, S. Petrophysical analysis and hydrocarbon potential of the lower Cretaceous Yageliemu Formation in Yakela gas condensate field, Kuqa Depression of Tarim Basin, China. Geosystems Geoenvironment 2022, 1, 100106. [Google Scholar] [CrossRef]
  48. Wang, S.; Wang, G.; Huang, L.; Song, L.; Zhang, Y.; Li, D.; Huang, Y. Logging evaluation of lamina structure and reservoir quality in shale oil reservoir of Fengcheng Formation in Mahu Sag, China. Mar. Pet. Geol. 2021, 133, 105299. [Google Scholar] [CrossRef]
  49. Zhu, L.-Q.; Sun, J.; Zhou, X.-Q.; Li, Q.-P.; Fan, Q.; Wu, S.-L.; Wu, S.-G. Well logging evaluation of fine-grained hydrate-bearing sediment reservoirs: Considering the effect of clay content. Pet. Sci. 2022. [Google Scholar] [CrossRef]
  50. Pan, B.; Wang, X.; Guo, Y.; Zhang, L.; Ruhan, A.; Zhang, N.; Zhang, P.; Li, Y. Study on reservoir characteristics and evaluation methods of altered igneous reservoirs in Songliao Basin, China. J. Pet. Sci. Eng. 2022, 212, 110266. [Google Scholar] [CrossRef]
  51. Hossain, S.; Junayed, T.R.; Haque, A. Rock physics diagnostics and modelling of the Mangahewa Formation of the Maui B gas field, Taranaki Basin, offshore New Zealand. Arab. J. Geosci. 2022, 15, 1177. [Google Scholar] [CrossRef]
  52. Shahrina, R.J.R.K.; Sideka, A.; Agia, A.; Junina, R.; Jaafara, M.Z.; Ariffinc, H. Comparison of Water Saturation Models Based on Well Logging Data: A Case Study of MX Field in Malay Basin. J. Kejuruter. 2022, 34, 101–108. [Google Scholar] [CrossRef]
  53. Daniel, D. Machine Learning for Pay Zone Identification in the Smørbukk Field Using Well Logs and XRF Data. Master’s Thesis, University of Stavanger, Stavanger, Norway, 2022. [Google Scholar]
  54. Ding, W.; Ming, Y.; Wang, Y.-K.; Lin, C.-T. Memory augmented convolutional neural network and its application in bioimages. Neurocomputing 2021, 466, 128–138. [Google Scholar] [CrossRef]
  55. Ezugwu, A.E.; Ikotun, A.M.; Oyelade, O.O.; Abualigah, L.; Agushaka, J.O.; Eke, C.I.; Akinyelu, A.A. A comprehensive survey of clustering algorithms: State-of-the-art machine learning applications, taxonomy, challenges, and future research prospects. Eng. Appl. Artif. Intell. 2022, 110, 104743. [Google Scholar] [CrossRef]
  56. Bakke, D. Different Strokes for Different Folks: Patient-Specific Gait Modelling and Post-Stroke Rehabilitation; ResearchSpace: Auckland, New Zealand, 2022. [Google Scholar]
  57. Sarker, I.H. Deep learning: A comprehensive overview on techniques, taxonomy, applications and research directions. SN Comput. Sci. 2021, 2, 420. [Google Scholar] [CrossRef]
  58. Zi, K.; Wang, S.; Liu, Y.; Li, J.; Cao, Y.; Cao, C. SOM-NCSCM: An Efficient Neural Chinese Sentence Compression Model Enhanced with Self-Organizing Map. In Proceedings of the 2021 Conference on Empirical Methods in Natural Language Processing, Punta Cana, Dominican Republic, 7–11 November 2021; pp. 403–415. [Google Scholar]
  59. Aliashrafi, A.; Zhang, Y.; Groenewegen, H.; Peleato, N.M. A review of data-driven modelling in drinking water treatment. Rev. Environ. Sci. Bio/Technol. 2021, 20, 985–1009. [Google Scholar] [CrossRef]
  60. Sarkar, S.; Ejaz, N.; Maiti, J.; Pramanik, A. An integrated approach using growing self-organizing map-based genetic K-means clustering and tolerance rough set in occupational risk analysis. Neural Comput. Appl. 2022, 34, 9661–9687. [Google Scholar] [CrossRef]
  61. Gawehn, E. Leveraging Self-Organizing Maps with Convolutional Neural Networks for Virtual Chemical Library Screening; ETH: Zurich, Switzerland, 2022. [Google Scholar]
  62. Kohonen, T. Self-organizing maps: Ophmization approaches. In Artificial Neural Networks; Elsevier: Amsterdam, The Netherlands, 1991; pp. 981–990. [Google Scholar]
  63. You, L.; Jiang, H.; Hu, J.; Chang, C.H.; Chen, L.; Cui, X.; Zhao, M. GPU-accelerated Faster Mean Shift with euclidean distance metrics. In Proceedings of the 2022 IEEE 46th Annual Computers, Software, and Applications Conference (COMPSAC), Los Alamitos, CA, USA, 27 June–1 July 2022; pp. 211–216. [Google Scholar]
  64. Saha, S.; Vishal, V. Rock strength estimation from petrophysical logs through core data calibration in low porosity and low permeability carbonate rocks. In Handbook of Petroleum Geoscience: Exploration, Characterization, and Exploitation of Hydrocarbon Reservoirs; John Wiley & Sons: Hoboken, NJ, USA, 2022; p. 137. [Google Scholar]
  65. Ashraf, U.; Zhang, H.; Anees, A.; Nasir Mangi, H.; Ali, M.; Ullah, Z.; Zhang, X. Application of unconventional seismic attributes and unsupervised machine learning for the identification of fault and fracture network. Appl. Sci. 2020, 10, 3864. [Google Scholar] [CrossRef]
  66. Fea, I.; Abioui, M.; Nabawy, B.S.; Jain, S.; Bruno, D.Z.; Kassem, A.A.; Benssaou, M. Reservoir quality discrimination of the Albian-Cenomanian reservoir sequences in the Ivorian basin: A lithological and petrophysical study. Geomech. Geophys. Geo-Energy Geo-Resour. 2022, 8, 1. [Google Scholar] [CrossRef]
  67. Freund, Y. Boosting a weak learning algorithm by majority. Inf. Comput. 1995, 121, 256–285. [Google Scholar] [CrossRef] [Green Version]
  68. Ali, M.; Ma, H.; Pan, H.; Ashraf, U.; Jiang, R. Building a rock physics model for the formation evaluation of the Lower Goru sand reservoir of the Southern Indus Basin in Pakistan. J. Pet. Sci. Eng. 2020, 194, 107461. [Google Scholar] [CrossRef]
  69. Al-Jawad, S.N.; Saleh, A.H. Flow units and rock type for reservoir characterization in carbonate reservoir: Case study, south of Iraq. J. Pet. Explor. Prod. Technol. 2020, 10, 1–20. [Google Scholar] [CrossRef] [Green Version]
  70. Looker, A.C.; Dallman, P.R.; Carroll, M.D.; Gunter, E.W.; Johnson, C.L. Prevalence of iron deficiency in the United States. JAMA 1997, 277, 973–976. [Google Scholar] [CrossRef]
  71. Ahr, W.M.; Allen, D.; Boyd, A.; Bachman, H.N.; Smithson, T.; Clerke, E.; Gzara, K.; Hassall, J.; Murty, C.; Zubari, H. Confronting the carbonate conundrum. Oilfield Rev. 2005, 17, 18–29. [Google Scholar]
Figure 1. Location map of the Qadirpur gas field (QGF).
Minerals 13 00029 g001
Figure 2. Stratigraphic chart of the QGF.
Minerals 13 00029 g002
Figure 3. Tectonic map of the QGF.
Minerals 13 00029 g003
Figure 4. Lithosaturation mapping of the QGF well 03 reservoir zones within the study area.
Minerals 13 00029 g004
Figure 5. QGF well 03 PEF via RHOB cross-plot of reservoir zone.
Minerals 13 00029 g005
Figure 6. QGF well 03 M and N cross-plot of reservoir zones.
Minerals 13 00029 g006
Figure 7. Calibrated SOM QGF well 03 outputs with corresponding color indices highlighting individual log impacts.
Minerals 13 00029 g007
Figure 8. Well 03 SOM facies vertical dispersions inside the zone of interest.
Minerals 13 00029 g008
Figure 9. QGF well 03 Pickett plot of Φeff via LLDs with a gamma-ray response. API—American Petroleum Institute.
Minerals 13 00029 g009
Figure 10. QGF well 03 Buckles plot.
Minerals 13 00029 g010
Figure 11. QGF well 03. (a) Shale concentration versus effective porosity; (b) effective porosity versus water saturation; and (c) effective porosity versus permeability cross-plot, with gamma-ray scales for cutoff determination.
Minerals 13 00029 g011
Figure 12. QGF volume of shale (Vsh) variation map computed in (%).
Minerals 13 00029 g012
Figure 13. Porosity (POR) variation map computed in (%).
Minerals 13 00029 g013
Figure 14. Water saturation (Sw) variation map computed in (%).
Minerals 13 00029 g014
Figure 15. Gas saturation (Sg) variation map computed in (%).
Minerals 13 00029 g015
Figure 16. Permeability (PERM) variation map computed in (%).
Minerals 13 00029 g016
Figure 17. QGF well correlation.
Minerals 13 00029 g017
Figure 18. QGF-well 03 cluster analysis depicting the final result.
Minerals 13 00029 g018
Table 1. The data obtained within geophysical logs.
Well LogsSignsPhysical FeaturesQGF-03
(Depth, m)
QGF-11
(Depth, m)
QGF-15
(Depth, m)
QGF-16
(Depth, m)
QGF-17
(Depth, m)
Bulk densityRHOBDensity836–1342860–14081653–1786837–1382693–1401
Deep resistivityLLDUninvaded zone resistivity831–1342393–14031653–1783387–1377357–1396
PhotoelectricPEFPhotoelectric effect688–1399860–14081537–1791837–1382693–1402
SonicDTCompressional slowness394–1342390–14071630–1790380–1380372–1405
Shallow resistivityLLSInvaded zone resistivity830–1344389–14021653–1786386–1377357–1390
Self-potentialSPNatural log831–1322389–14031660–1790386–1377357–1400
Gamma rayGRRadioactivity381–1346388–14031537–1791380–1390357–1400
Neutron porosityNPHIPorosity836–1340860–14081537–1791837–1382693–1378
Table 2. Archie parameters for the QGF.
Well IDamnRw
Qadirpur-0311.920.007
Qadirpur-1111.920.007
Qadirpur-1511.920.007
Qadirpur-1611.920.007
Qadirpur-1711.920.007
Table 3. A brief synopsis of the petrophysical characteristics of the Qadirpur gas field.
S.
No.Well
Proposed Zone
Top Bottom
Thickness
(m)
Φeff
%
K
mD
Vsh
%
Sw
%
Sg
%
Qadirpur-31010   12202101222395149
Qadirpur-11927   114521887354258
Qadirpur-151734   17845098303862
Qadirpur-16900   940401011375545
Qadirpur-17925   101085145434654
Table 4. Outcomes of the cluster analysis for every type of rock.
K-Mean Clustering Results
FaciesPointsRock TypingGR MeanΦeff MeanPerm MeanSw Mean
1137Excellent-quality rock type58.8730.0564138.4740.52641
216Good-quality rock type86.530.008330.374590.3541
341Moderate-quality rock type90.9670.14072637.820.30895
4109Poor-quality rock type92.270.08073134.890.53928
Table 5. Detailed description of the features of log facies.
S. NoRock TypingGR ΦeffPermSw
Facies-01Excellent-quality rock typeVery lowGood to excellentGood to excellentVery low
Facies-02Good-quality rock typeLowGoodgoodlow
Facies-03Moderate-quality rock typeMediumFair to goodFair to goodMedium
Facies-04Poor-quality rock typeHighLowLowVery high
Disclaimer/Publisher’s Note: The statements, opinions and data contained in all publications are solely those of the individual author(s) and contributor(s) and not of MDPI and/or the editor(s). MDPI and/or the editor(s) disclaim responsibility for any injury to people or property resulting from any ideas, methods, instructions or products referred to in the content.

