Article

Involvement of Soil Microorganisms in C, N and P Transformations and Phytotoxicity in Soil from Post-Industrial Areas Treated with Chemical Industry Waste

by
Edyta Kwiatkowska
1,
Jolanta Joniec
1,* and
Cezary A. Kwiatkowski
2
1
Department of Environmental Microbiology, Faculty of Agrobioengineering, University of Life Sciences in Lublin, Leszczyńskiego 7, 20-069 Lublin, Poland
2
Department of Herbology and Plant Cultivation Techniques, Faculty of Agrobioengineering, University of Life Sciences in Lublin, Akademicka 13, 20-950 Lublin, Poland
*
Author to whom correspondence should be addressed.
Minerals 2023, 13(1), 12; https://doi.org/10.3390/min13010012
Submission received: 26 November 2022 / Revised: 18 December 2022 / Accepted: 19 December 2022 / Published: 22 December 2022

Abstract

:
Soil degradation is an unavoidable phenomenon that poses a real threat, as it limits soil utility and reduces its resources. Early assessment of soil degradation can prevent its further deterioration. Various parameters of soil microbial activity may be helpful in this evaluation. Therefore, the purpose of the study was to assess the usefulness of microbiological (total abundance of oligotrophic bacteria and filamentous fungi), biochemical (soil respiration) and enzymatic (dehydrogenase, protease, acid and alkaline phosphatase activity and fluorescein hydrolytic activity) indicators, as well as phytotoxicity, in monitoring the condition of chemically degraded soils due to severe alkalization. The experimental material was soil collected in three sites located at different distances from the reservoir with liquid post-production waste. The analyzed indicators were correlated with the physical and chemical properties of the soil in three variants at the level of sampling sites, soil profile and seasonal variability. All analyzed parameters showed significant changes in the level of their activity at individual sampling sites. The location closest to the waste reservoir was characterized by the lowest values of the discussed activities and the highest phytotoxicity. Individual activities also showed changes depending on the season and soil layer. Considering the usefulness in monitoring changes in soils exposed to chemical degradation, total bacterial and fungal counts, as well as acid and alkaline phosphatase activities and fluorescein hydrolytic activity proved to be the most sensitive indicators.

1. Introduction

In addition to water and air, soil quality has a huge impact on the natural environment. It is defined as “the ability of the soil to function within the boundaries of the ecosystem and land use to maintain biological productivity, environmental quality, as well as plant and animal health” [1]. However, the soil is at the same time extremely vulnerable and exposed to a number of hazards due to both rapidly advancing climate change and intensive human activity [2,3]. All processes and activities causing deterioration of the chemical, physical and biological properties of the pedosphere are referred to as soil degradation. It leads to reduced soil productivity and thus to a decrease in other ecosystem functions [4,5].
Soil degradation is a worldwide phenomenon. According to the FAO, 33% of the Earth’s soils are already degraded, and more than 90% could be degraded by 2050. Every 5 s, soil the size of a football field is being degraded. In contrast, it can take up to 1000 years to produce just 2–3 cm of soil. The highest percentage of areas at risk of degradation or already destroyed are located in Europe (15.2%), Africa (10.7%) and Asia (10.4%) [6,7].
The causes of soil degradation are complex and diverse. They range from biophysical, i.e., land use, cropping system, agricultural practices, deforestation, to socio-economic (institutions, markets, poverty) and political (politics, political instability, conflicts) [8]. Soil degradation is most often characterized in terms of three closely related aspects: physical, biological and chemical. Physical degradation includes water erosion and landslides. It involves the displacement and/or repositioning of soil particles without changing their chemical composition. Biological degradation concerns, among others, a decrease in the quantity and quality of soil organic matter (SOM), as well as reduced biodiversity of soil organisms, both macrofauna and microflora [9,10].
Chemical degradation is closely related to the first two types. According to Richmond [11], this type of degradation is the most common form, second to erosion. It is a common form of both diffuse and point pollution that affect biotic and abiotic soil functions, crop quality, and animal and human health [9,11]. It is mainly associated with pollutants, e.g., heavy metals, toxic organic compounds, municipal or industrial waste, spills of toxic substances, but also excessive use of organic fertilizers, herbicides and insecticides. This, in turn, leads to high salt concentrations in soil solutions, disruption of the soil ionic balance, as well as its acidification or excessive alkalization [9,10]. Among the many aspects associated with this type of degradation, acidification or alkalization of the soil environment is one of the most important. Soil pH determines the fate of substances in the soil environment, influences countless biological, chemical and physical properties of the soil, and processes that affect microbial activity, plant growth and biomass yield [12]. Some micronutrients are more available in acidic conditions, while others in alkaline environments. Development of strongly acidic soils (below 5.5 pH) can result in poor plant growth. Alkaline soils, on the other hand, are characterized by reduced availability of phosphorus and micronutrients, which also negatively affect plants [13]. Soils with extremely alkaline pH (>9) are likely to have high sodium levels.
Soil degradation is an inevitable phenomenon that poses a real threat to the implementation of the vision of the 17 United Nations’ Sustainable Development Goals [9]. Therefore, efforts should be made to mitigate hazards to soil function caused by degradation and thus to agricultural productivity and socio-ecological sustainability. Early assessment of soil degradation can help identify various socio-economic and biophysical causes and prevent its further deterioration [14]. Various parameters of soil microbial activity are helpful in assessing the condition of the soil environment subjected to various types of human pressure. The most commonly used indicators are the number and diversity of microorganisms and biochemical and enzymatic activity [15,16,17,18,19].
The soil microbiome is an essential component of the soil ecosystem, responsible for most biological activity in the pedosphere. Microorganisms are closely linked to organic matter decomposition, mineral release, nutrient cycling or carbon sequestration, thereby determining the stability and resistance of ecosystems [20,21,22]. The composition and diversity of microbial communities depends on various factors, such as changes in soil acidity [23,24] or depth of the soil profile [22]. According to Shi et al. [24] and Wang et al. [25], soil pH is an important selector of the biodiversity of soil bacterial and fungal populations. In the case of the soil profile, it is entirely colonized by microorganisms, but their composition and diversity vary between individual soil layers [22]. The sensitivity of heterotrophic soil microorganisms to changes in the properties of the soil environment meant that the number of bacteria and fungi was repeatedly used to monitor changes in soils subjected to various anthropopressures [18,19,26]. An important indicator of soil biological activity, besides abundance, is the intensity of biochemical processes and the content of products of soil microorganism activity, such as N-NO3, N-NH4 or CO2. Respiratory activity is considered a good indicator of changes occurring in the soil environment [27,28]. Since about 90% of CO2 emitted from the soil is of microbial origin, the remainder is the effect of plant respiratory processes and decomposition of organic compounds, brought into the soil with the roots [29].
Enzyme activity is closely related to the soil microbiome and thus is considered a good indicator of soil quality due to these relationships, ease of measurement, and rapid reflection of changes caused by soil use [30,31]. Enzymes are involved in many biogeochemical cycles (in the carbon cycle—dehydrogenase, nitrogen cycle—proteases, phosphorus cycle—phosphatases) [32]. In addition, hydrolysis of fluorescein diacetate (FDA) is used to measure the total microbial activity in the soil. Fluorescein diacetate hydrolysis assessment is proposed as a prospective method for determining total microbial activity, as it covers several classes of enzymes including lipases, esterases and proteases. The spectrophotometric determination of fluorescein diacetate (FDA) hydrolysis has been shown to be a simple, sensitive and rapid method for determining soil microbial activity [33].
Monitoring these properties seems justified, because soils with greater microbial diversity and biochemical and enzymatic activity are characterized by higher resistance to environmental changes [30,32]. Although soils undergoing severe degradation are generally characterized by lower diversity and activity, they also constitute locations where populations of exthermophilic microorganisms can emerge [34]. Microorganisms obtained from such environments can subsequently be used in the composition of biopreparations applied in bioremediation [35,36]. Therefore, studies were conducted to assess the abundance, as well as biochemical and enzymatic activity of soil bacteria and fungi in soil from post-industrial areas subjected to strong alkalization. Due to the important role played by soil microorganisms in the health condition of soils and plants, research on the activity and abundance of the microbiome and mycobiome was combined with studies on the phytotoxicity of this environment, determining the impact of existing conditions on the development of plants at the initial stage, i.e., germination and seedling root growth.
The authors formulated two research hypotheses: the first assumed that the analyzed indicators of soil microbial activity and phytotoxicity would be suitable for monitoring the condition of chemically degraded soils due to strong alkalization; the second assumed that the alkalization of the environment would cause changes in the activity of microorganisms not only in the upper layer, but also in the lower one, and they would persist in the soil even at a great distance from the pollution emitter.

2. Materials and Methods

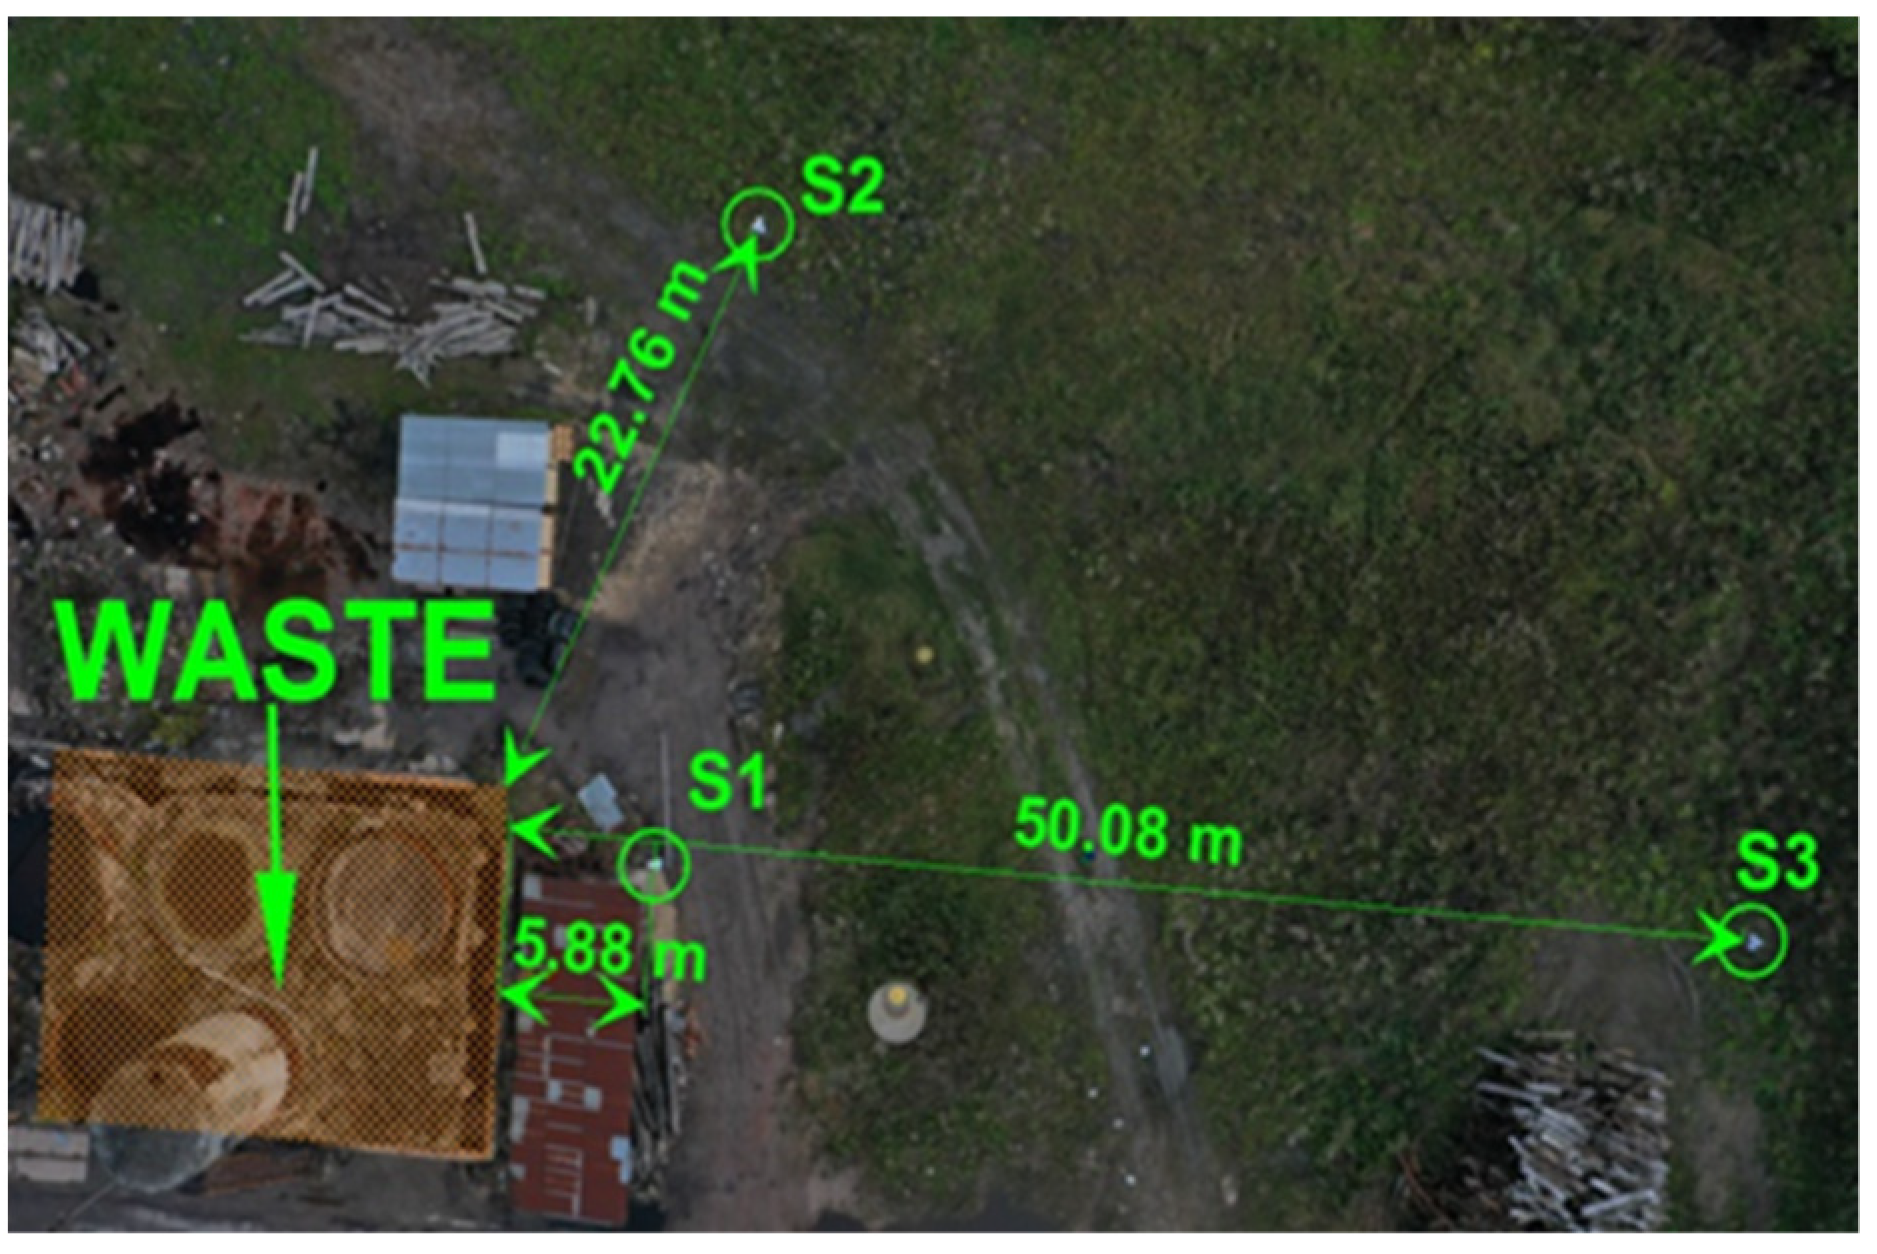
2.1. Description of the Research Area

The soil material was derived from a post-industrial area located in the Mazowieckie region in central-eastern Poland (51°28′54″ N, 21°27′01″ E). The climate of this region is transitional between maritime and continental. The average annual air temperature is 10–11 °C; the sum of average annual precipitation varies between 650 and 750 mm. Soil samples were collected from three locations at different distances from the reservoir with liquid post-production waste, i.e., sodium hydroxide (Scheme 1).
Site S1 was 5.88 m away from the liquid tailings tanks, site S2 was 22.7 m away, and site S3 was 50.08 m away. The sampling sites did not run along a single line, which helped to analyze whether possible soil contamination spread in the environment in one direction or evenly in all directions. The liquid was contained in sealed tanks placed in a concrete reservoir, which was originally intended as a secondary protection against possible leaching of the liquid into the soil. The liquid waste was a remnant from chemical industry activity related, among others, to the production of cellulose and adhesives. The tanks were set up in the 1970s. The characteristics of the liquid waste are listed in Table 1.

2.2. Sampling Description

Soil samples for analysis were collected in the summer (2 July) and autumn (27 September) of 2022 from depths of 0–20 and 20–40 cm. The material was randomly collected from 4 locations within each of the three collection sites, i.e., S1, S2 and S3, separately for individual layers. Soil samples were collected using a cylindrical sampler with a diameter of 4 cm and transferred to plastic bags. The collected material was then sieved through a 2 mm mesh to remove any roots, gravel and other fragments. The samples were stored in plastic containers at +4 °C.

2.3. Characteristics of Soil Chemical Properties

The chemical and physical properties of the soil (Table 2) were analyzed as a supplement to the microbiological, biochemical, enzymatic and phytotoxicity tests. The pH of the soil extract in KCl (10 g of soil in 25 mL of KCl) was determined electrometrically. Soil moisture was determined using the gravimetric method. IR spectrometry was used to determine organic carbon (TOC). Total nitrogen (TN) was determined by the Kjeldahl method.

2.4. Microbiological Analyses

According to the procedure described by Foght and Aislabie [37], the count of oligotrophic bacteria and filamentous fungi was determined using the plate method. Bacterial counts were determined on soil extract medium and K2HPO4, while fungal counts were determined on Martin’s medium with antibiotics [38]. Cultures were carried out for bacteria at 28 °C for 4 days, and for fungi at 25 °C for 3 days. The analyses were performed in triplicate, and the results are given as colony-forming units (CFU) per gram of dry matter.

2.5. Biochemical Analyses

The method of Rühling and Tyler [39] was used to determine soil respiratory activity. In the presence of 0.2 M NaOH solution, 20 g of soil sample with 1% glucose was incubated for 24 h. After incubation, excess unbound sodium hydroxide was titrated with 0.1 M HCl in the presence of BaCl2 and phenolphthalein.

2.6. Enzymatic Analyses

Dehydrogenase activity was determined by the method of Thalmanna [40]. Soil samples (5 g) were incubated for 48 h at 30 °C in the presence of 0.1 M tris(hydroxymethyl) aminomethane buffer (Tris-HCl pH 7.4). 2,3,5-triphenyltetrazolium chloride was used as a substrate. Enzyme activity was determined colorimetrically (λ = 485 nm) by measuring the extinction of the produced TPF (triphenylformazan). Protease activity was determined according to the method of Landd and Butler [41]. Soil samples (2 g) were incubated in 0.2 M tris(hydroxymethyl)aminomethane buffer (Tris-HCl pH 8.0) for 1 h at 50 °C. Sodium caseinate solution (5 mL) was used as a substrate. The level of released tyrosine was measured spectrophotometrically at 578 nm. The method of Tabatabai and Bremner [42] was used to determine acid and alkaline phosphatase activity. The activity of both these enzymes was determined in soil samples (1 g) incubated for 1 h at 37 °C. Disodium 4-nitrophenyl phosphate disodium salt hexahydrate (PNPNa) was used as a substrate. For acid phosphatase, incubation was conducted in universal buffer at pH = 6.5, while for alkaline phosphatase at pH = 11. The activity of both enzymes was determined spectrophotometrically at 400 nm and expressed as mg PNP kg−1 d.m. soil h−1.
Fluorescein diacetate (FDA) hydrolysis level was determined using the method of Schnurer and Rosswall [43]. Soil samples (1 g) were incubated for 2 h at 25 °C. Incubation was carried out in the presence of fluorescein diacetate substrate and 60 mM sodium phosphate buffer (pH 7.6). Enzyme activity was determined spectrophotometrically at 490 nm and expressed as mg fluorescein kg−1 d.m. soil h−1.

2.7. Soil Phytotoxicity

Soil phytotoxicity was assessed using a phytotest, which enabled the analysis of the effect of potentially toxic substances dissolved in the soil solution on germination and root growth of Lepidium sativum L. after 2 and 4 days. This test consisted of placing 20 g weighed amounts of fresh soil from the 0–20 cm layer in Petri dishes in 6 replicates for each combination. Subsequently, the soil was soaked with distilled water exceeding their total water capacity by 2 mL and thoroughly mixed. On the second day, after equilibrium in the soil solution was established, the soil was covered with a filter paper disc. The next step was placing 90 seeds of L. sativum on 3 plates and 10 seeds on the remaining 3 plates (100 seeds in total) and incubation at 22 °C. The number of germinated seeds on all plates was counted after two days. After 2 and 4 days, the length of sprout roots was also measured on plates with 10 seeds each.

2.8. Statistical Analysis
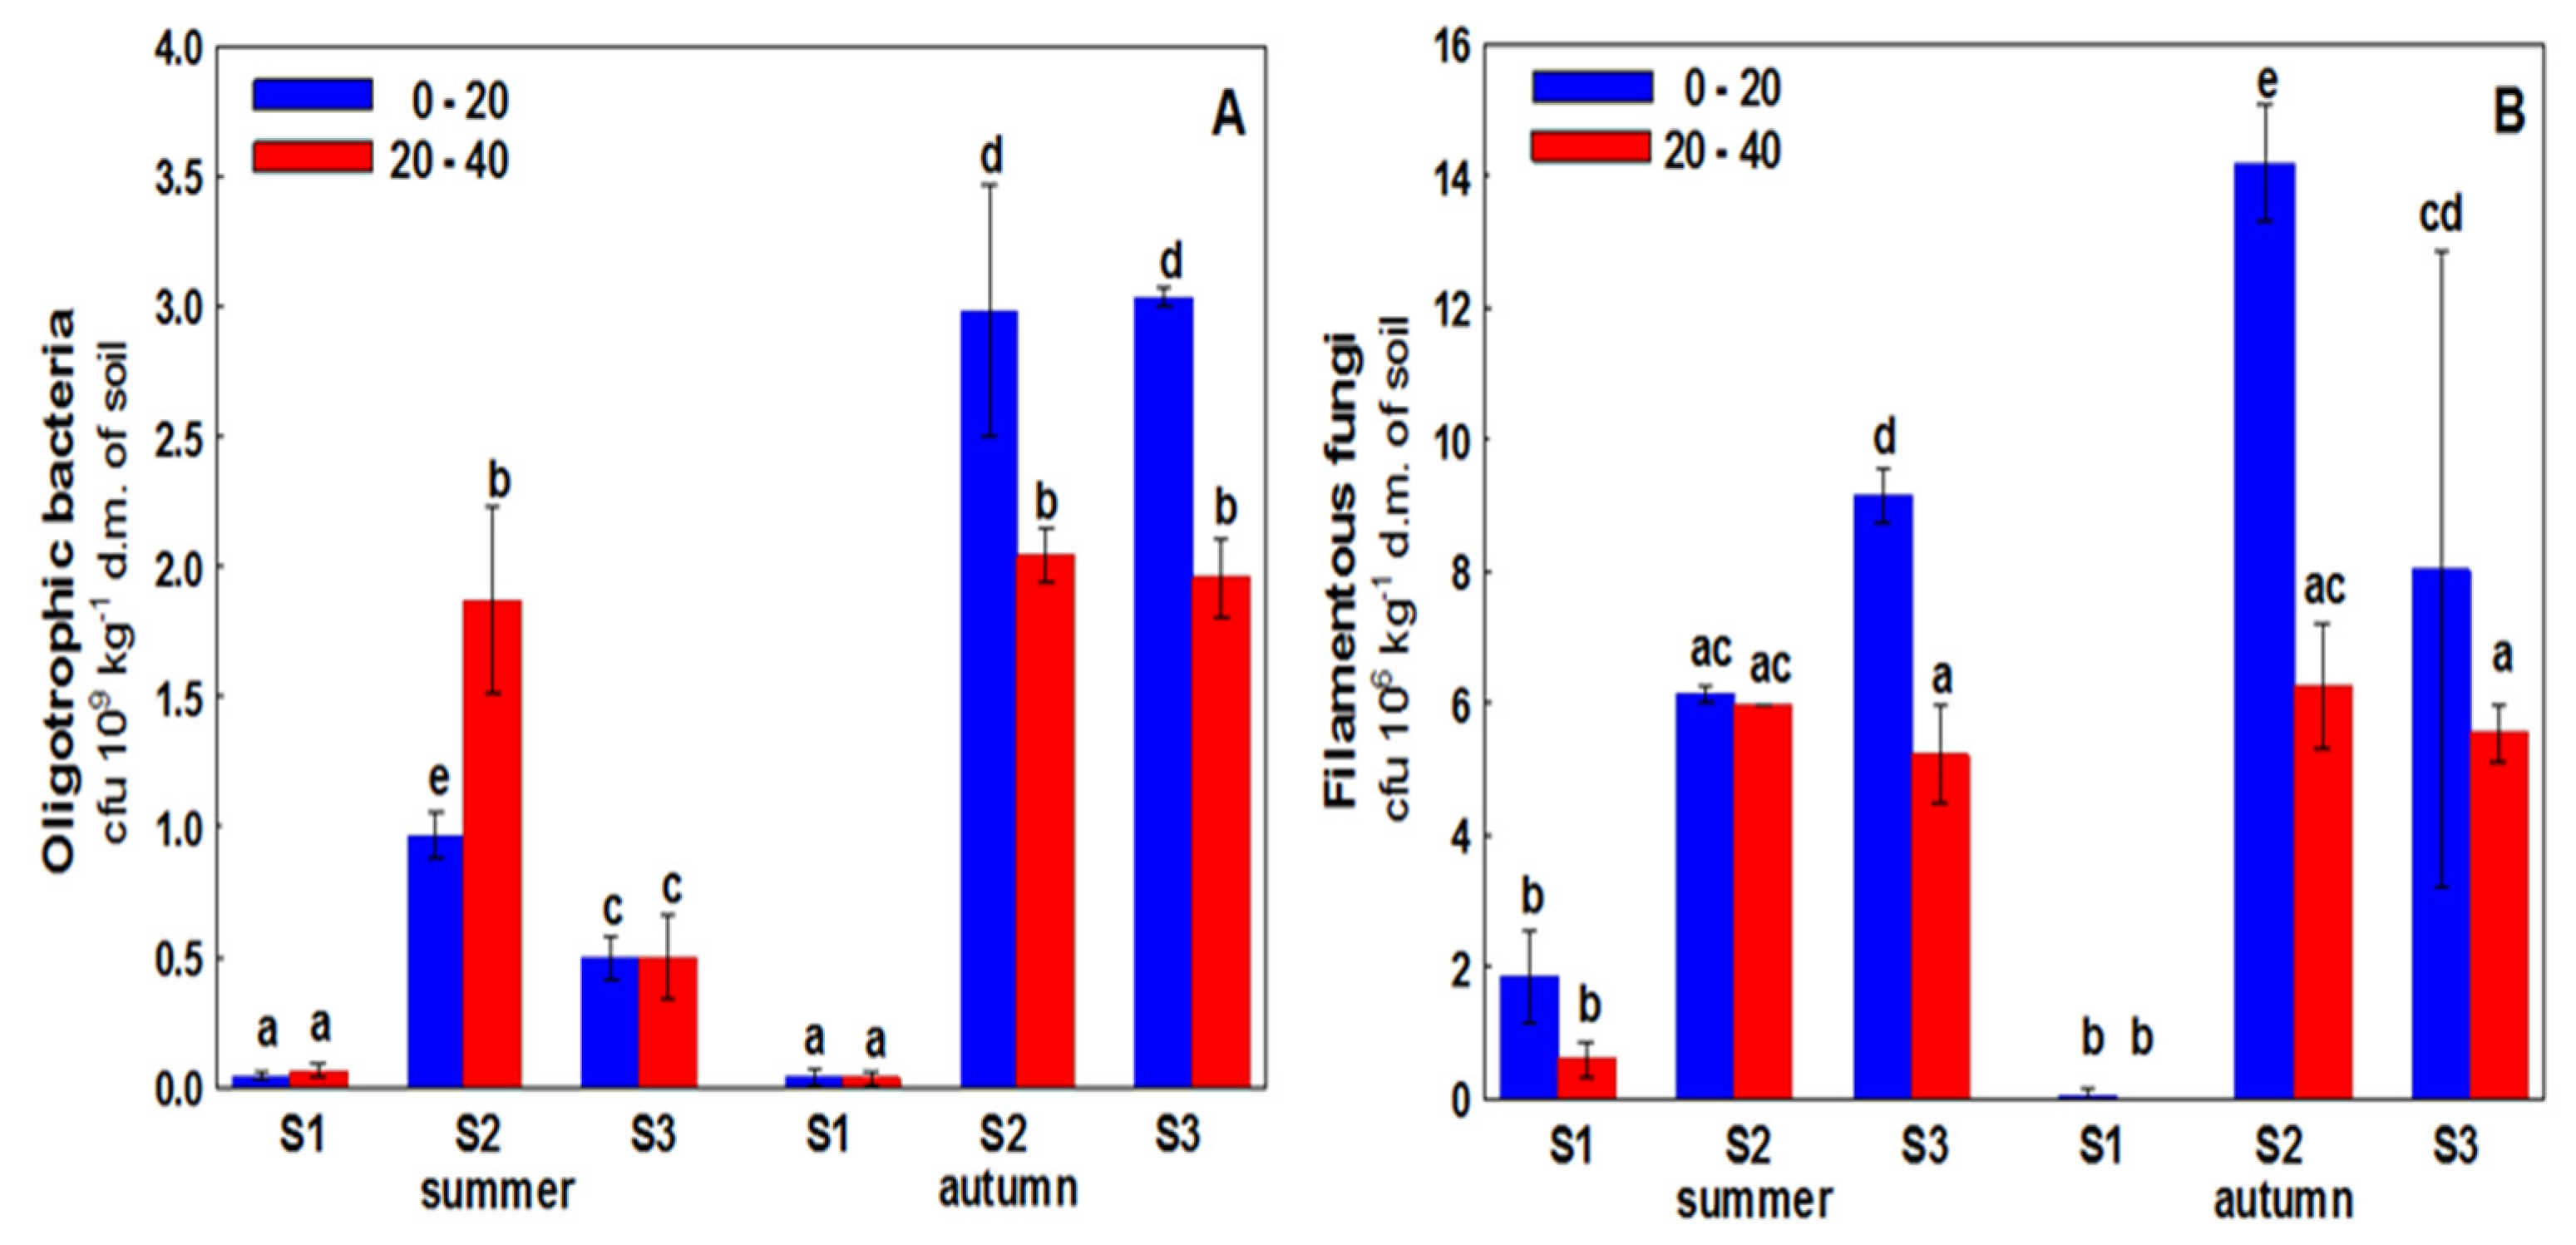
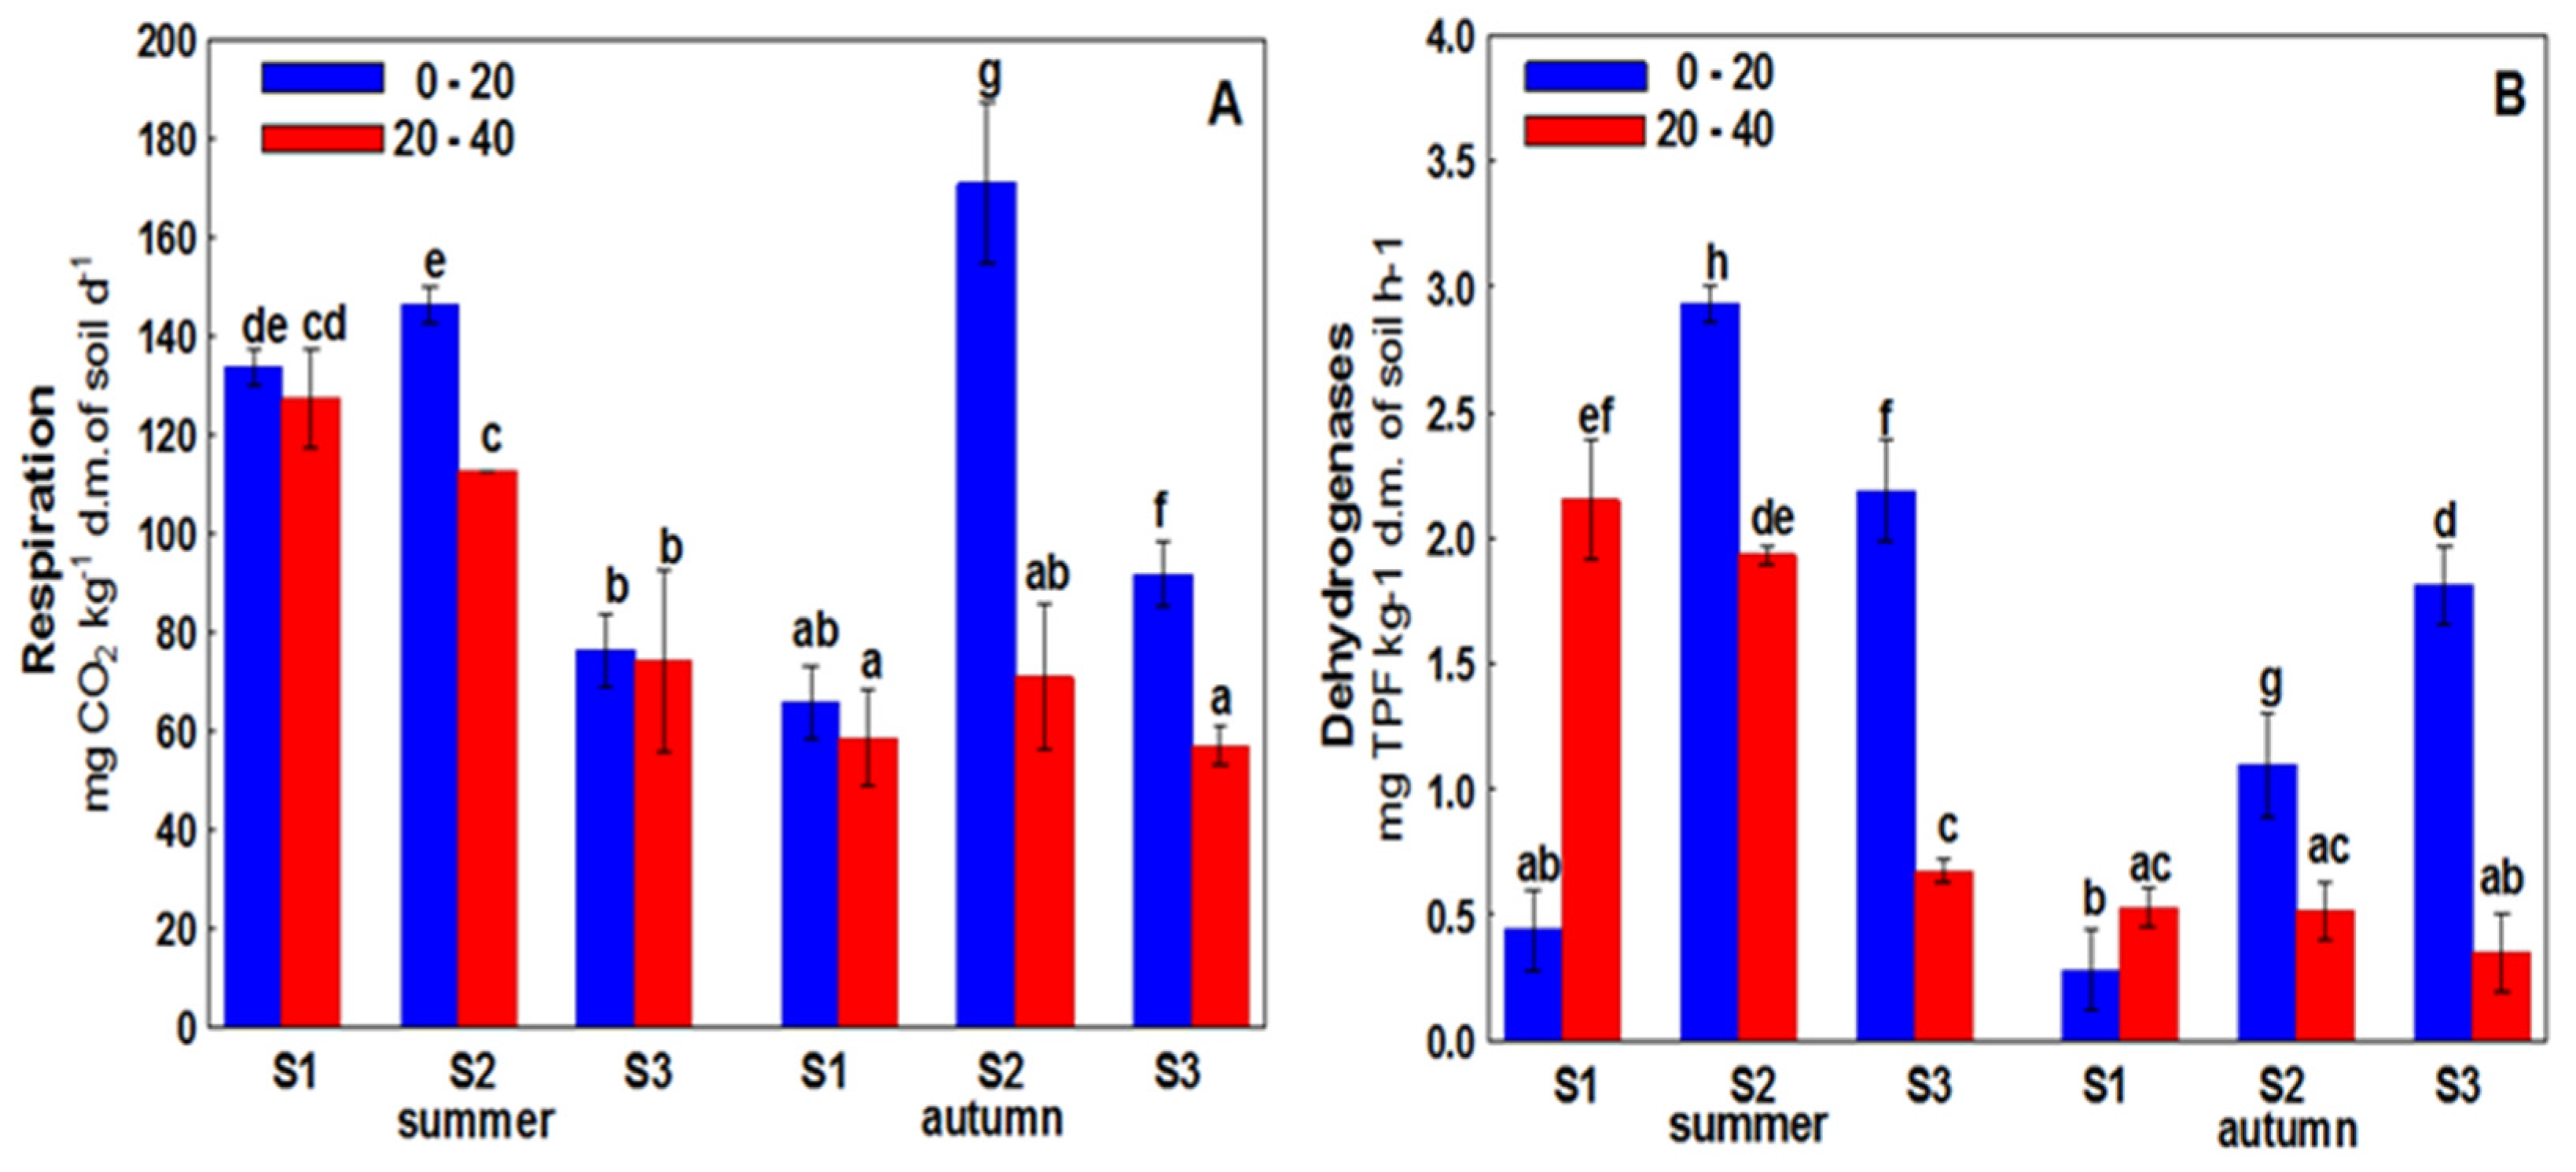
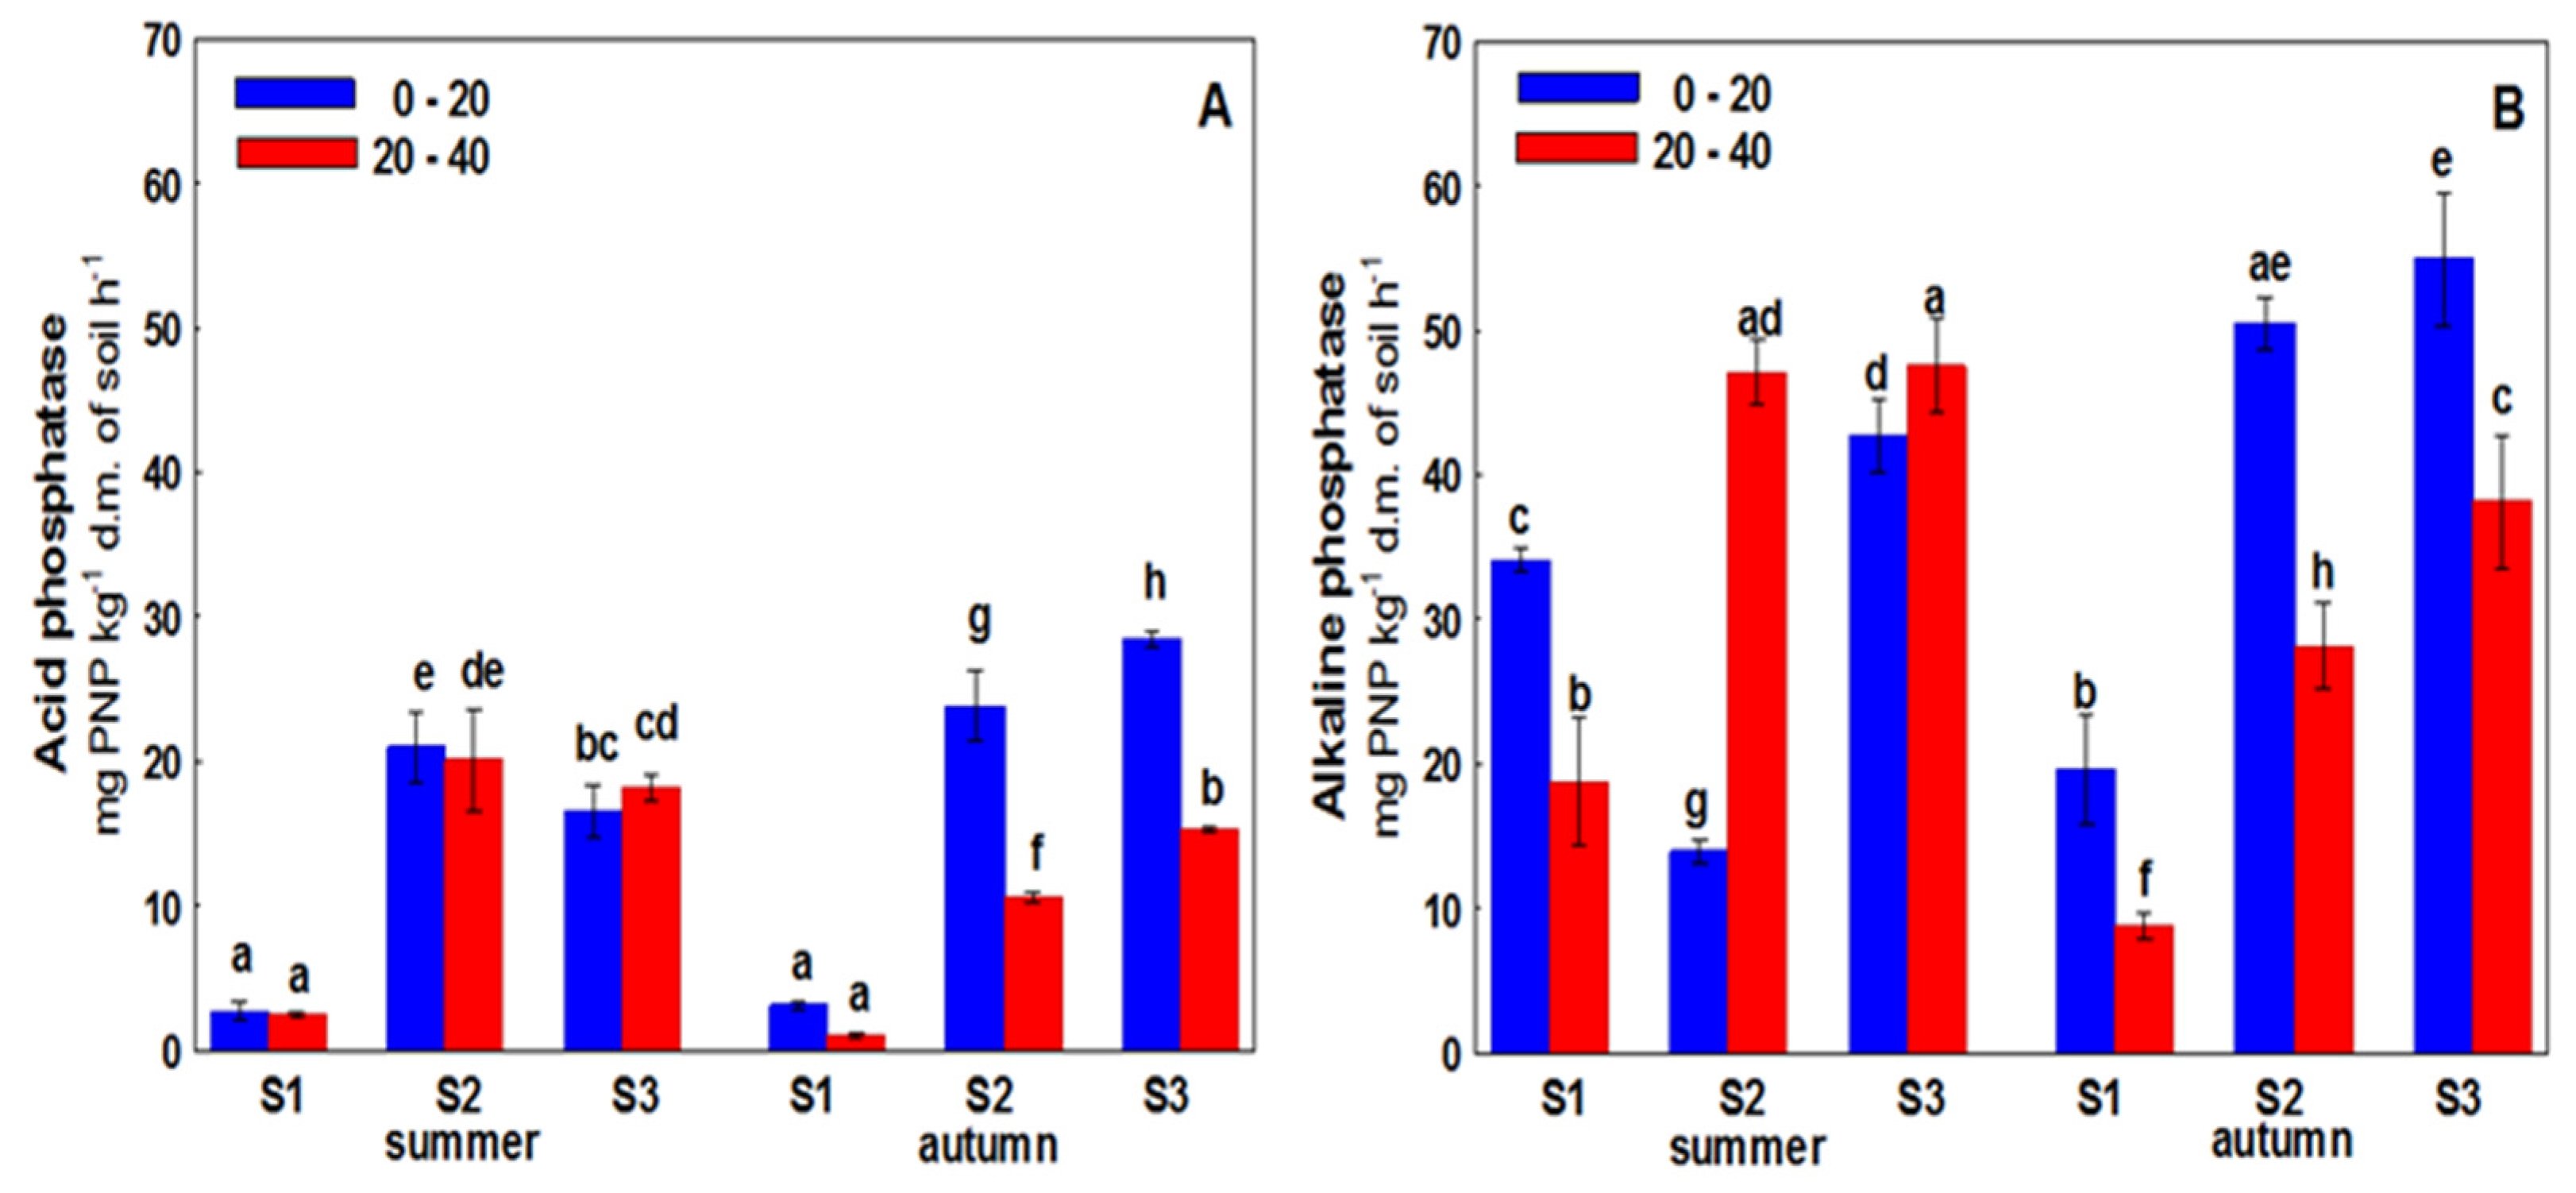
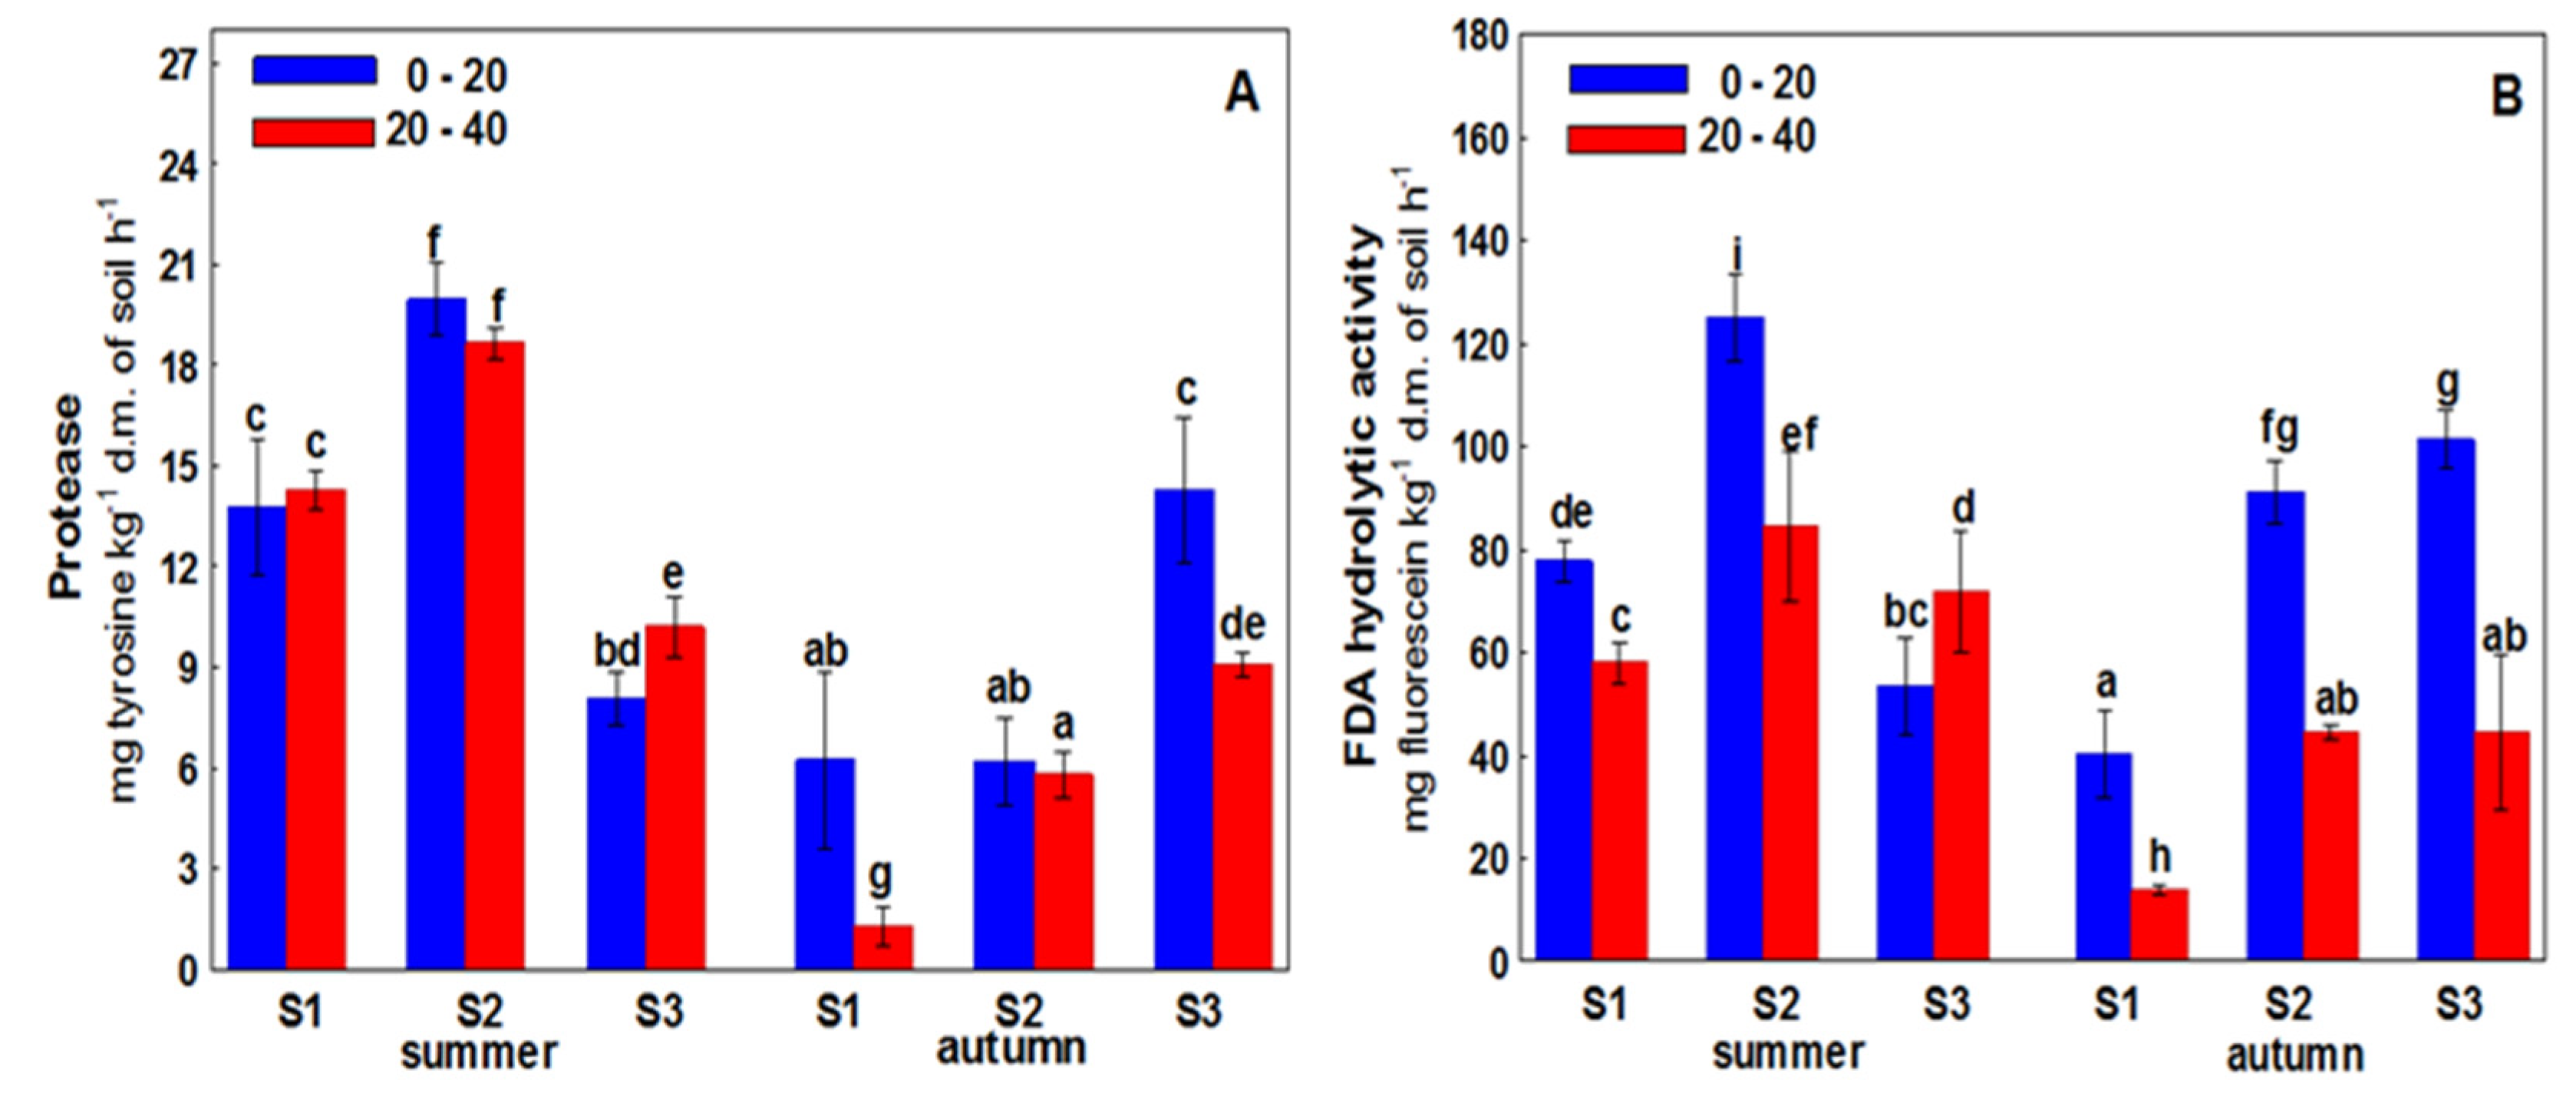
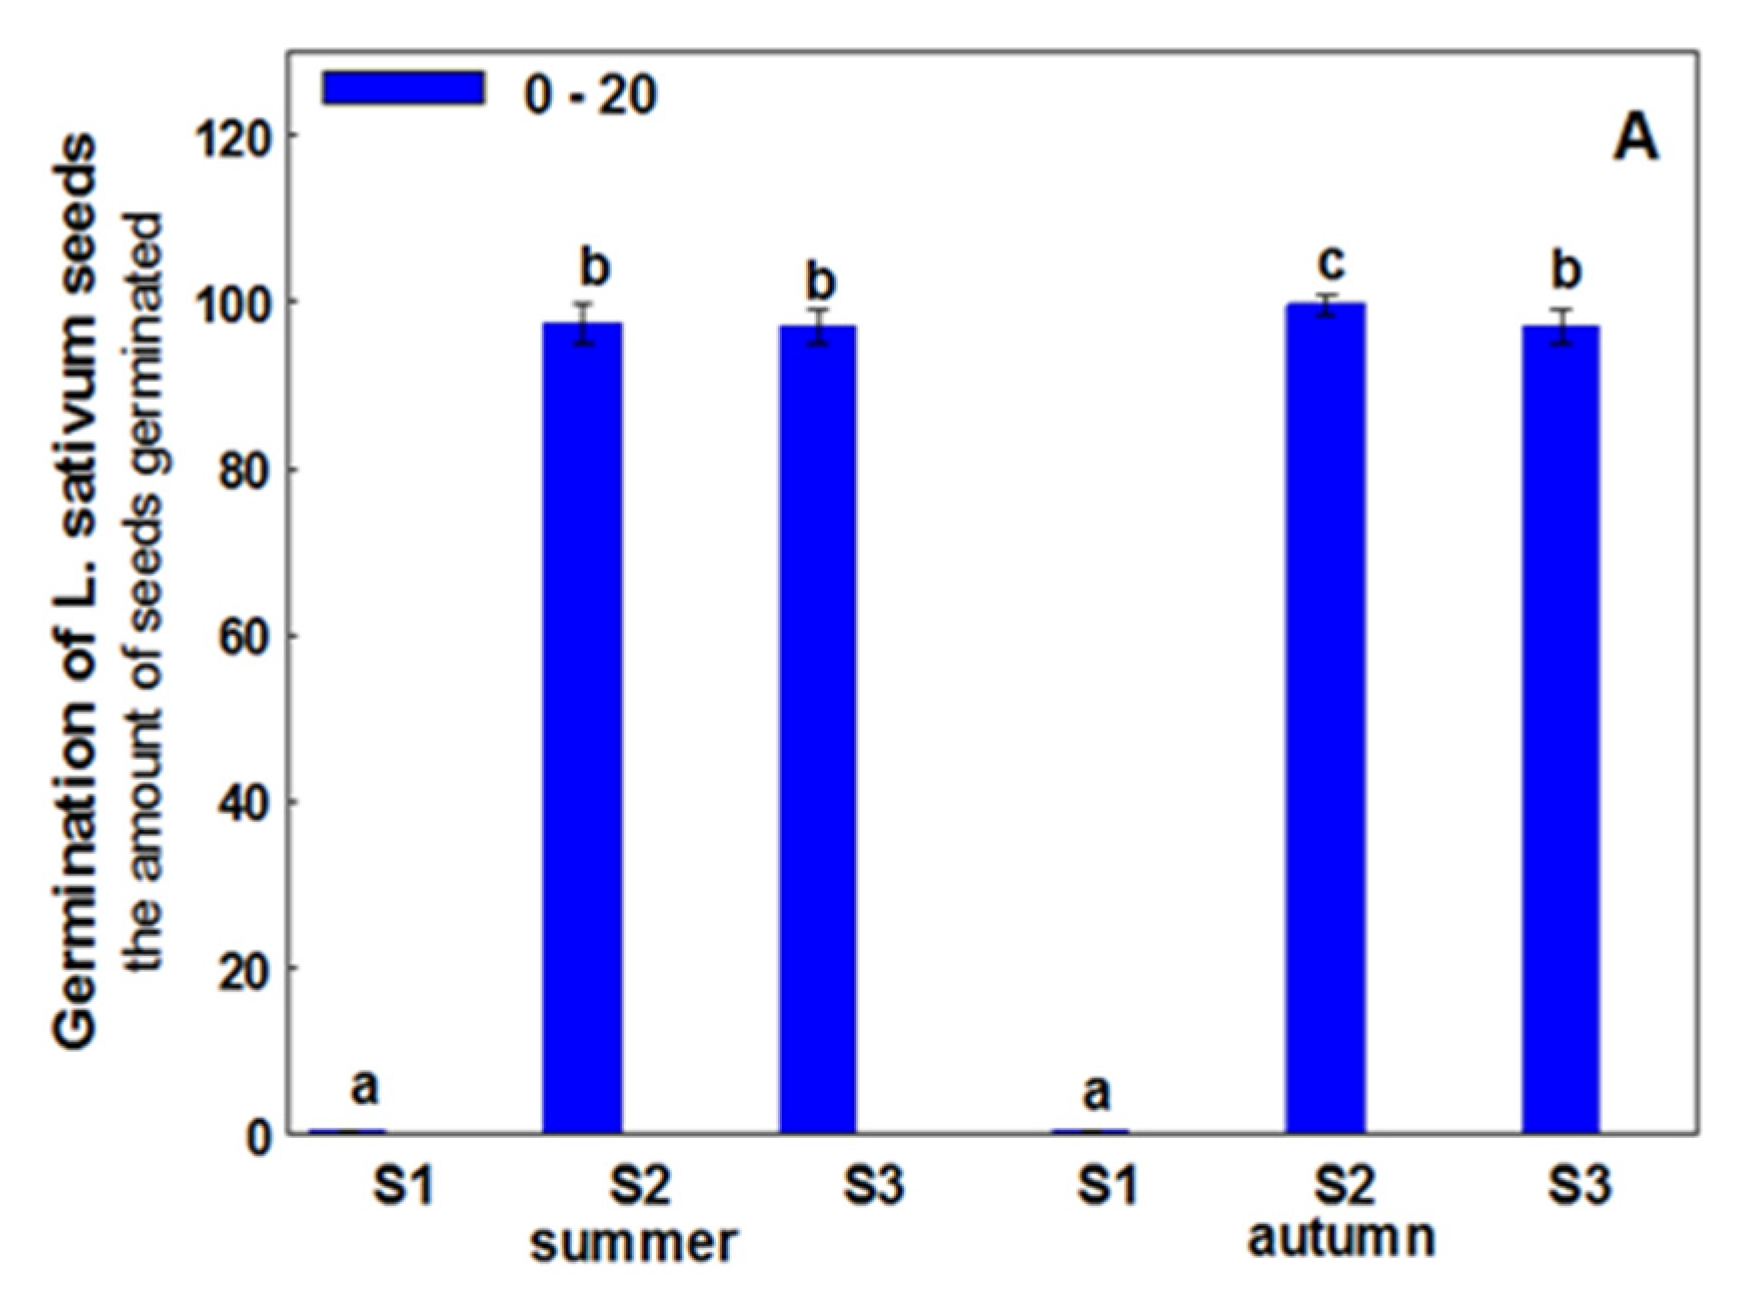
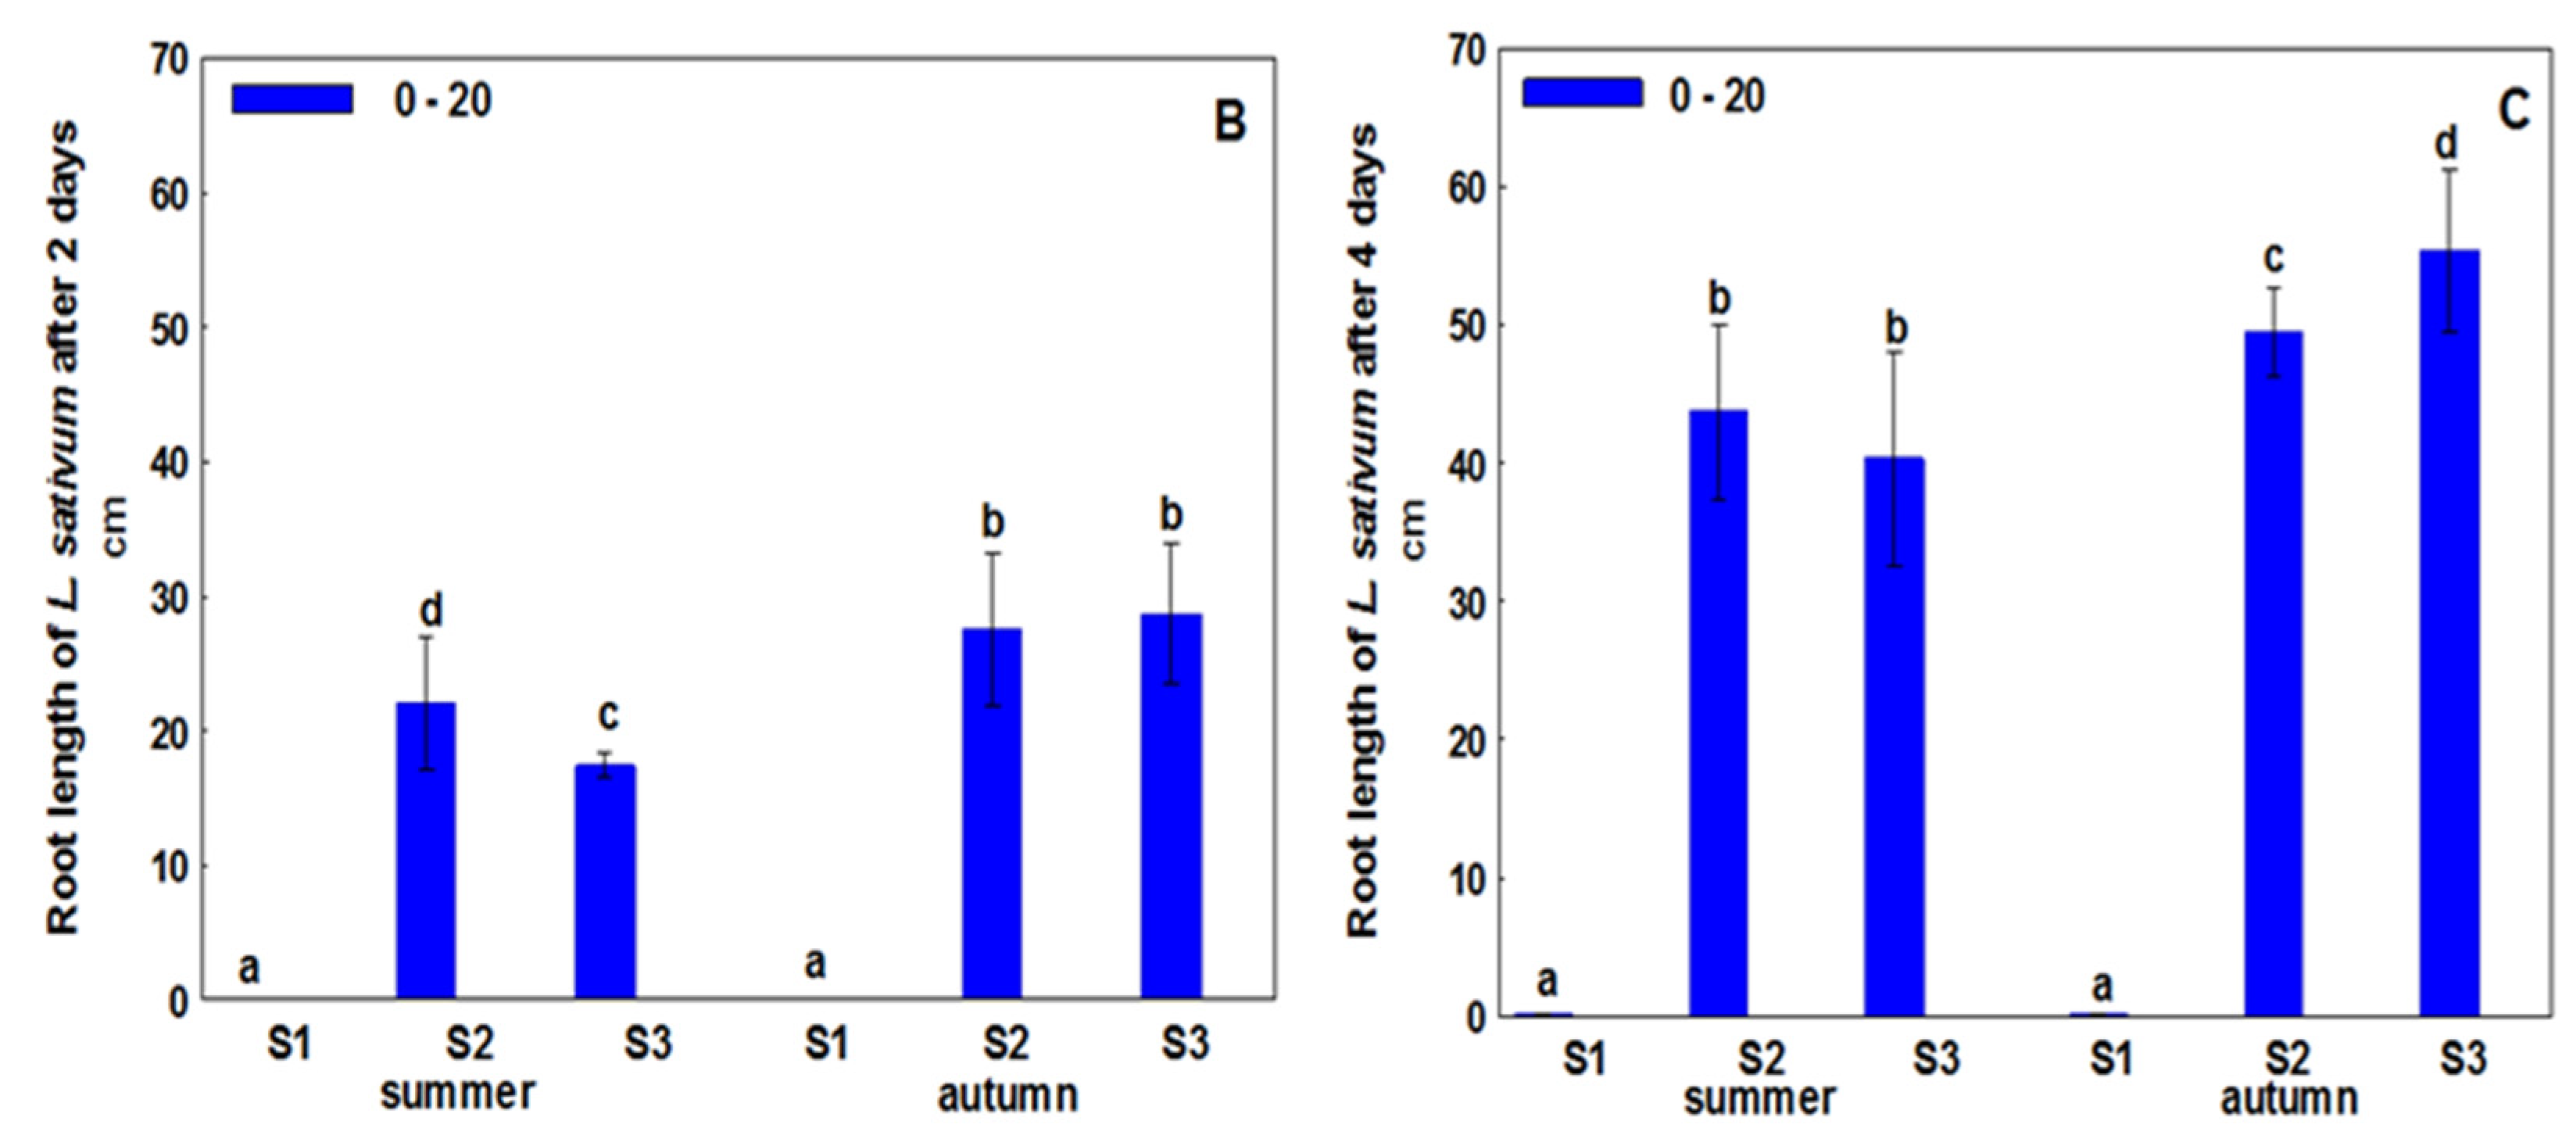
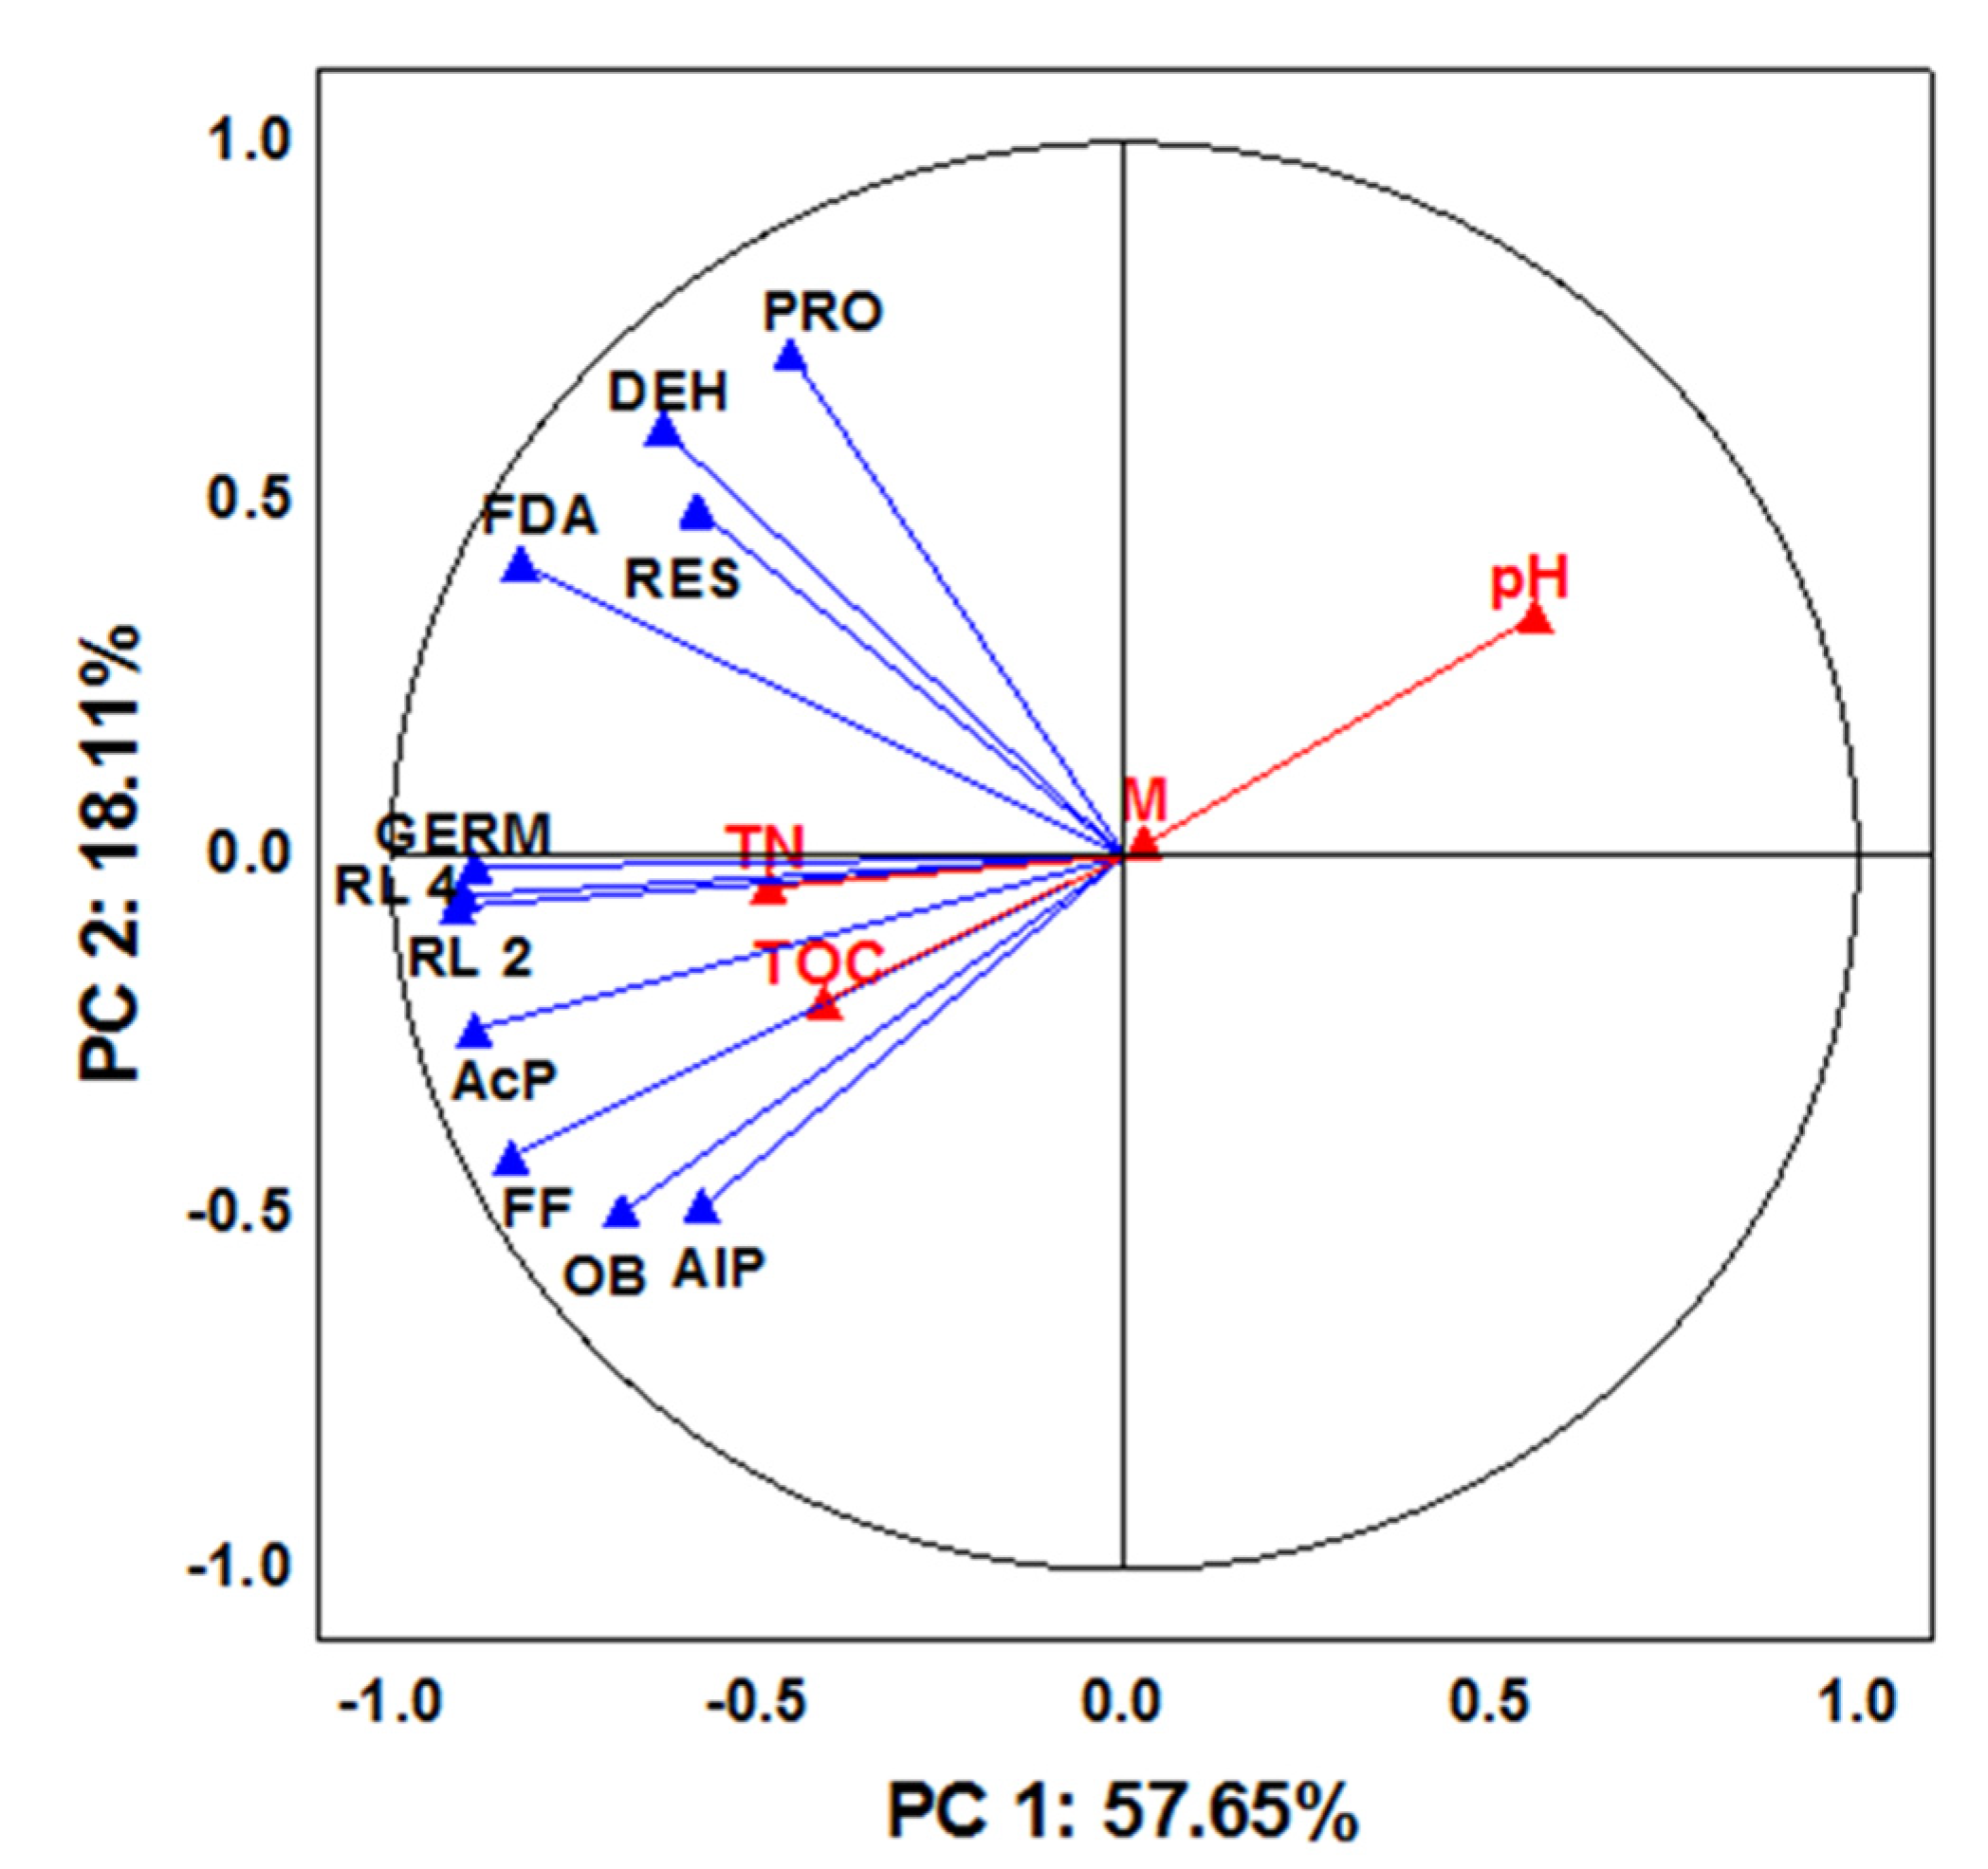
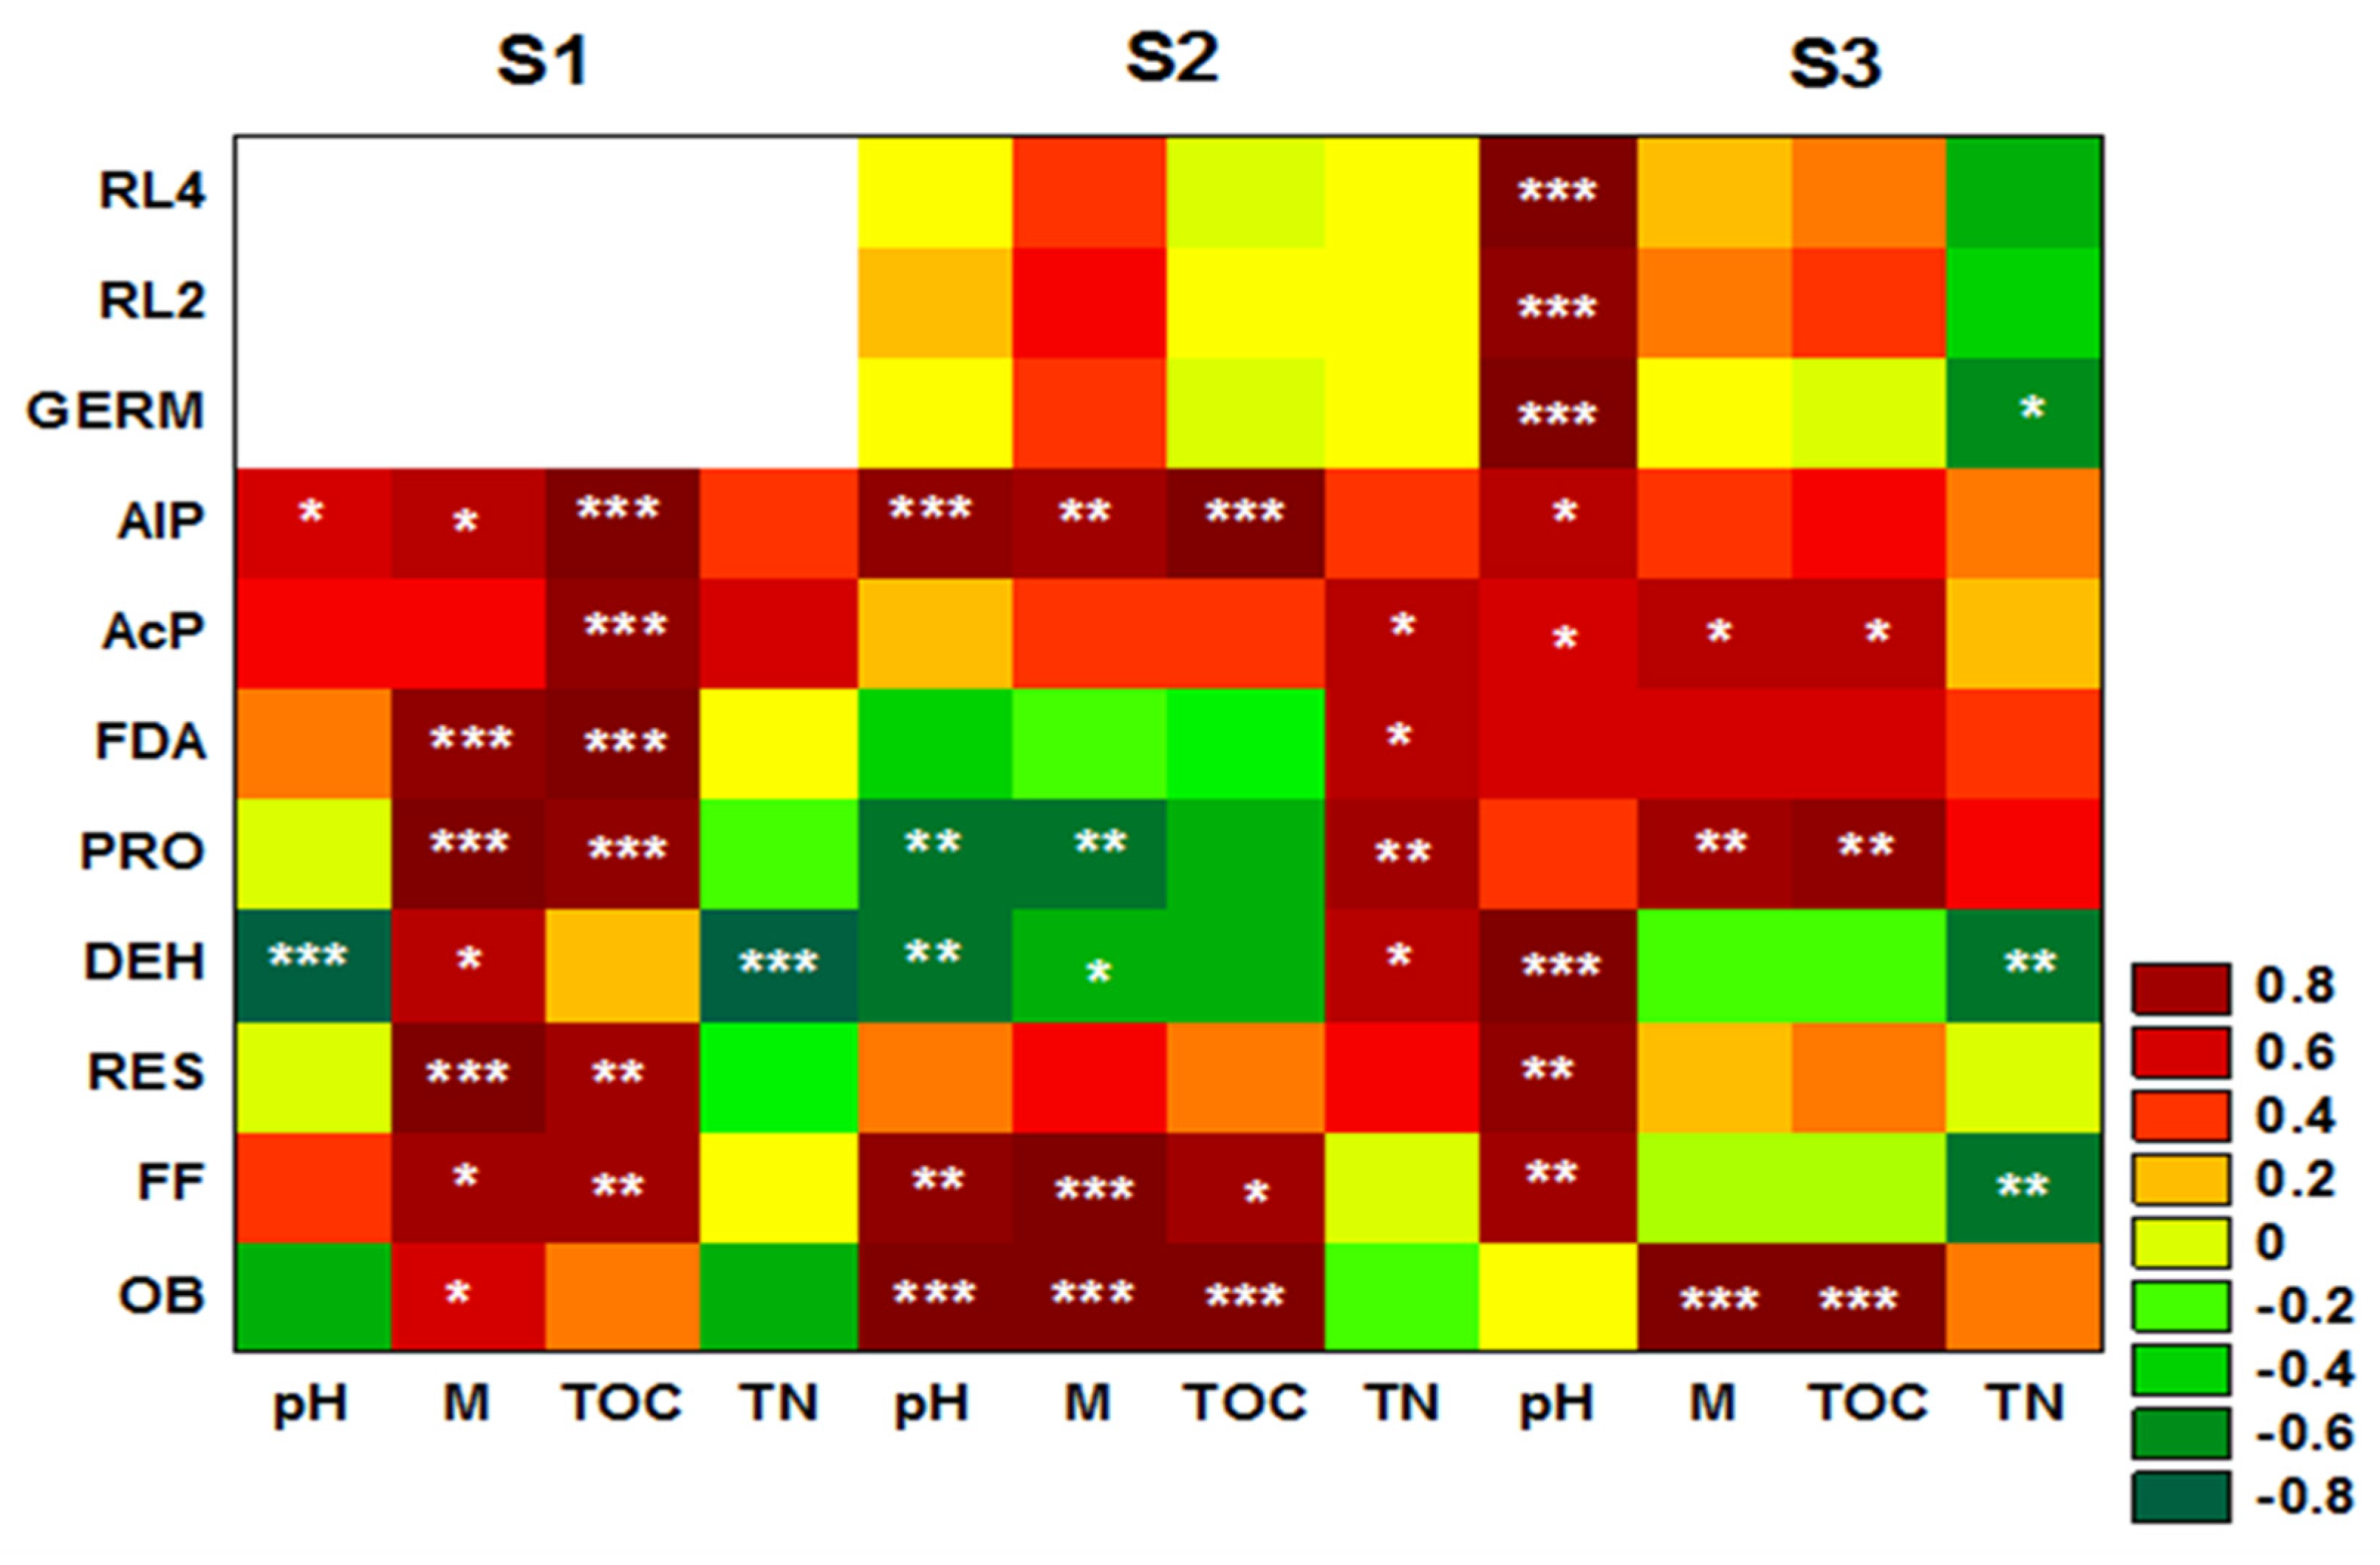
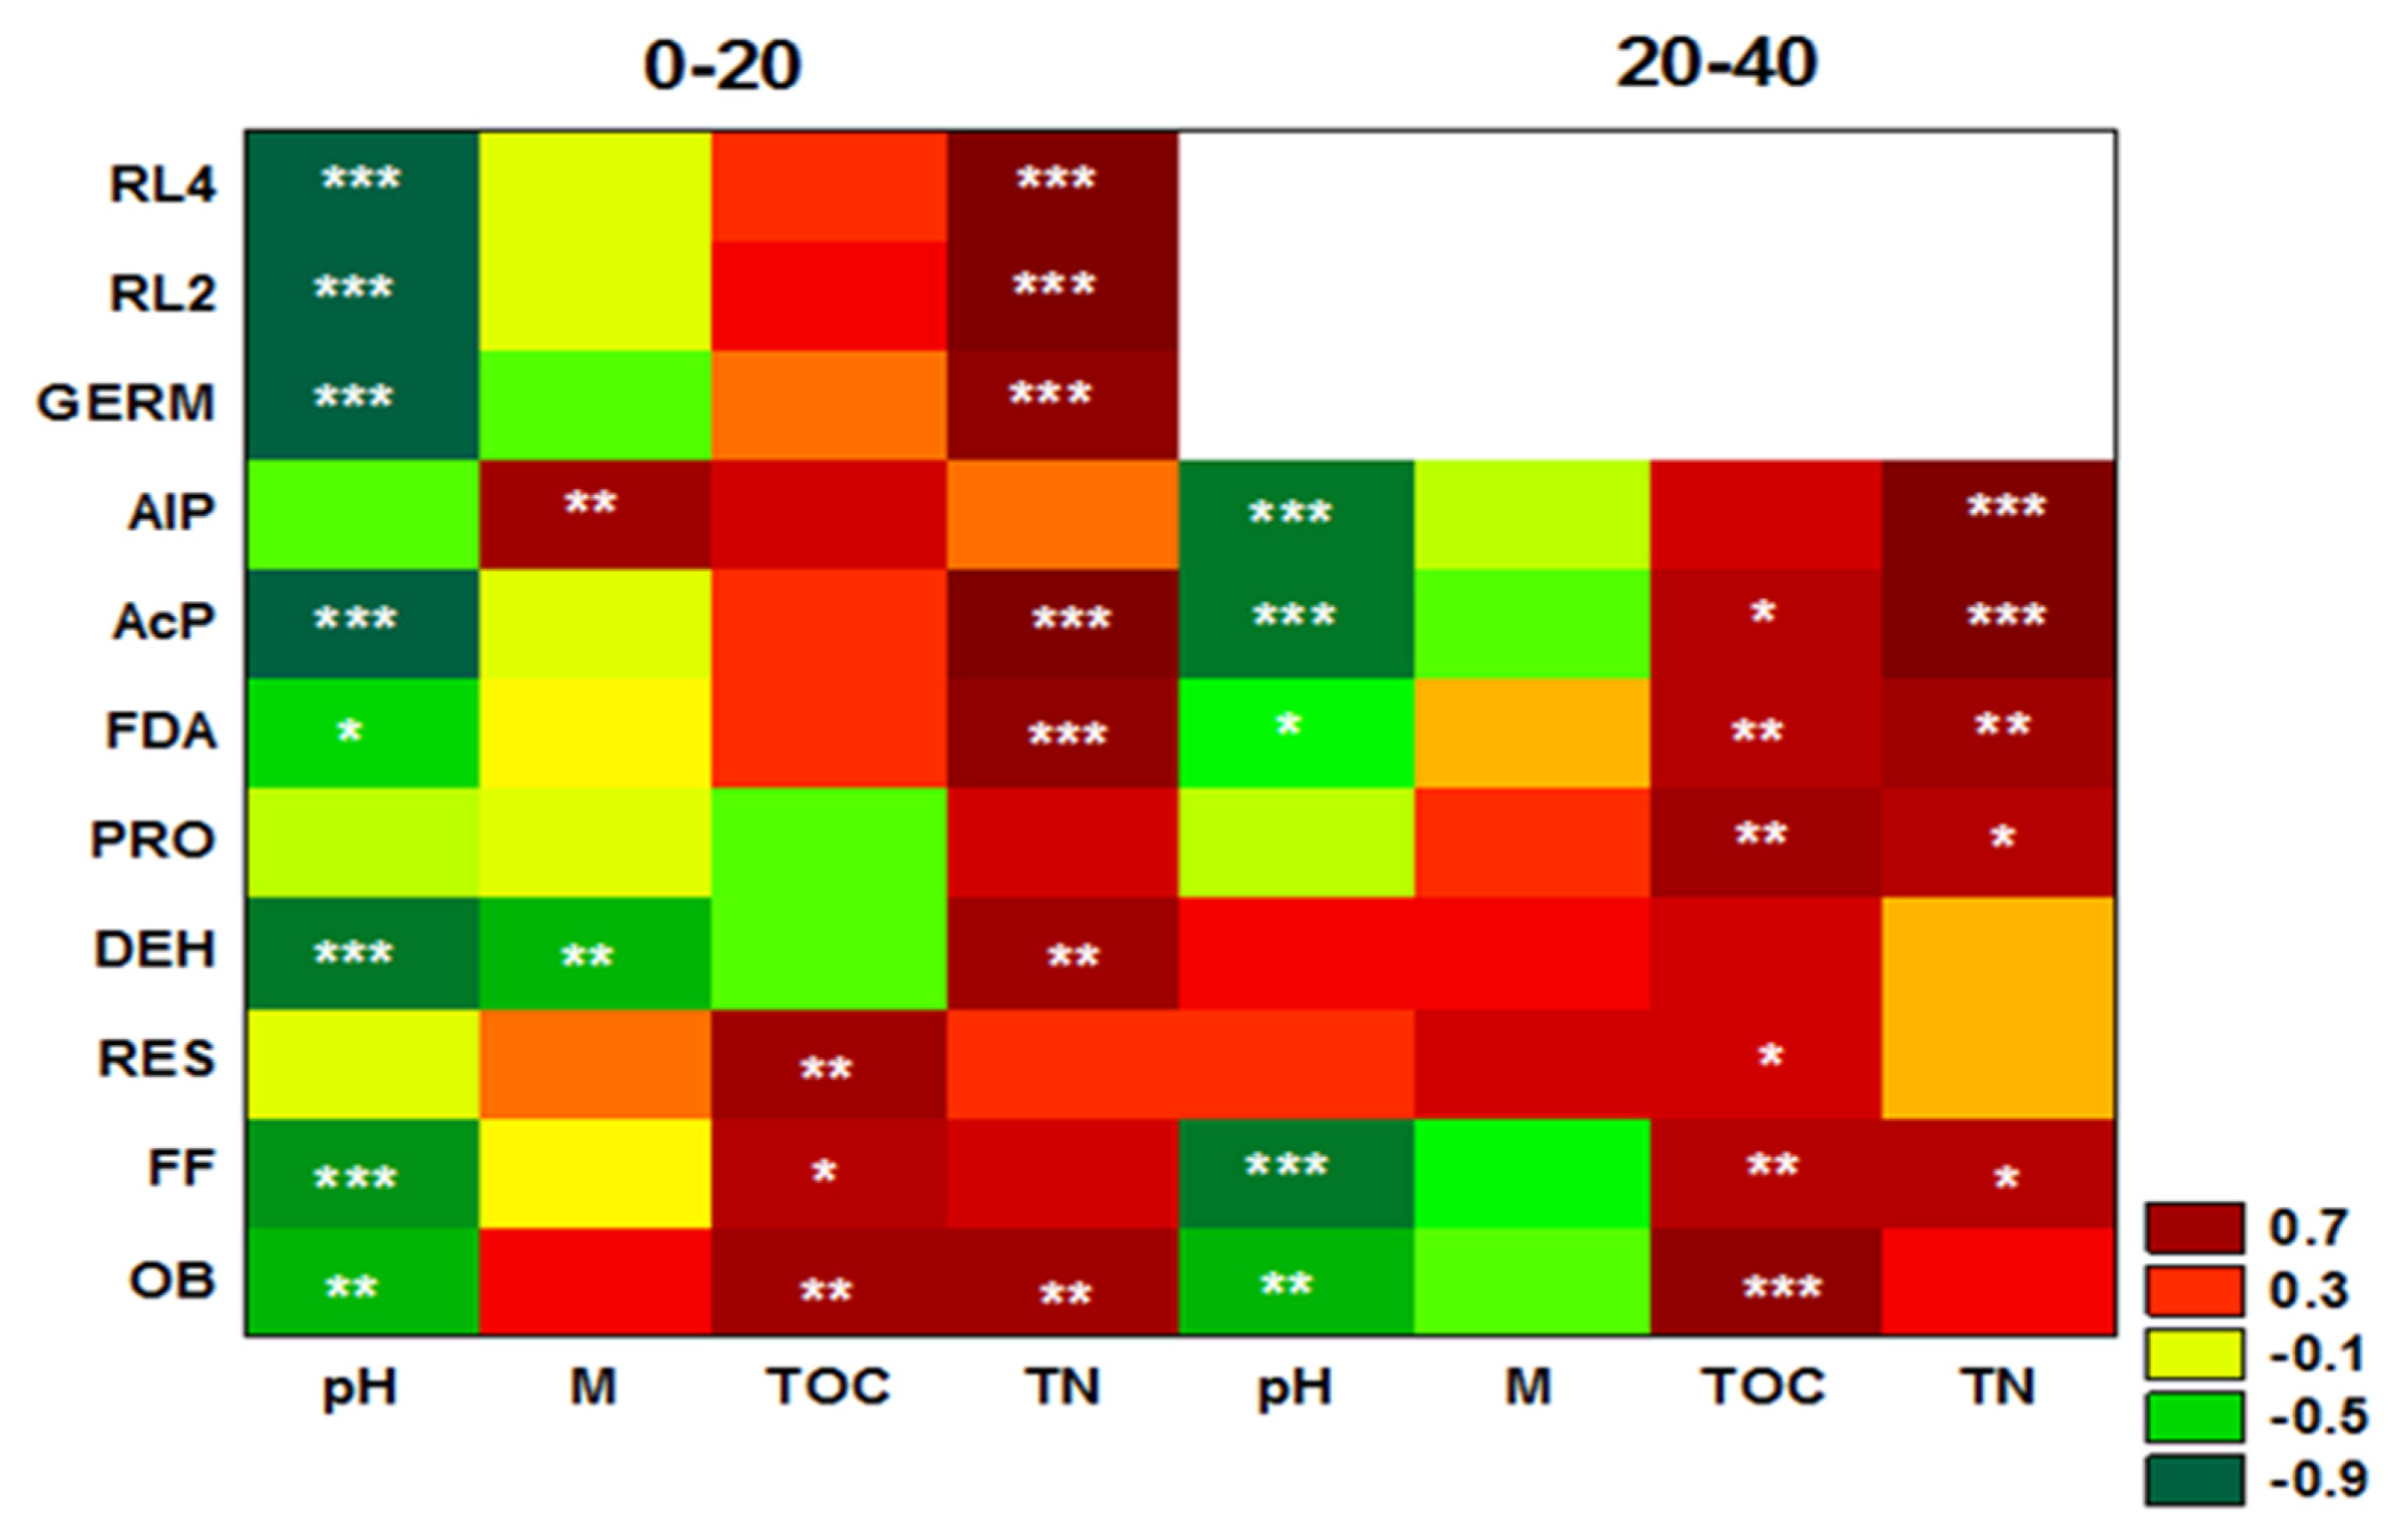
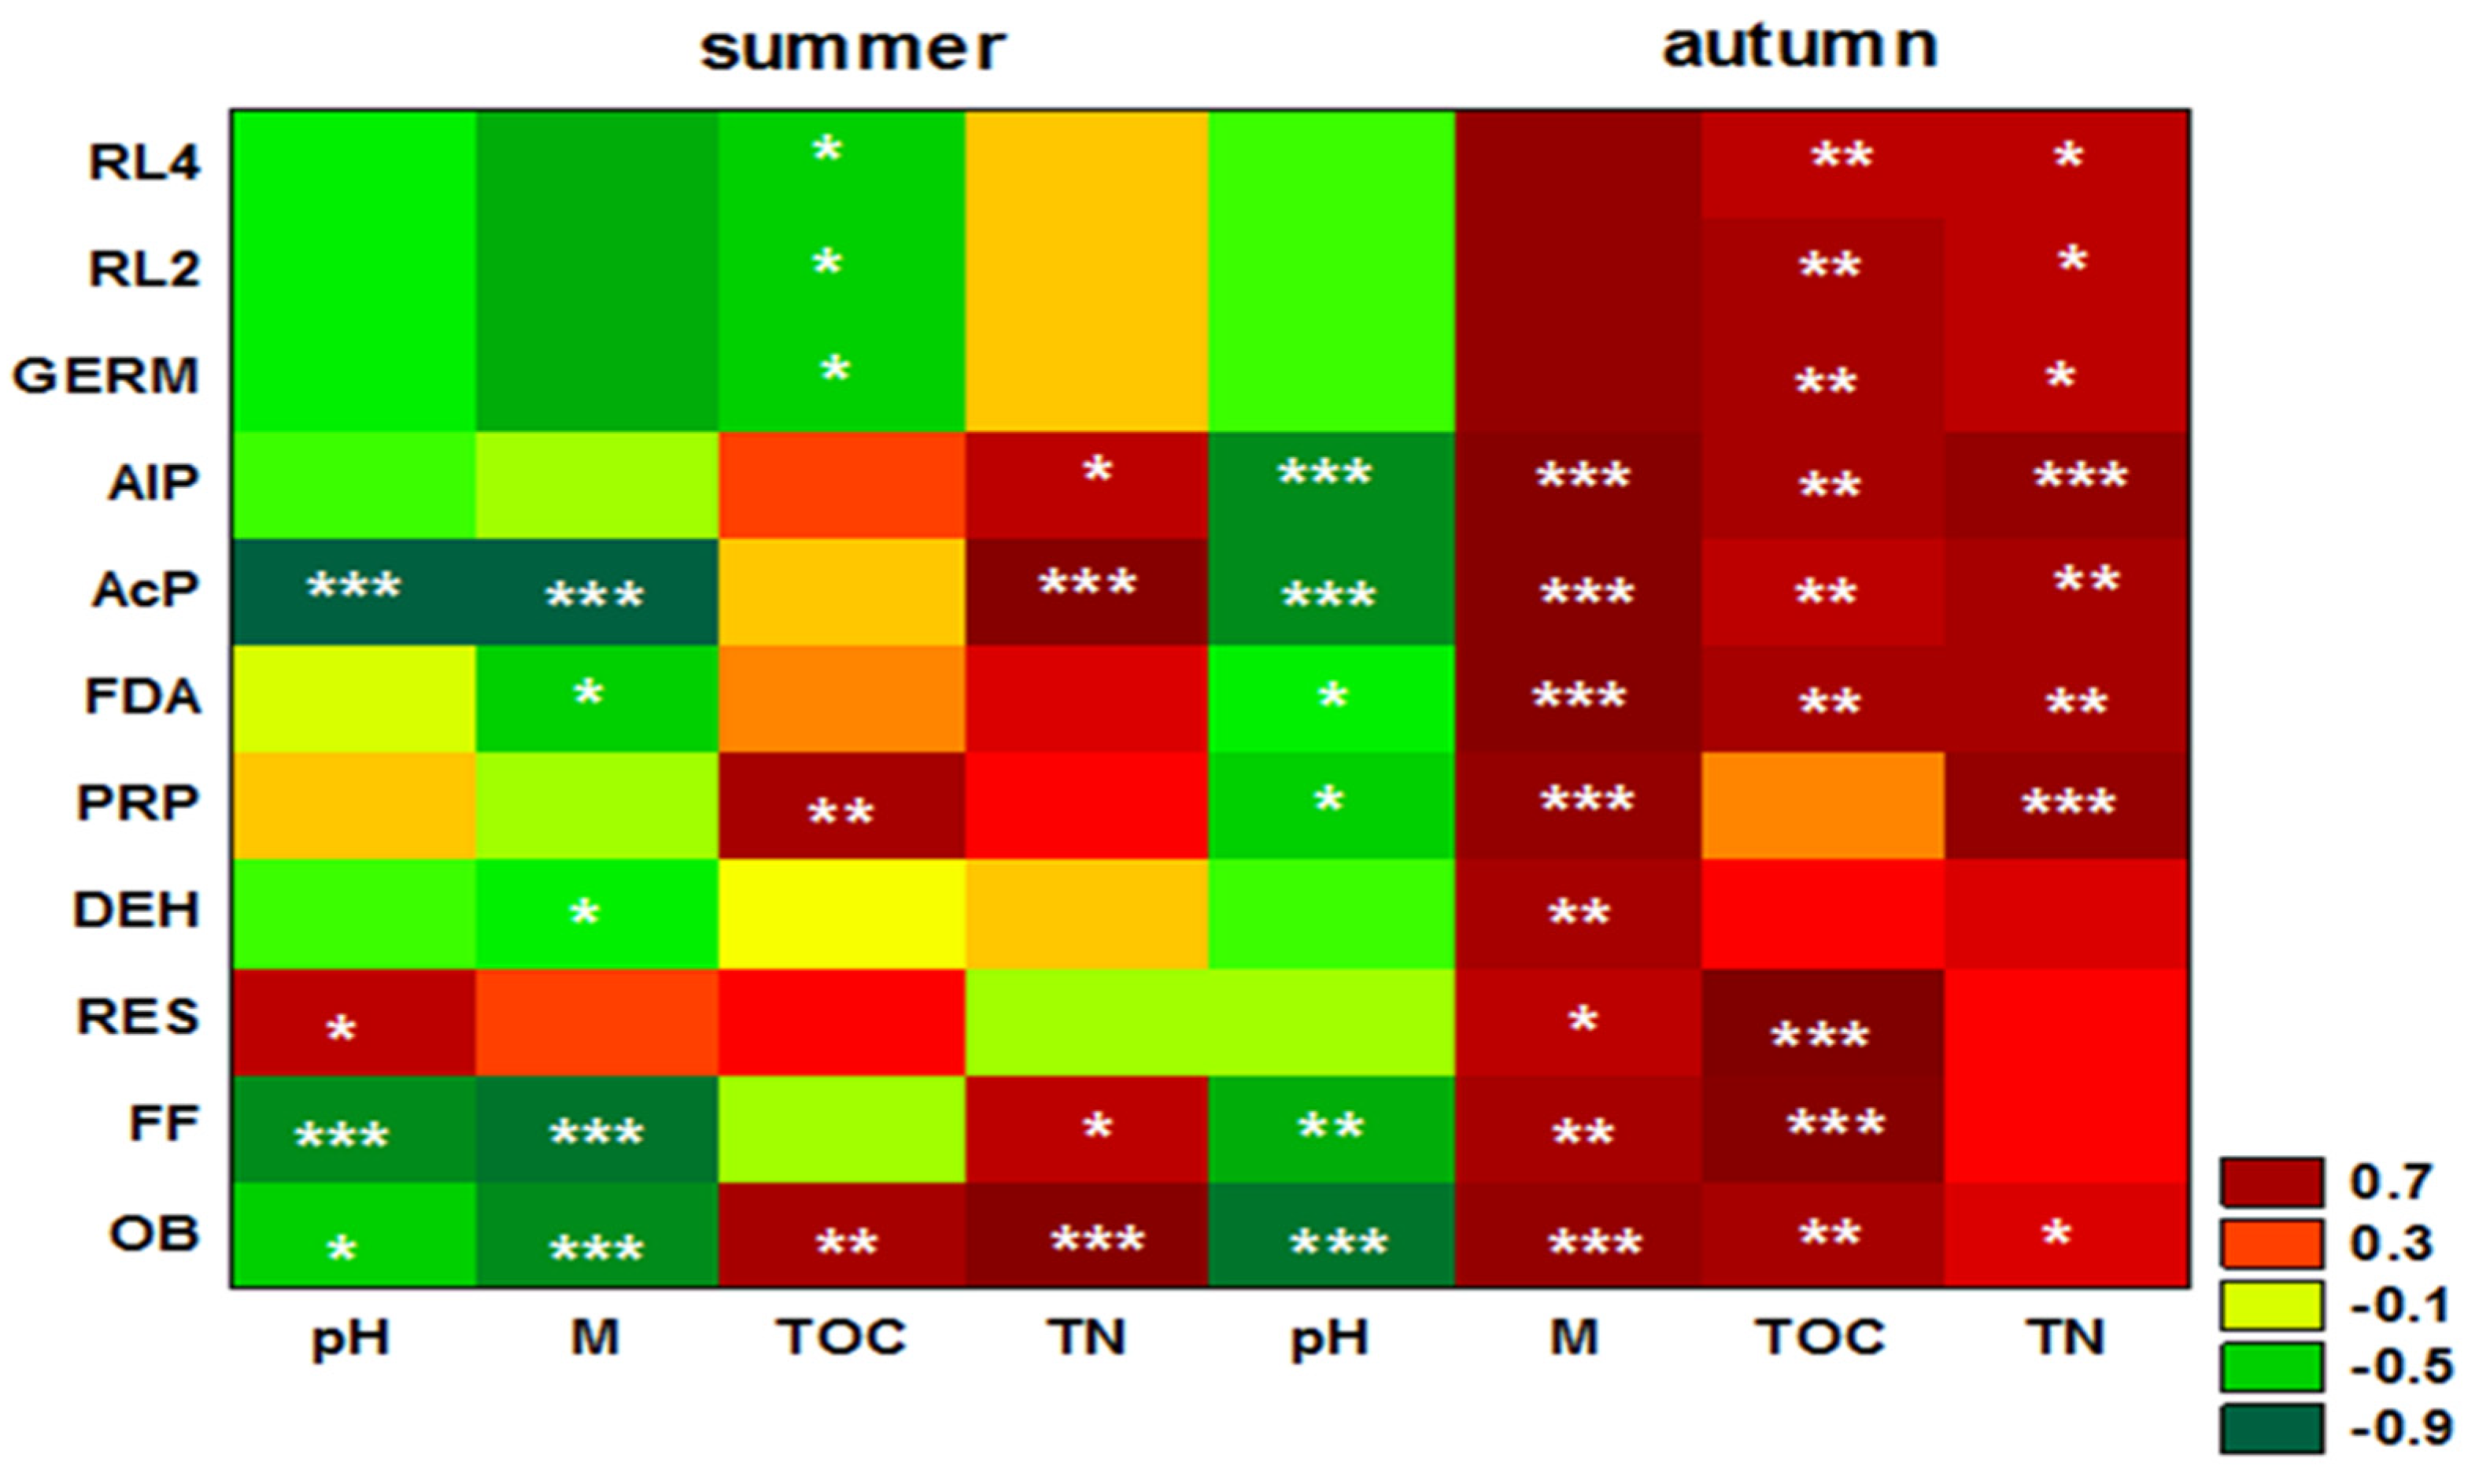
The results were presented in the form of arithmetic mean values from three replicates obtained for a given sample together with the standard deviation. Statistical analysis of the results of microbiological, biochemical, enzymatic and phytotoxicity analyses was performed using the STATISTICA 13.3 program (TIBCO Software Inc., Palo Alto, CA, USA). Data were analyzed using a three-way analysis of variance (ANOVA) to compare means. The post hoc analysis used Tukey’s honestly significant difference (HSD) test at the significance level of p < 0.05. Pearson’s correlation analysis was also conducted at three levels of significance: p < 0.001, p < 0.01, p < 0.05. The relationships between microbiological, biochemical, enzymatic, phytotoxicity and physical and chemical parameters were also analyzed in three variants, at the level of: sampling sites (“combinations”), soil profile and seasonal variation. Color scales ranging from dark green (lower values) to dark red (higher values) were adopted for each case, with corresponding transition colors between these extremes. Principal component analysis (PCA) was also performed for all analyzed parameters.

3. Results

The results presented in Figure 1A,B refer to the abundance of oligotrophic bacteria and filamentous fungi. Data concerning bacteria (Figure 1A) showed that their numbers in both soil layers (0–20 and 20–40 cm) differed significantly between individual sampling sites (S1, S2 and S3) throughout the study period. The smallest number was recorded at site S1, i.e., closest to the reservoir with liquid waste (0.04–0.06 cfu 109 kg1). The level of this parameter increased significantly with the distance from the source of pollution in both soil layers in summer and autumn. The highest number was recorded in autumn (2.98 and 3.04 cfu). At that time, the number of bacteria was significantly higher in the upper soil layer than in the lower layer.
The results obtained for filamentous fungi (Figure 1B) showed a similar development tendency of this group of microorganisms as for bacteria. The lowest abundance of fungi was recorded in the soil at site S1. This effect was visible in both soil layers and persisted throughout the study period. The level of this parameter at S1 ranged from 0, i.e., no filamentous fungi in the lower soil layer in autumn, to 1.85 cfu 106 kg−1 in the upper layer in summer. In the remaining sampling sites, i.e., S2 and S3, the development of fungi was significantly higher than in S1. The highest values were recorded in the upper soil layer, i.e., 0–20 cm (9.16–14.20 cfu), which was particularly pronounced in autumn. At that time, the number of fungi was significantly smaller in the lower soil layer.
Figure 2A presents the soil respiration data. Significant differences were noted in the intensity of this process at individual time points. In the summer, the highest values of this parameter were recorded at sites S1 and S2, (upper layer—133.68 and 146.21 mg kg−1; lower layer—112.51 and 127.20 mg kg−1). Significantly lower values were recorded at site S3, i.e., the farthest from the reservoir. Respiration in the analyzed layers at this location reached 76.23 and 73.90 mg, respectively. The intensity of the respiration process was different in autumn. Respiration in the upper soil layer (0–20 cm) was lowest at S1 and amounted only to 65.48 mg. It remained at a similar level in the lower soil layer at all sampling sites (S1, S2 and S3). On the other hand, in the 0–20 cm layer, respiration increased significantly with the distance from the waste reservoir. The highest value was recorded at site S2 (171.00 mg).
The results concerning the activity of dehydrogenases presented in Figure 2B showed that similarly to the number of bacteria and fungi, the lowest values for the upper layer were recorded for this parameter at site S1. This phenomenon was observed in the entire study period (0.28 and 0.44 mg kg−1). The activity of dehydrogenases significantly increased with the distance from the reservoir with liquid waste, reaching the highest value in summer at S2 (2.93 mg) and in autumn at S3 (1.81 mg). The opposite tendency was observed in the lower soil layer (20–40 cm) in summer compared to the upper soil layer (0–20 cm). The enzyme activity was the lowest at the most distant site, i.e., S3, and amounted to only 0.67 mg, while it was significantly higher at S1 and S2—2.15 and 1.93 mg, respectively. This parameter in autumn in the lower soil layer was at a similar level at all sampling sites, i.e., S1, S2 and S3 (0.35–0.52 mg).
Figure 3A,B show the results for acid and alkaline phosphatase activity. Acid phosphatase activity (Figure 3A) reached the lowest values in both soil layers, at the site closest to the waste tank, i.e., S1 (1.07–3.12 mg kg−1). At the remaining sites, i.e., S2 and S3, the discussed activity was significantly higher (10.58–28.52 mg kg−1). This effect persisted throughout the study period and was most pronounced in the upper soil layer in autumn. Acid phosphatase activity was significantly lower in the lower soil layer (20–40 cm).
Data on alkaline phosphatase activity (Figure 3B) showed that the activity of this enzyme reached higher values compared to acid phosphatase. For alkaline phosphatase, different trends were noted between individual time points and soil layers. In summer, the lowest values of this parameter in the 0–20 cm layer were reached at S2 (13.97 mg kg−1). In the remaining sites, i.e., S1 and S3, it was significantly higher, reaching the highest level at S3 (42.76 mg kg−1). The lowest value in the lower soil layer was recorded at S1 (18.74 mg kg−1). At the other sites, i.e., S2 and S3, it was significantly higher (47.13–47.53 mg kg−1). In autumn, the activity of alkaline phosphatase in both soil layers showed a similar tendency as acid phosphatase. It had the lowest values at S1 (19.59 mg and 8.76 mg kg−1). At other sites, it was significantly higher (54.95 mg and 50.51 mg kg−1). The values recorded in both time points for the upper layer were generally significantly higher than for the lower layer.
Figure 4A presents the results for protease activity. The data were significantly different in individual dates. In summer, the lowest values in both soil layers were recorded at the site most distant from the liquid reservoir, i.e., S3 (8.07 and 10.21 mg kg−1). However, at S1 and S2, the proteolytic activity was significantly higher, reaching the highest values at S2 (19.95 and 18.65 mg kg−1). In contrast to S3, there were no significant differences between the layers at S1 and S2. In autumn, a reverse trend was observed, i.e., the lowest values of the enzyme activity were observed at S1 and S2 (1.26-6.23 mg) and significantly higher at S3 (9.08 and 14.29 mg kg−1). In autumn, the values at most sites were significantly higher in the upper layer than in the lower one.
The hydrolytic activity of fluorescein (Figure 4B), similarly as proteolytic activity, greatly varied in individual experimental time points in both soil layers. In summer, the lowest values in the 0–20 cm layer were recorded at S3 (53.50 mg kg−1). In the remaining sites, i.e., S1 and S3, this activity was significantly higher, reaching the highest level at S2 (124.96 mg kg−1). In the 20–40 cm layer, the studied activity was lowest at S1 (57.94 mg kg−1), while at the other sites, it was significantly higher reaching the highest value similarly to the upper layer at S2 (84.55 mg kg−1). In autumn, fluorescein hydrolytic activity was the lowest in both soil layers at the site closest to the reservoir, i.e., S1, reaching 40.35 and 13.67 mg kg−1, respectively. At the other sampling sites, i.e., S2 and S3, the values were significantly higher, especially at S3 (101.32 mg kg−1). The hydrolytic activity of fluorescein throughout the study period was significantly lower in the lower soil layer than in the upper one.
The results concerning seed germination and root growth of L. sativum seedlings (Figure 5A–C) indicated that the distance from the liquid waste reservoir had a very significant effect on the phytotoxicity of the top soil layer (0–20 cm). Seed germination data (Figure 5A) demonstrated that at S1, i.e., closest to the reservoir, seeds did not germinate either in summer or in autumn. Therefore, no data were obtained for root length increment in the soil from this site (Figure 5B,C). At the other sites, i.e., S2 and S3, the number of germinated seeds was generally similar (97 seeds) in both time points. The number of germinated seeds was slightly but significantly higher only in autumn at S2 and amounted to 99 seeds.
The results concerning the root length measured after 2 and 4 days (Figure 5B,C) showed that the increments in autumn at both sites, i.e., S2 and S3, were significantly higher than in summer. Root length measured after 2 days (Figure 5B) in autumn did not differ significantly between individual points and amounted to 27.57 and 28.70. In contrast, root length in summer was significantly greater at S2 (22.03). Different observations were made for root measurements after 4 days (Figure 5C), where in summer, there were no significant differences between S2 and S3 (40.37–43.75). In contrast, such differences occurred in autumn. Significantly, the highest value was obtained for the farthest site, i.e., S3 (55.37 cm).

4. Discussion

Soil microorganisms are the foundation of many different ecosystem functions [20,21,22], and their abundance, richness and composition are sensitive to changes in the soil environment [44,45]; thus, they are considered early indicators of changes in its quality [46]. All changes in the soil microbiota have a significant impact on the cycle of nutrients, carbon, nitrogen, as well as greenhouse gas emissions [47,48]. Considering the importance of soil microbial diversity for the multifunctionality of ecosystems, it seems justified to include its analysis when studying all mechanism of the soil environment’s response to climate change, as well as to various human activities. Both of these factors significantly affect the physical and chemical properties of the soil [2,3], which in turn translate into the activity, abundance and biodiversity of soil microorganisms, which have been confirmed in the present study. Significant changes in the number of both bacteria and fungi recorded between individual sampling sites proved that changes in the chemical properties of the soil had the main impact on this parameter. This was confirmed by principal component analysis, which showed a negative correlation of both oligotrophic bacteria and filamentous fungi with soil pH (Figure 6). In addition, the smallest number of soil microorganisms was recorded in S1, characterized by a strongly alkaline pH (>9.0). Along with increasing distance from the source of pollution, the value of this parameter also grew significantly, which was probably related to the improvement in soil chemical conditions (decrease in pH).
This was confirmed by the correlation results at the “combination” level where significant positive correlations were recorded at S2 and S3 (Figure 7). The presented results may also be evidence of the high sensitivity of soil microorganisms to the stress factor, i.e., soil pH, due to the rather significant differences in the abundance between the individual analyzed sites at a relatively short distance.
Confirmation of the negative impact of soil pH on both groups of microorganisms was also shown for the correlation results at the level of the soil profile, where significant negative correlations for both bacteria and fungi were recorded (Figure 8). Generally, higher numbers were observed in the upper soil layer for both tested groups of microorganisms. Perhaps this was due to the fact that soil surface layers were porous and characterized by a more frequent occurrence of dry–wet cycles. This, in turn, caused an influx of fresh substrates and nutrients, which translated into relatively higher microbial activity [22]. Moreover, as reported by Naylor et al. [22], minerals such as sodium were more susceptible to leaching; thus, their concentration tended to increase with depth. This, in turn, could translate into deterioration of soil physicochemical conditions, with which soil microorganisms were strongly associated [23,24].
For both bacteria and fungi, the highest numbers were recorded in autumn. A similar trend was observed by Fan et al. [49]. This proved that the obtained microbial counts were probably also affected by seasonal changes. They were shown to be related to climatic fluctuations, including humidity and temperature in field conditions, which according to Li et al. [50], were key indicators affecting the soil microbiome. More pronounced changes in the case of bacteria were probably due to their greater sensitivity to unfavorable conditions compared to fungi, which showed greater resistance [51].
Soil respiratory activity, i.e., CO2 emissions from the soil surface, can also be a good indicator of ecological disturbance of the soil environment. CO2 can have different sources [30]; therefore, its generation stream is of global importance. It is a powerful regulator of the greenhouse effect and the global climate because it affects the global carbon cycle [52,53]. According to Grzyb et al. [54] and Kwiatkowska et al. [55], carbon mineralization was primarily related to organic matter. In turn, Bao et al. [56] and Hou et al. [57] proved that climatic factors, such as temperature and humidity, mainly influenced soil respiratory activity. It is likely that soil water content may have been one of the factors that contributed to the stimulation, albeit with varying degrees of intensity, of respiratory activity between the different sampling points in the current study. This was partially confirmed by the correlation results at the “combination“ level, where significant positive correlations were recorded at S1 between carbon content and moisture content (Figure 7). Quemada and Menacho [58] already reported that soil respiration was strongly influenced by water content and temperature. We also obtained the highest values of this parameter in summer, when high temperatures and water content probably contributed to the stimulation of respiration [58,59]. Sodium hydroxide was also a factor that could have affected the respiratory activity of the soil. According to Wong et al. [60], soil organic carbon could be rapidly lost under sodium conditions. This is due to the dispersion of soil aggregates and thus the release of organic matter accumulated in them. This may have stimulated, in our study, the activity of microorganisms in relation to carbon mineralization, by decomposing not only easily degradable carbon compounds, but also those that are hard to access. These observations were confirmed by significant positive correlations of respiratory activity with TOC at the “combination” level in sites located closest to the waste reservoir (Figure 7). We also recorded positive correlations of these parameters at the level of soil profiles: 0–20 and 20–40 cm (Figure 8). We recorded the highest significant positive correlation of this indicator with TOC in autumn. Perhaps some additional source of fresh organic matter also contributed to this effect, e.g., in the form of plant residues during the growing season. On the other hand, the soil microbiota utilizes only part of the carbon contained in the substrates for growth and maintenance of microbial structures, while the rest is released into the atmosphere in the form of CO2 [61]. Respiratory activity can be a good measure of stress factors because, firstly, it reflects the efficiency of microorganisms, and secondly, higher amounts of CO2 were shown to be produced under stress conditions [61]. This was also confirmed by the present results, indicating an increased CO2 emission from the soil at the site with most unfavorable conditions, i.e., S1. These observations additionally indicated that an increased amount of greenhouse gas was emitted from degraded soil, which could contribute to the worsening of the greenhouse effect [62].
In addition to biological and biochemical activity, soil enzymes are other rapid and sensitive “receptors” of environmental and anthropogenic stress factors. They are similarly closely associated with the physical and chemical properties of the soil and climatic conditions [31,49,63]. The latter reports were also confirmed by our research, in which both soil moisture and pH, as well as seasonal changes, were probably the main factors that contributed to the fluctuations in the activity of the enzymes studied. This was supported by the results of principal component analysis, where we noted negative correlations of soil pH with all analyzed enzymes (Figure 6). Therefore, it could be one of the factors limiting the activity of soil enzymes, especially at the site closest to the waste reservoir. This applied, among others, to the activity of dehydrogenase, acid phosphatase and fluorescein hydrolytic activity (FDA). These observations were also confirmed by significant negative correlations between dehydrogenase and soil pH in sites located closest to the waste reservoir (Figure 7). The dependence of the activity of soil enzymes on soil pH has been repeatedly analyzed in various conditions [18,64,65]. However, in the case of acid phosphatase activity and FDA, negative correlations with soil pH were recorded at the level of both soil profiles (Figure 8). With respect to acid phosphatase, we also noted negative correlations with soil pH at the level of seasonal changes (Figure 9). The situation was different for alkaline phosphatase, where the tested conditions, especially soil pH, had a stimulating effect on this enzyme. This was confirmed by positive correlations with soil pH at all sampling sites (Figure 7). The varying effects of soil pH on the enzymatic activity could be due to the high complexity of the role of this parameter. It affects, among others, the process of decomposition and mineralization of soil organic molecules, dispersion and aggregation of soil colloids, the number and activity of microorganisms, and redox reactions, which in turn translated into the activity of soil enzymes [66]. As with respiratory activity, varying enzyme activities were probably also influenced by sodium hydroxide, which not only increased soil pH, but also affected soil structure. These observations were confirmed by significant positive correlations with TOC at the site closest to the reservoir for all analyzed enzymes, except for dehydrogenase. As reported by Mavi and Marschnera [67], increasing sodium saturation in the soil caused the dispersion of organic matter and clay particles, thereby damaging aggregates and soil structure, which probably contributed to the release of organic matter accumulated in them. Positive correlations with TOC were also recorded for protease, FDA and acid phosphatase for the 20–40 cm profile (Figure 8). This was probably also related to the presence of sodium, whose concentration increased with depth [22]. The positive correlations with TOC of the tested parameters in autumn (Figure 9) were associated, as in the case of microorganisms and respiratory activity, with the supply of an additional source of organic matter, such as plant residues during the growing season. Nitrogen was another biogen that also significantly affected the activity of enzymes. This was confirmed by both principal component analysis (Figure 6) and the significant positive correlations recorded for all TN levels with the enzymes studied (Figure 7, Figure 8 and Figure 9). The important role of nitrogen in shaping soil enzyme activity has also been demonstrated by other authors [68,69]. The activity of the analyzed enzymes was also affected by climatic conditions, especially moisture. We recorded significant positive correlations of moisture content with all analyzed enzymes (Figure 9). The present study has shown that soil enzymes have great potential to respond rapidly to environmental changes, and can therefore serve as indicators of the health and quality of the soil environment.
Chemical degradation typically negatively affects the physical, chemical and microbiological properties of the soil environment, which also carries the risk of disturbing the living conditions of plants [11]. Therefore, it is important to monitor the effects of different types of harmful substances on parameters related to plant growth and development. Phytotoxic parameters are often used to assess the effects of various substances on the soil environment [17,70,71,72]. The conducted research indicated that sodium hydroxide was the main factor limiting plant growth in the current study. This was evidenced by germination inhibition of the test plant L. sativum in the soil collected closest to the waste reservoir. This was probably due to the strong alkalization of the soil environment. These observations were confirmed by the recorded significant negative correlations of soil pH with all parameters related to phytotoxicity (Figure 6). As the distance from the source of contamination increased, the soil pH decreased, which in turn translated into an improvement in phytotoxic parameters. This was supported by the results of correlations at the “combination” level between the discussed parameters, where significant positive correlations were observed at site S3, located farthest from the waste reservoir (Figure 7). Soil pH was also a limiting factor for both germination and root length increments of L. sativum at the soil profile level (Figure 8). The stimulation of parameters related to phytotoxicity in autumn was, to some extent, caused by better availability of the basic nutrient, important in terms of plant nutrition, i.e., TN (Table 2). This was confirmed by the recorded significant positive correlations between these parameters (Figure 9).
The present study has shown that soil microbiological, biochemical and enzymatic indicators, as well as phytotoxicity, have the potential to respond quickly to environmental changes. Therefore, they can be used to assess the effects of the impact of various wastes on soils used for various purposes, e.g., arable soils and soils of post-industrial areas [55,73].

5. Conclusions

All the analyzed parameters of the activity of soil microorganisms and phytotoxicity showed significant changes in the level at individual sampling sites. The soil located closest to the liquid waste reservoir had the lowest values of the microbiological, biochemical and enzymatic activities, while phytotoxicity had the highest. Individual activities showed changes depending on the season and soil layer. Bacterial and fungal counts and acid phosphatase activity remained at the lowest levels at S1 in spring and autumn in both soil layers (0–40 cm). For the other activities, i.e., respiration, protease, alkaline phosphatase and fluorescein hydrolytic activity, the effect was more pronounced in both layers only in autumn. The phytotoxicity results showed that conditions near the emitter of pollution were unfavorable for seed germination. The above observations support the hypothesis that the applied microbial activity parameters are sensitive indicators of soil changes caused by liquid waste. Considering the duration of these changes and the profile level at which they persisted, it should be pointed out that the total bacterial and fungal counts, and the activities of acid phosphatase, alkaline phosphatase and fluorescein hydrolytic activity were the most useful in monitoring the condition of soils exposed to degradation caused by increased pH. The results also partially confirmed the second hypothesis that soil contamination with waste would affect soil microbial populations in the deeper soil layer, i.e., 20–40 cm. In contrast, it does not result in negative changes further away from the reservoir.
Such strong changes in the activity of bacterial and fungal populations in the soil located closest to the waste reservoir, where the pH was the highest (pH 9), suggested that this could be a site of selection of microorganisms resistant to high pH. These observations suggest the need to continue research into the biodiversity of microbiota and mycobiota inhabiting this site.
The present study provides guidelines that can be helpful in assessing the degree of soil environment degradation caused by liquid waste reservoirs and in evaluating the effectiveness of safeguards for such reservoirs.

Author Contributions

Conceptualization, J.J. and E.K.; methodology, J.J.; software, E.K. and C.A.K.; validation, J.J., E.K. and C.A.K.; formal analysis, J.J. and E.K.; investigation, J.J. and E.K.; resources, J.J. and C.A.K.; data curation, E.K.; writing—original draft preparation, E.K.; writing—review and editing, J.J. and E.K.; visualization, E.K.; supervision, J.J.; project administration, J.J.; funding acquisition, J.J. All authors have read and agreed to the published version of the manuscript.

Funding

This work was financially supported by the University of Life Sciences in Lublin.

Data Availability Statement

Additional information is provided by the corresponding author.

Acknowledgments

The authors thank Michał Bańko for inspiration for research, for help in collecting soil material and in documentation.

Conflicts of Interest

The authors declare no conflict of interest.

References

  1. Bünemann, E.K.; Bongiorno, G.; Bai, Z.; Creamer, R.E.; De Deyn, G.; de Goede, R.; Fleskens, L.; Geissen, V.; Kuyper, T.W.; Mäder, P.; et al. Soil quality—A critical review. Soil Biol. Biochem. 2018, 120, 105–125. [Google Scholar] [CrossRef]
  2. Borrelli, P.; Robinson, D.A.; Panagos, P.; Lugato, E.; Yang, J.E.; Alewell, C.; Wuepper, D.; Montanarella, L.; Ballabio, C. Land use and climate change impacts on global soil erosion by water (2015–2070). Proc. Natl. Acad. Sci. USA 2020, 117, 21994–22001. [Google Scholar] [CrossRef] [PubMed]
  3. Kuzyakov, Y.; Gunina, A.; Zamanian, K.; Tian, J.; Luo, Y.; Xu, X.; Yudina, A.; Aponte, H.; Alharbi, H.; Ovsepyan, L.; et al. New approaches for evaluation of soil health, sensitivity and resistance to degradation. Front. Agric. Sci. Eng. 2020, 7, 282–288. [Google Scholar] [CrossRef]
  4. Kuzyakov, Y.; Zamanian, K. Reviews and syntheses: Agropedogenesis–humankind as the sixth soil-forming factor and attractors of agricultural soil degradation. Biogeosciences 2019, 16, 4783–4803. [Google Scholar] [CrossRef] [Green Version]
  5. Nunes, F.C.; de Jesus Alves, L.; de Carvalho, C.C.N.; Gross, E.; de Marchi Soares, T.; Prasad, M.N.V. Soil as a complex ecological system for meeting food and nutritional security. In Climate Change and Soil Interactions; Prasad, M.N.V., Pietrzykowski, M., Eds.; Elsevier Inc.: Amsterdam, The Netherlands; Academic Press: Cambridge, MA, USA, 2020; pp. 229–269. [Google Scholar] [CrossRef]
  6. FAO; ITPS. Status of the World’s Soil Resources (SWSR)—Main Report. Food and Agriculture Organization of the United Nations and Intergovernmental Technical Panel on Soils, Rome, Italy. 2015. Available online: http://www.fao.org/3/a-i5199e.pdf (accessed on 3 November 2022).
  7. IPBES. The IPBES assessment report on land degradation and restoration. In Intergovernmental Science-Policy Platform on Biodiversity and Ecosystem Services; Montanarella, L., Scholes, R., Brainich, A., Eds.; Zenodo: Bonn, Germany, 2018; p. 744. [Google Scholar] [CrossRef]
  8. Gomiero, T. Soil Degradation, Land Scarcity and Food Security: Reviewing a Complex Challenge. Sustainability 2016, 8, 281. [Google Scholar] [CrossRef] [Green Version]
  9. Keesstra, S.; Mol, G.; De Leeuw, J.; Okx, J.; Molenaar, C.; De Cleen, M.; Visser, S. Soil-Related Sustainable Development Goals: Four Concepts to Make Land Degradation Neutrality and Restoration Work. Land 2018, 7, 133. [Google Scholar] [CrossRef] [Green Version]
  10. Saljnikov, E.; Lavrishchev, A.; Römbke, J.; Rinklebe, J.; Scherber, C.; Wilke, B.-M.; Tóth, T.; Blum, W.E.H.; Behrendt, U.; Eulenstein, F.; et al. Understanding and Monitoring Chemical and Biological Soil Degradation. In Advances in Understanding Soil Degradation. Innovations in Landscape Research; Saljnikov, E., Mueller, L., Lavrishchev, A., Eulenstein, F., Eds.; Springer: Cham, Switzerland, 2022; pp. 75–124. [Google Scholar] [CrossRef]
  11. Richmond, N.T. Chemical soil degradation as a result of contamination: A review. J. Soil Sci. Environ. Manag. 2015, 6, 301–308. [Google Scholar] [CrossRef]
  12. Neina, D. The role of soil pH in plant nutrition and soil remediation. Appl. Environ. Soil Sci. 2019, 2019, 5794869. [Google Scholar] [CrossRef] [Green Version]
  13. Jiang, Y.; Li, Y.; Zeng, Q.; Wei, J.; Yu, H. The effect of soil pH on plant growth, leaf chlorophyll fluorescence and mineral element content of two blueberries. Acta Hortic. 2017, 1180, 269–276. [Google Scholar] [CrossRef]
  14. Ferreira, C.S.; Seifollahi-Aghmiuni, S.; Destouni, G.; Ghajarnia, N.; Kalantari, Z. Soil degradation in the European Mediterranean region: Processes, status and consequences. Sci. Total Environ. 2022, 805, 150106. [Google Scholar] [CrossRef]
  15. Alvarenga, P.; Rodrigues, D.; Mourinha, C.; Palma, P.; de Varennes, A.; Cruz, N.; Tarelho, L.A.C.; Rodrigues, S. Use of wastes from the pulp and paper industry for the remediation of soils degraded by mining activities: Chemical, biochemical and ecotoxicological effects. Sci. Total Environ. 2019, 686, 1152–1163. [Google Scholar] [CrossRef] [PubMed]
  16. Gałązka, A.; Marzec-Grządziel, A.; Grządziel, J.; Varsadiya, M.; Pawlik, Ł. Fungal genetic biodiversity and metabolic activity as an indicator of potential biological weathering and soil formation—Case study of towards a better understanding of Earth system dynamics. Ecol. Indic. 2022, 141, 109136. [Google Scholar] [CrossRef]
  17. Joniec, J.; Oleszczuk, P.; Jezierska-Tys, S.; Kwiatkowska, E. Effect of reclamation treatments on microbial activity and phytotoxicity of soil degraded by the sulphur mining industry. Environ. Pollut. 2019, 252, 1429–1438. [Google Scholar] [CrossRef] [PubMed]
  18. Joniec, J.; Żukowska, G.; Bik-Małodzińska, M.; Kwiatkowska, E.; Rojek, K. Reaction of Microorganisms to Long-Term Waste Reclamation of Soil Degraded by the Sulfur Mining Industry. Minerals 2021, 11, 1226. [Google Scholar] [CrossRef]
  19. Wyszkowska, J.; Borowik, A.; Zaborowska, M.; Kucharski, J. Evaluation of the Usefulness of Sorbents in the Remediation of Soil Exposed to the Pressure of Cadmium and Cobalt. Materials 2022, 15, 5738. [Google Scholar] [CrossRef]
  20. Ananyeva, N.D.; Ivashchenko, K.V.; Sushko, S.V. Microbial Indicators of Urban Soils and Their Role in the Assessment of Ecosystem Services: A Review. Eurasian Soil Sci. 2021, 54, 1517–1531. [Google Scholar] [CrossRef]
  21. Mencel, J.; Mocek-Płóciniak, A.; Kryszak, A. Soil Microbial Community and Enzymatic Activity of Grasslands under Different Use Practices: A Review. Agronomy 2022, 12, 1136. [Google Scholar] [CrossRef]
  22. Naylor, D.; McClure, R.; Jansson, J. Trends in Microbial Community Composition and Function by Soil Depth. Microorganisms 2022, 10, 540. [Google Scholar] [CrossRef]
  23. Hermans, S.M.; Buckley, H.L.; Case, B.S.; Curran-Cournane, F.; Taylor, M.; Lear, G. Using soil bacterial communities to predict physico-chemical variables and soil quality. Microbiome 2020, 8, 79. [Google Scholar] [CrossRef]
  24. Shi, Y.; Li, Y.; Yang, T.; Chu, H. Threshold effects of soil pH on microbial co-occurrence structure in acidic and alkaline arable lands. Sci. Total Environ. 2021, 800, 149592. [Google Scholar] [CrossRef]
  25. Wang, C.; Zhou, X.; Guo, D.; Zhao, J.; Yan, L.; Feng, G.; Gao, Q.; Yu, H.; Zhao, L. Soil pH is the primary factor driving the distribution and function of microorganisms in farmland soils in northeastern China. Ann. Microbiol. 2019, 69, 1461–1473. [Google Scholar] [CrossRef] [Green Version]
  26. Majewska, M.; Jaroszuk-Ściseł, J. Mobilization of cadmium from Festuca ovina roots and its simultaneous immobilization by soil in a root-soil-extractant system (in vitro test). Int. J. Phytoremediat. 2017, 19, 701–708. [Google Scholar] [CrossRef] [PubMed]
  27. Joniec, J.; Furczak, J.; Kwiatkowska, E. Application of biological indicators for estimation of remediation of soil degraded by sulphur industry. Ecol. Chem. Eng. S 2015, 22, 269–283. [Google Scholar] [CrossRef] [Green Version]
  28. Gyawali, A.J.; Lester, B.J.; Stewart, R.D. Talking SMAAC: A New Tool to Measure Soil Respiration and Microbial Activity. Front. Earth Sci. 2019, 7, 138. [Google Scholar] [CrossRef]
  29. Kuzyakov, Y. Sources of CO2 efflux from soil and review of partitioning methods. Soil Biol. Biochem. 2006, 38, 425–448. [Google Scholar] [CrossRef]
  30. Joniec, J. Enzymatic activity as an indicator of regeneration processes in degraded soil reclaimed with various types of waste. Int. J. Environ. Sci. Technol. 2018, 15, 2241–2252. [Google Scholar] [CrossRef] [Green Version]
  31. Lee, S.-H.; Kim, M.-S.; Kim, J.-G.; Kim, S.-O. Use of Soil Enzymes as Indicators for Contaminated Soil Monitoring and Sustainable Management. Sustainability 2020, 12, 8209. [Google Scholar] [CrossRef]
  32. Furtak, K.; Gałązka, A. Enzymatic activity as a popular parameter used to determine the quality of the soil environment. Pol. J. Agron. 2019, 37, 22–30. [Google Scholar] [CrossRef]
  33. Patle, P.N.; Navnage, N.P.; Barange, P.K. Fluorescein diacetate (FDA): Measure of total microbial activity and as indicator of soil quality. Int. J. Curr. Microbiol. Appl. Sci. 2018, 7, 2103–2107. [Google Scholar] [CrossRef]
  34. Köhler, J.M.; Beetz, N.; Günther, P.M.; Möller, F.; Cao, J. Extremophiles in Soil Communities of Former Copper Mining Sites of the East Harz Region (Germany) Reflected by Re-Analyzed 16S rRNA Data. Microorganisms 2021, 9, 1422. [Google Scholar] [CrossRef]
  35. Jeong, S.-W.; Choi, Y.J. Extremophilic Microorganisms for the Treatment of Toxic Pollutants in the Environment. Molecules 2020, 25, 4916. [Google Scholar] [CrossRef] [PubMed]
  36. Kochhar, N.; Kavya, I.K.; Shrivastava, S.; Ghosh, A.; Rawat, V.S.; Sodhi, K.K.; Kumar, M. Perspectives on the microorganism of extreme environments and their applications. Curr. Res. Microb. Sci. 2022, 3, 100134. [Google Scholar] [CrossRef] [PubMed]
  37. Foght, J.; Aislabie, J. Enumeration of Soil Microorganisms. In Monitoring and Assessing Soil Bioremediation. Soil Biology Part 5; Margesin, R., Schinner, F., Eds.; Springer: Berlin/Heidelberg, Germany, 2005; pp. 261–280. ISBN 978-3-540-25346-4. [Google Scholar] [CrossRef]
  38. Martin, J.P. Use of acid rose bengal and streptomycin in the plate method for estimating soil fungi. Soil Sci. 1950, 69, 215–232. [Google Scholar] [CrossRef]
  39. Rühling, A.; Tyler, G. Heavy metal pollutions and decomposition of Spruce Needle litter. Oikos 1973, 24, 402–415. [Google Scholar] [CrossRef]
  40. Thalmann, A. Zur Methodik der Bestimmung der dehydrogenaseactivität im boden mittels triphenyltetrazoliumchlorid (TTC). Landwirtsch Forsch. 1968, 21, 249–258. [Google Scholar]
  41. Ladd, J.N.; Butler, J.A.H. Short-term assays of soil proteolytic enzyme activities using proteins and dipeptide derivatives as substrates. Soil Biol. Biochem. 1972, 4, 19–30. [Google Scholar] [CrossRef]
  42. Tabatabai, M.A.; Bremner, J.M. Use of p-nitrophenyl phosphate for assay of soil phosphatase activity. Soil Biol. Biochem. 1969, 1, 301–307. [Google Scholar] [CrossRef]
  43. Schnurer, J.; Rosswall, T. Fluorescein Diacetate Hydrolysis as a measure of total microbial acticity in soil and litter. Appl. Environ. Microbiol. 1982, 43, 1256–1261. [Google Scholar] [CrossRef] [Green Version]
  44. Shah, A.M.; Khan, I.M.; Shah, T.I.; Bangroo, S.A.; Kirmani, N.A.; Nazir, S.; Malik, A.R.; Aezum, A.M.; Mir, Y.H.; Hilal, A.; et al. Soil Microbiome: A Treasure Trove for Soil Health Sustainability under Changing Climate. Land 2022, 11, 1887. [Google Scholar] [CrossRef]
  45. Qiu, L.; Zhang, Q.; Zhu, H.; Reich, P.B.; Banerjee, S.; van der Heijden, M.G.A.; Sadowsky, M.J.; Ishii, S.; Jia, X.; Shao, M.; et al. Erosion reduces soil microbial diversity, network complexity and multifunctionality. ISME J. 2021, 15, 2474–2489. [Google Scholar] [CrossRef]
  46. Nosrati, K.; Collins, A.L. A soil quality index for evaluation of degradation under land use and soil erosion categories in a small mountainous catchment, Iran. J. Mt. Sci. 2019, 16, 2577–2590. [Google Scholar] [CrossRef]
  47. Muhammad, I.; Lv, J.Z.; Wang, J.; Ahmad, S.; Farooq, S.; Ali, S.; Zhou, X.B. Regulation of Soil Microbial Community Structure and Biomass to Mitigate Soil Greenhouse Gas Emission. Front. Microbiol. 2022, 13, 868862. [Google Scholar] [CrossRef] [PubMed]
  48. You, X.; Wang, S.; Du, L.; Wu, H.; Wei, Y. Effects of organic fertilization on functional microbial communities associated with greenhouse gas emissions in paddy soils. Environ. Res. 2022, 213, 113706. [Google Scholar] [CrossRef] [PubMed]
  49. Fan, L.; Tarin, M.W.K.; Zhang, Y.; Han, Y.; Rong, J.; Cai, X.; Chen, L.; Shi, C.; Zheng, Y. Patterns of soil microorganisms and enzymatic activities of various forest types in coastal sandy land. Glob. Ecol. Conserv. 2021, 28, e01625. [Google Scholar] [CrossRef]
  50. Li, G.; Kim, S.; Han, S.H.; Chang, H.; Du, D.; Son, Y. Precipitation affects soil microbial and extracellular enzymatic responses to warming. Soil Biol. Biochem. 2018, 120, 212–221. [Google Scholar] [CrossRef]
  51. Stanaszek-Tomal, E. Environmental Factors Causing the Development of Microorganisms on the Surfaces of National Cultural Monuments Made of Mineral Building Materials—Review. Coatings 2020, 10, 1203. [Google Scholar] [CrossRef]
  52. Bond-Lamberty, B.; Thomson, A. Temperature-associated increases in the global soil respiration record. Nature 2010, 464, 579–582. [Google Scholar] [CrossRef]
  53. Le Quéré, C.; Andrew, R.M.; Friedlingstein, P.; Sitch, S.; Hauck, J.; Pongratz, J.; Pickers, P.A.; Korsbakken, J.I.; Peters, G.P.; Canadell, J.G.; et al. Global carbon budget 2013. Earth Syst. Sci. Data 2013, 6, 235–263. [Google Scholar] [CrossRef] [Green Version]
  54. Grzyb, A.; Wolna-Maruwka, A.; Niewiadomska, A. Environmental Factors Affecting the Mineralization of Crop Residues. Agronomy 2020, 10, 1951. [Google Scholar] [CrossRef]
  55. Kwiatkowska, E.; Joniec, J. Effects of Agricultural Management of Spent Mushroom Waste on Phytotoxicity and Microbiological Transformations of C, P, and S in Soil and Their Consequences for the Greenhouse Effect. Int. J. Environ. Res. Public Health 2022, 19, 12915. [Google Scholar] [CrossRef]
  56. Bao, X.; Zhu, X.; Chang, X.; Wang, S.; Xu, B.; Luo, C.; Zhang, Z.; Wang, Q.; Rui, Y.; Cui, X. Effects of soil temperature and moisture on soil respiration on the Tibetan plateau. PLoS ONE 2016, 11, e0165212. [Google Scholar] [CrossRef] [PubMed] [Green Version]
  57. Hou, T.; Wang, Y.; Guo, F.; Jia, Q.; Wu, X.; Wang, E.; Hong, J. Soil Respiration Characteristics and Influencing Factors for Apple Orchards in Different Regions on the Loess Plateau of Shaanxi Province. Sustainability 2021, 13, 4780. [Google Scholar] [CrossRef]
  58. Quemada, M.; Menacho, E. Soil respiration 1 year after sewage sludge application. Biol. Fertil. Soils 2001, 33, 344–346. [Google Scholar] [CrossRef]
  59. Frank, A.B.; Liebig, M.A.; Hanson, J.D. Soil carbon dioxide fluxes in northern semiarid grasslands. Soil Biol. Biochem. 2002, 34, 1235–1241. [Google Scholar] [CrossRef]
  60. Wong, V.N.; Dalal, R.C.; Greene, R.S. Salinity and sodicity effects on respiration and microbial biomass of soil. Biol. Fertil. Soils 2008, 44, 943–953. [Google Scholar] [CrossRef]
  61. Gonzalez-Quinones, V.; Stockdale, E.A.; Banning, N.C.; Hoyle, F.C.; Sawada, Y.; Wherrett, A.D.; Jones, D.L.; Murphy, D.V. Soil microbial biomass—Interpretation and consideration for soil monitoring. Soil Res. 2011, 49, 287–304. [Google Scholar] [CrossRef]
  62. Lal, R. Soil Erosion and Gaseous Emissions. Appl. Sci. 2020, 10, 2784. [Google Scholar] [CrossRef]
  63. Xie, X.; Pu, L.; Wang, Q.; Zhu, M.; Xu, Y.; Zhang, M. Response of soil physicochemical properties and enzyme activities to long-term reclamation of coastal saline soil, Eastern China. Sci. Total Environ. 2017, 607–608, 1419–1427. [Google Scholar] [CrossRef]
  64. Bueis, T.; Turrión, M.B.; Bravo, F.; Pando, V.; Muscolo, A. Factors determining enzyme activities in soils under Pinus halepensis and Pinus sylvestris plantations in Spain: A basis for establishing sustainable forest management strategies. Ann. For. Sci. 2018, 75, 1–13. [Google Scholar] [CrossRef] [Green Version]
  65. Wojewódzki, P.; Lemanowicz, J.; Debska, B.; Haddad, S.A. Soil Enzyme Activity Response under the Amendment of Different Types of Biochar. Agronomy 2022, 12, 569. [Google Scholar] [CrossRef]
  66. Dick, W.A.; Cheng, L.; Wang, P. Soil acid and alkaline phosphatase activity as pH adjustment indicators. Soil Biol. Biochem. 2000, 32, 1915–1919. [Google Scholar] [CrossRef]
  67. Mavi, M.S.; Marschnera, P. Impact of Salinity on Respiration and Organic Matter Dynamics in Soils is More Closely Related to Osmotic Potential than to Electrical Conductivity. Pedosphere 2017, 27, 949–956. [Google Scholar] [CrossRef]
  68. Dong, L.; Berg, B.; Gu, W.; Wang, Z.; Sun, T. Effects of different forms of nitrogen addition on microbial extracellular enzyme activity in temperate grassland soil. Ecol. Process. 2022, 11, 36. [Google Scholar] [CrossRef]
  69. Liu, M.; Gan, B.; Li, Q.; Xiao, W.; Song, X. Effects of Nitrogen and Phosphorus Addition on Soil Extracellular Enzyme Activity and Stoichiometry in Chinese Fir (Cunninghamia lanceolata) Forests. Front. Plant Sci. 2022, 13, 834184. [Google Scholar] [CrossRef]
  70. Clasen, B.; de Moura Lisbôa, R. Ecotoxicological Tests as a Tool to Assess the Quality of the Soil. In Soil Contamination and Alternatives for Sustainable Development; Vázquez-Luna, D., Cuevas-Díaz, M.D.C., Eds.; IntechOpen: London, UK, 2019; pp. 13–33. [Google Scholar] [CrossRef] [Green Version]
  71. Godlewska, P.; Jośko, I.; Oleszczuk, P. Ecotoxicity of sewage sludge- or sewage sludge/willow-derived biochar-amended soil. Environ. Pollut. 2022, 305, 119235. [Google Scholar] [CrossRef]
  72. Seneviratne, M.; Rajakaruna, N.; Rizwan, M.; Madawala, H.M.S.P.; Sik Ok, Y.; Vithanage, M. Heavy metal-induced oxidative stress on seed germination and seedling development: A critical review. Environ. Geochem. Health 2019, 41, 1813–1831. [Google Scholar] [CrossRef]
  73. Joniec, J.; Kwiatkowska, E.; Kwiatkowski, C.A. Assessment of the Effects of Soil Fertilization with Spent Mushroom Substrate in the Context of Microbial Nitrogen Transformations and the Potential Risk of Exacerbating the Greenhouse Effect. Agriculture 2022, 12, 1190. [Google Scholar] [CrossRef]
Scheme 1. Sampling location.
Minerals 13 00012 sch001
Figure 1. Number of selected groups of bacteria and fungi in soil from 0–20 and 20–40 cm depths: (A) oligotrophic bacteria; (B) filamentous fungi. Legend: S1, S2, S3—sampling sites located S1—5.88 m, S2—22.7 and S3—50.08 m from the reservoir with liquid post-production waste. Vertical lines indicate the standard deviation. Different letters above the columns indicate significant differences at p < 0.05.
Minerals 13 00012 g001
Figure 2. Biochemical and enzymatic activity in soil from 0–20 and 20–40 cm depths: (A) respiration; (B) dehydrogenases activity. Legend: S1, S2, S3—sampling sites located S1—5.88, S2—22.7 and S3—50.08 m from the reservoir with liquid post-production waste. Vertical lines indicate the standard deviation. Different letters above the columns indicate significant differences at p < 0.05.
Minerals 13 00012 g002
Figure 3. Enzymatic actvity in soil from 0–20 and 20–40 cm depths: (A) acid phosphatase; (B) alkaline phosphatase. Legend: S1, S2, S3—sampling sites located S1—5.88, S2—22.7 and S3—50.08 m from the reservoir with liquid post-production waste. Vertical lines indicate the standard deviation. Different letters above the columns indicate significant differences at p < 0.05.
Minerals 13 00012 g003
Figure 4. Enzymatic activity in soil from 0–20 and 20–40 cm depths continued: (A) protease; (B) FDA hydrolytic activity. Legend: S1, S2, S3—sampling sites located S1—5.88, S2—22.7 and S3—50.08 m from the reservoir with liquid post-production waste. Vertical lines indicate the standard deviation. Different letters above the columns indicate significant differences at p < 0.05.
Minerals 13 00012 g004
Figure 5. Soil phytotoxicity indicators from the 0–20 cm layer: (A) L. sativum seed germination; (B) seedling root length after 2 days; (C) seedling root length after 4 days. S1, S2, S3 —sampling sites located S1—5.88, S2—22.7 and S3—50.08 m from the reservoir with liquid post-production waste. Vertical lines indicate the standard deviation. Different letters above the columns indicate significant differences at p < 0.05.
Minerals 13 00012 g005aMinerals 13 00012 g005b
Figure 6. Principal component analysis (PCA) for the results of analyzed parameters in the soil. OB—oligotrophic bacteria, FF—filamentous fungi, RES—respiration of soil, DEH—dehydrogenases, PRO—protease, FDA—fluorescein diacetate hydrolysis activity, AcP—acid phosphatase, AlP—alkaline phosphatase, GERM—germination of L. sativum, RL2—root length of L. sativum after two days, RL4—root length of L. sativum after four days, M—moisture, TOC—total organic carbon, TN—total nitrogen.
Minerals 13 00012 g006
Figure 7. Heat map displaying the Pearson correlation coefficients between chemical and physico-chemical properties; microbial, biochemical and enzymatic activity; and phytotoxic parameters at the “combination’’ level. Significant at * p < 0.05; ** p < 0.01; *** p < 0.001, respectively. S1, S2, S3—sampling sites located S1—5.88, S2—22.7 and S3—50.08 m from the reservoir with liquid post-production waste. OB—oligotrophic bacteria, FF—filamentous fungi, RES—respiration of soil, DEH—dehydrogenases, PRO—protease, FDA—fluorescein diacetate hydrolysis activity, AcP—acid phosphatase, AlP—alkaline phosphatase, GERM—germination of L. sativum, RL2—root length of L. sativum after two days, RL4—root length of L. sativum after four days, M—moisture, TOC—total organic carbon, TN—total nitrogen.
Minerals 13 00012 g007
Figure 8. Heat map displaying the Pearson correlation coefficients between chemical and physico-chemical properties; microbial, biochemical and enzymatic activity; and phytotoxic parameters at the level of the soil profile. Significant at * p < 0.05; ** p < 0.01; *** p < 0.001, respectively. Legend: 0–20, 20–40—soil profiles in cm. OB—oligotrophic bacteria, FF—filamentous fungi, RES—respiration of soil, DEH—dehydrogenases, PRO—protease, FDA—fluorescein diacetate hydrolysis activity, AcP—acid phosphatase, AlP—alkaline phosphatase, GERM—germination of L. sativum, RL2—root length of L. sativum after two days, RL4—root length of L. sativum after four days, M—moisture, TOC—total organic carbon, TN—total nitrogen.
Minerals 13 00012 g008
Figure 9. Heat map displaying the Pearson correlation coefficients between chemical and physico-chemical properties; microbial, biochemical and enzymatic activity; and phytotoxic parameters at the level of the seasonal variability. Significant at * p < 0.05; ** p < 0.01; *** p < 0.001, respectively. VII, IX—months of sampling, OB—oligotrophic bacteria, FF—filamentous fungi, RES—respiration of soil, DEH—dehydrogenases, PRO—protease, FDA—fluorescein diacetate hydrolysis activity, AcP—acid phosphatase, AlP—alkaline phosphatase, GERM—germination of L. sativum, RL2—root length of L. sativum after two days, RL4—root length of L. sativum after four days, M—moisture, TOC—total organic carbon, TN—total nitrogen.
Minerals 13 00012 g009
Table 1. Waste characteristics.
pH
1 mol KCl
Ca
mg kg−1
K
mg kg−1
Na
mg kg−1
waste1437.632887,000
Table 2. Soil characteristics.
Sampling LocationDepth
cm
pH
1 mol KCl
M
%
TOC
g kg−1
TN
g kg−1
sasasasa
S10–209.69.510.986.5913.0311.600.300.40
20–408.99.211.965.3611.909.000.100.20
S20–207.98.13.398.9610.6921.000.600.50
20–408.08.04.735.1618.2115.100.900.10
S30–207.97.95.259.778.6913.000.400.60
20–407.67.46.448.5510.1111.600.700.60
Abbreviations: S1—site 5.88 m away, S2—22.7 m away, S3—50.08 m away. M—soil moisture, TOC—total organic carbon, TN—total nitrogen, s—summer, a—autumn.
Disclaimer/Publisher’s Note: The statements, opinions and data contained in all publications are solely those of the individual author(s) and contributor(s) and not of MDPI and/or the editor(s). MDPI and/or the editor(s) disclaim responsibility for any injury to people or property resulting from any ideas, methods, instructions or products referred to in the content.

