Article

Three-Dimensional Lithospheric Electrical Structure beneath the Handan-Xingtai District, North China: Implications for Tectonic Control of Skarn-Iron Mineralization

School of Geophysics and Information Technology, China University of Geosciences, Beijing 100083, China
*
Author to whom correspondence should be addressed.
Minerals 2023, 13(1), 14; https://doi.org/10.3390/min13010014
Submission received: 6 November 2022 / Revised: 13 December 2022 / Accepted: 21 December 2022 / Published: 22 December 2022

Abstract

:
In this study, we determined the lithospheric electrical structure beneath the Handan-Xingtai district and its adjacent regions using magnetotelluric sounding data. To the west of the Handan-Xingtai district, the crust and upper mantle beneath the Taihang Mountains are mainly characterized by high resistivity (>1000 Ωm, which we interpreted to be the relic cratonic lithosphere. In contrast, the lithosphere beneath the North China Plain to the east shows high-conductivity features (<100 Ωm) overall, which may indicate that it has suffered significant modifications. Additionally, other geological and geophysical studies suggested that this district was located in a significant boundary zone where the lithospheric thickness, temperature and geochemistry properties sharply changed. Combined with our resistivity model, we attributed this to the different degrees of lithospheric modification. Specifically, since the late Mesozoic, the subduction, roll-back and dehydration of the Pacific slab caused an unsteady asthenospheric flow and upwelling; therefore, the deep-derived melts and fluids concentrated within the uppermost mantle had even underplated or intruded into the crust, while this process had a negligible effect on the Taihang Mountains. Small-scale mantle convection and upwelling are likely to occur in this kind of transfer zone of lithospherice properties, leading to mantle-derived melts and fluids transporting upwardly near the surface, which was confirmed by the significantly enhanced conductivity beneath the ore district in our resistivity model. During this process, Fe derived from mantle-source magma or relic Precambrian metamorphic basement beneath the Taihang Mountains was extracted and emplaced along with the Yanshanian magmatism.

1. Introduction

Skarn is a statement of a set of altered silicate mineral assemblages formed in the contact zones between intermediate acid intrusive rocks and carbonate rocks. Skarn-type iron deposits were widely supposed to be formed by the metasomatism between fluids and magmatic or wall rocks [1]. Bimetasomatism is one of the most acceptable mechanisms of water–rock interaction for the formation of Skarn-type iron deposits. Specifically, magma fluid acts as a reaction medium. Elements such as Si and Fe enter the fluid from the sides of magmatic rocks, while Ca and Mg enter through the carbonate wall rocks. Along with changes in temperature, pressure and oxygen fugacity, different kinds of skarn minerals can be successively extracted from the fluid [2]. Furthermore, some scholars suggested that magmatic skarn was formed by the intrusion and crystallization of calcium-silicate melt (fluid) or calcium skarn magma [3]. A previous review of the global distribution of skarn Fe-Cu deposits indicated that most of the skarn deposits occurred in continental-margin arcs formed by high-angle subduction and were closely related to the magmatism generated by oceanic subduction. However, it is puzzling that most of the skarn iron ores in China are mainly distributed in the stable intra-plate regions, which are far from active tectonic plate margins, unlike the global distribution [4,5]. Therefore, understanding the driving-force, sources and transporting pathways of ore-forming materials, magma and fluids of this kind of intra-plate skarn iron ores have a certain research value.
The Handan-Xingtai district (HXD, or Han-Xing district) is located in the central part of the North China Craton (NCC) and the southern Taihang Mountains tectonic-magmatic zone (Figure 1). The HXD is one of the most important contact metasomatic skarn-type iron ore clusters in China, with proven reserves of 900–1000 Mt and an average iron content of 40 to 55 wt% [6]. Due to the strong magmatic events during the Yanshanian period (~125–135 Ma) and superior tectonic environments, ideal geological conditions for mineralization were created for this district; the products are called ‘Han-Xing-type iron ore deposits’ [5]. Combined with geochronological data and the available isotopic dating data, the Fe mineralization and associated magmatism of the HXD mainly occurred at 137–133 Ma and 131–128 Ma [7]. Skarn-iron deposits are also widely distributed in other parts of the NCC contemporaneously forming the only known giant Mesozoic iron-skarn region on Earth (Figure 1a). Therefore, the HXD has a relatively important research significance [8].
Most scholars have reached a consensus that the iron-skarn mineralization in the HXD was consistent with the tectonic–magmatic–metallogenic events in the Taihang Mountains belt caused by the lithospheric destruction of the NCC, which observably indicated that there was a causal or genetic relationship between the two processes [6,7]. High-magnesium diorite played a crucial role in this process [15], and its formation may have been the result of lithospheric delamination or thinning [16,17]. Many previous studies from different disciplines have indicated that an important geological-geophysical transfer zone exists beneath the HXD due to the lithospheric deformation mentioned above, such as the bouguer gravity survey [18], geochemical research [19] and seismic imaging [11]. At present, there are still some important issues surrounding metallogenic information as a consensus cannot be reached, such as why metallogenic magma was generated in this intra-plate region and how the basic magma generated by the partial melting of the upper mantle migrated upward and injected into the intermediate-acidic magma chambers in the crust and mixed [7,8]. These issues are undoubtedly important for understanding the metallogenic mechanism of the skarn-type iron deposits in the HXD.
Since magnetotelluric sounding (MT) uses the same natural electromagnetic field as the source, it has a large detection depth and can be used to perform the geophysical imaging of electrical structures of the depths of crusts and even the top layer of the upper mantle [20,21]. It is important to note that all geophysical methods can only image the present lithosphere. However, almost all the instances of metal mineralization were ancient events. For example, the HXD mineralization mainly occurred in the Yanshanian period. Fortunately, the tectonic–magmatic events associated with mineralization can create specific ‘imprints’ within the crust or mantle beneath major ore-concentration areas [22], such as deep faults, mid-lower crustal detachments or even weakening of the upper-mantle zones, which can be retained over time and detected using geophysical methods, including MT [21]. These specific imprints can undoubtedly provide important constraints for determining the mineralization mechanisms of these ore-concentration areas. No magmatism as strong as the Yanshanian events was recorded in the HXD for the late Mesozoic and Cenozoic periods after mineralization [12]. Therefore, we infer that the lithospheric structure of the HXD may still largely retain its form during or after the Yanshanian iron mineralization.
Therefore, in this research, we obtained the present-day lithosphere-scale 3D electrical structure model of the HXD using a profile across this region that contains 26 MT sites. Based on this model, several pieces of important information, including the imaging and, therefore, the determination of the deep faults, intra-crustal and crust-mantle detachments, the possible fluid enrichment or the partial melting in the upper mantle are discussed. These are all closely related to mineralization, finally providing new geophysical constraints for the mineral sources and the migration channels of ore-forming magma or fluids in the skarn-mineralization system.

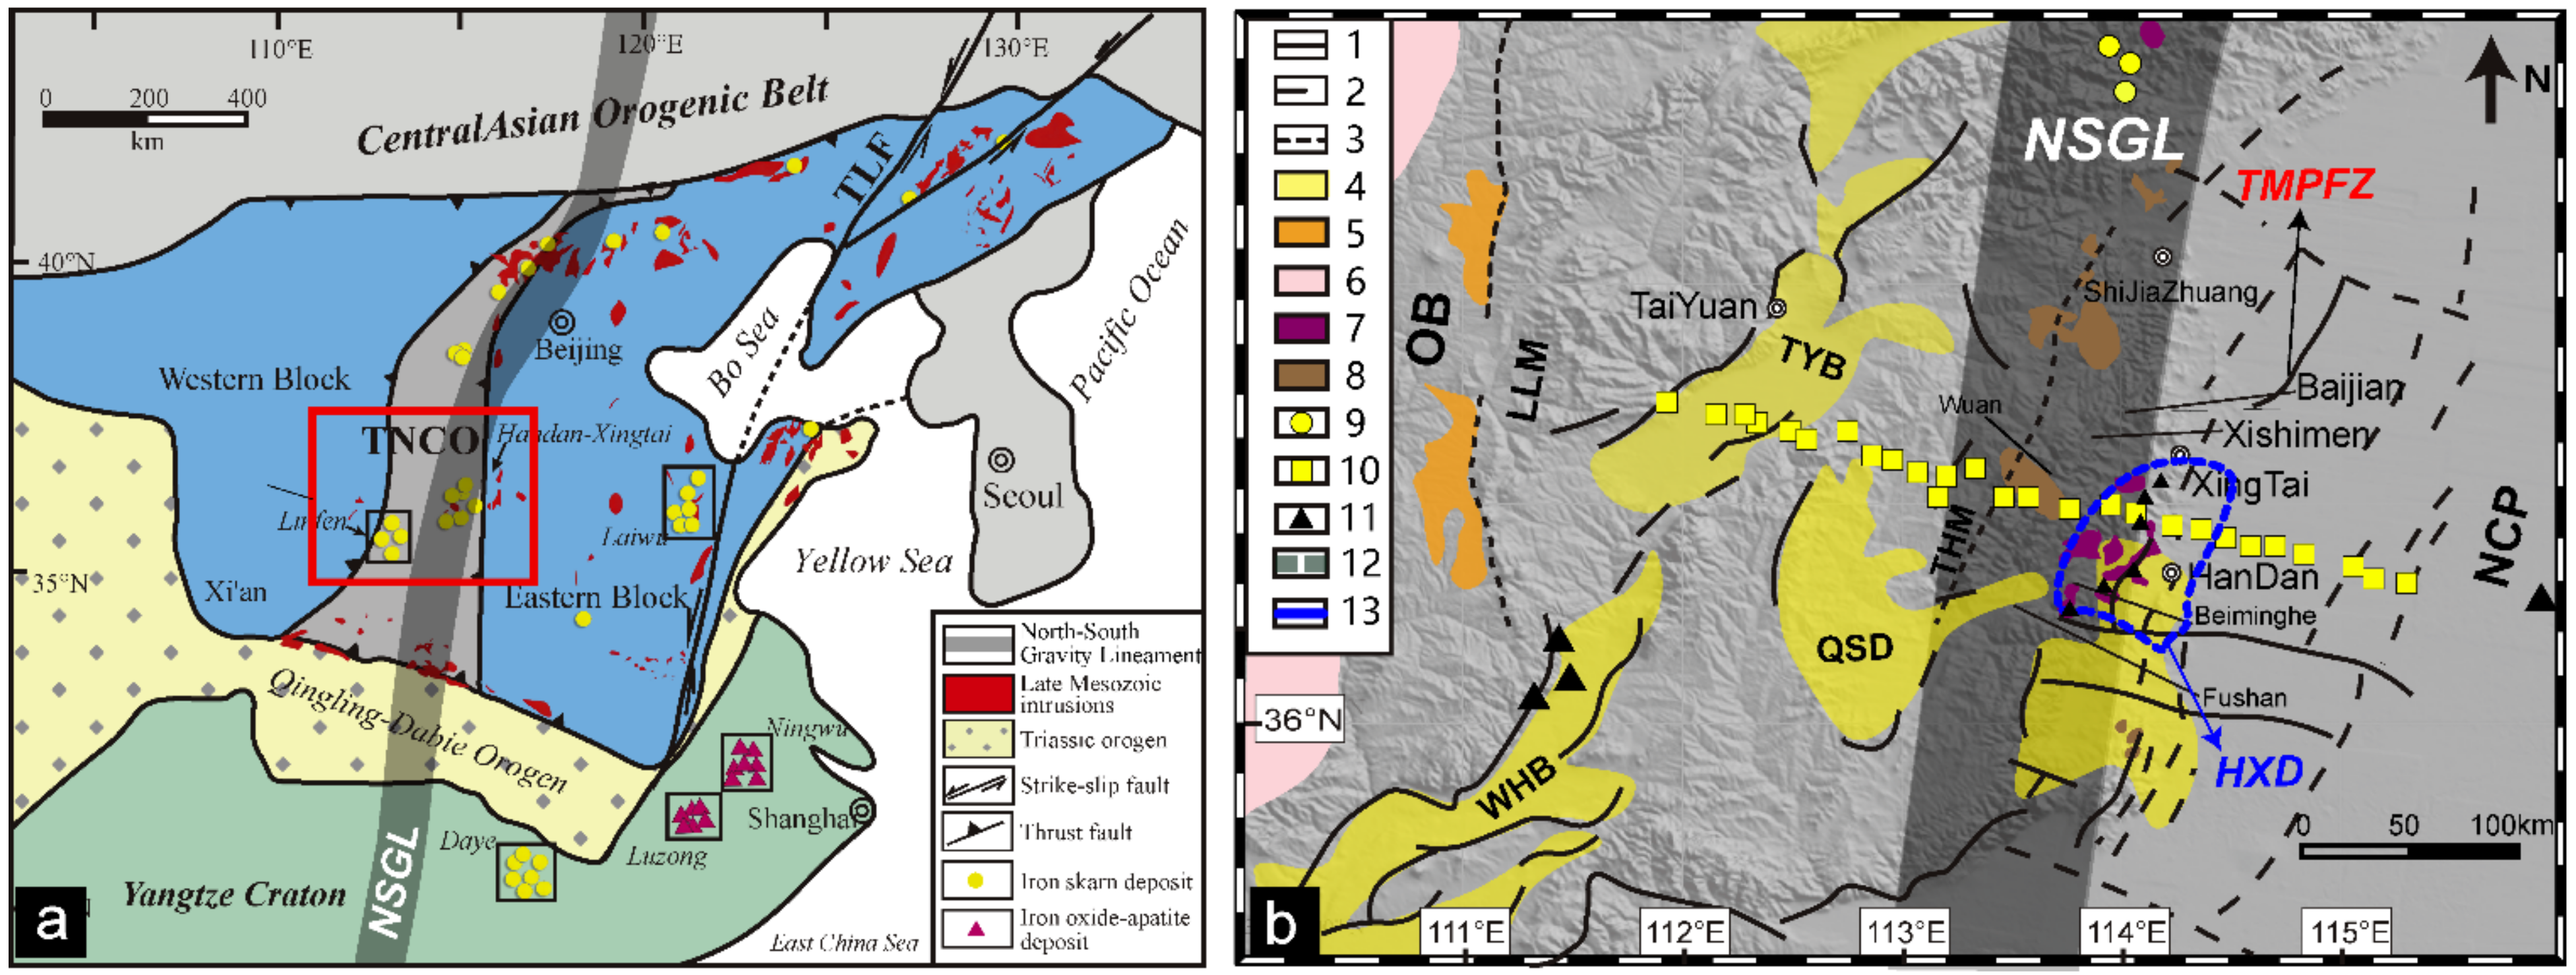
2. Geological Settings

The NCC is one of the world’s oldest cratons. It is widely accepted that it was formed by the amalgamation between its Eastern Block (EB) and Western Block (WB) along the Central Block (CB, or Trans-North China Orogen, TNCO) [23]. The HXD is located in the southern Taihang Mountains, where the junction zone between the EB and CB is also located. The crystalline basement in the region is mainly the late Archean–early Paleoproterozoic Zanhuang Group, composed of TTG (tonalite–trondhjemite–granodiorite) gneisses, monzonitic and potassic granite, with minor supracrustal rocks [24]. Mesoproterozoic Changcheng Group sandstone overlies the Zanhuang Group with an angular unconformity and is covered by Cambrian-to-Ordovician carbonate formation. Middle-Ordovician limestone and dolomitic limestone comprise the wall rocks of the ore bodies of the HXD [8].
Since the late Mesozoic, the NCC has undergone large-scale decratonization, which is widely known as cratonic destruction [11]. The most significant characteristics of this process include the drastic thinning of the lithosphere beneath the EB to the east of the HXD and its accompanying widespread tectonic–thermal–magmatic activities [25]. Despite the controversy, the mechanism of cratonic destruction was widely supposed to be related to the subduction and retreat of the Pacific slab [24,26]. The Mesozoic magmatic events played an important role on the metallogenesis of the NCC [27]. The large contact metasomatic magnesian skarn-type iron deposits in the HXD are typical representatives of the mineralization in this period. These deposits include Xishimen, Baijian and Zhongguan iron deposits (Figure 1b) [28].
The Yanshanian (~125–135 Ma) magmatic rocks are widely distributed in the HXD and closely related to skarn-ore metallogenesis [7], most of which are Mesozoic meso-basic epidiagenetic intrusions. According to the spatial distribution, they can be divided into three zones and eight major rock masses from west to east, including Fushan in the west, the Qicun, Wu’an and Guzhen rock masses in the center and the Xincheng, Hongshan and Baisha rock masses in the east [8]. Lithologically, they are mainly diorite, monzonite and syenite complexes and are associated with Proterozoic basic rocks and Cenozoic basaltic magmatic rocks. In particular, the Yanshanian diorite and monzonite magmatic rocks are the main ore-forming parent rocks of the Han-Xing iron mines [7]. The age of rock masses in the area is mainly between 125 and 135 Ma, which is consistent with the time during which the large-scale lithospheric destruction of the eastern NCC occurred [9].
A series of nearly NNE-trending faults are present around the HXD, which control the distribution of the magmatic rocks (Figure 1). The most important fault zone is the Taihang Mountains piedmont fault zone (TMPFZ, Shijiazhuang-Anyang fault) [29], which is also the eastern boundary of the HXD, located in the transition zone between the Taihang Mountains and the North China Plain [19]. Its formation was closely related to the activity of the Pacific plate. Before the Indosinian period, this area was affected by the southward subduction of the Paleo-Siberian plate and the northward subduction of the Yangtze plate and, consequently, a series of EW trending hidden basement faults were formed [29]. These hidden faults were reactivated in the Yanshan period, which controlled the magmatic activities, diagenesis and mineralization in this period [30].

3. Data Acquisition, Processing and Analysis

3.1. MT Data Acquisition and Processing

The locations of 26 MT sites used in this study are shown in Figure 1, which belong to an NW-SE-trending profile approximately perpendicular to the tectonic trend of the survey area. Due to the influence of terrain and cultural conditions, these sites are not evenly distributed along a straight line. These sites belong to the subset of a NE-SW-trending profile spanning from the central NCC to its eastern block (i.e., the Wenshui-Rizhao profile, or HB-MT02 profile [20]). A 2D inversion model of the HB-MT02 profile was published by Wei et al. [20] to discuss the regional tectonic issues of the NCC. However, limited by computer and inversion technologies at that time, their research only carried out a 2D inversion based on the NLCG algorithm for TM-mode data only with no 3D inversion performed.
The MTU-5 system, developed by Phoenix Geophysics Ltd., Canada, was used for data collection and synchronous satellite observations. These sites were collected in 2005 and the longest acquiring time of each can reach 72 h. Five-component measurement were used to record Ex, Ey, Hx, Hy and Hz time series. The period range covers 0.003–3000 s. Since the industrial and economic levels of the survey area, more than 15 years ago, were not as developed as nowadays, the electromagnetic noises were relatively weak. Therefore, the data quality was relatively high (Figure 2). Moreover, the acquiring time was also long enough, which ensured sufficient stacking times of low-frequency power spectrum. The mainstream MT-data-processing techniques were used to process the data and a relatively good quality was achieved. The impedance tensors and magnetic transfer functions of all the sites were estimated using the standard Robust algorithm [31]. At the same time, the requirement of remote-reference was taken into account during the data acquisition and several instruments were collecting data simultaneously. Thus, remote-reference techniques [32] were used to reduce the random noises. Finally, we selected 26 sites with acceptable data quality for this study.

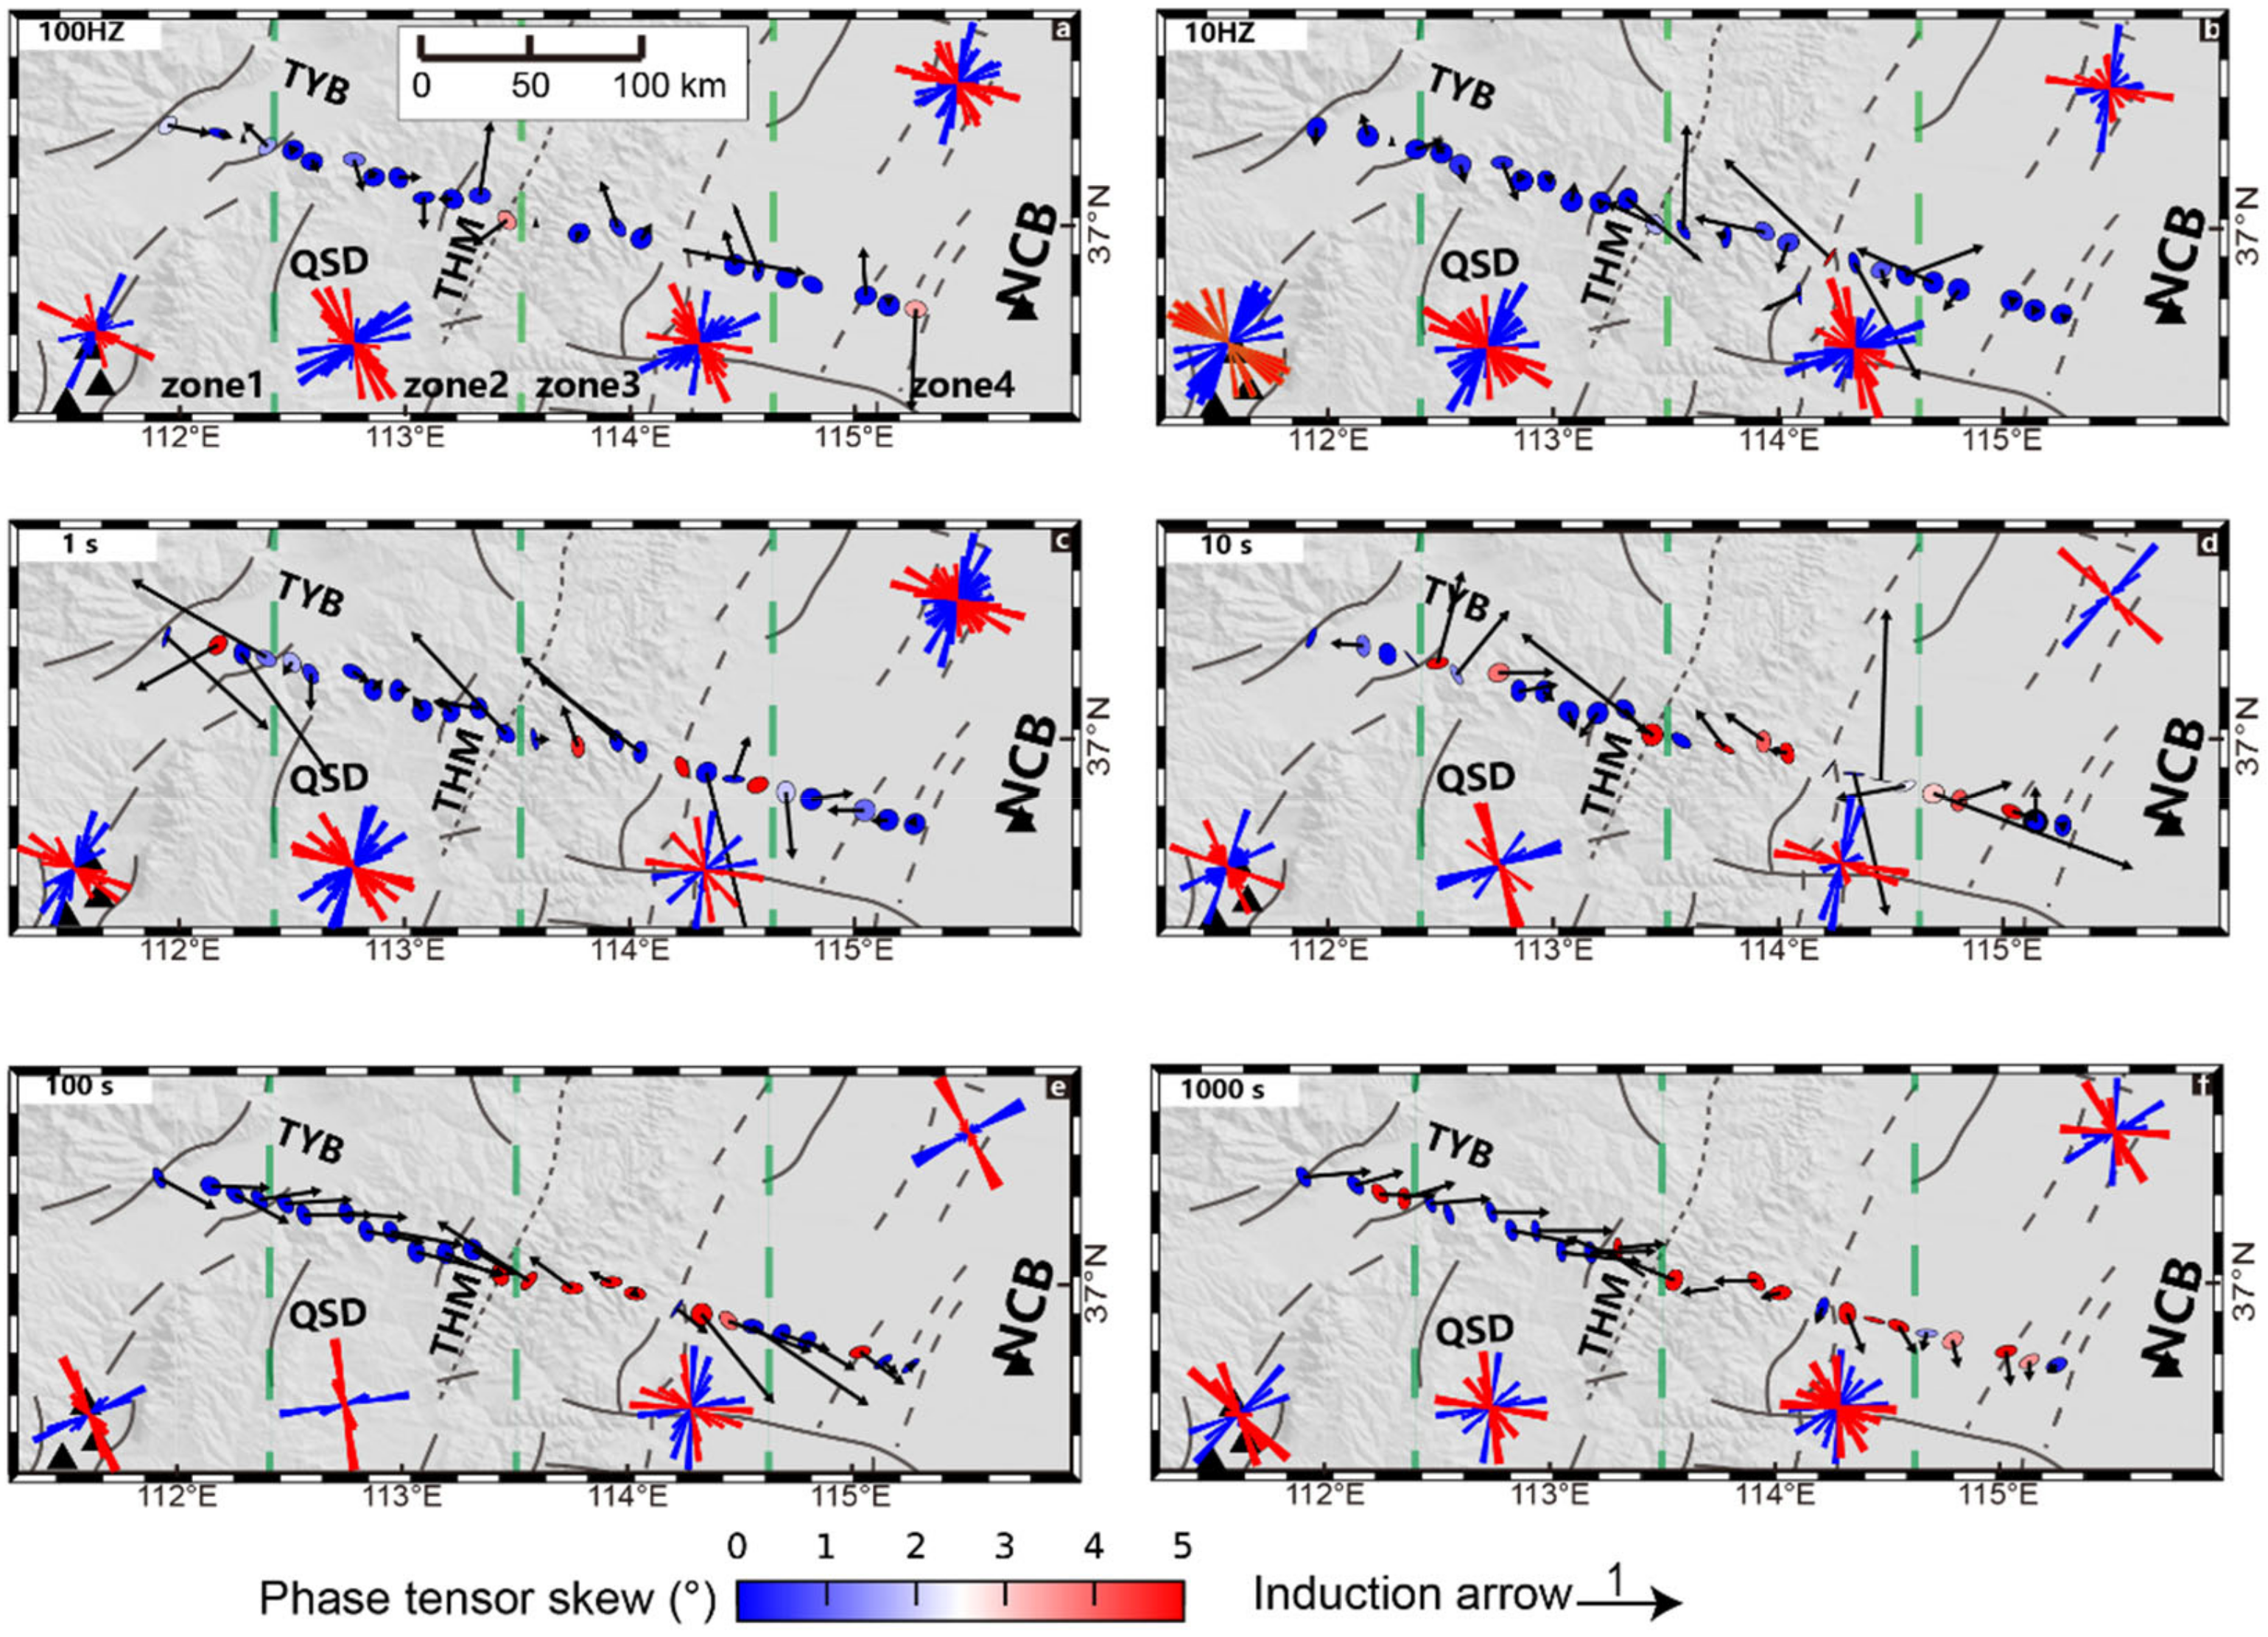
3.2. Dimensionality and Directionality Analysis of the MT Data

The Groom–Bailey (GB) tensor decomposition [33], phase tensors [34] and induction vectors in Parkinson convention [35] were used in this study in order to obtain detailed dimensionality information and geoelectric strikes. Due to the complex geological structure in the study area, we divided the area into four sub-regions according to the topography and tectonic features, i.e., Taiyuan Basin, Qinshui depression, Taihang Mountains, and the North China Plain (Figure 3).
The phase tensors of middle-high period bands (~0.01–1 s) are approximately circular with no obvious elliptical polarization, and the skew values are relatively small (mostly, <2°), probably demonstrating a 1-D feature at near surface. The pointing directions of induction vectors are not uniform, which may indicate the disorganized distribution of near-surface structures. The rose diagrams obtained by the GB tensor decomposition for the period band of ~0.01–1 s also shows as being relatively messy, which may confirm the above determination. In contrast, the phase tensors from middle-low period bands (>10 s) gradually show an elliptic polarization, but the polarization directions of which show obvious differences in different regions. Specifically, to the west of the Taihang Mountains, they are mostly NW-SE trending, while to the east of the Taihang Mountains they are mainly NE-SW trending. The polarization directions of the phase tensors within the Taihang Mountains have no obvious regularity and the skew values are large, indicating obvious 3D features. Significantly, in the two flanks of the Taihang Mountains, the polarization directions of the induction vectors and the phase tensor ellipses show a partly orthogonal feature, i.e., the principal axes to the west of which are mostly NE trending, while those in the east are mostly SE trending. According to the phase tensor and the induction vectors of the Parkinson convention, there may be a relatively significant high-conductivity anomaly or electrical interface in these two regions, indicating 2D features. The strike directions of the GB rose diagrams are also consistent with the inferred direction of the electrical interface. In contrast, the induction vectors and rose diagrams derived from the GB tensor decomposition within the Taihang Mountains are more disordered, indicating 3D features.
In summary, different tectonic units show significantly different electrical dimensionalities and strike directions. Obvious 3D features are shown in the crust and mantle under the Taihang Mountains, the electrical structures on both sides of it may be mainly 2D features, but the geoelectric strike directions are different from each other. Therefore, the electrical structure under the whole study area is characterized by 3D features. In the previous studies mentioned above, a uniform impedance rotation angle was used for the global 2D inversion of all sites, which was a kind of upset limited by the technical conditions at that time [20]. We suggest that the 3D inversion is urgently needed for the dataset.

4. Inversion and Modeling

4.1. Inversion Algorithms and Parameter Settings

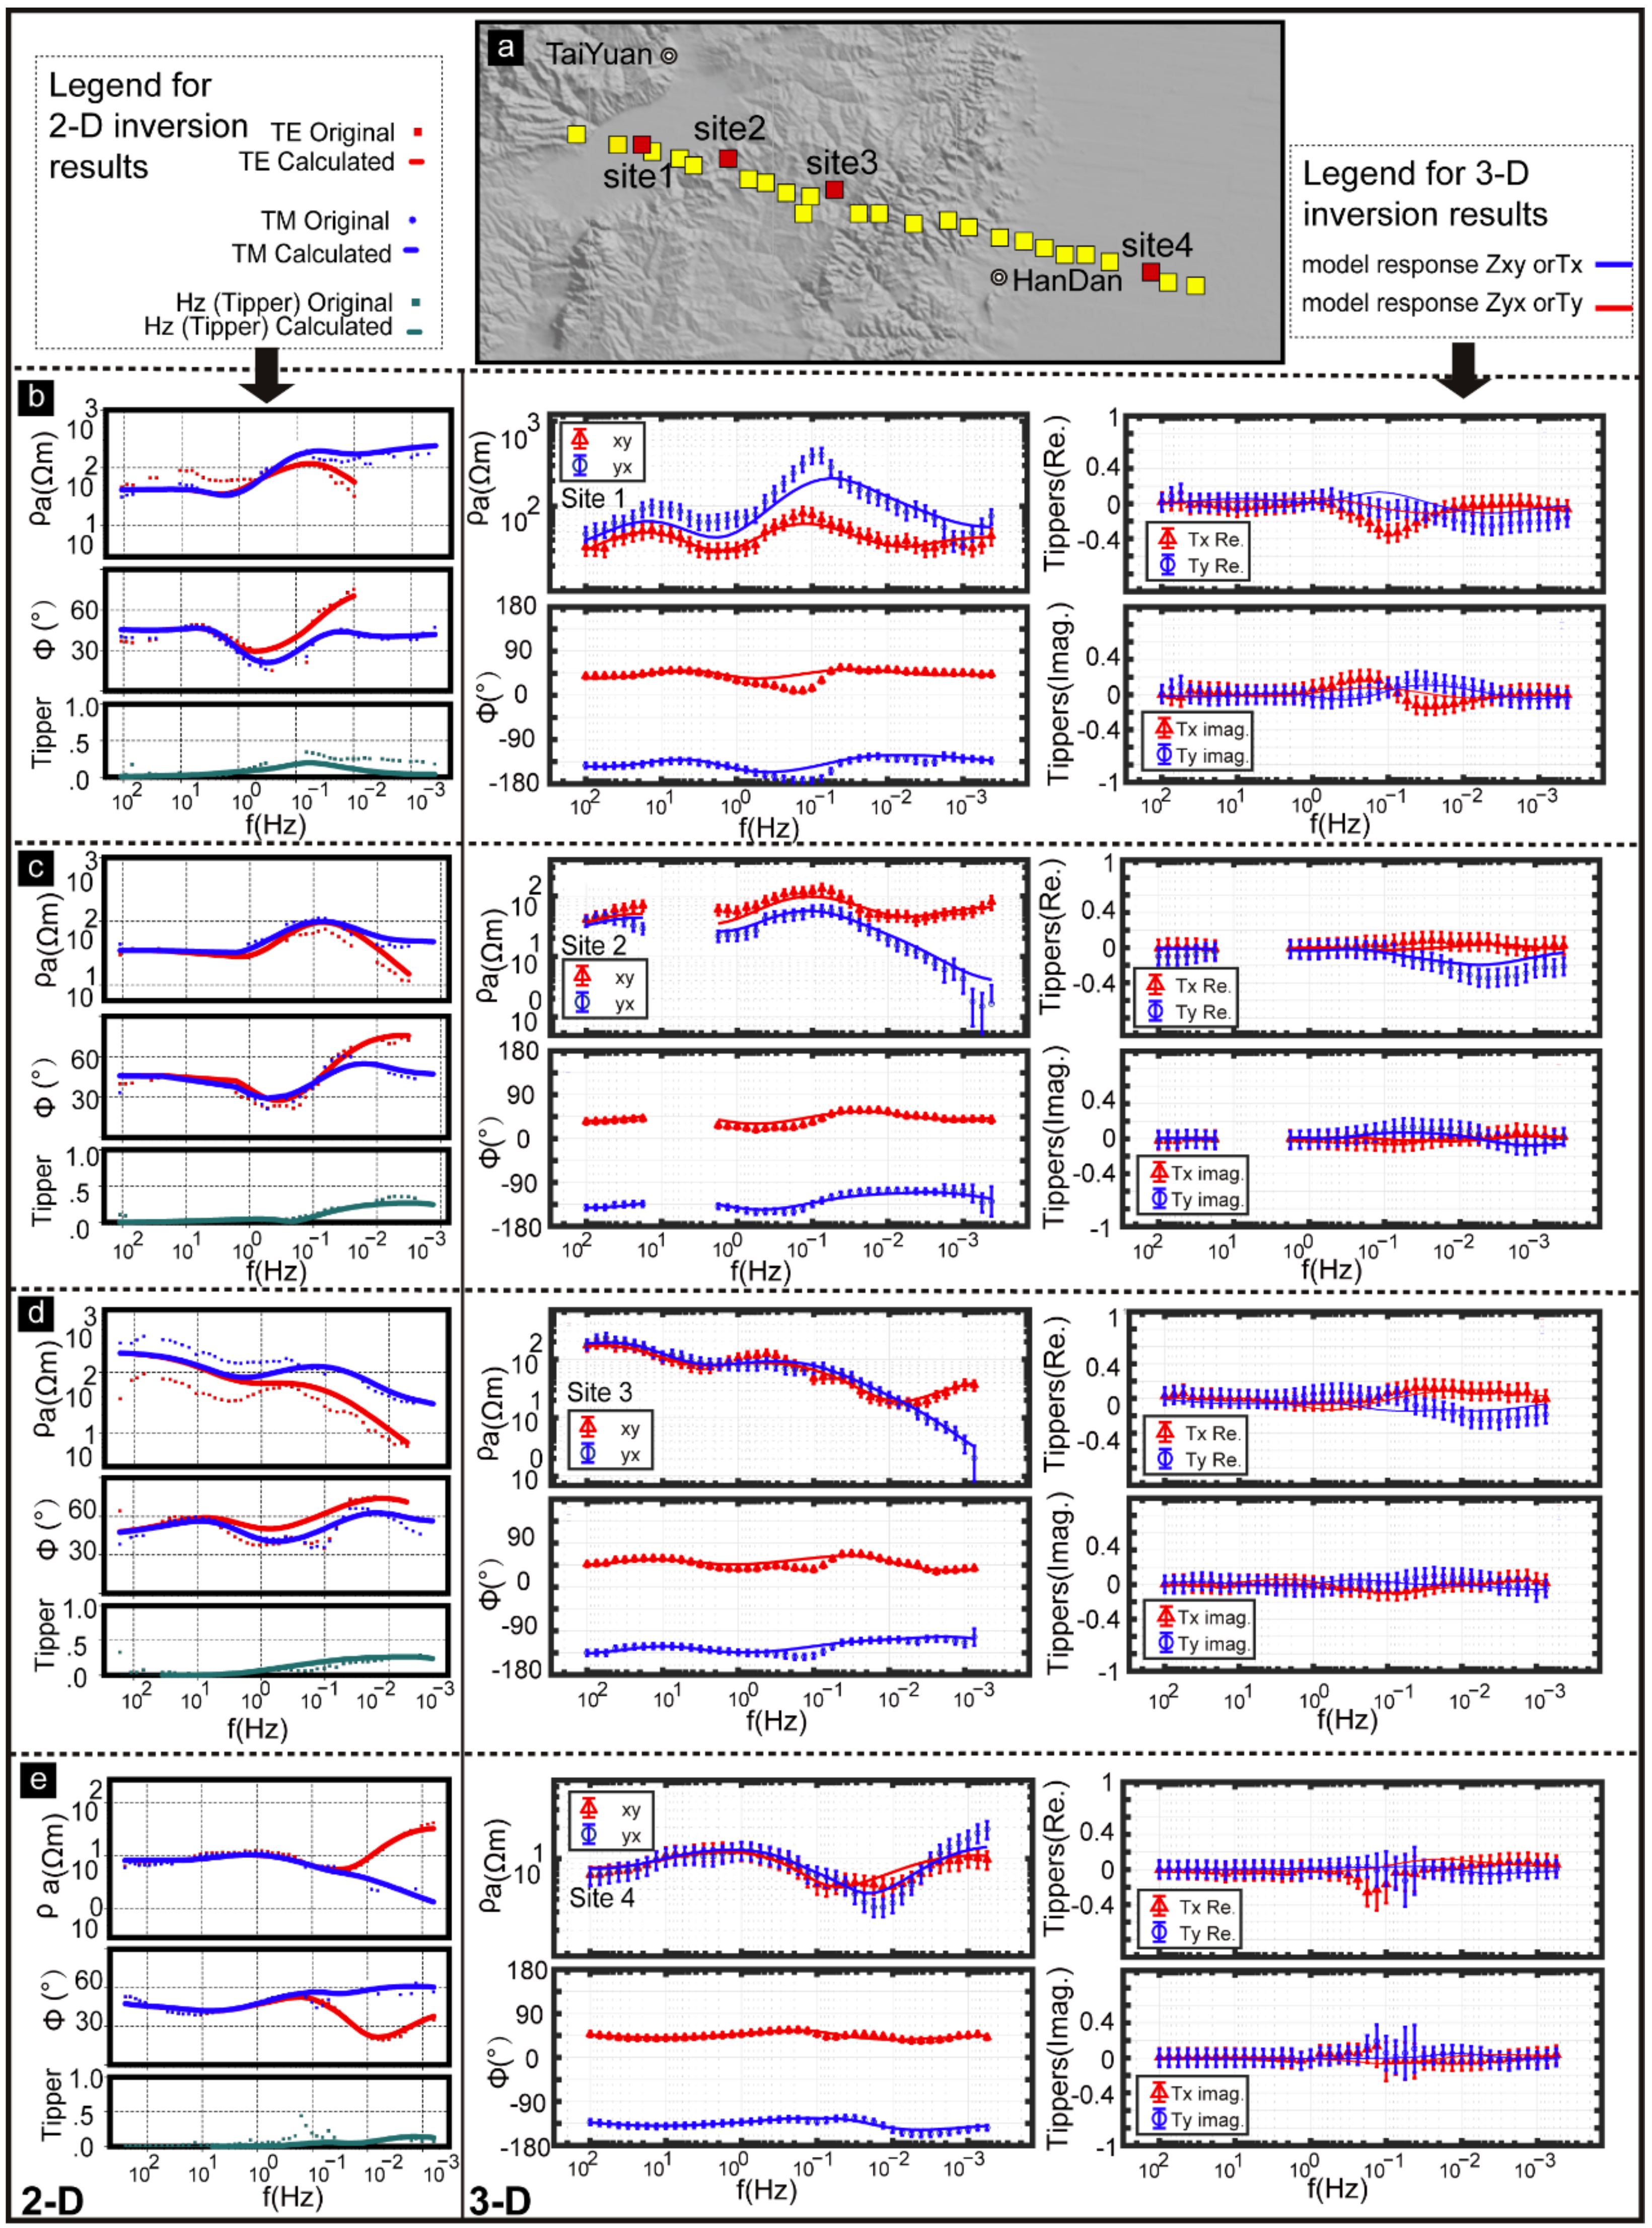
4.1.1. Two-Dimensional Inversion

We used WinGlink software, an integrated interpretation platform developed by GEOSYSTEM ltd. (Firenze, Italy) for 2D inversion. The core algorithm is a nonlinear conjugate gradient NLCG [36]. According to the data analysis results, 26 MT sites were uniformly rotated to N45°E, and the inversion for the different modes of data (i.e., TE, TM, Hz or the combinations between them) were applied, the results of which were compared. By comparison the TE+TM+HZ inversion mode was chosen. The starting model was a half-space of 100 Ωm. The error floors of Rho and Phase in the TE mode are set to 30% and 15%, while the values for the TM mode were set to 20% and 10%, respectively. The period range of the 2D inversion is 0.003–3000 s. The compromise factor tau was set to 3. The final RMS misfit reached 2.6977 after 150 iterations. The typical apparent resistivity and phase curves of the model response for several sites are shown in Figure 2.

4.1.2. Three-Dimensional Inversion

Three-dimensional inversion was conducted using the modular code ModEM [37,38] for all 26 MT sites. The core inversion algorithm is the nonlinear conjugate gradient (NLCG) method. The period bands of inversion were set to 0.01–3000 s. The starting mesh consists of 50 × 50 × 50 grid in the X, Y and Z directions. The horizontal grid cell size of the central area is 600 m, padded with nine cells on each edge, with the width increasing by a factor of 1.5 outwards to the model boundary. In the vertical direction, the uppermost layer is 15 m and layers increase in thickness exponentially by a factor of 1.2. The starting model was a half-space of 100 Ωm. The error floor was set to 10% for both diagonal (Zxx&Zyy) and off-diagonal components of the impedance tensor (Zxy&Zyx) and tippers (Tx&Ty). After 84 iterations, the nRMS reached 1.86. The comparison between the original data and the corresponding responses of the 3D inversion model for several typical sites are shown in Figure 2.

4.2. Inversion Models

The horizontal slices by depth of the 3D inversion model are shown in Figure 4. A comparison between the 2D model and the vertical slices of the 3D model along the main profile (P1 in the bottom-right sub-figure in Figure 4) is shown in Figure 5. By comparing the 2D and 3D results along the same section, it was observed that they have certain similarities. For example, high-resistivity blocks R1, R2 and R3 and high-conductivity blocks C1, C2 and C4 are present in both models, which proves the reliability of the inversion results. Although there are some differences in the morphology and scale of the above anomalies, considering that the 2D and 3D inversion algorithms of the MT data are based on different assumptions in the resistivity model and the derivation of Maxwell equations [39], these divergences are acceptable.
In general, the 3D model comprehensively reflects all the electrical-resistivity anomalies in the 2D model, as well as demonstrating more anomalies that the 2D model does not show, such as C3. Furthermore, the 3D results appear to have higher resolutions. The characteristics of the inversion models shown on Figure 4 are also consistent with the results of the dimensionality analysis, according to which the subsurface electrical structure of the study area shows 3D characteristics. Therefore, the geological interpretation and discussion below are mainly based on the 3D inversion.

5. Geological Interpretation and Discussion of Metallogenic Mechanisms

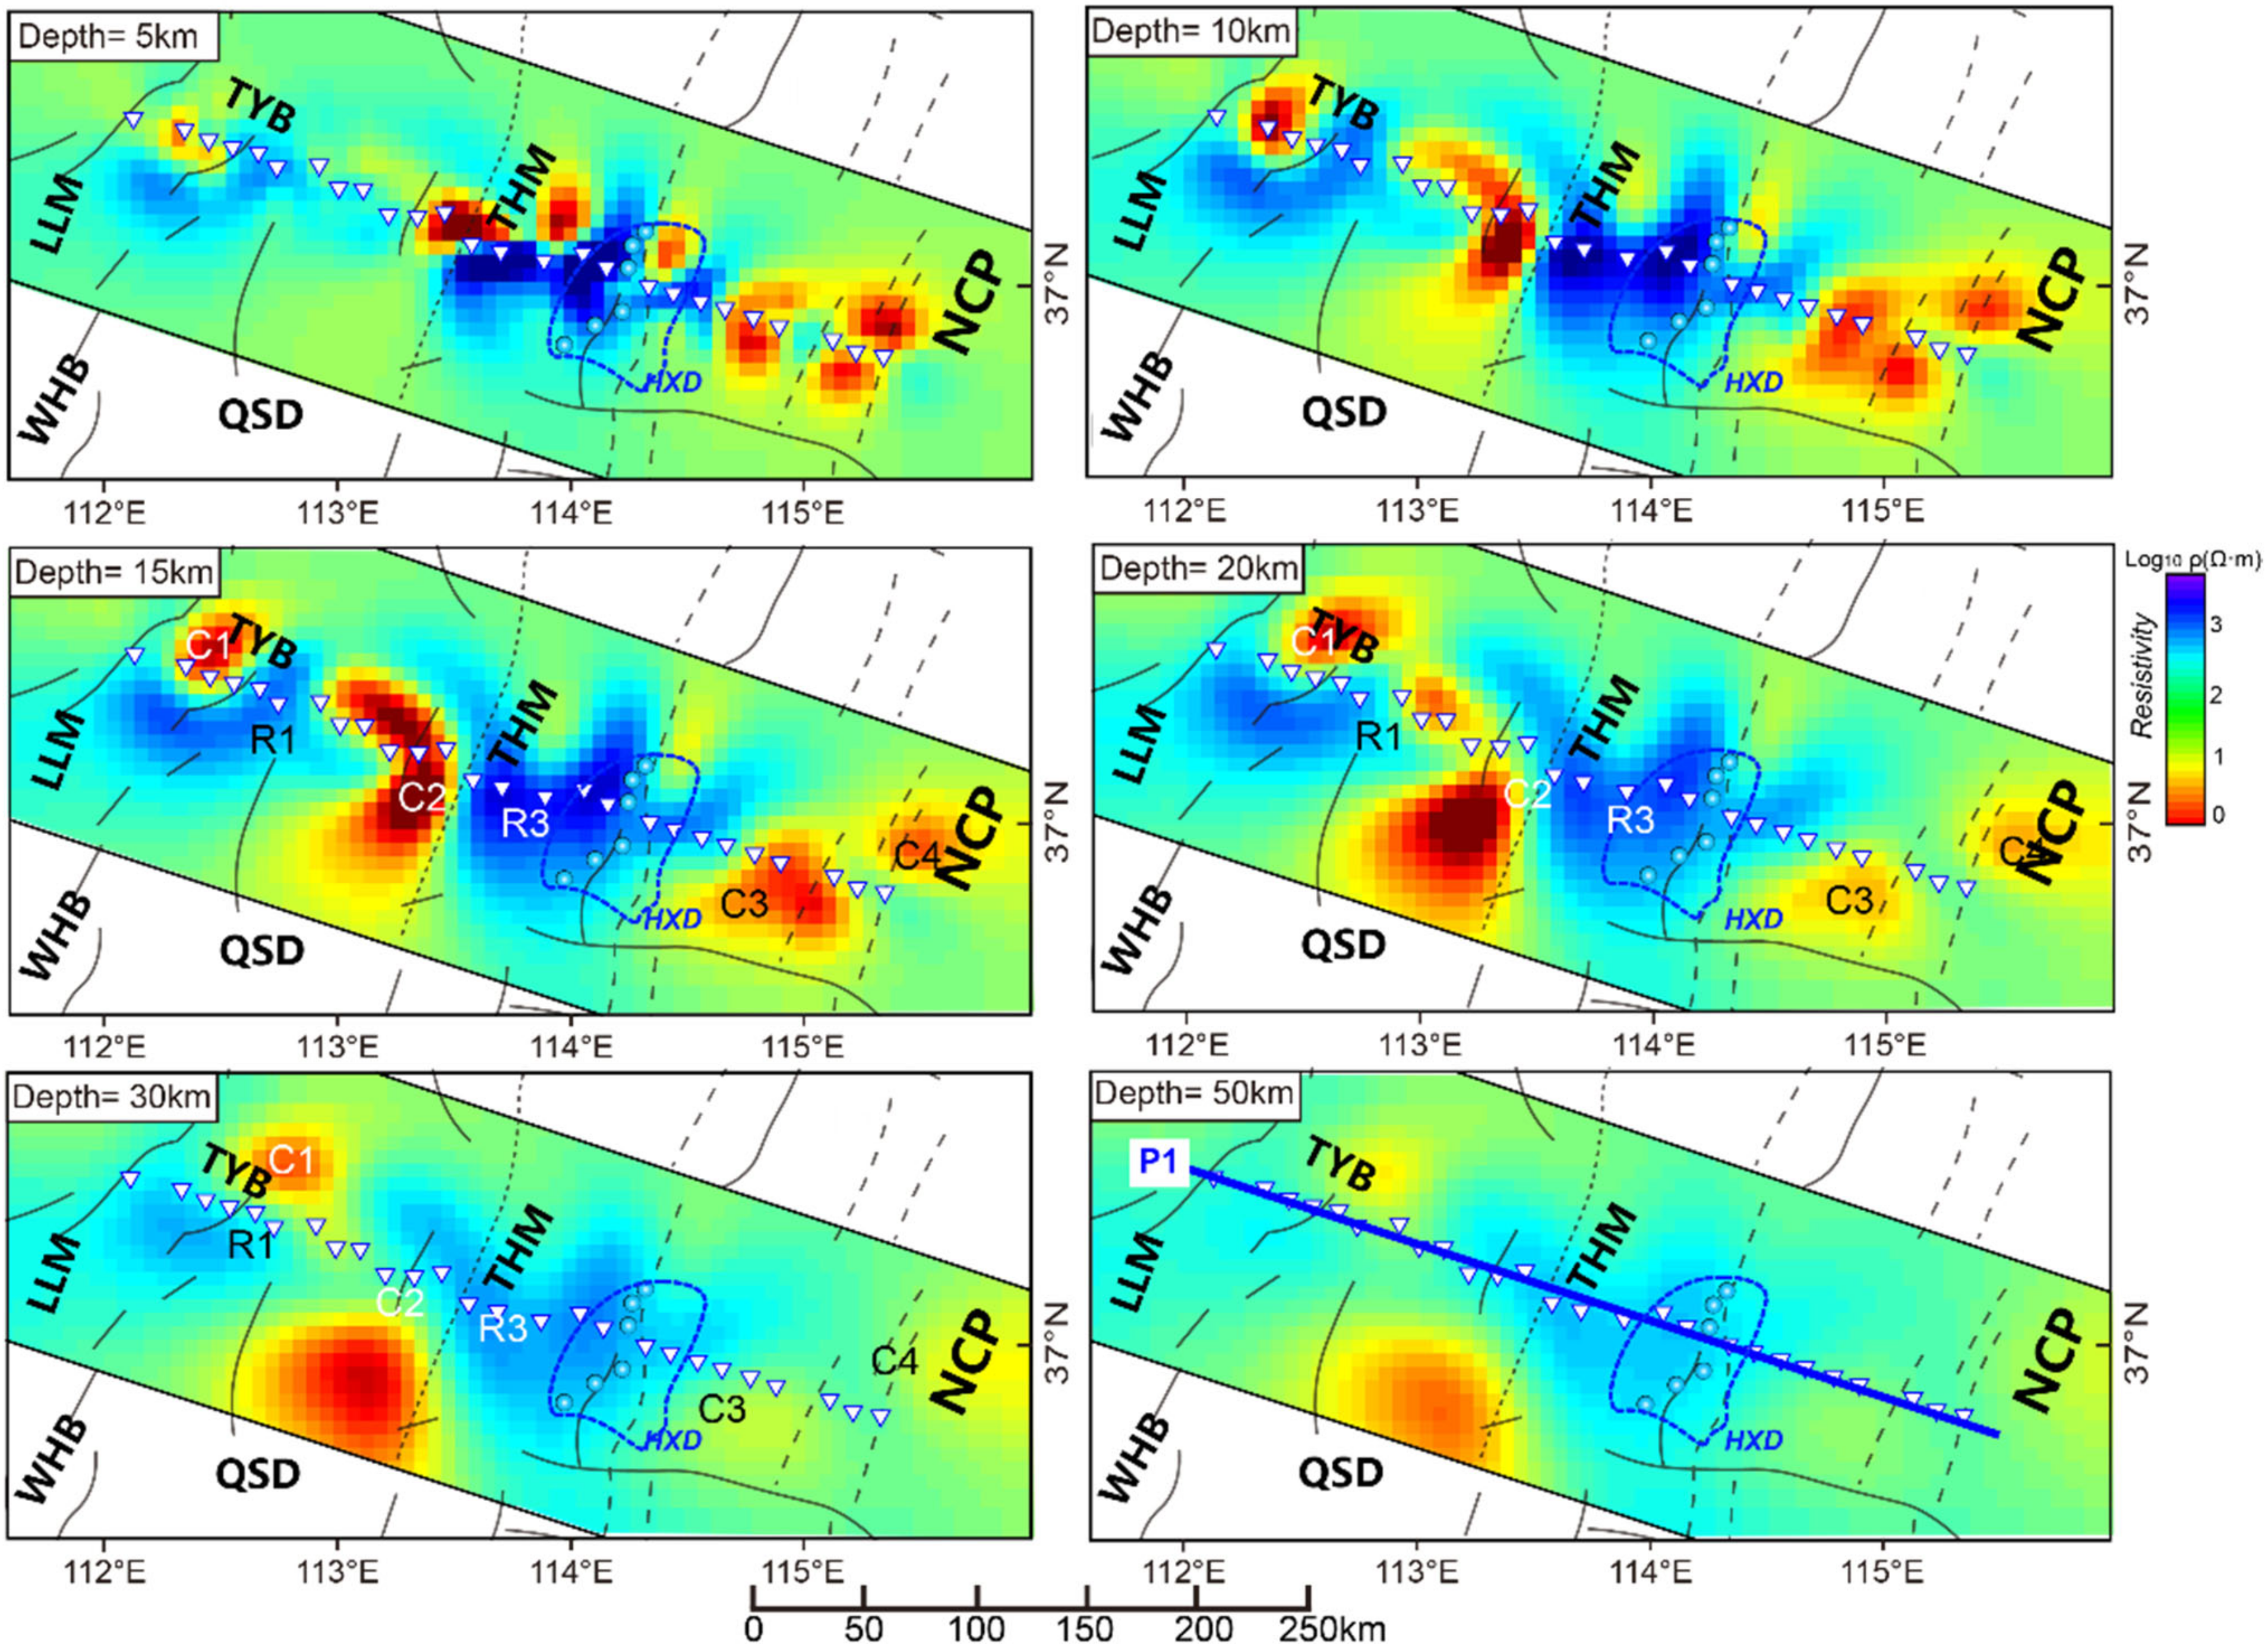
5.1. Geological Interpretation

The electrical resistivity structure beneath the hinterland of the Taiyuan Basin, especially its eastern part, shows obvious layered features. There is a high-resistivity block R1(~600–2000 Ωm) in the upper-mid crust (~0–25 km). Compared with the violent tectonic activities in the adjacent areas, it was suggested that the Taiyuan Basin underwent particularly weak Phanerozoic tectonic movements. On the contrary, however, it has been continuously deposited since the Cenozoic [40]. Hence, we infer that the high-resistivity block beneath it may indicate the relatively stable Precambrian crystalline basement belonging to the TNCO [23]. The compact ancient metamorphic rocks cannot be filled with secondary high-conductivity materials due to poor porosity and generally show high resistivity [41].
The SE-dipping conductor under the western margin of the Taiyuan Basin, C1, extends to the lower crust or even the upper-mantle depths, coinciding with the Jiaocheng fault zone exposed on the surface. Previous geological-mapping results demonstrated that its fault plane inclines towards the Taiyuan Basin in the east [42], which conforms to the manner of the distribution of conductor, C1. On the east side of the Taiyuan Basin, a NW-trending conductor, C2, extends from the western edge of Taihang Mountains to the underpart of the Qinshui depression and gradually forms a nearly horizontal mid-crustal (~15–20 km) high-conductivity layer. The Qinshui depression is rich in geothermal resources with high heat flows [43]. Therefore, we interpret the conductor as a top-to-NW nappe structure and as the boundary between the Taihang Mountains and the Qinshui depression. The high-conductivity layer of the middle crust connected to C2 may be a detachment structure. Its high conductivity may be due to the decoupling of the brittle/ductile transition zone in the crust with high porosity and the filling of high-conductivity materials, such as deep-derived thermal fluids. Both C1 and C2 are located within the crust beneath the boundaries of different geological units, and their characteristics are consistent with those of fault-zone conductors (FZC). The stress concentration in fault zones led to rock breakage and the expansion of porosity. The conductivity of such regions can be significantly increased if they are filled with conductive materials, such as graphite, metallic sulfide or saline fluid [44].
The crust-mantle structure under the Taihang Mountains is relatively simple and characterized by an overall high resistivity. As a crucial part of TNCO, the Neoarchean Zanhuang complex is outcropped within this area [45]. Although the South Taihang Mountains have experienced many tectonic movements since the Proterozoic [12], the complex belt remains stable and maintains its shape. Thus, it is reasonable to believe that there is still a Proterozoic, or even Archean-aged, basement and a lithosphere beneath it. Their constituents are mainly a compact metamorphic basement and depleted peridotite, often showing high-resistivity features [41,46]. High-resistivity relic Precambrian lithospheres have been widely reported in other Precambrian orogenic belts all over the world, such as the Trans-Hudson orogen in North America [47].
In both the 2D and 3D models, the crust and upper mantle beneath the North China Plain manifest overall high-conductivity features. The North China Plain is located in eastern NCC. It is widely believed that the cratonic lithosphere has been destructed on a large scale since the Mesozoic, resulting in the existence of an extremely thin lithosphere (~80 km) and crust (<38 km) below it, as well as a strong upwelling of asthenospheric thermal materials [22,23]. The 3D MT imaging presented by Huang et al. [48] also indicated that the crust and mantle beneath the eastern part of the North China Plain showed overall high-conductivity features, which are similar to those in our model. According to their interpretation and discussion, the enhanced conductivity of the lithospheric mantle may be due to the upward migration of deep thermal fluids and enrichment in olivine or its partial melting as a result of the subduction and roll-back of the Pacific slab. The high conductivity of the crust may be generated by the underplating and the input of hot materials derived from the asthenosphere.

5.2. Differential Levels of Lithospheric Modification on the Two Sides of HXD

In the 3D model (Figure 5b), there is a significant, high-conductivity anomaly, C3 (<30 Ωm), beneath the western margin of the North China Plain, which is in contact with the high-resistivity lithosphere beneath the Taihang Mountains. It appears to extend from the near-surface to the lower-crust (at a depth of >30 km), which is approximately coincident with the eastern margin of the HXD. Furthermore, it shows similar characteristics to C1 and C2; hence, we interpreted its upper–mid–crustal part at least as an FZC of TMPFZ. However, this conductor does not appear in the 2D model (Figure 5a), instead, there is an obvious and nearly upright high–low–resistivity interface. An interface with similar resistivity can also be observed in the 3D model. In other words, the lithospheric–resistivity values on both sides of this position demonstrate obvious differences. Specifically, the lithosphere beneath the Taihang Mountains on the west side shows high resistivity, while that of the North China Plain on the east side shows an overall high in-conductivity.
In fact, previous studies from different disciplines have indicated that an important geological–geophysical boundary exists beneath this boundary zone. Firstly, the well-known NEE-trending Daxin’anling–Taihangshan or North South Gravity Lineament (NSGL) crosses this region, across which the Bouguer gravity anomaly decreases rapidly from −100 mGal to −40 m Gal, from west to east [18]. Secondly, Xu [10] reviewed the geochemical characteristics of the mantle xenoliths in North China, and indicated that the lithospheric mantle on both sides of the NSGL demonstrated completely diverse features. Finally, Zhu et al. [27,49] indicated that this region is a key transitional zone of crust and lithosphere thickness, based on a summary of the previous seismic receiver function and tomography results. Specifically, a thicker crust and lithosphere (>40 km and 100 km, respectively) were present in the west, while these two values decreased sharply to <35 km and 80 km in the east. In addition, the significant discrepancies in the topography and geothermal gradients on both sides of this region also suggests that there are major differences in the deep lithospheric structures and properties [10].
The seismic tomography of East Asia described by Huang et al. [26] exhibited that the subduction frontier of the Pacific slab reaches and stagnates in the mantle-transition zone approximately beneath the front of the Taihang Mountains. Along with the subduction and roll-back of the western Pacific slab since the early Cretaceous, the dehydration of the slab and, therefore, the perturbance of the asthenosphere may be the root causes of the drastic destruction of the lithosphere beneath the eastern NCC [27], and the significant differences between the lithosphere thicknesses on both sides of the HXD. This may also be the essential reason for the discrepancies in the electrical characteristics of the lithosphere on the two sides of C3 (Figure 6b). In other words, the lithosphere under the North China Plain has been dramatically destructed or even destroyed and thinned, while the Taihang Mountains on the west side may still retain the ancient cratonic lithosphere.

5.3. Tectonic–Magmatic–Fluid–Mineralization of Skarn-Type Iron Ores in HXD

Based on the geological interpretation above, C3 may be the FCZ of the TMPFZ extending to the deep crust. The conductivity difference in the lithosphere on both sides of C3 indicates that it has been reconstructed by varying degrees. Although the broad-band MT data cannot be used to directly image the gradient of the lithospheric thickness due to the limited exploration depth [39], we are convinced of the existence of the lithospheric transfer zone, based on the integrated geological and geophysical studies mentioned above.
Most, if not all, of the similar transfer zones of lithospheric thickness and properties all over the world are also known as important zones for tectonic–magmatic–mineralization. For instance, a rheological simulation study under the transfer zone of lithospheric thickness in front of the Rocky Mountains in the western United States indicates that the lithospheric thickness step can lead to small-scale mantle perturbance and convections, as well as causing decompression and the adiabatic upwelling of the asthenosphere [50]. This can explain the driving force behind magma generation and the upward migration. Coincidentally, a high–low–resistivity interface was reported to occur beneath the boundary zone between the Rocky Mountains and the Great Plains [51], similar to that beneath the HXD. Additionally, a nearly horizontal lower–crustal high-conductivity body, similar to the mid-lower–crustal part of C3 (Figure 6a), also occurs at this location, which was shown to result from the basaltic under-plating within the intra-crustal detachment. The enrichment of carbon or metal sulfide in mantle-derived magma was perhaps the reason for its high conductivity. There are analogous cases in other ore-concentration areas in the world. For example, Yin et al. [21] utilized the MT data to image the lithospheric–thickness–gradient zone beneath the Nanling Range metallogenic belt in South China, where similar asthenospheric upwelling and underplating had occurred, resulting in significant W-Sn metallogenesis.
In summary, combined with other geological and geophysical information, our resistivity model can provide new constraints on the metallogenetic mechanism of Handan-Xingtai–type iron ores. Since the Mesozoic, the subduction and subsequent roll-back of the Pacific slab caused dramatic changes in the properties and thickness of the lithosphere beneath the region to the east of the Taihang Mountains, while a relatively old, stable and thick lithosphere may still remain beneath the Taihang Mountains [27], as suggested by our resistivity model (Figure 6a,b).
Beneath the inferred lithospheric–thickness–transfer zone, the decompression and adiabatic upwelling of asthenosphere-derived hot materials may cause the generation of a weak zone that cuts through the crust, possibly on the scale of lithosphere, beneath the boundary between the Taihang Mountains and the North China Plain. This weak zone may also result from the reactivation of a Precambrian lithospheric suture [45], since the Taihang Mountains are supposed to have been formed by the closure of an ancient ocean during the final amalgamation of the North China Craton (NCC) before the Paleoproterozoic [24]. This weak zone is reflected by C3 in our resistivity model (Figure 6a). Coincidentally, its upper-mid–crust segment (Figure 6a), which was interpreted to be an FCZ, appears to be connected with the HXD.
Since it was suggested that the destruction of the cratonic lithosphere occurred after the Yanshanian period and that this coincided with the mineralization of the Han-Xing-skarn-type iron-ore deposits [7], it is reasonable to suggest that differential modification levels and thicknesses of the lithosphere on the two sides of the HXD have existed since then and probably remain. The unsteady flow of the regional asthenosphere caused by the subduction of the Pacific slab and the subsequent disturbance and dehydration [52] led to the partial melting of the mantle peridotite, forming basic magma, as well as the underplating to the bottom of the lower crust and, therefore, its partial melting. Diorite magma was generated by the MASH process (Melting, Assimilation, Storage and Homogenization, Figure 6b) between the crust-derived acid and the mantle-derived basic magma, which mainly emplaced in an active manner [1]. During the process of magma emplacement, more iron-rich metamorphic basement materials were assimilated and the mantle-derived basic magma passively rose to a certain depth and injected into dioritic magma chambers or formed basic magma chambers through the trans-crust weak zone [15], which can be determined from C3. During the migration of the aforementioned magma to the shallow crust, the Fe in the ancient metamorphic basement (represented by the upper-mid crustal part of R3 beneath the Taihang Mountains Figure 6) was extracted [53]. Furthermore, Mg and Fe can also be separated in the mineral and melt phases by forming high-magnesium amphibole under high-oxygen-fugacity conditions, thereby forming magnesium-rich diorite and skarn-type iron ore [17].

6. Conclusions

In this research, we obtained the lithospheric electrical structure beneath the Han-dan-Xingtai ore district using magnetotelluric data. Three main conclusions can be drawn:
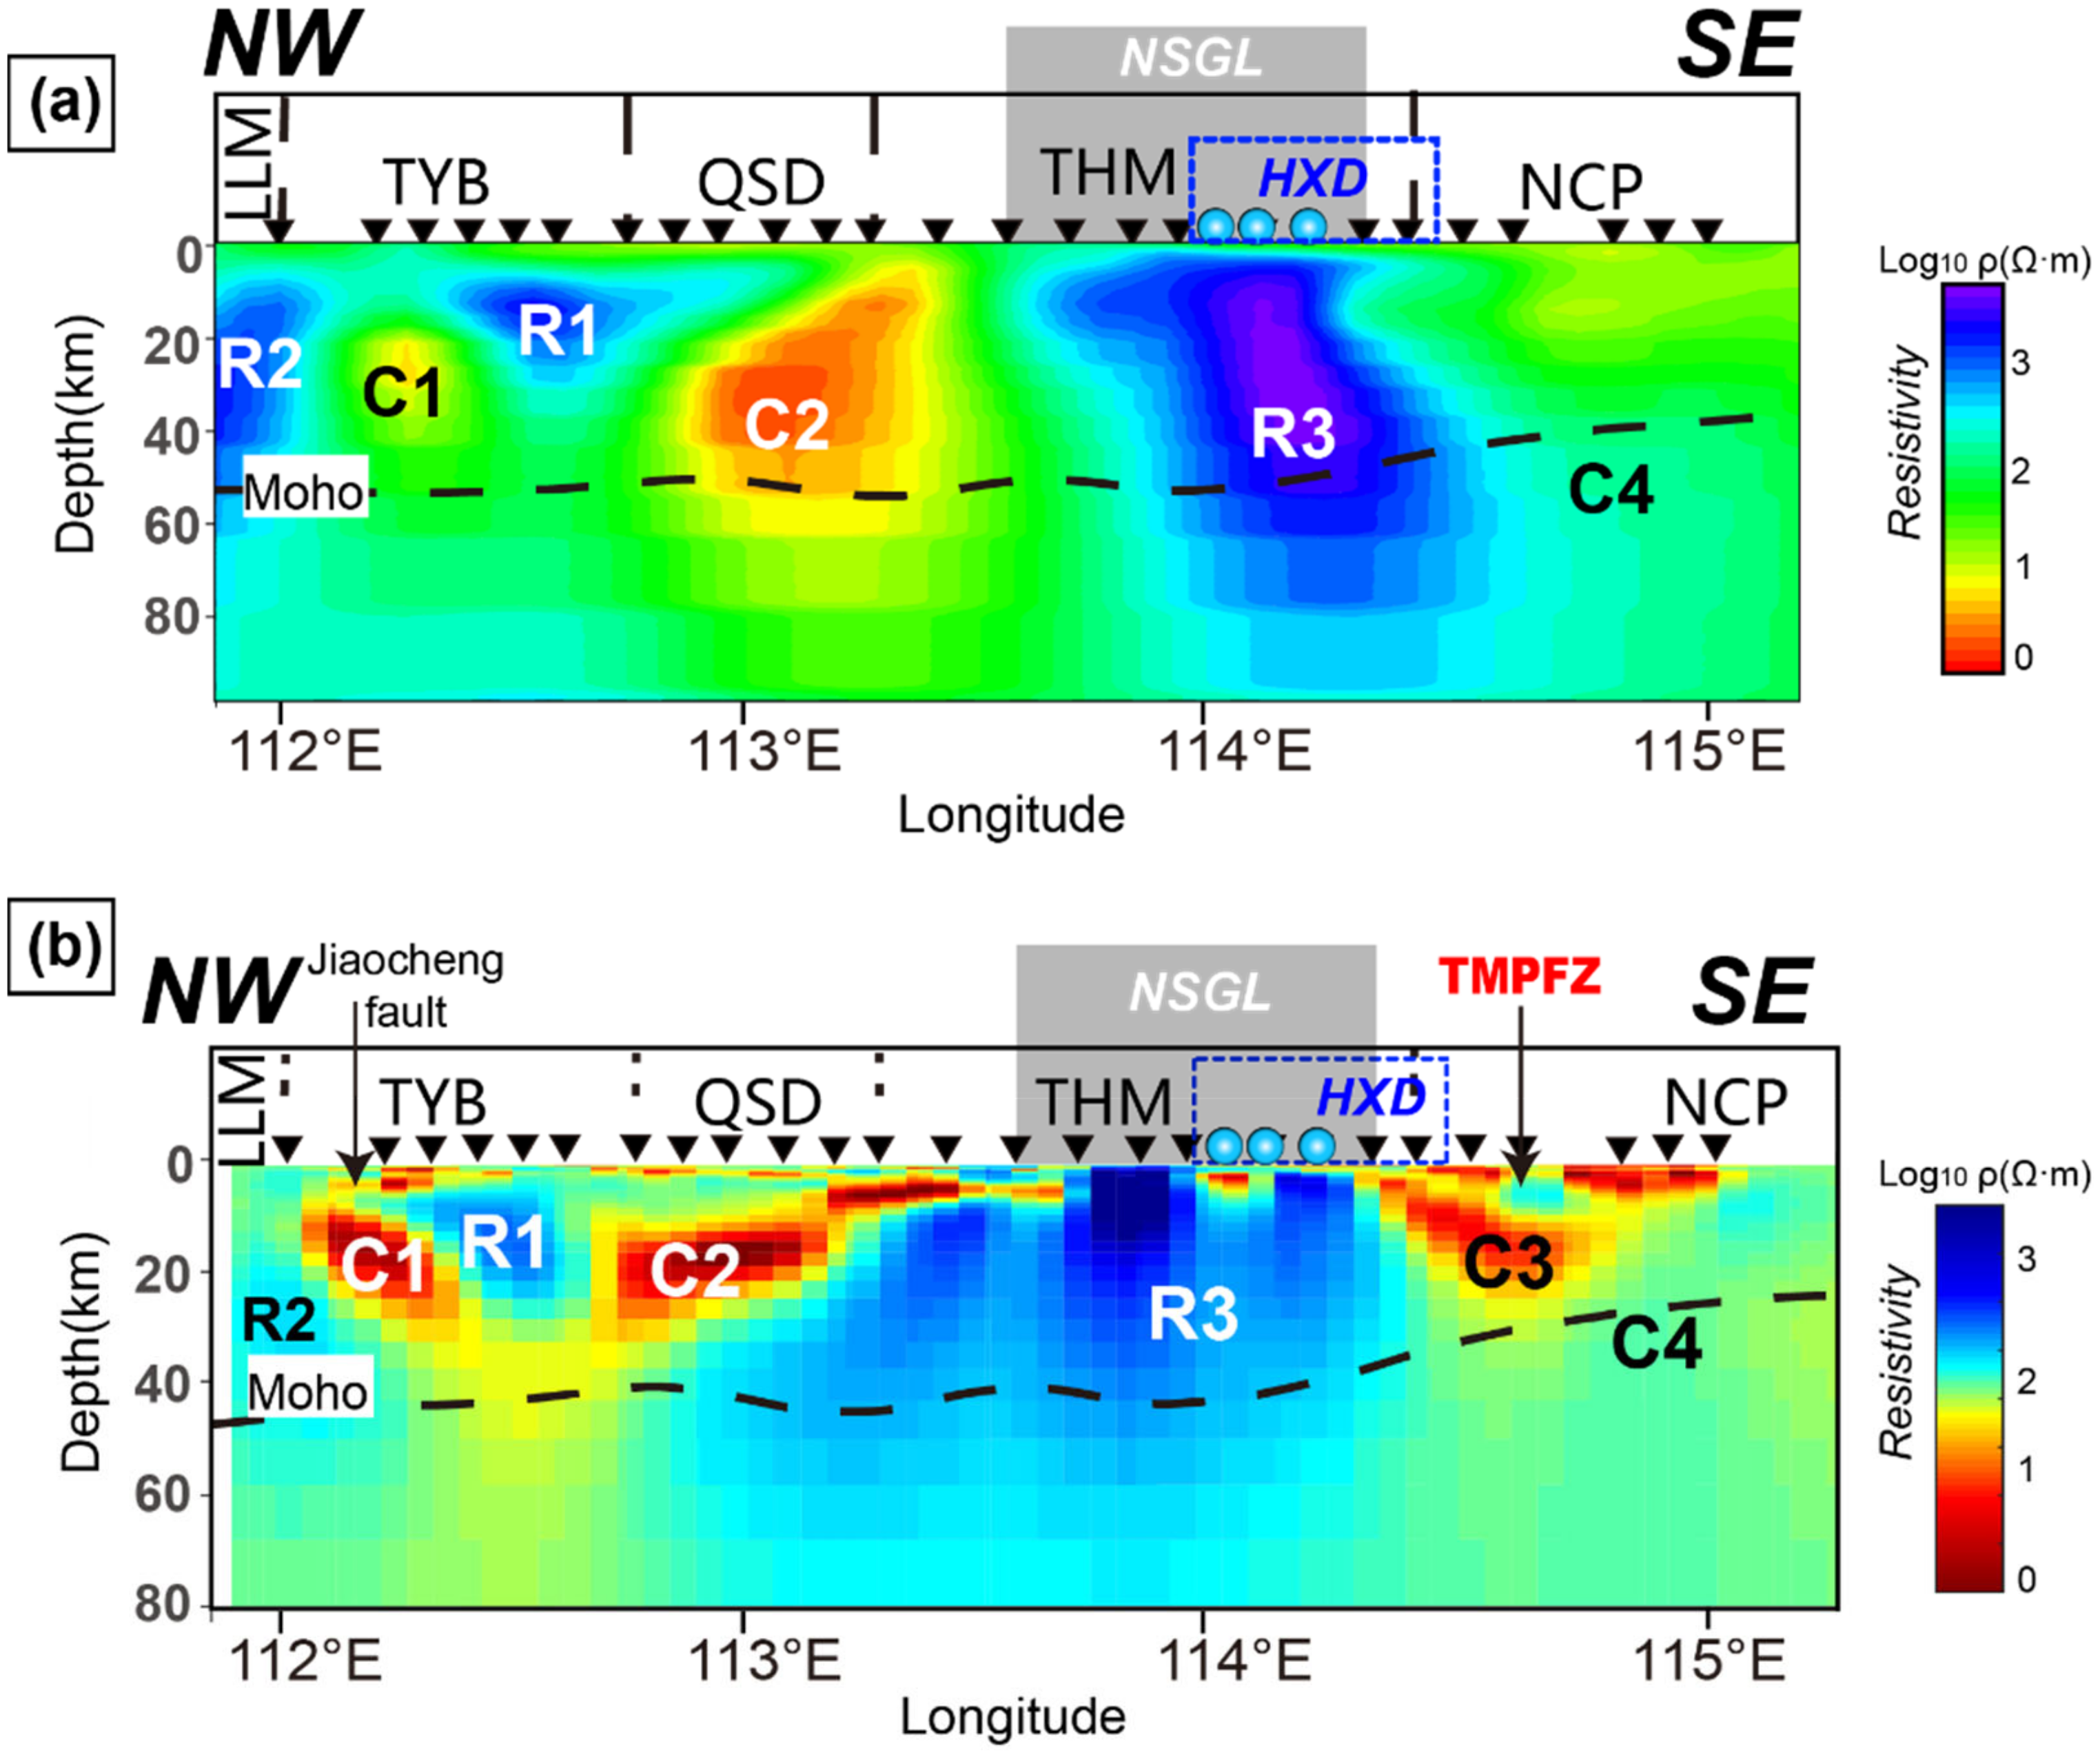
  • The crust and uppermost mantle beneath the Taihang Mountains to the west of Handan-Xingtai district is characterized by high resistivity and can be interpreted as the relic Precambrian lithosphere;
  • The lithosphere beneath the region to the east of the Handan-Xingtai district generally shows high-conductivity features, which may indicate the overall lithospheric destruction that was caused by modification by asthenosphere-derived materials, as a result of the drastic tectonic processes in eastern China since the late Mesozoic;
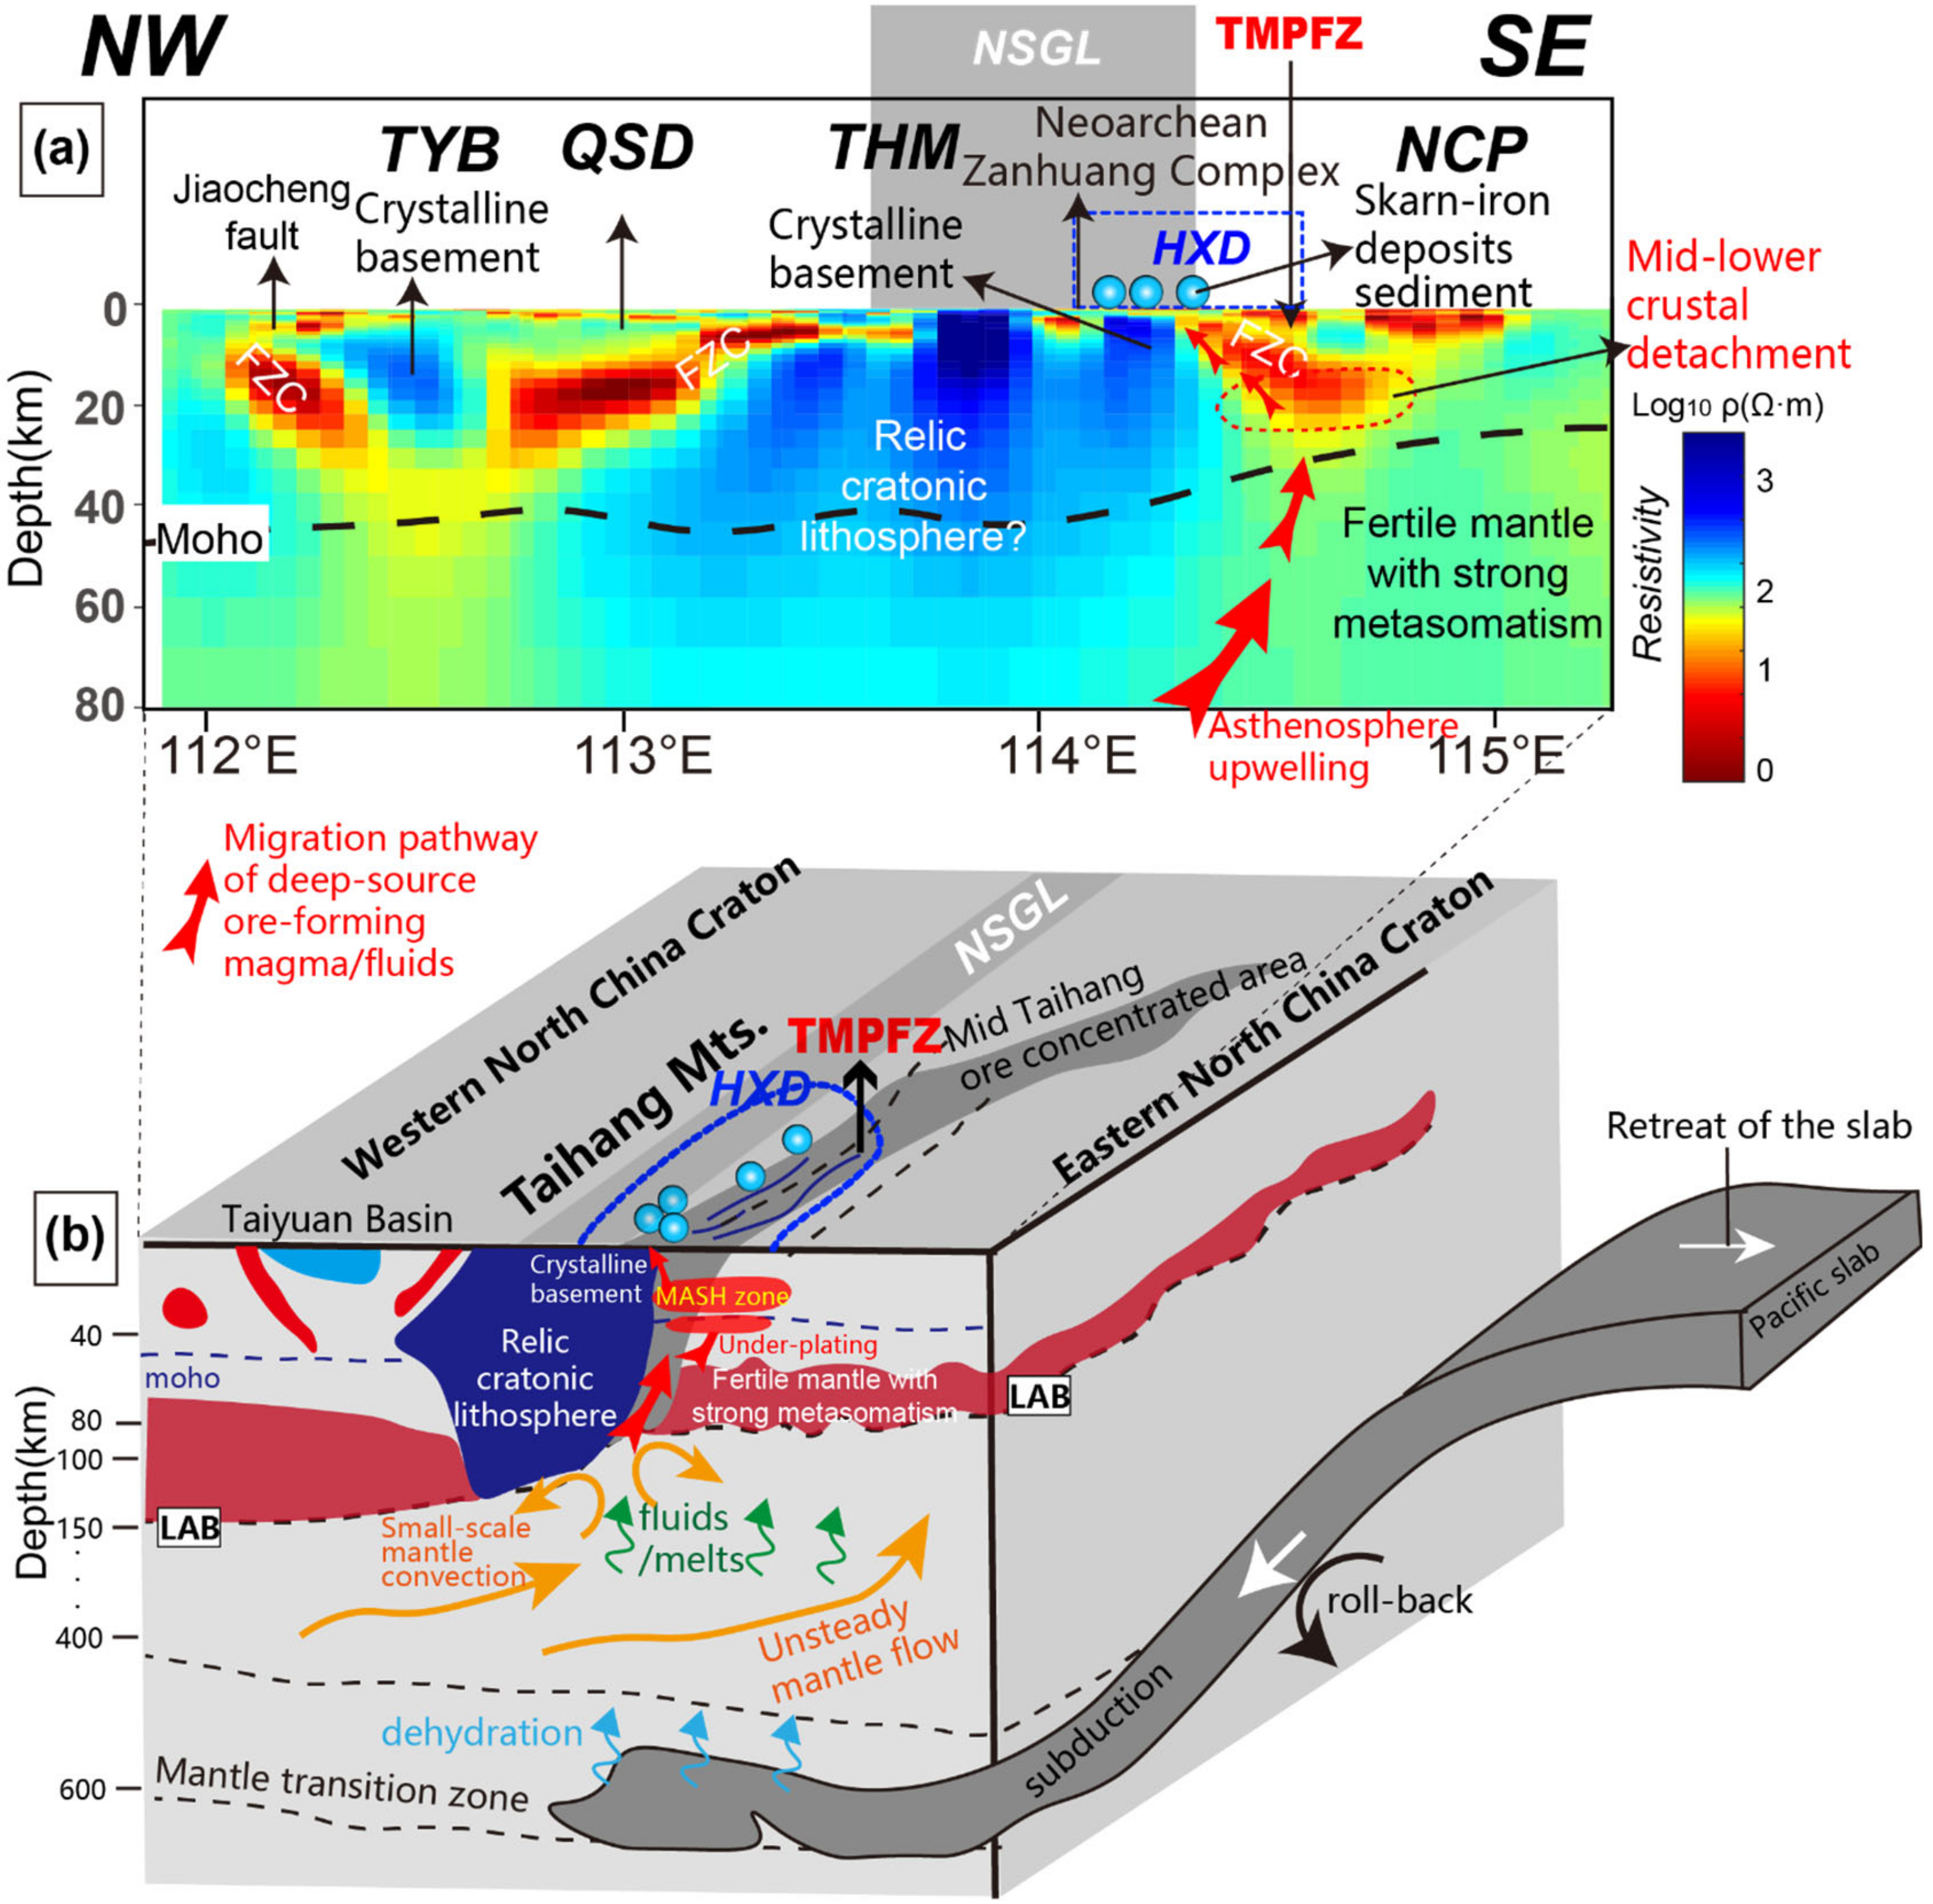
  • The Handan-Xingtai district is coincidentally located at the transfer zone of lithosphere thickness and properties, where small-scale mantle convection and upwellings are likely to occur, leading to the upward transportation of the mantle-derived melts and fluids to near-surface. During this process, Fe derived from mantle-source magma or the relic Precambrian metamorphic basement beneath the Taihang Mountains was extracted and emplaced along with the Yanshanian magmatism.

Author Contributions

Conceptualization, H.Z. and Y.Y.; methodology, Y.Y., S.J. and W.W.; software, L.X. and H.W; validation, P.Q. and Q.W.; formal analysis, S.J. and W.W.; investigation, Q.W. and H.W.; resources, Y.Y.; datacuration, Y.Y.; writing—original draft preparation, H.Z., Y.Y., L.X. and P.Q.; writing—review and editing, H.Z. and Y.Y.; project administration, S.J., W.W. and Y.Y. All authors have read and agreed to the published version of the manuscript.

Funding

This research was mainly supported by the National Natural Science Foundation of China (grant no. 40434010, 41974092 and 41704079). The development of some methods used in this research was supported by National Key Research and Development Program of China (NO. 2018YFC0604104 and 2016YFC0600201).

Institutional Review Board Statement

Not applicable.

Informed Consent Statement

Not applicable.

Data Availability Statement

Not applicable.

Acknowledgments

We thank all the faculty and graduate students from the MT group in China University of Geosciences (Beijing) for providing facilities for data collection and processing. We thank Gary Egbert and his group members for sharing their 3D inversion code. We thank Alan Jones and Gary NcNeice for using their tensor decomposition codes.

Conflicts of Interest

The authors declare no conflict of interest.

References

  1. Burt, D.M.; Einaudi, M.T.; Burt, D.M. Skarn deposits; historical bibliography through 1970. Econ. Geol. Bull. Soc. Econ. Geol. 1982, 77, 755–763. [Google Scholar] [CrossRef]
  2. Meinert, L.D. Skarns and skarn deposits. Geosci. Can. 1992, 19, 145–162. [Google Scholar]
  3. Meinert, L.D.; Dipple, G.M.; Nicolescu, S.; Hedenquist, J.W.; Thompson, J.F.H.; Goldfarb, R.J.; Richards, J.P. World Skarn Deposits. In One Hundredth Anniversary Volume; Society of Economic Geologists: Littleton, CO, USA, 2005; p. 100. [Google Scholar]
  4. Mao, J.; Wang, Y.; Zhang, Z.; Yu, J.; Niu, B. Geodynamic settings of Mesozoic large-scale mineralization in North China and adjacent areas—Implication from the highly precise and accurate ages of metal deposits. Sci. China Ser. D Earth Sci. 2003, 46, 838–851. [Google Scholar] [CrossRef]
  5. Zhang, Z.C.; Hou, T.; Santosh, M.; Li, H.M.; Li, J.W.; Zhang, Z.H.; Song, X.Y.; Wang, M. Spatio-temporal distribution and tectonic settings of the major iron deposits in China: An overview. Ore Geol. Rev. 2014, 57, 247–263. [Google Scholar] [CrossRef]
  6. Deng, X.D.; Li, J.W.; Wen, G. U-pb geochronology of hydrothermal zircons from the early cretaceous iron skarn deposits in the Handan-Xingtai district, North China Craton. Econ. Geol. 2015, 110, 2159–2180. [Google Scholar] [CrossRef]
  7. Li, S.-R.; Santosh, M.; Zhang, H.-F.; Shen, J.-F.; Dong, G.-C.; Wang, J.-Z.; Zhang, J.-Q. Inhomogeneous lithospheric thinning in the central North China Craton: Zircon U-Pb and S-He-Ar isotopic record from magmatism and metallogeny in the Taihang Mountains. Gondwana Res. 2013, 23, 141–160. [Google Scholar] [CrossRef]
  8. Sun, Y.; Wu, T.; Xiao, L.; Bai, M.; Zhang, Y.H. U-Pb ages, Hf-O isotopes and trace elements of zircons from the ore-bearing and ore-barren adakitic rocks in the Handan-Xingtai district: Implications for petrogenesis and iron mineralization. Ore Geol. Rev. 2019, 104, 14–25. [Google Scholar] [CrossRef]
  9. Wen, G. The Mechanisms and Key Factors in Forming high-Grade Iron Skarn Deposits in Handan-Xingtai District, North China Craton. Ph.D. Thesis, China University of Geosciences, Wuhan, China, 2007. [Google Scholar]
  10. Xu, Y.G. Diachronous lithospheric thinning of the North China Craton and formation of the Daxin’anling-Taihangshan gravity lineament. Lithos 2007, 96, 281–298. [Google Scholar] [CrossRef]
  11. Zhu, R.X.; Fan, H.R.; Li, J.W.; Meng, Q.R.; Li, S.R.; Zeng, Q.D. Decratonic gold deposits. Sci. Sin. 2015, 45, 1153–1168. [Google Scholar] [CrossRef]
  12. Tang, Y.J.; Zhang, H.F.; Ying, J.F. Asthenosphere-lithospheric mantle interaction in an extensional regime: Implication from the geochemistry of Cenozoic basalts from Taihang Mountains, North China Craton. Chem. Geol. 2006, 233, 309–327. [Google Scholar] [CrossRef]
  13. Zhang, H.D.; Wang, D.Q.; Liu, J.C.; Yang, J.K. Geology, geochronology, and fluid evolution of the pingshun skarn iron deposit, Southern Taihang Mountains. Arab. J. Geosci. 2019, 12, 497. [Google Scholar] [CrossRef]
  14. Xie, Q.H.; Zhang, Z.C.; Jin, Z.; Santosh, M.; Han, L.; Wang, K.Y.; Zhao, P.L.; He, H.H. The high-grade Fe skarn deposit of Jinling, North China Craton: Insights into hydrothermal iron mineralization. Ore Geol. Rev. 2021, 138, 104395. [Google Scholar] [CrossRef]
  15. Zhang, J.Q.; Li, S.R.; Santosh, M.; Wang, J.Z.; Li, Q. Mineral chemistry of high-Mg diorites and skarn in the Han-Xing Iron deposits of South Taihang Mountains, China: Constraints on mineralization process. Ore Geol. Rev. 2015, 64, 200–214. [Google Scholar] [CrossRef]
  16. Xu, W.L.; Yang, D.B.; Pei, F.P.; Wang, F.; Wang, W. Mesozoic lithospheric mantle modified by delaminated lower continental crust in the North China Craton: Constraints from compositions of amphiboles from peridotite xenoliths. J. Jilin Univ. Earth Sci. Ed. 2009, 39, 606–617. [Google Scholar]
  17. Zhang, J.Q.; Yan, L.N.; Santosh, M.; Li, S.R.; Lu, J.; Wang, D.X.; Liang, X.; Wang, L.X.; Li, Y.Q. Tracing the genesis of skarn type iron deposit in central North China Craton: Insights from mineral zoning textures in ore-forming intrusion. Geol. J. 2020, 55, 6280–6295. [Google Scholar] [CrossRef]
  18. Ma, X.Y. Lithospheric Dynamics Map of China and Adjacent Seas (1:4,000,000) and Explanatory Notes; Publishing House of Geology: Beijing, China, 1989. [Google Scholar]
  19. Cao, X.Z.; Li, S.Z.; Liu, X.; Suo, Y.H.; Zhao, S.J.; Xu, L.Q.; Dai, L.M.; Wang, P.C.; Yu, S. The intraplate morplotectonic inversion along the Eastern Taihang Mountain FaultZone, North China and its mechanism. Earth Sci. Front. 2013, 20, 88–103. [Google Scholar]
  20. Wei, W.B.; Ye, G.F.; Jin, S.; Peng, Z.Q.; Lin, X.; Song, S.L.; Tang, B.S.; Qu, S.Z.; Chen, K.; Yang, H.W.; et al. Geoelectric structure of lithosphere beneath eastern North China: Features of a thinned lithosphere from magnetotelluric soundings. Earth Sci. Front. 2008, 15, 204–216. [Google Scholar] [CrossRef]
  21. Yin, Y.T.; Jin, S.; Wei, W.B.; Lü, Q.T.; Ye, G.F.; Jing, J.E.; Zhang, L.T.; Dong, H.; Xie, C.L. Lithosphere structure and its implications for the metallogenesis of the Nanling range, South China: Constraints from 3-D magnetotelluric imaging. Ore Geol. Rev. 2021, 131, 104064. [Google Scholar] [CrossRef]
  22. Lü, Q.T.; Dong, S.W.; Tang, J.T.; Shi, D.N.; Chang, Y.F. Multi-scale and integrated geophysical data revealing mineral systems and exploring for mineral deposits at depth a synthesis from sinoprobe-03. Chin. J. Geophys. Chin. Ed. 2015, 58, 4319–4343. [Google Scholar]
  23. Zhao, G.C.; Sun, M.; Wilde, S.A.; Li, S.Z. Late Archean to Paleoproterozoic evolution of the North China Craton: Key issues revisited. Precambrian. Res. 2005, 136, 177–202. [Google Scholar] [CrossRef]
  24. Wang, J.P.; Kusky, T.M.; Wang, L.; Polat, A.; Wang, S.J.; Deng, H.; Fu, J.M.; Fu, D. Petrogenesis and geochemistry of circa 2.5 Ga granitoids in the Zanhuang Massif: Implications for magmatic source and Neoarchean metamorphism of the North China Craton. Lithos 2017, 268–271, 149–162. [Google Scholar] [CrossRef]
  25. Wei, Z.; Chen, L.; Li, Z.; Ling, Y.; Li, J. Regional variation in Moho depth and Poisson’s ratio beneath eastern China and its tectonic implications. J. Asian Earth Sci. 2016, 115, 308–320. [Google Scholar] [CrossRef]
  26. Huang, J.L.; Zhao, D.P. High-resolution mantle tomography of China and surrounding regions. J. Geophys. Res. 2006, 111, B09305. [Google Scholar] [CrossRef]
  27. Zhu, R.X.; Xu, Y.G.; Zhu, G.; Zhang, H.F.; Xia, Q.K.; Zheng, T.Y. Destruction of the North China Craton. Sci. China Earth Sci. 2012, 55, 1565–1587. [Google Scholar] [CrossRef]
  28. Zheng, T.Y.; Chen, L.; Zhao, L.; Xu, W.W.; Zhu, R.X. Crust–mantle structure difference across the gravity gradient zone in North China Craton: Seismic image of the thinned continental crust. Phys. Earth Planet. Inter. 2006, 159, 43–58. [Google Scholar] [CrossRef]
  29. Xu, M.C.; Gao, J.H.; Rong, L.X.; Wang, G.K.; Wang, X.J. Seismic analysis of the active character of the Taihang Mountain piedmont fault. Appl. Geophys. 2010, 7, 392–398. [Google Scholar] [CrossRef]
  30. Shen, J.F.; Li, S.R.; Santosh, M.; Dong, G.C.; Wang, Y.J.; Liu, H.M.; Peng, Z.D.; Zhang, Z.Y. Zircon U-Pb geochronology of the basement rocks and dioritic intrusion associated with the Fushan skarn iron deposit, Southern Taihang Mountains, China. J. Asian Earth Sci. 2015, 113, 1132–1142. [Google Scholar] [CrossRef]
  31. Egbert, G.D.; Booker, J.R. Robust estimation of geomagnetic transfer functions. Geophys. J. R. Astron. Soc. 1986, 87, 173–194. [Google Scholar] [CrossRef] [Green Version]
  32. Gamble, T.D.; Goubau, W.M.; Clarke, J. Error analysis for remote reference magnetotellurics. Geophysics 1979, 44, 959–968. [Google Scholar] [CrossRef]
  33. Groom, R.W.; Bailey, R.C. Decomposition of magnetotelluric impedance tensors in the presence of local three-dimensional galvanic distortion. J. Geophys. Res. Solid Earth 1989, 94, 1913–1925. [Google Scholar] [CrossRef] [Green Version]
  34. Caldwell, T.G.; Bibby, H.M.; Brown, C. The magnetotelluric phase tensor. Geophys. J. Int. 2004, 158, 457–469. [Google Scholar] [CrossRef] [Green Version]
  35. Parkinson, W.D. The inflfluence of continents and oceans on geomagnetic variations. Geophys. J. R. Astr. Soc. 1962, 6, 411–449. [Google Scholar] [CrossRef] [Green Version]
  36. Rodi, W.; Mackie, R.L. Nonlinear conjugate gradients algorithm for 2D magnetotelluric inversion. Geophysics 2001, 66, 174–187. [Google Scholar] [CrossRef]
  37. Egbert, G.; Kelbert, A. Computational recipes for electromagnetic inverse problems. Geophys. J. Int. 2012, 189, 251–267. [Google Scholar] [CrossRef]
  38. Kelbert, A.; Meqbel, N.; Egbert, G.D.; Tandon, K. ModEM: A modular system for inversion of electromagnetic geophysical data. Comput. Geosci. 2014, 66, 40–53. [Google Scholar] [CrossRef]
  39. Simpson, F.; Bahr, K. Practical Magnetotellurics; Cambridge University Press: Cambridge, UK, 2005; pp. 1–270. [Google Scholar]
  40. Zhu, W.; Zhang, Q.; Ding, X.L.; Zhao, C.Y.; Yang, C.S.; Qu, W. Recent ground deformation of Taiyuan basin (China) investigated with C-, L-, and X-bands SAR images. J. Geodyn. 2013, 70, 28–35. [Google Scholar] [CrossRef]
  41. Selway, K. On the Causes of Electrical Conductivity Anomalies in Tectonically Stable Lithosphere. Surv. Geophys. 2013, 35, 219–257. [Google Scholar] [CrossRef]
  42. Liu, Y.Y.; Zhao, C.Y.; Zhang, Q.; Yang, C.S. Complex surface deformation monitoring and mechanism inversion over Qingxu-Jiaocheng, China with multi-sensor SAR images. J. Geodyn. 2018, 114, 41–52. [Google Scholar] [CrossRef]
  43. Wu, Y.D.; Ju, Y.W.; Hou, Q.L.; Hu, S.B.; Fan, P.J. Comparison of coalbed gas generation between Huaibei-Huainan coalfields and Qinshui coal basin based on the tectono-thermal modeling. Sci. China Earth Sci. 2011, 54, 1069–1077. [Google Scholar] [CrossRef]
  44. Unsworth, M.J.; Bedrosian, P.A. On the geoelectric structure of major strike-slip faults and shear zones. Earth Planets Space 2004, 56, 1177–1184. [Google Scholar] [CrossRef] [Green Version]
  45. Wang, Y.J.; Fan, W.M.; Zhang, Y.H.; Guo, F.; Zhang, H.F.; Peng, T.P. Geochemical, 40Ar/39Ar geochronological and Sr-Nd isotopic constraints on the origin of Paleoproterozoic mafic dikes from the southern Taihang Mountains and implications for the 1800 Ma event of the North China Craton. Precambrian. Res. 2004, 135, 55–77. [Google Scholar] [CrossRef]
  46. Yang, X. Origin of High Electrical Conductivity in the Lower Continental Crust: A Review. Surv. Geophys. 2011, 32, 875–903. [Google Scholar] [CrossRef]
  47. Spratt, J.E.; Skulski, T.; Craven, J.A.; Jones, A.G.; Snyder, D.B.; Kiyan, D. Magnetotelluric investigations of the lithosphere beneath the central rae craton, mainland nunavut, canada. J. Geophys. Res. Solid Earth 2014, 119, 2415–2439. [Google Scholar] [CrossRef]
  48. Huang, J.H.; Yin, Y.T.; Jin, S.; Wei, W.B.; Ye, G.F.; Jing, J.E.; Dong, H.; Zhang, L.T.; Xie, C.L.; Xu, L.Y. 3-D electrical structure of the lithosphere beneath the yanshan belt and its adjacent areas, north china. Tectonophysics 2022, 832, 229–333. [Google Scholar] [CrossRef]
  49. Zhu, R.; Zheng, T. Destruction geodynamics of the North China Craton and its Paleoproterozoic plate tectonics. Chin. Sci. Bull. 2009, 54, 33–54. [Google Scholar] [CrossRef] [Green Version]
  50. Van Wijk, J.W.; Baldridge, W.S.; Van Hunen, J.; Goes, S.; Aster, R.; Coblentz, D.D.; Grand, S.P.; Ni, J. Small-scale convection at the edge of the Colorado Plateau: Implications for topography, magmatism, and evolution of Proterozoic lithosphere. Geology 2010, 38, 611–614. [Google Scholar] [CrossRef] [Green Version]
  51. Feucht, D.W.; Sheehan, A.F.; Bedrosian, P.A. Magnetotelluric Imaging of Lower Crustal Melt and Lithospheric Hydration in the Rocky Mountain Front Transition Zone, Colorado, USA. J. Geophys. Res. Solid Earth 2017, 122, 9489–9510. [Google Scholar] [CrossRef]
  52. Sun, P.; Guo, P.Y.; Niu, Y.L. Eastern China continental lithosphere thinning is a consequence of paleo-Pacific plate subduction: A review and new perspectives. Earth Sci. Rev. 2021, 218, 103680. [Google Scholar] [CrossRef]
  53. Zhu, B.; Zhang, H.F.; Zhao, X.M.; He, Y.S. Iron isotope fractionation during skarn-type alteration: Implications for metal source in the Han-Xing iron skarn deposit. Ore Geol. Rev. 2016, 74, 139–150. [Google Scholar] [CrossRef]
Figure 1. (a) A simplified map of the North China Craton and adjacent regions showing the distribution of late Mesozoic granitoid intrusions and major districts hosting large iron-skarn and iron oxide-apatite deposits (modified from [9,10]; (b) Geological sketch map of the research area (modified from [10,11,12,13,14]), showing the distribution of dioritic and monzonitic intrusions related nonferrous metal deposits. Most Fe deposits occur near the Taihang Mountains. MT site locations of the profile used in this study are also shown.1—fault; 2—buried fault; 3—basement liniment; 4—Pliocene-Quaternary; 5—Plain deposit; 6—Neogene red clay; 7—Mesozoic intrusive; 8—Cenozoic basalts; 9—gold deposits; 10—MT sites; 11—iron deposits; 12—North–South Gravity Lineament; 13—HXD. Abbreviations: OB—Ordos Basin; LLM—Lüliang Mountain; WHB—Weihe Basin; TYB—Taiyuan Basin; QSD—Qinshui Depression; THM—Taihang Mountain; NCP—North China Plain; HXD—Handan-Xingtai district; TLF—Tancheng-Lujiang fault zone.
Minerals 13 00014 g001
Figure 2. Typical apparent resistivity, phase curves and tippers for 4 sub-regions of the research area. (a) Locations of MT sites from 4 sub-regions. (be) show the typical curves from the Taiyuan Basin (TYB), Taihang Mountain (THM), and North China Plain (NCP), respectively. It’s notable that the impedance tensors for 2D inversion were rotated to a uniform strike direction, i.e., N45°E, while the impedance components for 3D inversion were unrotated.
Minerals 13 00014 g002
Figure 3. Geoelectric strike direction, phase tensor and real induction arrows for different period bands. Strike directions are shown as rose diagrams for three different zones of MT sites according to geographical locations, with red-blue sectors illustrating the inherent 90° ambiguity. Phase tensor ellipses are shaded according to skew value β. The induction vectors are plotted in the Parkinson convention, pointing towards conductors. The superposed tectonic features are the same as those in Figure 1b.
Minerals 13 00014 g003
Figure 4. Horizontal slices of 3D inversion model at depths of 5, 10, 20, 30 and40 km, respectively. The superposed tectonic features are the same as in Figure 1b. The white triangles demonstrate the locations of MT sites. Warm and cold colors indicate low and high resistivity.
Minerals 13 00014 g004
Figure 5. Vertical slices of both 2D and 3D inversion models along the transect P1 are shown in Figure 4. (a) 2D inversion model;(b) 3D inversion model. Abbreviations: LLM—Lüliang Mountain; TYB—Taiyuan Basin; QSD—Qinshui Depression; THM—Taihang Mountain; NCP—North China Plain. R1–R3 represent major high-resistivity zones. C1–C4 indicates major conductors. The Moho depth was plotted according to a previous seismic survey [25].
Minerals 13 00014 g005
Figure 6. (a) General geological interpretation for the vertical slice of the 3D inversion model along P1 in Figure 4. (b) An integrated 3D sketch diagram illustrating possible metallogenic mechanisms of the HXD inferred from the crustal and upper mantle electrical structure derived from this research. The deep structure (>80 km) in (b) was determined or modified according to previous studies [26,27,49], while the shallower part of this sketch is mainly based on the geological interpretation in (a).
Minerals 13 00014 g006
Disclaimer/Publisher’s Note: The statements, opinions and data contained in all publications are solely those of the individual author(s) and contributor(s) and not of MDPI and/or the editor(s). MDPI and/or the editor(s) disclaim responsibility for any injury to people or property resulting from any ideas, methods, instructions or products referred to in the content.

