Article

Behaviors of Silicon, Aluminum and Iron and Kinetics of Silicon from the Roasted Clinker of Silver Tailings in Water–Acid Leaching Process

1
College of Materials Science and Engineering, Xi’an University of Architecture and Technology, Xi’an 710055, China
2
School of Earth Science and Resources, Chang’an University, Xi’an 710054, China
3
Institute of Earth Environment, Chinese Academy of Sciences, Xi’an 710061, China
*
Authors to whom correspondence should be addressed.
Minerals 2023, 13(1), 105; https://doi.org/10.3390/min13010105
Submission received: 15 November 2022 / Revised: 8 January 2023 / Accepted: 8 January 2023 / Published: 9 January 2023

Abstract

:
In order to achieve efficient resource utilization of metal tailings, taking the roasted clinker of silver tailings (RCST) as the object, the dissolution behaviors of Si, Al and Fe in the water–acid two-stage leaching process and the water leaching kinetics of Si were investigated in this study. Single-factor experiments were performed to investigate the effects of the leaching parameters; the XRF, XRD and SEM-EDS methods were used to characterize the leaching residues with different leaching times, and the leaching kinetics models of Si were established. The results demonstrate that, in the water leaching stage, the sodium silicate and a small part of the structurally unstable sodium aluminosilicate in RCST are dissolved, while the nepheline, most of the sodium aluminosilicate and the mixed materials containing iron enter the water leaching residue. The first 5 min of water leaching is controlled by both interfacial transfer and diffusion across the product layer, with an apparent activation energy of 22.36 kJ/mol, and the dissolution reaction during 5–15 min is controlled by the unsteady diffusion of the liquid film, with an apparent activation energy of 14.22 kJ/mol. The structure of the materials in the clinker is completely destroyed, and a great number of fissures and pores are produced by the continued dissolving action of the water. Thus, in the acid leaching stage, the amorphous Si-, Al- and Fe-containing substances in the water leaching residue are rapidly dissolved in the sulfuric acid solution at a lower temperature.

1. Introduction

The enormous accumulation of mine tailings and the consequent environmental problems are getting worse [1,2,3]. However, tailings contain a large number of useful components that can be exploited [4,5]. In the current context of increasing scarcity of mineral resources, it has become a consensus that tailings are a type of secondary resource [6,7]. For this reason, discovering how to make effective use of tailings is the focus of current research.
In recent years, a lot of studies have been carried out on the recovery of useful components from tailings [8,9,10,11,12,13]. However, previous studies only focused on the recovery of a part of the trace metallic elements and neglected the value of the major elements, such as silicon, aluminum, etc., resulting in the discharge of large amounts of secondary tailings, which cannot fundamentally solve the problems of environmental pollution and resource waste. In addition, the major elements are also precious mineral resources. For example, aluminum has been established in second position on the list of most commonly used metals in modern society [14] and is one of the strategic mineral resources in China [15]. Silicon is the elemental building block of today’s ‘high-tech’ materials [16], needed in aerospace [17], biomedicine [18] and photovoltaic materials [19], and is classified as a strategic mineral by Japan [20]. Therefore, if the major elements such as SiO2 and Al2O3 can be firstly separated and recovered, not only can it greatly decrease the tailings accumulation and effectively use resources, but also it can enormously concentrate the trace elements to be further divided and extracted, which achieves the maximum resource utilization of tailings and even complete recycling.
In our previous study, the basic characteristics of silver tailings from Shaanxi Silver Mining Co., Ltd., China, were investigated, of which the combined amount of SiO2, Al2O3 and Fe2O3 was 74.30%. The sodium carbonate roasting method was used to activate the formerly stable and insoluble minerals in the tailings to become structurally loose and soluble materials [21]. For the leaching of the components, there are two categories of methods: acid leaching and alkaline leaching (Table 1). Therein, most silicon leaching utilizes alkali methods [22,23]. To leach aluminum, either alkali [24] or acid methods [25] can be applied, while the leaching of iron is chiefly achieved by acid methods [26,27]. Recently, several approaches have been carried out for recovering Al and Fe elements from tailings. For example, Zhang et al. [28] reported that 88.64% of Al leaching from bauxite tailings was obtained with a mixed acid concentration of 60%, liquid–solid ratio of 4 mL/g, temperature of 373 K and time of 3 h. Tao et al. [29] showed that the leaching ratio of Fe was 66.45% with the conditions of 0.53 mol/L H2SO4, 10 mL/g L/S ratio, 313 K and 2 h. Almeida et al. [30] showed that the recovery ratio of Fe was approximately 94% with high leaching parameters levels (10.8 mol/L HCl, 353 K and 2 h). Hernández et al. [31] studied the recovery of Fe, Co and Ni from nickel tailings in Cuba using a mixed acid solution of tartaric acid and oxalic acid. The results showed that 50% of Fe and 80% of Ni and Co could be extracted after leaching with a mixture of 0.15 mol/L tartaric acid and 0.05 mol/L oxalic acid at room temperature for 5 days. However, the conventional leaching processes are difficult to put into practical production due to their prolonged leaching time and low efficiency. In addition, limited studies have reported on the leaching of Si from mine tailings.
Based on the above, a modified water–acid two-stage leaching process was carried out to sufficiently recover Si, Al and Fe from silver tailings, the advantages of which are: (1) it can dissolve the water-soluble substances in the roasted clinker and separate some of the components; (2) it can save acid consumption and improve components’ leaching efficiencies. Herein, a theoretical analysis of the leaching of Si, Al and Fe was performed by taking the silver tailings’ sodium carbonate roasting activated clinker as the object. Then, the behavior of Si, Al and Fe during the leaching process and the kinetics of Si leaching were investigated. The aim of this study is to provide theoretical foundation for the industrial application of and efficient resource utilization of metal tailings.

2. Materials and Methods

2.1. Materials and Reagents

The silver tailings were obtained from Shaanxi Silver Mining Co., Ltd. (Shangluo, China). The roasted clinker, which was the subject of this research, was prepared by mixing the silver tailings with 99% purity sodium carbonate and our self-developed catalysts at a mass ratio of 1:1.3:0.004 and then it was roasted in a muffle furnace at 1023 K for 30 min, after which it was cooled to room temperature and ground to pass through a 200-mesh sieve. The chemical composition of the silver tailings and the roasted clinker was measured using the X-ray fluorescence spectrum (XRF, Shimadzu 1800, Kyoto, Japan), and the contents of the main components are listed in Table 2. As shown in Table 2, the contents of SiO2, Al2O3 and Fe2O3 in the roasted clinker were 27.93%, 8.43% and 8.32%, respectively. The mineralogical analysis and the analysis of the micromorphology with chemical composition of microregions of RCST were performed using X-ray diffraction analysis (XRD, Rigaku D/MAX 2200X, Akishima-shi, Japan) and scanning electron microscopy equipped with an energy-dispersive X-ray spectrometer (SEM-EDS, MLA650F, F.E.I., Hillsboro, USA), as shown in Figure 1. It is shown that the crystalline phases contained in RCST were sodium silicate with flake aggregates (Na2SiO3, Spot 1) and aluminosilicate phases with a layered structure (NaAlSiO4, Spot 2), including nepheline or sodium aluminosilicate, as well as a small amount of sodium ferrate (NaFeO2). In addition, there were also a mixture of various elements (Spot 3) in the clinker which was dense, blocky and not shown in XRD due to its low content. Typically, the particles in the clinker are irregularly shaped and have plenty of defects on the surface, resulting in a large reaction interface, indicating that the clinker has a strong reaction capacity.
The concentrated sulfuric acid (Chengdu Colon Chemicals Co., Ltd., Chengdu, China) and hydrogen peroxide at a concentration of 30% (Tianjin Tianli Chemical Reagent Co., Ltd., Tianjin, China) were of analytical grade. The concentrated sulfuric acid was diluted with water to different concentrations. Deionized water was used in all experiments.

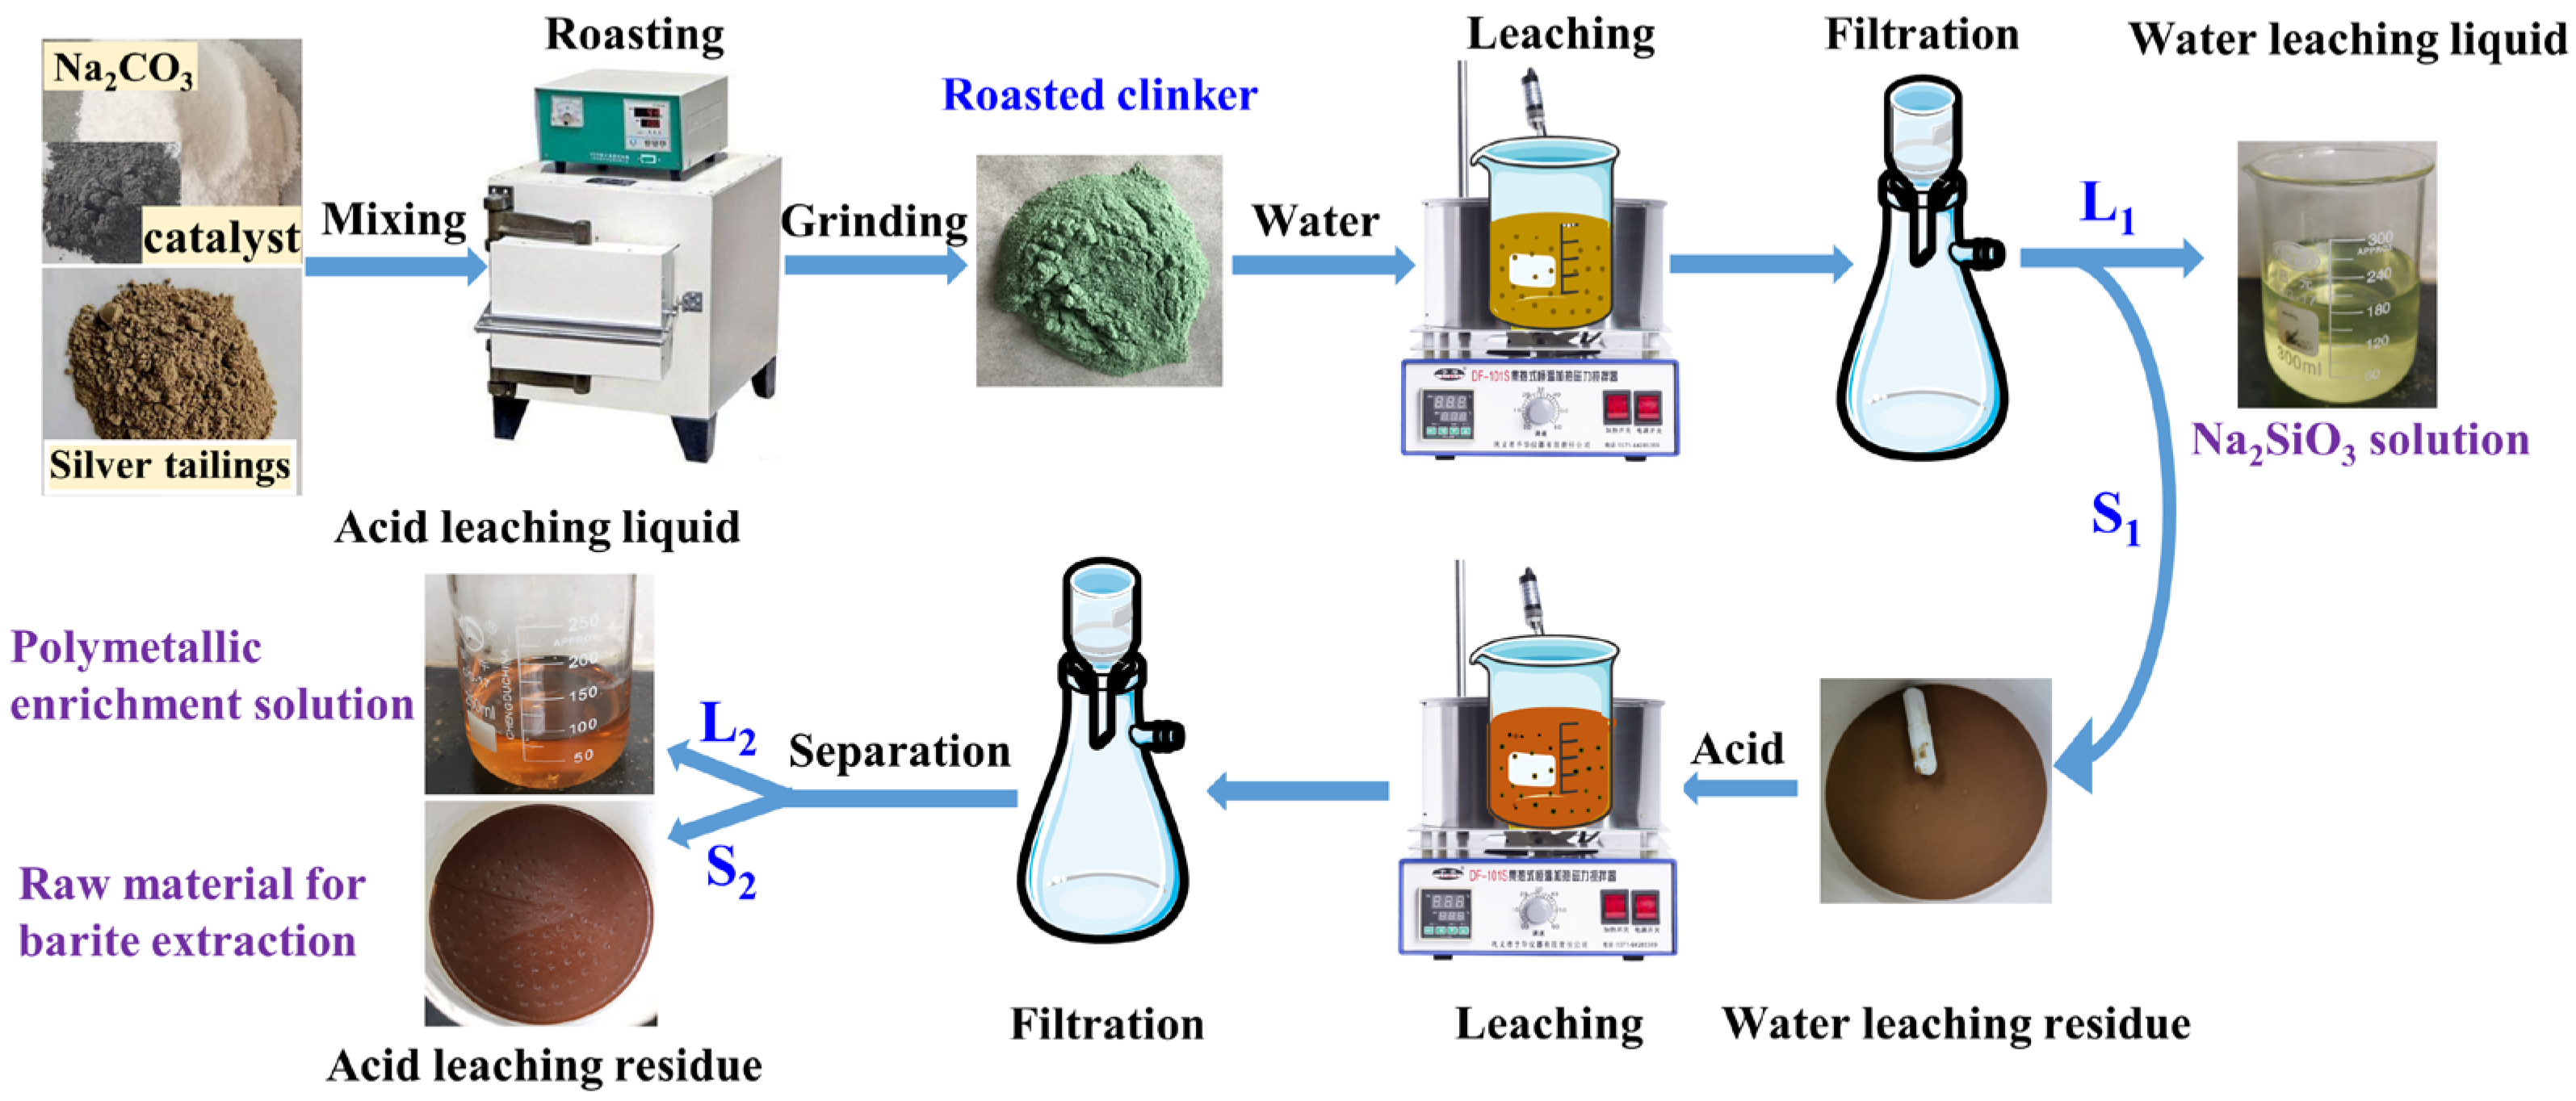
2.2. Experimental Procedure

The water–acid two-stage leaching procedures of RCST are shown in Figure 2.

2.2.1. Water Leaching

A 10g amount of RCST was weighed accurately for use. A certain amount of deionized water according to the liquid–solid ratio of 5–25 mL/g was added into a 300 mL glass beaker and was heated to a given temperature in the range of 303–363 K in a constant-temperature heating magnetic stirrer (DF-101S, Gongyi Yuhua Instrument Co., Ltd., Gongyi, China). When the set temperature was reached, the weighed RCST was slowly added to the stirred hot water, and 1–2 drops of 30% hydrogen peroxide were promptly added, then it was covered with a glass cover and leached for 2–30 min at an agitation rate of 100 r/min. After leaching, the slurry was quickly filtered under a vacuum. The water leaching residue was washed with heated distilled water at least three times to pH = 7 and then dried at 378 K for 2 h.

2.2.2. Acid Leaching

A 10 g amount of the water leaching residue was weighed and poured into a 300 mL beaker. Sulfuric acid with a concentration of 2–10 mol/L was slowly added to the beaker at a liquid–solid ratio of 3–7 mL/g, placed in a constant-temperature heating magnetic stirrer and kept at a speed of 100 r/min from room temperature to 333 K for 1–5 min. After the acid leaching was finished, the slurry was quickly filtered, and the acid leaching residue was rinsed with water three times until it was neutral (pH = 7) and then it was dried at 378 K for 2 h.

2.3. Analysis and Calculation

The chemical analyses of the leaching residues were determined using the X-ray fluorescence spectrum (XRF, Shimadzu 1800, Kyoto, Japan), and all experimental data are the average of three parallel experiments. The leaching ratios of the components in RCST were calculated using Equation (1). The phase compositions of the leaching residues were detected using X-ray diffraction analysis (XRD, Rigaku D/MAX 2200X, Akishima-shi, Japan), and the analysis of micromorphology with chemical composition of microregions of the leaching residues was performed using scanning electron microscopy equipped with an energy-dispersive X-ray spectrometer (SEM-EDS, MLA650F, F.E.I., Hillsboro, OR, USA).
x i = ω s × m s ω i × m i ω s × m s × 100 %
where x i is the leaching efficiency of the element; ω s is the element content of the solid sample treated by leaching; m s is the mass of the solid sample; ω i is the element content of the leaching residue; and m i is the mass of the leaching residue.

3. Results and Discussion

3.1. Chemical Reactions during the Leaching Process

From the analysis of RCST (Section 2.1), it was found to principally contain sodium silicate Na2SiO3, NaAlSiO4 (nepheline), NaAlSiO4 (sodium aluminosilicate) and a small amount of sodium ferrite NaFeO2. The chemical reactions that may occur during the leaching of the Si, Al and Fe elements are as follows.

3.1.1. Water Leaching Stage

In the water leaching stage, the water-soluble Na2SiO3 is dissolved and hydrolyzed. In essence, it is the ion exchange between the Na+ and H+ of the aqueous solution that makes the solution alkaline and generates orthosiliconic acid (H4SiO4) [32]. The chemical reaction is shown as Equation (2).
Na 2 SiO 3 + 3 H 2 O   2 NaOH + H 4 SiO 4
NaAlSiO4 (sodium aluminosilicate) is slightly soluble in alkaline solutions [33] and undergoes hydrolysis to generate NaAl(OH)4 and H4SiO4 [34,35]; the chemical reaction is shown in Equation (3):
NaAlSiO 4 + 4 H 2 O   NaAl ( OH ) 4 + H 4 SiO 4
NaFeO2 undergoes hydrolysis to produce a precipitate of Fe(OH)3, and the reaction is shown in Equation (4):
NaFeO2 + 2H2O = Fe(OH)3↓ + NaOH
In addition, Na2SiO3 in the solution also combines with the NaAl(OH)4 generated by the hydrolysis of NaAlSiO4 as a precipitate of hydrated sodium aluminosilicate [36], as seen in Equation (5):
Na2SiO3 + NaAl(OH)4 = NaAlSiO4·H2O↓ + 2NaOH
As a result, the sodium silicate in RCST, as well as a small amount of sodium aluminosilicate, enters the water leaching solution, while insoluble nepheline, as well as the precipitates formed by the hydrolysis of sodium ferrite and the generated hydrated sodium aluminosilicate, enters into the water leaching residue. This means that some of the Si and a small amount of Al in the clinker go into the water leaching solution, and another part of the Si and most of the Al and Fe go into the water leaching residue.

3.1.2. Acid Leaching Stage

After the water leaching, the aluminosilicates in the water leaching residue, including nepheline and sodium aluminosilicate, as well as Fe(OH)3, can react with sulfuric acid to generate metal sulfate and silicic acid, as per the reaction equations in Equations (6) and (7). Therefore, all the Si, Al and Fe in the water leaching residue enter the acid leaching solution during the acid leaching process.
2NaAlSiO4 + 4H2SO4 = Al2(SO4)3 + Na2SO4 + 2H4SiO4
2Fe(OH)3 + 3H2SO4 = Fe2(SO4)3 + 6H2O

3.2. Effects of Experimental Conditions

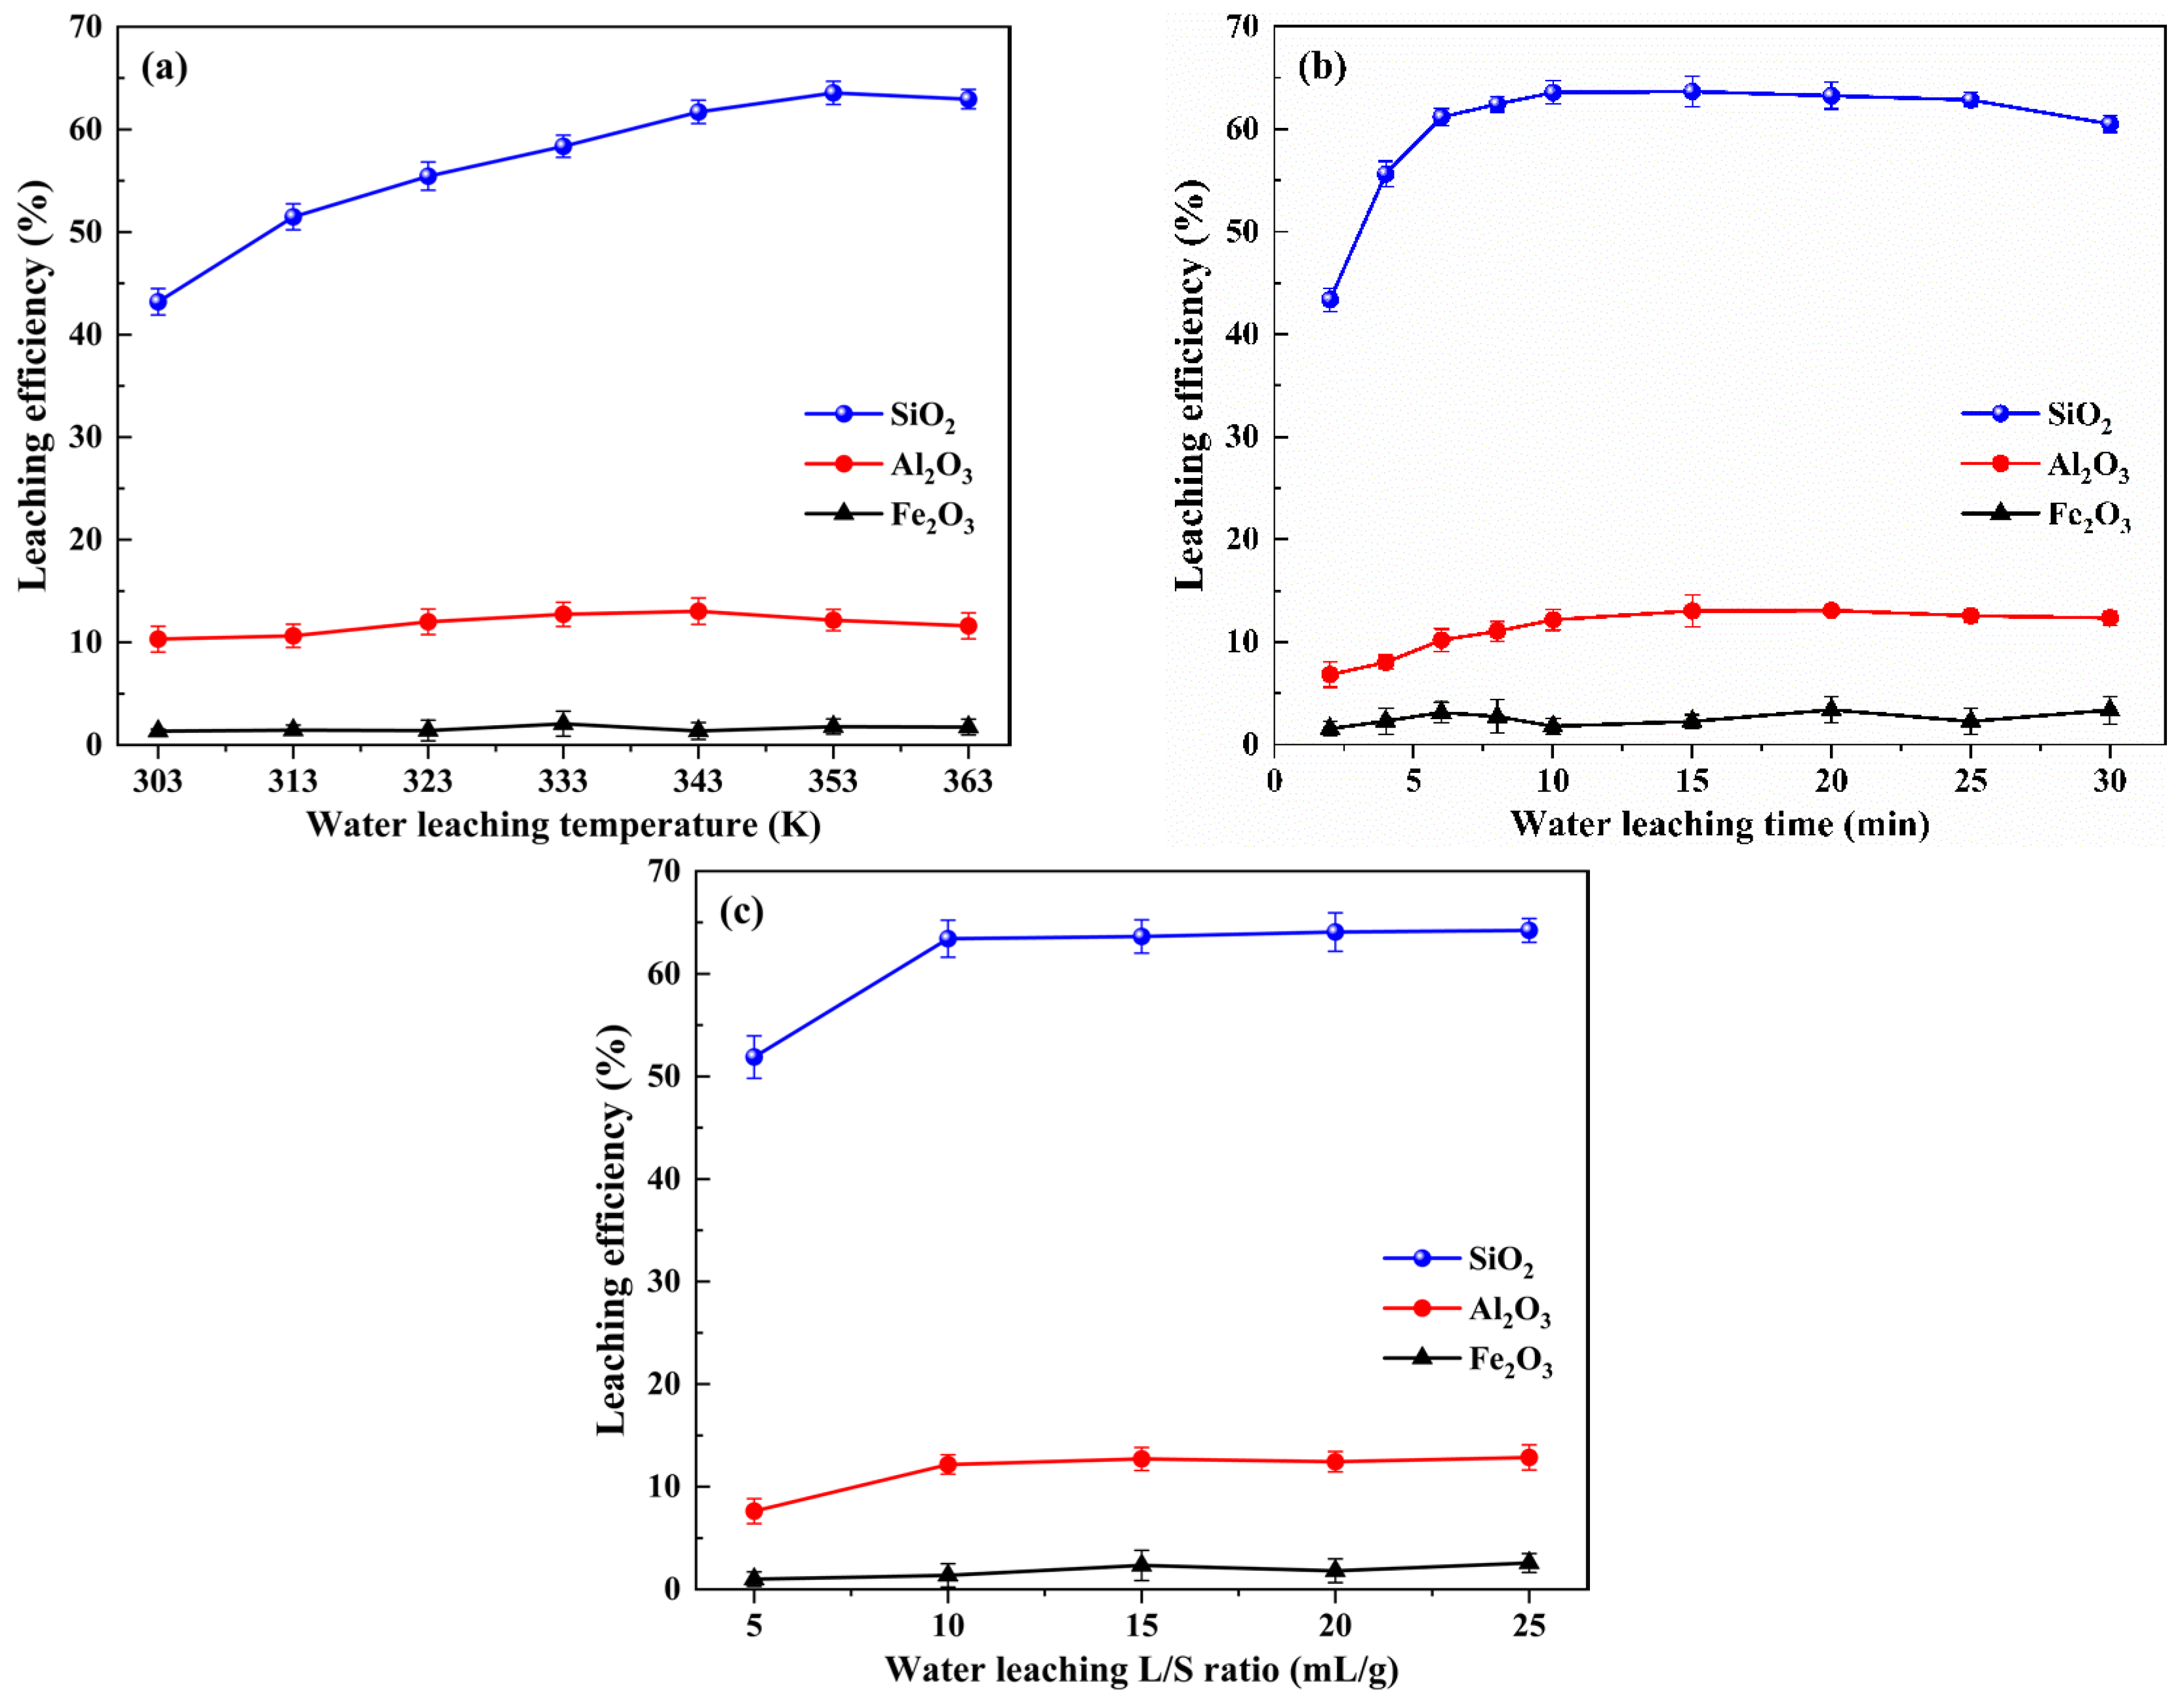
3.2.1. Water Leaching Stage

The RCST water leaching experiments were performed with different leaching temperatures, leaching times and liquid–solid ratios, and the SiO2, Al2O3 and Fe2O3 leaching efficiencies were measured. The effects of these parameters on the leaching of Si, Al and Fe were investigated, as shown in Figure 3.
As shown in Figure 3a, the influence of variations in the leaching temperature (between 303 and 363 K) of the RCST on the SiO2, Al2O3 and Fe2O3 leaching efficiencies was investigated at a liquid–solid ratio of 10 mL/g for 10 min. As seen, the leaching efficiency of SiO2 was raised when the temperature increased from 303 K and 353 K, while it declined when the temperature increased to 363 K. The variation of Al2O3 leaching efficiency was similar to that of SiO2, which also increased and then decreased with the increase in temperature. The leaching efficiency of Fe2O3 was below 3% at all temperatures and was almost not leached. This indicates that increasing the temperature favors the leaching of Si and Al from the clinker. The reason is that the higher temperature accelerates the movement of ions, which promotes the dissolution of soluble substances in the clinker in the water. Moreover, it is known from the literature [36,37] that, in the Na2O–Al2O3–SiO2–H2O system, there is a process of dissolution of the unstable sodium aluminosilicates and precipitation of the stable forms. Thus, the reduction in the leaching efficiencies of SiO2 and Al2O3 at 363 K is presumed to be caused by the generation of insoluble aluminosilicates in the solution. Accordingly, to attain a favorable leaching performance, a 353 K water leaching temperature is appropriate.
The results in Figure 3b display the effects of time on the leaching efficiencies of SiO2, Al2O3 and Fe2O3, which were obtained at a temperature of 353 K and a liquid–solid ratio of 10 mL/g. As shown, the leaching efficiency of SiO2 dramatically increased from 1 to 5 min, slightly increased from 6 to 15 min, leveled off from 15 to 20 min and showed a decreasing trend from 20 to 30 min. In addition, the leaching efficiencies of Al2O3 and Fe2O3 did not alter significantly. It demonstrates that the water leaching reaction is essentially completed within 15 min, with a fast reaction rate from 1 to 5 min and a moderate reaction rate from 6 to 15 min, whereas, when the water leaching time is extended to 20 min, it is assumed that insoluble aluminosilicates are formed in the solution, which results in a decrease in the leaching efficiencies of SiO2 and Al2O3 in the solution [38]. Therefore, in order to obtain a favorable leaching effect, the water leaching time of RCST should be set at 15 min.
Leaching experiments with various liquid–solid ratios were conducted, for which the conditions were a temperature of 353 K and time of 15 min (Figure 3c). As shown, at a low liquid–solid ratio (5 mL/g), the leaching efficiencies of SiO2 and Al2O3 were lower due to the insufficient amount of solution preventing the soluble substances in the clinker from leaching altogether. However, as the liquid-to-solid ratio was raised to 10 mL/g, the leaching efficiencies of SiO2 and Al2O3 increased and then leveled off. Similarly, the leaching efficiency of Fe2O3 was less than 5%. Therefore, the RCST water leaching liquid–solid ratio should be set to 10 mL/g.

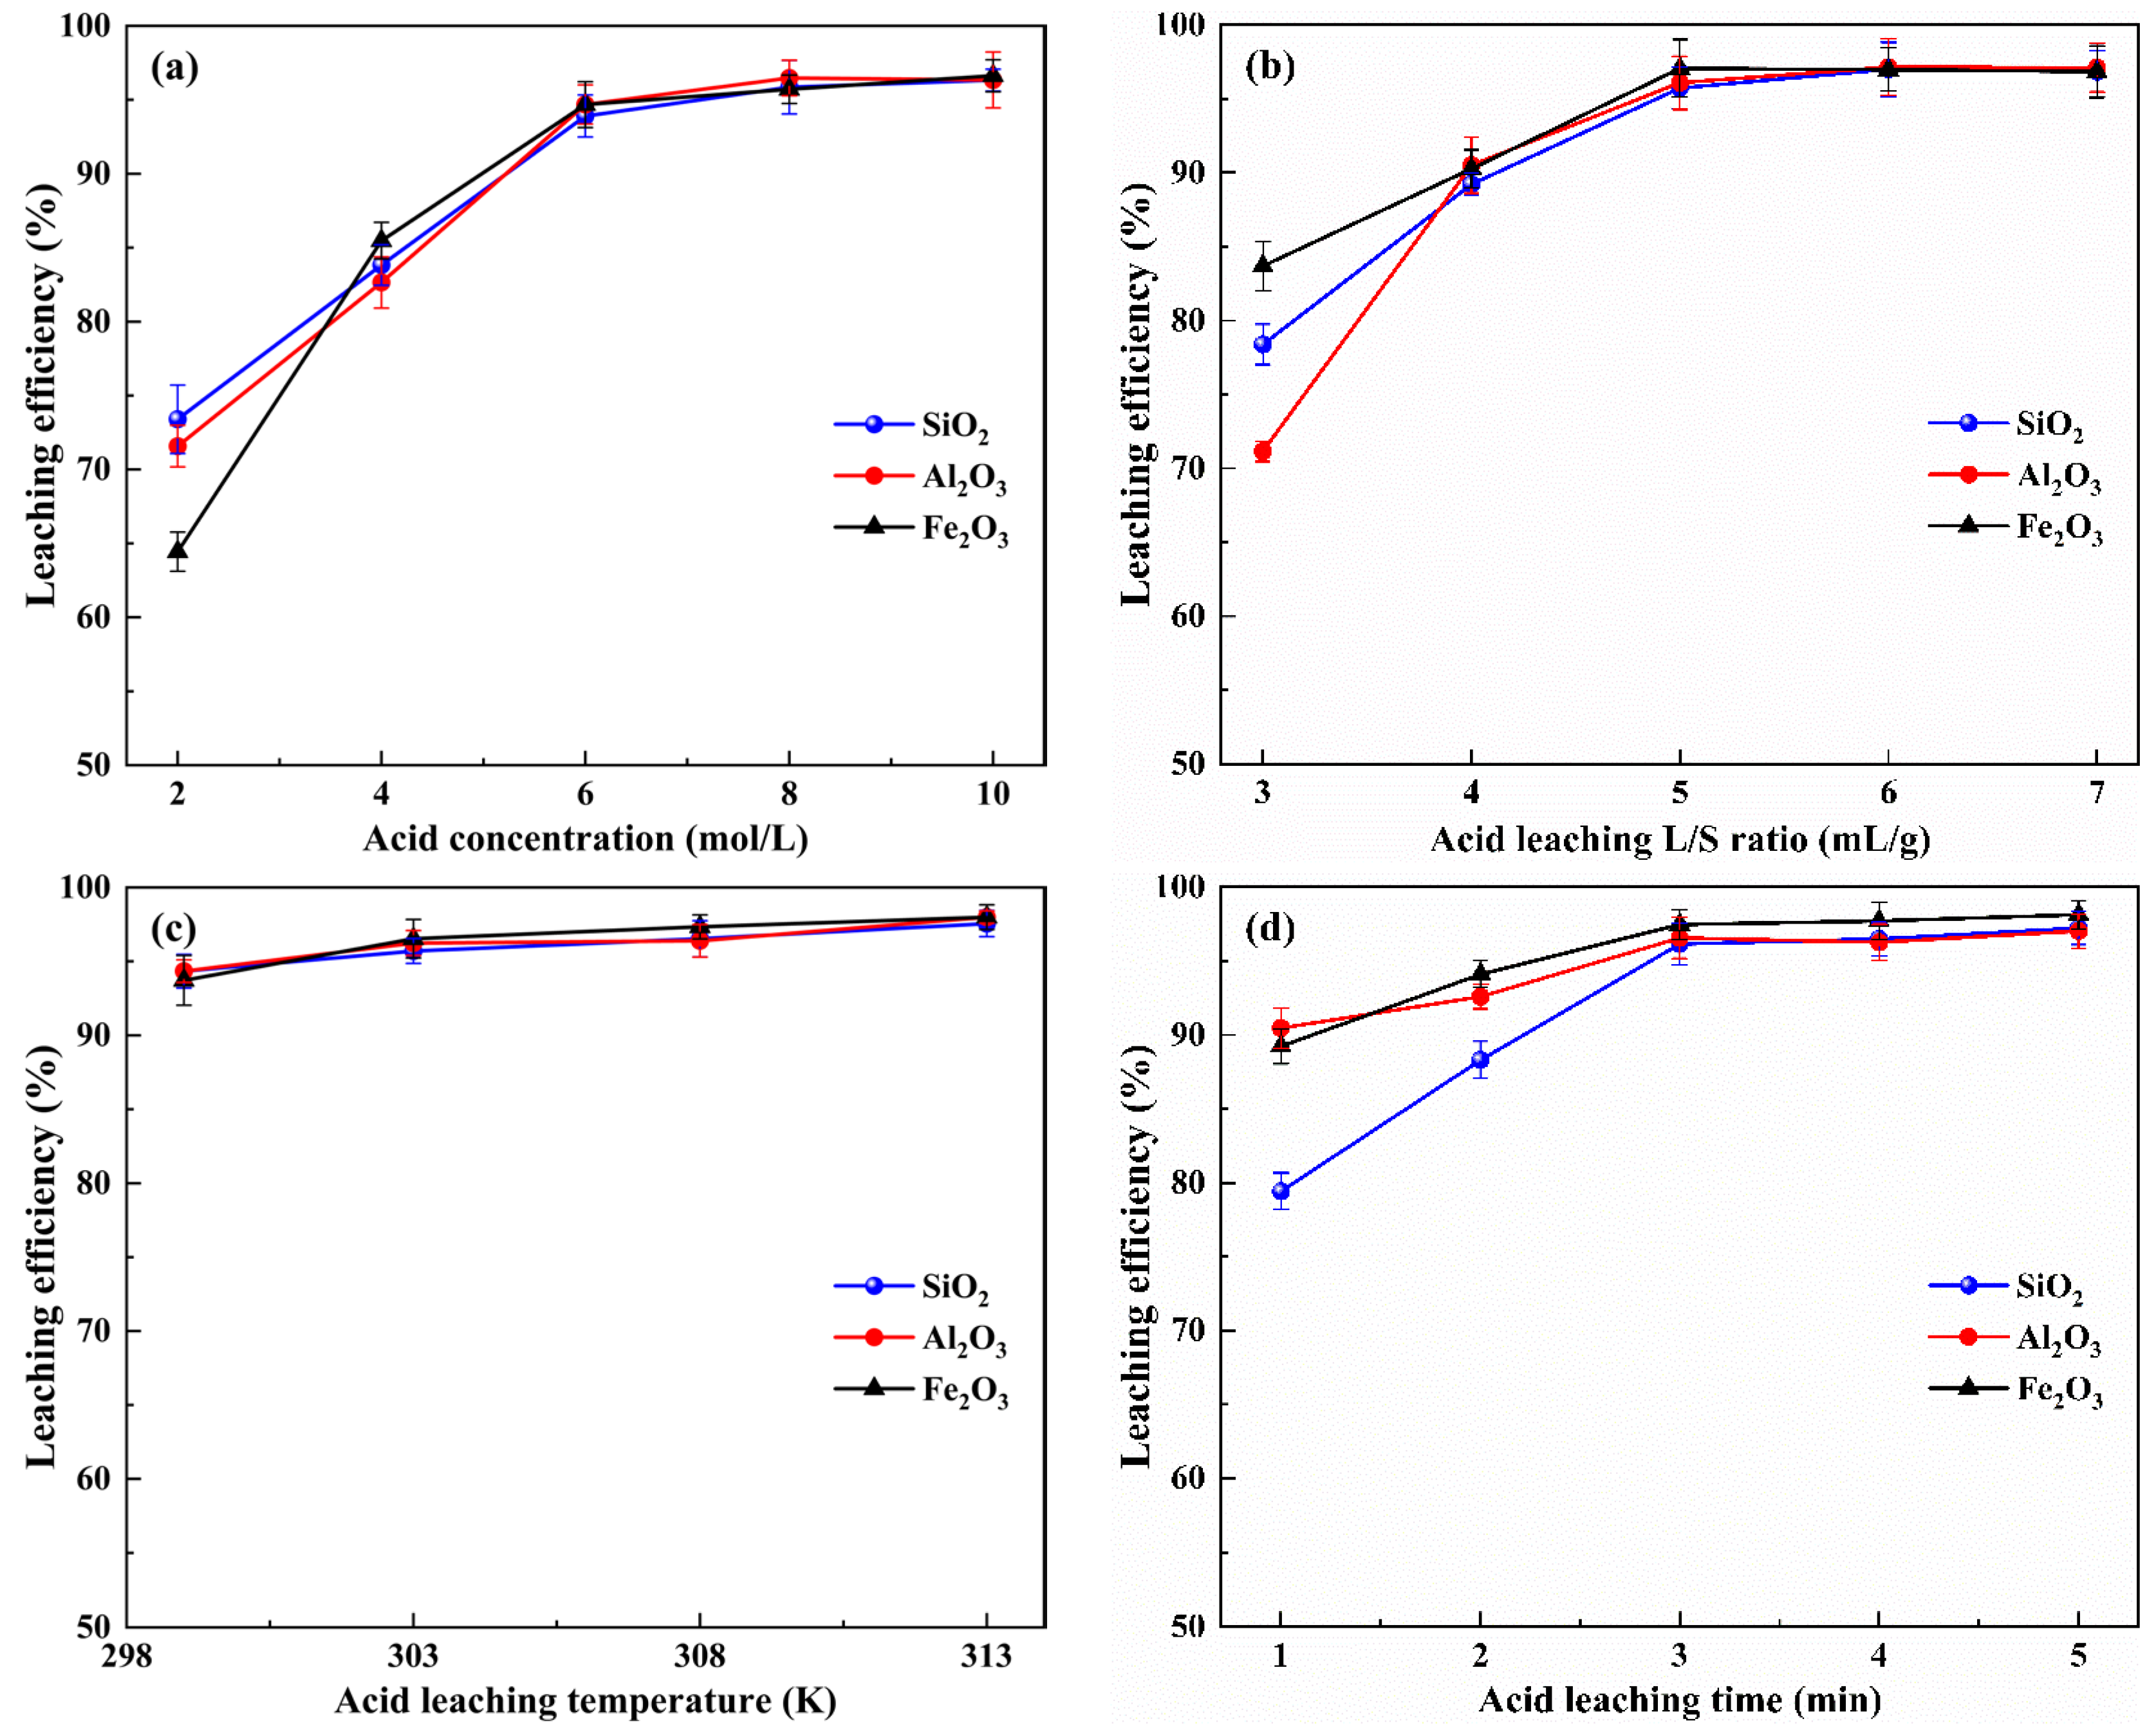
3.2.2. Acid Leaching Stage

Acid leaching experiments with various sulfuric acid concentrations, liquid–solid ratios, leaching temperatures and leaching times were performed to investigate the effects on the leaching efficiencies of SiO2, Al2O3 and Fe2O3. The results are shown in Figure 4.
As shown in Figure 4a, the effect of sulfuric acid concentration (from 2 to 10 mol/L) on SiO2, Al2O3 and Fe2O3 leaching efficiencies was evaluated at indoor temperature (measured as 299 K), time of 3 min and a liquid–solid ratio of 5 mL/g. It can be seen that the leaching efficiencies of SiO2, Al2O3 and Fe2O3 increased with increasing acid concentration from 2 to 6 mol/L and remained virtually constant from 6 to 10 mol/L. This indicates that increasing the acid concentration promotes the leaching of Si, Al and Fe from the water leaching residue. This is because, as the acid concentration is lower, the amount of H+ reacting with NaAlSiO4, Fe(OH)3, etc., in the system is insufficient, so the substances in the water leaching residue cannot react completely, resulting in components’ low leaching efficiencies. As the acid concentration increases, the amount of H+ reacting with the water leaching residue increases, which promotes acid leaching, and the acid leaching reaction reached equilibrium at a sulfuric acid concentration of 6 mol/L. Consequently, subsequent acid leaching experiments were performed with 6 mol/L sulfuric acid.
As shown in Figure 4b, the effect of the liquid–solid ratio on the SiO2, Al2O3 and Fe2O3 leaching efficiencies was investigated at a sulfuric acid concentration of 6 mol/L, indoor temperature (measured as 299 K) and time of 3 min. As can be observed, the leaching efficiencies of SiO2, Al2O3 and Fe2O3 increased as the acid leaching liquid–solid ratio increased from 3 to 5 mL/g and remained almost unchanged as the liquid–solid ratio increased from 5 to 7 mL/g. This is due to the relatively low acid leaching liquid–solid ratio, wherein the insufficient amount of the acid solution limits the contact area between the solid particles with the acid and the reaction mass transfer, resulting in components’ low leaching efficiencies. As the liquid–solid ratio increases, the contact area between the liquid and solid increases, which promotes the acid leaching reaction. Therefore, the liquid–solid ratio for the acid leaching process should be set at 5 mL/g.
Figure 4c shows the effect of leaching temperature on the SiO2, Al2O3 and Fe2O3 leaching efficiencies at a sulfuric acid concentration of 6 mol/L, liquid–solid ratio of 5 mL/g and time of 3 min. When the initial temperature was room temperature (299 K), the leaching efficiencies of SiO2, Al2O3 and Fe2O3 reached 93.03%, 94.24% and 93.44%, respectively; when the temperature was set to 303 K, the leaching efficiency of the components was slightly increased to 95.56%, 95.41% and 96.91%, respectively; and when the temperature continued to increase to 308 K and 313 K, the leaching efficiencies of the components were approximately constant. The results demonstrate that, after the RCST water leaching process, favorable leaching performance can be achieved even at a low temperature during the acid leaching process. Considering the energy savings, the temperature of acid leaching process should be set at 303 K.
The effect of leaching time on SiO2, Al2O3 and Fe2O3 leaching efficiencies was investigated at a sulfuric acid concentration of 6 mol/L, liquid–solid ratio of 5 mL/g and temperature of 303 K, and results are given in Figure 4d. It can be seen that the leaching efficiencies of SiO2, Al2O3 and Fe2O3 increased when the leaching time was increased from 1 min to 3 min. However, the leaching efficiencies of SiO2, Al2O3 and Fe2O3 remained in equilibrium when the leaching time was increased from 3 min to 5 min. This is due to a violent reaction in the initial stages of the acid leaching process, and, as a result, the leaching efficiencies of the components increase significantly; however, after 3 min, the SiO2, Al2O3 and Fe2O3 leaching efficiencies essentially cease to change due to the fact that the acid leaching reaction has reached equilibrium. Meanwhile, it was also concluded from the results that, in only one minute of the acid leaching, the leaching efficiencies of SiO2, Al2O3 and Fe2O3 reached 79.49%, 90.69% and 89.14%, respectively.
The above experimental results show that, under the conditions of temperature 353 K, time 15 min and liquid–solid ratio 10 mL/g in the water leaching stage and sulfuric acid concentration 6 mol/L, liquid–solid ratio 5 mL/g, temperature 303 K and time 3 min in the acid leaching stage, the total recovery rate of SiO2, Al2O3 and Fe2O3 reached 98.39%, 96.02% and 96.96%, respectively.

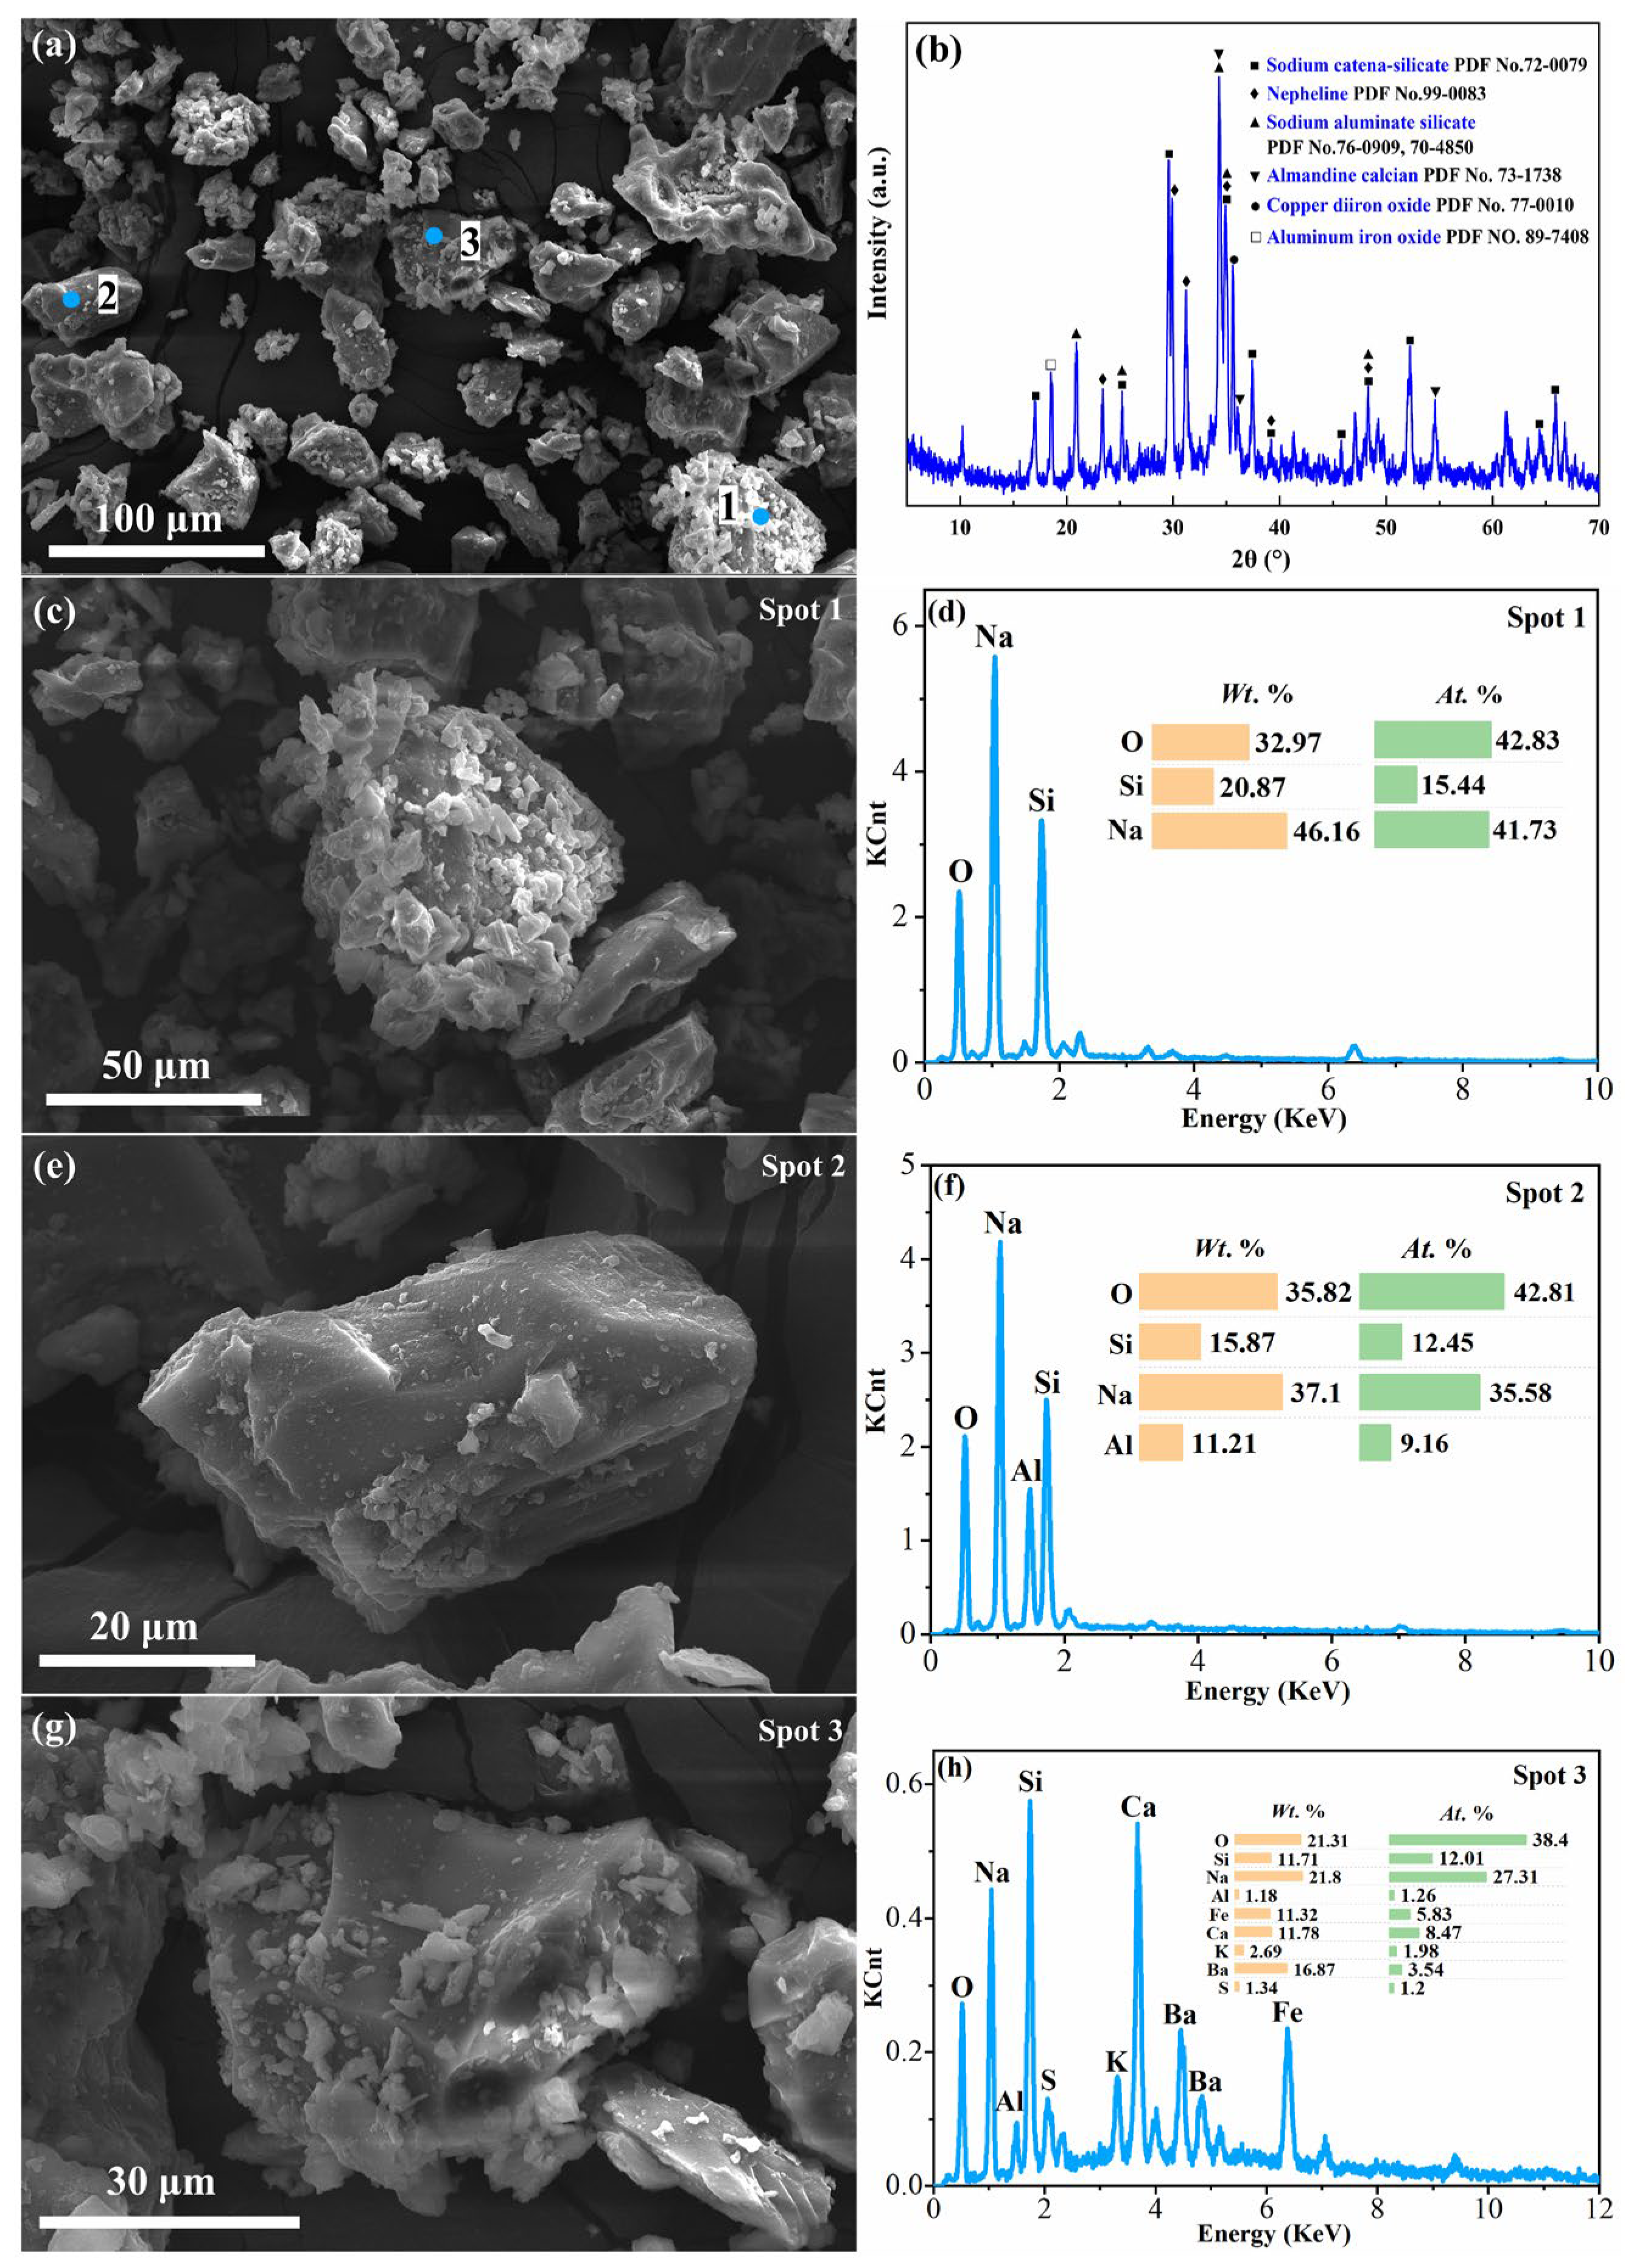
3.3. Analysis of Leaching Residues

To determine the dissolution behavior of the Si-, Al- and Fe-containing substances from the RCST during the water–acid two-stage leaching process, XRF, XRD and SEM-EDS were used to characterize the residues.

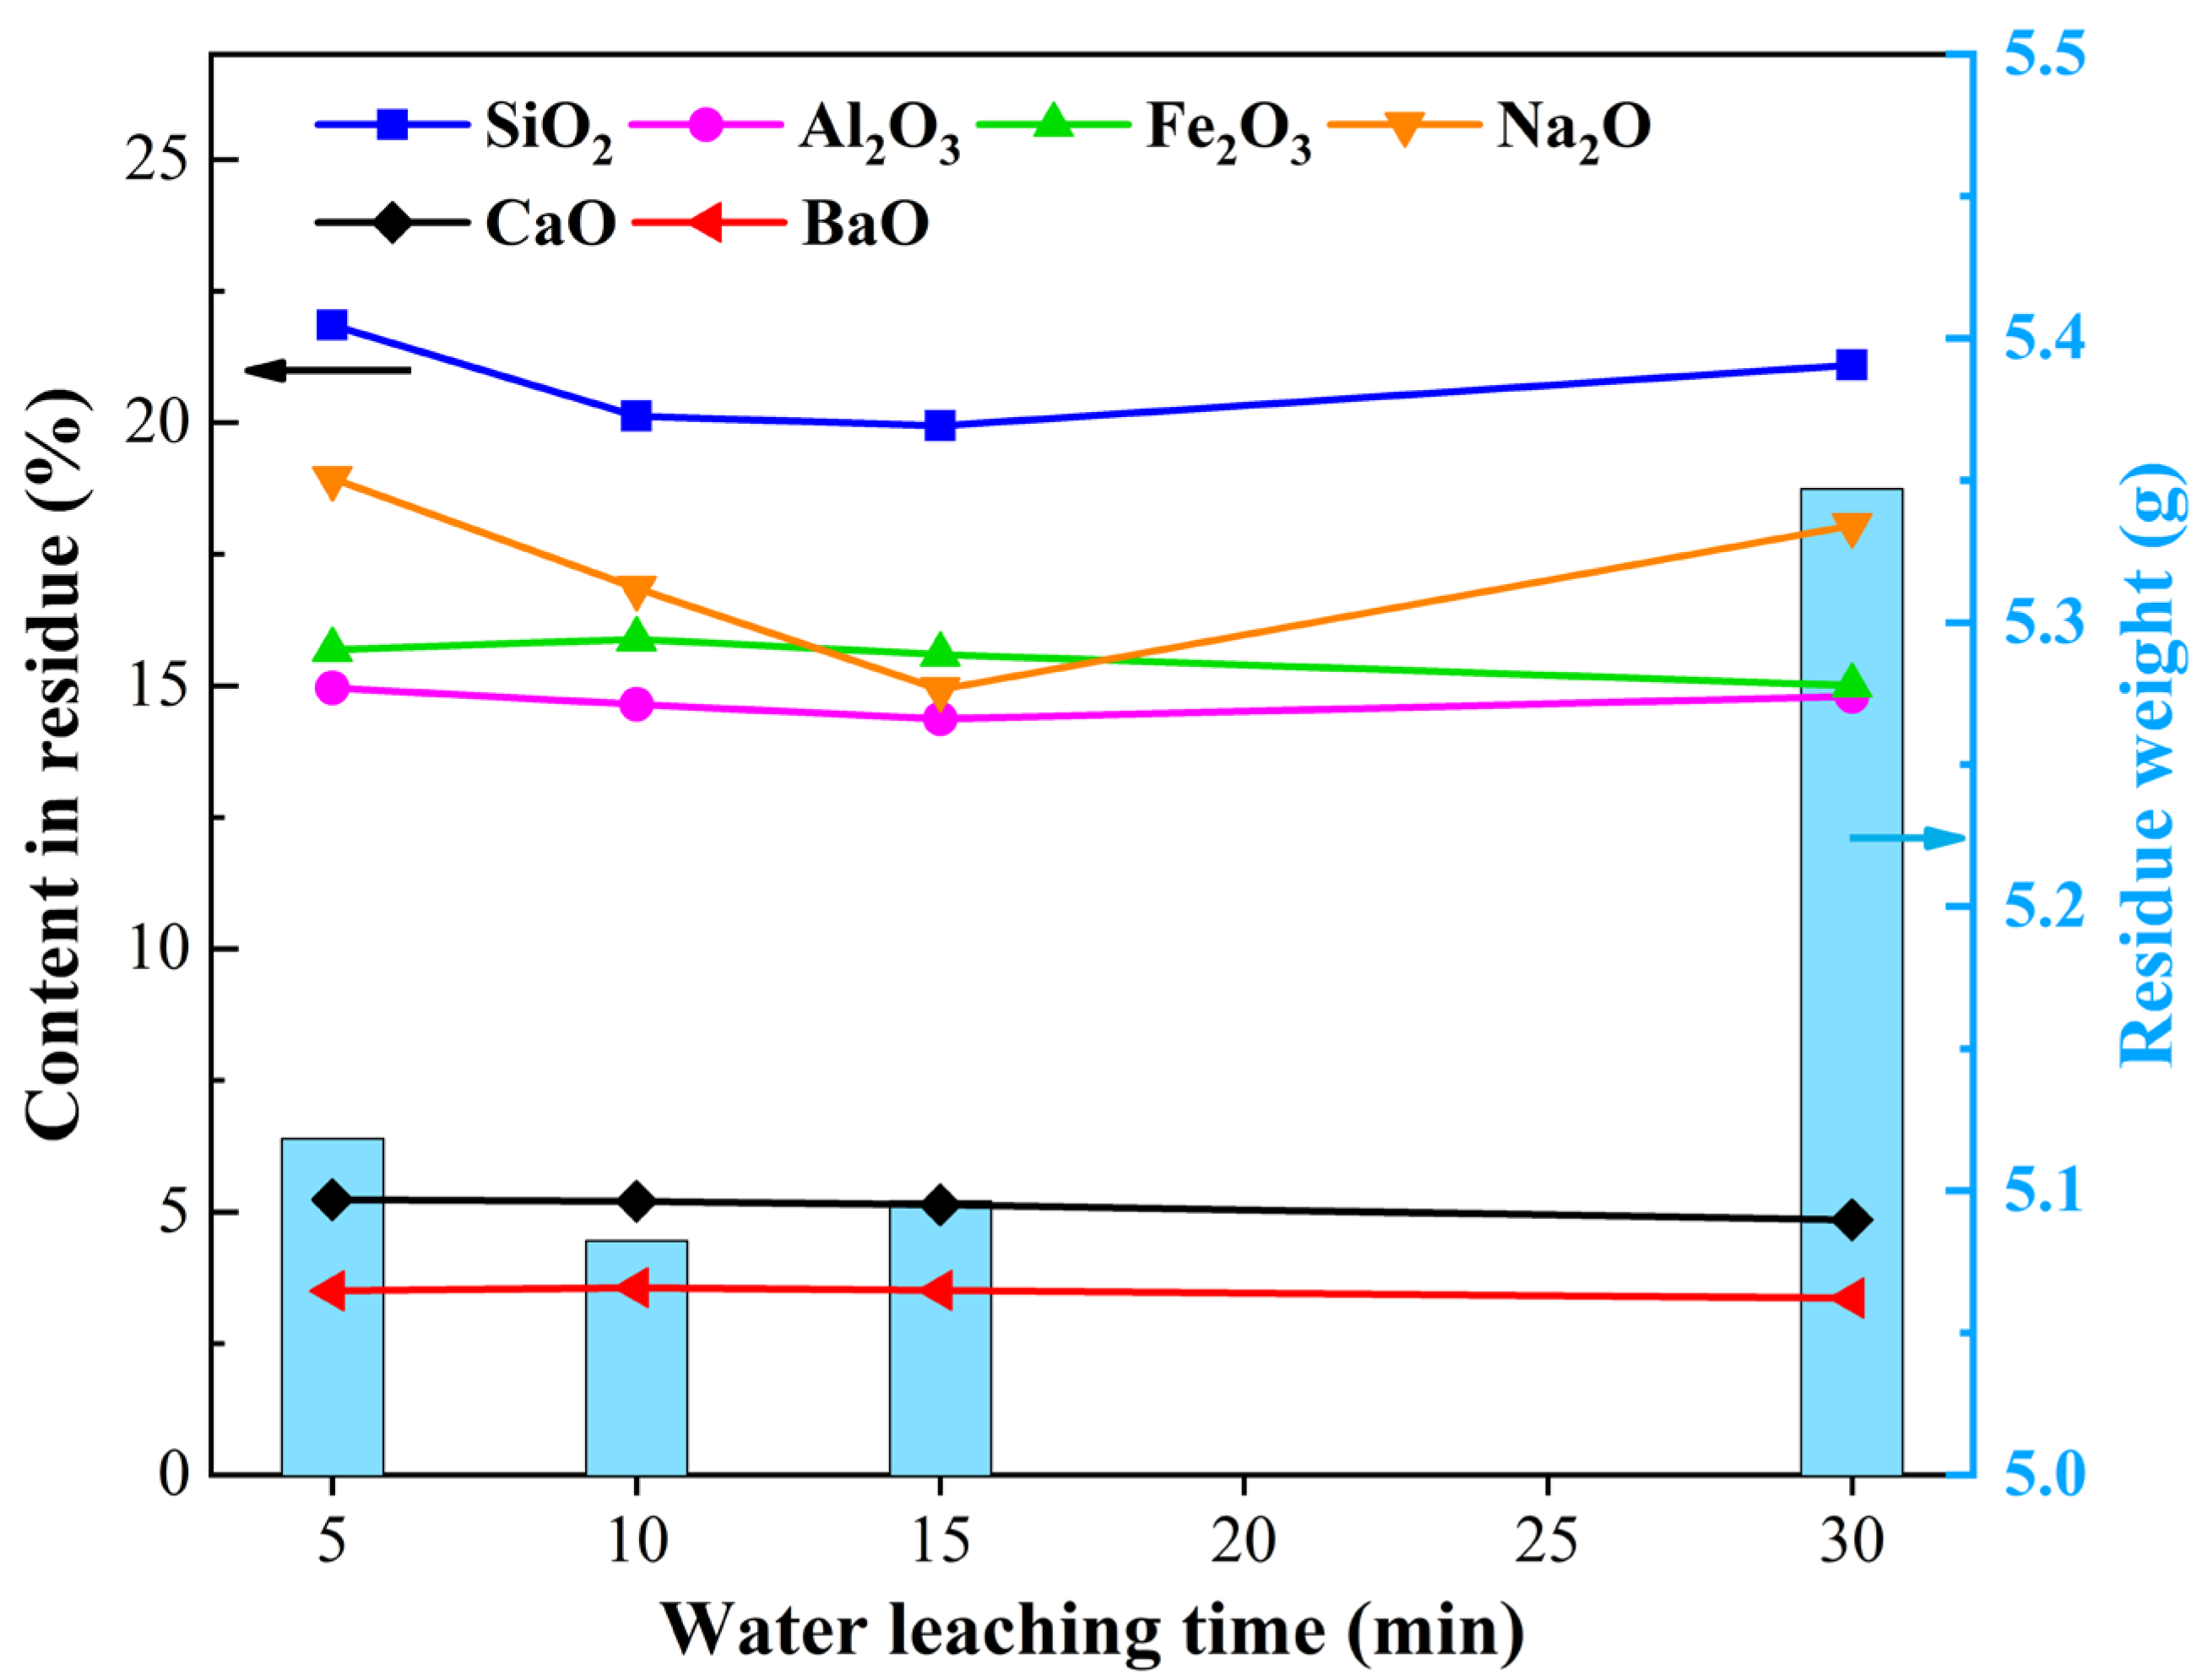
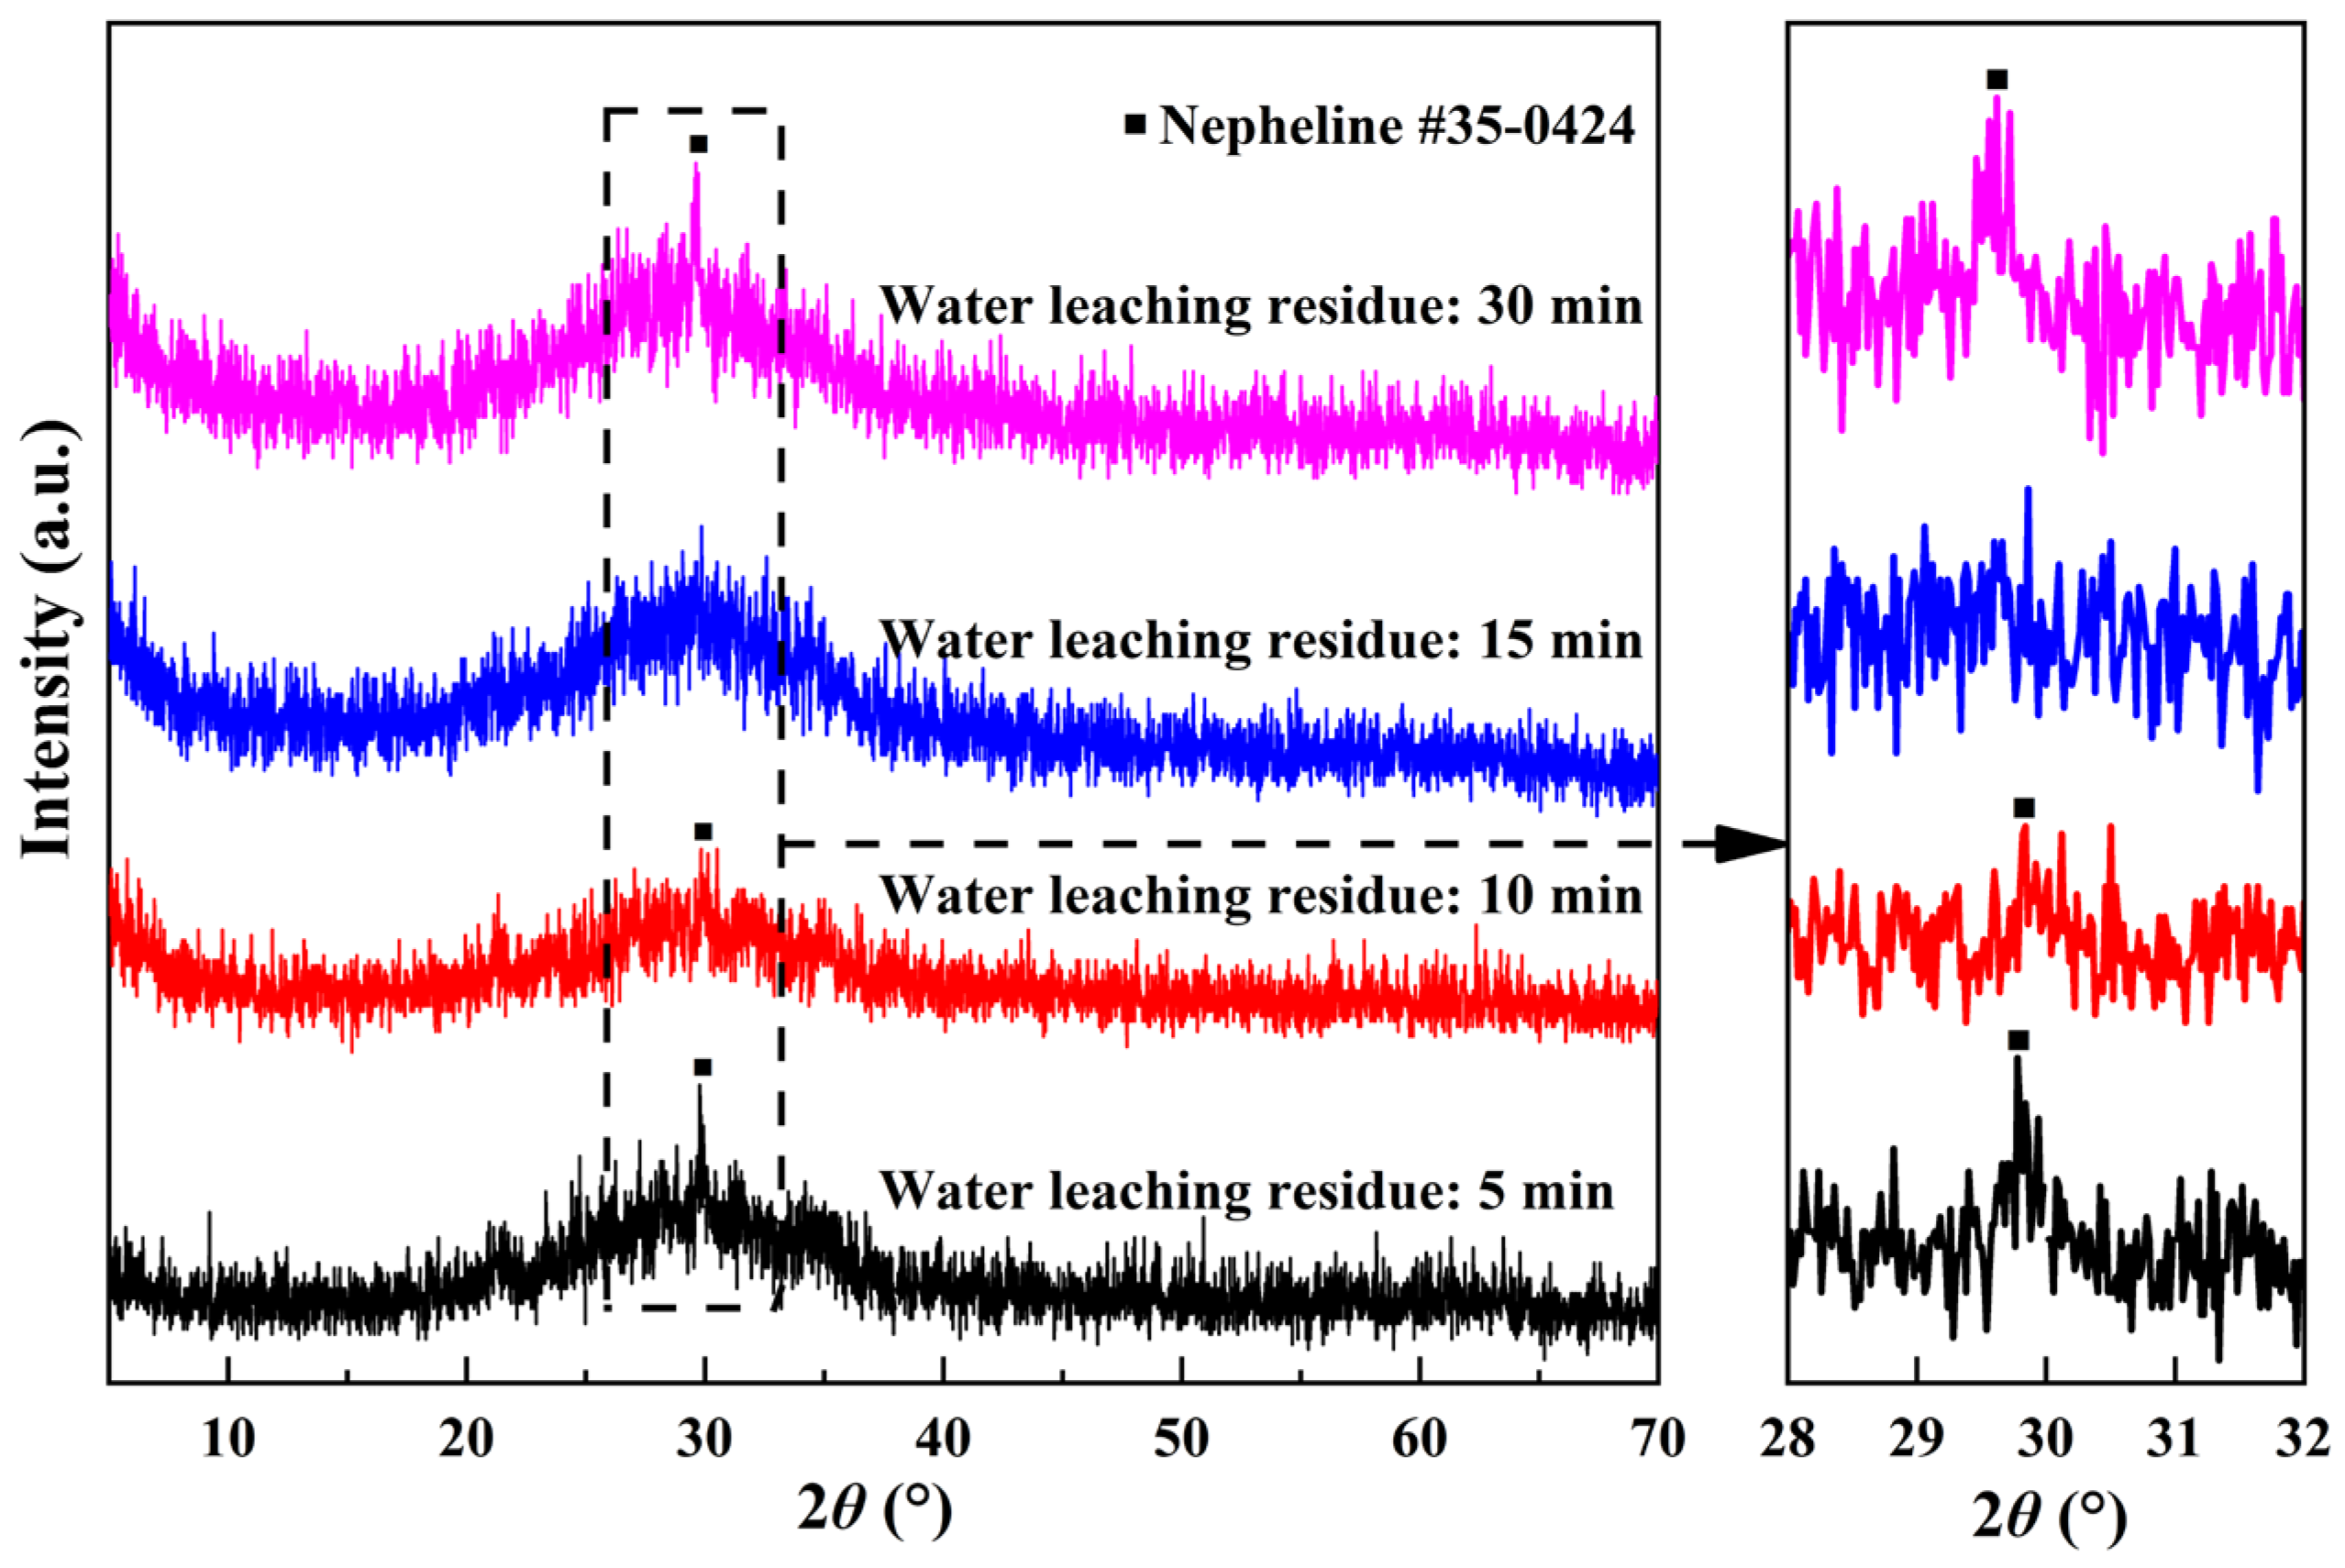
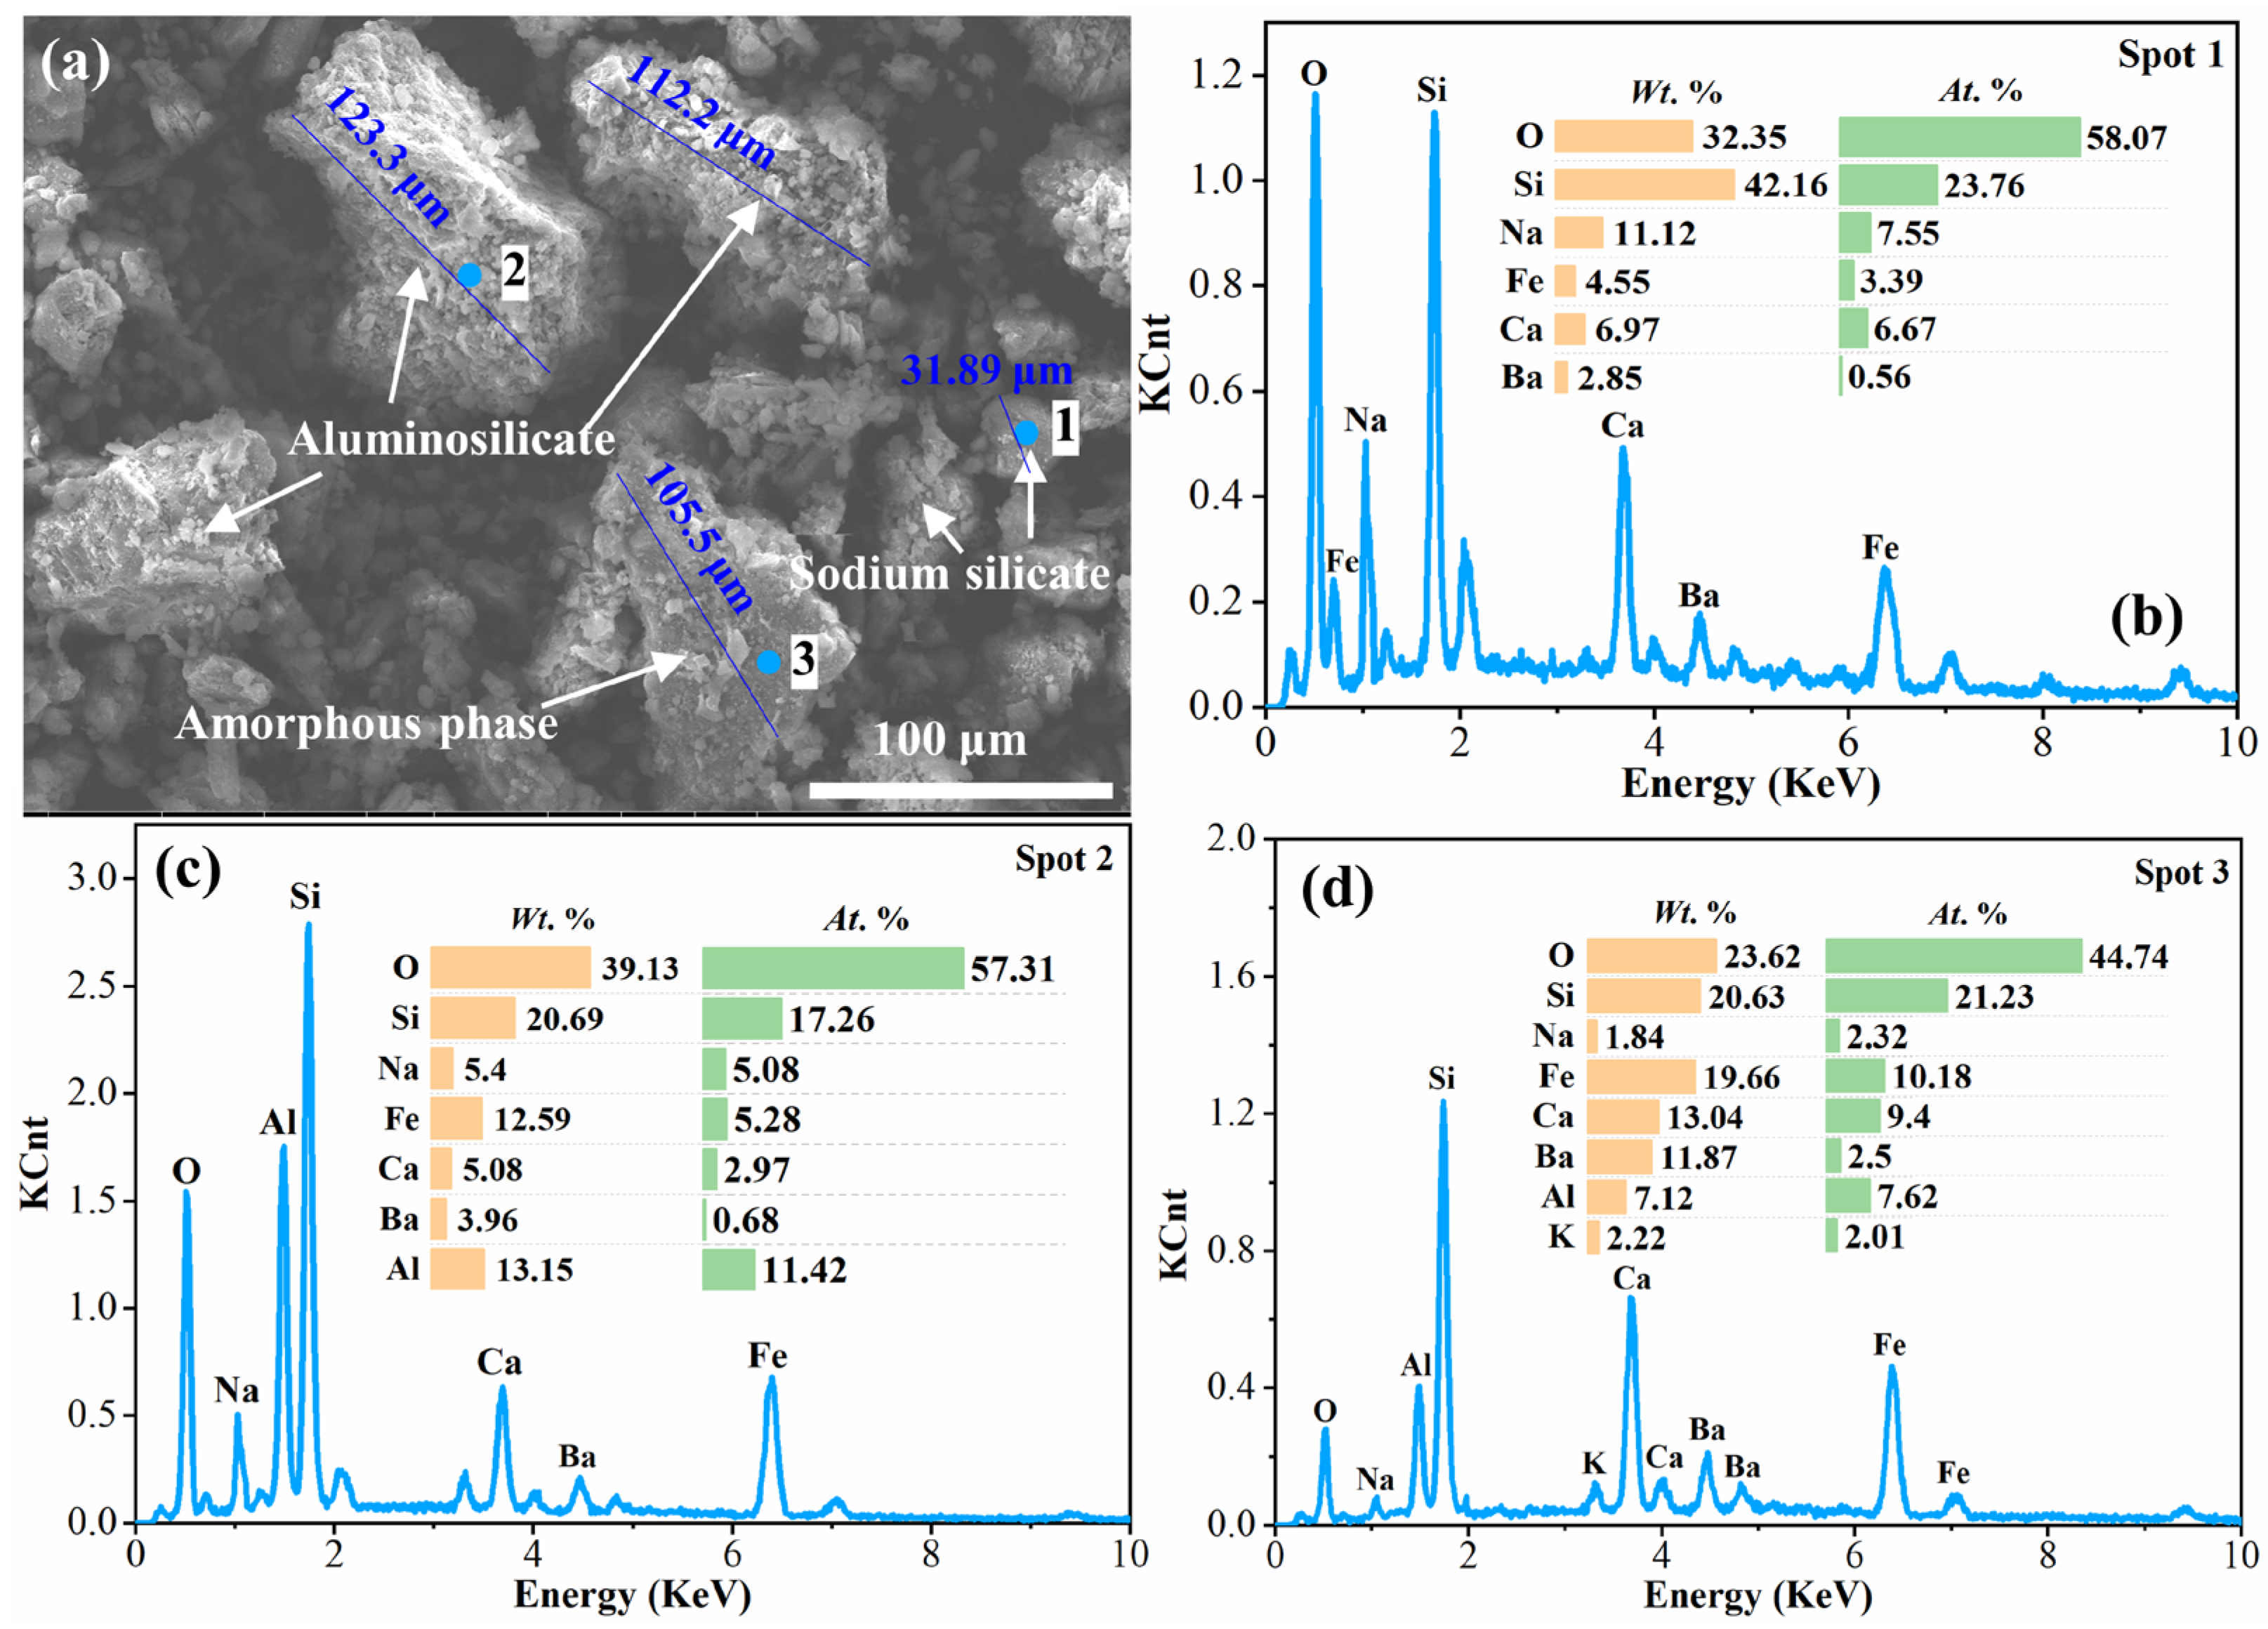
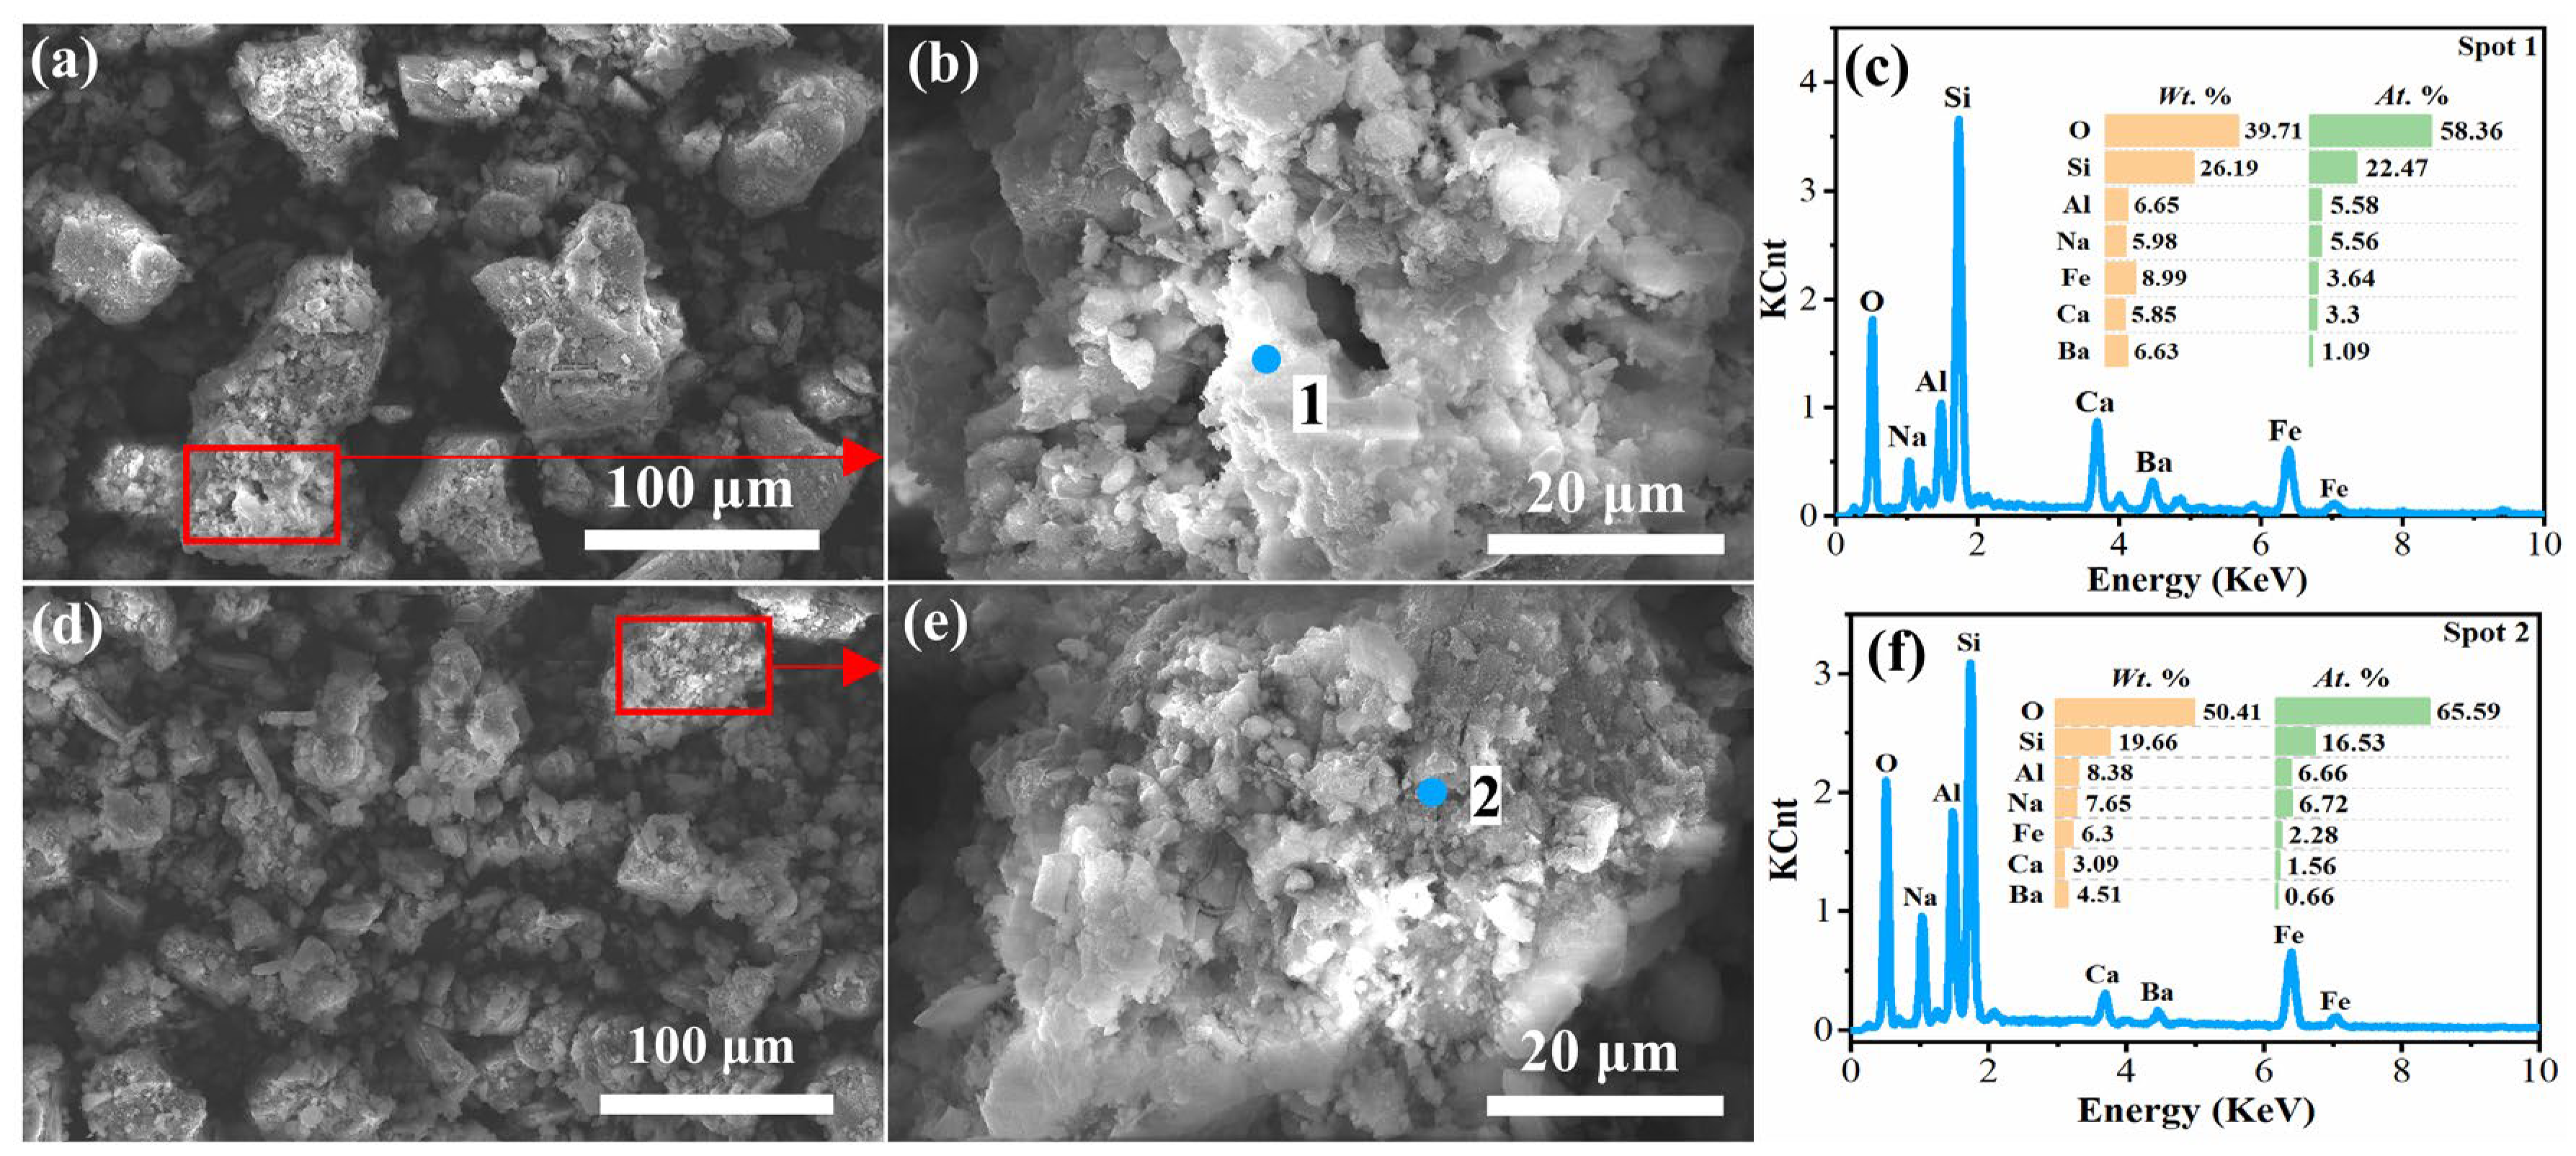
3.3.1. Water Leaching Residue

The qualities and the main components of the water leaching residues for different leaching times at temperature of 353 K and liquid–solid ratio of 10 mL/g are shown in Figure 5, and the XRD patterns of the water leaching residues are shown in Figure 6. Figure 5 shows that the residue quality increased from 5 to 10 min, changed slightly from 10 to 15 min, and then increased with time. Therein, the SiO2, Al2O3 and Na2O contents gradually decreased from 5 min to 15 min, remained constant from 15 min to 25 min, and increased to 30 min. It can be seen in Figure 6 that the water leaching residues were nearly all amorphous, except for the 5 min and 30 min water leaching residues, which contained a small amount of the crystalline phase of nepheline, and the diffraction peaks corresponding to sodium silicate and sodium ferrite in RCST disappeared. This demonstrates that, during the water leaching process, the crystal structure of the substances in RCST is destroyed and then dissolved in the solution. From comparing Figure 5 and Figure 6, it can be seen that the large amount of Si, Al and Na remaining in the 5 min residue (Figure 5) was the undissolved nepheline phase, and, from Figure 3b, showing that there were certain leaching ratios of SiO2 and Al2O3 at 5 min, it is indicated that the structure of most of the substances in the clinker is destroyed and transformed into amorphous phases, and a small amount of sodium silicate and sodium aluminosilicate is dissolved, which can be explained by Equations (2) and (3). At 10 min of leaching, the intensity of the characteristic diffraction peak of nepheline was significantly reduced or not even visible, suggesting that the structure of the materials in RCST was further disrupted and that many more soluble materials were dissolved in the water. It indicates that Equations (2) and (3) occur further. This corresponds to the decrease in SiO2 and Na2O in Figure 5. By 15 min of the water leaching, the structure of the materials in the clinker was completely destroyed, and, at 30 min water leaching, the nepheline phase appeared again in the residue, confirming that the reduction in the leaching efficiencies of SiO2 and Al2O3 was due to the generation of an insoluble silicate phase in the solution, which can be explained by Equation (5).
The morphological images and the related EDS results of the water leaching residues at different times under the conditions of leaching temperature 353 K and liquid–solid ratio of 10 mL/g are shown in Figure 7 and Figure 8. Figure 7 shows the SEM photograph and EDS analysis of the 5 min water leaching residue. It can be observed from the SEM photo that the 5 min water leaching residue contained massive grains with a particle size of about 100 μm, as well as minor particles of 20–30 μm scattered around the massive grains. The surface of the particles was rough and fractured. The results of the EDS analysis show that the massive particles were a mixture phase containing multiple elements, as well as an aluminosilicate phase containing Na, Al, Si and O elements, while the minor particles were sodium silicate, mainly containing O, Si and Na. Moreover, element Fe was distributed in all three phases. This indicates that a fraction of the sodium silicate contained in the clinker was dissolved after 5 min of water leaching. In contrast, the mixture phase and aluminosilicate phase (including nepheline and sodium aluminosilicate) were undissolved and remained in the water leaching residue. Furthermore, combined with the fact that the residue contained most of the amorphous phase displayed in Figure 6, it can be concluded that the continuous infiltration of water causes fragmentation of the particles in the clinker.
In Figure 8, the SEM photo and EDS analysis of the water leaching residue at 10 min are shown. As seen, the residue was dominated by two phases of the multielement mixture and the aluminosilicate. Compared with the 5 min water leaching residue (Figure 7), the content of Na element in both phases was decreased, and there were larger fractures and obvious pores on the surface of the 10 min leaching residue. It is demonstrated that the leaching infiltration effect by water for 5–10 min was further conducted, meaning the sodium silicate in the clinker was essentially dissolved, and the structures of the mixture phase and aluminosilicate phase were destroyed further.
Figure 9 shows SEM photos and EDS analysis of the residues obtained at 15 min and 30 min for the leaching process. From Figure 9a–c, it can be seen that there were plenty of fine particles with large pores in the 15 min water leaching residue. Combined with the results of XRD analysis, showing the overall amorphous phase of the water leaching residue at this time (Figure 6), and showing that the leaching efficiencies of SiO2 and Al2O3 did not increase significantly at 10–15 min (Figure 3b), it can be concluded that the soluble substances in the clinker were essentially dissolved at 10 min, and 10–15 min of leaching predominantly destructed the structure of the substances. From Figure 9d–f, it can be seen that the content of Na in the 30 min water leaching residue increased, which confirms the results of the presence of the nepheline phase in the XRD analysis (Figure 6), indicating that insoluble aluminosilicate was generated in the water leaching solution at this time.

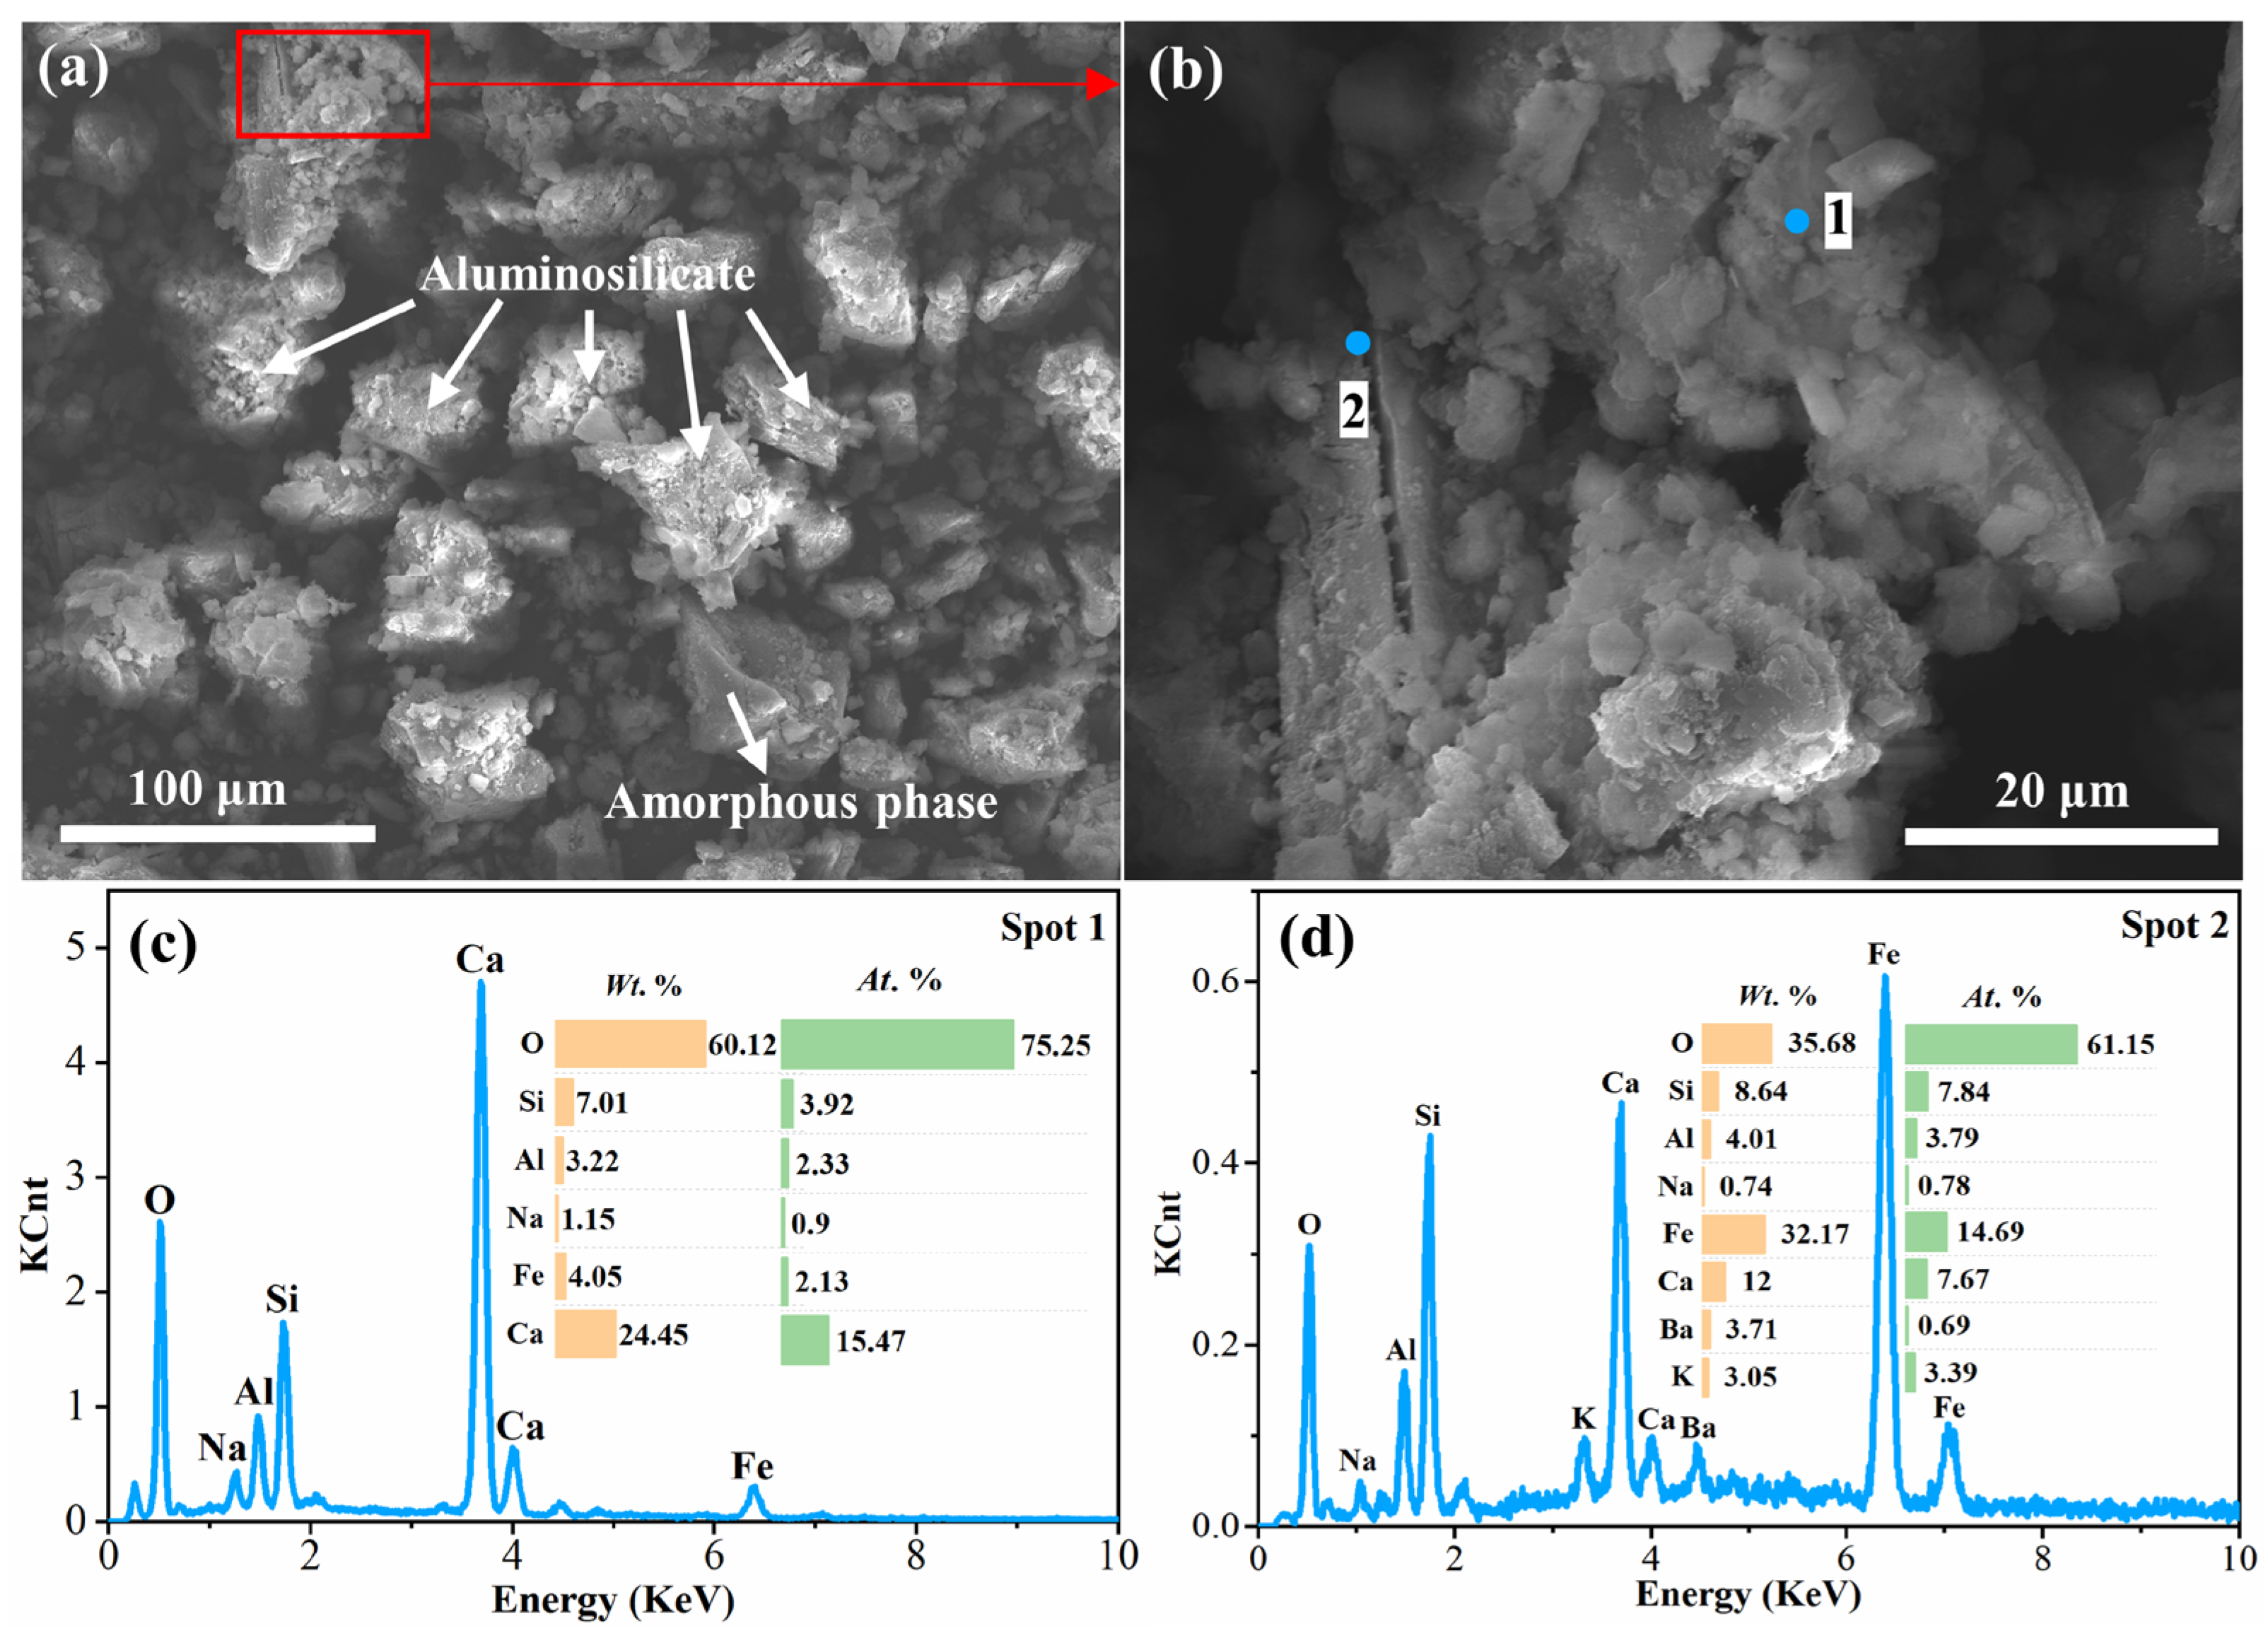
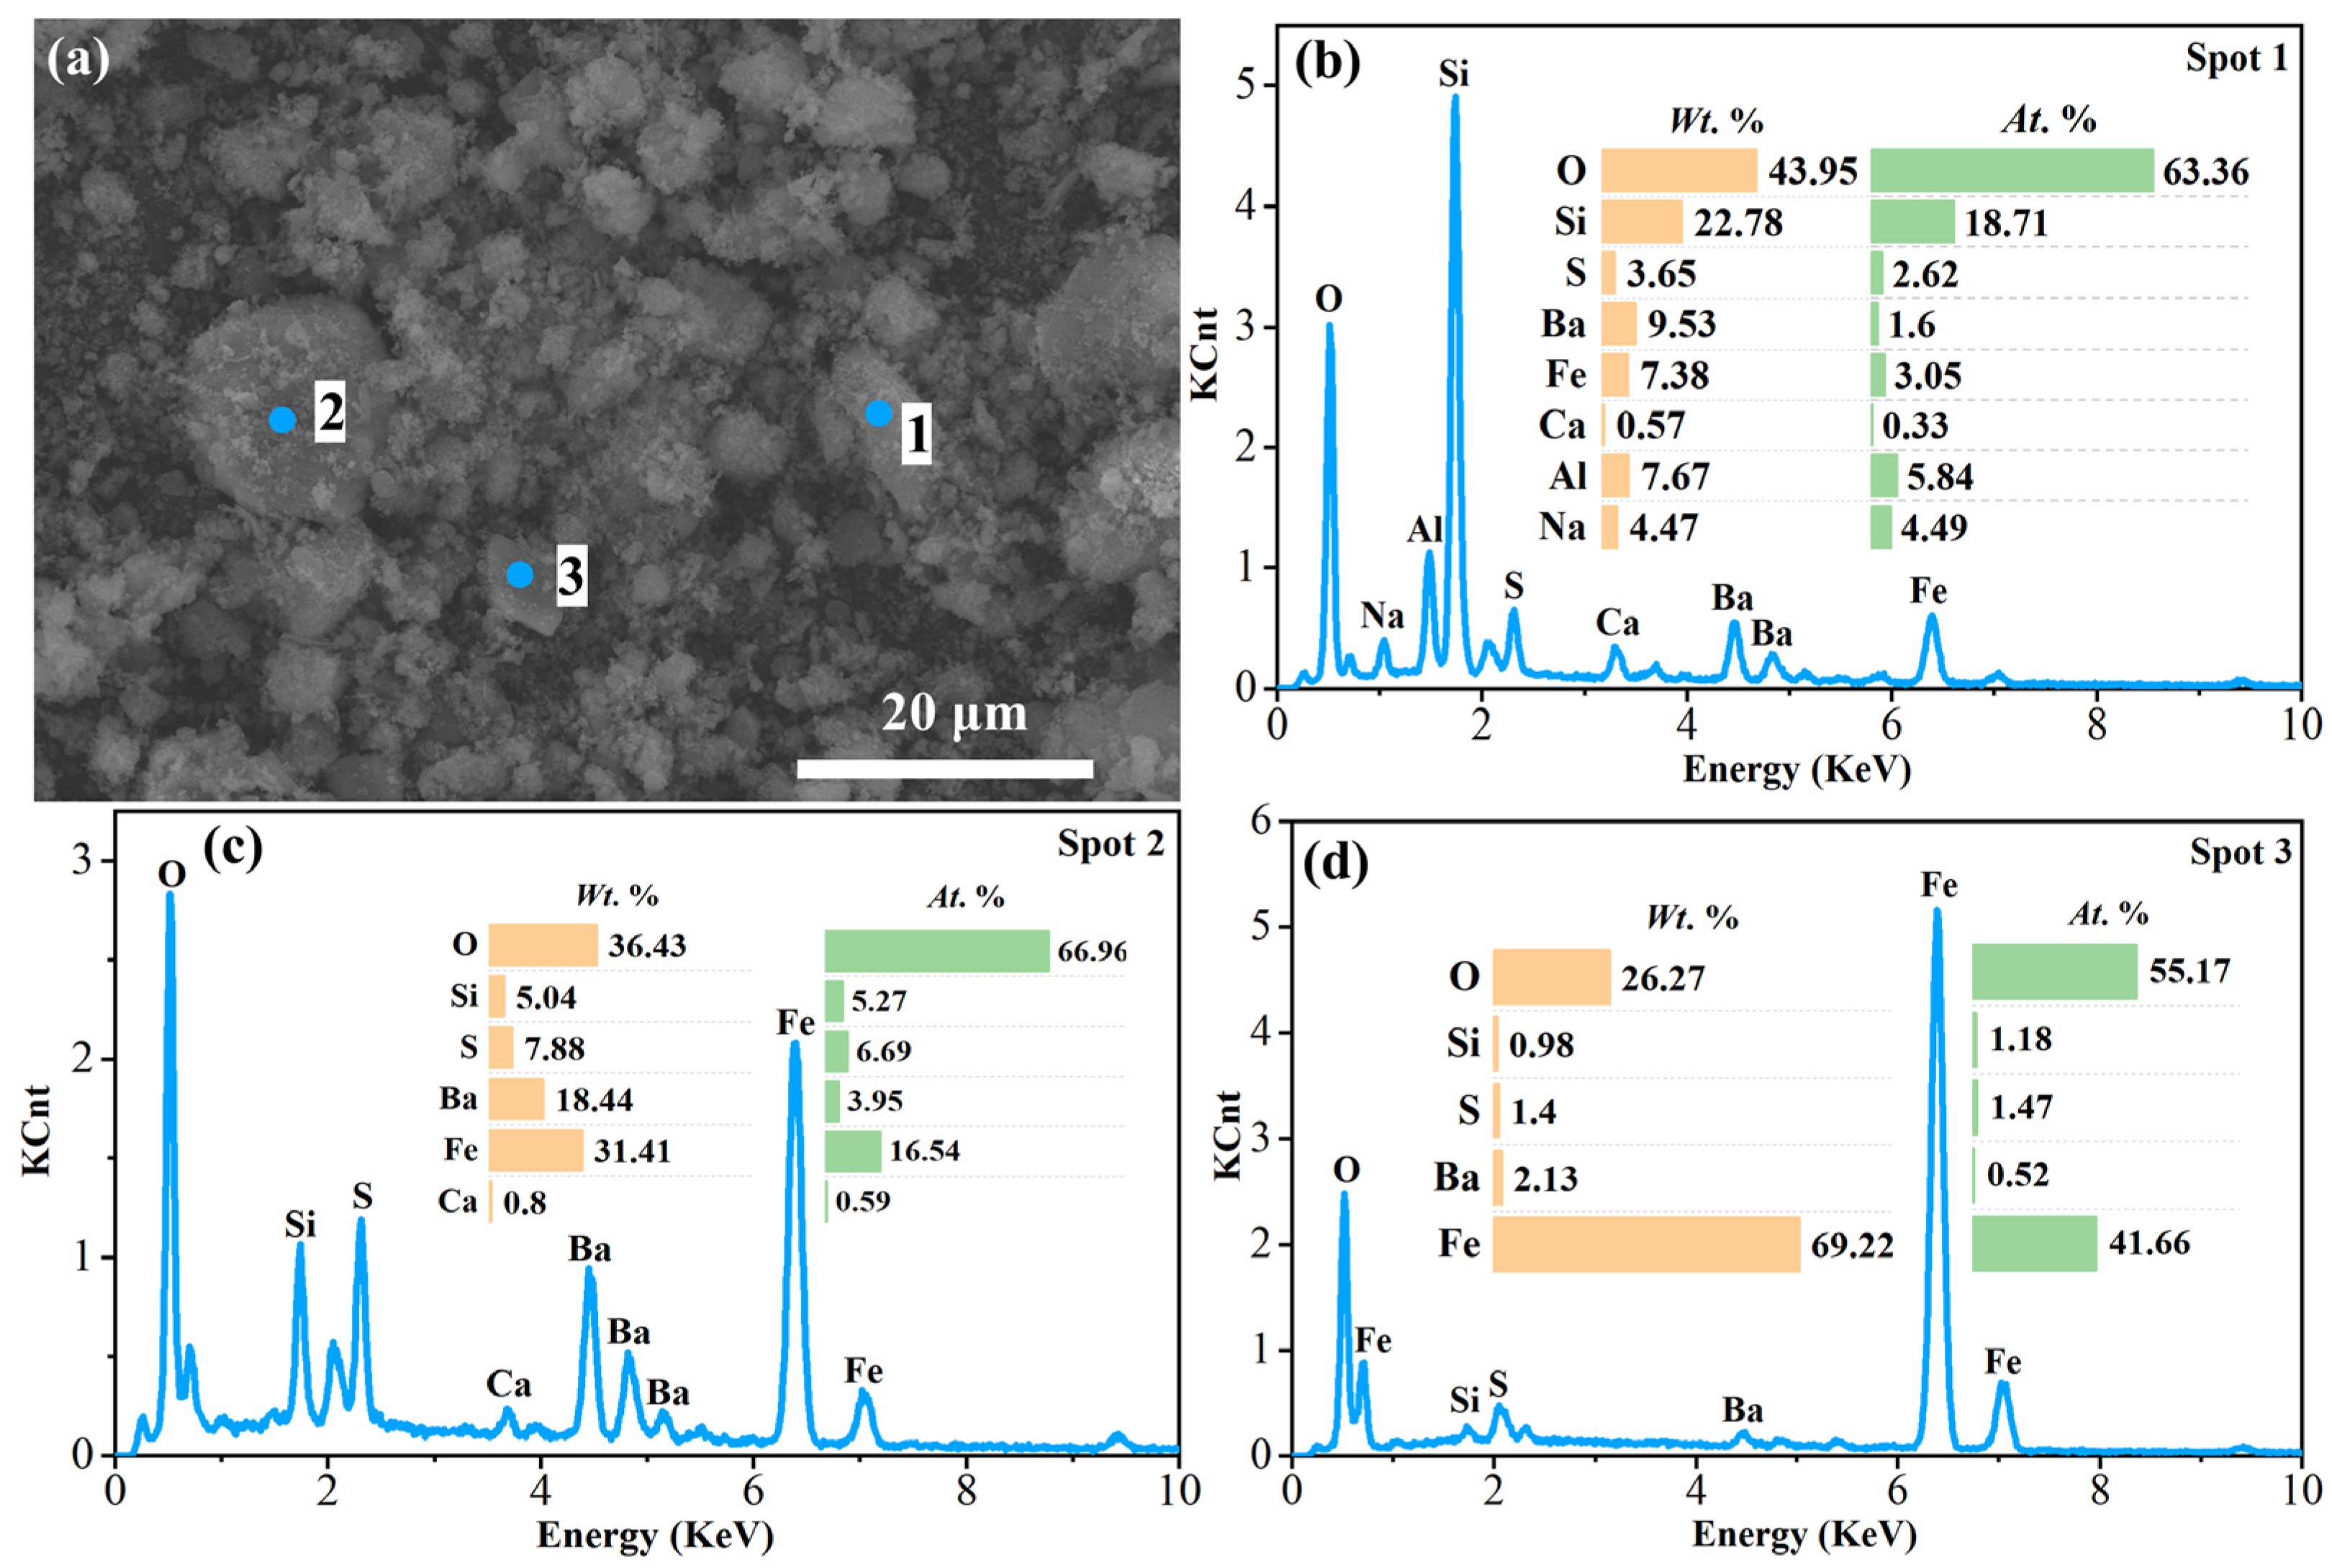
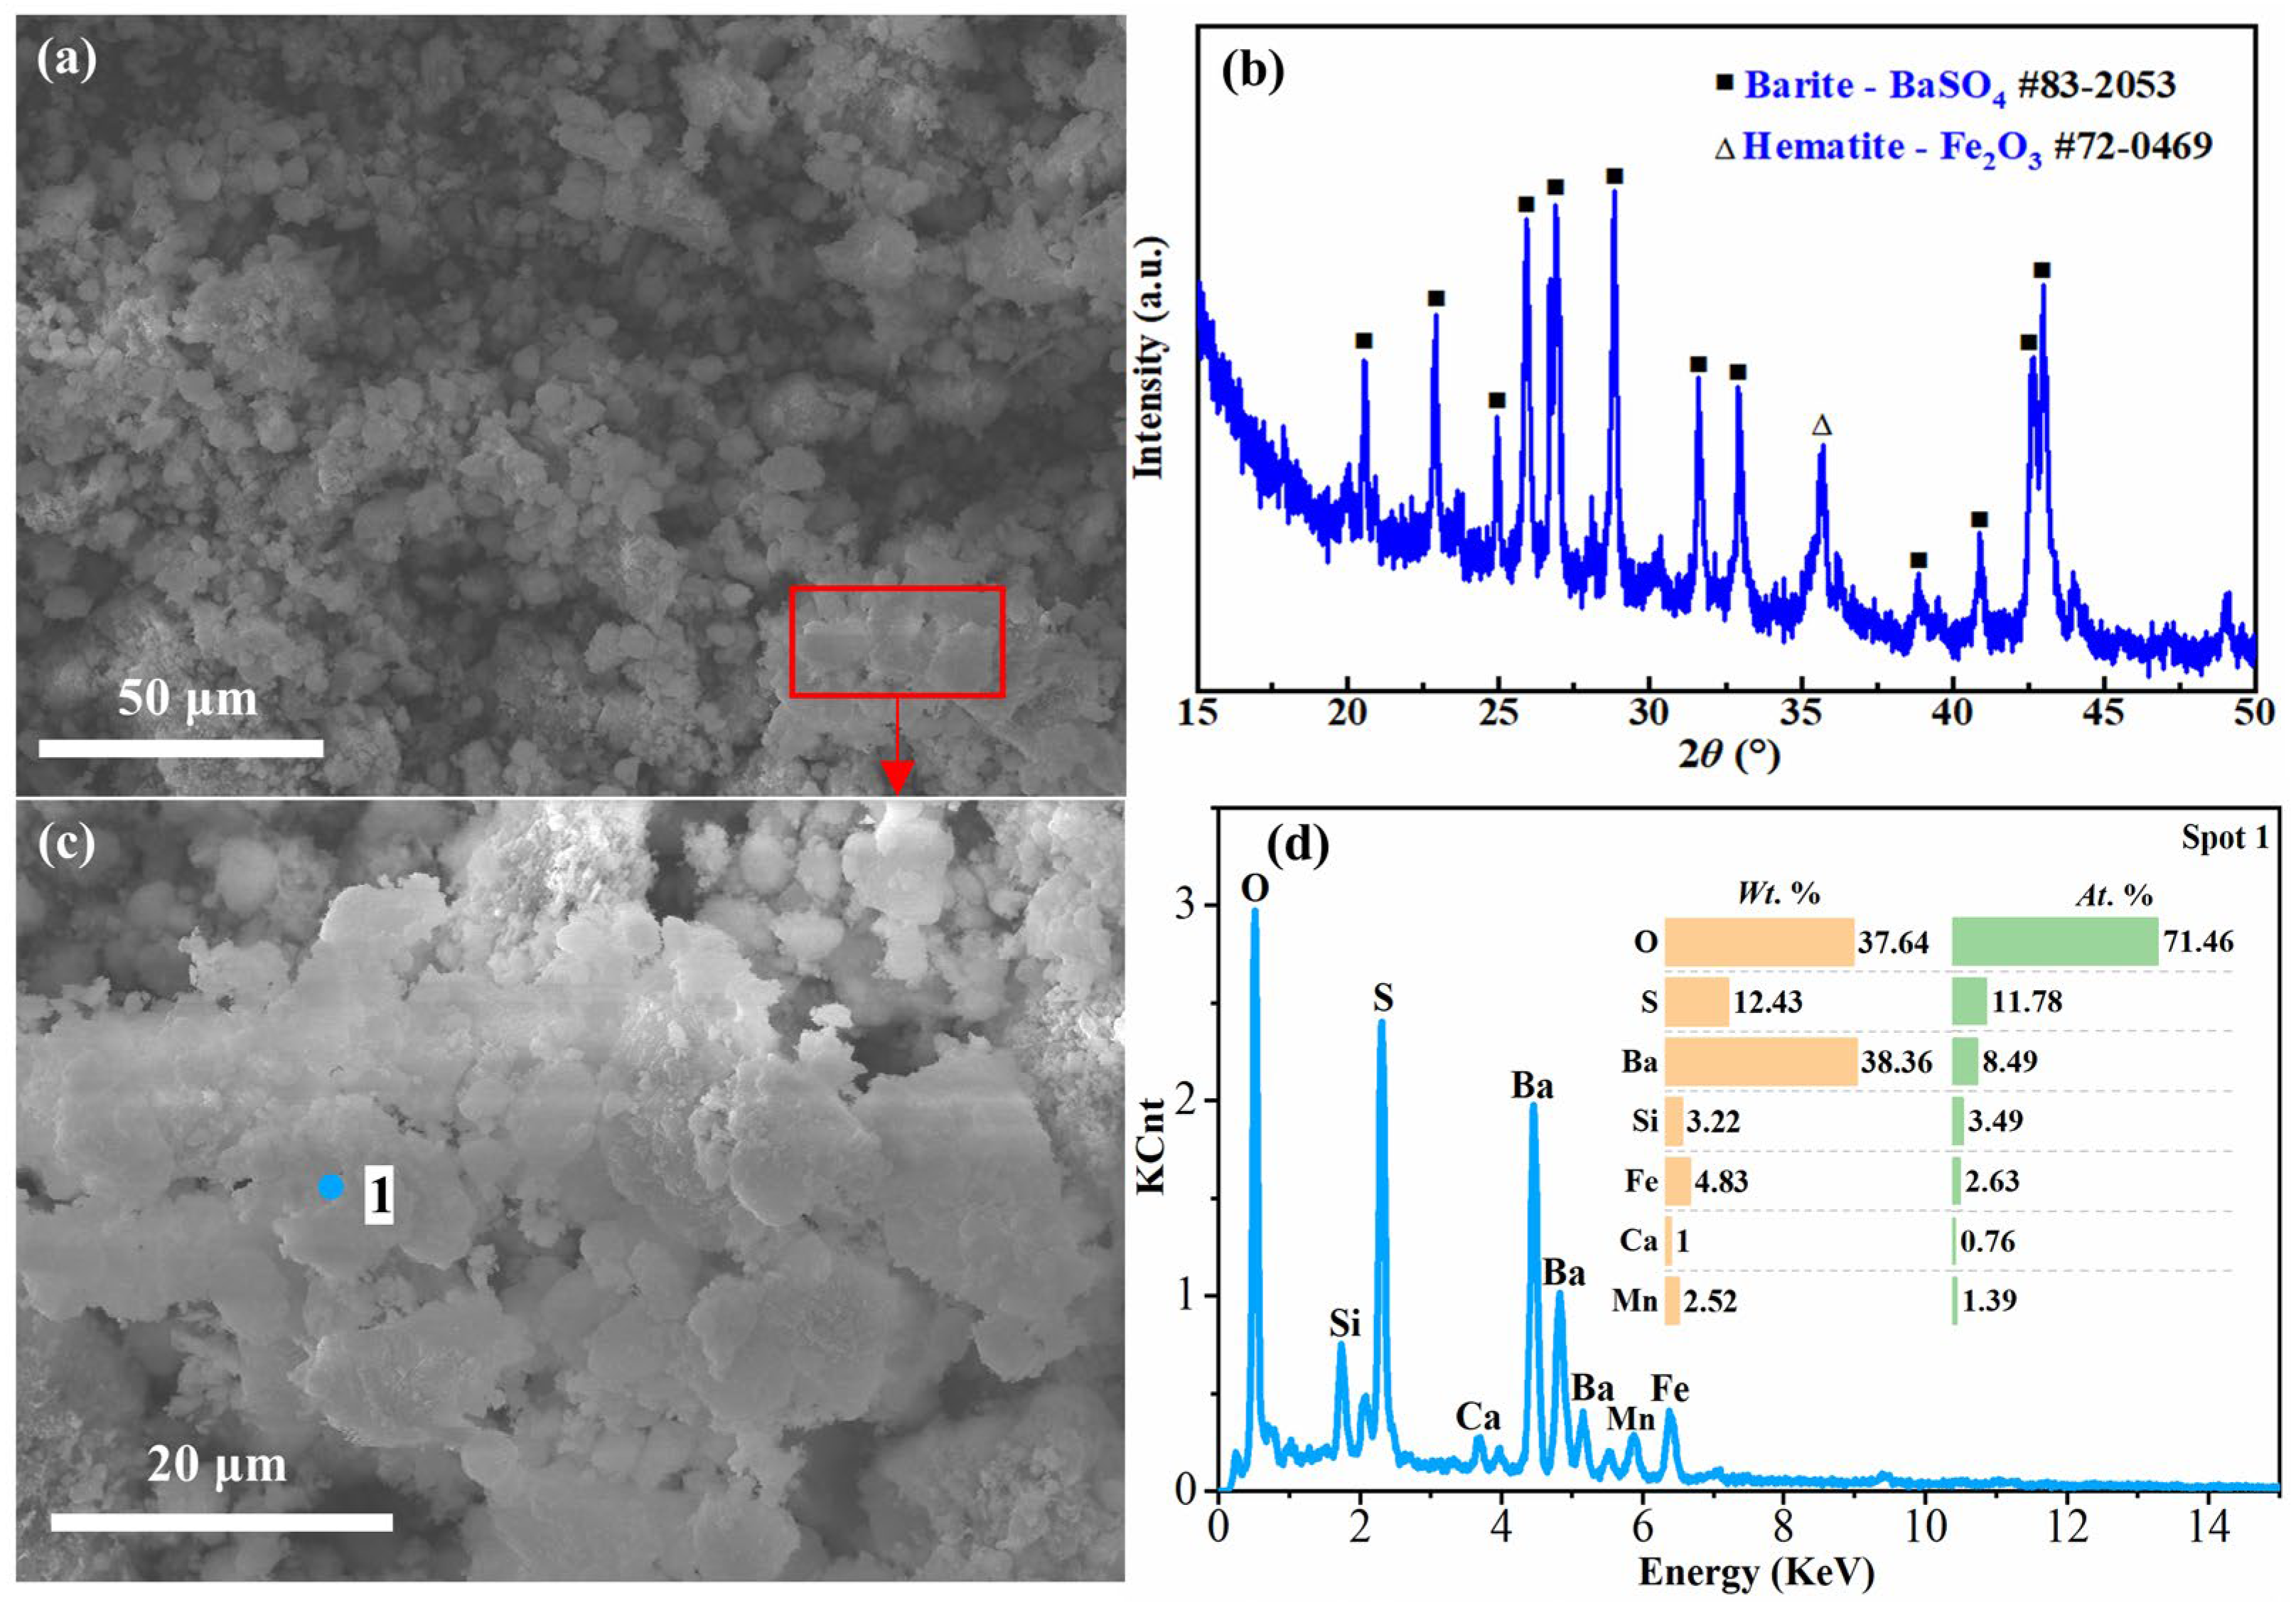
3.3.2. Acid Leaching Residue

The water leaching residue obtained by leaching RCST at 353 K, liquid–solid ratio of 10 mL/g for 15 min was leached with 2 mol/L sulfuric acid for 1 min and 6 mol/L sulfuric acid for 3 min at 303 K with 2 mol/L sulfuric acid for 1 min and 6 mol/L sulfuric acid for 3 min at 303 K with a liquid–solid ratio of 5 mL/g. The characteristics of the acid leaching residues are shown in Table 3 and Figure 10 and Figure 11.
As can be seen from Table 3, the contents of SiO2, Al2O3 and Fe2O3 in the resulting acid leach residues decreased from 17.24% to 7.69%, 15.52% to 5.73% and 15.26% to 4.32% with 2 mol sulfuric acid for 1 min and 6 mol sulfuric acid for 3 min, respectively, while the contents of BaO and SO3 increased from 12.78% to 30.57% and 18.71% to 31.15%. As observed from the SEM photo (Figure 10), the acid leaching residue obtained after 1 min of leaching of the water leaching residue using 2 mol/L sulfuric acid had an overall crushed granular shape. The results of EDS analysis (Figure 10) revealed that there were three major phases in the residue, including an aluminum silicate phase containing Na, Al, Si and O, similar to that in the water leaching residues (Spot 1), a mixture phase of silicon oxide, iron oxide and barium sulfate (Spot 2), and iron oxide (Spot 3). However, the contents of Si and Al elements in the acid leaching residue were reduced compared to that of the water leaching residue, indicating that sulfuric acid had already leached a part of Si and Al from the water leaching residue under this condition. This was accompanied by an increase in elemental Ba, suggesting that it was enriched in the acid leach residues. In addition, since there were still aluminum silicates and iron oxides in the acid leaching residue, this means that the acid leaching reaction did not occur entirely at this time. Figure 11 shows the properties of the acid leach residue obtained in the condition of 6 mol/L sulfuric acid at 3 min. It can be seen that the particles in the acid leach residue at this time were in the form of flaky aggregates. The XRD analysis results show that the main crystalline phase of the residue was barite (BaSO4). The results of the EDS analysis also show that the residue predominantly contained O, S and Ba elements. It demonstrates that, by this time, Si, Al and Fe elements contained in the water leaching residue had been leached out in large quantities in the acid leaching solution.
The results of the above analysis indicate that the structure of the materials in the silver tailings’ roasted clinker was sufficiently destroyed during the water leaching stage, forming a large number of fissures and pores on the particles surface, which allowed the components to be effectively dissolved in sulfuric acid solution at a lower temperature of 303 K and an extremely short time of 3 min.

3.4. Product Preparation and Cost Analysis

3.4.1. Product Preparation

(1)
Silica micronized powder
The water leaching solution was cyclically leached for five rounds under optimal conditions (temperature 353 K, time 15 min, L/S ratio 10 mL/g). Afterwards, the solution was kept at 353 K, and a CO2 gas with a concentration of 38% was passed through. Ventilation was stopped when the solution pH was 11.0 and filtered. After that, carbonation continued until the solution pH reached 9.0. The insoluble material after filtration was SiO2·nH2O, and the silica micronized powder was obtained after. The rest was sodium carbonate solution, which can be returned after evaporation and used as the roasting aid. It was determined that the silica powder contained 93.19% SiO2 and 1.0% Al2O3 and 0.26% Fe2O3, which meets the SF93 level index requirement of the Chinese industry standard YB/T 115-2004 and can be used to make refractory materials.
(2)
Silica gel
The acid leaching solution was kept at 358 K for 30 min to facilitate the polymerization of the silicic acid, and the insoluble material after filtration was silica gel. The silica gel was measured to contain 99.12% water, which can be used as a water-retaining agent for soil moisturization. Upon drying, the dried silica gel contained 99.78% of SiO2 and 0.1% combined Al2O3 and Fe2O3, meeting the index requirements for the production of white carbon black, and can also be used as a raw material for the preparation of silicon compounds.
(3)
Polyaluminum ferric sulfate water purifying agent
After the silica gel was separated from the acid leaching solution, its composition was dominated by Al2(SO4)3 and Fe2(SO4)3. Cyclic acid leaching was carried out until Al2(SO4)3 and Fe2(SO4)3 reached saturation and then the aluminum iron sulfate crystals were obtained by filtration. The aluminum iron sulfate crystals were put in distilled water with a liquid–solid ratio of 1.5 mL/g and heated up to dissolve; the solution was adjusted to pH 3.0 with Ca(OH)2 emulsion with a mass concentration of 20%, filtered to remove impurities, and then stirred at a constant temperature of 353 K for 7 h to obtain polyaluminum ferric sulfate water-purifying agent. The combined amount of Al2O3 + Fe2O3 was 9.35%, which meets the Chinese chemical industry standard (HG/T 5565~5566-2019) and can be used for the dewatering treatment of industrial water, sewage and sludge.
(4)
Multi-metal solution
After separation of the aluminum iron sulfate crystals, the solution’s pH was adjusted using ammonia, and the metal elements such as Cu and Co were recovered by stepwise precipitation.

3.4.2. Cost Analysis

The treatment cost of silver tailings includes raw materials, fuel and power consumption and other costs such as labor, manufacturing, operations, administration and finance (Table 4). Therein, the consumption of raw materials was calculated based on the results of this experiment; the rest of the cost items were estimated with reference to the economic benefits of the industrial test project for the resource utilization of Baihe sulfide mine tailing slags in Shaanxi Province implemented by our research team. It should be noted that the metal elements were enriched in the acid leaching solution pending further precipitation and separation and that the costs of this experiment did not include the consumption of extracted metal elements. The primary products obtained from the treatment of silver tailings to recover the major elements Si, Al and Fe are silica micronized powder, silica gel and polyaluminum ferric sulfate water-purifying agent. The economic benefits of per ton of tailings were initially estimated, as shown in Table 5.
From Table 4 and Table 5, it can be seen that the full cost of treatment per ton of silver tailings is RMB 1526.08, the resulting products revenue is expected to be RMB 2042.41, the total profit would be RMB 453.33, and the profit after tax would be RMB 334.48.

3.5. Leaching Kinetics

From the analysis of the acid leaching stage in Section 3.2.2, it is clear that the leaching ratios of SiO2, Al2O3 and Fe2O3 reached 79.49%, 90.69% and 89.14%, respectively, after only 1 min of the acid leaching process (Figure 4), indicating that the duration of the acid leaching reaction is very short and controlled by the chemical reaction. Therefore, the kinetics of the acid leaching stage were not further investigated, but the water leaching stage was of primary interest. From the analysis of the water leaching residue characteristics in Section 3.3.1, the reaction that primarily occurred in the water leaching stage was sodium silicate leaching in water, with a small variation in the leaching ratio range of 5.04–13.98% of Al2O3 and nearly no leaching of Fe (Figure 3). Hence, the kinetics of the water leaching stage were explored with Si to ascertain the control steps of the reaction rate.

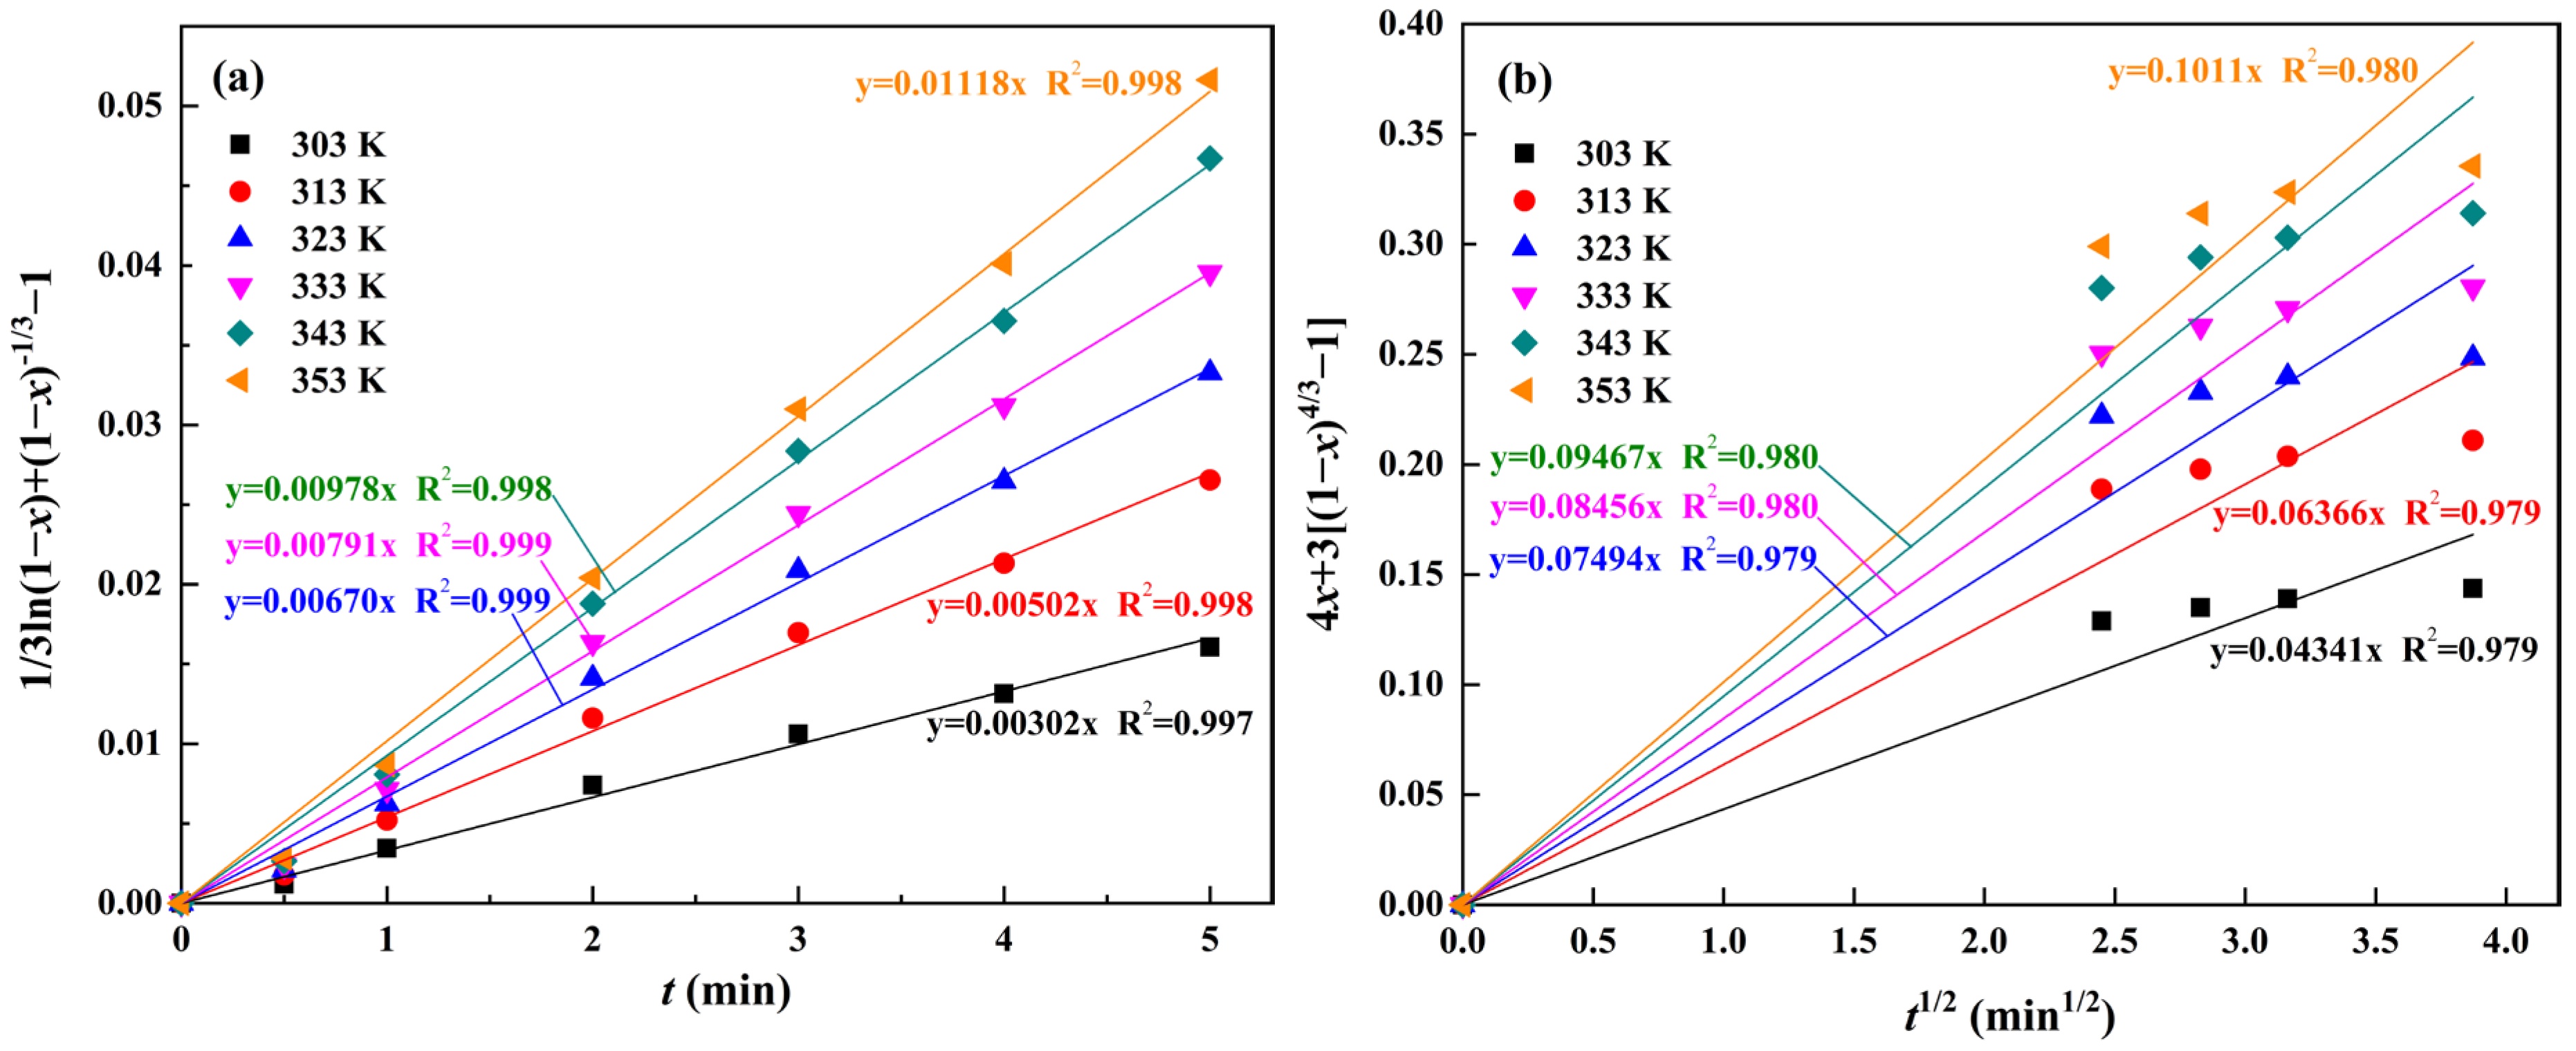
3.5.1. Analysis of Kinetics Model

Water leaching of RCST is a liquid–solid heterogeneous reaction that can be explained by the classical shrinking core models [29,40,41,42]. The leaching reaction rate is generally controlled by the following steps: (1) external diffusion of the leaching agent through the liquid film to the solid phase surface; (2) internal diffusion of the leaching agent through the solid film; (3) chemical reaction at the surface of the core of the unreacted solid; or (4) diffusion of reactants through the residual layer [43].
Assuming that the leaching ratio is controlled by the external diffusion, the shrinking core model can be described using the following expression [44]:
1 − (1 − x)2/3 = k1t
Similarly, when the product layer diffusion controls the rate, the following expression is used [45]:
1 − 2/3x − (1 − x)2/3 = k2t
When the surface chemical reaction is the slowest step, the following equation of the shrinking core model describing the dissolution kinetics can be used [46,47]:
1 − (1 − x)1/3 = k3t
In addition to the above models, a new variant of the shrinking core model describes the mechanism by which interfacial transfer and diffusion across the product layer both influence the dissolution rate [48,49,50]. The equation of this model is as follows:
1/3ln(1 − x) + (1 − x)−1/3 − 1 = k4t
Moreover, from the aforementioned analyses, it can be seen that there were solution caves in the water leaching residues at 10 and 15 min (Figure 7 and Figure 8) when the leaching agent diffused through the pores to the interior of the solids. As a result, a liquid film was formed between the pores and fissures, which can constitute a resistance layer for the unsteady diffusion of ions. Therefore, the leaching ratio has the potential to be controlled by the unsteady diffusion of the liquid film. The expression is as follows [51,52]:
4x + 3[(1 − x)4/3 − 1] = k5t1/2
where x is the leaching ratio of SiO2; k1, k2, k3, k4 and k5 are the rate constants for the corresponding control models, respectively; t is the leaching time.
The kinetics control step of Si in RCST during the water leaching process was determined by fitting equations. The aforementioned analyses suggest that Si in RCST is completely leached out of the water at 15 min. Thus, the clinker was subjected to water leaching dissolution experiments at 303–353 K for 1–15 min. The effect of leaching time on the SiO2 leaching efficiency at various leaching temperatures is shown in Figure 12. It can be seen that the leaching ratio of SiO2 increased rapidly from 1 to 5 min, while the increase became slower from 5 to 15 min, implying that the reaction mechanism or the control step altered after 5 min. Thereby, the water leaching process of Si was divided into two stages: the first stage of 1–5 min and the second stage of 5–15 min [23].
The first- and second-stage experimental data were fitted linearly with the five kinetics models described above, and the regression coefficients are given in Table 6. From Table 6, it can be seen that Equation (11) is more suitable for all the reaction temperatures in the first stage, with regression coefficients greater than 0.99, which is higher than the other equations, and Equation (12) gives a better fit at the second stage, with regression coefficients greater than 0.97. This means that the leaching reaction in the first stage is controlled by both the interfacial transfer and diffusion across the product layer, and the second stage of leaching is controlled by the unsteady diffusion of the liquid film.

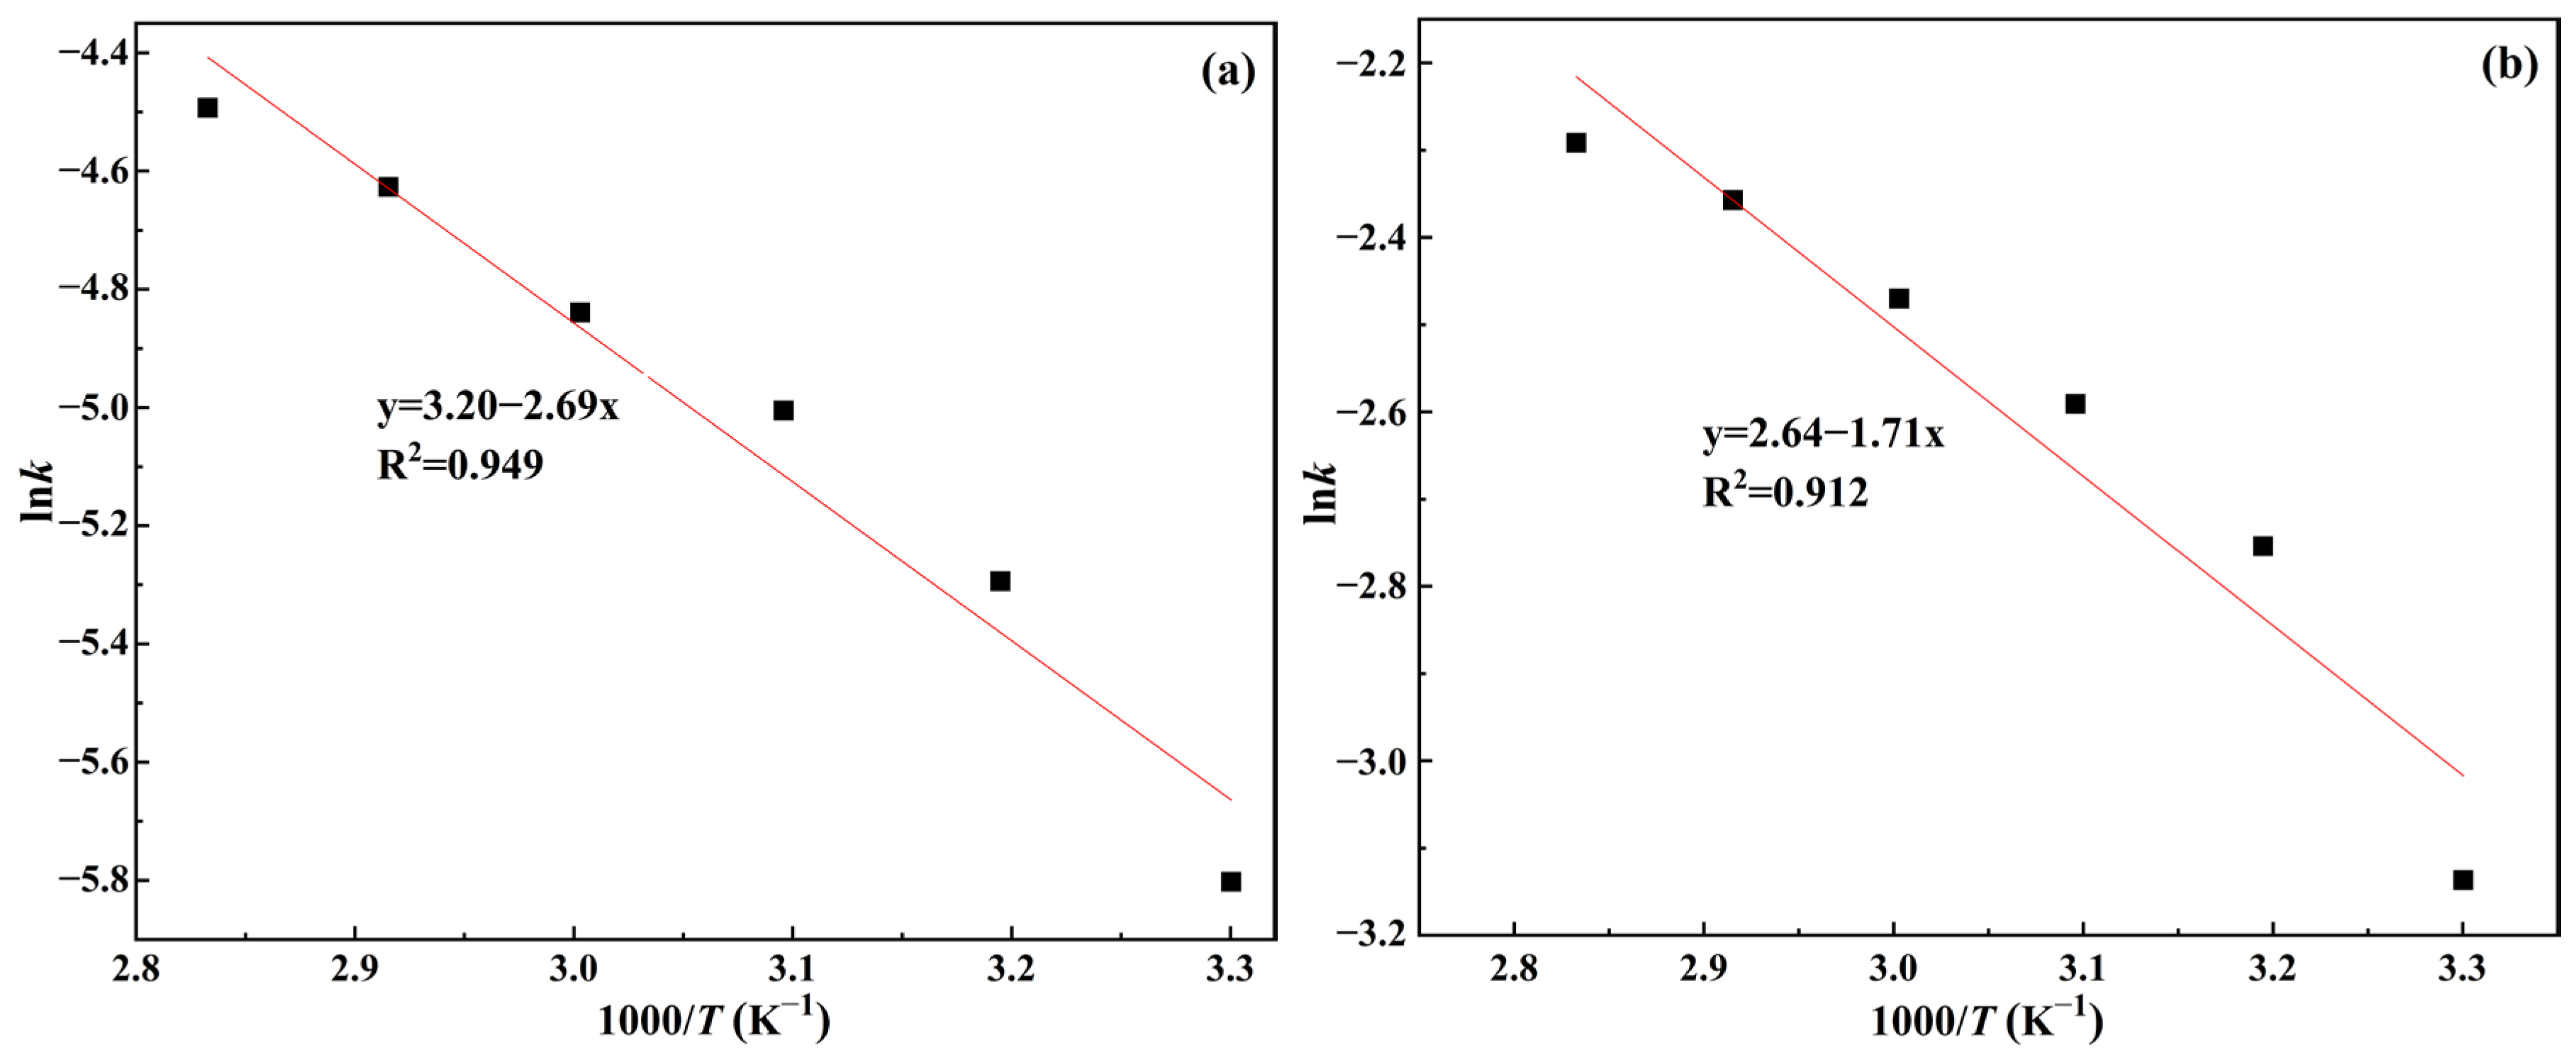
3.5.2. Establishment of Kinetics Equation

The fitted curves between the experimental data and the calculated values of the kinetics models for silicon at the first stage (1–5 min) and the second stage (5–15 min) of the water leaching reaction are illustrated in Figure 13. It can be seen that the straight lines fitted to the experimental data for each reaction temperature have a good linear relationship. The rate constant k was determined from the slope of the fitted straight line for each temperature in Figure 13 and brought into the Arrhenius equation to calculate the apparent activation energy of the leaching reaction. The Arrhenius equation is as follows:
k = A·exp[−Ea/(RT)]
where k is the rate constant; A is the pre-exponential factor; Ea is the apparent activation energy of the leaching reaction, kJ/mol; R is the molar gas constant, J/(mol·K); T is the thermodynamic temperature, K.
The relationship between lnk and 1000/T was constructed from the rate constants k obtained in Figure 13 and is shown in Figure 14. Based on the slopes of −2.69, −1.71 and the intercepts of 3.20, 2.64 for the fitted lines of the first and second water leaching stages shown in Figure 14, the apparent activation energies of 22.36 kJ/mol and 14.22 kJ/mol and the pre-exponential factors of 24.53, 14.01 were calculated, respectively. In general, the activation energy of the leaching process is less than 20 kJ/mol if the reaction is controlled by diffusion, and 20–40 kJ/mol if it is controlled by mixing [53]. Consequently, the calculated results are in accordance with the principle and demonstrate that the water leaching reaction of silicon in RCST is controlled by both the interfacial transfer and the diffusion across the product layer within 1–5 min and by the unsteady diffusion of the liquid film within 5–15 min. According to the above analyses, the kinetics equations for the first and second stages of the water leaching reaction are derived as shown in Equations (14) and (15), respectively.
ln 1 x 3 + 1 x 1 3 1 = 24.53 · exp 22360 / 8.314 T · t
4 x + 3 [ ( 1 x ) 4 3 1 ] = 14.01 · exp [ 14220 / ( 8.314 T ) ] · t

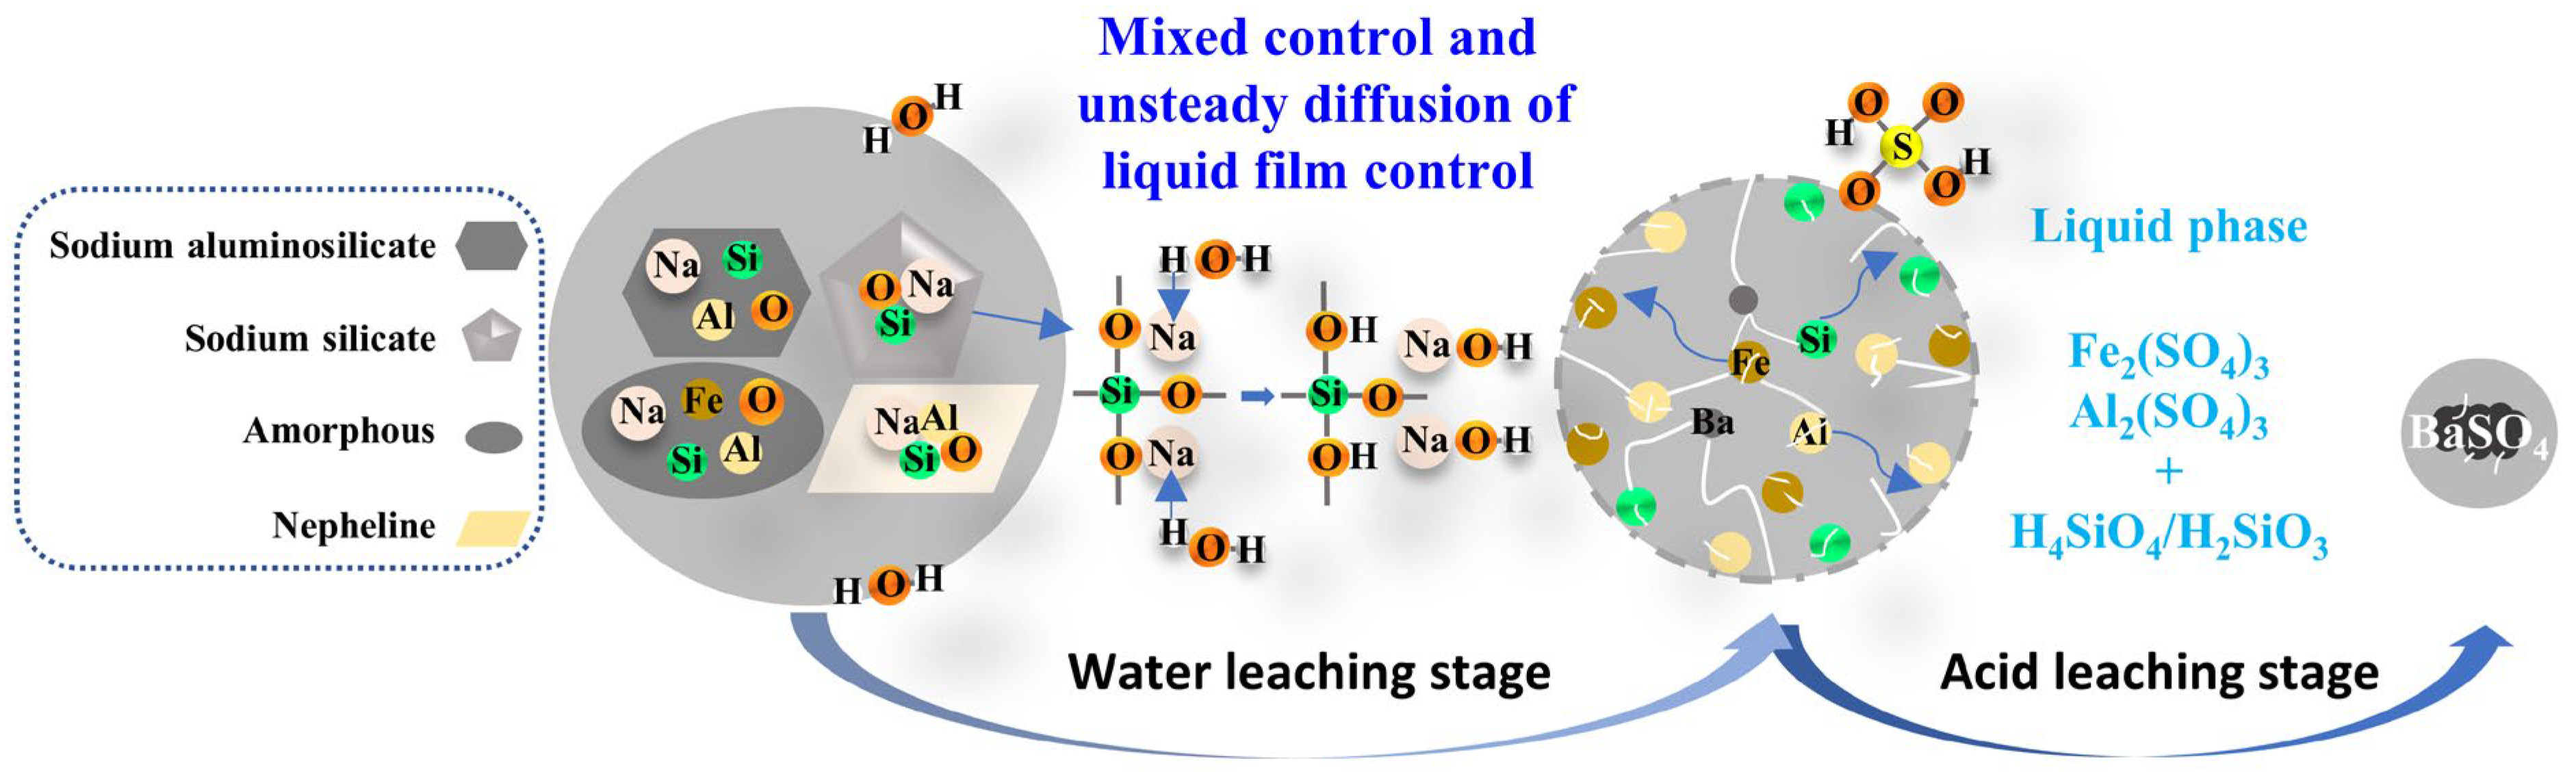
3.6. Mechanism of the Leaching Process of RCST

Based on the above studies, the proposed leaching mechanism is illustrated in Figure 15. In the water leaching stage, sodium silicate and a small part of the structurally unstable sodium aluminosilicate in RCST are dissolved in the water leaching solution, while the aluminosilicates (including nepheline and most of the sodium aluminosilicate) and mixed materials containing iron enter the water leaching residue and can be leached in the acid leaching stage. The main reaction occurring during the water leaching process is the dissolution of sodium silicates, the essence of which is the ionic exchange between Na⁺ and H⁺, alkalizing the aqueous solution and promoting the leaching of small amounts of structurally unstable sodium aluminosilicate from the solution. The temperature is the main factor affecting the progress of this reaction, which accelerates as it increases. Moreover, during the first five minutes of the reaction, the hot water immediately reacts violently with the surface-activated sodium silicate due to the large reaction interface caused by the large number of defects on the clinker surface. The reaction within the time frame is controlled by both interfacial transfer and diffusion across the product layer. After 5 min of the reaction, cracks and pores appear in the solid particles due to the continuous leaching action of the water, through which the leaching agent can diffuse to the interior, and the liquid film formed between the voids constitutes a resistance layer for the non-stationary diffusion of ions so that the reaction is controlled by the unsteady diffusion of the liquid film. However, excessive water leaching time (30 min) and temperature (363 K) can produce insoluble aluminosilicates in the solution, which hampers the leaching of Si and Al. After the water leaching, the residue mainly contains amorphous phases of O, Si, Al and Fe elements due to structural disruption. Such a structure allows for a rapid acid leaching reaction, with almost all of the Si, Al and Fe being dissolved at a lower temperature of 303 K and in an extremely short time of 3 min.

4. Conclusions

In this study, the leaching behavior of Si, Al and Fe in the silver tailings’ roasting clinker during the water–acid stepwise leaching process and the water leaching kinetics of Si were investigated, and the conclusions were drawn as follows:
(1)
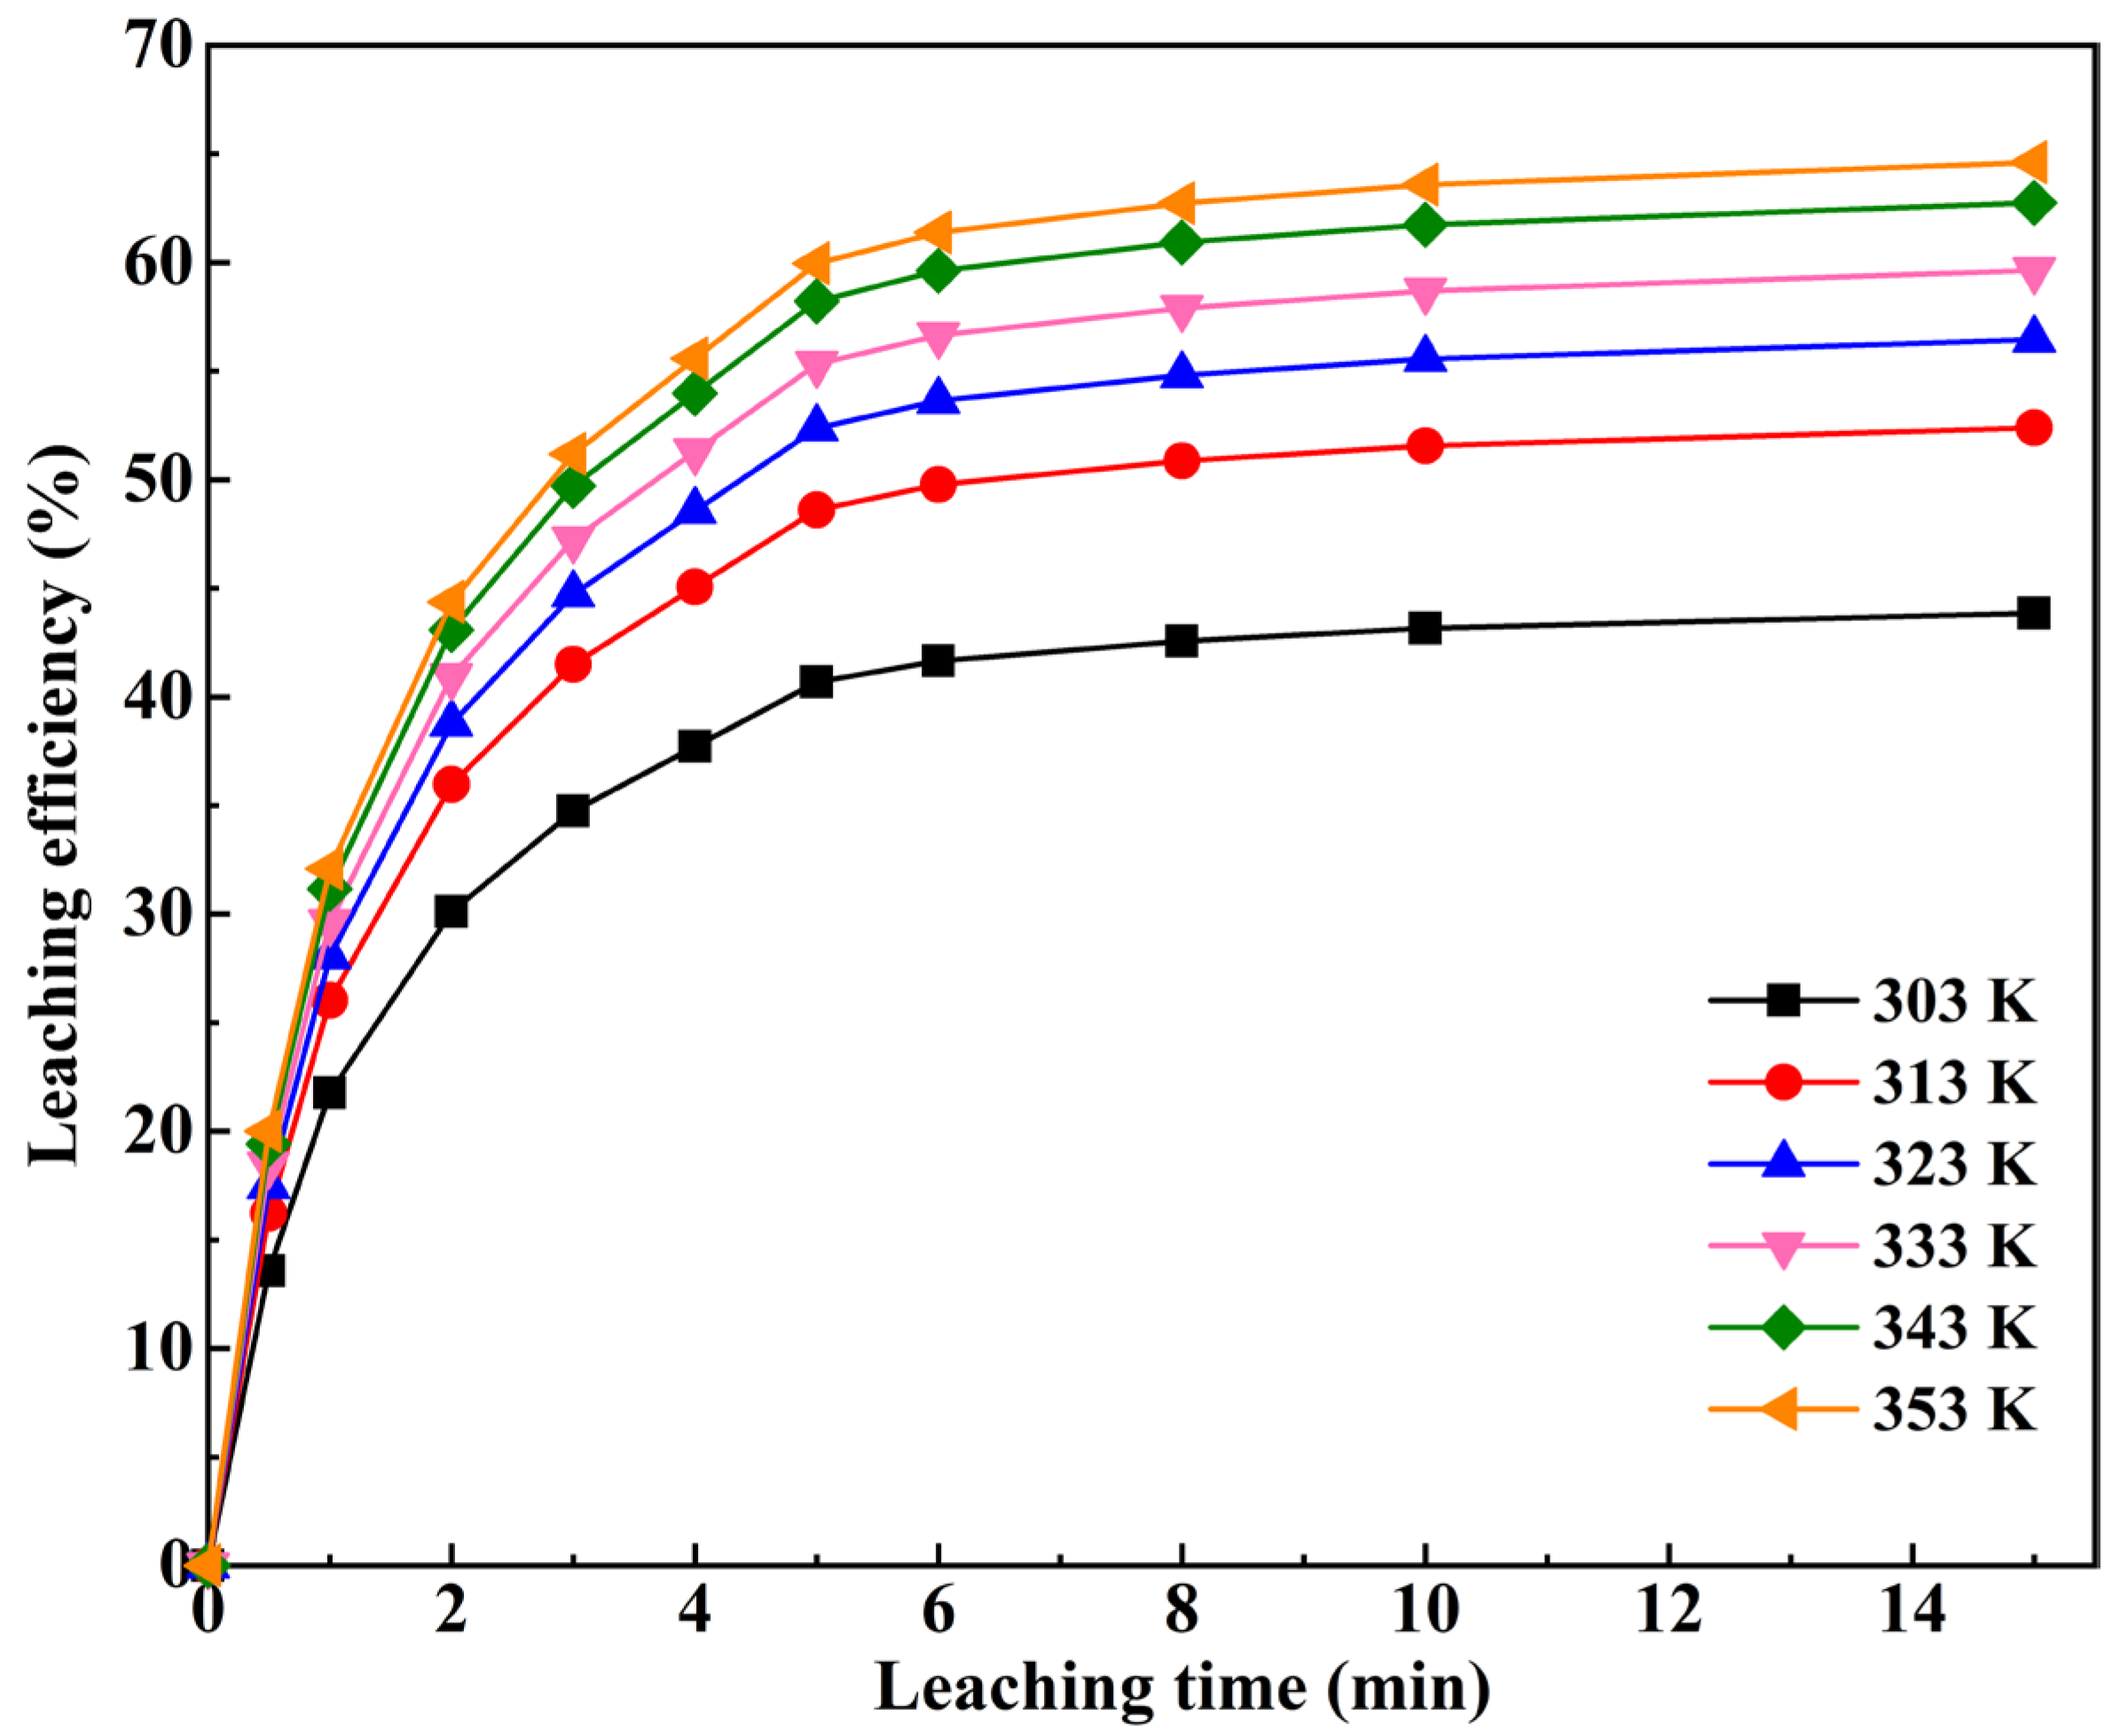
The effect of temperature on the water leaching of Si and Al is significant, as is the effect of H2SO4 concentration on the acid leaching of Si, Al and Fe. At a temperature of 353 K, liquid–solid ratio of 10 mL/g and time of 15 min in the water leaching stage, and at an acid concentration of 6 mol/L, liquid–solid ratio of 5 mL/g, temperature of 303 K and time of 3 min in the acid leaching stage, the recoveries of SiO2, Al2O3 and Fe2O3 were finally obtained as 98.39%, 96.02% and 96.96%, respectively;
(2)
The water leaching solution was prepared as silica micronized powder by carbonation, and silica gel and aluminum iron sulfate crystals were isolated from the acid leaching solution and used for the preparation of silica compounds and the water-purifying agent, respectively. The metal elements were enriched in the final acid leaching solution and can be further separated and extracted. In this way, efficient resource utilization of the tailings can be achieved without discharging secondary solid waste, and economic benefits can be achieved;
(3)
The results of the kinetics model calculations and analysis show that the dissolution of Si during the first 5 min of water leaching is controlled by both interfacial transfer and diffusion across the product layer, with an apparent activation energy of 22.36 kJ/mol, and the dissolution reaction during 5–15 min is controlled by unsteady diffusion of the liquid film, with an apparent activation energy of 14.22 kJ/mol. The rate control equations are: ln 1 x 3 + 1 x 1 3 1 = 24.53 · exp 22360 / 8.314 T · t and 4 x + 3 ( 1 x ) 4 3 1 = 14.01 · exp   14220 / 8.314 T · t , respectively;
(4)
In the water leaching stage, sodium silicate in the clinker leaches out of the water and undergoes hydrolysis, making the solution alkaline and promoting the leaching of a small amount of structurally unstable sodium aluminosilicate into the solution. Under the continued dissolving action of the water, the structure of the materials in the clinker is completely destroyed, and a great number of fissures and pores are produced. Thus, in the acid leaching stage, the amorphous Si-, Al- and Fe-containing substances in the water leaching residue are rapidly (3 min) and effectively dissolved in the sulfuric acid solution at a lower temperature (303 K).

Author Contributions

Investigation, J.C., Y.S. and S.H.; Methodology, J.C.; Resources, A.P.; Supervision, A.P.; Writing—original draft, J.C.; Writing—review and editing, Y.M. All authors have read and agreed to the published version of the manuscript.

Funding

This research was funded by the Shaanxi Public Welfare Fund of China (grant 201919) and the Shaanxi Science and Technology Fund China (grant 2020SF-361).

Data Availability Statement

Not applicable.

Conflicts of Interest

The authors declare no conflict of interest.

References

  1. Sun, R.; Gao, Y. Leaching of heavy metals from lead-zinc mine tailings and the subsequent migration and transformation characteristics in paddy soil. Chemosphere 2022, 291, 132792. [Google Scholar] [CrossRef]
  2. Li, S.; Wu, J. Profiling multiple heavy metal contamination and bacterial communities surrounding an iron tailing pond in Northwest China. Sci. Total Environ. 2021, 752, 141827. [Google Scholar] [CrossRef] [PubMed]
  3. Nascimento, R.; Alves, P. The Fundão dam failure: Iron ore tailing impact on marine benthic macrofauna. Sci. Total Environ. 2022, 838, 156205. [Google Scholar] [CrossRef] [PubMed]
  4. Tunsu, C.; Menard, Y. Recovery of critical materials from mine tailings: A comparative study of the solvent extraction of rare earths using acidic, solvating and mixed extractant systems. J. Cleaner Product. 2019, 218, 425–437. [Google Scholar] [CrossRef]
  5. Mulenshi, J.; Gilbricht, S. Systematic characterization of historical tailings for possible remediation and recovery of critical metals and minerals—The Yxsjöberg case. J. Geochem. Explor. 2021, 226, 106777. [Google Scholar] [CrossRef]
  6. Cairncross, K.; Tadie, M. Life cycle assessment as a design consideration for process development for value recovery from gold mine tailings. Miner. Eng. 2022, 183, 107588. [Google Scholar] [CrossRef]
  7. Kart, E. Evaluation of sulphation baking and autogenous leaching behaviour of Turkish metallurgical slag flotation tailings. Physiochem. Probl. Min. Process. 2021, 57, 107–116. [Google Scholar]
  8. Wang, M.; Chen, B. Extraction of molybdenum and nickel from Ni-Mo ore by acid leaching combined with chlorate oxidation and phosphate complexation. Miner. Eng. 2018, 124, 63–67. [Google Scholar] [CrossRef]
  9. Geng, H.; Wang, F. Leaching behavior of metals from iron tailings under varying pH and low-molecular-weight organic acids. J. Hazard. Mater. 2020, 383, 121136. [Google Scholar] [CrossRef]
  10. Zhang, Y.; Zhang, T.A. Recovery of vanadium from calcification roasted-acid leaching tailing by enhanced acid leaching. J. Hazard. Mater. 2019, 369, 632–641. [Google Scholar] [CrossRef]
  11. Han, B.; Altansukh, B. Development of copper recovery process from flotation tailings by a combined method of high-pressure leaching-solvent extraction. J. Hazard. Mater. 2018, 352, 192–203. [Google Scholar] [CrossRef] [PubMed]
  12. Altinkaya, P.; Liipo, J. Leaching of trace amounts of metals from flotation tailings in cupric chloride solutions. Mining Metall. Explor. 2018, 36, 335–342. [Google Scholar] [CrossRef] [Green Version]
  13. Munive, G.T.; Encinas, M.A.; Campoy, M.M.S.; Álvarez, V.E.; Vazquez, V.M. Leaching gold and silver with an alternative system: Glycine and thiosulfate from mineral tailings. JOM 2020, 72, 918–924. [Google Scholar] [CrossRef]
  14. Maung, K.; Yoshida, T. Assessment of secondary aluminum reserves of nations. Resour. Conserv. Recycl. 2017, 126, 34–41. [Google Scholar] [CrossRef]
  15. National Mineral Resources Planning (2016–2020). Available online: http://g.mnr.gov.cn/201701/t20170123_1430456.html. (accessed on 15 November 2016).
  16. O’Hare, P.A.G. Thermochemistry of silicon-containing materials. Pure Appl. Chem. 1999, 71, 1243–1248. [Google Scholar] [CrossRef] [Green Version]
  17. Petrovic, J.J. Mechanical behavior of MoSi2 and MoSi2 composites. Mater. Sci. Eng. A 1995, 192–193, 31–37. [Google Scholar] [CrossRef]
  18. Gehring, J.; Schleheck, D. Mesoporous organosilica nanoparticles containing superacid and click functionalities leading to Cooperativity in biocidal coatings. ACS Appl. Mater. Inter. 2015, 7, 1021–1029. [Google Scholar] [CrossRef] [PubMed]
  19. Guo, J.; Liu, X. An overview of the comprehensive utilization of silicon-based solid waste related to PV industry. Resour. Conserv. Recycl. 2021, 169, 105450. [Google Scholar] [CrossRef]
  20. Chen, Q.-S.; Zhang, Y.-F. Methods of strategic mineral resources determination in China and abroad. Acta Geosci. Sin. 2021, 42, 137–144. [Google Scholar]
  21. Chang, J.; Pan, A. Thermodynamics and mechanisms of silver tailings roasting processes. Metall. Res. Technol. 2022, 119, 114. [Google Scholar] [CrossRef]
  22. Zhu, G.; Tan, W. Effects and mechanism research of the desilication pretreatment for high-aluminum fly ash. Energ. Fuel. 2013, 27, 6948–6954. [Google Scholar] [CrossRef]
  23. Wang, R.-C.; Zhai, Y.-C. Kinetics of SiO2 leaching from Al2O3 extracted slag of fly ash with sodium hydroxide solution. T. Nonferr. Metal. Soc. 2014, 24, 1928–1936. [Google Scholar] [CrossRef]
  24. Chun, T.; Zhu, D. Recovery of alumina from magnetic separation tailings of red mud by Na2CO3 solution leaching. Metall. Mater. Trans. B 2014, 45, 827–832. [Google Scholar] [CrossRef]
  25. Wang, L.; Chen, L. Recovery of titanium, aluminum, magnesium and separating silicon from titanium-bearing blast furnace slag by sulfuric acid curing–leaching. Int. J. Min. Met. Mater. 2022, 29, 1705–1714. [Google Scholar] [CrossRef]
  26. Gao, Y.-Q.; Zhao, Y.-P. Leaching behavior and leaching kinetics of ferric oxide in copper-smelting waste acid. Chin. J. Nonferrous Met. 2020, 30, 2418–2426. [Google Scholar]
  27. Zhao, X.; Liu, X. Preparation of high-purity quartz sand by leaching with mixed acids. J. Chin. Ceram. Soc. 2021, 49, 581–589. [Google Scholar]
  28. Zhang, Y.; Zhang, J. Extraction of lithium and aluminium from bauxite mine tailings by mixed acid treatment without roasting. J. Hazard. Mater. 2021, 404, 124044. [Google Scholar] [CrossRef]
  29. Tao, L.; Wang, L. Leaching of iron from copper tailings by sulfuric acid: Behavior, kinetics and mechanism. RSC Adv. 2021, 11, 5741–5752. [Google Scholar] [CrossRef]
  30. Almeida, V.; Schneider, I. Production of a ferric chloride coagulant by leaching an iron ore tailing. Miner. Eng. 2020, 156, 106511. [Google Scholar] [CrossRef]
  31. Hernández, C.; Banza, A. Recovery of metals from Cuban nickel tailings by leaching with organic acids followed by precipitation and magnetic separation. J. Hazard. Mater. 2007, B139, 25–30. [Google Scholar] [CrossRef]
  32. Weldes, H.; Lange, K. Properties of soluble silicates. Ind. Eng. Chem. 1969, 61, 29–44. [Google Scholar] [CrossRef]
  33. Kpayc, И.П.; Деревянкин, B.A.; Куэнецoв, C.И.; Ran, Q. Solubility of sodium aluminosilicate hydrate in caustic soda solution. Foreign Light Met. 1966, 4, 1–5. [Google Scholar]
  34. Ни, Л.H.; Перехрест, Г.Л.; Сoленкo, T.B.; Ran, Q. Solubility of sodium aluminate in sodium aluminate solution. Foreign Light Met. 1965, 8, 1–5. [Google Scholar]
  35. Park, H.; Englezos, P. Thermodynamic modeling of sodium aluminosilicate formation in aqueous alkaline solutions. Ind. Eng. Chem. Res. 1999, 38, 4959–4965. [Google Scholar] [CrossRef]
  36. Liu, G.-H.; Fan, K.-S. Sodium aluminosilicate hydrate in alumina production. Light Met. 2006, 2, 13–17. [Google Scholar]
  37. Zheng, K.; Smart, R.S.C. Solubility of sodium aluminosilicates in synthetic Bayer liquor. J. Chem. Eng. Data 1998, 43, 312–317. [Google Scholar] [CrossRef]
  38. Liu, G.-H.; Li, X.-B. The Kinetics of the formation of sodium aluminosilicate hydrate in strong caustic solutions. Chem. J. Chin. Univ. 1999, 20, 1262–1265. [Google Scholar]
  39. Pan, A.; Ma, R. Baihe Pyrite Slag Resource Utilization Industrial Test Report; Institute of Earth Environment, Chinese Academy of Sciences and Other Units: Beijing, China, 2022; pp. 83–87. [Google Scholar]
  40. Luo, M.-J.; Liu, C.-L. Leaching kinetics and mechanism of alunite from alunite tailings in highly concentrated KOH solution. Hydrometallurgy 2017, 174, 10–20. [Google Scholar] [CrossRef]
  41. Lei, C.; Yan, B. Silver leaching and recovery of valuable metals from magnetic tailings using chloride leaching. J. Cleaner Product. 2018, 181, 408–415. [Google Scholar] [CrossRef]
  42. Zhao, J.; Li, L. Principle of Metallurgy; Metallurgical Industry Press: Beijing, China, 2012; pp. 65–67. [Google Scholar]
  43. Liu, H.; Xu, Z. Hydrometallurgy·Leaching Technology; Metallurgical Industry Press: Beijing, China, 2010; pp. 35–36. [Google Scholar]
  44. Seyed Ghasemi, S.M.; Azizi, A. Alkaline leaching of lead and zinc by sodium hydroxide: Kinetics modeling. J. Mater. Res. Technol. 2018, 7, 118–125. [Google Scholar] [CrossRef]
  45. Ma, D.X.; Ma, P.H. Kinetics and mechanism of leaching potassium from biotite in H2SO4 solution. ChemistrySelect 2020, 5, 11955–11960. [Google Scholar] [CrossRef]
  46. Tavakoli, M.R.; Dreisinger, D.B. The kinetics of oxidative leaching of vanadium trioxide. Hydrometallurgy 2014, 147–148, 83–89. [Google Scholar] [CrossRef]
  47. Zhou, J.; Zhao, J. Leaching kinetics of potassium and aluminum from phosphorus-potassium associated ore in HCl-CaF2 system. Sep. Purif. Technol. 2020, 253, 117528. [Google Scholar] [CrossRef]
  48. Peng, X.; Liu, W. Fluorite enhanced magnesium recovery from serpentine tailings: Kinetics and reaction mechanisms. Hydrometallurgy 2021, 201, 105571. [Google Scholar] [CrossRef]
  49. Dickinson, C.F.; Heal, G.R. Solid–liquid diffusion controlled rate equations. Thermochim. Acta 1999, 340–341, 89–103. [Google Scholar] [CrossRef]
  50. Zhang, L.J.; Zhou, W.B. Bioleaching of dewatered electroplating sludge for the extraction of base metals using an adapted microbial consortium: Process optimization and kinetics. Hydrometallurgy 2020, 191, 105227. [Google Scholar] [CrossRef]
  51. Liu, J.; Zhang, Y. Study on leaching kinetics of extracting vanadium by water from stone coal. Nonferrous Met. (Miner. Process. Sect.) 2008, 4, 15–17+24. [Google Scholar]
  52. Pang, S.; Tao, D. Apparent kinetics of leaching of iron oxides in diasporic bauxite by hydrochloric acid. Nonferrous Met. 1999, 3, 49–53. [Google Scholar]
  53. Hua, Y. Introduction to Kinetics of Metallurgical Process; Metallurgical Industry Press: Beijing, China, 2004; pp. 191–193. [Google Scholar]
Figure 1. SEM images with EDS analyses and XRD pattern of silver tailings’ roasted clinker: (a) SEM image and (b) XRD pattern of silver tailings roasted clinker; (c), (e) and (g) enlarged images and (d), (f) and (h) EDS analyses of Spot 1, Spot 2 and Spot 3, respectively, in (a).
Minerals 13 00105 g001
Figure 2. The leaching experimental process of silver tailings’ roasted clinker.
Minerals 13 00105 g002
Figure 3. Effects of different water leaching conditions on the leaching efficiencies of silicon, aluminum and iron: (a) leaching temperature, (b) leaching time and (c) liquid–solid ratio.
Minerals 13 00105 g003
Figure 4. Effects of different acid leaching conditions on the leaching efficiencies of silicon, aluminum and iron: (a) acid concentration (b) liquid–solid ratio (c) leaching temperature and (d) leaching time.
Minerals 13 00105 g004
Figure 5. The element contents and the weight of water leaching residues.
Minerals 13 00105 g005
Figure 6. XRD patterns of water leaching residues.
Minerals 13 00105 g006
Figure 7. SEM image and EDS analysis of the water leaching residue at 5 min: (a) SEM image of the water leaching residue at 5 min; (b), (c) and (d) EDS analysis of Spot 1, Spot 2 and Spot 3, respectively, in (a).
Minerals 13 00105 g007
Figure 8. SEM image and EDS analysis of the water leaching residue at 10 min: (a) SEM image of water leaching residue at 10 min; (b) enlarged image for the frame area in Figure 8a; (c) and (d) EDS analysis of Spot 1 and Spot 2 in (a).
Minerals 13 00105 g008
Figure 9. SEM image and EDS analysis of water leaching residue at 15 min (ac) and 30 min (df).
Minerals 13 00105 g009
Figure 10. SEM image and EDS analysis of the acid leaching residue of 2 mol/L H2SO4 at 1 min: (a) SEM image of the acid leaching residue; (b), (c) and (d) EDS analysis of Spot 1, Spot 2 and Spot 3, respectively, in (a).
Minerals 13 00105 g010
Figure 11. SEM image with EDS analysis and XRD pattern of acid leaching residue of 6 mol/L H2SO4 at 2 min: (a) SEM image and (b) XRD pattern of the acid leaching residue of 6 mol/L H2SO4 at 2 min; (c) enlarged image of the frame area in (a); (d) EDS analysis of Spot 1 in (c).
Minerals 13 00105 g011
Figure 12. Effect of leaching time on the Si leaching efficiency at various leaching temperatures.
Minerals 13 00105 g012
Figure 13. Fitting curves between experimental data and the calculated values with reaction rate control models under various temperatures: (a) mixed control of the first stage; (b) unsteady diffusion of the liquid film control of the second stage.
Minerals 13 00105 g013
Figure 14. Arrhenius plot of lnk vs. 1/T: (a) the first stage; (b) the second stage.
Minerals 13 00105 g014
Figure 15. Schematic of the mechanism of the water–acid leaching of silicon, aluminum and iron from the silver tailing roasted clinker.
Minerals 13 00105 g015
Table 1. Leaching conditions and efficiency of useful components from mine tailings.
MethodRaw MaterialTarget ElementLeaching ConditionsLeaching EfficiencyRef.
NaOH leachingHigh-aluminum
fly ash
SiO2NaOH 110–140 g/L, L/S = 3;
first stage: 338 K, 12 h;
second stage: 368 K, 4 h
33.58%[22]
NaOH leachingAl2O3 extracted slag of fly ashSiO2NaOH to SiO2 mass ratio 2, L/S = 10, 363 K, 30 min95.66%[23]
Na2CO3 leachingMagnetic separation tailings of red mudAlNa2CO3 20%, L/S = 15, 343 K,
1 h
80.25%[24]
H2SO4 curing and H2SO4 leachingTitanium-bearing blast furnace slagAl, TiH2SO4 70%, L/S = 1.4, 523 K,
2 h
Al 81.17%, Ti 85.96%[25]
Mixed acid leachingBauxite tailingsAlAcid concentration 60%, L/S = 4,
373 K, 3 h
88.64%[28]
H2SO4 leachingCopper tailingsFeH2SO4 0.53 M, L/S = 10, 313 K,
2 h
66.45%[29]
HCl leachingIron tailingsFeHCl 10.8 M, L/S = 1.67, 353 K,
2 h
94%[30]
Mixed organic acid leachingNickel tailingsFe, Co, NiTartaric acid 0.15 M and oxalic acid 0.05 M, room temperature, 5 daysFe 50%, Co, Ni 80%[31]
Table 2. Chemical composition of the silver tailings’ roasted clinker (wt%).
ElementSiO2Al2O3Fe2O3Na2OCaOMgOBaO
Silver tailings46.0016.8011.500.544.271.132.39
Roasted clinker27.938.438.3243.522.850.761.82
Table 3. Chemical component of acid leaching residues (wt%).
ElementSiO2Al2O3Fe2O3Na2OCaOMgOBaO
2 mol for 1 min17.2415.5215.260.958.7412.7818.71
6 mol for 3 min7.695.734.320.9510.6430.5731.15
Table 4. Cost estimation of processing per ton of silver tailings.
No.ItemsUnitsPrice (RMB/Unit)Consumption
(Unit/Per Tailings)
Costs (RMB/Per Tailings)
1Raw materials
1.1Tailingston010
1.2Sodium carbonateton27000.169456.30
1.3Sulfuric acidton2000.96192.00
1.4Waterton1.792.153.85
1.5Limeton3500.1863.00
Subtotal 715.15
2Fuel *
2.1Natural gasNm33.74152.86571.68
Subtotal 571.68
3Power *
3.1Dynamic electricitykW·h0.43278.41119.72
3.2Steamton107.130.96102.84
Subtotal 222.56
4Other *Labor, manufacturing, operations, administration and finance79.69
5Full cost 1589.08
* Estimated according to reference [39].
Table 5. Revenue estimation of major element products for per ton of silver tailings.
ProductsPrice (RMB/Ton)Output (Ton)Revenues (RMB)
Silica micronized powder1000 (1)0.28279.06
Silica gel1000 (2)0.16161.00
Water-purifying agent1100 (3)1.461602.34
Revenue from products2042.41
Retained profits453.33
Corporate tax payment118.85
Profit after tax334.48
(1) According to market research, the price of silica micronized powder is RMB 650 to 2000 per ton, taking the middle price to calculate. (2) The price of solid water purification agents with 16% to 20% amount of Al2O3 + Fe2O3 is about RMB 2000 per ton, taking the 50% discount price to calculate the revenue. (3) The market price of white carbon black is RMB 4000/ton, taking its 1/4 price to calculate the silica gel revenue.
Table 6. Correlation coefficients (R2) of various kinetic models with the experimental data.
Reaction
Stage
Kinetic ModelsR2
303 K313 K323 K333 K343 K353 K
First
stage
1 − (1 − x)2/3 = k1t0.8680.8730.8750.8770.8790.880
1 − 2/3x − (1 − x)2/3 = k2t0.9840.9860.9870.9880.9890.989
1 − (1 − x)1/3 = k3t0.8840.8920.8970.9000.9040.906
1/3ln(1 − x) + (1 − x)−1/3 − 1 = k4t0.9970.9980.9990.9990.9980.998
4x + 3[(1 − x)4/3 − 1] = k5t0.9560.9550.9550.9540.9540.953
Second
stage
1 − (1 − x)2/3 = k1t0.6720.6730.6740.6740.6750.676
1 − 2/3x − (1 − x)2/3 = k2t0.7150.7180.7200.7210.7230.724
1 − (1 − x)1/3 = k3t0.6760.6790.6800.6820.6830.684
1/3ln(1 − x) + (1 − x)−1/3 − 1 = k4t0.7320.7410.7470.7520.7570.761
4x + 3[(1 − x)4/3 − 1] = k5t0.9790.9790.9790.9800.9800.980
Disclaimer/Publisher’s Note: The statements, opinions and data contained in all publications are solely those of the individual author(s) and contributor(s) and not of MDPI and/or the editor(s). MDPI and/or the editor(s) disclaim responsibility for any injury to people or property resulting from any ideas, methods, instructions or products referred to in the content.

