Article

Structural Features of Oxyapatite

by
Natalia V. Bulina
1,*,
Leon A. Avakyan
2,
Svetlana V. Makarova
1,
Igor B. Orehov
1 and
Vladimir S. Bystrov
3
1
Institute of Solid State Chemistry and Mechanochemistry, Siberian Branch of the Russian Academy of Sciences, 630128 Novosibirsk, Russia
2
Physical Faculty, Southern Federal University, 344059 Rostov-on-Don, Russia
3
Institute of Mathematical Problems of Biology, Keldysh Institute of Applied Mathematics, Russian Academy of Sciences, 142290 Pushchino, Russia
*
Author to whom correspondence should be addressed.
Minerals 2023, 13(1), 102; https://doi.org/10.3390/min13010102
Submission received: 3 December 2022 / Revised: 2 January 2023 / Accepted: 6 January 2023 / Published: 9 January 2023
(This article belongs to the Special Issue Recent Advances of Hydroxyapatite and Its Applications, Volume II)

Abstract

:
One of the most widely known representatives of the apatite family is hydroxyapatite, Ca10(PO4)6(OH)2. This mineral is a part of the human dental and bone tissues, and, therefore, is widely used in medicine. Less known is oxyapatite, Ca10(PO4)6O, which has the same biocompatibility as hydroxyapatite. In this work, it is shown that oxyapatite can be obtained by heating hydroxyapatite powder at 1000 °C in vacuum. IR and NMR spectroscopy proved the absence of the hydroxyl groups in the apatite obtained. In the IR spectrum, the presence of new absorption bands of phosphate groups, indicating a symmetry disorder, was observed. Density functional theory modeling confirmed lowering of symmetry for the oxyapatite structure. Modeling the IR spectrum of oxyapatite made it possible to identify the experimentally observed new absorption bands. According to the modeling, the presence of a vacancy in a hydroxyl channel of the apatite structure lowered the symmetry. Powder X-ray diffraction data confirmed that full dehydroxylation of hydroxyapatite led to a decrease in symmetry to triclinic phase. Comparison of the formation energies showed that formation of the hydroxyapatite phase was more preferable than that of oxyapatite, which explains apatite’s tendency to rehydroxylation. It was shown that the solubility of oxyapatite in water was comparable to that of hydroxyapatite.

1. Introduction

Research in the field of medical materials is one of the most important and actively developing areas of science. Hydroxyapatite (HA, Ca10(PO4)6(OH)2) is one of the important biomaterials used in regenerative medicine since it is an analogue of the mineral component of human bone tissue. HA is used for bone augmentation, maxillofacial reconstruction, spinal fusion, periodontal disease repairs and bone fillers after tumor surgery [1,2,3,4,5]. For medical purposes, synthetic HA is usually used, as natural HA, due to a high flexibility of apatite structure, contains various structural defects and additional ions that are not always useful for the body [6]. Due to the tendency for substitution, biological HA, which forms the mineral basis of bone and tooth enamel, also contains various important foreign ions [7]. The influence of various defects on the change in HA properties is convincingly shown using computational theoretical methods of the density functional theory (DFT) [8,9,10,11,12,13,14]. Revealing the role of various structural defects and changes in HA is important for practical applications of HA, as well as in the synthesis of artificial HA, during the thermal treatment of synthesized HA. These HA features can be effectively investigated by combining experimental and theoretical methods.
The HA unit cell contains 10 calcium cations located in two nonequivalent positions: four cations in the Ca1 site, each surrounded by nine oxygen atoms, and six cations in the Ca2 site, each surrounded by seven oxygen atoms [15]. In addition to calcium ions, the HA elementary cell has six phosphate and two hydroxyl groups. The latter are located on the c axis in a hexagonal channel formed by calcium and oxygen ions from phosphate tetrahedrons.
The crystal lattice of stoichiometric HA, with a Ca/P ratio of 1.67, has a high enough thermal stability to allow HA heat treatment up to 1300 °C [16,17]. However, it must be borne in mind that this procedure must not take place in a dry atmosphere, as the heating of the HA is accompanied by a process of dehydroxylation with a release of water molecules [18], which must be recovered when the material cools (reversible process). A noticeable rate of dehydroxylation starts at 850–900 °C [19] and leads to the formation of vacancies in the position of the hydroxyl groups in the HA crystal lattice. Hence, upon heating, the formation of oxyhydroxyapatite (OHA) takes place as a result of the following reaction:
Ca10(PO4)6(OH)2 → Ca10(PO4)6(OH)2−2xOx + xH2O
The two nearest hydroxyl groups participate in the production of one OH vacancy. One of them will be removed, the other donates the H+ ion to form one neutral molecule of water, which then diffuses on the particle surface:
2OH → VOH + O2− + H2O
where VOH is the OH group vacancy.
The vacancy and the oxide ion remaining, instead of two hydroxyl groups, retain the electroneutrality of the system. This experimental result is in accordance with the results of modeling [8].
The dehydroxylation process is affected by the kinetic factors, the heating rate and the water vapor partial pressure. The slower the heating rate, the more hydroxyl groups will leave the structure during heating to a certain temperature [17,20]. When fully dehydroxylated, the apatite structure has the chemical formula of Ca10(PO4)6O and is called oxyapatite (OA). It has been reported that this condition of apatite is highly reactive [21], in particular, it has a higher solubility in water than HA [5,22]. This suggests that OA is a more promising material for use as a bioresorbable material in reconstructive medicine. However, some authors believe that OA cannot be obtained in its pure form [23], so its properties have been poorly investigated.
Obtaining OA is not a trivial task because cooling of OA in air is accompanied by rehydroxylation. This is due to the fact that reactions (1, 2) are reversible, so an increase in the water vapor pressure and a decrease in the temperature lead to incorporation of water into the OA structure [18]. The formation and existence of OA needs very rigidly controlled conditions. The concentration of the restored hydroxyl groups depends on the heating temperature, the density of the substance, and the water partial pressure [17]. In addition, overheating of OA leads to a decomposition of the surface layer with the formation of a mixture of α-tricalcium phosphate and tetracalcium phosphate or calcium oxide by the following reactions, respectively [18,22]:
Ca10(PO4)6O → 2Ca3(PO4)2 + Ca4O(PO4)2
Ca10(PO4)6O → 3Ca3(PO4)2 + CaO
The OA decomposition also depends on the heating rate and the water partial pressure. OA decomposes in vacuum at temperatures above 1050 °C [21]. When heated in a moist atmosphere, decomposition is observed at 1300–1400 °C [17,18]. By providing a water partial pressure of 500 mm Hg in the sintering atmosphere, it is possible to shift the decomposition process to a temperature of 1475 °C [18,20].
Despite the fact that the first publications devoted to the process of HA dehydroxylation appeared in 1933 [24], there are very few works on the preparation and study of the properties of OA [15,18,25,26,27,28,29]. Controversial structural data on OA are given in the literature (Table 1). Obviously, these contradictions are related to the difficulties of obtaining and analyzing OA. Thus, the authors of review articles [27,30] inform us that OA has hexagonal symmetry with space group P. Elliott reported that OA retains the structure of HA, P63/m [15]. The determination of the lattice parameters of HA during heating in vacuum at 800 °C showed that the OA a parameter is less than, while the OA c parameter is higher than, the corresponding values a and c for HA [21].
In this work, the structure of OA is studied experimentally using scanning electron microscopy (SEM), X-ray diffraction (XRD), infra-red (IR) and nuclear magnetic resonance (NMR) spectroscopies, and theoretically within the framework of the density functional theory (DFT).

2. Materials and Methods

2.1. Samples Preparation and Characterization

HA nanopowder with Ca/P ratio of 1.67 was used as a precursor. HA nanopowder was synthesized in the AGO-2 planetary ball mill by means of mechanochemical method. A detailed description of the synthesis procedure can be found in our previous paper [17]. Briefly, a mixture of CaHPO4 (pure grade, Vekton, Saint Petersburg, Russia) and freshly calcined CaO (analytical grade, Vekton, Saint Petersburg, Russia) powders was treated in the mill for 30 min. The powder obtained was a single-phase HA. The results of element analysis obtained by an S2 Puma X-ray fluorescent spectrometer (Bruker, Germany) are presented in Table S1. The analysis indicated that the ratio of Ca/P in the synthesized material was 1.67. The concentration of other elements in the sample did not exceed 1 wt % and was explained by the insufficiently high purity of the initial reagents.
A portion of the HA nanopowder was annealed in air atmosphere in a high-temperature electrical furnace PVK-1.6-5 (Teplopribor, Ekaterinburg, Russia) at 1000 °C for 1 h and at a cooling rate of 5 °C/min (sample A). The OA sample (sample B) was obtained by annealing the HA nanopowder in a vacuum furnace SNVE-1,7/20 at 1000 °C for 1 h in vacuum 1 mPa with cooling in vacuum.
Powder X-ray diffraction (PXRD) patterns of the samples obtained were recorded on a D8 Advance powder diffractometer (Bruker, Karlsruhe, Germany) with Bragg–Brentano geometry using Cu–Kα radiation. PXRD patterns were collected in the interval 10° < 2Θ < 90° with a step size of ∆2θ = 0.0195° and a counting time of 53 s per step. X-ray phase analysis of the samples was carried out using PDF-4 database (ICDD, Release 2011). The unit cell parameters and crystallite size were determined by the Rietveld method using Topas 4.2 software. Initial structural data on the HA and OA phases were borrowed from ref. [31] and [29], respectively.
FTIR spectra were recorded on a Scimitar-FTS 2000 spectrometer (Digilab LLC, Randolph, MA, USA) using the KBr pellet method.
The morphology of the particles was analyzed using a Hitachi TM1000 (Hitachi, Tokyo, Japan) scanning electron microscope (SEM). Powder was fixed on conductive double sided carbon tape. Before the study, the surface of the samples was coated with a 15 nm thick sputtered gold layer.
Solid-state NMR experiments were detected on an Avance III 500 spectrometer (Bruker, Karlsruhe, Germany) at a resonance frequency of 500 MHz for 1H experiments and 200 MHz for 31P experiments. Magic angle spinning (MAS) spectra were acquired using a 4 mm probe at a sample rotation frequency of 10 kHz.
The resorption of HA and OA in water was determined for pressed pellets with identical mass (~0.67 g). The pellets, after preliminary drying at 105 °C, were placed in tubes with 13 mL of distilled water (each pellet in a separate tube). The tubes with samples were covered with lids and placed in a thermostat at 37 °C. During the experiment, a daily change of water was carried out, and the mass of pellets was measured once a week after preliminary drying at 105 °C.

2.2. Computational Details

The ground state electronic structure of atomic models was calculated within DFT using the QUANTUM ESPRESSO package [32,33]. The many-body electronic interactions were evaluated using hybrid density functional HSE06 [34,35] which is important for achievement of correct energy and geometry of HA materials [12,13]. Core states were described by means of optimized norm-conserved (ONCV) pseudopotentials [36,37], while the kinetic energy cut-offs of 60 and 240 Ry for expansions of the Khon–Sham wave functions and semi-local potential. The exact exchange operator was calculated using the plane wave cut-off of 120 Ry. We verified the selection of these values in [13].
The forces acting on atoms were evaluated based on the calculated ground state electronic structure. The search of the stable atomic configuration was performed using BFGS minimization of total energy, which was continued while any component of force at any atom was higher than 10−4 Ryd/Bohr.
The less precise generalized gradient approximation (PBE-GGA) [38] was used for resource-demanding phonon calculations required for IR spectra modeling. The phonons and Born effective charges were evaluated at Γ point using the density-functional perturbation approach. The acoustic sum rule was applied to three translation degrees of freedom. The IR transmission T was evaluated as T = exp(−K·σ), where K is an adjusted parameter depending on the density and depth of the sample (we assumed K = 0.001), and σ is the IR intensities, smeared by 1 meV width Gaussian function.

3. Results and Discussion

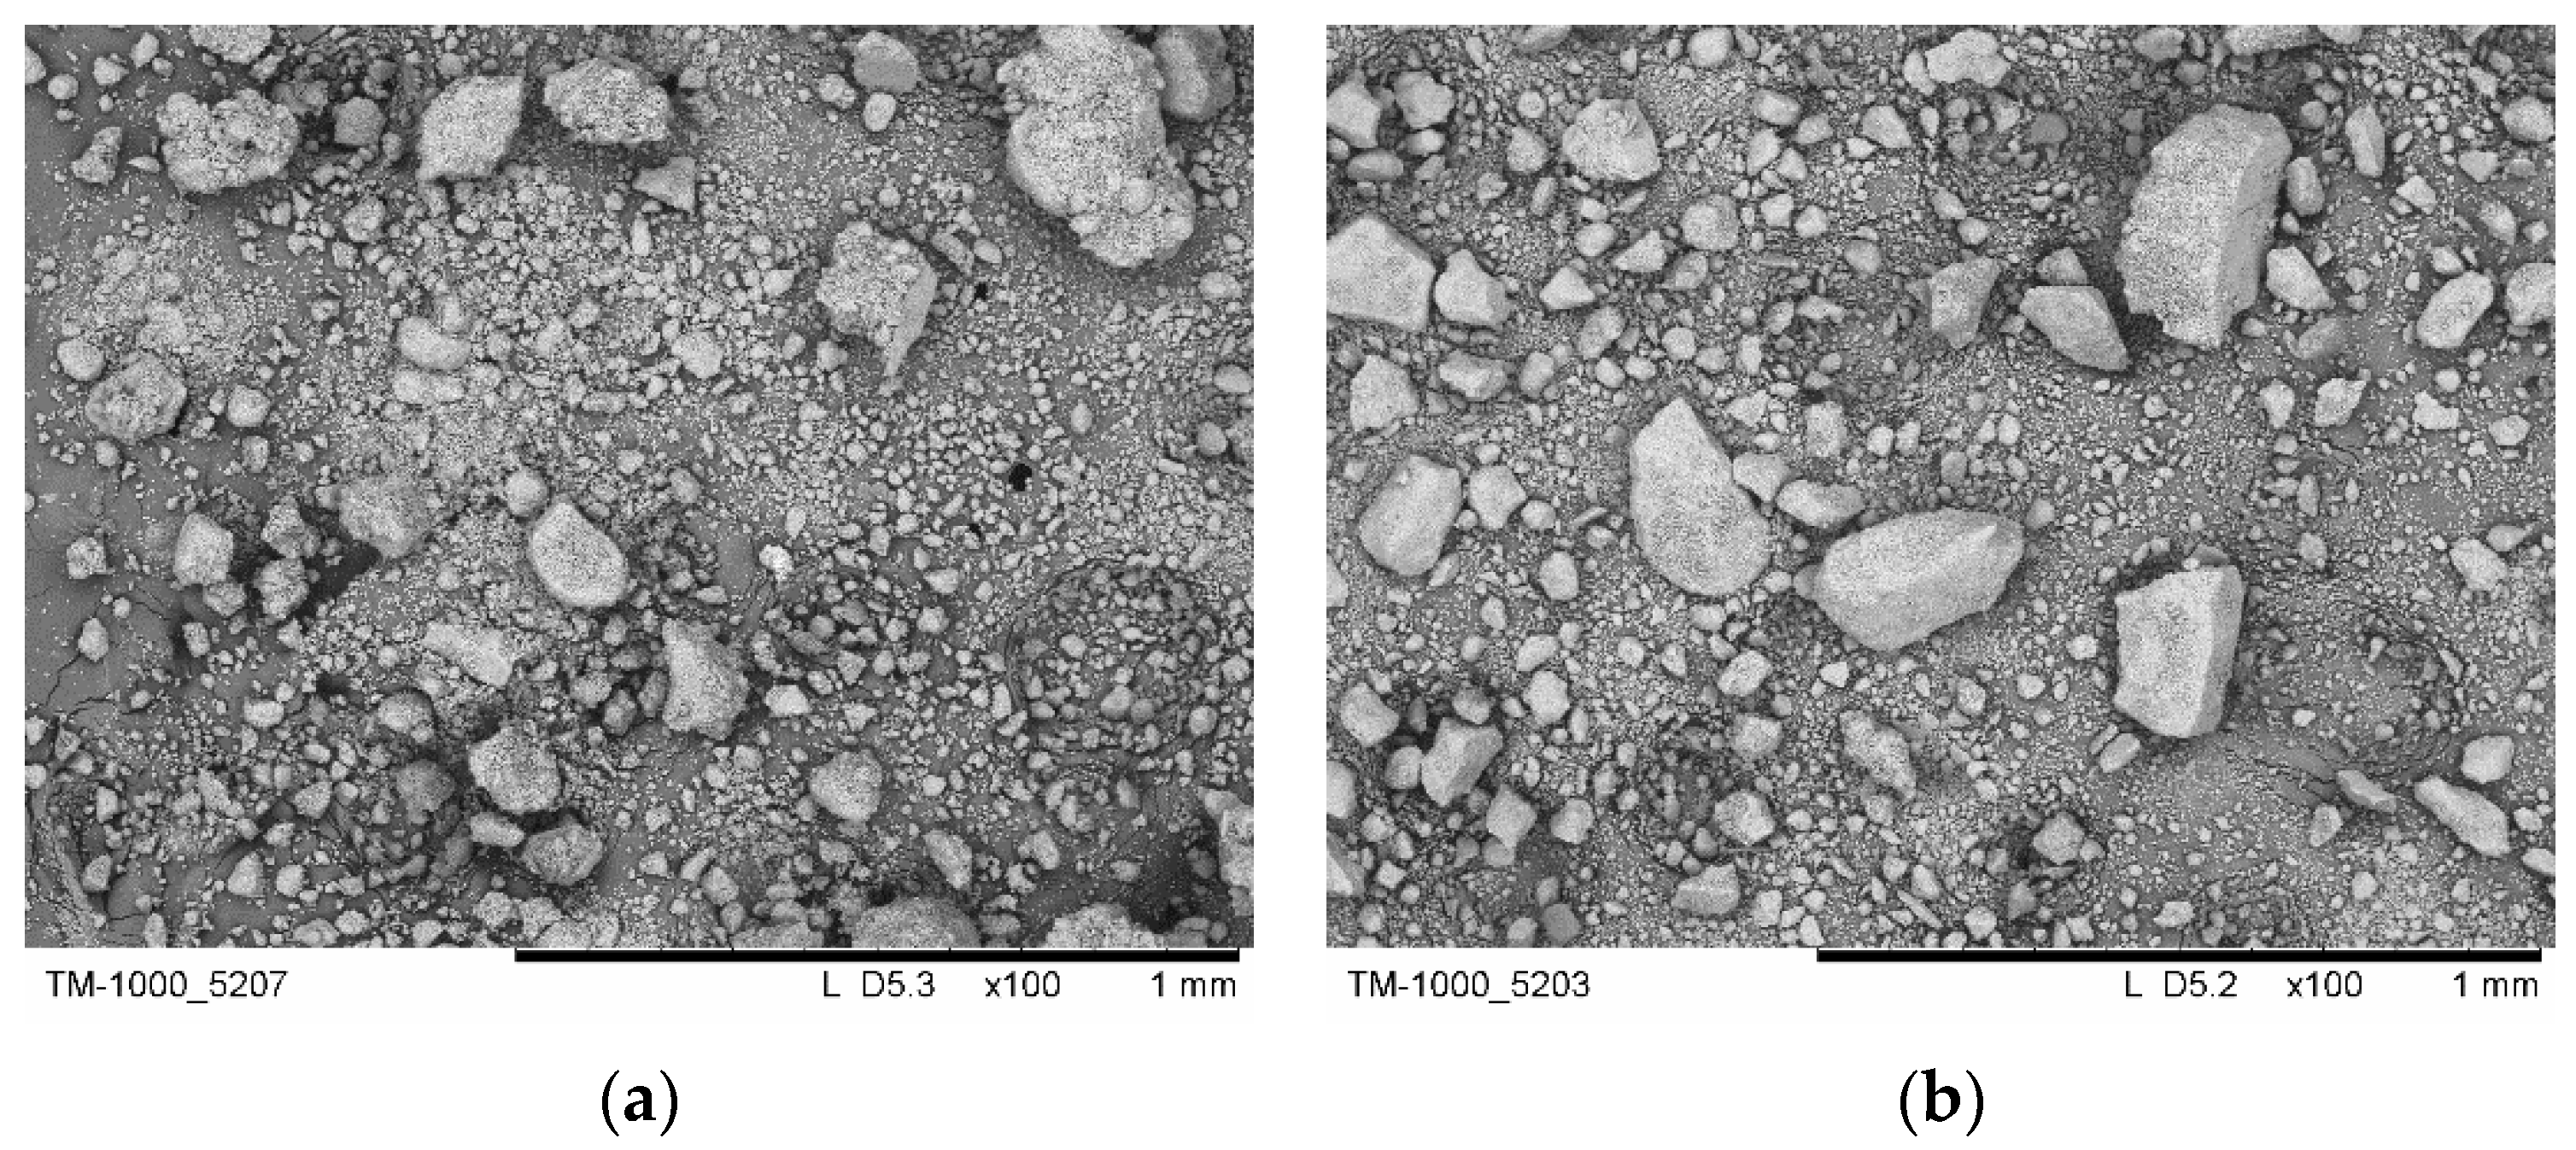
3.1. SEM Investigation

Figure 1 illustrates the images of particles of samples A (annealing in air) and B (annealing in vacuum). The samples consisted of dense, irregularly shaped particles, typical of the mechanochemical synthesis process [39]. Approximately the same size of particles was observed in samples A and B. The size ranged from 1 μm to 300 μm. From Figure 1, it can be concluded that the atmosphere in which HA powder is heated does not affect the morphology of the cooled particles.

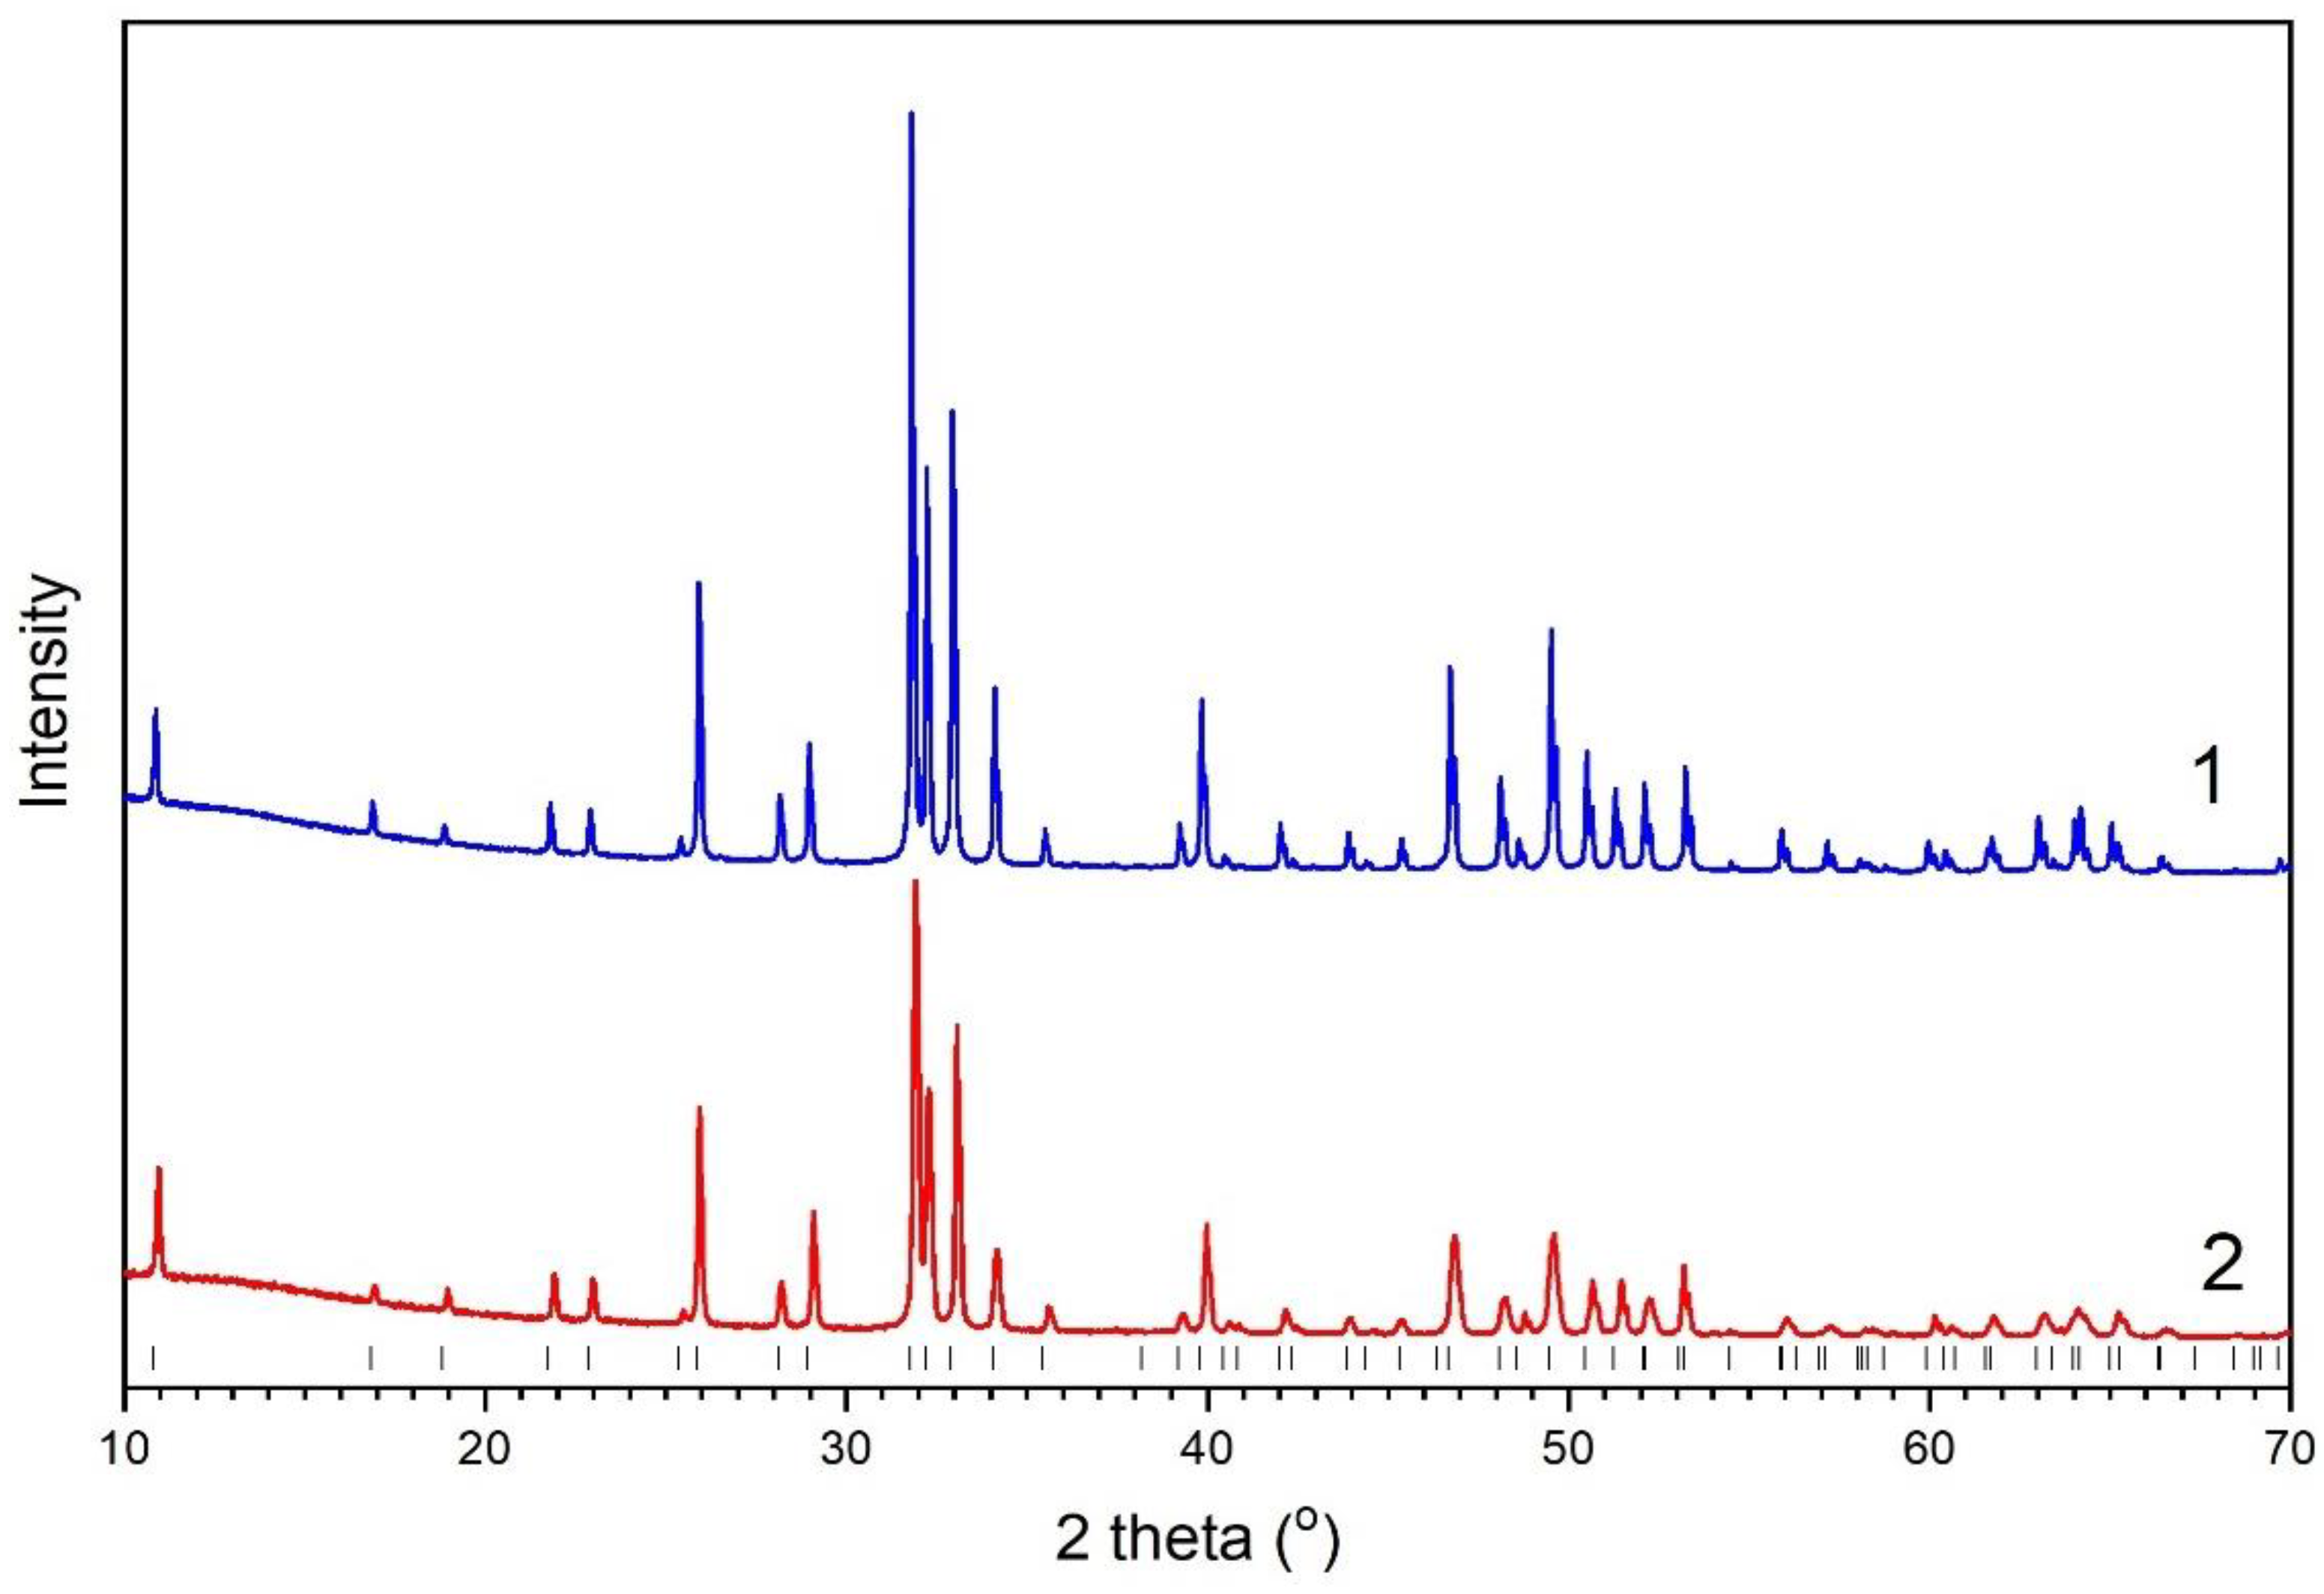
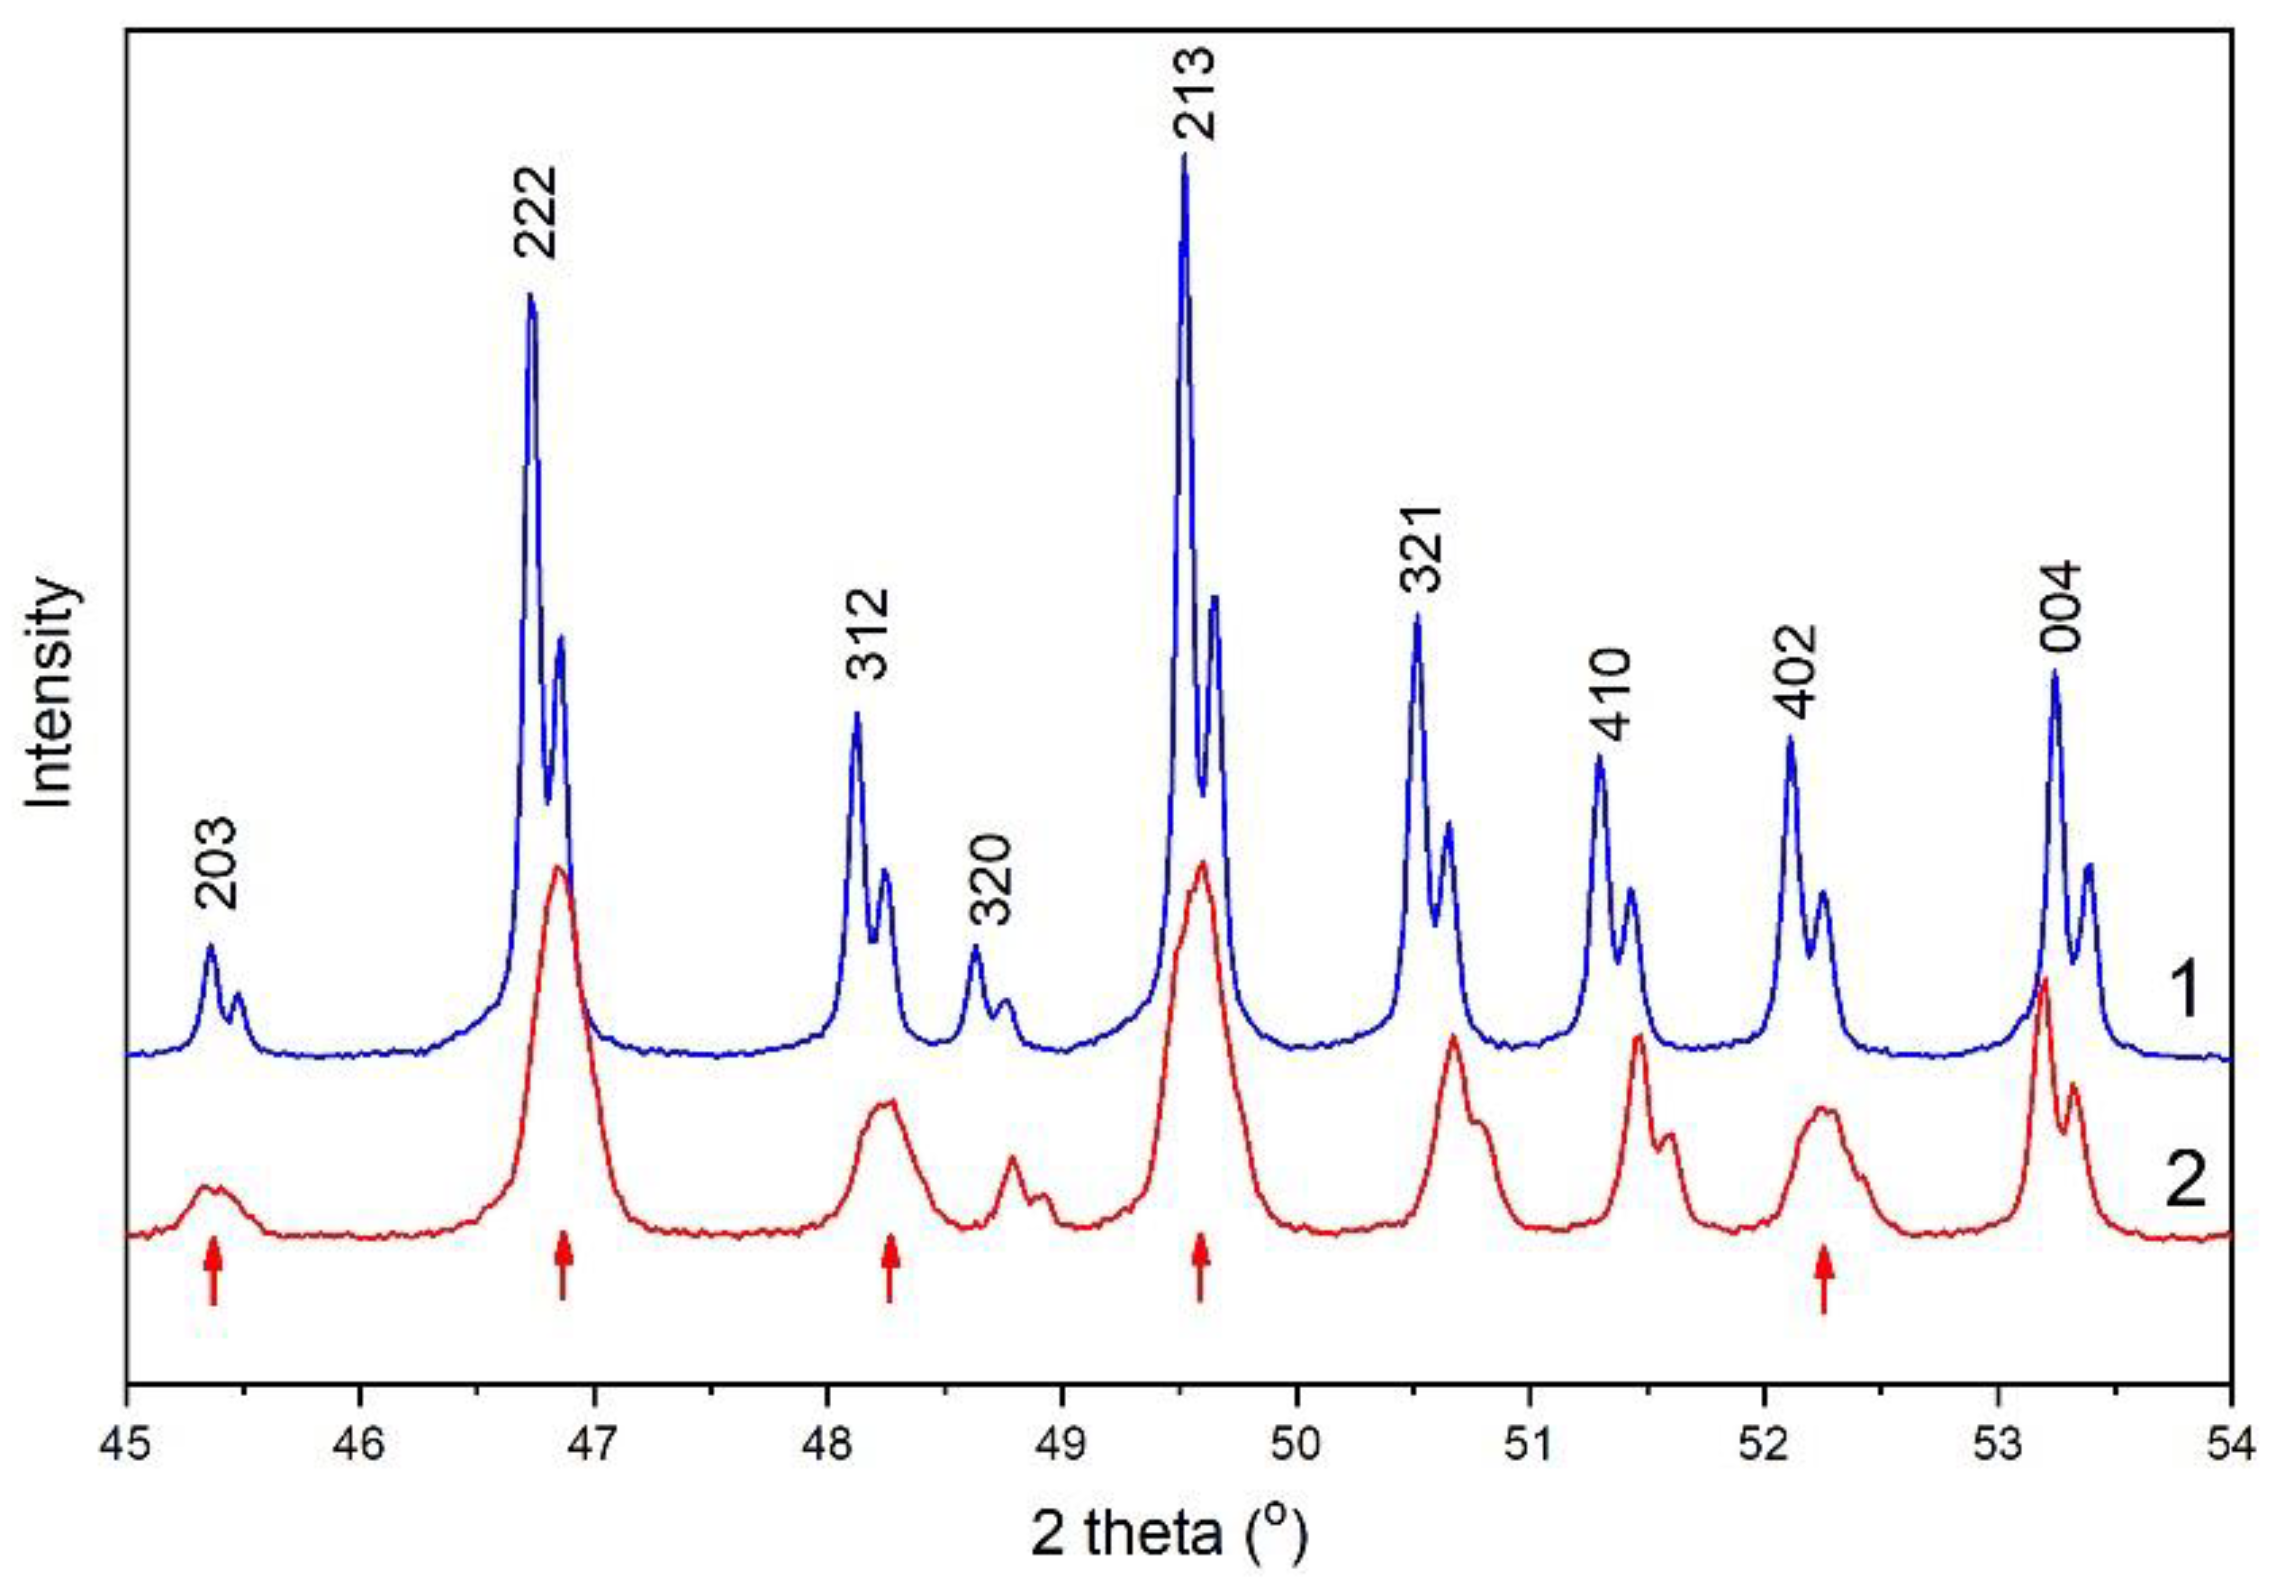
3.2. Powder Diffraction

The PXRD data showed that the samples annealed in air and vacuum were the same (Figure 2). All reflections belonged to the HA phase (card PDF 000-09-0432) with hexagonal symmetry P63/m. At the same time, these samples had different lattice parameters and crystallite sizes (Table 2). The sample annealed in air had parameters corresponding to the stoichiometric HA [17], but the sample heated under vacuum had a smaller value of the a parameter and a larger value of the c parameter. The unit cell volume for sample B decreased by approximately 1 Å3 and the crystallite size was reduced twice due to heating in vacuum. At the same time, reliability factors Rwp and GOF for the refinement of the unit cell parameters of sample B were significantly worse than for sample A. Refinement of the parameters in space group P 6 ¯ did not give a significant improvement of reliability factors.
Figure 3 shows that, in the case of heating in a vacuum condition, broadening and shifting of some reflections were observed. The reason may be the splitting of the reflections as a result of lattice distortion, as proposed by Henning et al. [29]. Based on synchrotron PXRD data, the authors established that the structure of the material with a high degree of dehydroxylation lowered the symmetry to triclinic phase and could be determined in space group P 1 ¯ [29]. In our case, the lattice parameters for sample B, refined in space group P 1 ¯ (Table 3), had a slight deviation from the values obtained for the hexagonal setting (Table 2). Table 3 shows that, in the trigonal settings for sample B, the a and b parameters differed from each other, α and β angles had a little deviation from 90°, γ angle was almost equal to 120°, and reliability factors had lower values than in the case of other settings. The region of 46–54°2θ of the Rietveld refinement plot in the different space groups is shown in Figure S1.

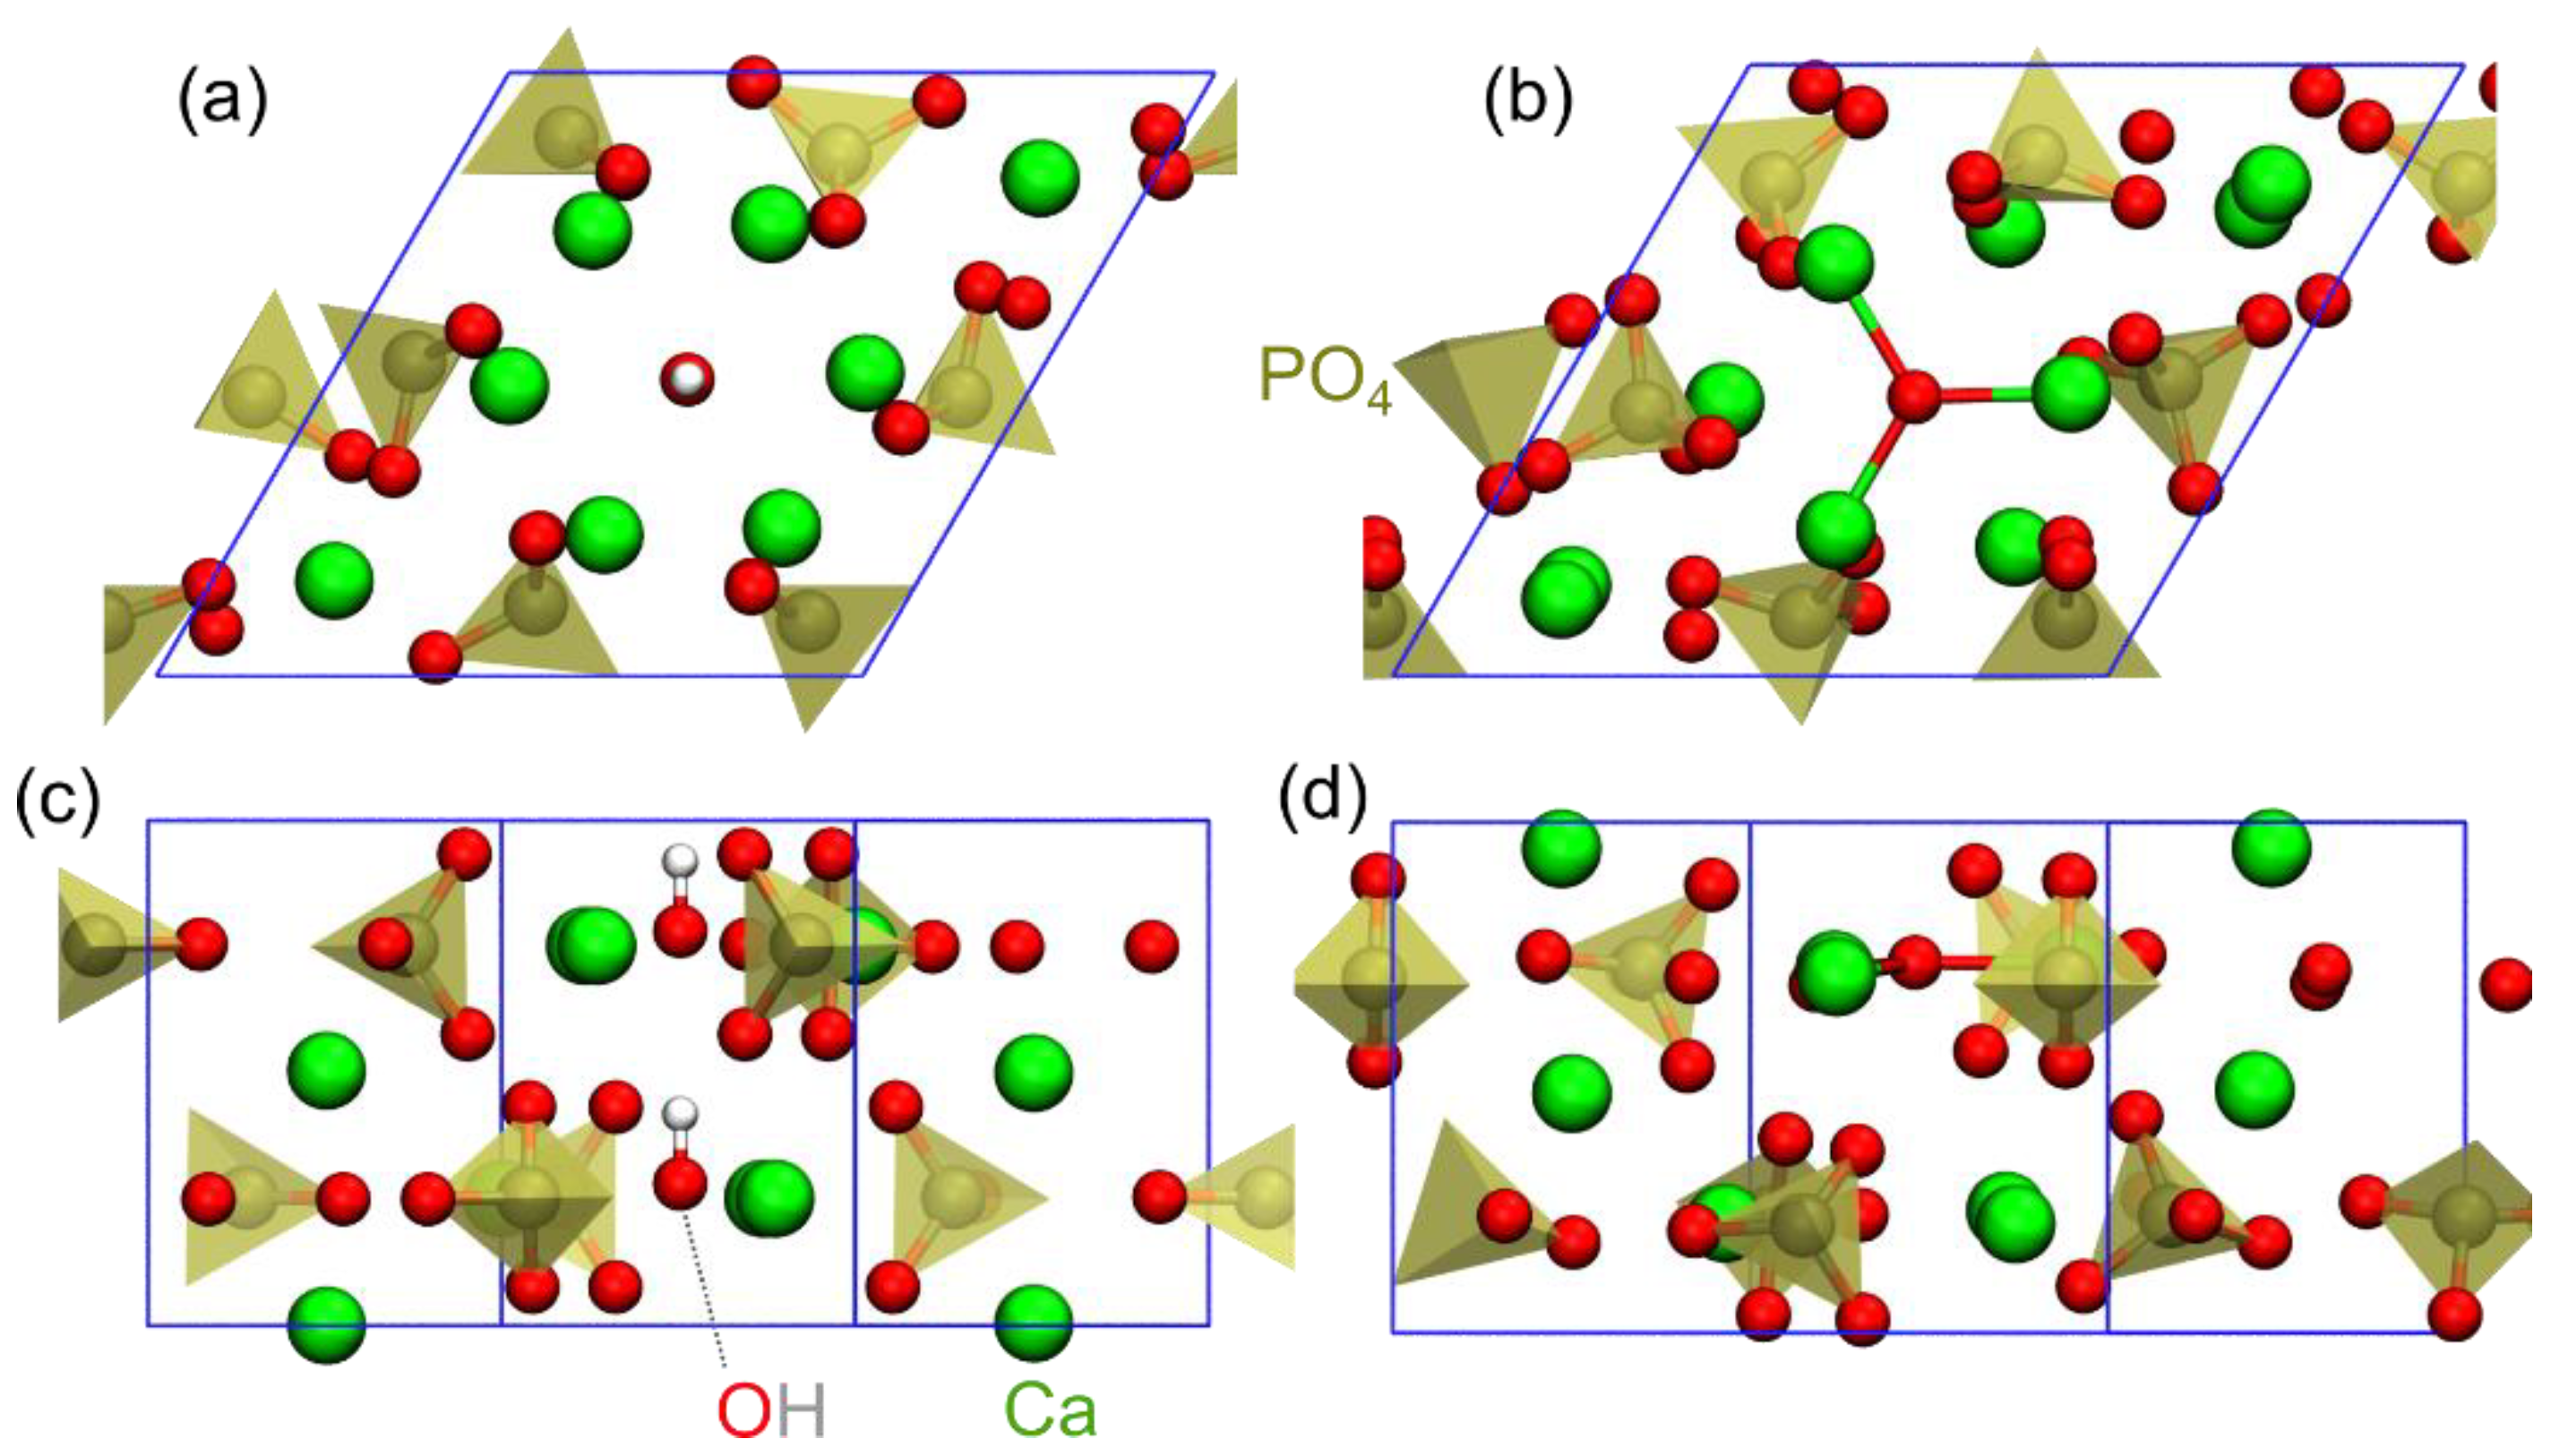
3.3. DFT Study of Crystal Structures

The perfect HA crystal has a hexagonal unit cell which contains 44 atoms, namely, ten calcium atoms, six phosphate tetrahedrons and two hydroxyl groups. The OH groups are placed in a one-dimensional channel with walls formed by Ca cations. Each OH group is located in the center of the calcium triangle with a slight offset from the plane of the triangle [15].
For OA, we consider the atomic model obtained from the HA unit cell by removing two OH groups and placing a single O atom in the calcium channel. This corresponds to a fully dehydrated HA with x = 1 in Equation (1). The relaxation of the OA structure may depend on the initial position of the added O atom. We considered several initial configurations for this atom and found that the lowest potential energy was achieved for the position of O in the vicinity of the positions of one of the OH groups (c/4 or 3c/4), not between the two OH groups (c/2). Sometimes we observed spontaneous transitions from the c/2 site to c/4. Therefore, the most favorable position of the oxygen ion when there was only one oxygen ion in the channel (a vacancy instead of a second one), was in the center of the calcium triangle. This result was consistent with those obtained by other authors [14].
Note that there were several local minima in the potential energy surface for OA, which depended on the selection of the initial cell geometry. The structures obtained starting from HA cell parameters and from parameters for sample B (Table 2) resulted in the formation of enthalpies ~0.1 eV higher than the lowest results, which points to their instabilities. The lowest energy configuration was achieved after successive application of PBE- functional and HSE-level relaxations. On the first step, the relaxation was performed at PBE level without fixation of hexagonal symmetry. On the second step, the triclinic cell obtained was symmetrized to hexagonal and relaxed using HSE functional. The differences between triclinic and hexagonal crystal properties (both obtained at HSE level) were subtle (~0.01 Å for cell parameters, ~0.1° for cell angles and ~0.01 eV/cell for formation enthalpies), so we reported the results for the hexagonal cell.
Table 4 presents the results of the relaxation of atomic structures for HA and OA models. Additionally, we considered the hypothetical structure of HA with an empty OH channel (Ca5(PO4)3), denoted as “HA w/o OH”. This structure is also considered as a probable configuration of HA surface layers in a hydrogen-poor environment [40]. The charge neutrality of such a cell is preserved by the trapping of two electrons. The structural data of the structures simulated are available in the Supplementary Materials. The cell parameters reported in Table 4 for HA were in good agreement with experimental values for sample A (Table 2), the bulk modulus was close to the reference value of 89 GPa, and the enthalpy of formation was underestimated only by 8% [41].
The consideration of enthalpies of formation (Table 4) showed that in abundance of hydrogen, HA will be formed. In the absence of hydrogen, the formation of OA was more preferable than HA without OHs. The last enthalpy of formation was close to that of other tricalcium phosphates (TCPs) [13], so that a structure with an empty OH channel, as expected, was not stable with respect to the phase transition to TCPs, according to reactions (3) and (4).
The cell parameters obtained for OA (Table 4) agreed well with those measured for sample B (Table 2). In addition, the lattice parameter dynamics for the transition from HA to OA, observed in the experimental data (Table 2), were repeated for the calculated data (Table 4): the value of c increased and a decreased upon transition from HA to OA (from sample A to sample B). This fact suggests the feasibility of the OA atomic model.
Figure 4 compares atomic structures of HA and OA obtained as a result of DFT simulations. The main difference between the structures was the formation of Ca–O bonds with a length of ~2.15 Å in the hexagonal calcium channel (in bulk CaO and in HA, this length is ~2.5 Å). The bonds are formed between the oxygen and calcium triangle in the center of which it is located. In order to consider the bonding character, we considered the electron localization functions, ELF [42,43], which are the spatial dimensionless quantities, 0 < ELF < 1. The values of ELF of about 0.5 correspond to regions where electrons are delocalized, such as in a homogeneous gas; the values of ELF close to 0 correspond to an electron depletion region; and close to 1, to an electron gathering region. The consideration of ELF for the OA model showed (Figure S2) that the ELF distribution near Ca cations that were close to the O anion in the channel was practically the same as near other Ca cations. This means that a strong covalent bond was not formed and the bond nature was mostly ionic. This conclusion was also supported by charge transfer analysis and bond lengths considerations. However, the presence of the O anion in the channel led to the contraction of the calcium triangle (Figure 4b). The next lower lying calcium triangle had no oxygen at the center (there was a vacancy), and as a result, the triangle expanded. In this regard, Ca triangles, which were identical in symmetry in HA, became nonequivalent in OA. Noteworthy were the rotations of PO4 groups in response to changes in the calcium channel. The phosphorus sites were also not equivalent in OA, in contrast to HA. This led to a decrease in the symmetry from P63/m to P1, which was consistent with the PXRD data.

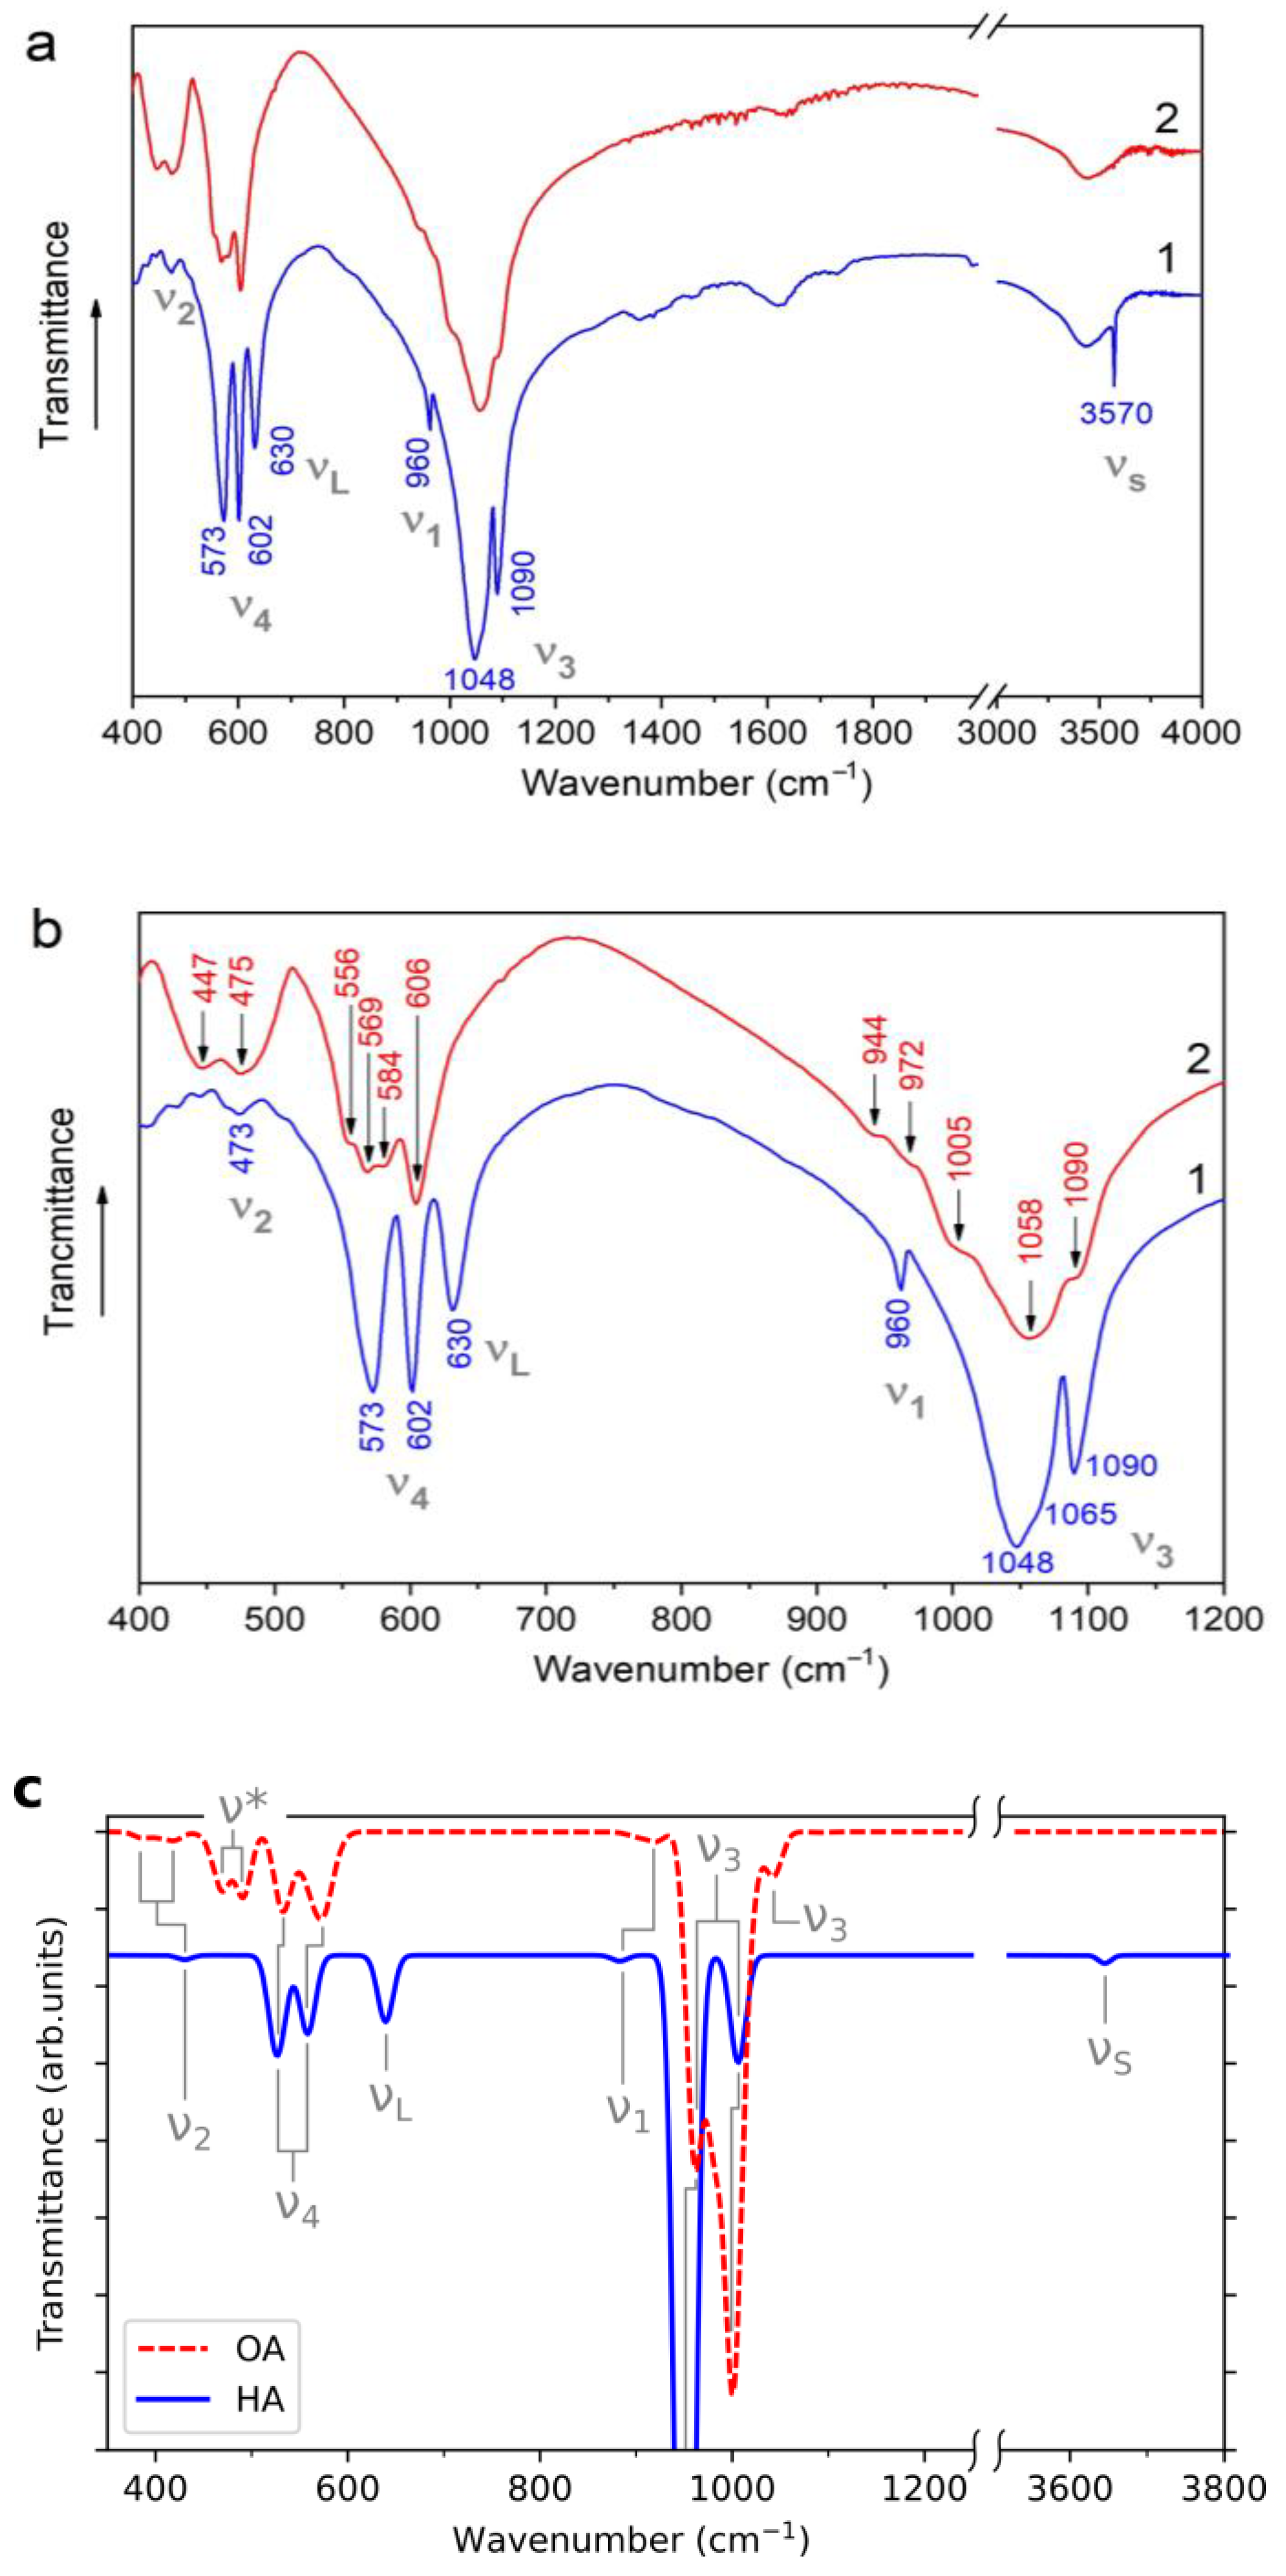
3.4. IR Spectroscopy

Figure 5a,b presents experimentally observed IR spectra of the samples obtained. The spectrum of sample A annealed in air contained absorption bands corresponding to the stoichiometric HA [15], namely, vibrations of PO4 tetrahedrons and hydroxyl groups (Table 5). The classification of vibrations can be considered on the basis of the isolated perfect PO4 tetrahedron, which exhibits four vibration modes [44]: ν1—symmetrical stretching, ν2—symmetrical bending, ν3—asymmetrical stretching and ν4—asymmetrical bending. The first two modes are doubly degenerate and IR silent, while the last two—triply degenerate and IR active. In a crystal, some modes may split and shift due to symmetry decrease and modes ν1 and ν2 may become IR active. Vibrations of the hydroxyl group are of two types: νS—stretching of O–H bond and νL—libration of the group [45]. In addition to the absorption bands of the phosphate tetrahedron and hydroxyl group, the IR spectrum of sample A contained a wide absorption band of water at 1624 and 3432 cm−1, which were the result of sample preparation (sorption of water by KBr).
A comparison of the experimentally observed IR spectra of sample A and sample B indicated that νL and νS vibrations of the hydroxyl group were absent in the spectrum of hydrated sample B (Figure 5a,b). This was consistent with the assumption made on the basis of the PXRD data that sample B was OA. In addition, there were splittings and shifts of the absorption bands of the phosphate ion (Table 5), that point to changes in the nearest environment.
To identify new absorption bands observed in the IR spectrum of sample B, we simulated the IR spectra of HA and OA atomic models (Figure 5c). The peaks observed were then compared with the modes of vibrations and mapping was performed (Table 5) using consideration of the calculated atom displacements.
The spectrum calculated for the HA model well reproduced the experimentally observed bands for sample A. The width of the bands was not reproduced since constant 1 meV smearing was used for calculations, and the systematic shift between theoretical and experimental positions of the bands was mentioned by other authors [45,46].
The OH libration and stretching modes were not observed in the simulated spectra of OA. Comparing the experimental IR spectrum of sample B and the simulated OA spectrum, we made the following band attribution for the experimental spectrum. The bands at 447 and 475 cm−1 in the spectrum of sample B (denoted as ν* in Figure 5 and Table 5) originated from the vibrations of the O atom located in the channel at the center of the calcium triangle. The wide ν1 band contained two components: a component observed for sample B at 944 and 972 cm−1, and the one calculated for the OA model at 900 and 920 cm−1. Such splitting was absent in spectra for sample A and for the HA model. According to Elliot [15] such splitting of ν1 band of PO4 is one of distinguishing features of OA. This splitting was the evidence for symmetry non-equivalence of PO4 groups in sample B, which was expected for OA.

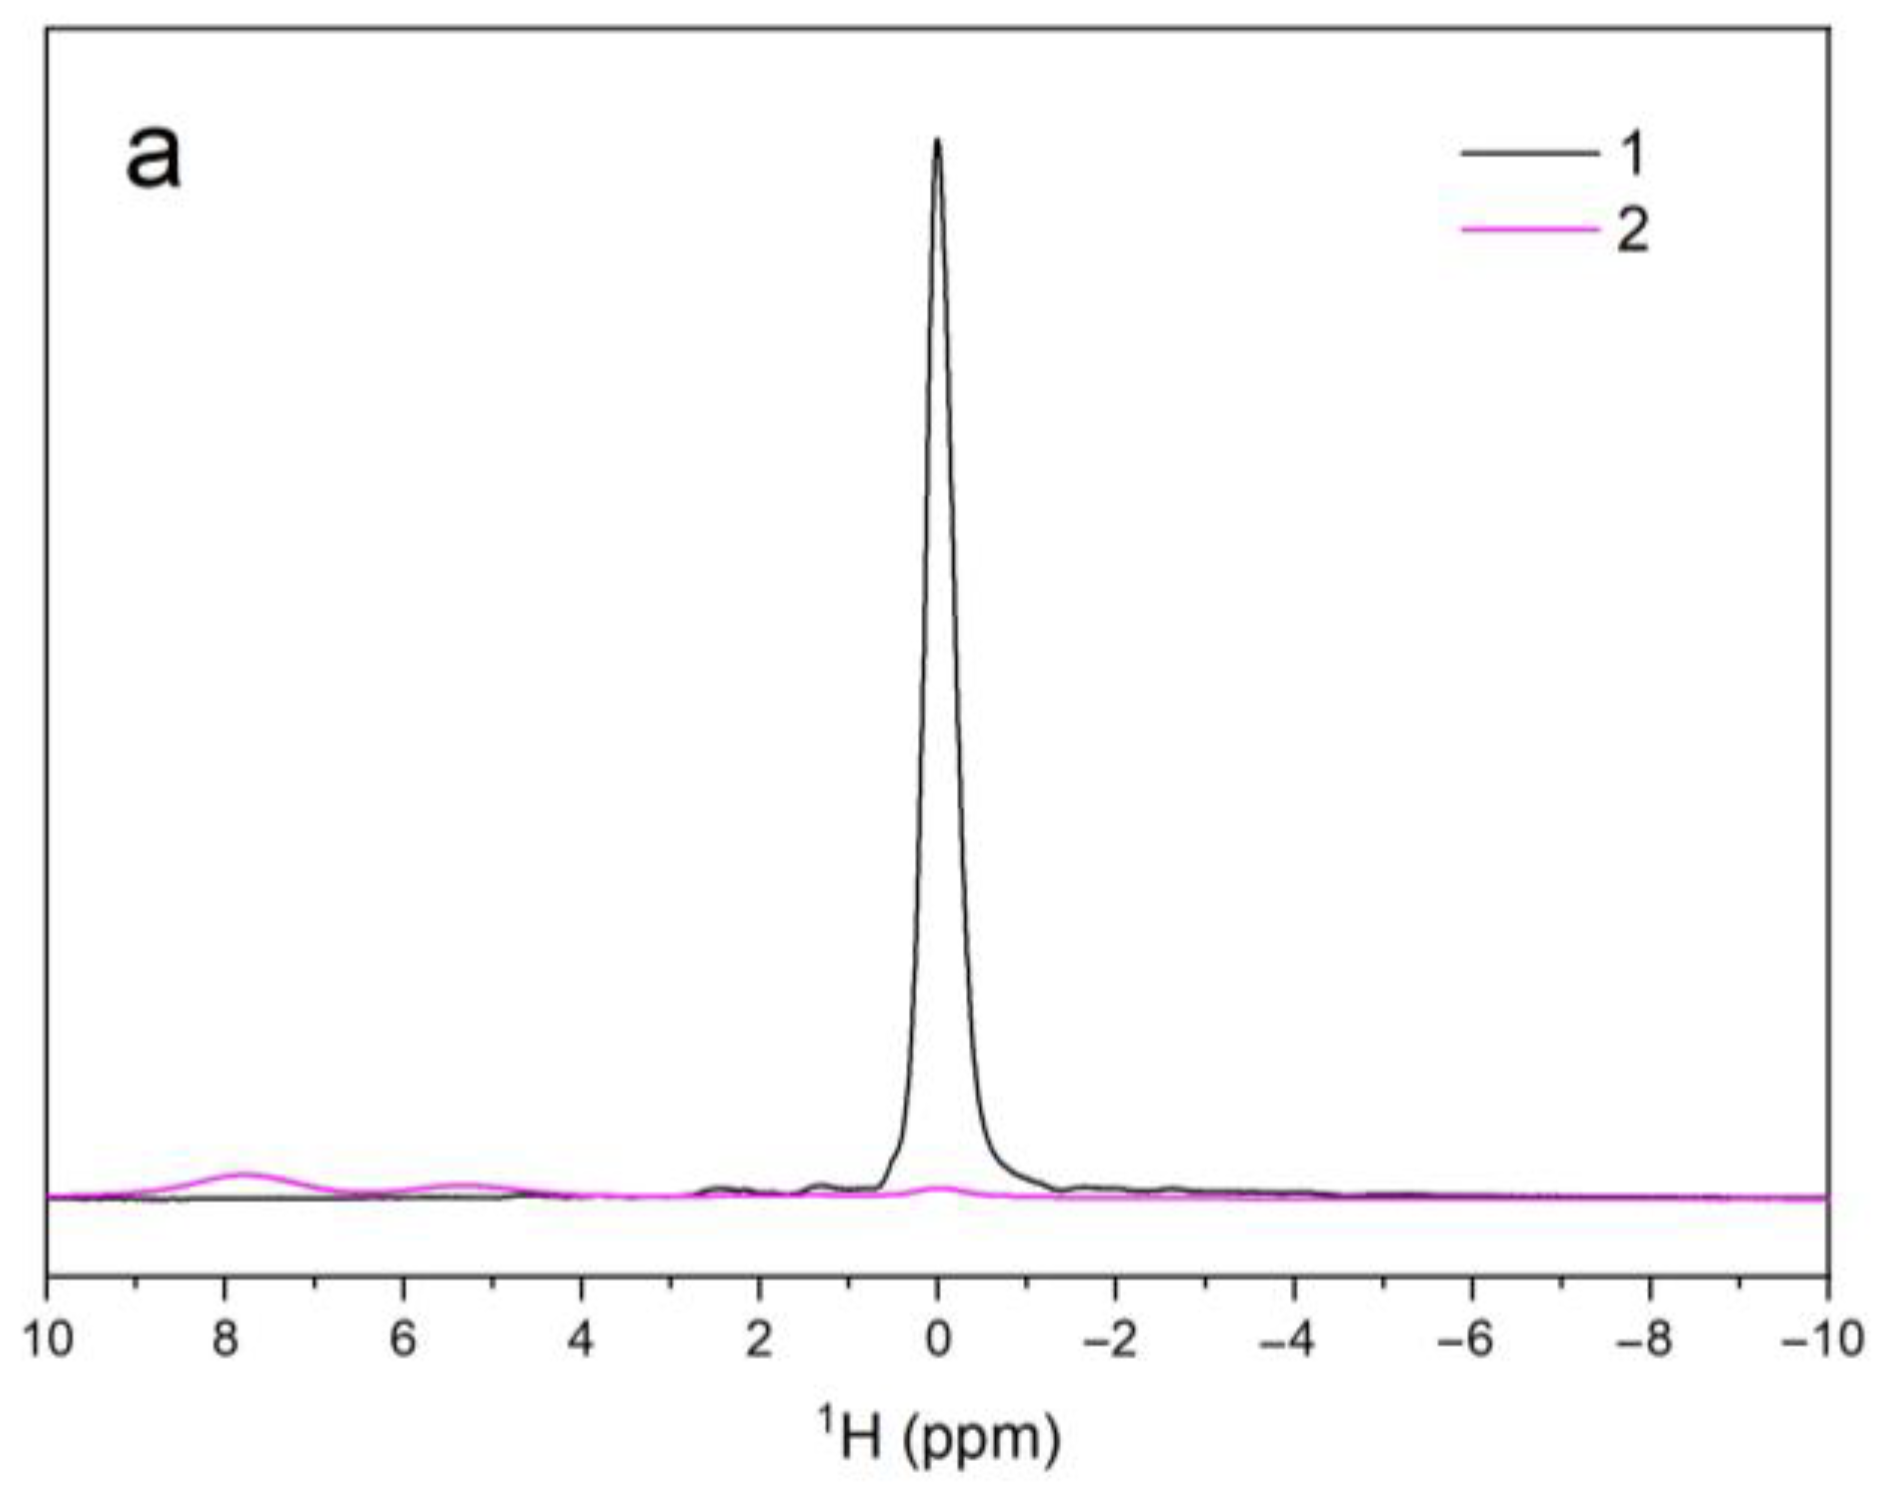
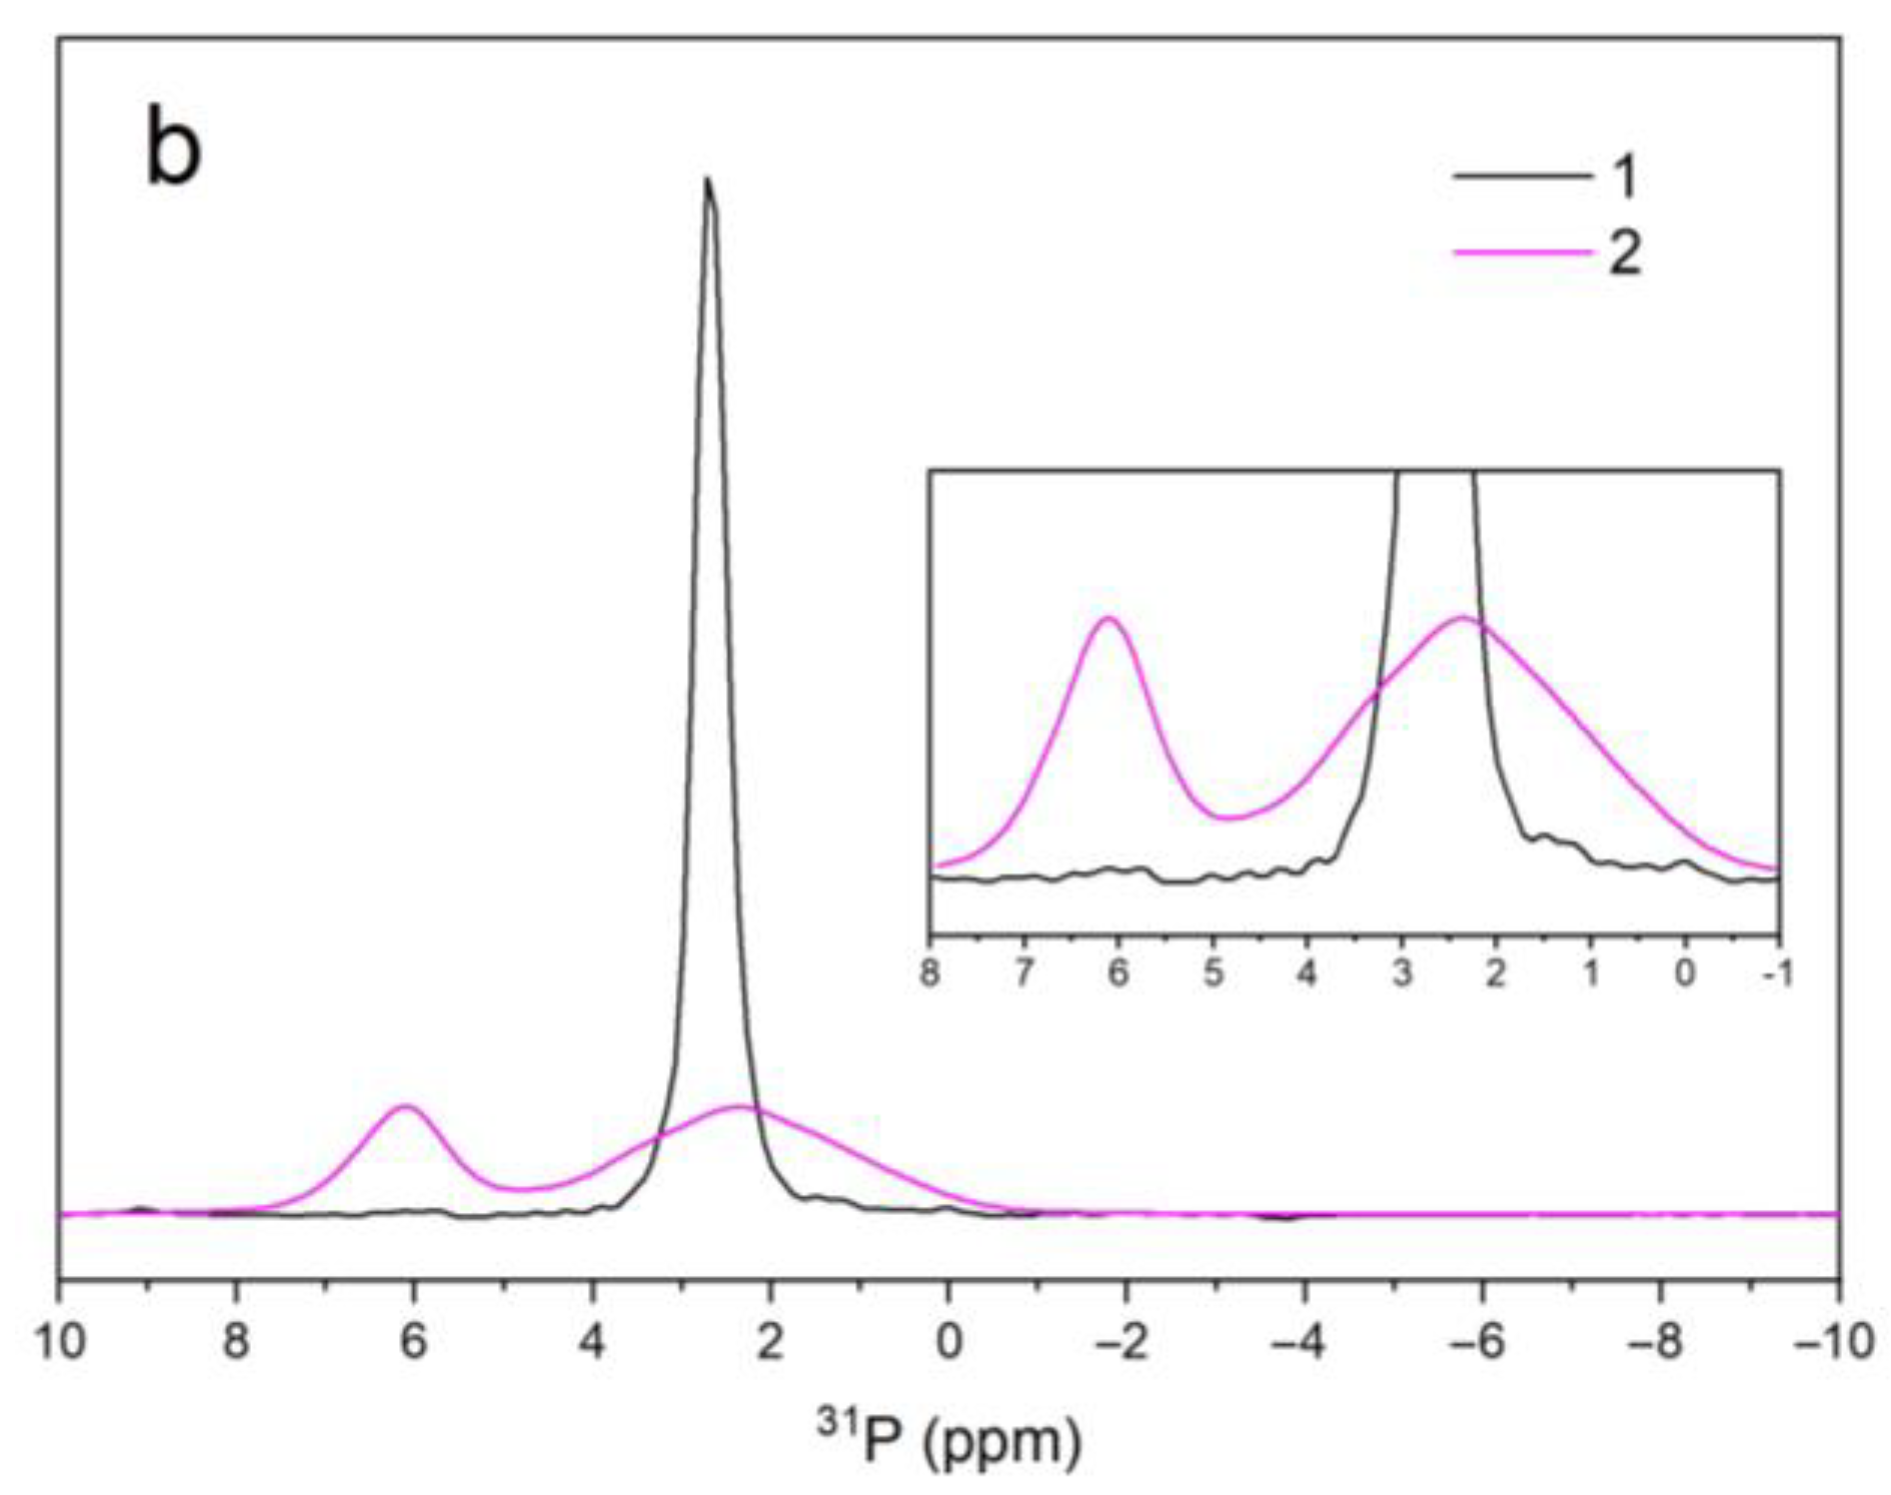
3.5. NMR Spectroscopy
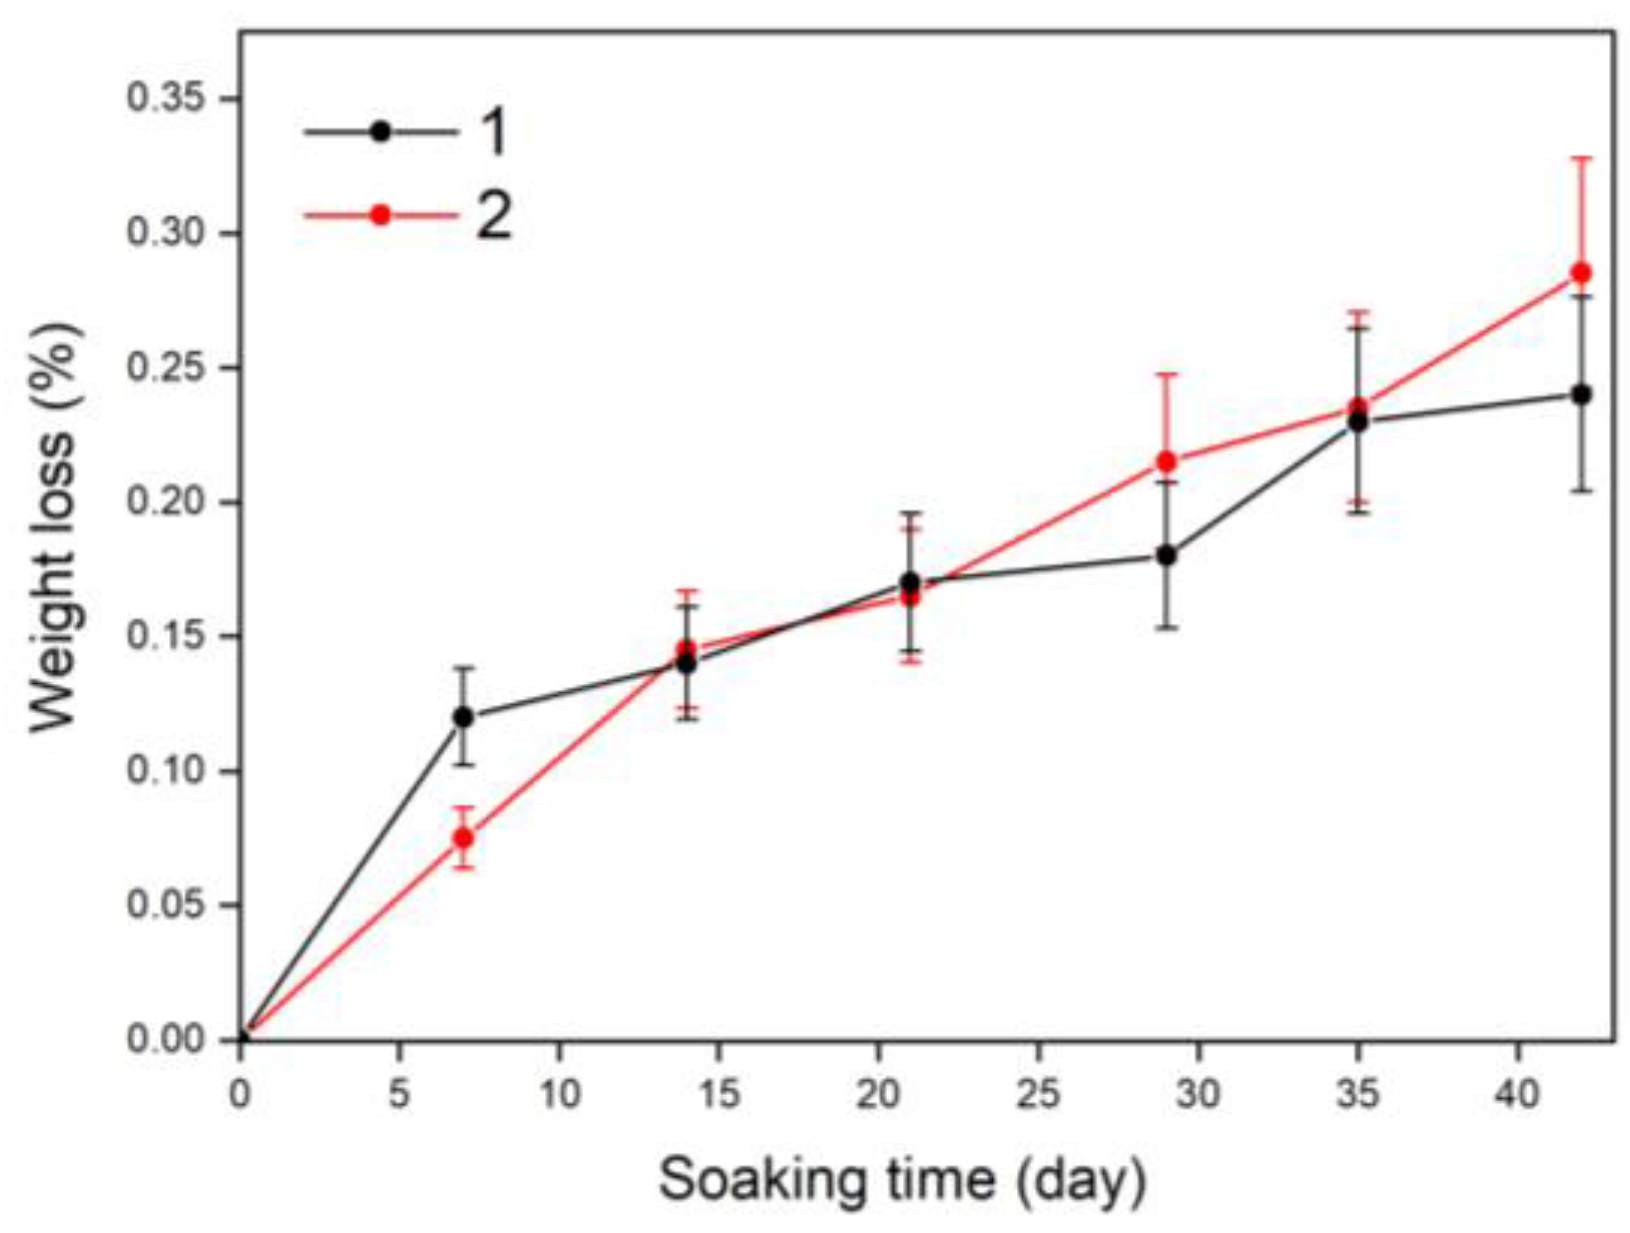
NMR spectra of synthesized samples are presented in Figure 6. The NMR parameters of the lines observed are given in Table 6. The fitting of lines observed was carried out in accordance with the literature data [47,48,49].
1H MAS NMR spectrum of sample A (Figure 6a) contained only one signal corresponding to the hydroxyl group in HA [47,48,49]. The same line was present in sample B (δiso = 0.02 ppm), but its area was 1% of the area observed in sample A (Table 6). In addition to this barely noticeable line, the spectrum of sample B also contained weak lines at 5.29 and 7.80 ppm. The same lines, but very intensive, were observed by Hartmann et al. [48] in the spectrum of OHA, obtained by the heating of HA up to 1280 °C. Based on 2D double-quantum correlation spectra, the authors established that lines at 5.29 and 7.80 ppm arise from OH groups, which are adjacent to vacancies. It is likely that line 5.29 ppm represents OH positions missing only one neighboring hydroxyl ion, whereas line 7.80 ppm is the signal of isolated OH groups in the channel. In our case, the total area of three signals observed in the 1H spectrum of sample B was only 8% of the area of the signal from the hydroxyl group observed in sample A. This led us to believe that the amount of hydroxyl groups in sample B was very low, and that these groups were most likely present in the surface layer of the particles due to the rehydroxylation in the air. The amount of OH groups should decrease with depth: so that the uppermost layer contains the hexagonal channel completely filled with OH groups with the signal at 0.02 ppm; then the layer of alternating vacancies and OH with the signal at 5.29 ppm; followed by a layer in which isolated OH groups are far apart; the central part (the major part) of the particle does not contain hydroxyl groups.
The intense quite narrow signal of HA phosphate tetrahedra [48] at 2.27 ppm was observed in the 31P NMR spectrum of sample A (Figure 6b). In sample B, this line widened considerably and became a superposition of three lines (see inset in Figure 6b) with an average value of 6.11 ppm. In addition, a new line appeared at 6.11 ppm. The shape of the sample B spectrum was the same as for the OHA spectrum given in [48,50]. Two dimensional double-quantum correlation spectra made it possible to determine that all these NMR lines belonged to the phosphate tetrahedrons with different degrees of distortion due to vacancies [48].

3.6. Solubility

Figure 7 shows that the weight loss for both samples on soaking in water was approximately identical. The amount of dissolved material increased over time. The average solubility was 0.003 g/L for sample A and 0.004 g/L for sample B. Apparently, when OA is placed in water, intensive dehydroxylation occurs, resulting in the transformation of OA into HA, so all samples become identical. The values of solubility obtained in our case significantly differed from the literature data for HA (~0.0003 g/L) and OA (~0.087 g/L) [5]. Solubility is largely affected by the conditions for the preparation of the sample (particle size, density, temperature of calcination), therefore, a comparison of values can be carried out for only samples tested under identical conditions, as in our case.

4. Conclusions

In this work, a powder of oxyapatite (OA) was obtained, which is a product of the dehydroxylation of HA. The absence of hydroxyl groups in the material was shown by IR and NMR spectroscopy. According to powder X-ray diffraction data, the dehydroxylated sample showed a decrease in symmetry to triclinic. NMR data indicated distortion of the environment of the phosphate tetrahedra. At least two variants of the environment of phosphorus atoms were observed. The experimentally recorded IR spectra of OA also revealed significant changes in the nearest environment of phosphate tetrahedra. In the OA spectrum, splitting and shift of the absorption bands of the phosphate group were observed. To identify the observed absorption bands, the OA structure was optimized and the IR spectrum was simulated for the structure obtained.
Density functional theory modeling confirmed lowering of symmetry for the OA due to the presence of an OH vacancy and O atom in the channel formed by Ca cations. The new absorption bands at 447 and 475 cm−1 were due to vibration of the O atom in the channel in the plane of three neighboring Ca atoms (correspondingly, 470 and 490 cm−1 were calculated for the OA model). The wide vibration band ν1 contained two components: a component experimentally observed for the dehydroxylated sample (corresponding to OA) at 944 and 972 cm−1, and a component calculated for the OA model at 900 and 920 cm−1. The same splitting of ν1 band of PO4 is a distinguishing feature of OA.
The cell parameters modelled for OA agreed well with those measured for the dehydroxylated sample: the value of c increased and a decreased upon transition from HA to OA. This points to the feasibility of the OA atomic model.
Comparison of the formation energies showed the benefit of HA phase formation over other considered phases. In extreme hydrogen-poor conditions, when there are no H atoms in the material, the OA phase was most stable, with formation energy higher than the HA phase, by ~5 eV/cell. Other hydrogen-free phases, namely, tricalcium phosphate (TCP) and “HA without OH” have a higher formation energy value by ~10 eV/cell, than the value for HA. The similarity of TCP and “HA without OH” leads to the expected instability of the structure with an empty OH channel with respect to the phase transition to TCP. Thus, among the phases without hydrogen, the OA phase is the most favorable.
The trial studies showed that the solubility of OA in water was comparable to that of HA, which we attributed to the conversion of OA to HA in an aqueous environment. This observation indicates that OA probably has the same bioresorption properties as HA and requires further more detailed research.

Supplementary Materials

The following supporting information can be downloaded at: https://www.mdpi.com/article/10.3390/min13010102/s1, Figure S1: Rietveld refinement for sample B in space group P63/m, P 6 ¯ and P 1 ¯ ; Figure S2: The electron localization function (ELF) maps for OA model; Table S1: Results of element analysis obtained by X-ray fluorescent spectroscopy; simulated atomic structures for HA (HA.cif), OA (OA.cif) and HA with empty OH channel (HA_no_OHs.cif).

Author Contributions

Conceptualization, V.S.B.; funding acquisition, V.S.B.; investigation, L.A.A., S.V.M. and I.B.O.; methodology, N.V.B. and V.S.B.; resources, L.A.A. and V.S.B.; software, L.A.A.; writing—original draft, N.V.B. and L.A.A.; writing—review and editing, V.S.B. All authors have read and agreed to the published version of the manuscript.

Funding

The study was supported by a grant from the Russian Science Foundation (RSF), no. 21-12-00251.

Data Availability Statement

The raw/processed data required to reproduce these results are included in Section 2.

Acknowledgments

The authors are grateful to Martynova S.A. (Novosibirsk Institute of Inorganic Chemistry SB RAS, Russia) for the measurement of IR spectra.

Conflicts of Interest

The authors declare no conflict of interest. The funders had no role in the design of the study; in the collection, analyses, or interpretation of data; in the writing of the manuscript; or in the decision to publish the results.

References

  1. Camaioni, A.; Cacciotti, I.; Campagnolo, L.; Bianco, A. 15—Silicon-substituted hydroxyapatite for biomedical applications. In Hydroxyapatite (Hap) for Biomedical Applications; Mucalo, M., Ed.; Woodhead Publishing: Cambridge, UK, 2015; pp. 343–373. [Google Scholar] [CrossRef]
  2. Turon, P.; del Valle, L.J.; Alemán, C.; Puiggalí, J. Biodegradable and Biocompatible Systems Based on Hydroxyapatite Nanoparticles. Appl. Sci. 2017, 7, 60. [Google Scholar] [CrossRef] [Green Version]
  3. Ghiasi, B.; Sefidbakht, Y.; Mozaffari-Jovin, S.; Gharehcheloo, B.; Mehrarya, M.; Khodadadi, A.; Rezaei, M.; Siadat, S.O.R.; Uskoković, V. Hydroxyapatite as a biomaterial—A gift that keeps on giving. Drug Dev. Ind. Pharm. 2020, 46, 1035–1062. [Google Scholar] [CrossRef] [PubMed]
  4. Siddiqui, H.A.; Pickering, K.L.; Mucalo, M.R. A Review on the use of hydroxyapatite-carbonaceous structure composites in bone replacement materials for strengthening purposes. Materials 2018, 11, 1813. [Google Scholar] [CrossRef] [PubMed] [Green Version]
  5. Dorozhkin, S.V. Calcium orthophosphate bioceramics. Ceram. Int. 2015, 41, 13913–13966. [Google Scholar] [CrossRef]
  6. Pasero, M.; Kampf, A.R.; Ferraris, C.; Pekov, I.V.; Rakovan, J.; White, T.J. Nomenclature of the apatite supergroup minerals. Eur. J. Miner. 2010, 22, 163–179. [Google Scholar] [CrossRef]
  7. Dorozhkin, S.V. Calcium orthophosphates. J. Mater. Sci. 2007, 42, 1061–1095. [Google Scholar] [CrossRef]
  8. Matsunaga, K.; Kuwabara, A. First-principles study of vacancy formation in hydroxyapatite. Phys. Rev. B 2007, 75, 014102. [Google Scholar] [CrossRef] [Green Version]
  9. Sadetskaya, A.V.; Bobrysheva, N.P.; Osmolowsky, M.G.; Osmolovskaya, O.M.; Voznesenskiy, M.A. Correlative experimental and theoretical characterization of transition metal doped hydroxyapatite nanoparticles fabricated by hydrothermal method. Mater. Charact. 2021, 173, 110911. [Google Scholar] [CrossRef]
  10. Terra, J.; Dourado, E.R.; Eon, J.-G.; Ellis, D.E.; Gonzalez, G.; Rossi, A.M. The structure of strontium-doped hydroxyapatite: An experimental and theoretical study. Phys. Chem. Chem. Phys. 2009, 11, 568–577. [Google Scholar] [CrossRef]
  11. Bystrov, V.; Paramonova, E.; Avakyan, L.; Coutinho, J.; Bulina, N. Simulation and Computer Study of Structures and Physical Properties of Hydroxyapatite with Various Defects. Nanomaterials 2021, 11, 2752. [Google Scholar] [CrossRef]
  12. Avakyan, L.A.; Paramonova, E.V.; Coutinho, J.; Öberg, S.; Bystrov, V.S.; Bugaev, L.A. Optoelectronics and defect levels in hydroxyapatite by first-principles. J. Chem. Phys. 2018, 148, 154706. [Google Scholar] [CrossRef] [PubMed] [Green Version]
  13. Avakyan, L.; Paramonova, E.; Bystrov, V.; Coutinho, J.; Gomes, S.; Renaudin, G. Iron in Hydroxyapatite: Interstitial or Substitution Sites? Nanomaterials 2021, 11, 2978. [Google Scholar] [CrossRef] [PubMed]
  14. Leeuw, N.H.; Bowe, J.R.; Rabone, J.A.L. A computational investigation of stoichiometric and calcium-deficient oxy- and hydroxy-apatites. Faraday Discuss. 2007, 134, 195–214. [Google Scholar] [CrossRef] [PubMed]
  15. Elliott, J.C. Structure and Chemistry of Apatite and Other Calcium Orthophosphates; Studies in Inorganic Chemistry; Elsevier: Amsterdam, The Netherlands, 1994; pp. 1–404. ISBN 0-444-81582-1. [Google Scholar]
  16. Champion, E. Sintering of calcium phosphate bioceramics. Acta Biomater. 2013, 9, 5855–5875. [Google Scholar] [CrossRef] [PubMed]
  17. Bulina, N.V.; Makarova, S.V.; Baev, S.G.; Matvienko, A.A.; Gerasimov, K.B.; Logutenko, O.A.; Bystrov, V.S. A Study of Thermal Stability of Hydroxyapatite. Minerals 2021, 11, 1310. [Google Scholar] [CrossRef]
  18. Tõnsuaadu, K.; Gross, K.A.; Plūduma, L.; Veiderma, M. A review on the thermal stability of calcium apatites. J. Therm. Anal. Calorim. 2012, 110, 647–659. [Google Scholar] [CrossRef]
  19. Tanaka, H.; Chikazawa, M.; Kandori, K.; Ishikawa, T. Influence of thermal treatment on the structure of calcium hydroxyapatite. Phys. Chem. Chem. Phys. 2000, 2, 2647–2650. [Google Scholar] [CrossRef]
  20. Kanazawa, T. Inorganic Phosphate Materials. In Materials Science Monographs; Elsevier: Amsterdam, The Netherlands, 1989; Volume 52, ISSN 0166-6010. [Google Scholar]
  21. Trombe, J.C.; Montel, G. Some features of the incorporation of oxygen in different oxidation states in the apatitic lattice—I On the existence of calcium and strontium oxyapatites. J. Inorg. Nucl. Chem. 1978, 40, 15–21. [Google Scholar] [CrossRef]
  22. Sakka, S.; Bouaziz, J.; Ben, F. Mechanical Properties of Biomaterials Based on Calcium Phosphates and Bioinert Oxides for Applications in Biomedicine. In Advances in Biomaterials Science and Biomedical Applications; Pignatello, R., Ed.; InTech: Rijeka, Croatia, 2013; pp. 23–50. [Google Scholar] [CrossRef]
  23. Saad, B.H.F. 2—Structure, microstructure, and properties of bioceramics. In Bioceramics: For Materials Science and Engineering; Woodhead Publishing: Sawston, UK; Elsevier: Amsterdam, The Netherlands, 2019; pp. 39–76. [Google Scholar] [CrossRef]
  24. Bredig, M.A.; Frank, H.H.; Füldner, H. Beiträge zur kenntnis der kalk-phosphorsaure-verbindungen II. Z. Elektrochem. Angew. Phys. Chem. 1933, 39, 959–969. [Google Scholar] [CrossRef]
  25. Pastero, L.; Bruno, M.; Aquilano, D. About the Genetic Mechanisms of Apatites: A Survey on the Methodological Approaches. Minerals 2017, 7, 139. [Google Scholar] [CrossRef] [Green Version]
  26. Wilson, R.M.; Elliott, J.C.; Dowker, S.E.P.; Rodriguez-Lorenzo, L.M. Rietveld refinements and spectroscopic studies of the structure of Ca-deficient apatite. Biomaterials 2005, 26, 1317–1327. [Google Scholar] [CrossRef] [PubMed]
  27. White, T.J.; Dong, Z.L. Structural derivation and crystal chemistry of apatites. Acta Crystallogr. B Struct. Sci. 2003, B59, 1–16. [Google Scholar] [CrossRef] [PubMed]
  28. Henning, P.A.; Landa-CaÂnovas, A.R.; Larssona, A.K.; Lidin, S. Elucidation of the crystal structure of oxyapatite by high-resolution electron microscopy. Acta Crystallogr. B Struct. Sci. 1999, B55, 170–176. [Google Scholar] [CrossRef] [PubMed]
  29. Henning, P.A.; Adolfsson, E.; Grins, J.; Fritch, A. Triclinic oxy-hydroxyapatite. J. Mater. Sci. 2001, 36, 663–668. [Google Scholar] [CrossRef]
  30. Dorozhkin, S.V. Calcium orthophospates (CaPO4): Occurrence and properties. Prog. Biomater. 2016, 5, 9–70. [Google Scholar] [CrossRef] [PubMed] [Green Version]
  31. Kay, M.I.; Young, R.A.; Posner, A.S. Crystal Structure of Hydroxyapatite. Nature 1964, 204, 1050–1052. [Google Scholar] [CrossRef]
  32. Giannozzi, P.; Andreussi, O.; Brumme, T.; Bunau, O.; Nardelli, M.B.; Calandra, M.; Car, R.; Cavazzoni, C.; Ceresoli, D.; Cococcioni, M.; et al. Advanced capabilities for materials modelling with Quantum ESPRESSO. J. Phys. Condens. Matter 2017, 29, 465901. [Google Scholar] [CrossRef]
  33. Giannozzi, P.; Baroni, S.; Bonini, N.; Calandra, M.; Car, R.; Cavazzoni, C.; Ceresoli, D.; Chiarotti, G.L.; Cococcioni, M.; Dabo, I.; et al. QUANTUM ESPRESSO: A modular and open-source software project for quantum simulations of materials. J. Phys. Condens. Matter 2009, 21, 395502. [Google Scholar] [CrossRef]
  34. Heyd, J.; Scuseria, G.E.; Ernzerhof, M. Hybrid functionals based on a screened Coulomb potential. J. Chem. Phys. 2003, 118, 8207–8215. [Google Scholar] [CrossRef] [Green Version]
  35. Krukau, A.V.; Vydrov, O.A.; Izmaylov, A.F.; Scuseria, G.E. Influence of the exchange screening parameter on the performance of screened hybrid functionals. J. Chem. Phys. 2006, 125, 224106. [Google Scholar] [CrossRef]
  36. Schlipf, M.; Gygi, F. Optimization algorithm for the generation of ONCV pseudopotentials. Comput. Phys. Commun. 2015, 196, 36–44. [Google Scholar] [CrossRef] [Green Version]
  37. Hamann, D.R. Optimized norm-conserving Vanderbilt pseudopotentials. Phys. Rev. 2013, B88, 085117. [Google Scholar] [CrossRef] [Green Version]
  38. Perdew, J.P.; Burke, K.; Ernzerhof, M. Generalized Gradient Approximation Made Simple. Phys. Rev. Lett. 1996, 77, 3865–3868. [Google Scholar] [CrossRef] [PubMed] [Green Version]
  39. Tabrizi, B.N.; Baradaran, S.; Zalnezhad, E.; Basirun, W.J. Applications of electron microscopy in mechanochemistry. In Microscopy: Advances in Scientific Research and Education; Mendez-Vilas, A., Ed.; Formatex Microscopy Series; Formatex Research Center S.L.: Badajoz, Spain, 2014; Volume 2, pp. 791–802. Available online: https://www.researchgate.net/publication/267066990 (accessed on 3 December 2022).
  40. Likhachev, I.; Balabaev, N.; Bystrov, V.; Paramonova, E.; Avakyan, L.; Bulina, N. Molecular Dynamics Simulation of the Thermal Behavior of Hydroxyapatite. Nanomaterials 2022, 12, 4244. [Google Scholar] [CrossRef]
  41. Lide, D.R. CRC Handbook of Chemistry and Physics, 88th ed.; CRC Press: Boca Raton, FL, USA, 2007; p. 2640. ISBN 0-8493-0488-1. [Google Scholar]
  42. Becke, A.D.; Edgecombe, K.E. A simple measure of electron localization in atomic and molecular systems. J. Chem. Phys. 1990, 92, 5397–5403. [Google Scholar] [CrossRef]
  43. Putz, M. Density Functionals of Chemical Bonding. Int. J. Mol. Sci. 2008, 9, 1050–1095. [Google Scholar] [CrossRef] [Green Version]
  44. Nakamoto, K. Infrared and Raman Spectra of Inorganic and Coordination Compounds, Part B: Applications in Coordination, Organometallic, and Bioinorganic Chemistry, 6th ed.; John Wiley & Sons: New York, NY, USA, 2009; p. 400. ISBN 978-0-470-40587-1. [Google Scholar]
  45. Mukherjee, K.; Palchowdhury, S.; Maroncelli, M. OH Stretching and Libration Bands of Solitary Water in Ionic Liquids and Dipolar Solvents Share a Single Dependence on Solvent Polarity. J. Phys. Chem. B 2022, 126, 4584–4598. [Google Scholar] [CrossRef]
  46. Calzolari, A.; Pavan, B.; Curtarolo, S.; Nardelli, M.B.; Fornari, M. Vibrational spectral fingerprinting for chemical recognition of biominerals. ChemPhysChem 2020, 21, 770–778. [Google Scholar] [CrossRef]
  47. Jager, C.; Welzel, T.; Meyer-Zaika, W.; Epple, M. A solid-state NMR investigation of the structure ofnanocrystalline hydroxyapatite. Magn. Reson. Chem. 2006, 44, 573–580. [Google Scholar] [CrossRef]
  48. Hartmann, P.; JaKger, C.; Barth, S.; Vogel, J.; Meyer, K. Solid State NMR, X-ray Diffraction, and Infrared Characterization of Local Structure in Heat-Treated Oxyhydroxyapatite Microcrystals: An Analog of the Thermal Decomposition of Hydroxyapatite during Plasma-Spray Procedure. J. Solid State Chem. 2001, 160, 460–468. [Google Scholar] [CrossRef]
  49. Bulina, N.V.; Chaikina, M.V.; Andreev, A.S.; Lapina, O.B.; Ishchenko, A.V.; Prosanov, I.Y.; Gerasimov, K.B.; Solovyov, L.A. Mechanochemical Synthesis of SiO44–-Substituted Hydroxyapatite, Part II—Reaction Mechanism, Structure, and Substitution Limit. Eur. J. Inorg. Chem. 2014, 2014, 4810–4825. [Google Scholar] [CrossRef]
  50. McPherson, R.; Gane, N.; Bastow, T.J. Structural characterization of plasma-sprayed hydroxylapatite coatings. J. Mater. Sci. Mater. Med. 1995, 6, 327–334. [Google Scholar] [CrossRef]
Figure 1. SEM images of synthesized powders: (a) sample A; (b) sample B.
Minerals 13 00102 g001
Figure 2. PXRD patterns of sample A (1) and B (2). Vertical markers correspond to the position of the HA reflections (card PDF 000-09-0432).
Minerals 13 00102 g002
Figure 3. PXRD patterns of sample A (1) and B (2) in the range of 45–54°2θ illustrating distortion in the case of heating in vacuum. Reflections with maximum broadening are marked with an arrow.
Minerals 13 00102 g003
Figure 4. Illustration of HA (a,c) and OA (b,d) structures obtained after relaxation. Panels (a,b) show view from axis c, and panels (c,d) from axis b.
Minerals 13 00102 g004
Figure 5. Experimental IR spectra of sample A (1) and B (2). Panel (a) general view; Panel (b) enlarged view of 500–1200 cm−1 region. Panel (c) presents the simulated IR spectra for HA and OA.
Minerals 13 00102 g005
Figure 6. 1H (a) and 31P (b) MAS NMR spectra of sample A (1) and B (2).
Minerals 13 00102 g006aMinerals 13 00102 g006b
Figure 7. Dependence of weight loss of sample A (1) and B (2) on soaking time in water at 37 °C.
Minerals 13 00102 g007
Table 1. Structural parameters of the oxyapatite reported in the literature.
Crystal SystemSpace Groupa (Å)b (Å)c (Å)α (°)β (°)γ (°)Reference
HexagonalP63/m9.409.406.899090120[15]
P 6 ¯ 9.4329.4326.88190.390119.9[25,26,27,28]
TriclinicP 1 ¯ 9.40029.39706.899790.06389.748119.997[29]
Table 2. Refined crystallographic characteristics of samples in the hexagonal setting.
Sample NameAnnealing
Conditions
Space Groupa (Å)c (Å)V (Å3)Crystallite Size (nm)Rwp/GOF
AAirP63/m9.42378(6)6.88104(6)529.218(9)220(4)5.69/2.06
BVacuumP63/m9.4060(3)6.8950(2)528.30(4)106(8)11.9/2.87
P 6 ¯ 9.4089(3)6.8965(3)528.67(4)100(5)10.4/3.13
Table 3. Refined crystallographic characteristics of sample B in the triclinic setting with a space group P 1 ¯ .
a (Å)b (Å)c (Å)α (°)β (°)γ (°)V (Å3)Rwp/GOF
9.4115(4)9.4077(4)6.8953(2)90.01(1)89.83(4)120.04(1)528.50(4)6.3/1.9
Table 4. Calculated parameters of HA, OA and “HA w/o OH” atomic models: cell parameters a and c, bulk modulus B, formation enthalpy ΔfH.
Materiala (Å)c (Å)B (GPa)ΔfH (eV/cell)
HA9.4816.85988−128.49
OA9.4426.88879−123.16
HA w/o OH9.5496.74769−117.68
Table 5. The correspondence between the observed and theoretical vibration bands.
Type of
Vibration
Wavenumber (cm−1)
Sample ASample BModel HAModel OA
O–P–O, ν2 473Out of range420380, 420
Ca–O, ν*447, 475470, 490
O–P–O, ν4573, 602556, 569, 584, 606520, 560530, 580
OH, νL630640
P–O, ν1960944, 972880900, 920
P–O, ν31048, 1065, 10901005, 1058, 1090950, 1000970, 1000, 1020
O–H, νS35703640
Table 6. 1H and 31P chemical shift parameters for the synthesized samples.
Sample Name 1H31P
V–OH–VOH–V–OHOH–OHPO43−PO43−
Aδiso (ppm)0.012.27
Width (Hz)18991
Area (arb. un.) 1.7 × 1068.2 × 107
Bδiso (ppm)7.805.290.022.336.11
Width (Hz)714630309574247
Area (arb. un.)8.7 × 1043.7 × 1042.2 × 1043.6 × 1071.6 × 107
Disclaimer/Publisher’s Note: The statements, opinions and data contained in all publications are solely those of the individual author(s) and contributor(s) and not of MDPI and/or the editor(s). MDPI and/or the editor(s) disclaim responsibility for any injury to people or property resulting from any ideas, methods, instructions or products referred to in the content.

