Article

Chlorellestadite (Synth): Formation, Structure, and Carbonate Substitution during Synthesis of Belite Clinker from Wastes in the Presence of CaCl2 and CO2

Institute for Technical Chemistry, Karlsruhe Institute of Technology, Karlsruhe 76021, Germany
*
Authors to whom correspondence should be addressed.
Minerals 2022, 12(9), 1179; https://doi.org/10.3390/min12091179
Submission received: 29 August 2022 / Revised: 12 September 2022 / Accepted: 16 September 2022 / Published: 19 September 2022
(This article belongs to the Special Issue Cement Related Minerals—in Memory of Herbert Pöllmann)

Abstract

:
The synthesis of low-temperature belite (C2S) clinker from wastes of autoclaved aerated concrete and limestone was studied in the presence of CaCl2 as a mineralizing agent. Synthetic chlorellestadite (SCE; Ca10(SiO4)3(SO4)3Cl2) forms in experiments at temperatures between 700 and 1200 °C. Samples were investigated by X-ray diffraction and Raman spectroscopy. In general, the amount of SCE depends mainly on the sulfate content and to a lesser extent on the synthesis temperature. At lower temperatures of formation, a non-stoichiometric SCE seems to crystallize in a monoclinic symmetry similar to hydroxylellestadite. Rietveld refinements revealed the presence of chlorine and calcium vacancies. Raman spectroscopy proved the partial substitution of sulfate by CO32− groups in ellestadites formed at 800 °C and 900 °C in air. Incorporation of CO3 results in a shorter unit cell parameters and smaller cell volume similar to CO3−apatite. At low temperatures, SCE coexists with spurrite intermixed on a very fine nm scale. At temperatures above 900 °C in air, ellestadite is carbonate-free and above 1000 °C chlorine loss starts in all samples.

Graphical Abstract

1. Introduction

Chlorellestadite, Ca10(SiO4)3(SO4)3Cl2, is a chlorine endmember of the ellestadite group of minerals. Synthetically obtained chlorellestadite (SCE) was already reported by Pliego-Cuervo [1] and only recently, its natural analogue was confirmed by Środek et al. [2]. SCE is a common phase formed by calcination processes in course of the production of alternative cement clinker rich in belite (Ca2SiO4 or C2S according to the cement nomenclature, with C, S denoting CaO and SiO2, respectively), when CaCl2 is used as a mineralizing (or flux) agent. Due to their high electronegativity, such agents change the properties of the melt and facilitate the dissolution and diffusion of CaO, thus accelerating the C2S synthesis at significantly lower temperatures [3,4,5]. The use of autoclaved aerated concrete (AAC) wastes as a raw material for the synthesis of a C2S cement clinker provides the sulfate needed within the Ca-silicate matrix for the formation of ternesite [6] or SCE. Wastes from AAC contain sulfate from several sources, e.g., CaSO4 added for achieving an initial strength of the green body during its production or due to the inevitable contamination with masonry during demolition. Another source for the formation of SCE (and synthetic chlorapatite) along with KCl, is the use of industrial waste materials such as PVC or other chlorine-containing polymers as alternative fuels in cement kilns [7].
The conditions leading to the formation of SCE and its high-temperature stability during the clinkering process in cement kilns were investigated previously [8,9,10]. They reveal that a partial decomposition of SCE and transformation into the compound Ca10(Si2O7)3Cl2 takes place at temperatures higher than 1200 °C. The formation of the latter was also reported during the processes of waste incineration, combustion of ashes containing chlorine-bearing calcium silicates [11], in the burned spoil heaps of coal mines [12], and by synthesis using the flux method [13]. The structure of a natural analogue of Ca10(Si2O7)3Cl2, known as rusinovite, was described for samples from two localities [14,15].
The ellestadite group is notorious for its versatility in terms of chemical composition and structure. Exact compositions and their changes as a function of temperature are not well understood. Ellestadites belong to the apatite supergroup with the general formula IXM14VIIM26(IVTO4)6 × 2 [16]. According to the nomenclature, the roman superscript denotes the coordination of the polyhedra. M1 and M2 are two independent polyhedral cationic positions occupied by Ca. T is occupied by tetrahedrally coordinated Si, P, S, V, As, etc. In the case of ellestadite, the 6 tetrahedral positions are subdivided equally among Si and S. Anions like Cl, F, and OH occupy the X positions. The structure is built of a framework of Ca(1)O6 metaprism columns that form channels by corner-connection to the (Si/S)O4 tetrahedra. The channels enclose Ca(2)O5(F/Cl/OH) polyhedra. Due to the structural similarity to apatites, natural and synthetic ellestadites share the same hexagonal space group archetype P63/m [2,17]. Indications for a monoclinic structure due to ordering of Si and S atoms within the tetrahedra or the anions in the tunnels were observed for apatites [16] and indications for such ordering were also found in hydroxylellestadite [18,19]. However, this was discussed controversially [20,21]. Especially interesting for SCE formed in cement kilns is the possible incorporation of CO3 in the tetrahedral site of the ellestadite structure, as assumed by Rouse et al. [22]. Banno et al. [23] described a natural ellestadite from Tadano, Fukushima, showing the presence of CO3 groups by Raman spectroscopy. A similar hypothesis was used for the interpretation of the Raman spectra of chlorellestadite and fluorellestadite by Środek et al. [2] and Avdontceva et al. [24], respectively.
The scope of this work covers the structural investigation of SCE at different formation temperatures during the low-temperature synthesis process of C2S. Samples of wastes from autoclaved aerated concrete with different sulfate contents were mixed with CaCO3 and CaCl2 and calcined in a muffle oven up to temperatures between 700 and 1200 °C. Selected structural parameters and the formation of SCE as a host material for the immobilization of chlorine are investigated by XRD and Raman spectroscopy.

2. Materials and Methods

2.1. Raw Mixtures and Oven Experiments

Two samples from wastes of autoclaved aerated concrete with different sulfate contents were crushed and dried at 250 °C (secondary material SM[P]: Xella and secondary material SM[D2]: Otto Dörner). These raw material samples were mixed with CaCO3 (Merck) and CaCl2 (Merck) with a targeted molar C/S-ratio of 2. CaCl2 also was predried at 250 °C. The raw mixtures P and D2 were homogenized for 30 min in a planetary ball mill (Fritsch Pulverisette 5). Chemical analyses of the raw mixture samples were performed according to DIN 51729–10 by X-ray fluorescence analysis (XRF; Bruker AXS S8 Tiger). Two determinations with different dilution factors (200 and 400 mg with 6 g Li-borate salt mixture) and certified cement standards were used for quality control. Fluorine and chlorine were analyzed using a combined combustion-ion chromatography (C-IC) system. About 20–30 mg of fine ground sample is weighed into a ceramic sample boat. Additionally, about 10–15 mg of tungsten oxide is added for better combustion of the sample. Additional information can be found in [25].
Amounts of 100 g of the samples were calcined in a Nabertherm furnace (LHT 04/17) at temperatures between 700 and 1200 °C in air. The samples were treated by a heating rate of 10 °C/min from RT to the desired temperature followed by a dwelling time of 60 min. After that, the furnace was switched off and the samples were slowly cooled down to room temperature. The corresponding sample notation reads (HT[sample mixture]_temperature).

2.2. X-ray Diffraction

X-ray diffraction measurements were conducted on an Empyrean diffractometer (Malvern-PANalytical, Almelo, The Netherlands) equipped with a multistrip PIXcel3D detector (255 channels, simultaneously covering 3.347° 2θ), CuKα-radiation and Bragg-Brentano HD optics. X-ray powder patterns were obtained in the range of 5 to 120° 2θ with step size 0.013° 2θ, time per step 1 s, slits of 0.125° and 0.5°, soller slits of 2.3°, and sample rotation.
For bulk quantitative phase analyses the samples were mixed with an internal standard (20 wt% α-Al2O3, Alfa Aesar 99.95%). Approximately 2 g of the sample mixture was used for measurement. The software packages HighScore Plus V. 4.9 (PANalytical) and Diffrac-Plus (Bruker-AXS, Karlsruhe, Germany) were applied with PDF 2004 (ICDD) and COD 2019 databases for phase identification. Rietveld refinements were performed based on the fundamental parameters approach implemented in TOPAS V6 (Bruker-AXS) to determine amorphous and crystalline phase contents. A detailed description of the refinement strategy is given in [25].

2.3. Raman Spectroscopy and Imaging

Confocal Raman spectroscopic analyses were performed on both single aggregates of the calcined samples (dusted on Au coated specimen slide), and on 7 mm compacts prepared by a hand press (Table Top Quick Press S.A.F.I.R., Knokke, Belgium).
WITec alpha300 R equipped with UHTS300 spectrometer (300 mm focal length) and Zeiss microscope was employed for single spot measurements, as well as for mappings. A 532 nm laser operated at 40 MW (measured on the sample) was used as an excitation source. The measurements were performed with a 100 × objective with a NA of 0.9 using 600 grating (spectral resolution better than 3 cm1) and 1800 grating (spectral resolution better than 1 cm1). A mercury-argon lamp was applied for spectral calibration, which was additionally checked by the 520.6 cm−1 line of a silicon test sample. A high-performance back-illuminated CCD camera (96% efficiency) was used for detection. Typical acquisition times were between 5–10 s with 5–10 scans. 2D Raman mappings of typical areas of 100 × 100 μm were performed in 1 μm steps. In addition, a 3D Raman mapping was carried out on the sample HT[D2]_800 in 10 single layers of size 20 × 15 mm in 300 nm steps in x, y and 500 nm in z direction. The phase identification was aided by the RRUFF mineral database [26] and an own database integrated in the WITec True Match program. The data processing and preparation of the Raman images were performed with the Project 5.3 + software from WITec. For imaging of the 2D phase distribution in 10 single layers of an aggregate, the complete spectral range between 100–1200 cm1 of the pure spectra of calcite, spurrite, ellestadite, anhydrite, and β-C2S, was used. The creation of the 3D images by stacking the 2D single layers was carried out with ImageJ [27].

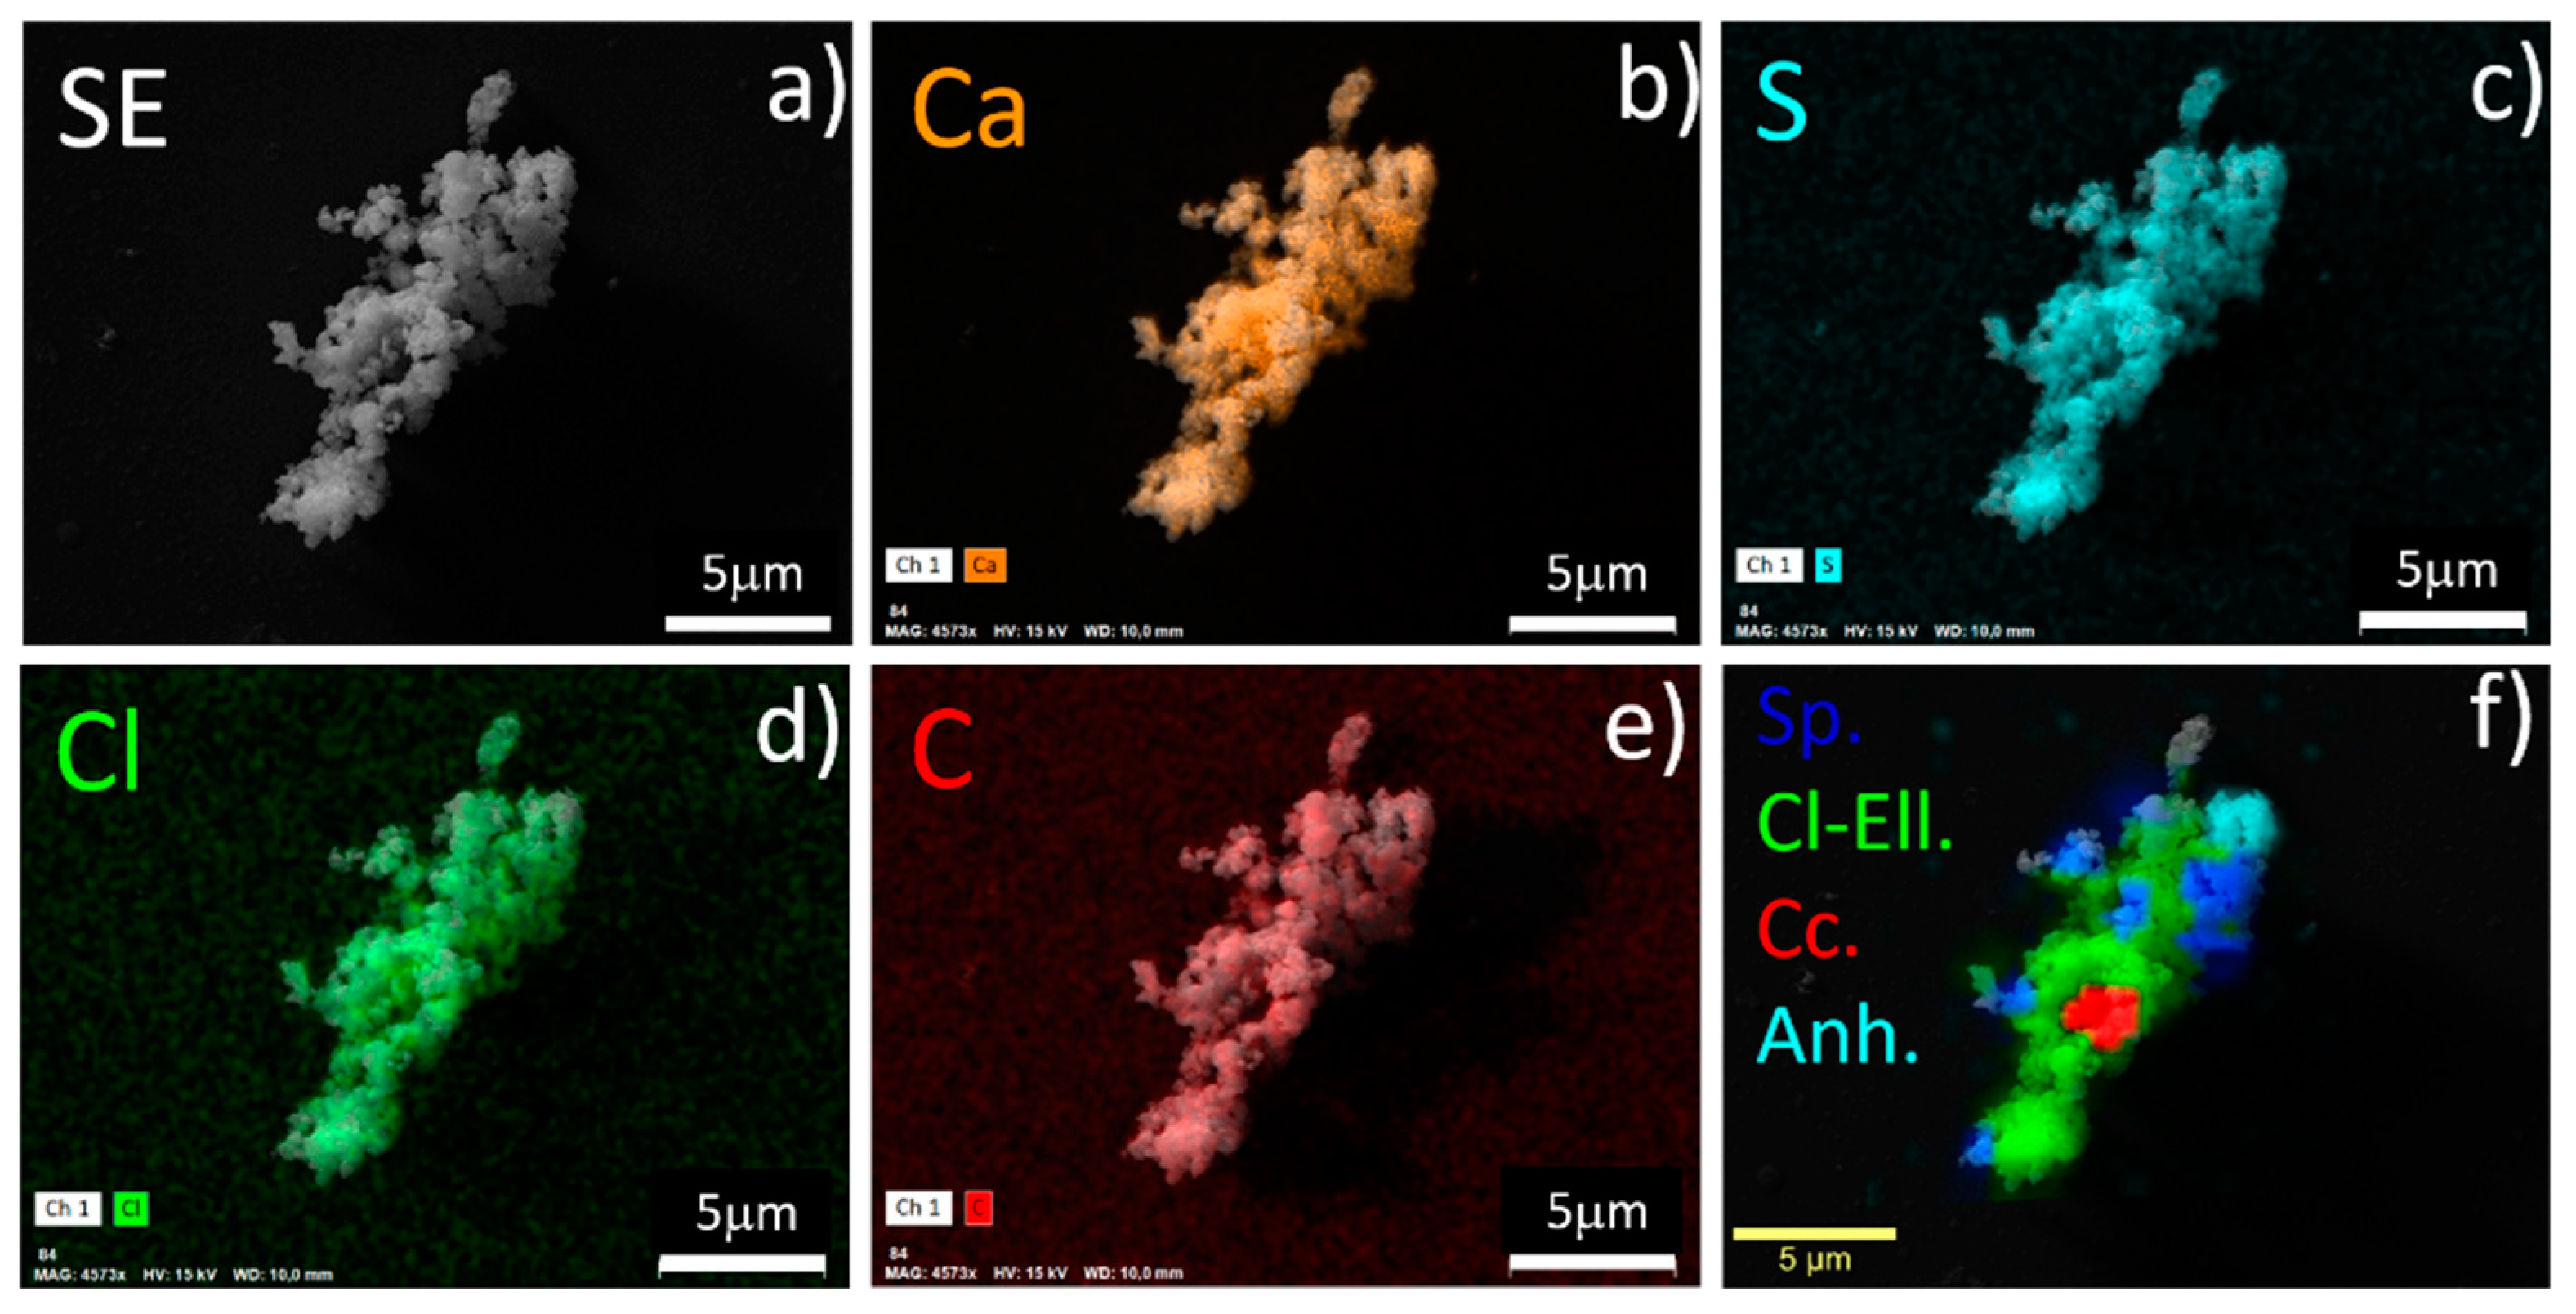
2.4. Electron Microscopy and Elemental Mapping

Au-coated samples (180 s/25 mA in Sputter-Coater Quorum Q150R ES) are imaged with a Scanning Electron Microscope (SEM, Zeiss Supra 55VP) with a field emission gun operating at 20 kV accelerating voltage. An aperture of 30 μm was used for imaging, mostly via secondary electrons (mode SE2) and in some cases also via backscattered electrons (mode AsB). Elemental mapping is performed using a Quantax EDS system (XFlash 5010 with 10 mm2 detection area and 127 eV FWHM/MnKα).

3. Results and Discussion

3.1. Raw Mixture Composition

The results from chemical analysis and XRD of the raw mixtures are presented in Table 1. A more detailed description of the raw material analysis is given elsewhere [25]. The SO3 content for sample mixtures D2 and P is 5.0 and 2.1 wt%, respectively, and the molar C/S-ratios are within the range of 2 ± 0.02.
Amorphous contents vary between 34 and 39 wt%. Both samples contain the crystalline phases tobermorite, quartz, calcite, vaterite, aragonite, feldspar, and the sulfates bassanite and anhydrite. Higher amount of crystalline sulfate phases was determined in sample D2 that corresponds to its high SO3 content. Due to the hygroscopic nature of CaCl2, which first transforms to sinjarite (CaCl2·2H2O) and finally dissolves in the crystal water of higher hydrates at room temperature in air [28], no CaCl2 could be determined in the raw mixtures.

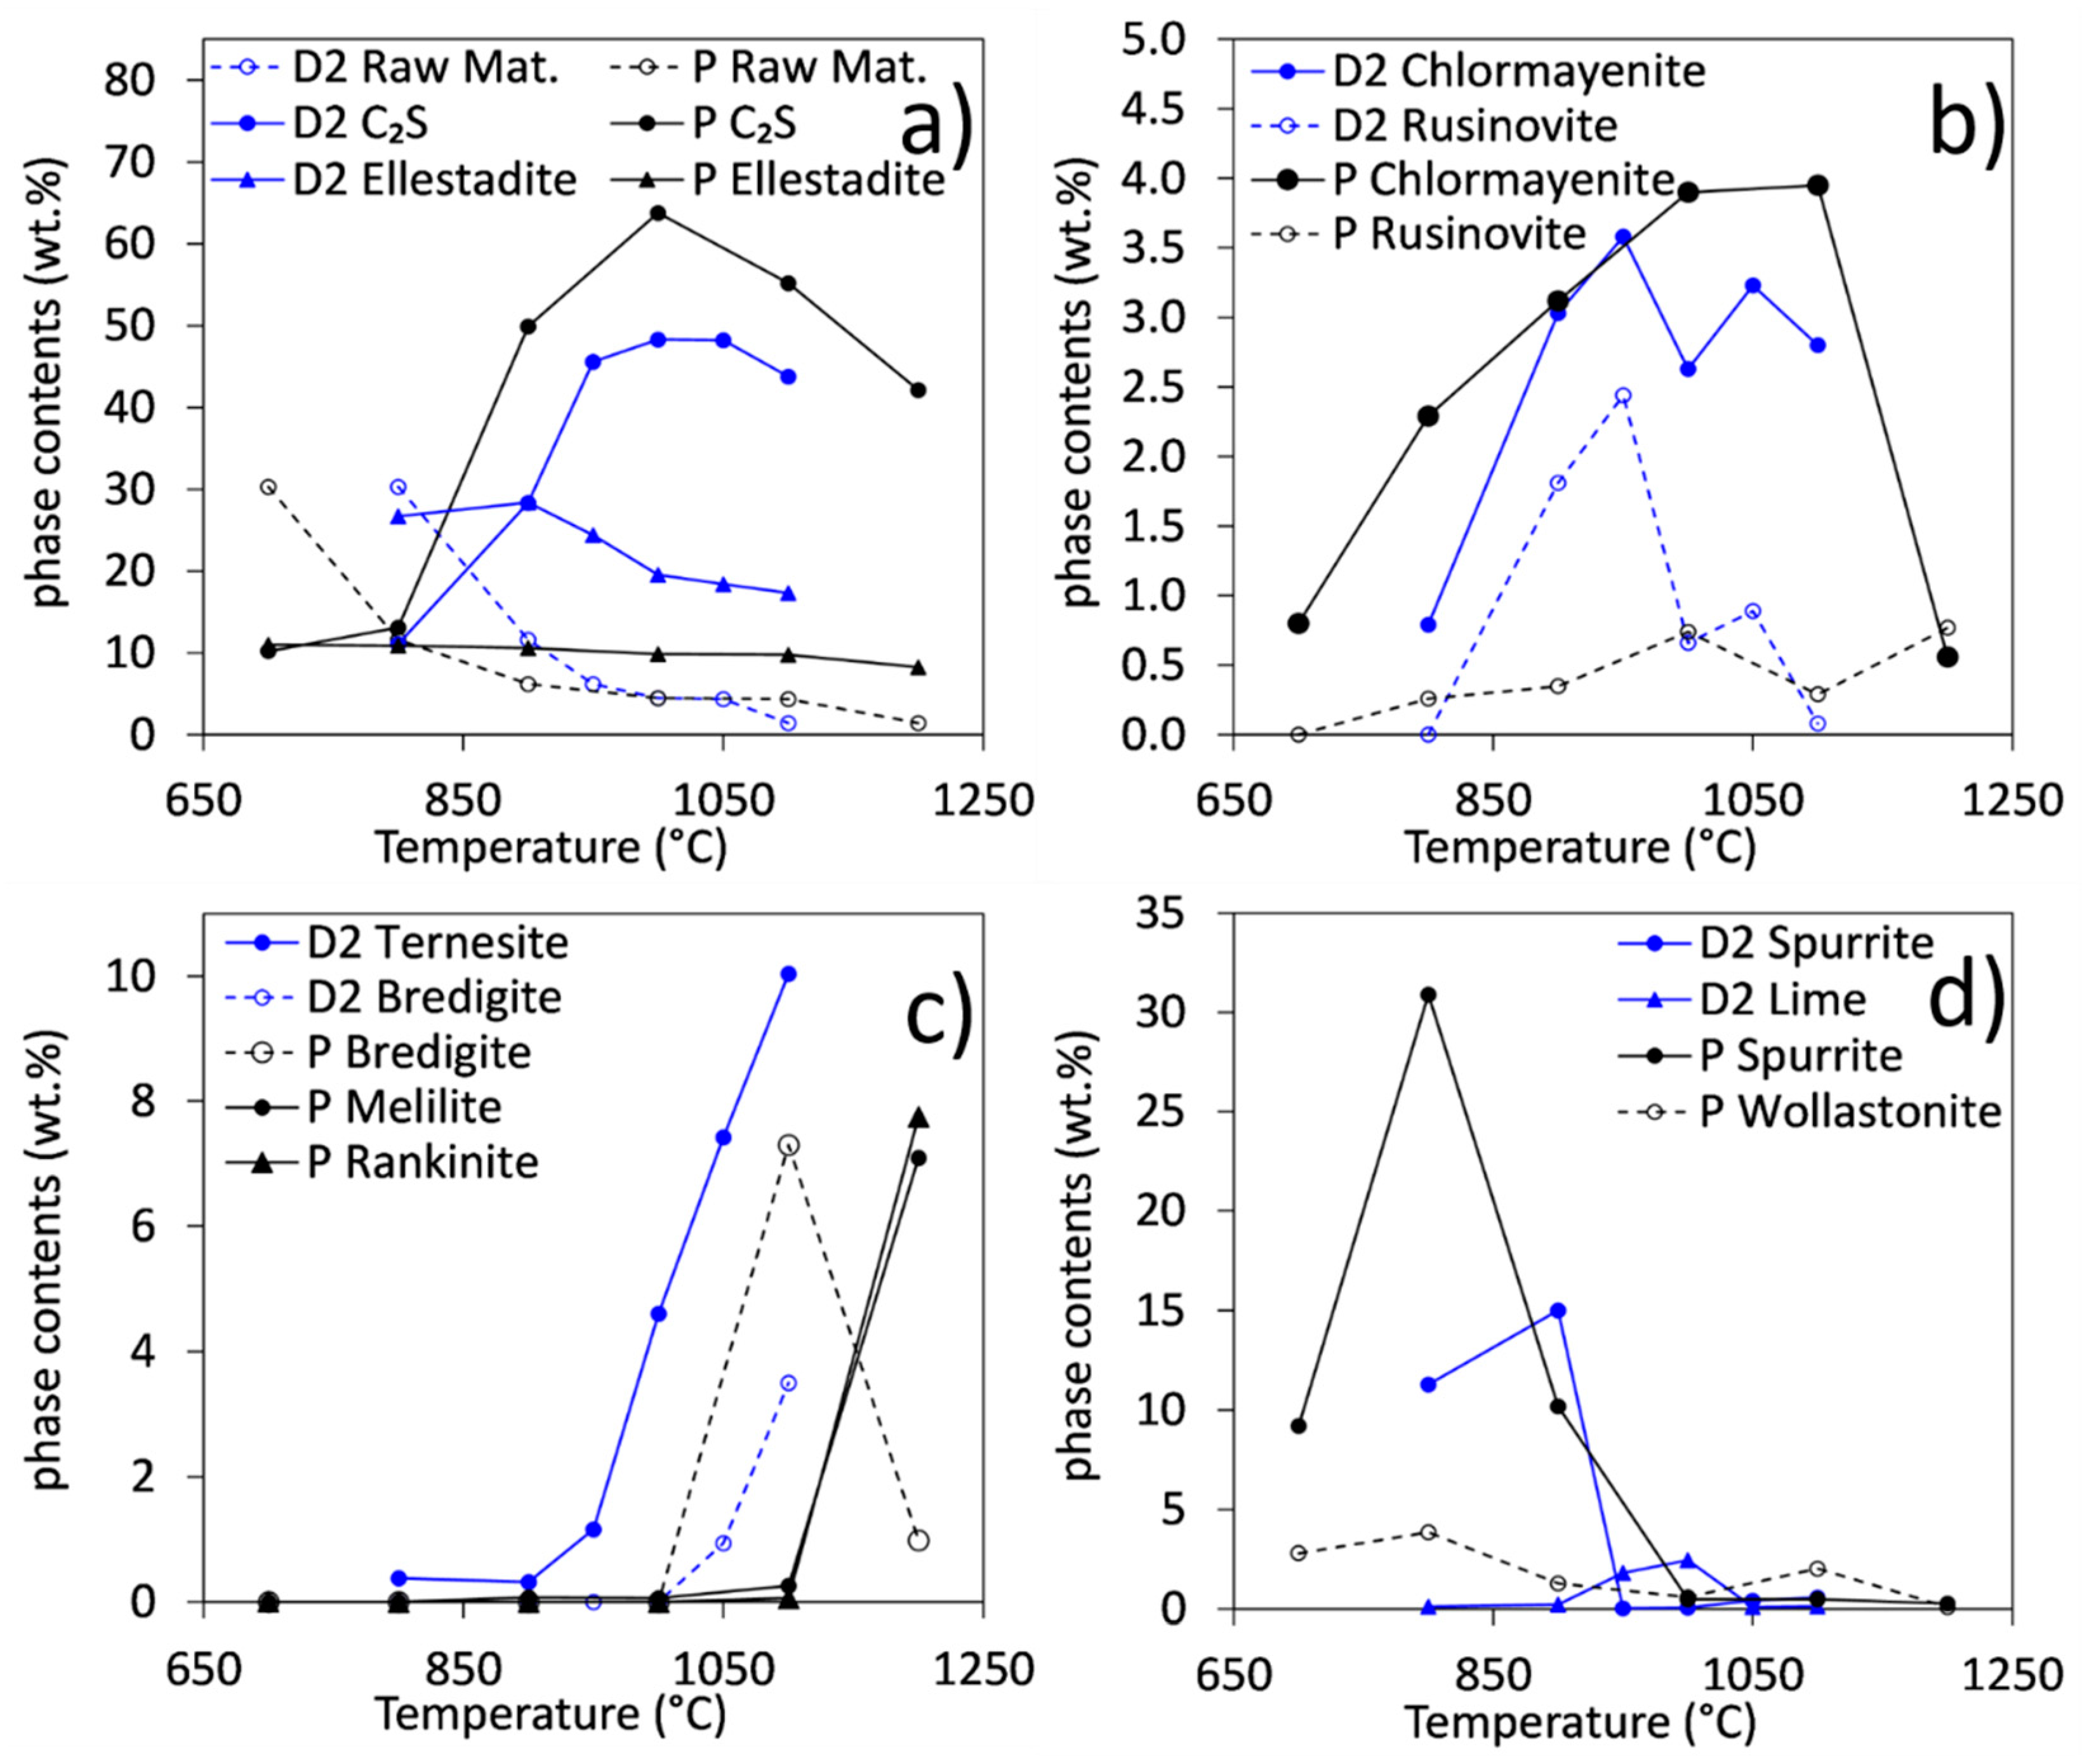
3.2. Phase Contents in Samples Synthesized at Temperatures between 700 and 1200 °C

Figure 1 shows the crystalline phase contents in the calcined samples HT[P]_700–1200 and HT[D2]_800–1100 as determined by Rietveld refinement. The full dataset with estimated standard deviations is listed in Supplementary Table S1.
Additional phases: <2 wt%: γ-C2S and merwinite; <1.5 wt%: brownmillerite; <1 wt%: albite, rondorfite, Ca2SiO3Cl2 and CaCl2; <0.5 wt%: microcline and ye’elimite.
Since Ullrich et al. [25] detected distinct evidence for the substitution of SO4 by CO3 and the occurrence of Cl deficiencies in low-temperature ellestadite, the monoclinic P1121 hydroxylellestadite structure was adapted to fit the structure of low-temperature SCE [19]. For ellestadite synthesized at high temperatures, the site occupancies for chlorine and calcium were refined in the structure of hexagonal ellestadite [20]. Carbonate was adopted to substitute sulfate isoelectronically as assumed by Środek et al. [2]. Further indication was given by the intensity ratios of ν1-[SiO4]/ν1-[SO4] bands in the Raman spectra (see discussion below). There was no evidence for a replacement of silicate. On the example of apatites, CO3 could be incorporated on tetrahedral sites (preferentially exchanging phosphorous), but it could also in extreme cases exchange OH groups [29]. This possibility was not considered, but it is an interesting subject for further investigations. All other phases were refined according to Ullrich et al. [25].
Amorphous contents with respect to XRD in samples HT[P]_800–1100 vary between 15 and 20 wt% and increase to 30 wt% at 1200 °C synthesis temperature. In samples HT[D2]_800–1100 the amorphous content with respect to XRD is slightly lower and ranges from 8.5 to 17 wt%. The reasons for this high non-crystalline fraction may be disorder, a glass fraction, and, to a lesser extent, hygroscopic CaCl2, which dissolves in its hydrate’s crystal water at room temperature in air.
Figure 1a shows the decrease of crystalline raw materials (calcite, quartz, and anhydrite) and the formation of the main products, C2S (α′H and β) and ellestadite with maximum C2S contents at 1000 °C synthesis temperature. Two processes taking place at temperatures >1000 °C can explain this observation essentially: (1) Increased formation of the high temperature modification α′H-C2S, which is disordered and probably underestimated by XRD, but clearly observed in Raman spectra. (2) Formation of ternesite at costs of C2S + anhydrite in sulfur-rich samples. Further chlorine-containing phases are chlormayenite and rusinovite (Figure 1b). They form at intermediate temperatures. However, phase contents are below 4 wt%. At temperatures between 700 and 900 °C (Figure 1c) spurrite content arises besides small amounts of wollastonite in the low-sulfate samples. With CO2 loss at 950 °C spurrite decomposes and minor amounts of CaO were observed in samples HT[D2]_950–1000. At high temperatures, (Figure 1d) ternesite and bredigite are observed in the sulfur-rich samples. The former manifests in the decrease in ellestadite content (Figure 1a). In sample HT[P]_1100 a significant amount of bredigite is observed. At 1200 °C it is substituted by melilite and rankinite. These data are consistent with [25] and confirm that the ideal range for ellestadite synthesis besides large amounts of C2S is between 950 and 1000 °C.
In order to investigate the formation of carbonate substituted SCEs, the total mass balance, especially concerning the substituted elements, is of interest. Here, calculations based on the data shown in Figure 1 and the structural data that will be discussed in chapter 3.3., reveal a deficit of chlorine in the crystalline fraction compared to the overall chemistry for samples HT[P]_700–900 and sample HT[D2]_800 (data table in Supplementary Table S2). Accordingly, chlorine must be enriched in the amorphous fraction in this temperature range. This can be explained by the formation of CaCl2-rich melts, which occurs more likely in sulfate poor samples where less ellestadite is formed. The binary subsystem CaCO3-CaCl2 exhibits a eutectic melt already at 630 °C, which contains 30 mol% CaCO3 [30]. The existence of more complex melts, which presumably also contain CaSO4, is probable below 1000 °C. Since such melts once formed slowly outgas CO2, CaO precipitates. CaCl2 and possibly CaSO4 crystallize on cooling [31]. CaCl2 is hardly detectable with XRD at RT for the reasons already mentioned above. At higher temperatures, the chlorine content in the crystalline phases is slightly higher than the one determined by C-IC. This is indicative for an overestimation of the chlorine content in other crystalline phases like chlormayenite.

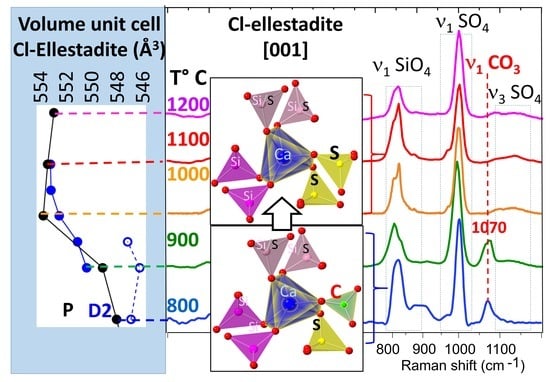
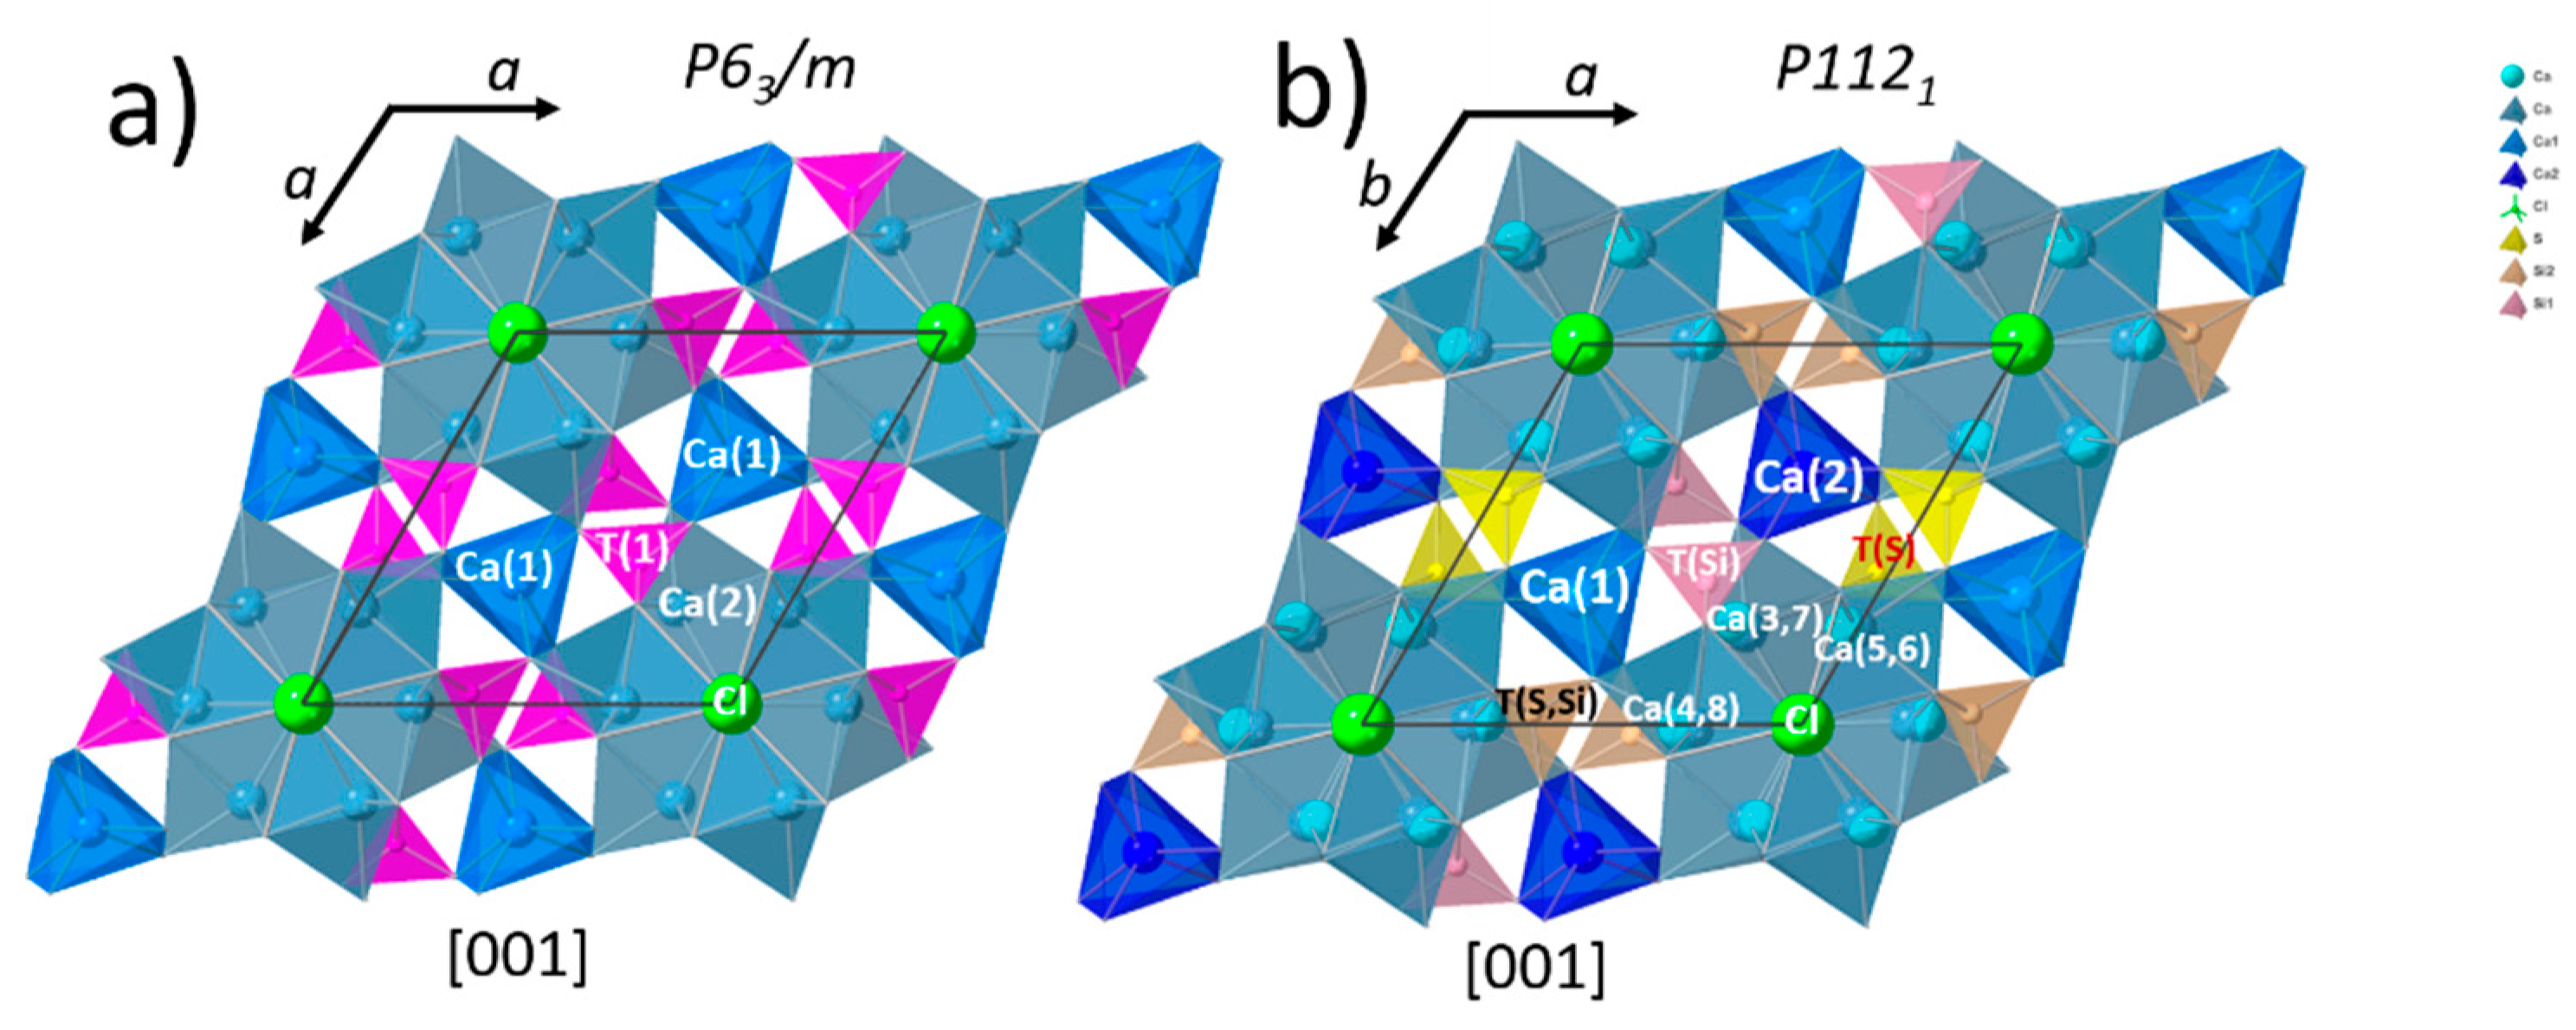
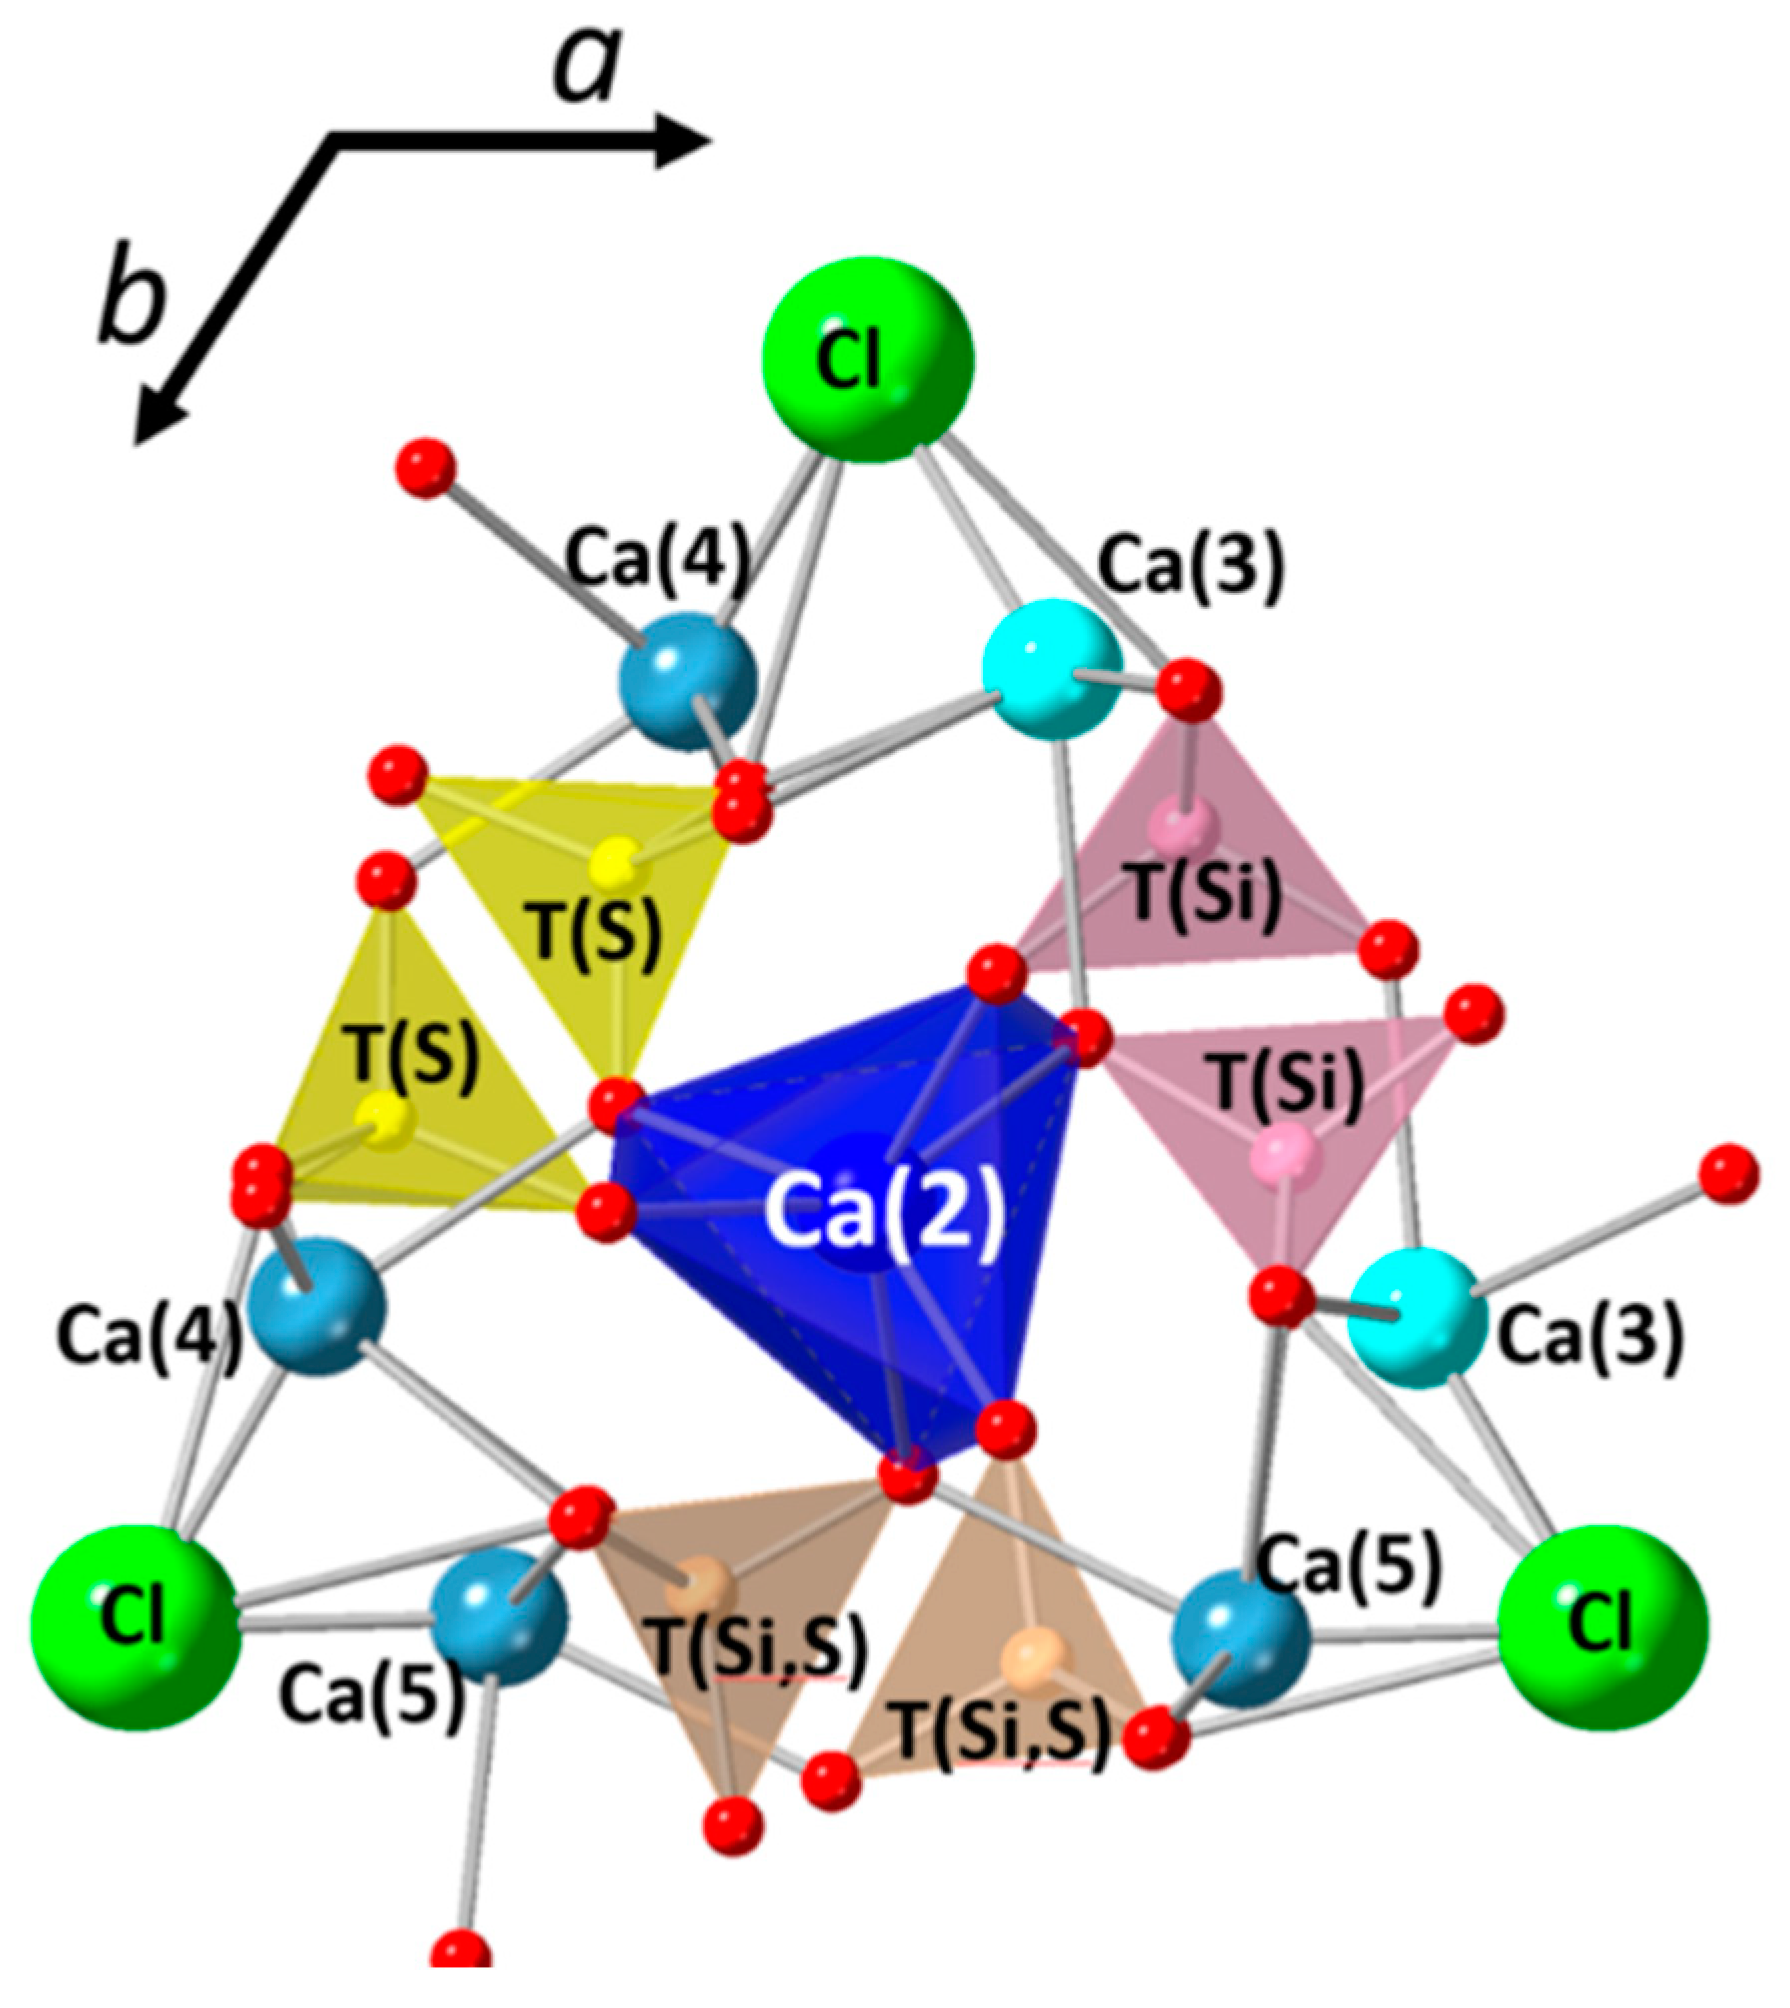
3.3. Structural Investigation of Ellestadite

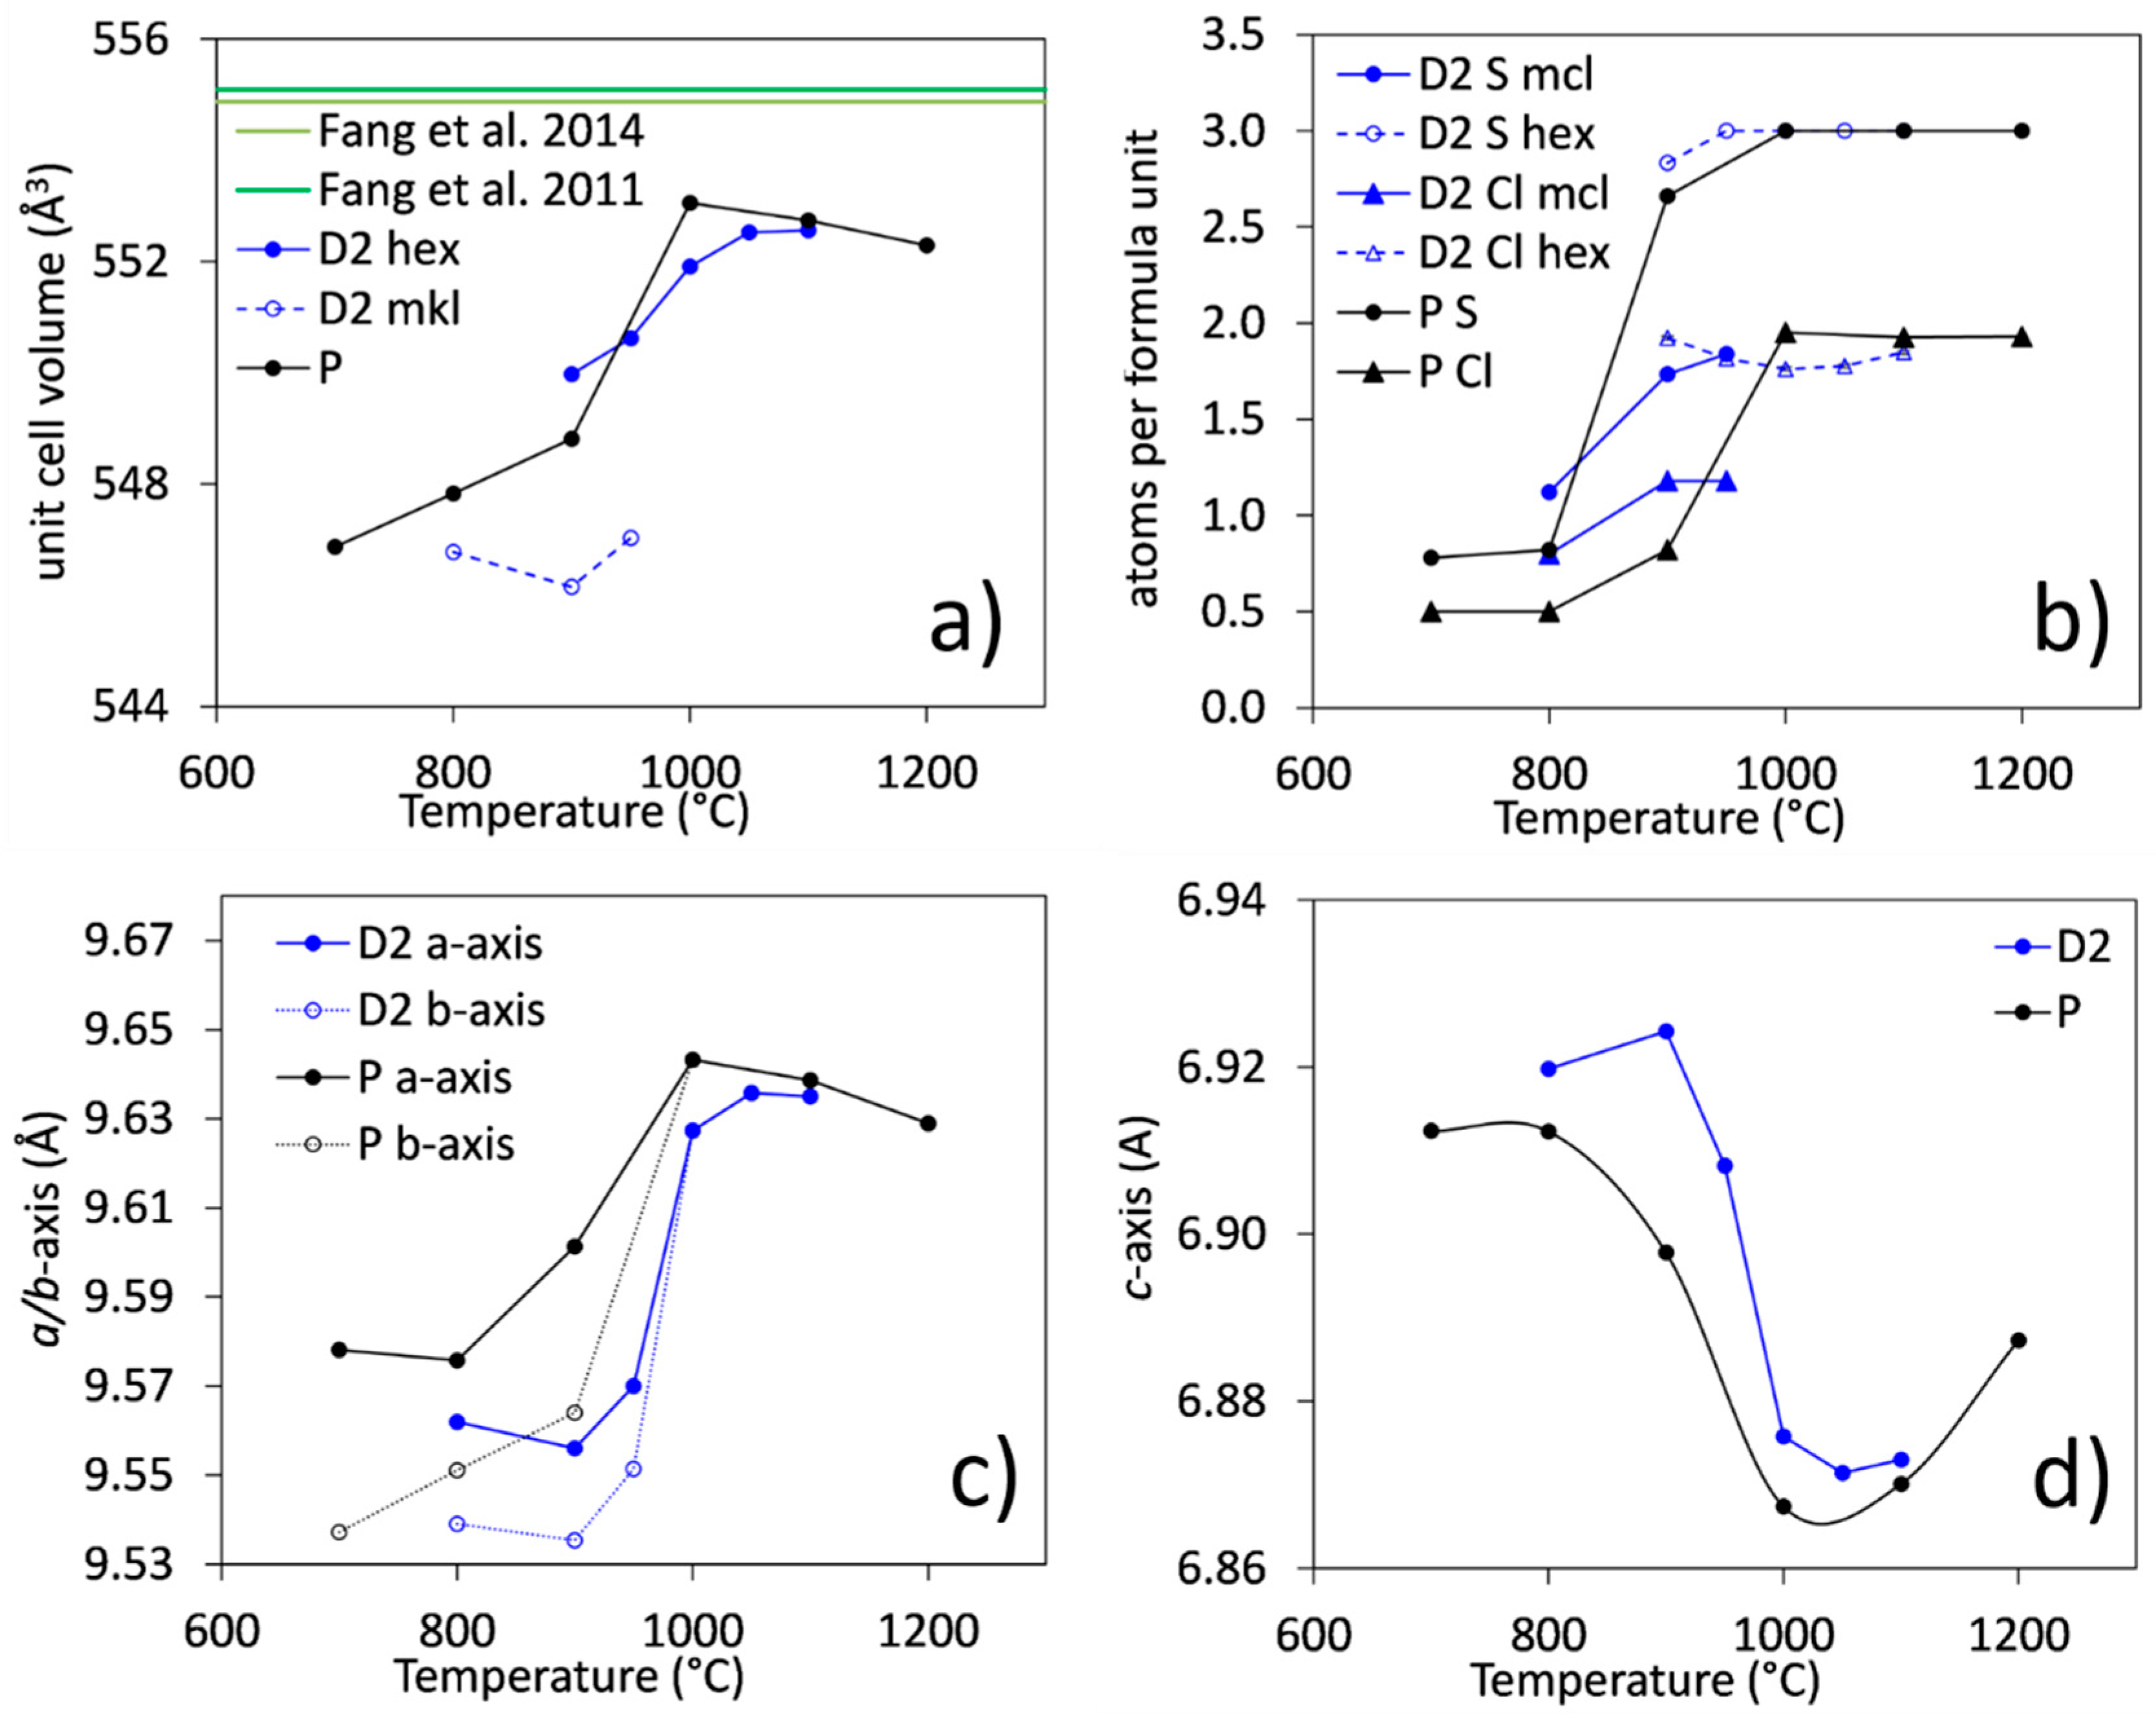
3.3.1. Unit-Cell Parameters and Site Occupancies

The structures of hexagonal and monoclinic ellestadite are shown in Figure 2a,b, respectively. In general, natural, and synthetic Ca10(SiO4)3(SO4)3Cl2 crystallize in space group P63/m [2,17,20,21]. The hexagonal ellestadite structure (Figure 2a) contains two independent Ca (Ca1 4 f on 63-fold axis, Ca2 6 h) and one tetrahedral position (6 h) in the asymmetric unit. The latter is 50/50% distributed between Si and S atoms. Chlorine is incorporated as Ca(2)6Cl2-columns in the channels formed by the Ca(1)4[(Si,S)O4]6 framework. As observed for apatites [16], indications for a monoclinic structure due to ordering of Si and S atoms within the tetrahedra or the anions in the tunnels were found in natural and synthetic hydroxylellestadite. Two monoclinic structures were proposed for ellestadite, one with space group P1121/m [19] and one with space group P1121 [20]. However, space group P1121/m predicts a rather unusual (1.7 Å) splitting between Ca (6) and Ca (7) and will not be considered further in this study. Whereas the hexagonal cell possesses one tetrahedral position T (1), the P63/mP1121 transformation results in three tetrahedral positions with two mono-atomic T (Si) and T (S) and one mixed T (Si, S) positions (Figure 2b). The hexagonal Ca (1) position degenerates into two positions. The Ca (2) gives rise to six split positions upon lowering the symmetry. In addition, increasing the OH content at cost of Cl (as in hydroxylellestadite, Ca9.94(SiO4)3(SO4)3(OH1.2Cl0.32O0.5)) decreases the volume of the unit cell to 542.89 Å [19].
Figure 3 shows two 2 theta ranges of samples HT[D2]_800–1100. It can be clearly seen that the peaks of ellestadite formed at lower temperatures (800–950 °C) are very broad compared to these formed at higher temperature pointing to lower symmetry and/or very small size of coherent scattering domains. Figure 3a shows splitting of the (020) peak of the hexagonal ellestadite to three separate reflections (002, 200 and −202) due to a monoclinic structure as described by Organova et al. [19]. Similar behavior shows the reflections (111), (−112) and (−211) (monoclinic cell), which at higher temperature are observed as a single peak due to 111 reflections of the hexagonal structure. Additionally, the decrease of the intensity ratio of the 111/020 reflections in the samples from 1000 to 800 ° C corresponds to incorporation of CO3 instead of SO4 groups, according to XRD pattern simulations with CrystalDiffract (6) [32].
In Figure 3b, the 2 theta range between 30.5 and 33.5 ° of the same samples is shown. Once again, the samples treated at 800–950 °C possesses very broad peaks due to multiple reflections typical for the monoclinic cell, namely high intense (211) and (−321) with satellites (112), (−213), and (−311), with lower intensity. The integral breadth is 0.235° 2 theta. At higher temperatures, they shift to higher d-values merging to a sharp (121) reflection with 0.135° 2 theta integral breadth of the hexagonal cell. Similar behavior is observed for the monoclinic triplet (121), (−122), (−221) merging to a hexagonal (112), although the shift is observed to lower d-values. The broad monoclinic triplet consisting of (003), (300), and (−303), shows a large shift to higher d-values eventually merging into (030) reflection of the hexagonal structure, which overlaps with the (013) reflection of α-C2S. These observations suggest that in our preparations the ellestadite formed at lower temperature is rather monoclinic than hexagonal, with possibly both modifications present at intermediate temperatures. Correspondingly, ellestadite crystalizes in hexagonal symmetry at higher temperatures. Additionally, a substantial change of the unit cell parameters in dependence of temperature could be observed. Reflections with large component in [h00] direction are shifted at most pointing to enlargement of the a-unit cell parameter with increased temperature of formation. Therefore, for the Rietveld refinements of the low-temperature datasets (700–950 °C), ellestadite was fitted using the monoclinic P1121 structure of hydroxylellestadite described by Organova et al. [19] (ICSD 39775). As the fits of samples HT[D2]_900–950 were still poor, intergrowth of domains of different composition and symmetry was assumed and these datasets were fitted by taking into account both structures.
The wide chemical adaptability of ellestadite is reflected in the evolution of unit cell volumes, which show systematic relationships with the chemical composition. For example, the substitution of Si by P leads to a decrease of both a and c unit cell parameters (ucp.) and correspondingly of the volume of the unit cell [20,22]. This is to be expected considering the size of the ionic radii of SVI+ (0.26 Å), SiIV+ (0.40 Å), and PV+ (0.31 Å) in tetrahedral coordination. Substitution of F by Cl increases the a ucp. and the cell volume, although it is accompanied by a slight decrease of the c-axis [21].
In comparison to SCEs from literature data, the unit cell volumes of the SCEs in P and D2 are small (Figure 4a). In particular, the refinements of unit cell volumes of SCE in the low-temperature samples (T < 1000 °C) show large deviations from the data of Fang et al. [20,21] for pure SCE. Since the P and F contents in all samples are below 0.1 wt.% and 30 mg/kg, respectively, and OH is not available, there must be another reason for this observation.
As already assumed by Rouse et al. [22], incorporation of CO3 in the tetrahedral site of the ellestadite structure would also result in a smaller a parameter similarly to apatite [33,34]. Banno et al. [23] described an ellestadite from Tadano, Fukushima, proving the presence of CO3 groups by Raman spectroscopy. A similar hypothesis was used for the interpretation of the Raman spectra of chlorellestadite and fluorellestadite by Środek et al. [2] and Avdontceva et al. [24], respectively. Therefore, we propose that the development of the ucp.s could be a strong indication for the incorporation of CO32− in the tetrahedral position in ellestadite. Additionally, taking into account the possibility of incorporation of vacancies according to Fang et al. [21], we can propose the following mechanisms leading to smaller cell volumes of ellestadite:
( SO 4 ) 2   ( CO 3 ) 2 + O
Ca 2 + + 2 Cl   Ca + 2 Cl
Exchange of SO4 by CO3 implies additional O−2 vacancies. These assumptions are supported by the fact that the P63/m structure of ellestadite at low synthesis temperatures poorly fits the XRD data (T < 1000 °C) of samples D2 and P [25].
At 1000 °C and higher temperatures, the criteria of fit approach similar values, regardless of whether the hexagonal or the modified monoclinic structure of ellestadite is used in the refinements. Therefore, the hexagonal P63/m structure [20] without substitution of carbonate provides satisfactory results. In addition, the simultaneous refinements of the two ellestadite structures in sample D2, show an increase of hexagonal ellestadite from 5.3 to 10.1 wt% between 900 and 950 °C, whereas the amount of monoclinic ellestadite decreases from 23.1 to 14.3 wt% (S1). This supports the assumption that ellestadite crystallizes in the P63/m structure at high temperatures.
For the fits of the monoclinic hydroxylellestadite structure, the OH- groups (O13 and O14) were substituted by Cl and the site occupancies (SOF) for Ca2+, Cl, S6+, and C4+, were refined with constraints according to the equations above. The two distinct tetrahedral positions which are either fully (T (S)) or partially occupied by S (T (Si,S)) in the monoclinic structure were considered possible sites of C4+ incorporation. For the refinements, the SOFs were constrained to minimum values of 0 and maximum values of 1 and 0.5 for all atoms on T (S) and T (Si,S), respectively. The results from the Rietveld refinement show that the substitution takes place in both tetrahedral positions (S2). The sums of the sulfate atoms per formula unit resulting from the refinements of the S6+ occupancies (SOF) are shown in Figure 4b. At the same time, an oxygen deficiency should be expected. It possibly takes place in sites common for S (C) and these with Ca deficiency. The occupancies of oxygen sites were not refined due to over parametrization of the Rietveld refinement and low value of the atom form factor of oxygen. Ellestadite formed at low temperatures shows lower S6+ and therewith, higher C4+ contents. By increasing synthesis temperature, the amount of C4+ in ellestadite decreases.
SOFs for the Ca (1–8) positions were refined with constraints to a minimum value of 0 and maxima according to the values determined by Organova et al. [19]. Ca2+-deficiency is expected mainly in the split positions Ca (3–8), which are surrounding the three partly occupied Cl positions. The fully occupied Ca (1) and Ca (2) positions show no replacement, which is contrary to the observations of Fang et al. [20], but consistent with the structural position of these polyhedra that are not in the immediate neighborhood of the Cl sites. There is also no replacement observed for the sites Ca (4–8). The preferential site for Ca deficiency seems to be the Ca (3) position. Therefore, the vacancies on Ca (3) could be constrained to be half the vacancies on all Cl sites. Chlorine vacancies were determined on the O (13) and Cl (1) sites only. Figure 5 shows a fragment of the monoclinic structure of Ca10(SiO4)3(SO4)3Cl2 centered in the Ca (2) site. The tetrahedral sites have two vertices sharing with the rigid columns of Ca (1) and Ca (2) polyhedral. The remaining two vertices are shared with Ca (3–5) polyhedra. Ca (3) shares oxygens with the T (Si) site showing Ca deficiency in ellestadite formed at low temperature. The remaining tetrahedral sites accommodate S, Si, and C leading to a lower volume of the corresponding tetrahedra compared to T (Si) site. Calcium polyhedra Ca (4,5) tend to be fully occupied to compensate for the difference in the volumes of the tetrahedral sites. The chlorine contents in ellestadite are low for the samples synthesized at low temperatures, particularly for samples P with less sulfate. This is accompanied by a Ca deficiency in the Ca (3) site. The replacement of the sulfate group by carbonate combined with the Ca deficiency explains the shorter a and b ucp. in ellestadite at low temperatures (Figure 4c). The averaged composition of carbonate-containing, monoclinic SCE at 800 °C, therefore, corresponds to:
Ca 9.3   ±   0.05 ( SiO 4 ) 3 ( SO 4 ) 1   ±   0.3 ( CO 3 ) 2   ±   0.3 Cl 0.6   ±   0.1
The substitutions reduce the mass per formula unit from 1036.1 g/mol to 886.3 g/mol, i.e., by approx. 15%. With an only slightly reduced cell volume, the density also decreases significantly. In the high-sulfate samples D2, the chlorine content in monoclinic ellestadite increases from 0.8 to 1.2 between 800 and 1000 °C accompanied by the formation of high-chlorine (1.9) hexagonal ellestadite. Full occupation of T (S) and 50% of T (Si,S) by sulfur leads to the expansion of the a and b ucp. at higher temperatures. Further incorporation of Cl instead of O in the vicinity of O (13) and O (14) sites leads to shortening of the c ucp. as consistent with literature data (Figure 4d). In addition, the development of the c ucp. with temperature implies that the Ca (1,2) columns must be fully occupied by Ca from the very beginning, forming the backbone of the structure. No Ca deficiency is possible there, contrary to the suggestion by Fang et al. [20,21]. No significant decrease in chlorine content in hexagonal ellestadite formed at higher temperatures is observed. In summary, these results are consistent with the evolution of unit-cell volumes (Figure 4a) and reflect the low preference for chlorine incorporation at low temperatures in the presence of a CaCl2-rich melt. In addition, they show that although the chlorine position is not fully occupied, there is no loss of chlorine in ellestadite in samples P and D2 at high temperatures. Therefore, the quantity of ellestadite formed, and thus its chlorine content, strongly depend on the availability of sulfate in the system.
These observations are consistent with the results of Fang et al. [20], who observed the decrease in a-axis and the increase in c-axis by the replacement of chlorine with smaller fluorine atoms. This derives from the position of chlorine atoms. Contrary to other halogenide ions like fluorine, chlorine is not centered in the Ca (2) triangle at z = 1/4, but it is slightly displaced along c [20]. Therefore, the weak bonds to the Ca (2) atoms lead to a contraction in c. A slight increase in c ucp. (+0.02 Å) accompanied by a decrease in a ucp. (−0.01 Å) at 1200 °C is not reflected in the site occupancies.

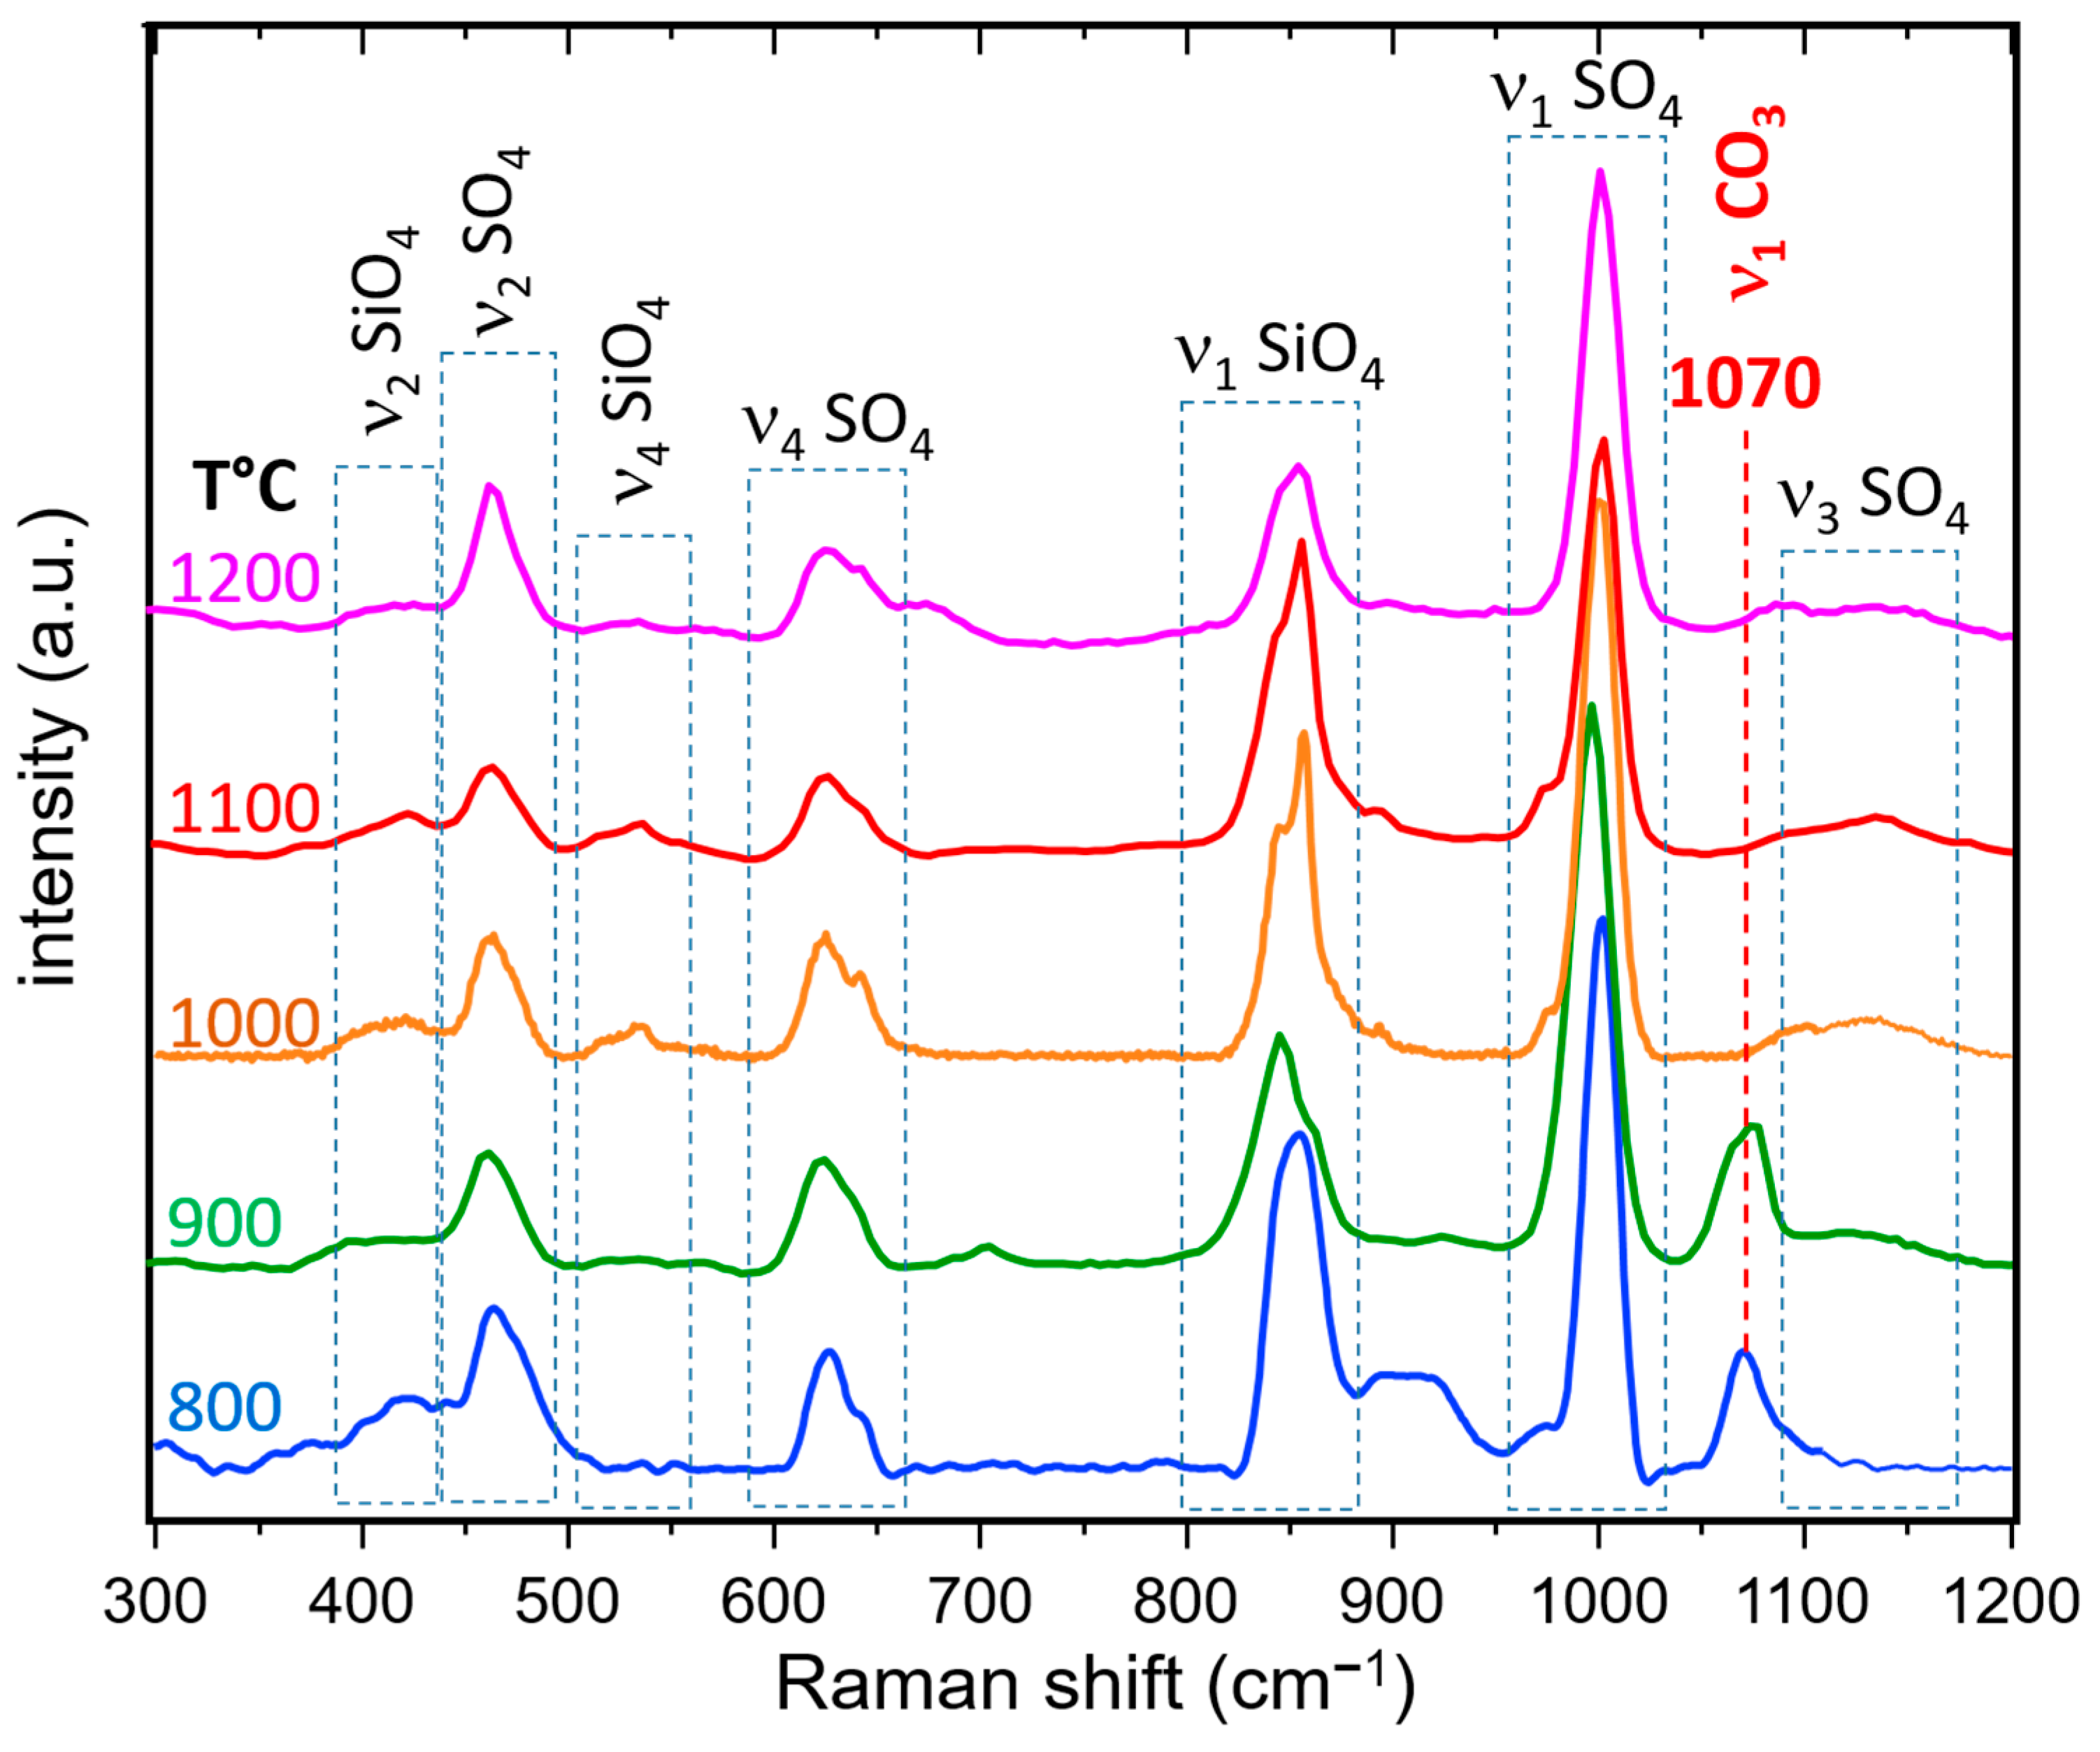
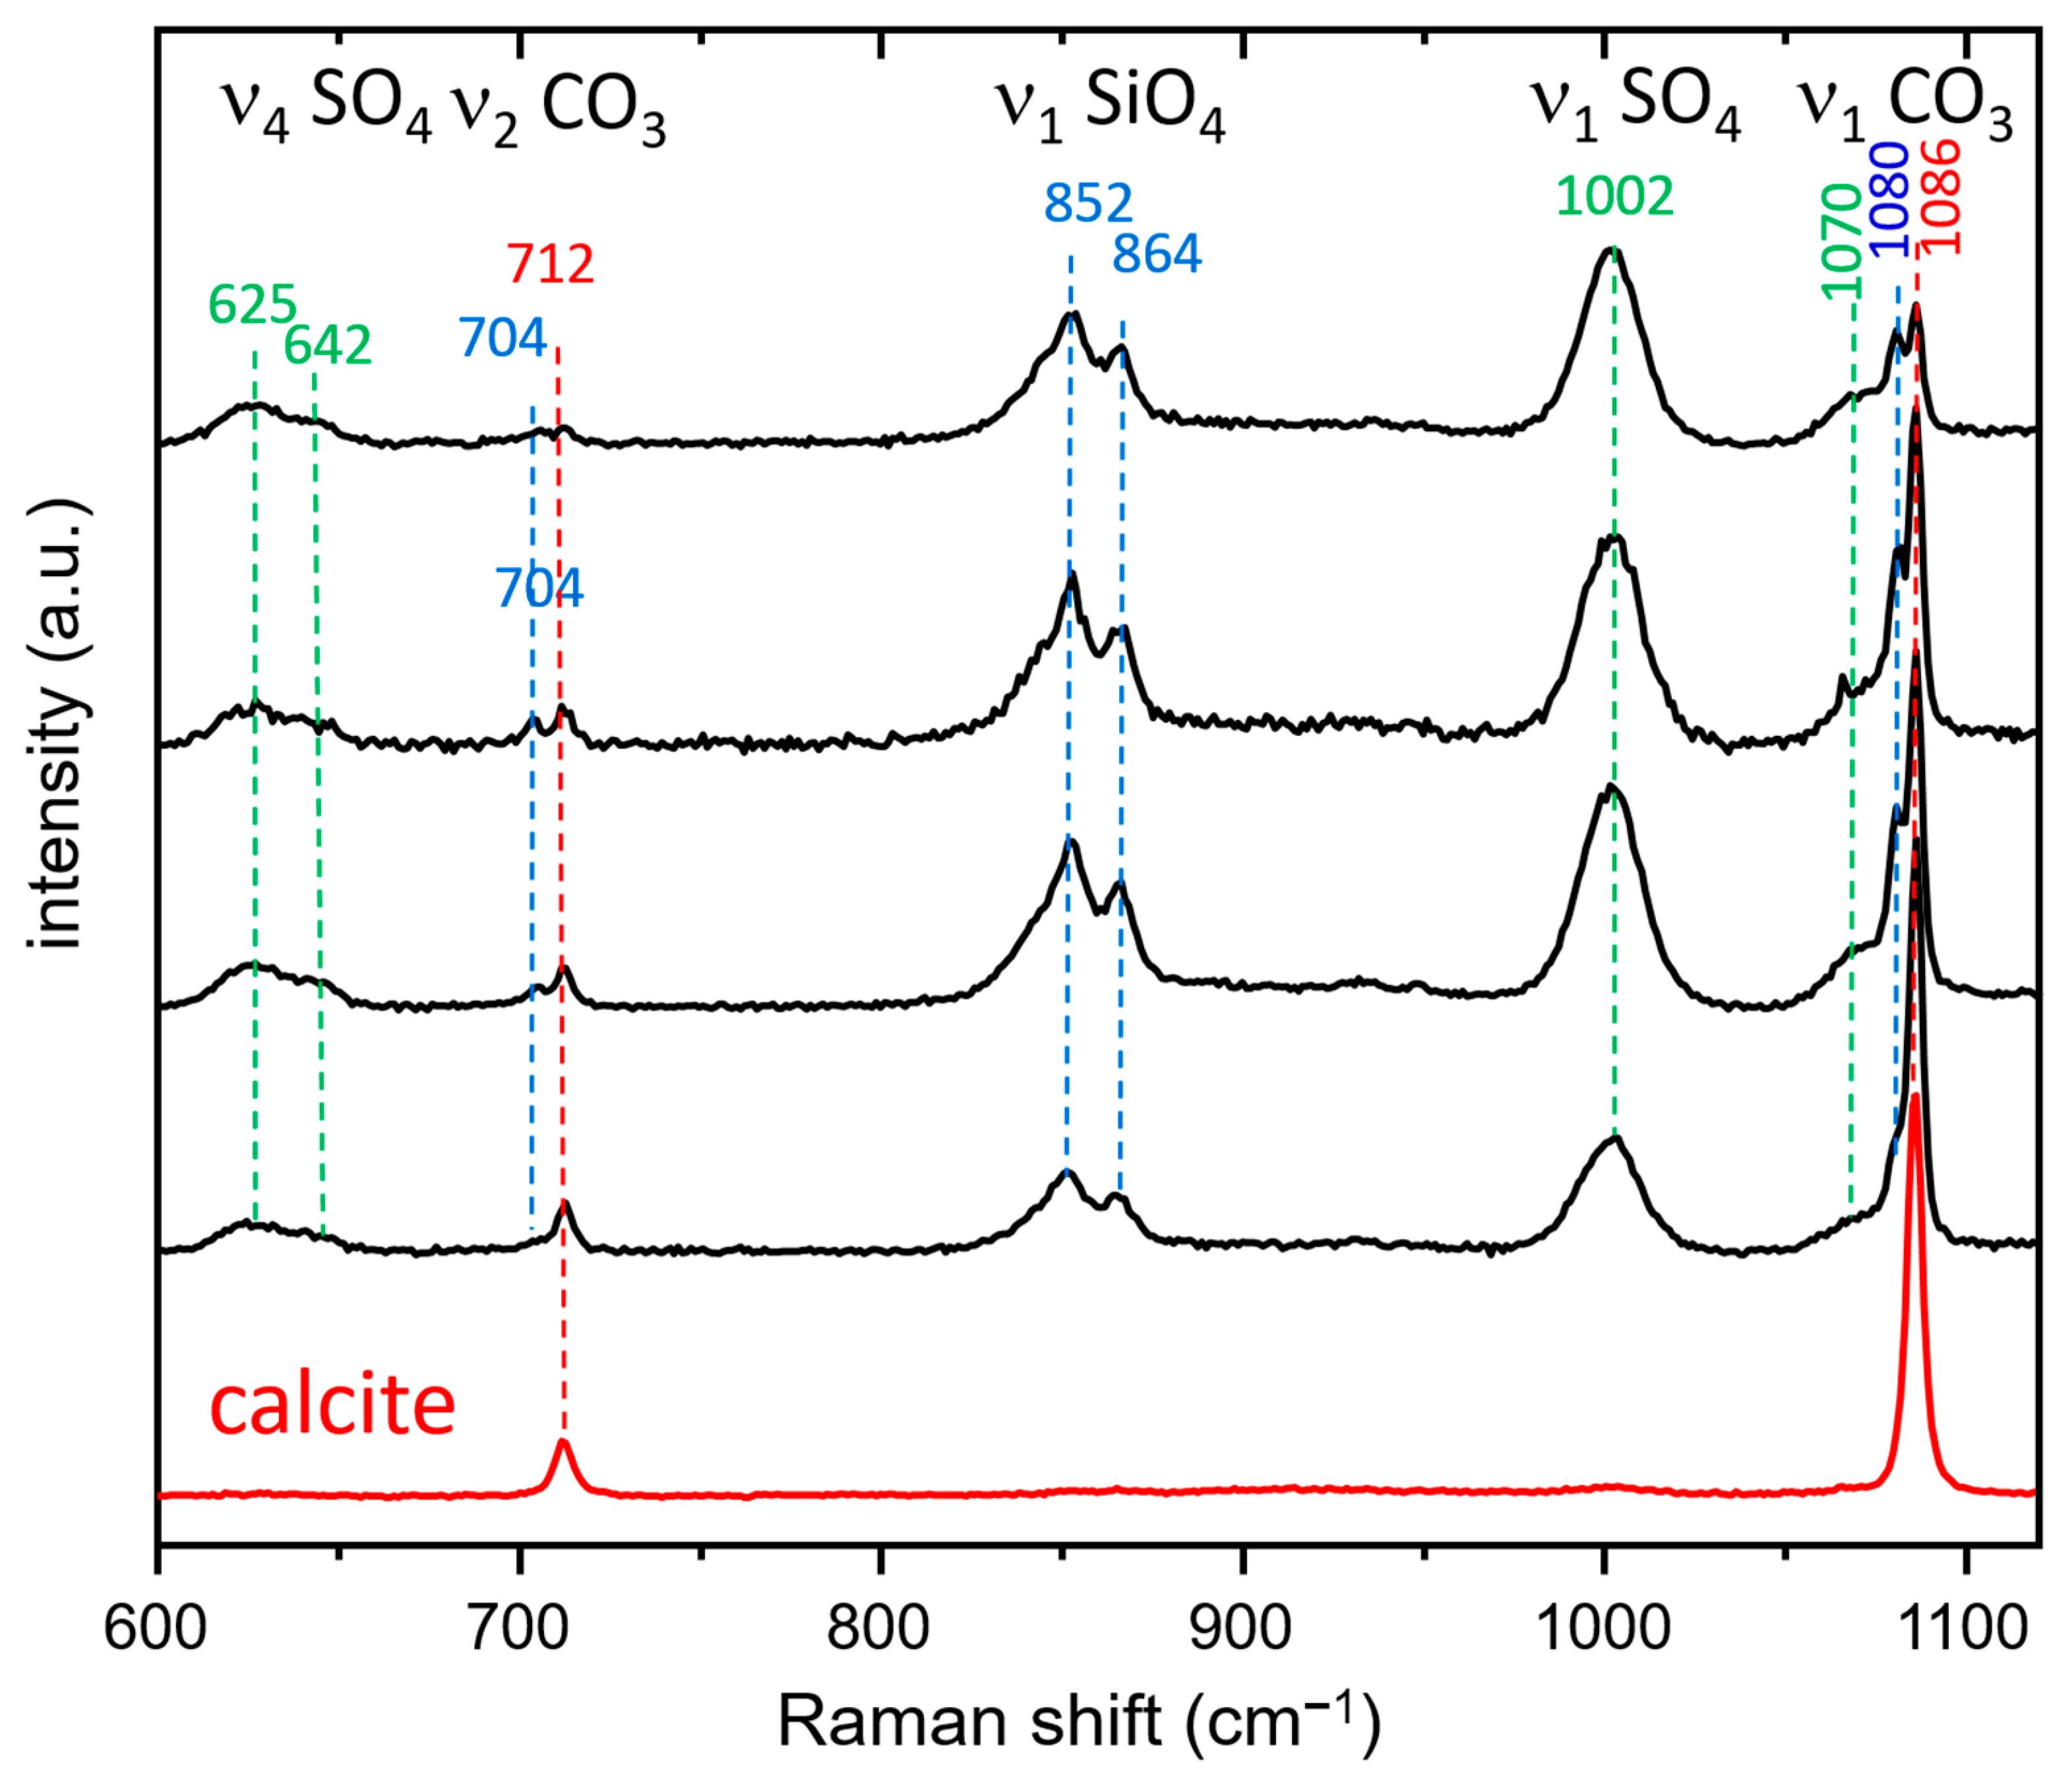
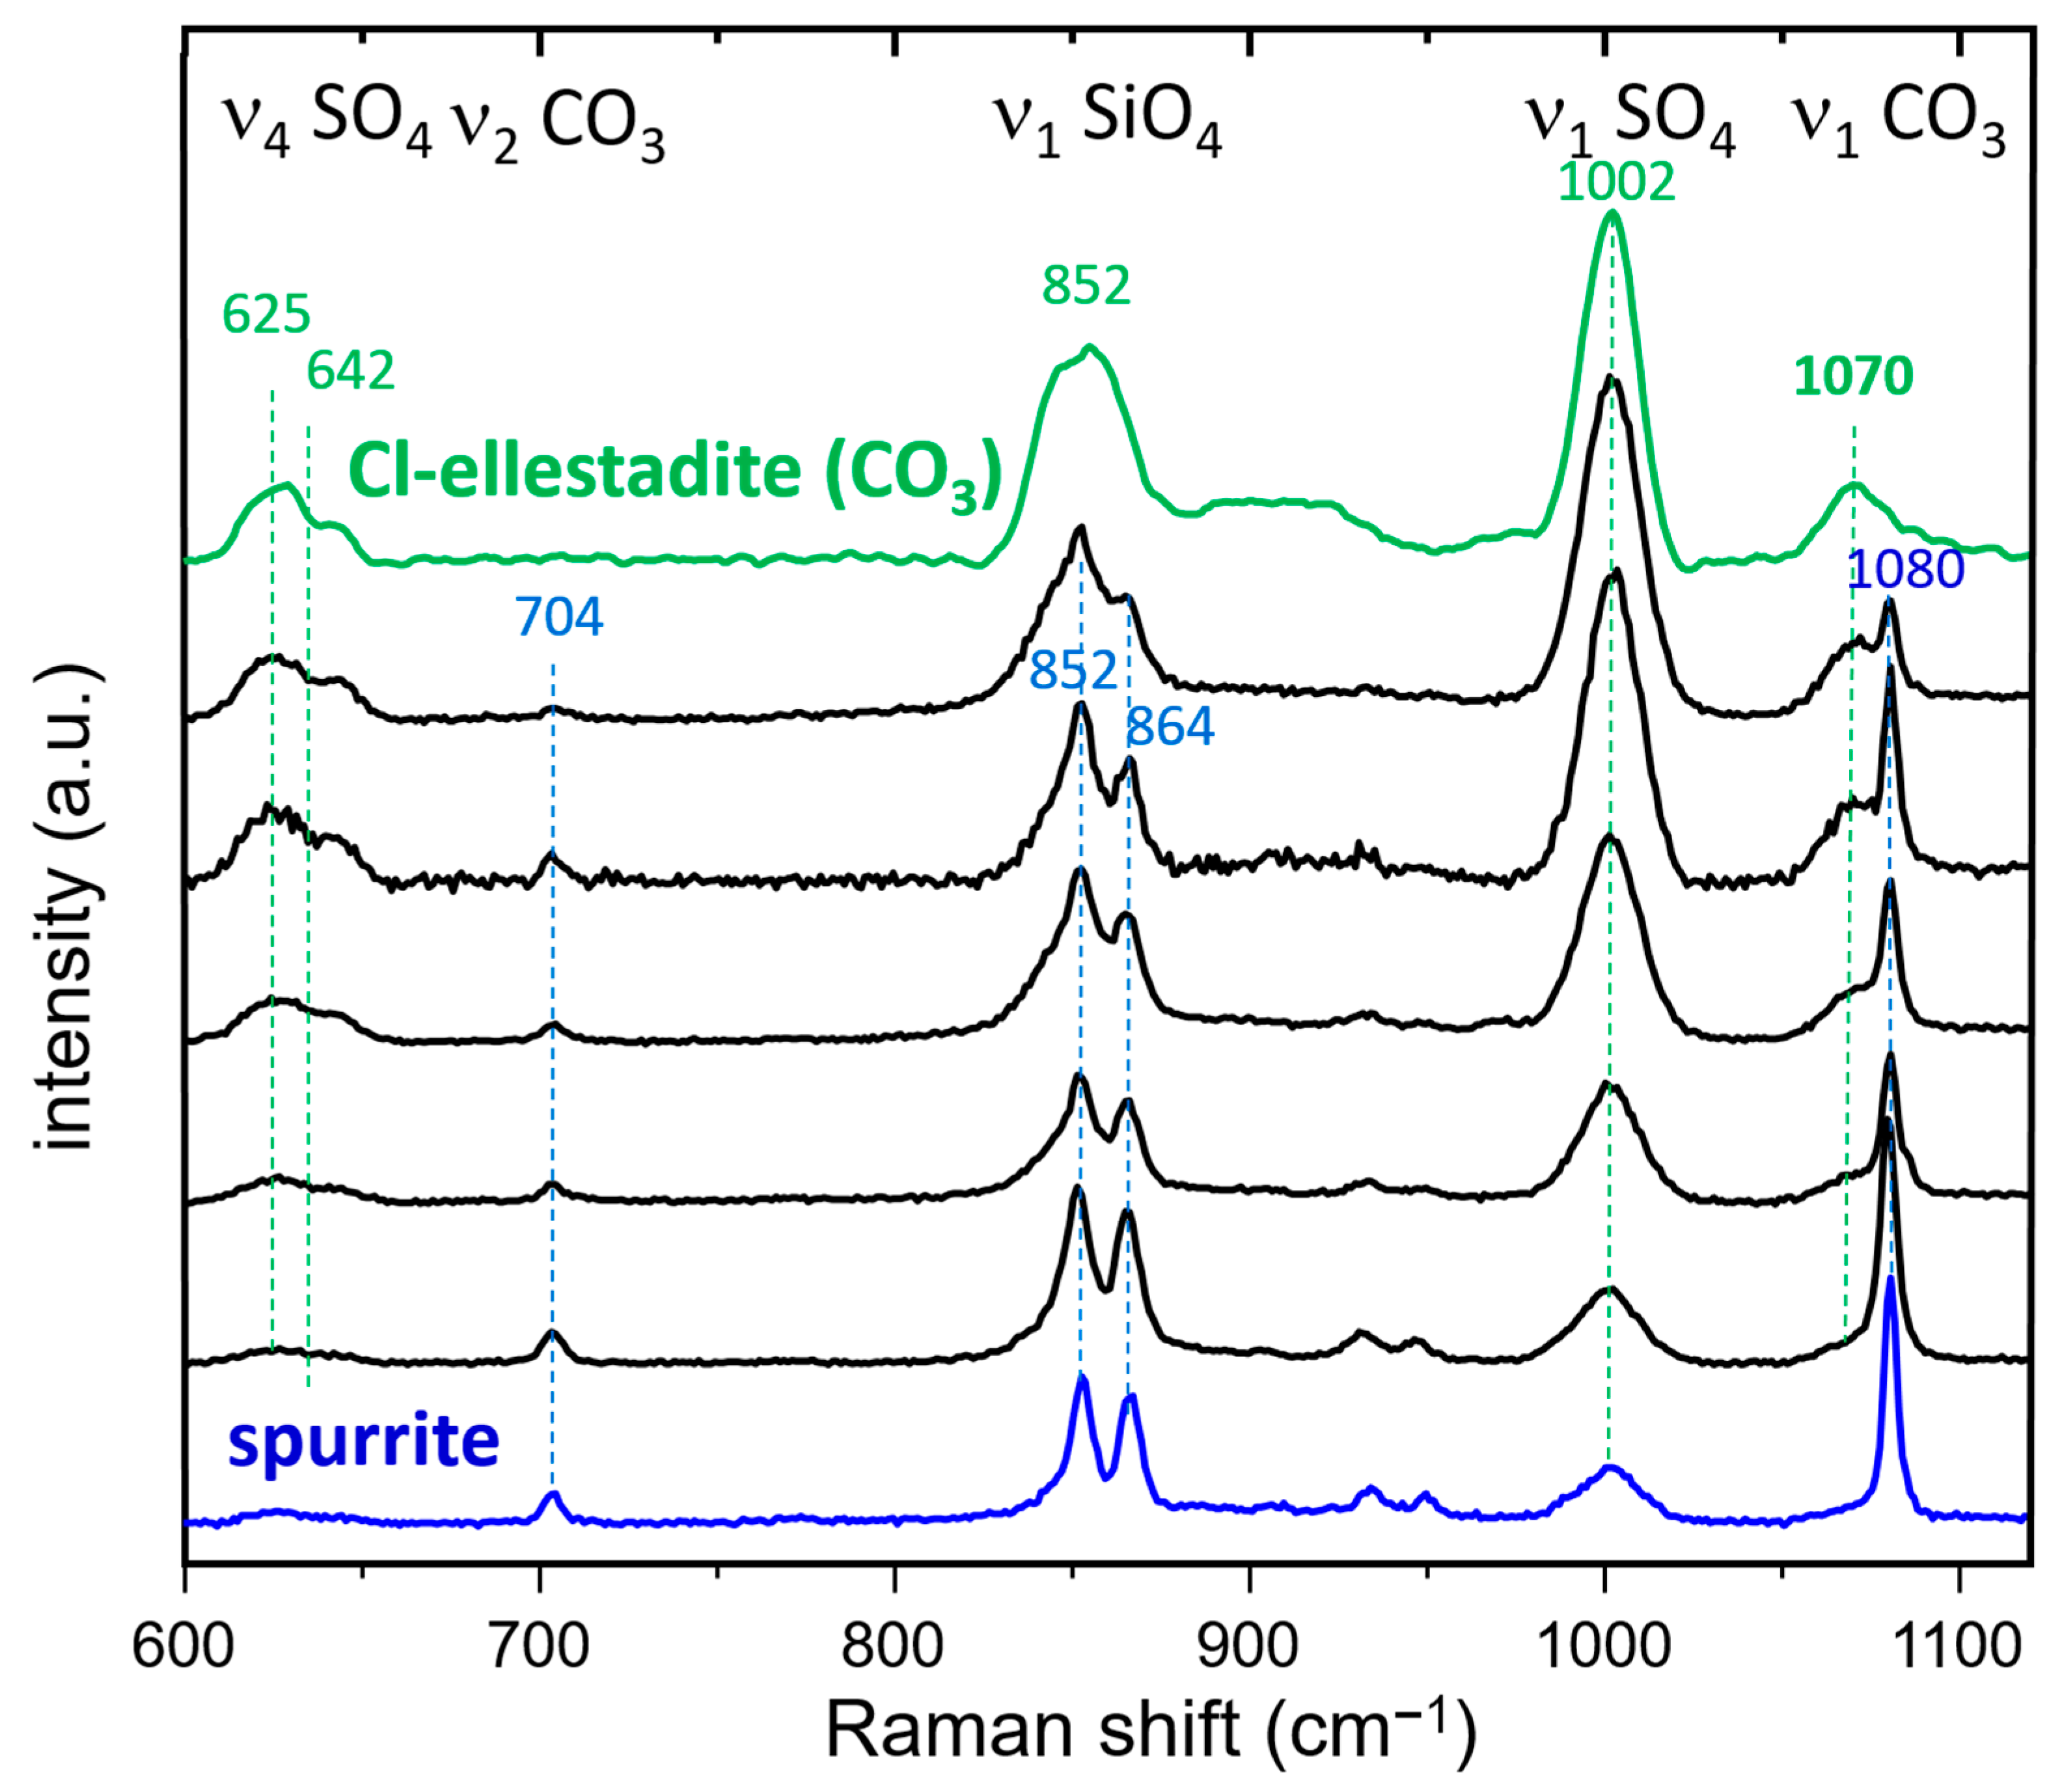
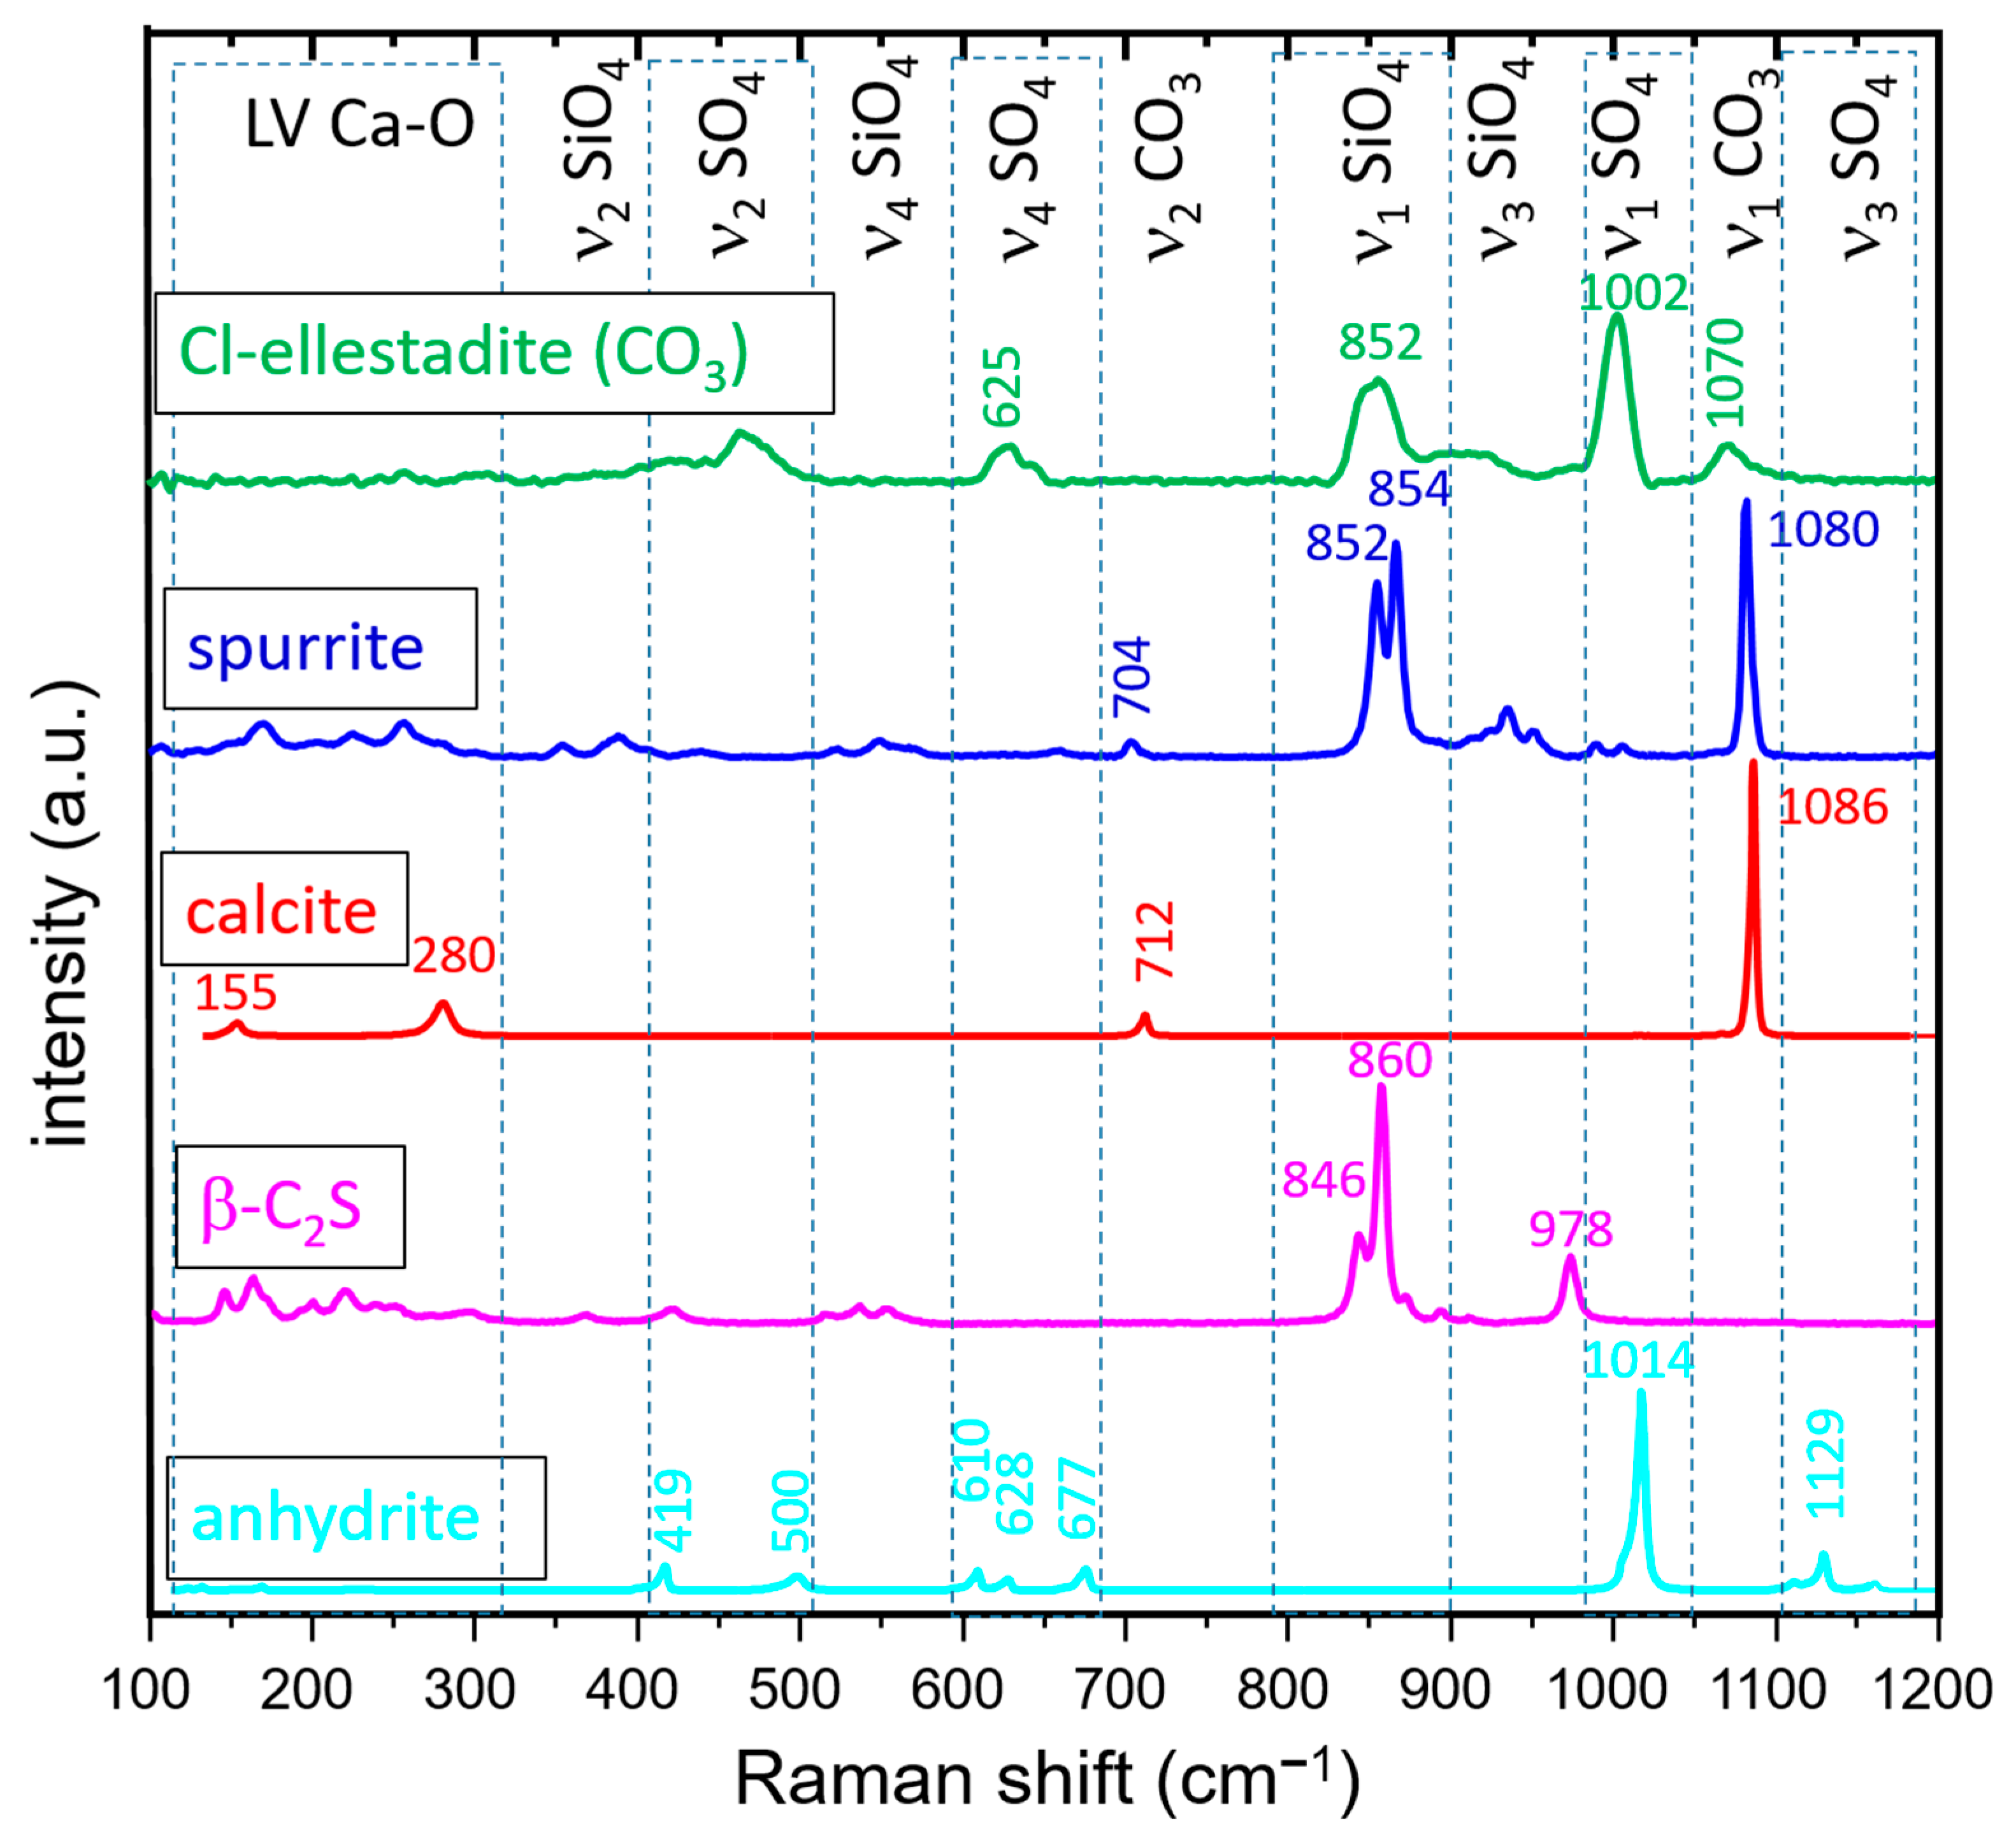
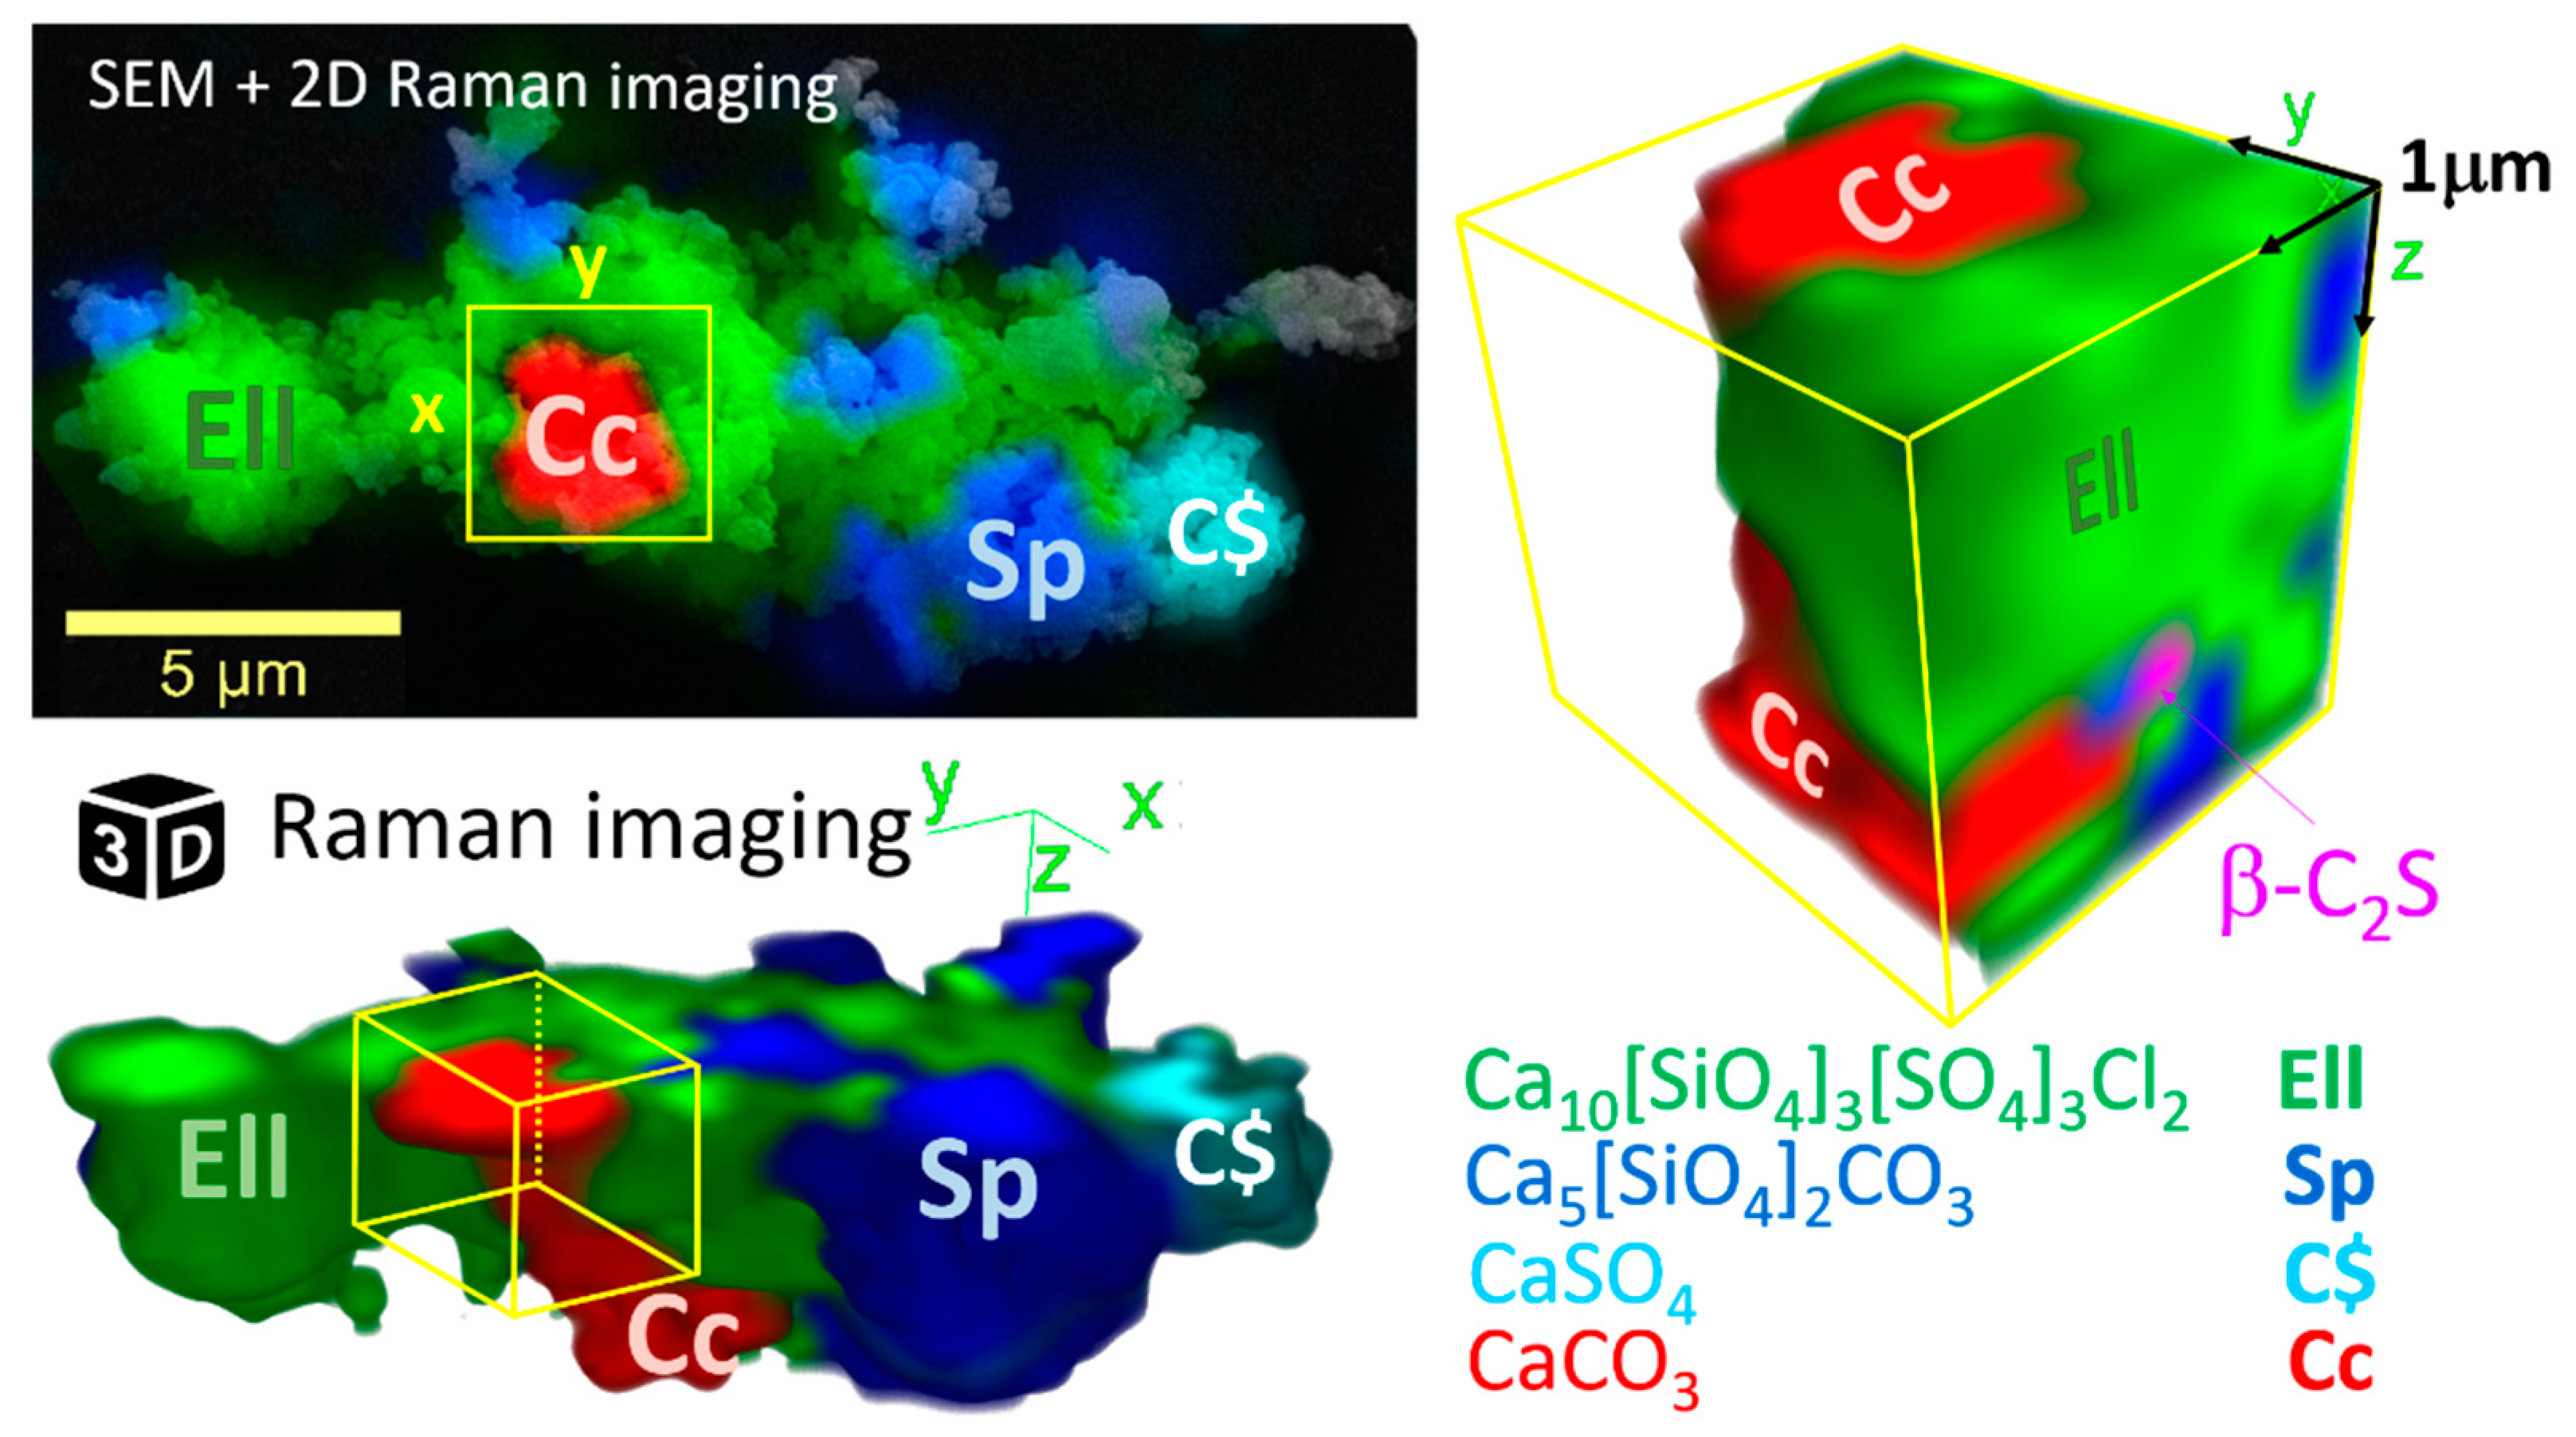
3.3.2. Raman Spectroscopy and Imaging

Spectroscopic investigation of ellestadite was the object of numerous studies [2,23,24,35,36]. The main bands in the Raman spectrum of Ca10(SiO4)3(SO4)3Cl2 correspond to the Si-O and S-O symmetrical stretching vibrations in tetrahedral sites. The presence of phosphate is normally indicated by a strong ν1 [PO4] vibration giving rise to an intense band at 958 cm−1, which is not present in our samples.
Figure 6 shows typical Raman spectra of SCE taken on D2 samples produced at 800, 900, 1000, and 1100 °C, and of P sample calcined at 1200 °C. The spectra are very similar to those already reported in the literature [2,34,35,36]. The main features represent bands due to fundamental vibrations of the SiO4 and SO4 groups. The most intense band is observed at 998–1002 cm1 assigned to ν1 (SO4). The analogous band of SiO4 appears at 852 cm−1 and, in our case, it is strongly influenced by the corresponding bands of β-C2S and spurrite due to the close intergrowth of these phases. In addition to these very intense bands, the spectrum shows bands at 625 and 642 cm−1 corresponding to the ν4 [SO4] bending vibrations. Analogous bands due to ν4 [SiO4] are seen at 536 and 572 cm−1 with much lower intensity. The band at 463 cm1 could be assigned to ν2 of (SO4) with partial overlap with corresponding SiO4 vibrations. The latter show much lower intensity than SO4 bands and can be ascribed to ν2 (SiO4) (400–450 cm−1). The low energetic part of the spectra (below 400 cm−1) will not be addressed in this study. For further details, refer to [24,35,37,38,39]. The spectral region between 1090 cm−1 and 1200 cm−1 comprises broad low-intensity bands due to ν3 SO4. The spectra of the samples produced at 800 and 900 °C show an additional broad band at 1070 cm−1, which could be assigned to ν1 of a carbonate group. Possible substitution of SO4 by CO3 was suggested by Banno et al. who determined a CO3 Raman band at 1076 cm−1 in the Si-rich part of the hydroxylapatite-hydroxylellestadite series [23]. In addition, Środek et al. [2] observed a band at 1078 cm−1, which they assigned to carbonate in the ellestadite structure. Comparing the results of the present study with theirs, it is also noticeable that all frequencies of the bands in our spectra are considerably lower (mostly by 6–7 cm−1). In addition, the existing Raman spectra (RRUFF database and literature data) show similar frequencies as those reported in their work. The spectra of the samples formed at T > 900 °C lack the carbonate band.
In summary, the data available show differences in the vibrational frequencies, which might be due mainly to two factors: (a) slightly different chemistry of the samples; and (b) use of different gratings and spectrometers. The 600 L/mm grating used in most of the studies has a resolution well between 3–10 cm−1 depending on focal length, exiting radiation, Raman shift, etc. The 1800 L/mm grating used in our study has a resolution lower than 1 cm−1. Furthermore, the mixed spectra of ellestadite, calcite, and spurrite (Figure 7), show that the bands of the last two lie exactly at the expected frequencies (ν1 CO3 calcite-1086 cm−1, ν1 CO3 spurrite-1080 cm−1), which excludes a shift in wavenumber positions due to instrumental aberration.
Figure 8 is representative for all possible variations of mixtures between ellestadite and spurrite observed in the spectra of sample HT[D2]_800. Samples calcined at that temperature contain mainly intermediate products such as spurrite, ellestadite, and unreacted SiO2, CaCO3, and lime, according to XRD. At this temperature stage, the phases are strongly intermixed and the acquisition of Raman spectra of single phases was relatively difficult. This is also reflected in Figure 7, which shows spectra of pure calcite and mixtures of calcite with spurrite and ellestadite.
It was possible to obtain pure basis spectra for calcite and ellestadite (Figure 9). However, it was not possible to obtain spectra for spurrite free of a sulfate band. Two main observations can be made: The ν1 CO3 stretching vibration of calcite and spurrite give rise to bands at 1086 and 1080 cm−1, respectively. The ν2 CO3 vibration results in bands at 712 and 704 cm−1, correspondingly. Thus, the contributions of calcite and spurrite in the mixed spectrum could be unambiguously differentiated.
In all mixed or pure spectra of ellestadite synthesized at low temperatures, the band at 1070 cm−1 is present. Therefore, the band at 1070 cm−1 could be assigned to CO3 incorporated in the ellestadite structure. The observations in the literature point to a frequency of 1078 cm−1 for carbonate in ellestadite [23], but the authors give a spectral resolution of 7 cm−1, whereas our spectra were taken with a resolution of <1 cm−1. A comparison of the ellestadite spectra of samples treated at 800 °C with those available in the literature or RRUFF database shows a lower intensity ratio for SO4 and SiO4 ν1 bands. This is further proof of the incorporation of CO3 in SO4 tetrahedral sites leading to SO4 deficiency and resulting in a decrease of the intensity of the ν1 SO4 band (Figure 6). Further evidence is the broadness and possible splitting of the SiO4 band centered at 855 cm−1. This observation infers the lowering of the symmetry of ellestadite, which was already discussed in the XRD part.
Spurrite and ellestadite are strongly intermixed on a very fine scale. This is deduced from the broadening of the bands (especially in the second spectrum from top in Figure 8). It results in the “smearing” of the characteristic double band of spurrite at 852 and 864 cm−11 SiO4). Further, even the purest spectrum of spurrite in this sample (Figure 8 bottom) shows the presence of a sulfate band (1002 cm−1). This in turn raises the question if spurrite could accommodate some SO4 in its structure given the presence of anhydrite upon thermal treatment.
Figure 10 shows a SE image of an aggregate of the sample treated at 800 °C and images of the elemental distribution of Ca, S, C, and Cl. In addition, a Raman map of the phase distribution of ellestadite, spurrite, calcite, and anhydrite is shown. The elemental distribution is quite uniform and fails to provide an assignment to a specific phase. It is due to the presence of finely distributed CaCl2 and other salts originating from the melt phase and to the similar Ca content in spurrite and ellestadite. Furthermore, the limits of lateral and depth resolution are reached. A comparison to the Raman image reveals that only the Cl and S distributions show some correlation with ellestadite. Therefore, all phases, but especially ellestadite and spurrite, seem to be intermingled on a very fine scale.
3D Raman imaging (Figure 11) proves the close intercalation of spurrite and ellestadite on a submicron level. The main phases found by Raman spectroscopy in the aggregate are calcite, ellestadite, spurrite, anhydrite, and a small amount of β-C2S, which spectra used for imaging are presented in Figure 9. Figure 11 (top) shows an overlay of the SEM microphotograph with the first layer (top to bottom) of the Raman image. It must be emphasized that the colors represent the major phase content in generally mixed spectra (as partially shown in Figure 8). Thus, they represent areas of relative enrichment of a certain phase compared to other phases. In this particular case is clear that the ellestadite and spurrite are the dominant phases in the mixture. Areas with relatively pure calcite and anhydrite could also be imaged (Figure 11 bottom). The cropped 3D image of the area marked as a yellow cube is presented in Figure 11 on the right side and shows the presence of β-C2S at the interface between ellestadite, calcite, and spurrite, formed in an early stage. Its grain size (around 300 nm) marks the limit of the spatial resolution of the confocal Raman spectroscopy.

4. Summary and Conclusions

Synthetic chlorellestadite is present at temperatures between 700 and 1200 °C in samples with different sulfate content. Results from X-ray diffraction combined with constrained Rietveld refinements and Raman spectroscopy show unambiguously several important findings:
(1)
At lower temperatures, a non-stoichiometric SCE seems to crystallize in a monoclinic symmetry similar to hydroxylellestadite (ICSD 39775).
(2)
The presence of a ν1 CO3 band (1070 cm−1) besides the characteristic bands of calcite and spurrite was detected by Raman spectroscopy. These CO32− groups are present at S1 and/or Si2 (50%S, 50%Si) positions in the P1121 structure, according to Rietveld refinements.
(3)
Incorporation of CO3 leads to shorter a/b ucp.s and a smaller cell volume similar to CO3-apatite [33,34].
(4)
At low temperatures (700–900 °C), there is CaCl2 deficiency in ellestadite revealed by refinements of the site occupancies of the Ca split positions and Cl (O13, O14) sites. Ca(3) seems to be preferential for Ca deficiency. The charge balance takes place preferentially in the neighborhood contrary to existing assumptions [20].
(5)
The averaged composition of carbonate-containing, monoclinic SCE at 800 °C corresponds to: Ca 9.3   ±   0.05 ( SiO 4 ) 3 ( SO 4 ) 1   ±   0.3 ( CO 3 ) 2   ±   0.3 Cl 0.6   ±   0.1 .
(6)
At low temperatures, SCE coexists with spurrite intermixed on a very fine nm scale. The large integral breadth of the ellestadite reflections also confirms this assumption.

Supplementary Materials

The following supporting information can be downloaded at: https://www.mdpi.com/article/10.3390/min12091179/s1, Table S1: Phase contents determined by XRD and Rietveld refinement, Table S2: Lattice parameters and site occupancies determined for ellestadite in sample mixtures D2 and P heated to 700–1200 °C.

Author Contributions

Conceptualization, K.G., A.U. and P.S.; formal analysis, A.U., K.G., G.B. and B.B.; investigation, A.U., K.G., G.B. and B.B.; writing—original draft preparation, A.U. and K.G.; writing—review and editing, G.B., B.B. and P.S.; funding acquisition, P.S.; All authors have read and agreed to the published version of the manuscript.

Funding

This research was funded by [BMBF], grant number [033R249D] (REPOST Project, 1 June 2019–31 May 2022, Available online: https://innovative-produktkreislaeufe.de/Projekte/REPOST.html (accessed on 1 July 2021)).

Data Availability Statement

Not applicable.

Acknowledgments

Many thanks go to Stefanie Kaufmann and Julia Podszuweit for the support in chemical analysis and XRD measurements. We also thank Michael Köhler for performing the high-temperature experiments.

Conflicts of Interest

The authors declare no conflict of interest.

References

  1. Pliego-Cuervo, Y.B.; Glasser, F.P. The role of sulphates in cement clinkering reactions: Phase formation and melting in the system CaO-Ca2SiO4-CaSO4-K2SO4. Cem. Concr. Res. 1977, 7, 477–481. [Google Scholar] [CrossRef]
  2. Środek, D.; Galuskina, I.O.; Galuskin, E.; Dulski, M.; Książek, M.; Kusz, J.; Gazeev, V. Chlorellestadite, Ca5(SiO4)1.5(SO4)1.5Cl, a new ellestadite-group mineral from Shadil-Khokh volcano, South Ossetia. Miner. Petrol 2018, 112, 743–752. [Google Scholar] [CrossRef]
  3. Engelsen, C. Effect of Mineralizers in Cement Production; SINTEF Report: Trondheim, Norway; Oslo, Norway, 2007; pp. 1–25. ISBN 978-82-536-0984-3. [Google Scholar]
  4. Yamashita, M.; Tanaka, H. Low-Temperature Burnt Portland cement Clinker Using Mineralizer. Cem. Sci. Concr. Technol. 2011, 65, 82–87. [Google Scholar] [CrossRef]
  5. Hunsinger, H.; Beuchle, G.; Stemmermann, P.; Schweike, U.; Giziewicz, K.; Garbev, K. Method for producing dicalcium silicate. U.S. Patent 9,751,771B2, 5 September 2017. [Google Scholar]
  6. Böhme, N.; Hauke, K.; Neuroth, M.; Geisler, T. In situ Hyperspectral Raman Imaging of Ternesite Formation and Decomposition at High Temperatures. Minerals 2020, 10, 287. [Google Scholar] [CrossRef]
  7. Martauz, P.; Strigá, J.; Jamnický, M. Decreasing chloride levels in cement rotary kiln atmosphere by sorption into hydroxylapatite structure. Mat. Sci. 2007, 60, 1–12. [Google Scholar]
  8. Saint-Jean, S.J.; Jøns, E.; Lundgaard, N.; Hansen, S. Chlorellestadite in the preheater system of cement kilns as an indicator of HCl formation. Cem. Concr. Res. 2005, 35, 431–437. [Google Scholar] [CrossRef]
  9. Gerassimidou, S.; Velis, C.A.; Williams, P.T.; Castaldi, M.J.; Black, L.; Komilis, D. Chlorine in waste-derived solid recovered fuel (SRF), co-combusted in cement kilns: A systematic review of sources, reactions, fate and implications. Crit. Rev. Environ. Sci. Technol. 2020, 51, 140–186. [Google Scholar] [CrossRef]
  10. Chen, M.; Fang, Y. The Chemical Composition and Crystal Parameters of Calcium Chlorosulfatosilicate. Cem. Concr. Res. 1989, 19, 184–188. [Google Scholar] [CrossRef]
  11. Stemmermann, P.; Pöllmann, H. The system CaO-SiO2-CaCl2-phase equilibria and polymorphs below 1000 °C. An interpretation on garbage combustion ashes. Neues Jahrb Miner. Monatsh 1992, 9, 409–431. [Google Scholar]
  12. Chesnokov, B.V.; Vilisov, V.; Bushmakin, A.; Kotlyarov, V.; Belogub, E.V. New minerals from a fired dump of the Chelyabinsk coal basin. Ural. Miner. Zbor. 1994, 3, 3–34. [Google Scholar]
  13. Hermoneit, B.; Ziemer, B.; Malewski, G. Single crystal growth and some properties of the new compound Ca3Si2O7∙13CaCl2. J. Cryst. Growth 1981, 52, 660–664. [Google Scholar] [CrossRef]
  14. Galuskin, E.V.; Galuskina, I.O.; Lazic, B.; Armbruster, T.; Zadov, A.E.; Krzykawski, T.; Banasik, K.; Gazeev, V.M.; Pertsev., N.N. Rusinovite, Ca10(Si2O7)3Cl2: A new skarn mineral from the Upper Chegem caldera, Kabardino-Balkaria, Northern Caucasus, Russia. Eur. J. Miner. 2011, 23, 837–844. [Google Scholar] [CrossRef]
  15. Środek, D.; Juroszek, R.; Krüger, H.; Krüger, B.; Galuskina, I.; Gazeev, V. New Occurrence of Rusinovite, Ca10(Si2O7)3Cl2: Composition, Structure and Raman Data of Rusinovite from Shadil-Khokh volcano, south Ossetia and Bellerberg Volcano, Germany. Minerals 2018, 8, 399. [Google Scholar] [CrossRef] [Green Version]
  16. Pasero, M.; Kampf, A.R.; Ferraris, C.; Pekov, I.V.; Rakovan, J.; White, T. Nomenclature of the apatite supergroup minerals. Eur. J. Miner. 2010, 22, 163–179. [Google Scholar] [CrossRef]
  17. Saint-Jean, S.J.; Hansen, S. Nonstoichiometry in chlorellestadite. Solid State Sci. 2005, 7, 97–102. [Google Scholar] [CrossRef]
  18. Sudarsanan, K. Structure of Hydroxylellestadite. Acta Cryst. 1980, 36, 1636–1639. [Google Scholar] [CrossRef]
  19. Organova, N.I.; Rastsvetaeva, R.K.; Kuz’mina, O.V. The Crystal Structure of Low-Symmetry Ellestadite in Comparison with other Apatite-Like Structures. Kristallografiya 1994, 39, 278–282. [Google Scholar]
  20. Fang, Y.N.; Ritter, C.; White, T.J. Crystal chemical characteristics of ellestadite-type apatite: Implications for toxic metal immobilization. Dalton Trans. 2014, 43, 16031–16043. [Google Scholar] [CrossRef]
  21. Fang, Y.; Ritter, C.; White, T. The Crystal Chemistry of Ca10−y(SiO4)3(SO4)3Cl2−x−2yFx Ellestadite. Inorg. Chem. 2011, 50, 12641–12650. [Google Scholar] [CrossRef]
  22. Rouse, R.C.; Dunn, P. A contribution to the crystal chemistry of ellestadite and the silicate sulfate apatite. Am. Miner. 1982, 67, 90–96. [Google Scholar]
  23. Banno, Y.; Miyawaki, R.; Momma, K.; Bunno, M. A CO3-bearing member of the hydroxylapatite-hydroxylellestadite series from Tadano, Fukushima Prefecture, Japan: CO3-SO4 substitution in the apatite-ellestadite series. Mineral. Mag. 2016, 80, 363–370. [Google Scholar] [CrossRef]
  24. Avdontceva, M.S.; Zolotarev, A.A.; Krivovichev, S.V.; Krzhizhanovskaya, M.G.; Sokol, E.V.; Kokh, S.N.; Bocharov, V.N.; Rassomakhin, M.A.; Zolotarev, A.A. Fluorellestadite from burned coal dumps: Crystal structure refinement, vibrational spectroscopy data and thermal behavior. Mineral. Petrol. 2021, 115, 271–281. [Google Scholar] [CrossRef]
  25. Ullrich, A.; Garbev, K.; Schweike, U.; Köhler, M.; Bergfeldt, B.; Stemmermann, P. CaCl2 as a Mineralizing Agent in Low-Temperature Recycling of Autoclaved Aerated Concrete: Cl-Immobilization by Formation of Chlorellestadite. Minerals 2022, 12, 1142. [Google Scholar] [CrossRef]
  26. Lafuente, B.; Downs, R.T.; Yang, H.; Stone, N. The power of databases: The RRUFF project. In Highlights in Mineralogical Crystallography; Armbruster, T., Danisi, R.M., Eds.; De Gruyter: Berlin, Germany; München, Germany; Boston, MA, USA, 2016; pp. 1–30. [Google Scholar]
  27. Schneider, C.A.; Rasband, W.S.; Eliceiri, K.W. NIH Image to ImageJ: 25 years of image analysis. Nat. Methods 2012, 9, 671–675. [Google Scholar] [CrossRef] [PubMed]
  28. Schmit, H.; Pfeffer, W.; Rathgeber, C.; Hiebler, S. Experimental Investigation of the Concentration Dependent Maximum Storage Capacity of two Inorganic Phase Change Materials. Energy Procedia 2015, 73, 231–238. [Google Scholar] [CrossRef] [Green Version]
  29. Cacciotti, I. Cationic and Anionic Substitutions in Hydroxyapatite. In Handbook of Bioceramics and Biocomposites; Antoniac, I., Ed.; Springer: Manhattan, NY, USA, 2016; pp. 145–211. ISBN 978-3-319-12459-9. [Google Scholar]
  30. Freidina, E.; Fray, D. Phase diagram of the system CaCl2–CaCO3. Thermochim. Acta 2000, 351, 107–108. [Google Scholar] [CrossRef]
  31. Genge, M.J.; Jones, A.P.; Price, G. An infrared and Raman study of carbonate glasses: Implications for the structure of carbonatite magmas. Geochim. Cosmochim. Acta 1995, 59, 927–937. [Google Scholar] [CrossRef]
  32. LeGeros, R.Z. Effect of carbonate on the lattice parameters of apatite. Science 1965, 206, 403–404. [Google Scholar]
  33. Wilson, R.M.; Elliott, J.C.; Dowker, S. Rietveld refinement of the crystallographic structure of human dental enamel apatites. Am. Miner. 1999, 84, 1406–1414. [Google Scholar] [CrossRef]
  34. Harada, K.; Hagashima, K.; Nakao, K.; Kato, A. Hydroxylellestadite, a new apatite from Chichibu mine, Saitama prefecture, Japan. Am. Mineral. J. Earth Planet Mater. 1971, 56, 1507–1518. [Google Scholar]
  35. Onac, B.P.; Effenberger, H.; Ettinger, K.; Panzaru, S.C. Hydroxylellestadite from Cioclovina cave (Romania): Microanalytical, structural, and vibrational spectroscopy data. Am. Mineral. 2006, 91, 1927–1931. [Google Scholar] [CrossRef]
  36. Dulski, M.; Bulou, A.; Marzec, K.M.; Galuskin, E.V.; Wrzalik, R. Structural characterization of rondorfite, calcium silica chlorine mineral containing magnesium in tetrahedral position [MgO4]6−, with the aid of the vibrational spectroscopies and fluorescence. Spectrochim. Acta A Mol. Biomol. Spectrosc. 2013, 101, 382–388. [Google Scholar] [CrossRef]
  37. Frost, R.; Palmer, S.J.; Bouzaid, J.M.; Reddy, B.J. A Raman spectroscopic study of humite minerals. J. Raman Spectrosc. 2007, 38, 68–77. [Google Scholar] [CrossRef]
  38. Frost, R.L.; Palmer, S.J. Raman spectroscopic study of the minerals diadochite and destinezite Fe3+2(PO4,SO4)2(OH)·6H2O: Implications for soil science. J. Raman Spectrosc. 2011, 42, 1589–1595. [Google Scholar] [CrossRef]
  39. Frost, R.L.; Keeffe, E.C. Raman spectroscopic study of the selenite mineral mandarinoite Fe2Se3O9·6H2O. J. Raman Spectrosc. 2009, 40, 42–45. [Google Scholar] [CrossRef]
Figure 1. Synthetic crystalline phase contents in samples D2 and P after thermal treatment at 700–1200 °C. Only phase contents > 2 wt% are shown. (a) Consumption of raw materials (quartz + calcite + anhydrite) and formation of main products C2S (β-C2S + α′H-C2S) and ellestadite; (b) Chlorine-containing intermediate phases (chlormayenite and rusinovite);(c) Intermediate phases (spurrite, wollastonite and lime; lime in P < 0.5 wt%, wollastonite in D2 < 1.5 wt%); (d) Minor phases (chlorine free) formed at high temperatures: ternesite, bredigite, melilite, and rankinite, ternesite in P < 0.5 wt%, rankinite < 1 wt.%, and melilite < 1.5 wt% in D2.
Minerals 12 01179 g001
Figure 2. (a) Hexagonal structure of Ca9.82(SiO4)3(SO4)3Cl1.64 (ICSD: 262245: [20]); (b) monoclinic structure of Ca9.94(SiO4)3(SO4)3(O H)1.2O0.5Cl0.32 (ICSD: 39775, [19]). For explanation see text.
Minerals 12 01179 g002
Figure 3. XRD patterns of sample D2 calcined at different temperatures. (a) 21–23° 2 theta range, splitting of the hexagonal 020 reflection (1000 °C) to 002, 200, −202 monoclinic reflections (sample 800 °C). The decreasing intensity ratio of the 111/020 reflections in the samples from 1000 to 800 °C corresponds to incorporation of CO3 instead of SO4 groups; (b) 30.5–33.5° 2 theta range. Samples treated at 800, 900, and 950 °C, show very broad peaks pointing to lower symmetry and/or very small size of coherent scattering domains. The integral breadth of the doublet 211 and −312 with three additional reflections with low intensity (monoclinic) is 0.235° 2 theta in the 800 °C sample, whereas the corresponding hexagonal reflection 121 shows 0.135° 2 theta in the 1000 °C sample.
Minerals 12 01179 g003
Figure 4. Structural parameters of ellestadite as a function of synthesis temperature (hex = hexagonal, mcl = monoclinic): (a) variation of the unit-cell volume of hexagonal and monoclinic ellestadite in sample series D2 and P. For comparison, literature data of Ca9.82(SiO4)3(SO4)3Cl1.64 [20,21] is shown; (b) atoms per formula unit for sulfur and chlorine in ellestadite; and (c,d) variation of a-, b- and c-axes in ellestadite with synthesis temperature (700–950 °C: mcl and 1000–1200 °C: hex). The γ-angle in the monoclinic structure varies between 119.94 and 120.05°.
Minerals 12 01179 g004
Figure 5. Fragment of the structure of monoclinic Ca10(SiO4)3(SO4)3Cl2 according to the structure of Ca9.94(SiO4)3(SO4)3(O H)1.2O0.5Cl0.32 determined by Organova et al. [19]. T (S) and T (Si,S) tetrahedral sites can partially accommodate CO3 groups. Ca (3) is the site with Ca deficiency.
Minerals 12 01179 g005
Figure 6. Raman spectra of SCE D2 samples calcined at temperatures 800, 900, 1000, and 1100 °C (from bottom to top) In addition, the Raman spectrum of SCE obtained from calcination of the P sample at 1200 °C is shown (top). Samples 800 and 900 °C proof CO3 groups in the ellestadite structure.
Minerals 12 01179 g006
Figure 7. Raman spectra at different spots of the sample HT[D2]_800 showing different degrees of intermixing of calcite (bottom), spurrite, and ellestadite. The bands due to the ν1 CO3 vibration of calcite (1086 cm−1), spurrite (1080 cm−1), and ellestadite (1070 cm−1), can be clearly distinguished.
Minerals 12 01179 g007
Figure 8. Selected Raman spectra of HT[D2]_800 presenting different degrees of intermixing between spurrite (bottom) and CO3-ellestadite (top).
Minerals 12 01179 g008
Figure 9. Basis Raman spectra used for Raman imaging of HT[D2]_800. From top to bottom: ellestadite, spurrite, calcite, β-C2S, anhydrite.
Minerals 12 01179 g009
Figure 10. Electron microphotographs showing SE images of an aggregate of the sample HT[D2]_800 (a), the elemental distribution of Ca (b), S (c), Cl (d), and C (e). Superimposed Raman and SE image of the phase distribution of spurrite, ellestadite, calcite, and anhydrite (f).
Minerals 12 01179 g010
Figure 11. Top: overlay of an electron micrograph (SE) of an aggregate of sample D2 calcined at 800 °C with a corresponding Raman image of the phase distribution in false colors (red: calcite; blue: spurrite; green: ellestadite; light blue: anhydrite C$). Bottom: a 3D image of the same aggregate (same color scheme). Right: clipped 3D image of the cube marked as a yellow cube (rotated at 90°). Presence of β-C2S crystal (purple) formed at the interface between spurrite (Sp), ellestadite (Ell), and calcite (Cc).
Minerals 12 01179 g011
Table 1. Chemical composition and quantitative phase contents (XRD and Rietveld refinement) of the raw materials in wt%. Loss of Ignition = LoI. Additional contents of TiO2, Na2O, and K2O < 0.4 wt%. E.s.d.s of the Rietveld refinements are shown in parentheses. The samples contain additionally <1 wt% feldspar.
D2P
LoI27.5725.74
SiO222.5523.91
CaO41.844.28
SO35.042.11
Al2O31.241.64
Fe2O30.500.71
MgO0.380.6
Cl1.081.14
Amorphous33.7 (9)39.2 (6)
Quartz9.6 (1)6.98 (7)
Calcite47.5 (4)44.8 (3)
Vaterite1.5 (1)1.15 (9)
Aragonite1.4 (2)0.4 (1)
Tobermorite1.6 (2)4.3 (2)
Anhydrite4.3 (1)1.94 (9)
Bassanite0.3 (1)0.42 (9)
Sinjarite0.3 (1)0.7 (1)
Publisher’s Note: MDPI stays neutral with regard to jurisdictional claims in published maps and institutional affiliations.

