
Exploring High-Resolution Chemical Distribution Maps of Incompatible and Scarce Metals in a Nepheline Syenite from the Massif of “Serra de Monchique” (Portugal, Iberian Peninsula)
 , , , , , and
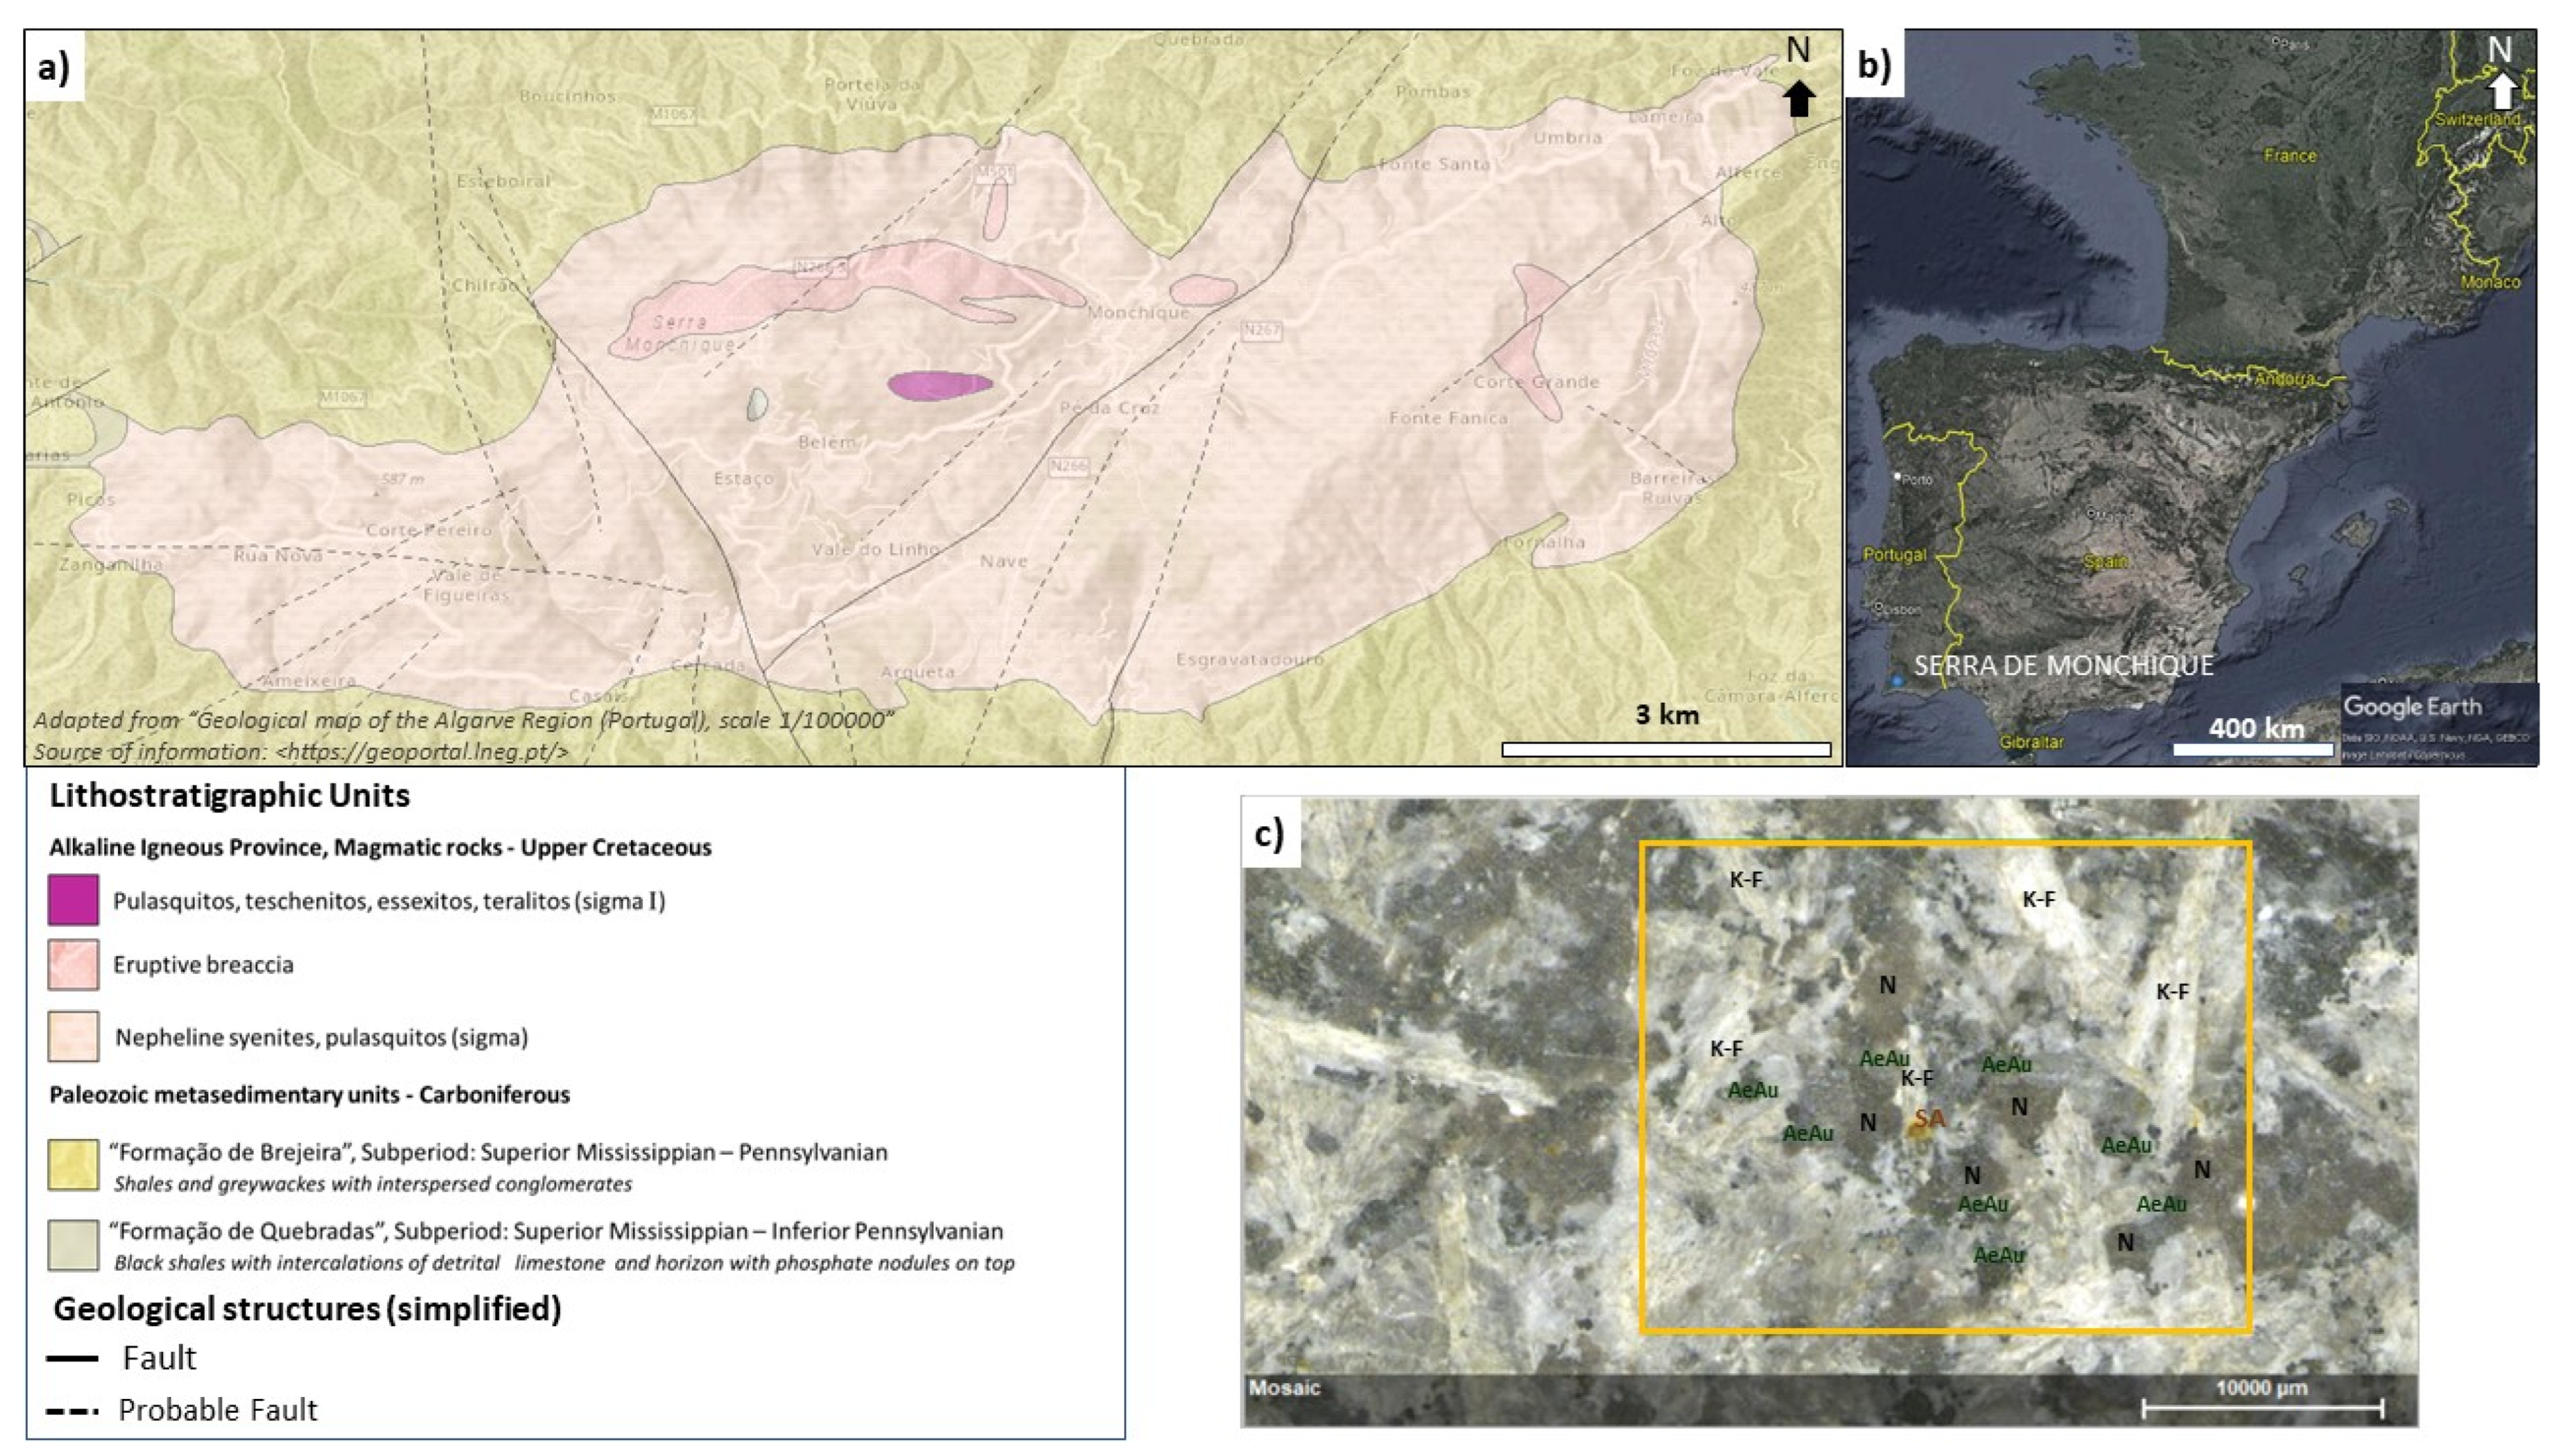
Abstract
:1. Introduction
2. Materials and Methods
2.1. The Nepheline Syenite of “Serra de Monchique” Massif
2.2. Micro X-ray Fluorescence Elemental Mapping
2.3. 2D Image Mapping Processing: Clustering RGB Pixel Analysis
2.4. Elemental Spatial Co-Localization in µ-EDXRF Maps
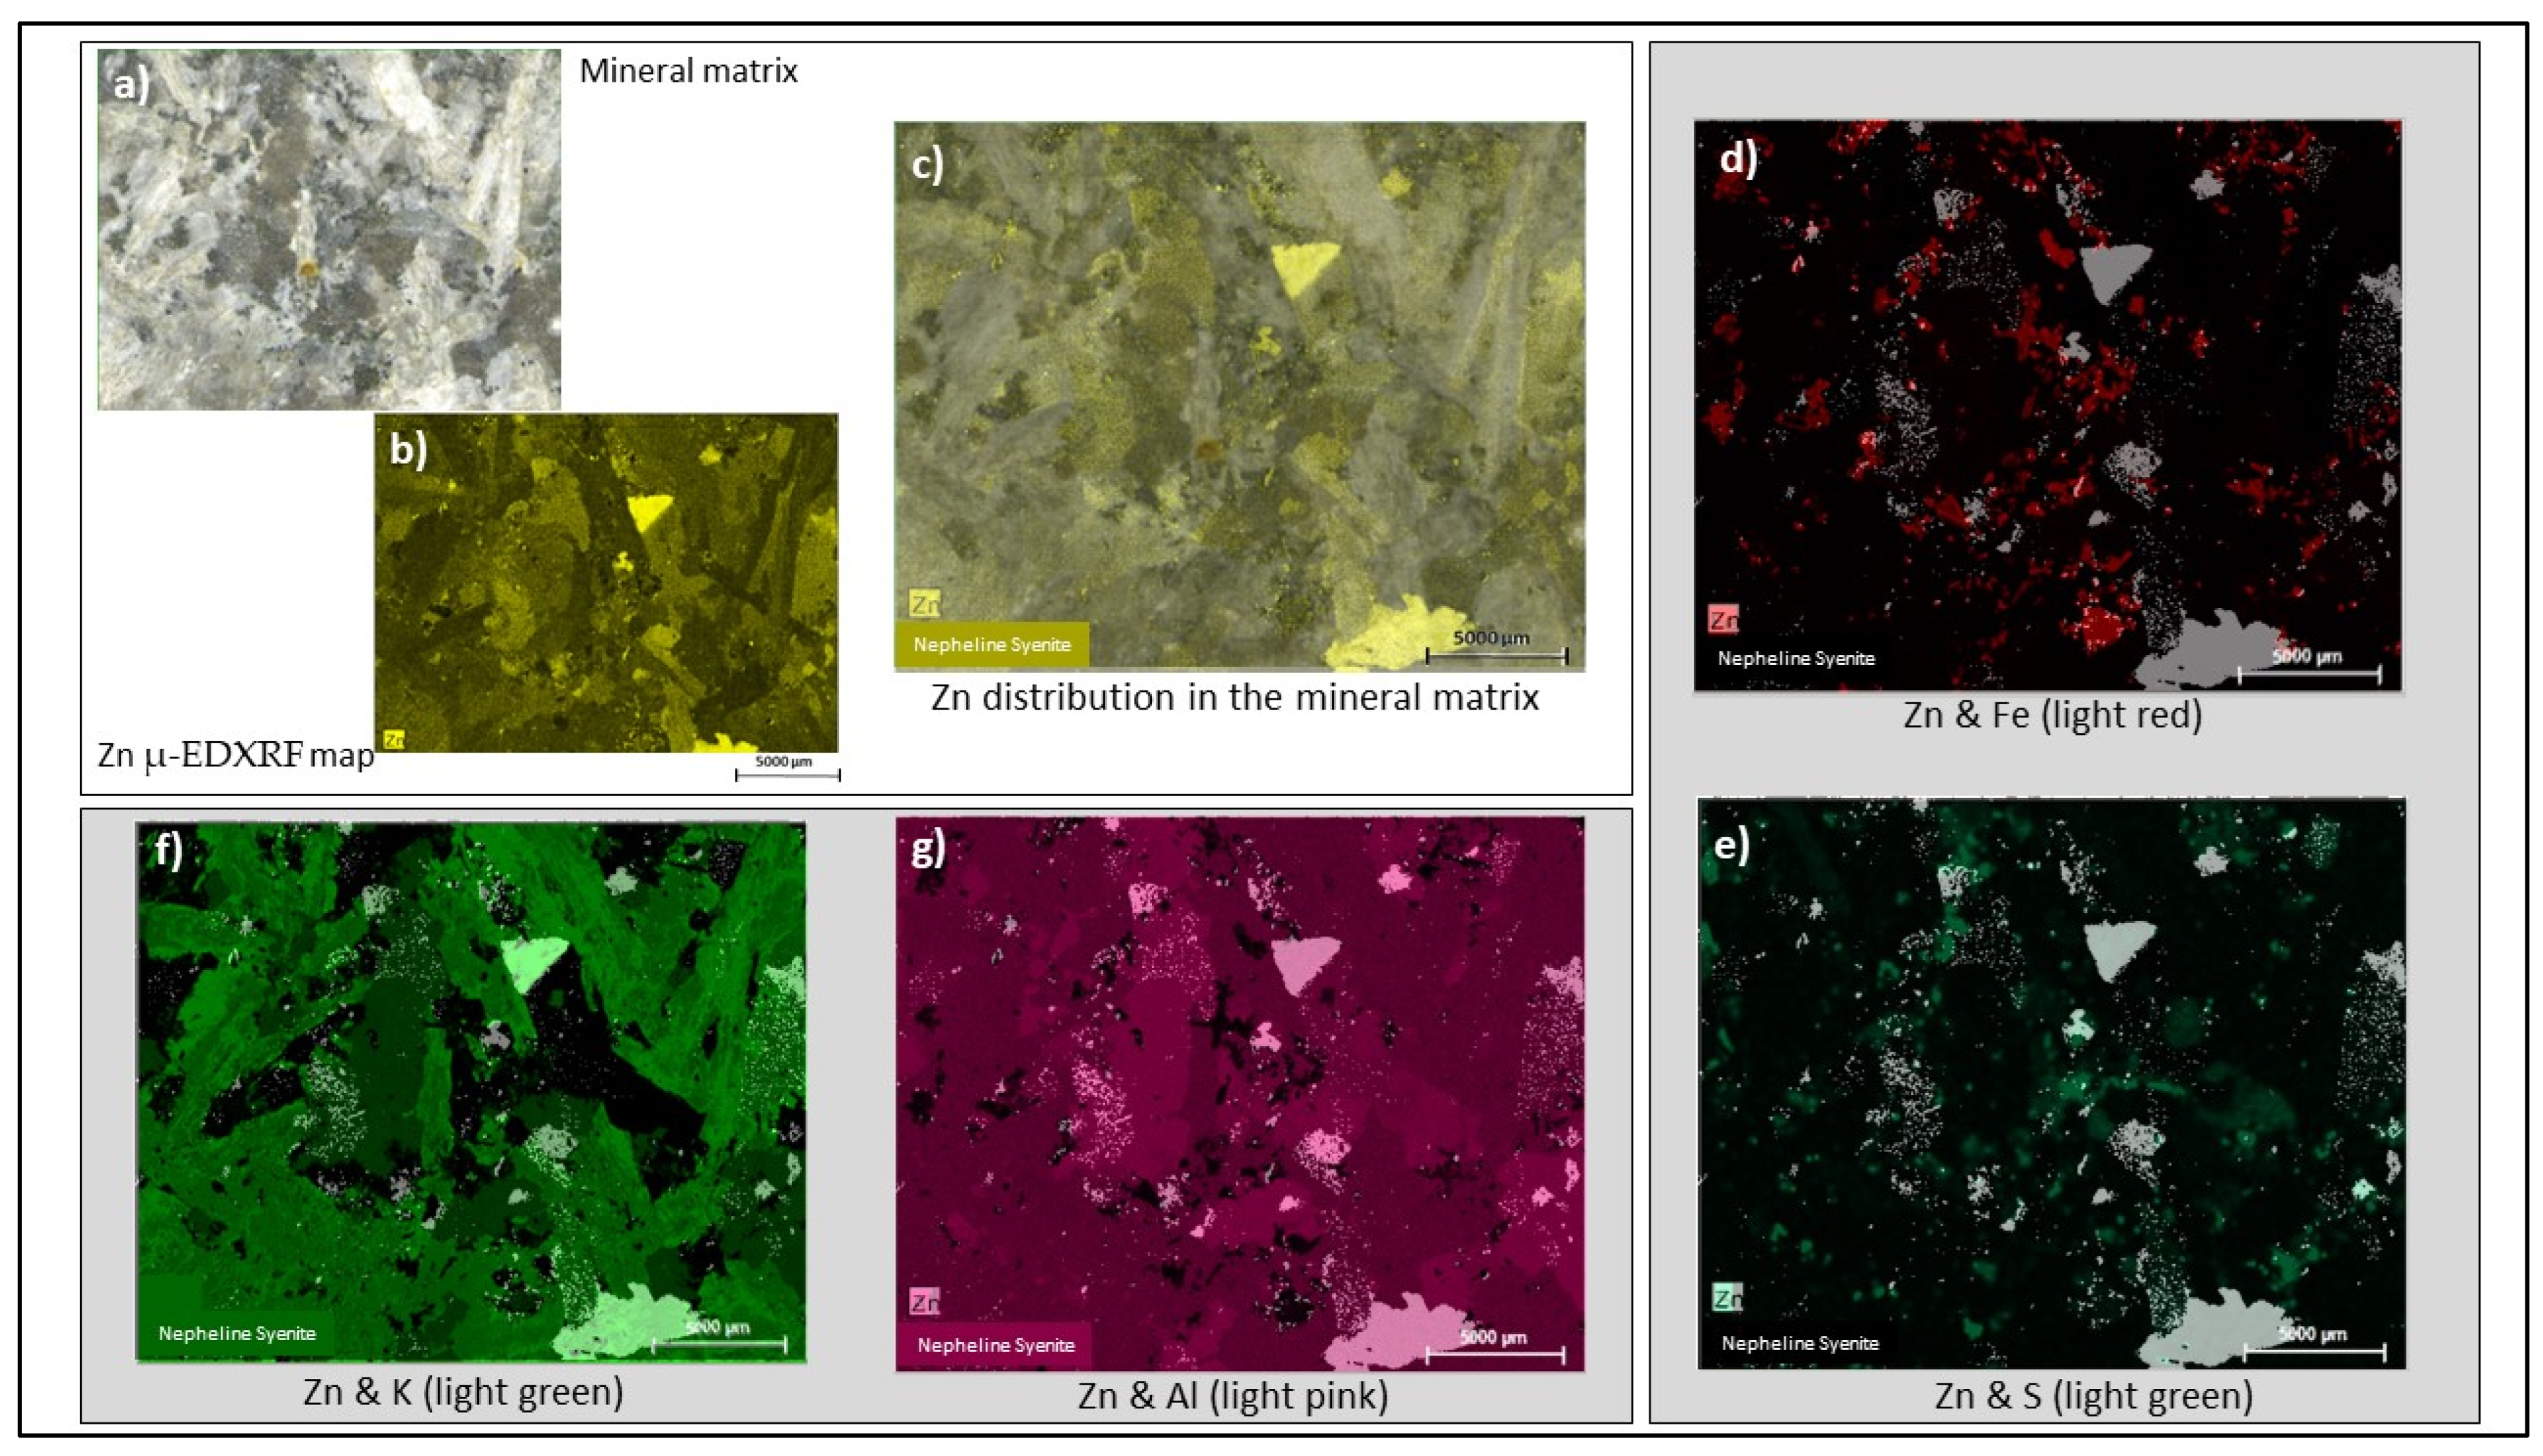
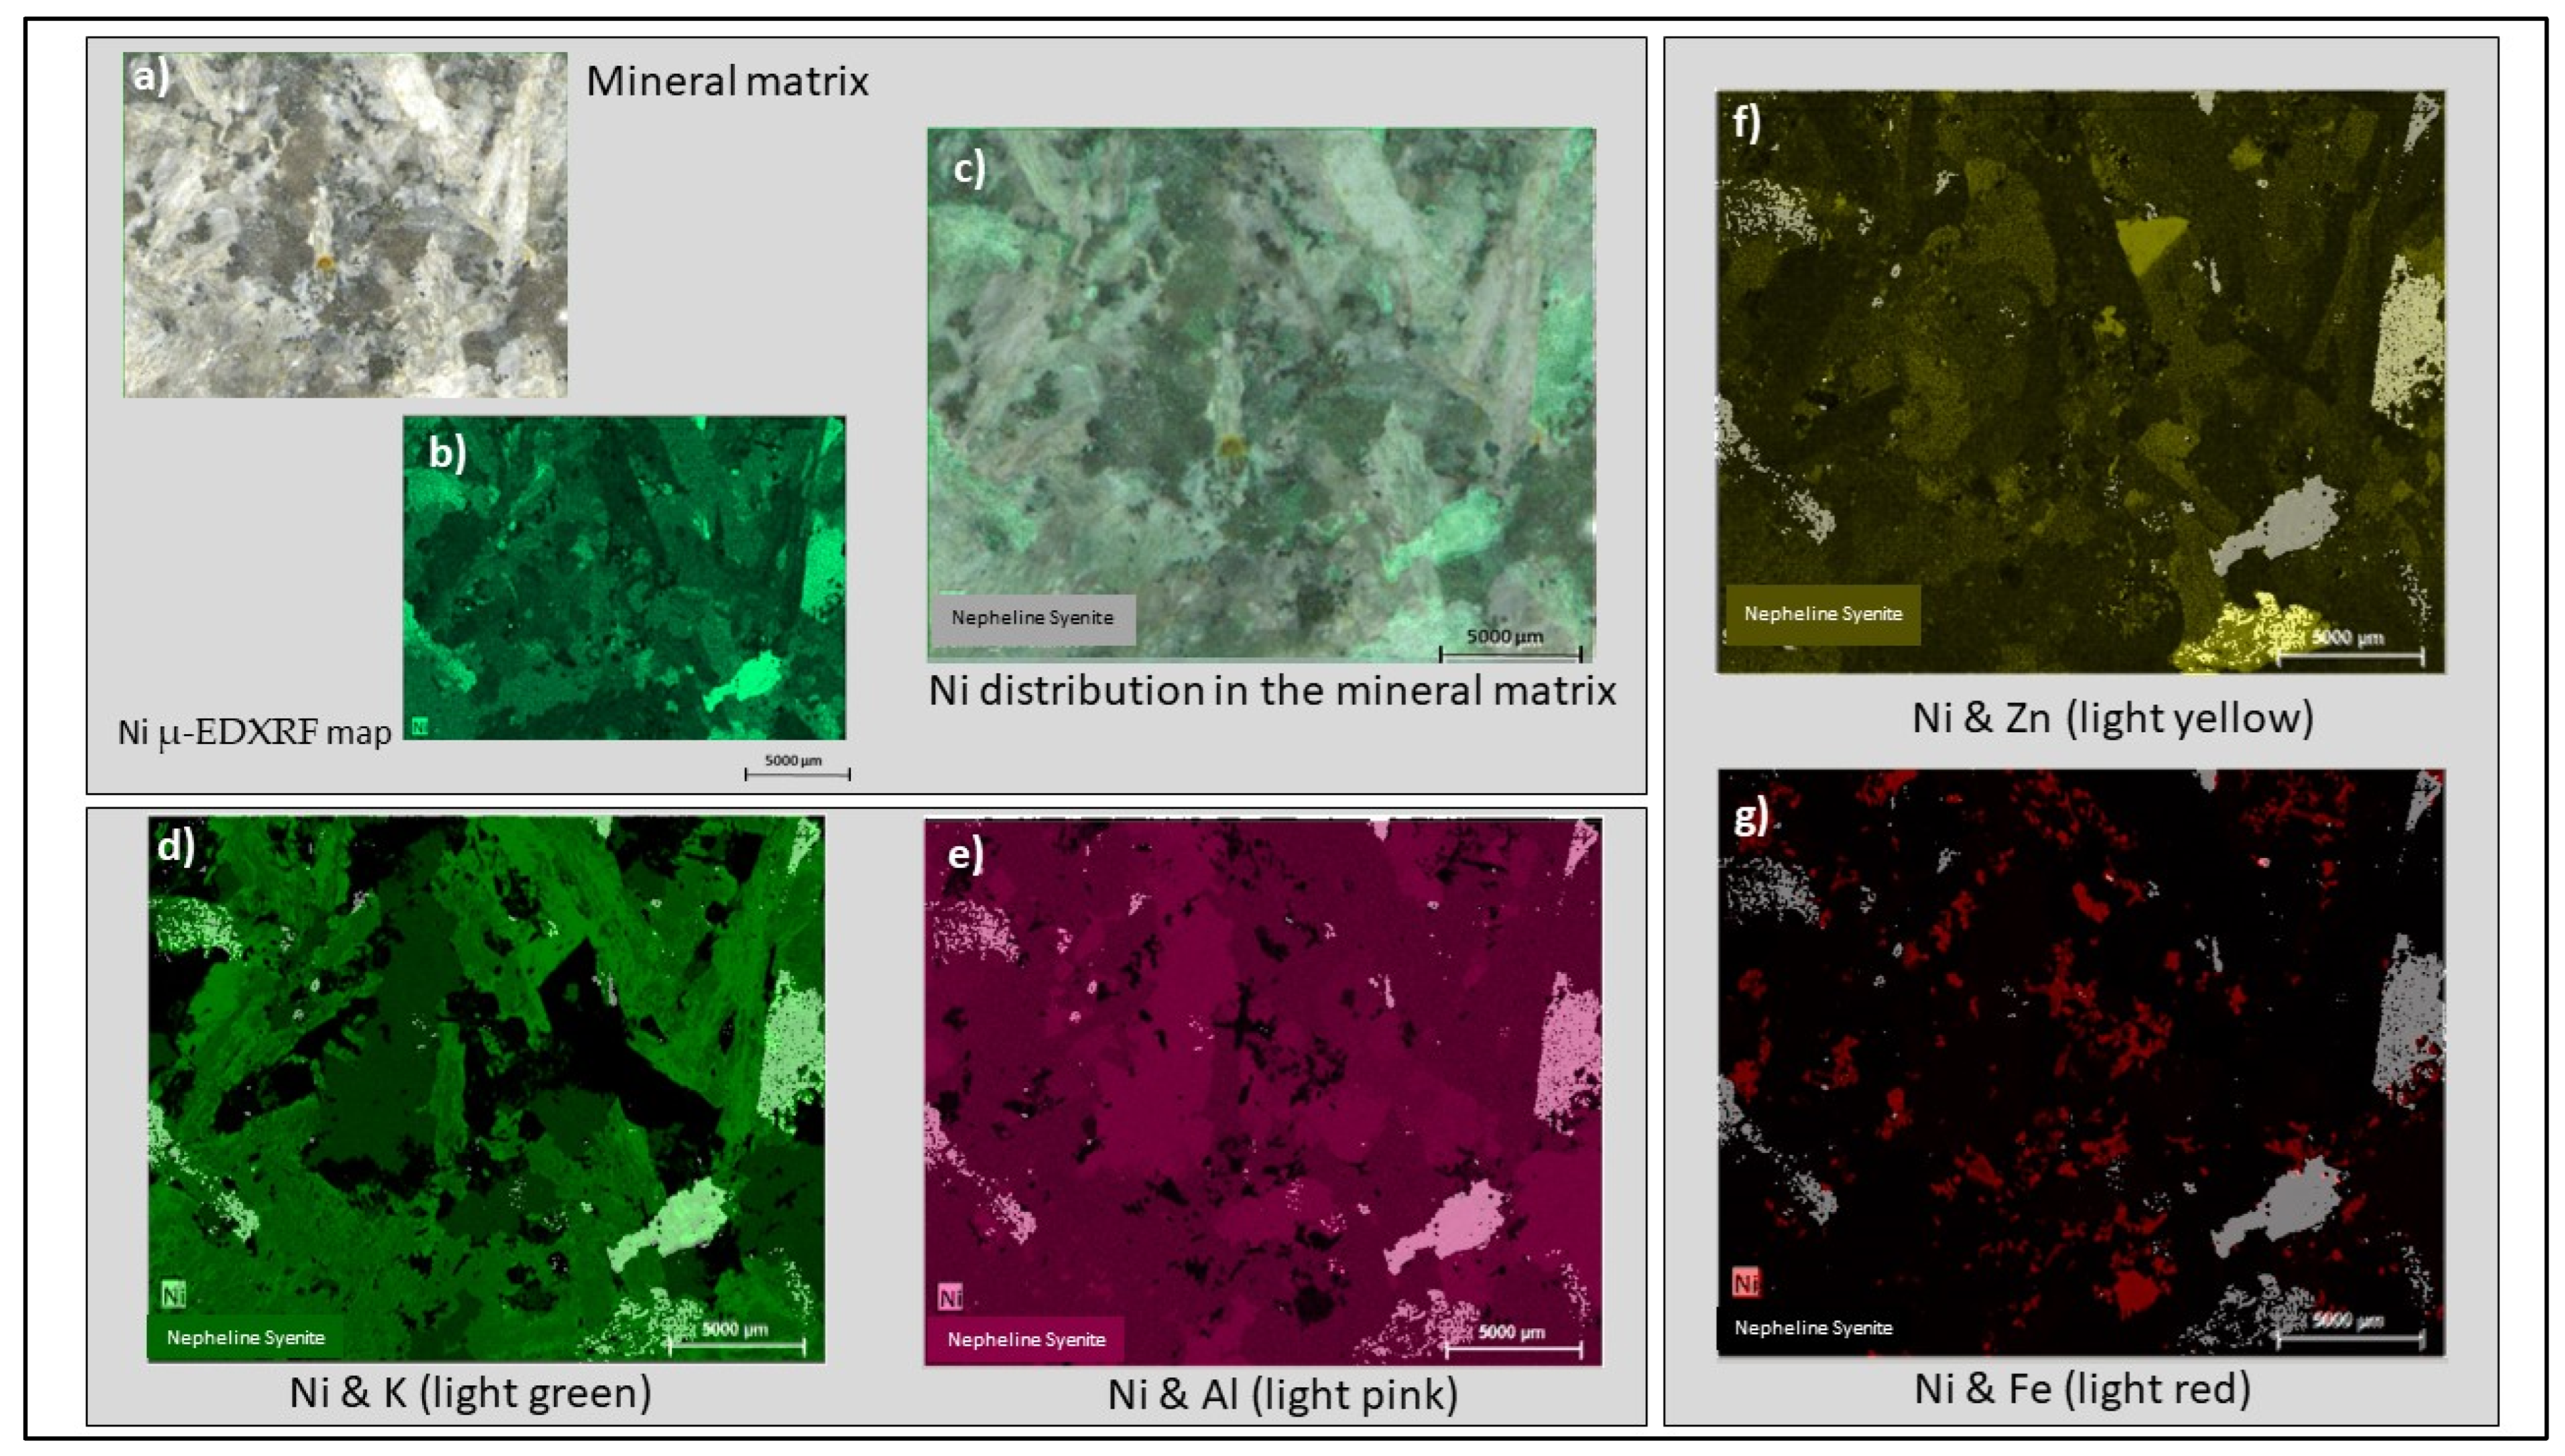
3. Results
3.1. Subsection
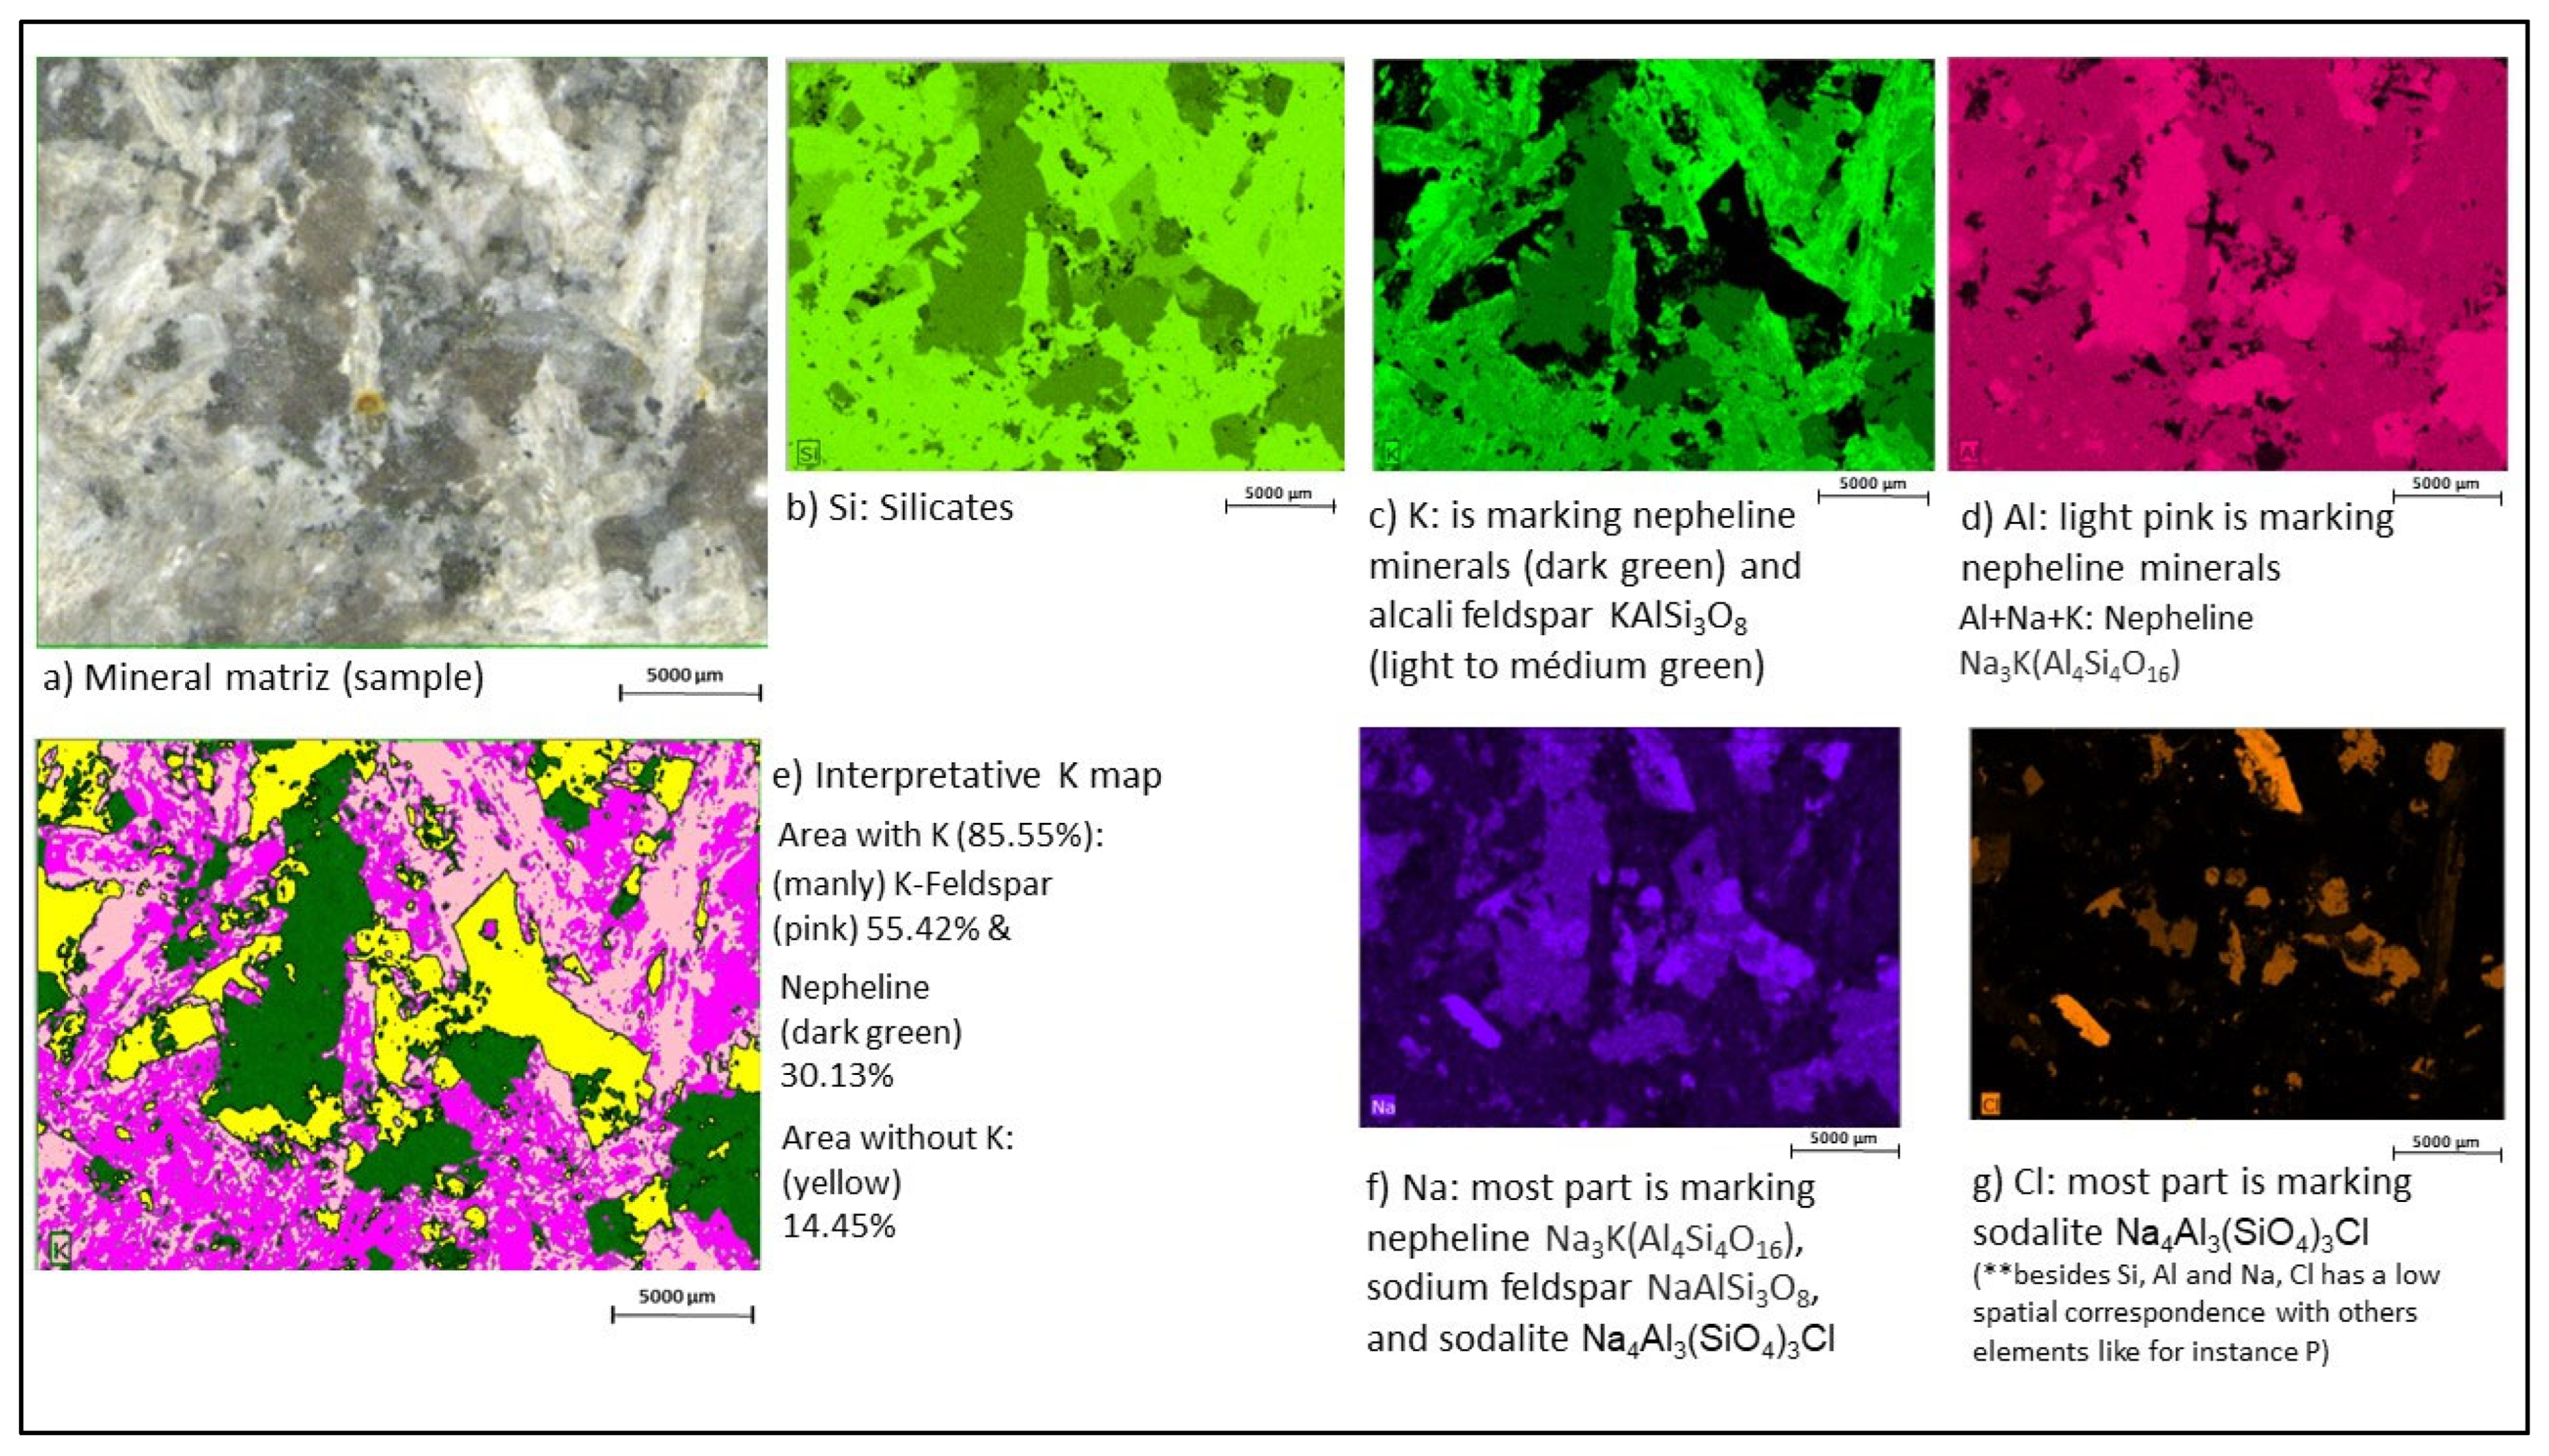
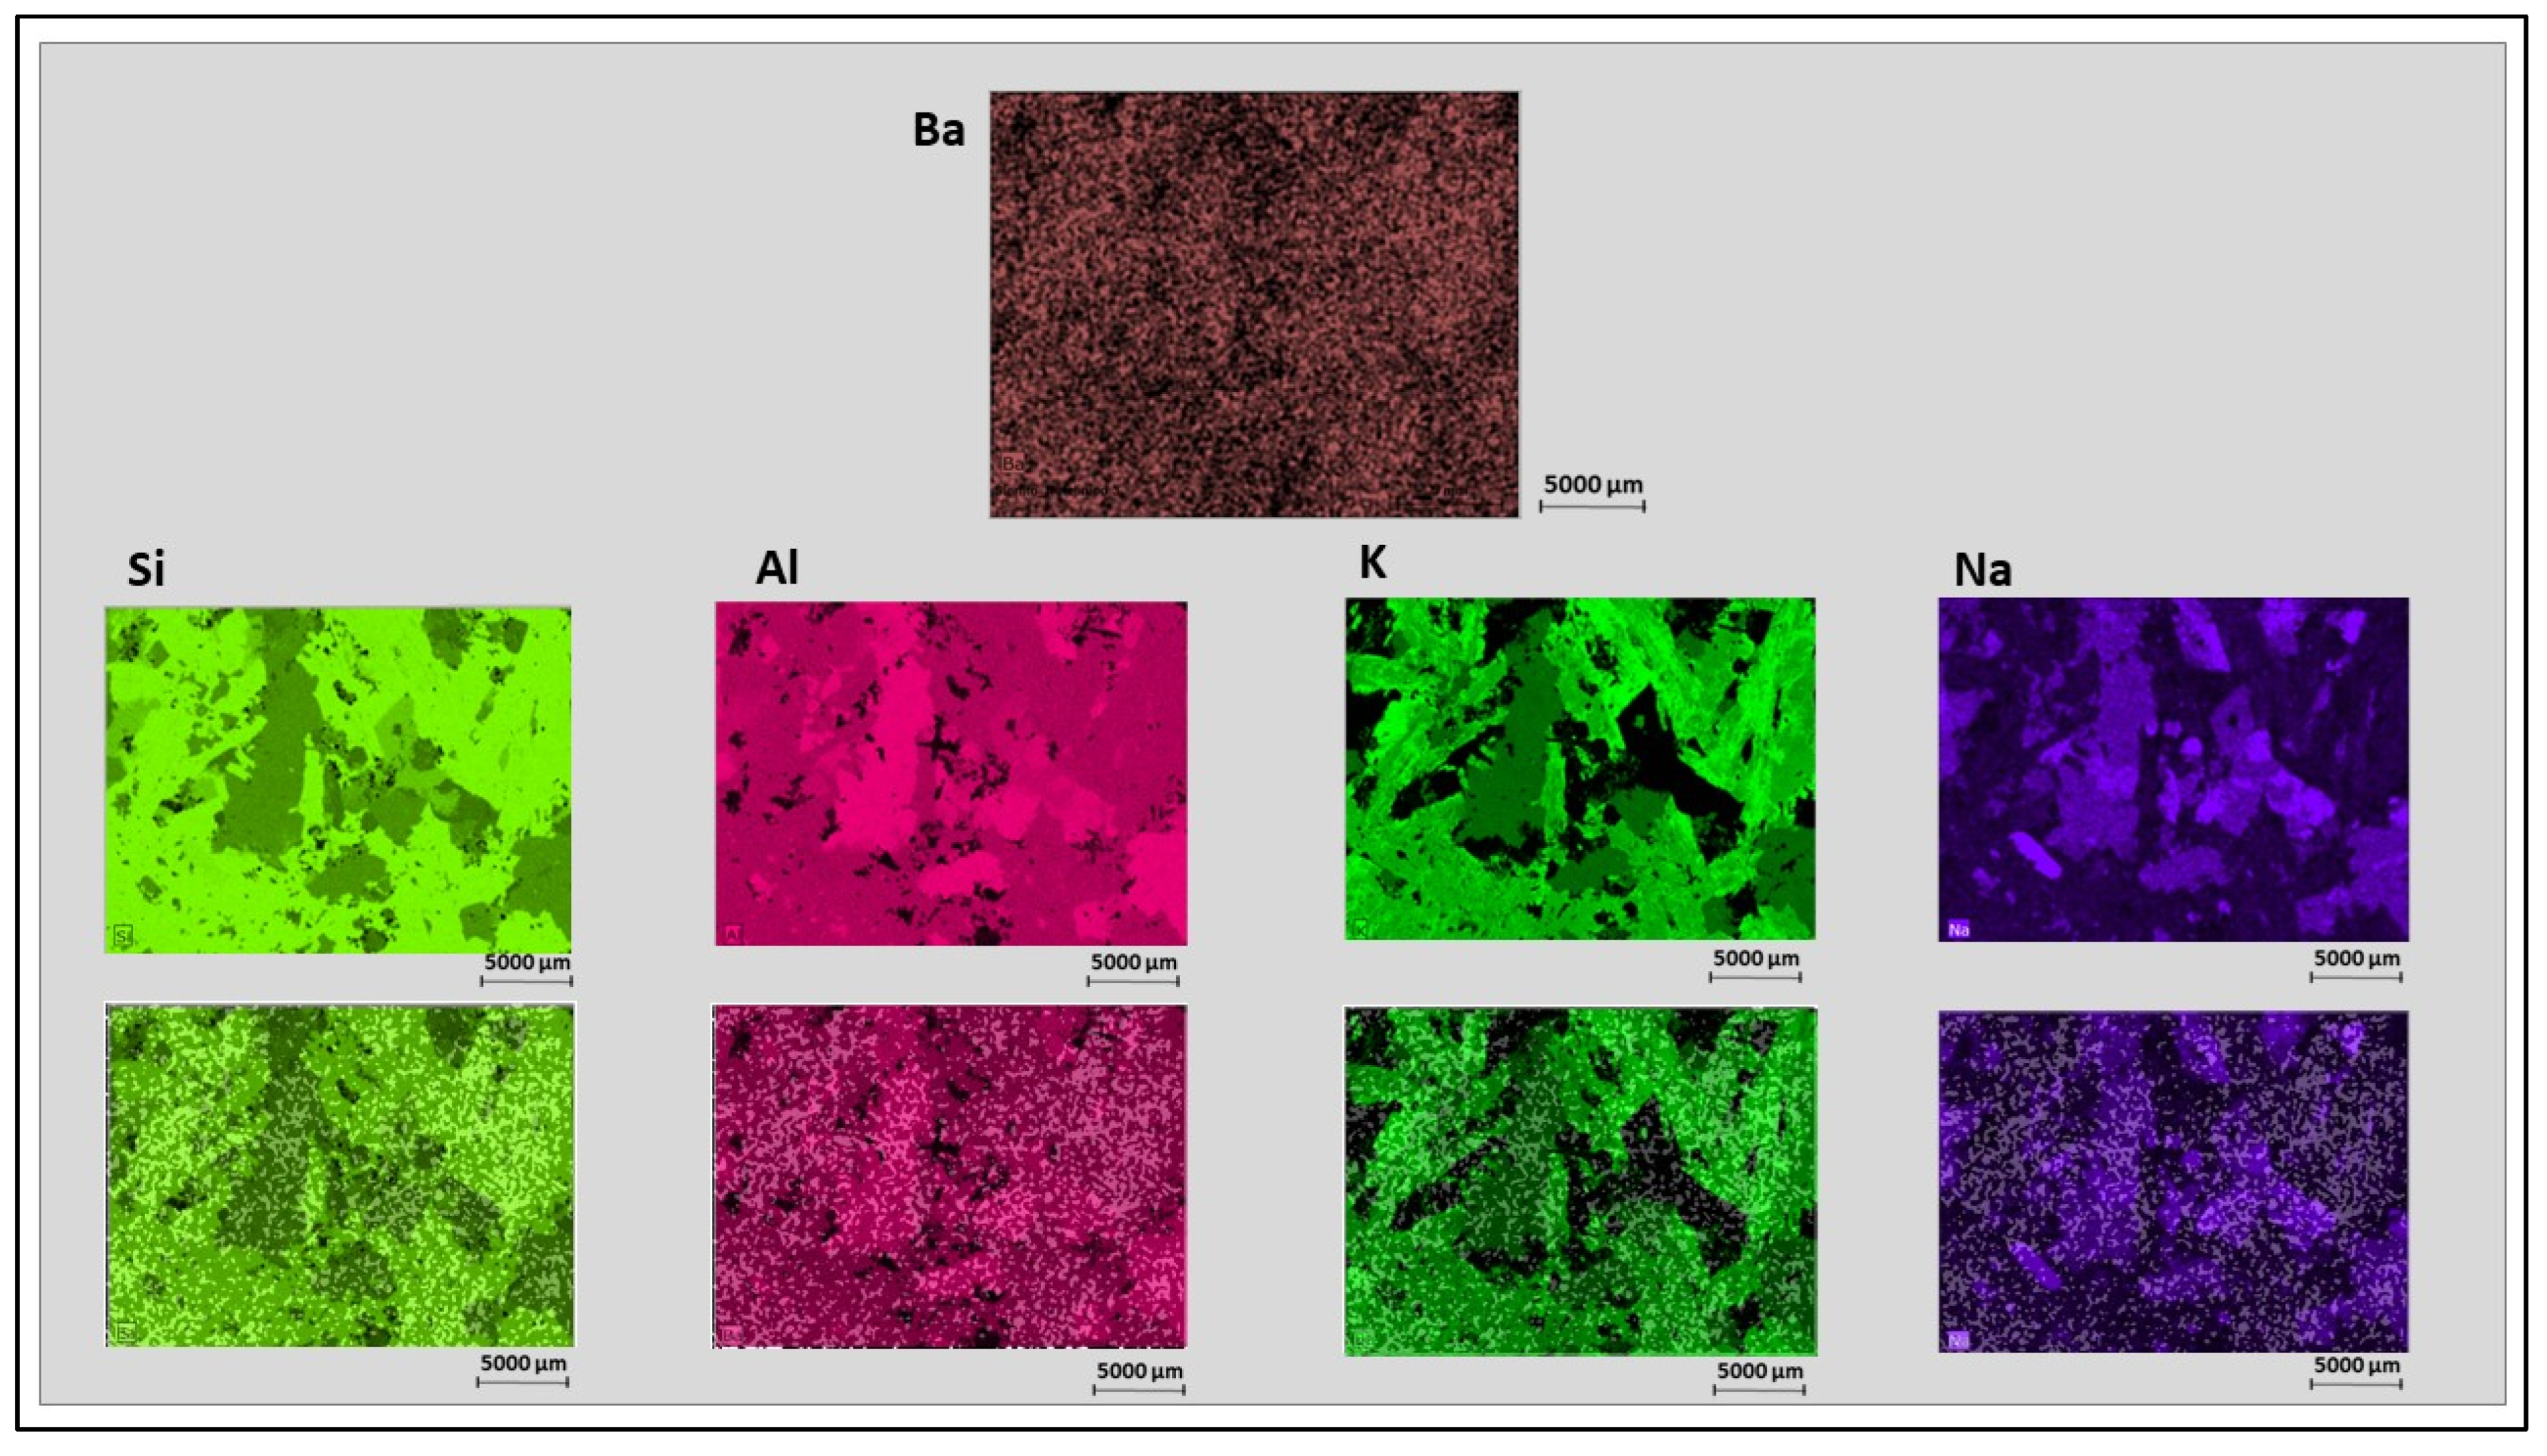
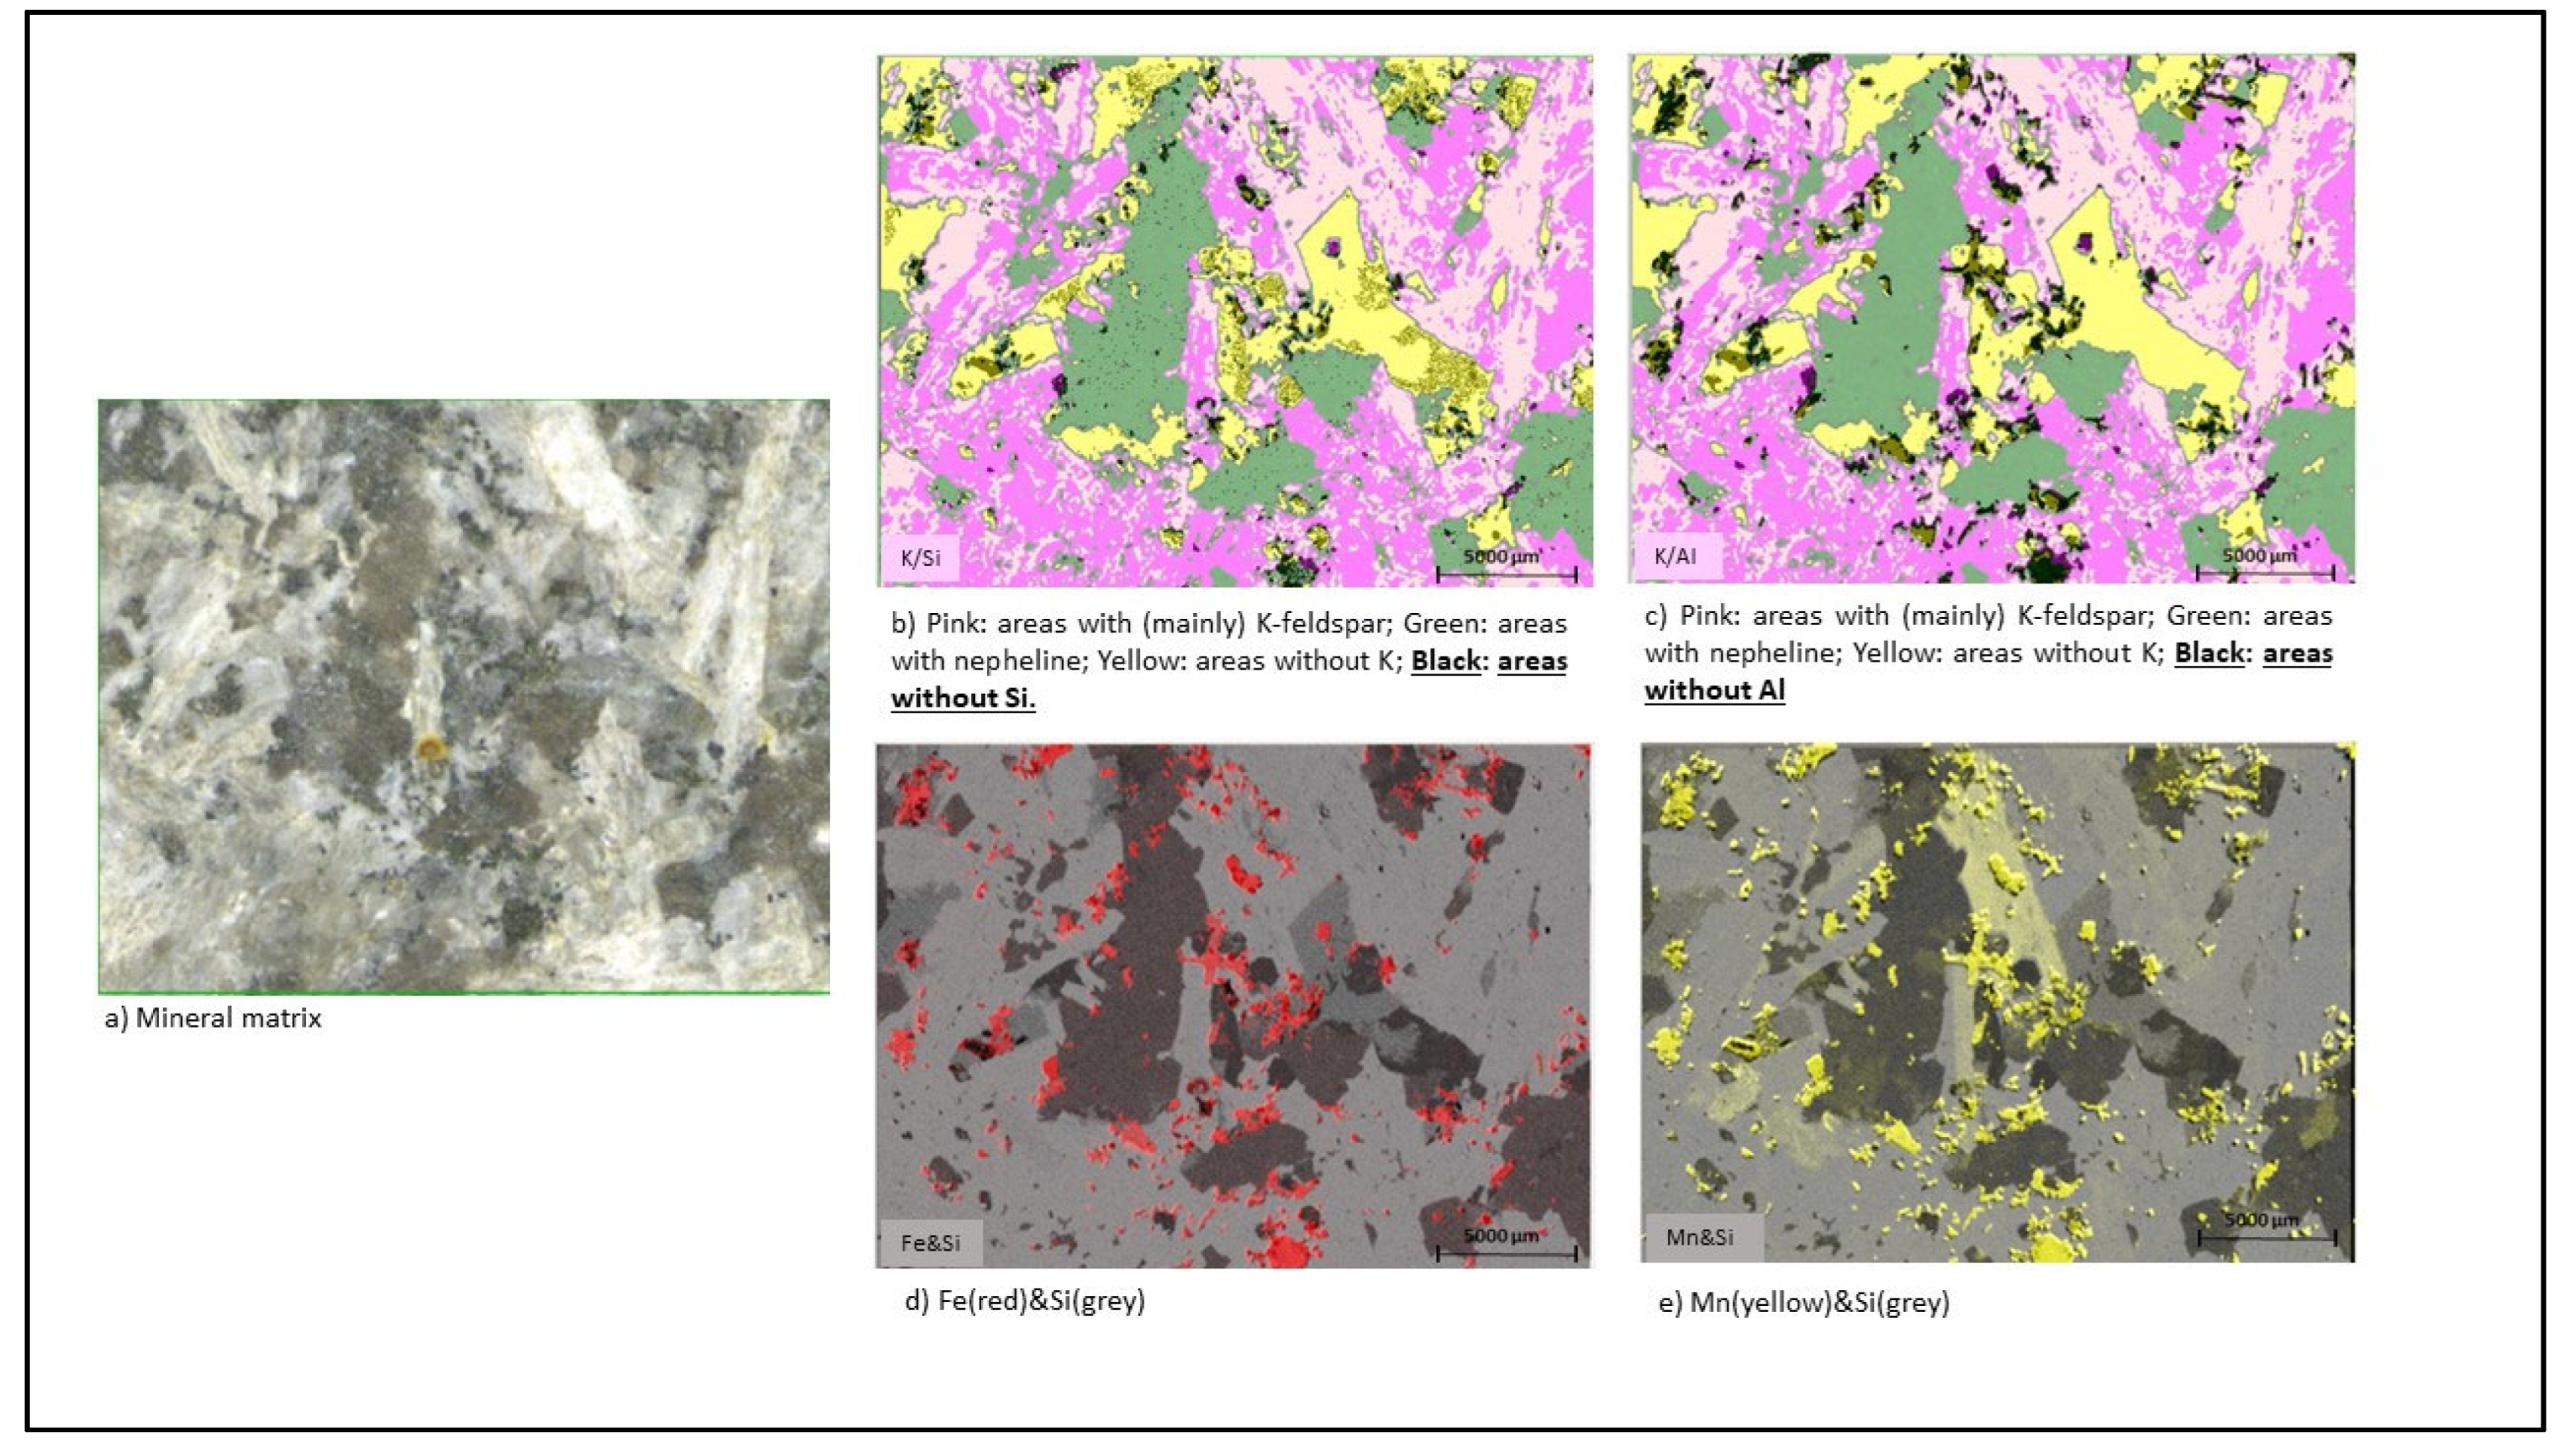
- Silicate and K-bearing feldspar phases are very well distinguishable in the mineral matrix through the elements Si, Al, K, Cl, and Na (Figure 2);
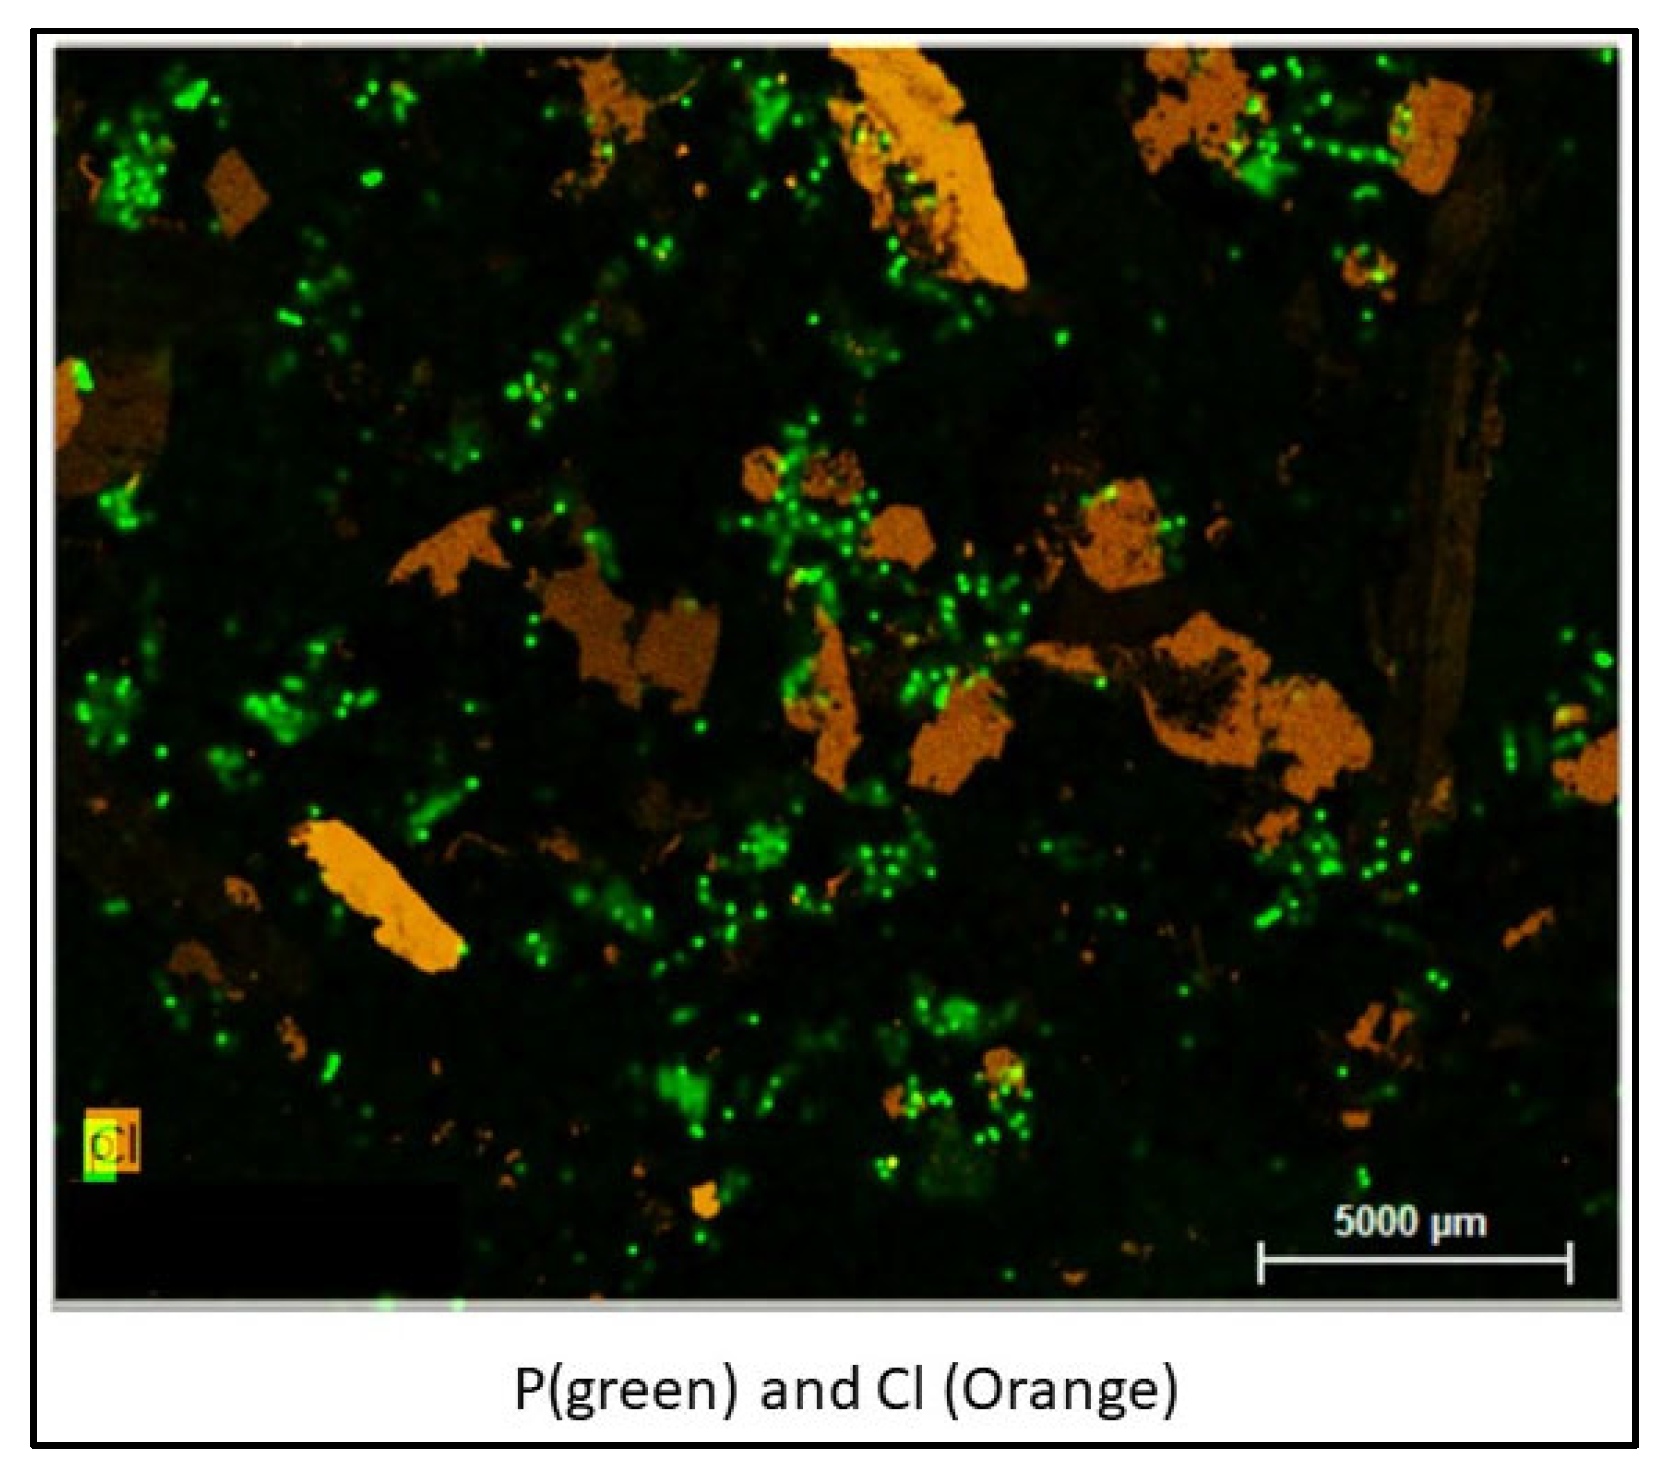
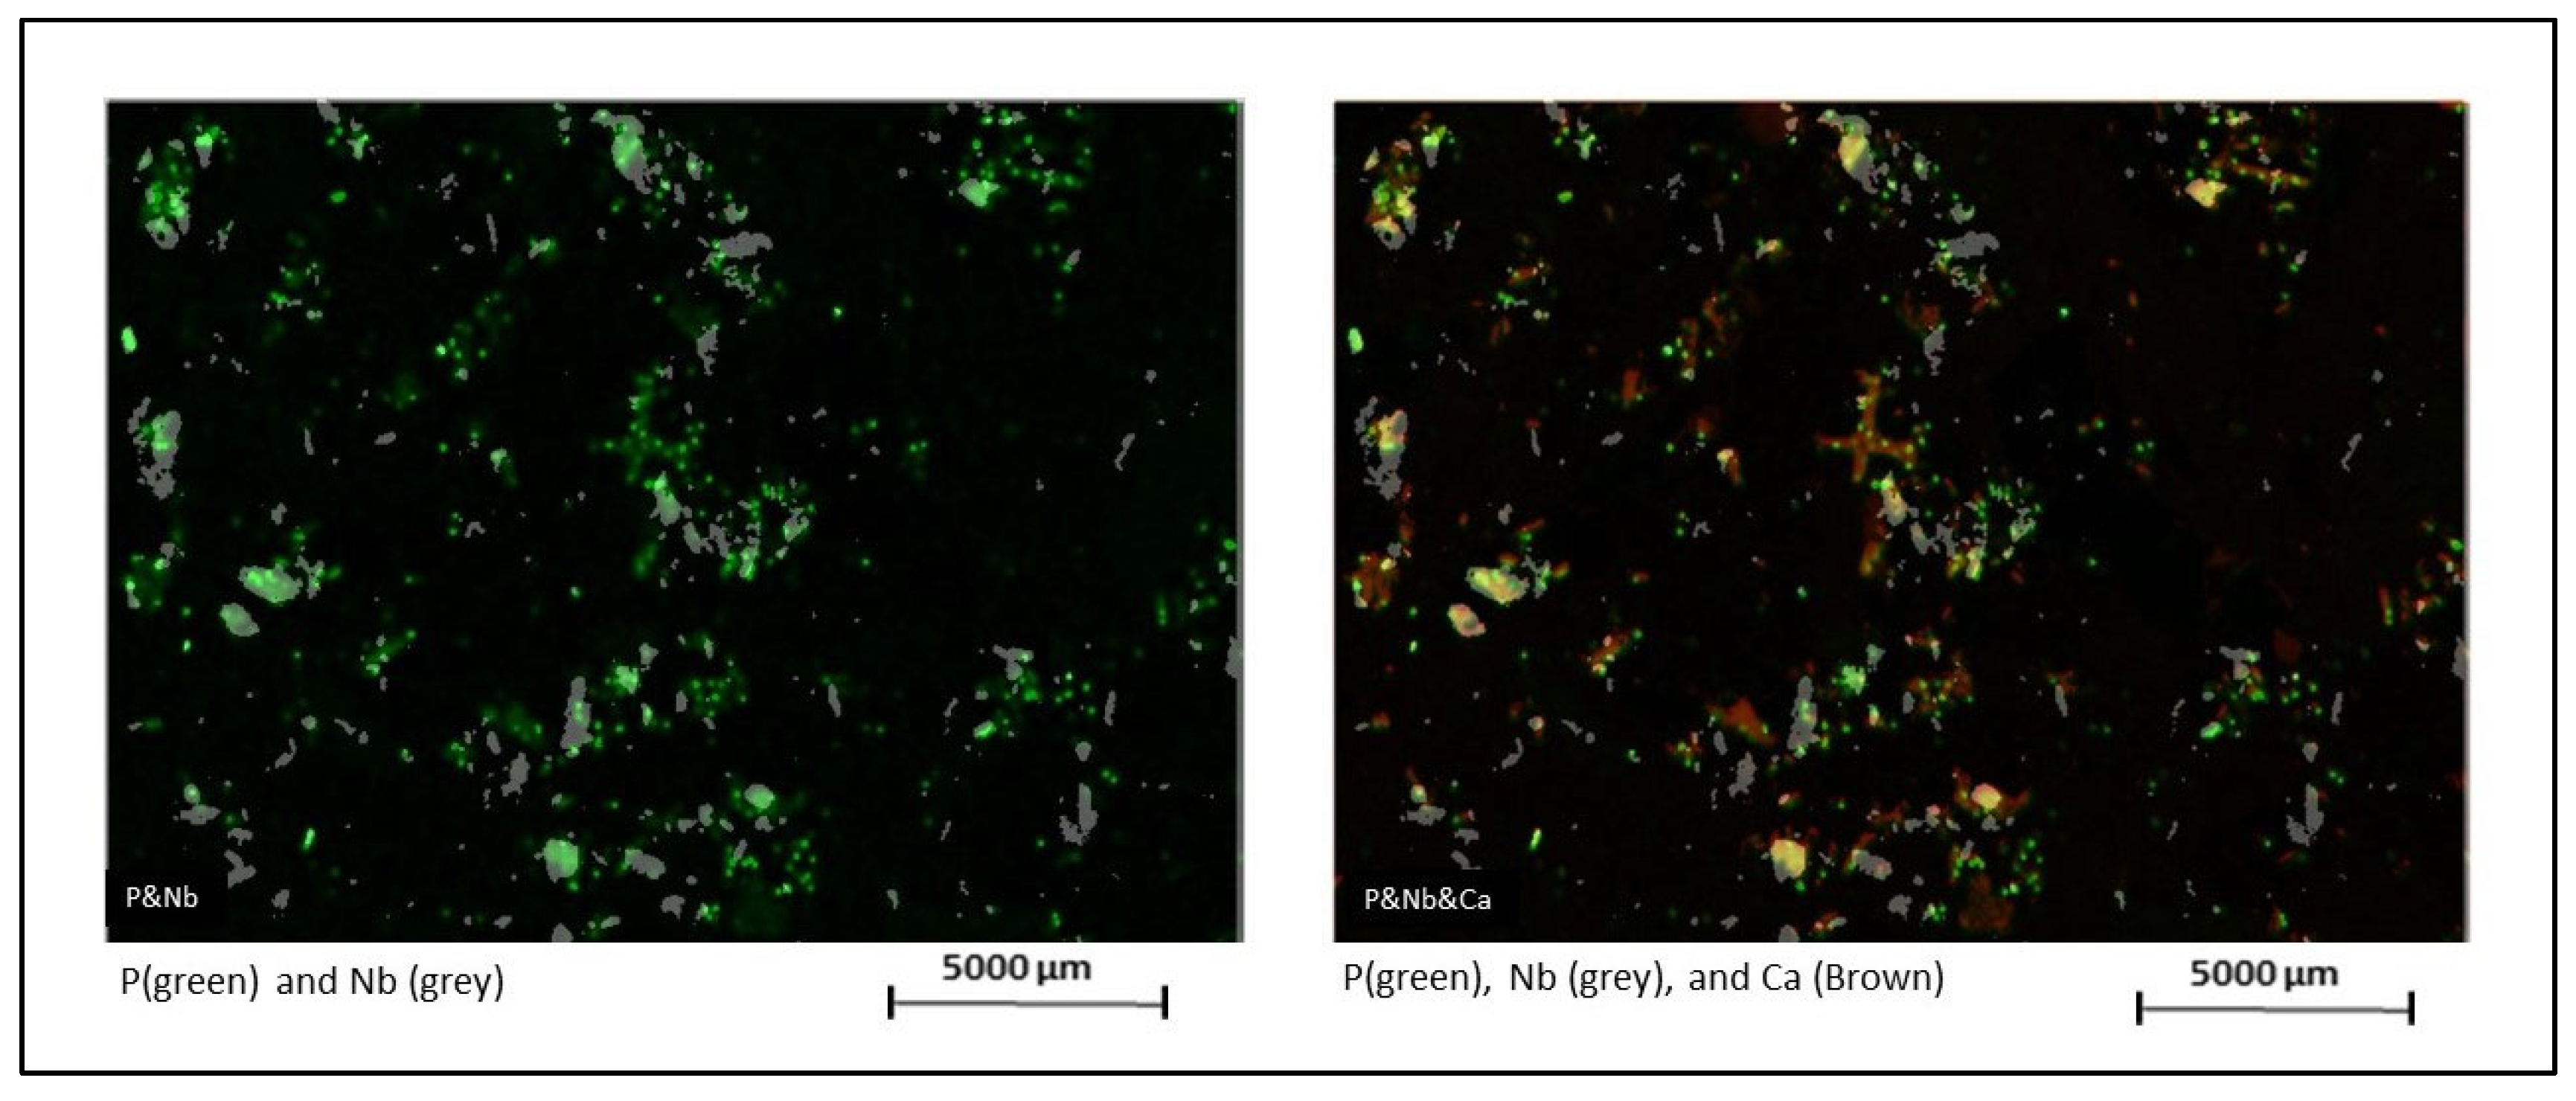
- Correspondence between Cl and P, which may indicate localization of phosphate mineral apatite, is almost absent or inexistent (Figure 3);
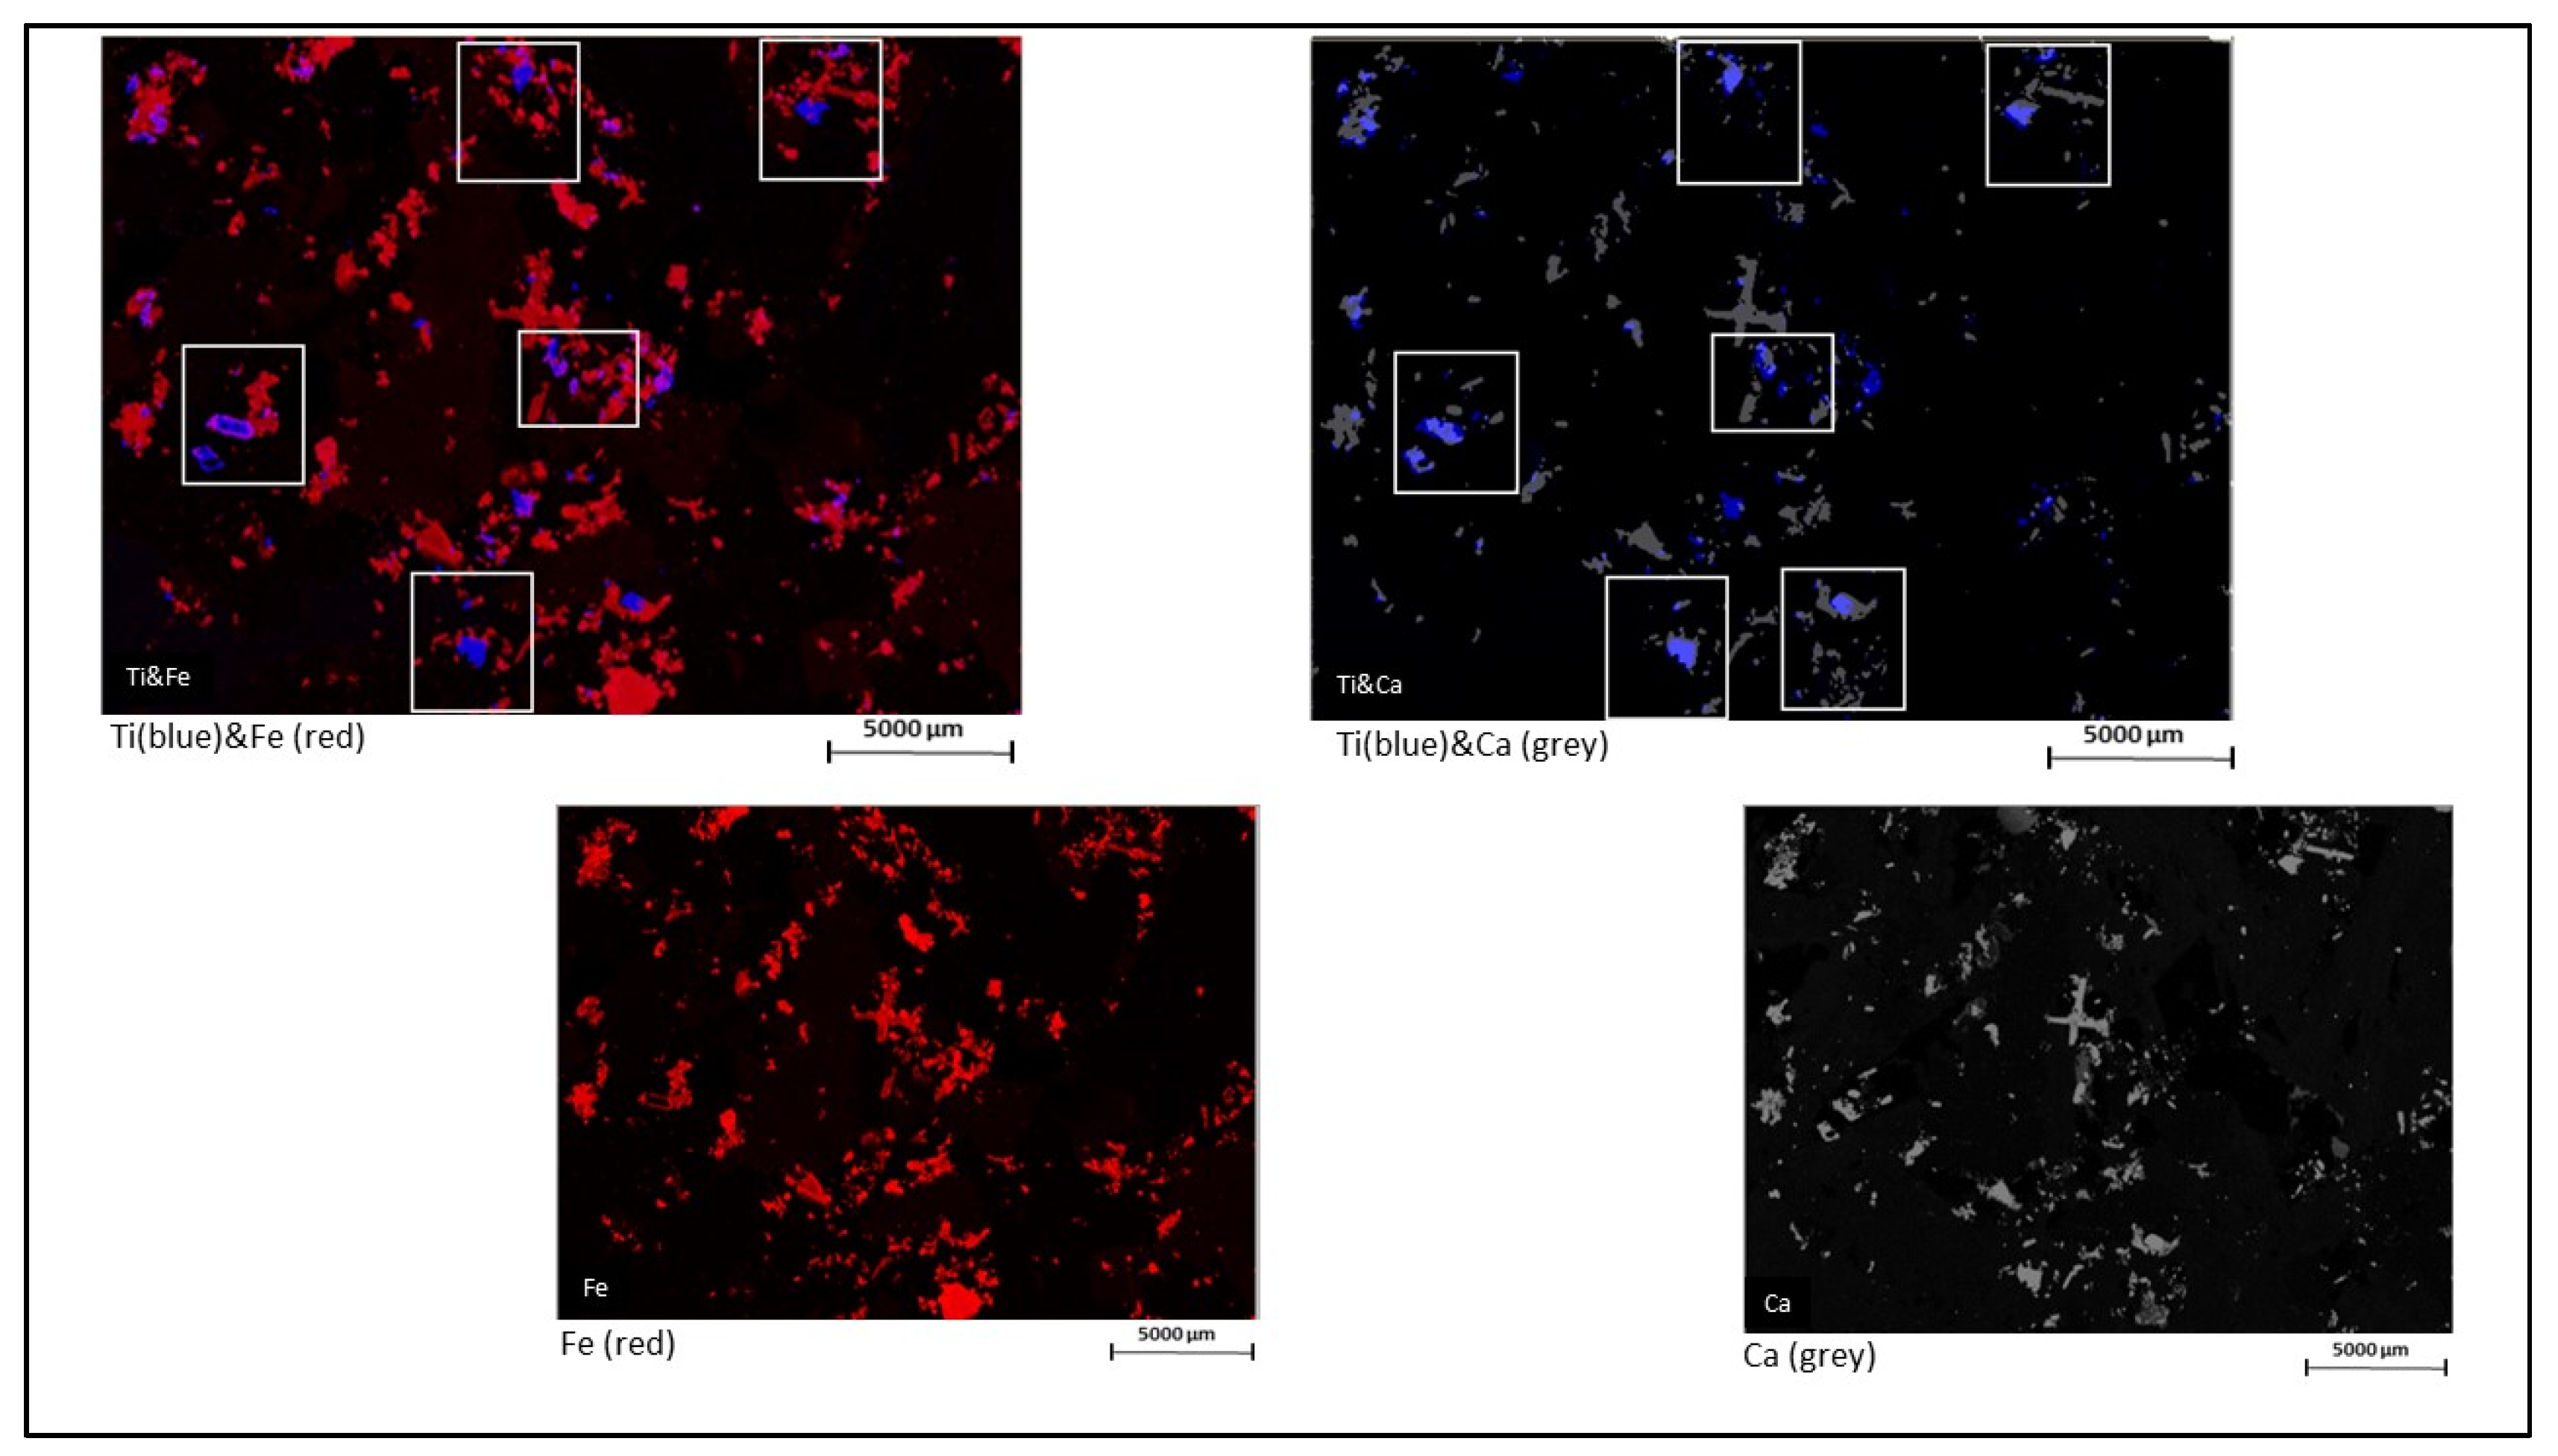
- Ti has an antagonistic spatial distribution with Fe, and a very good spatial correspondence with Ca (Figure 10);
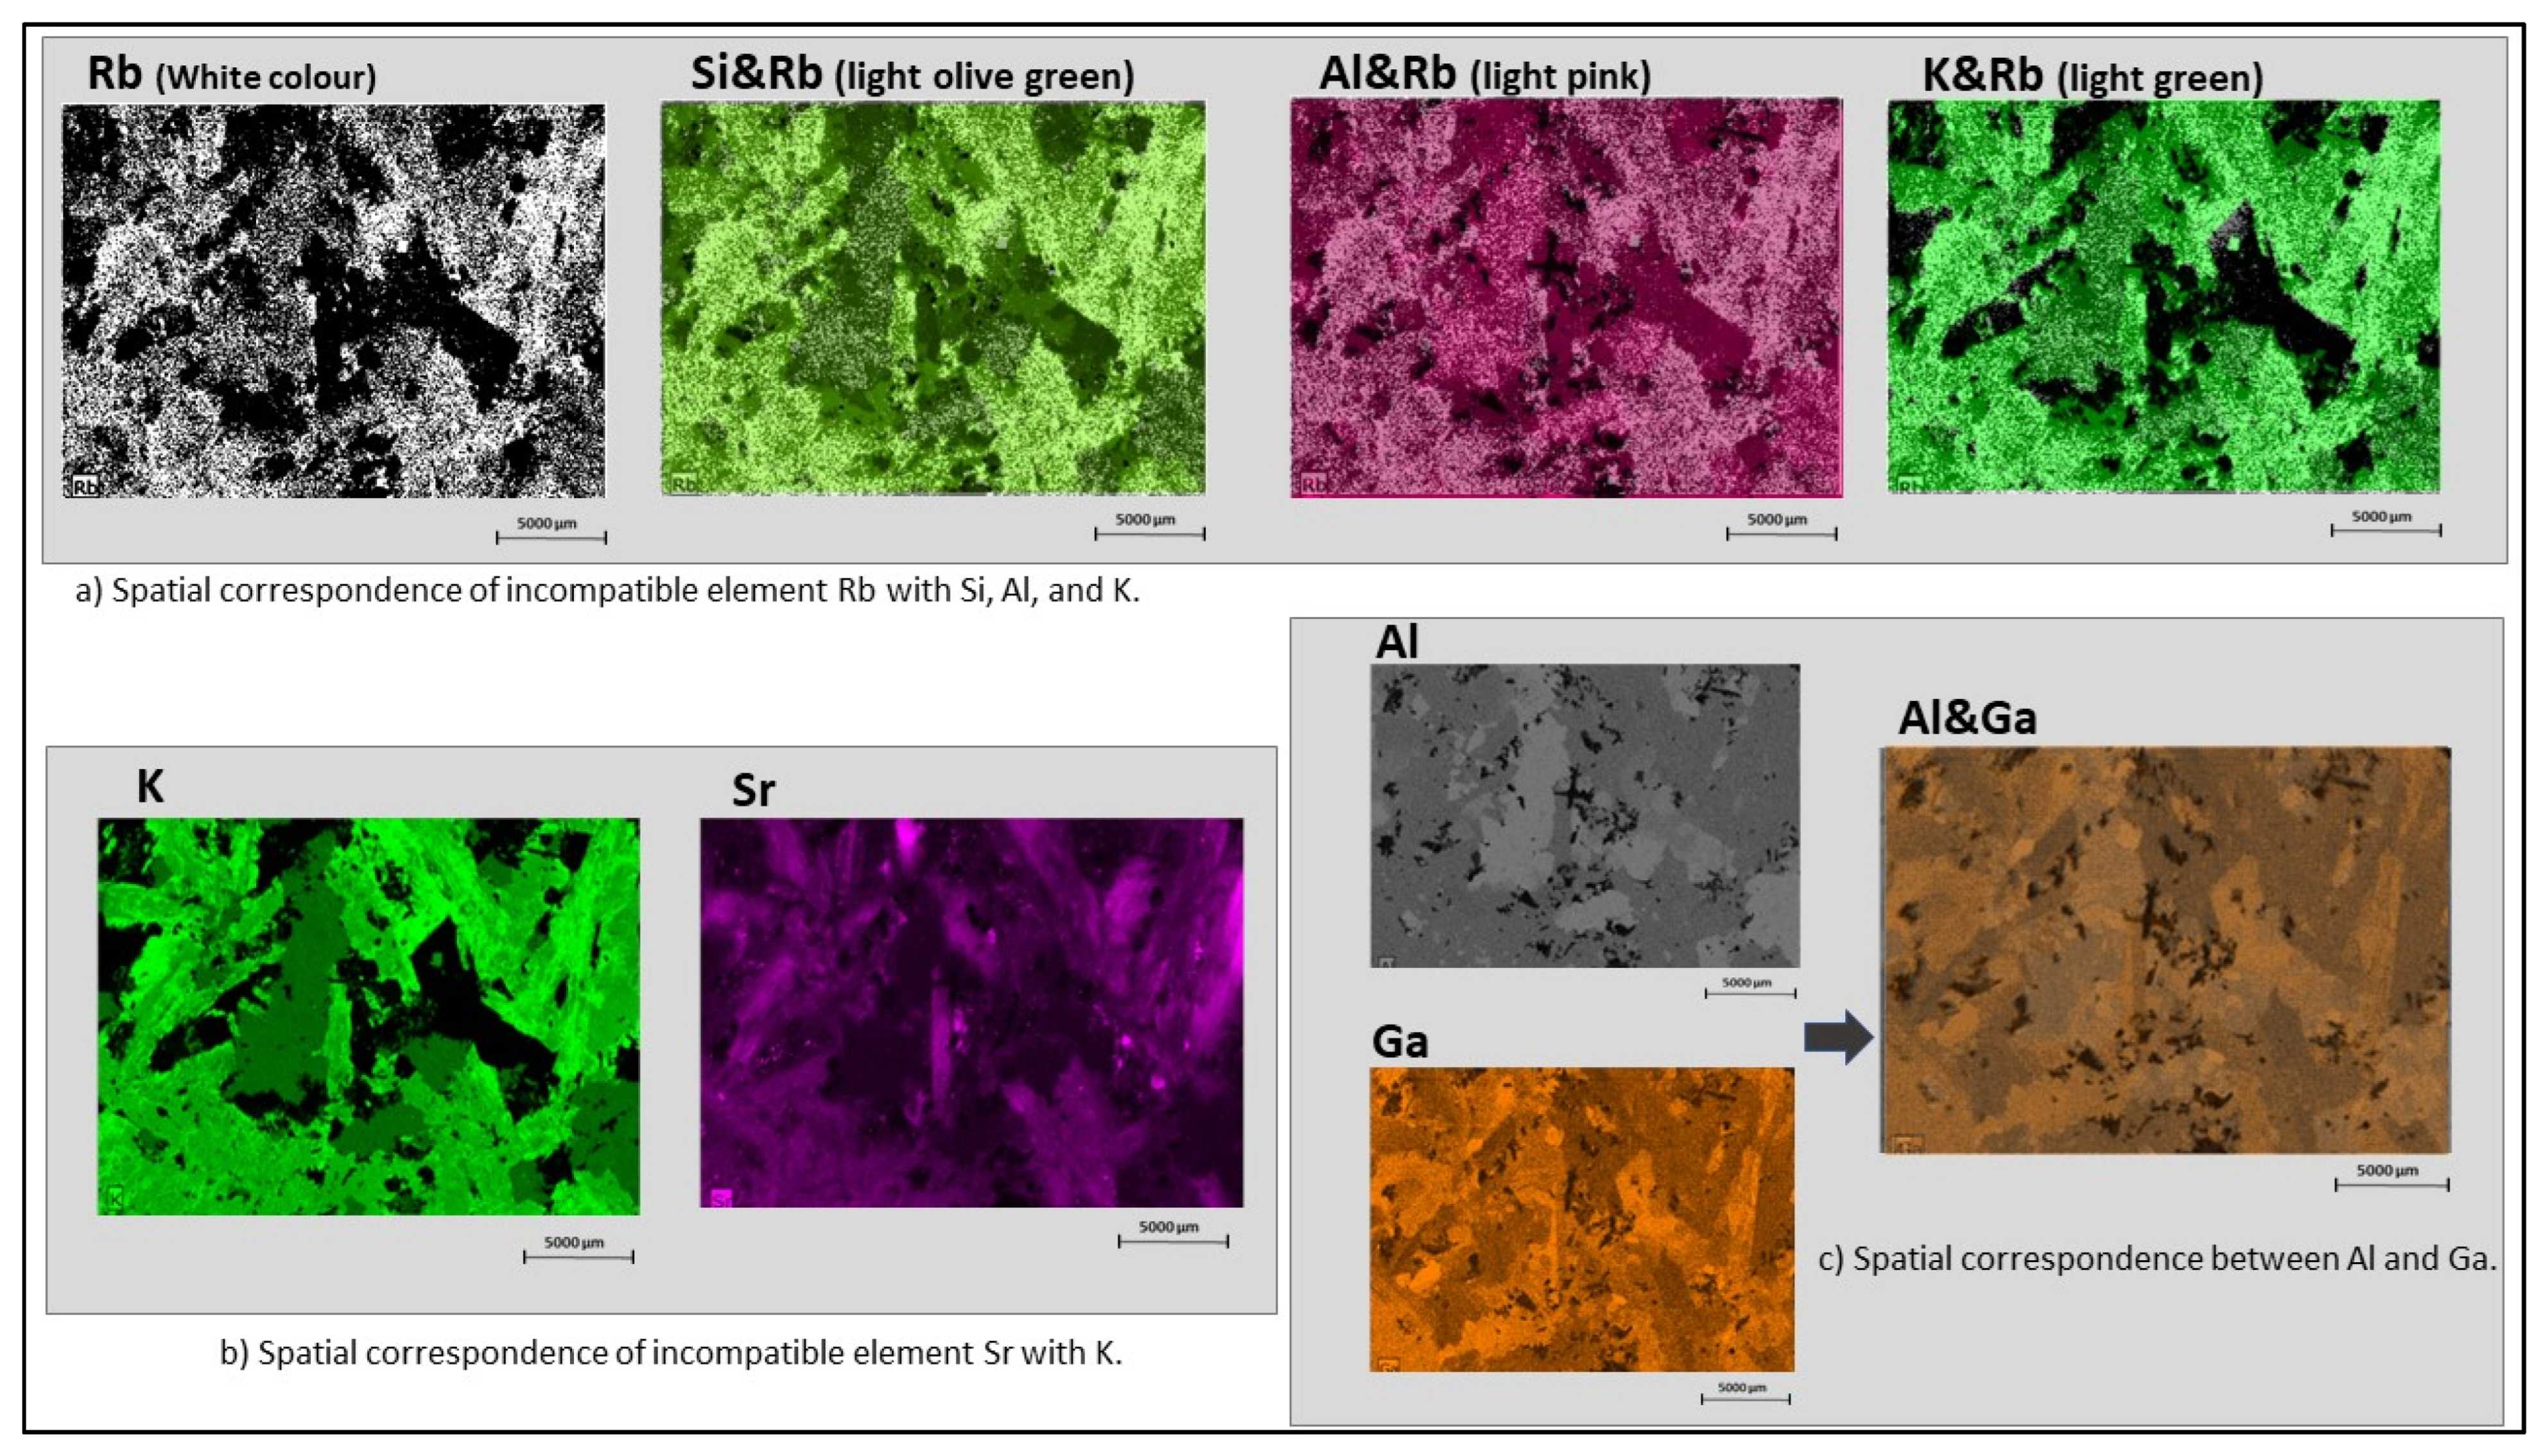
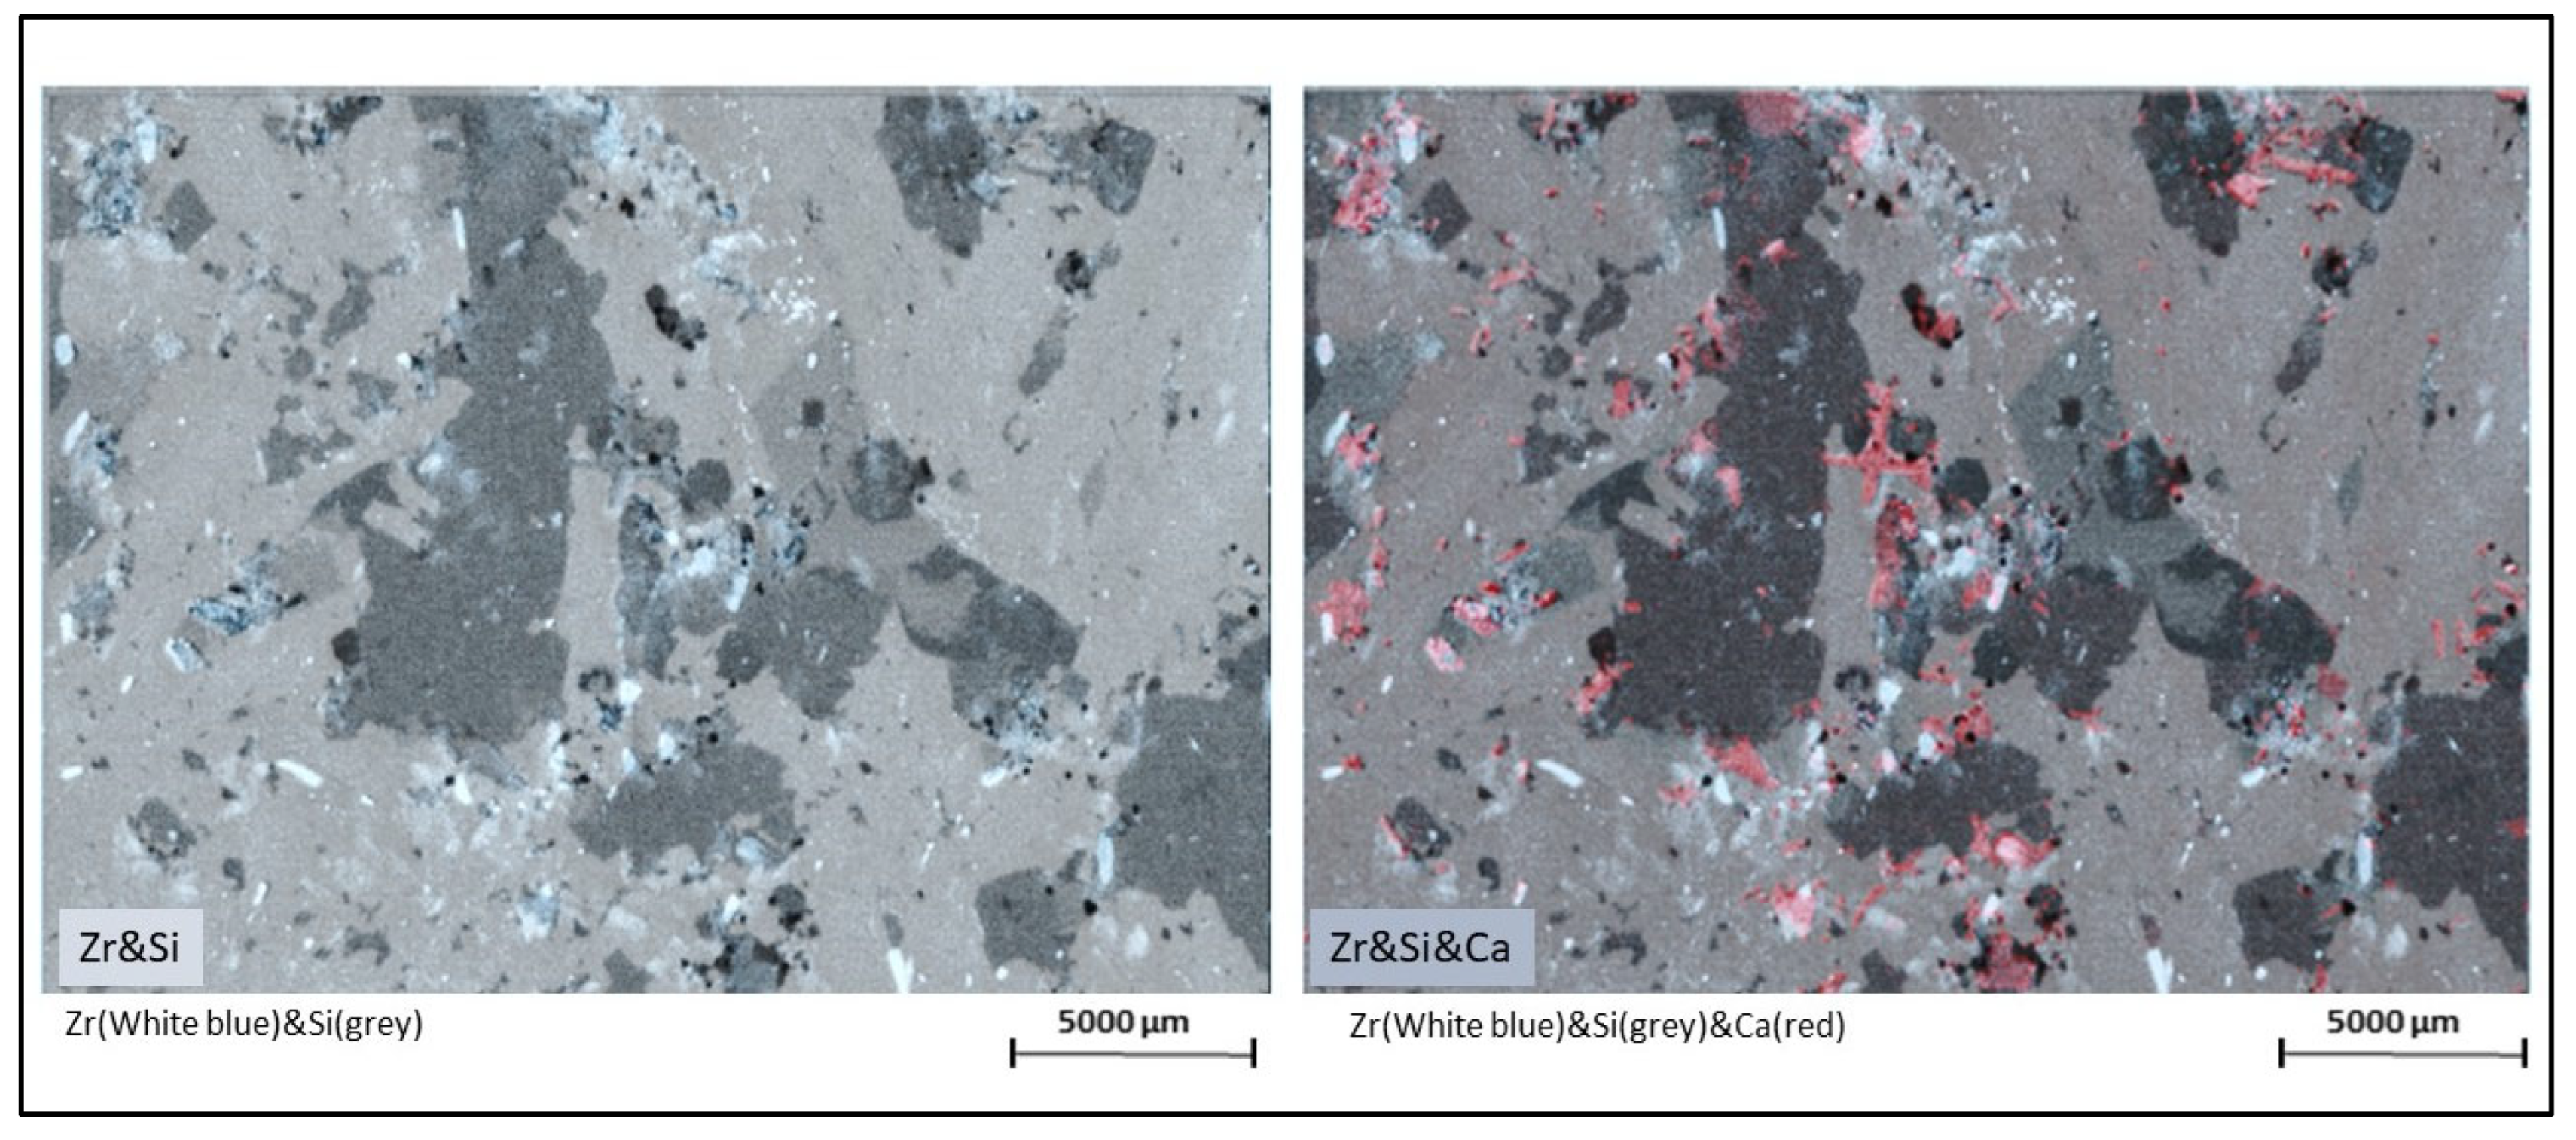
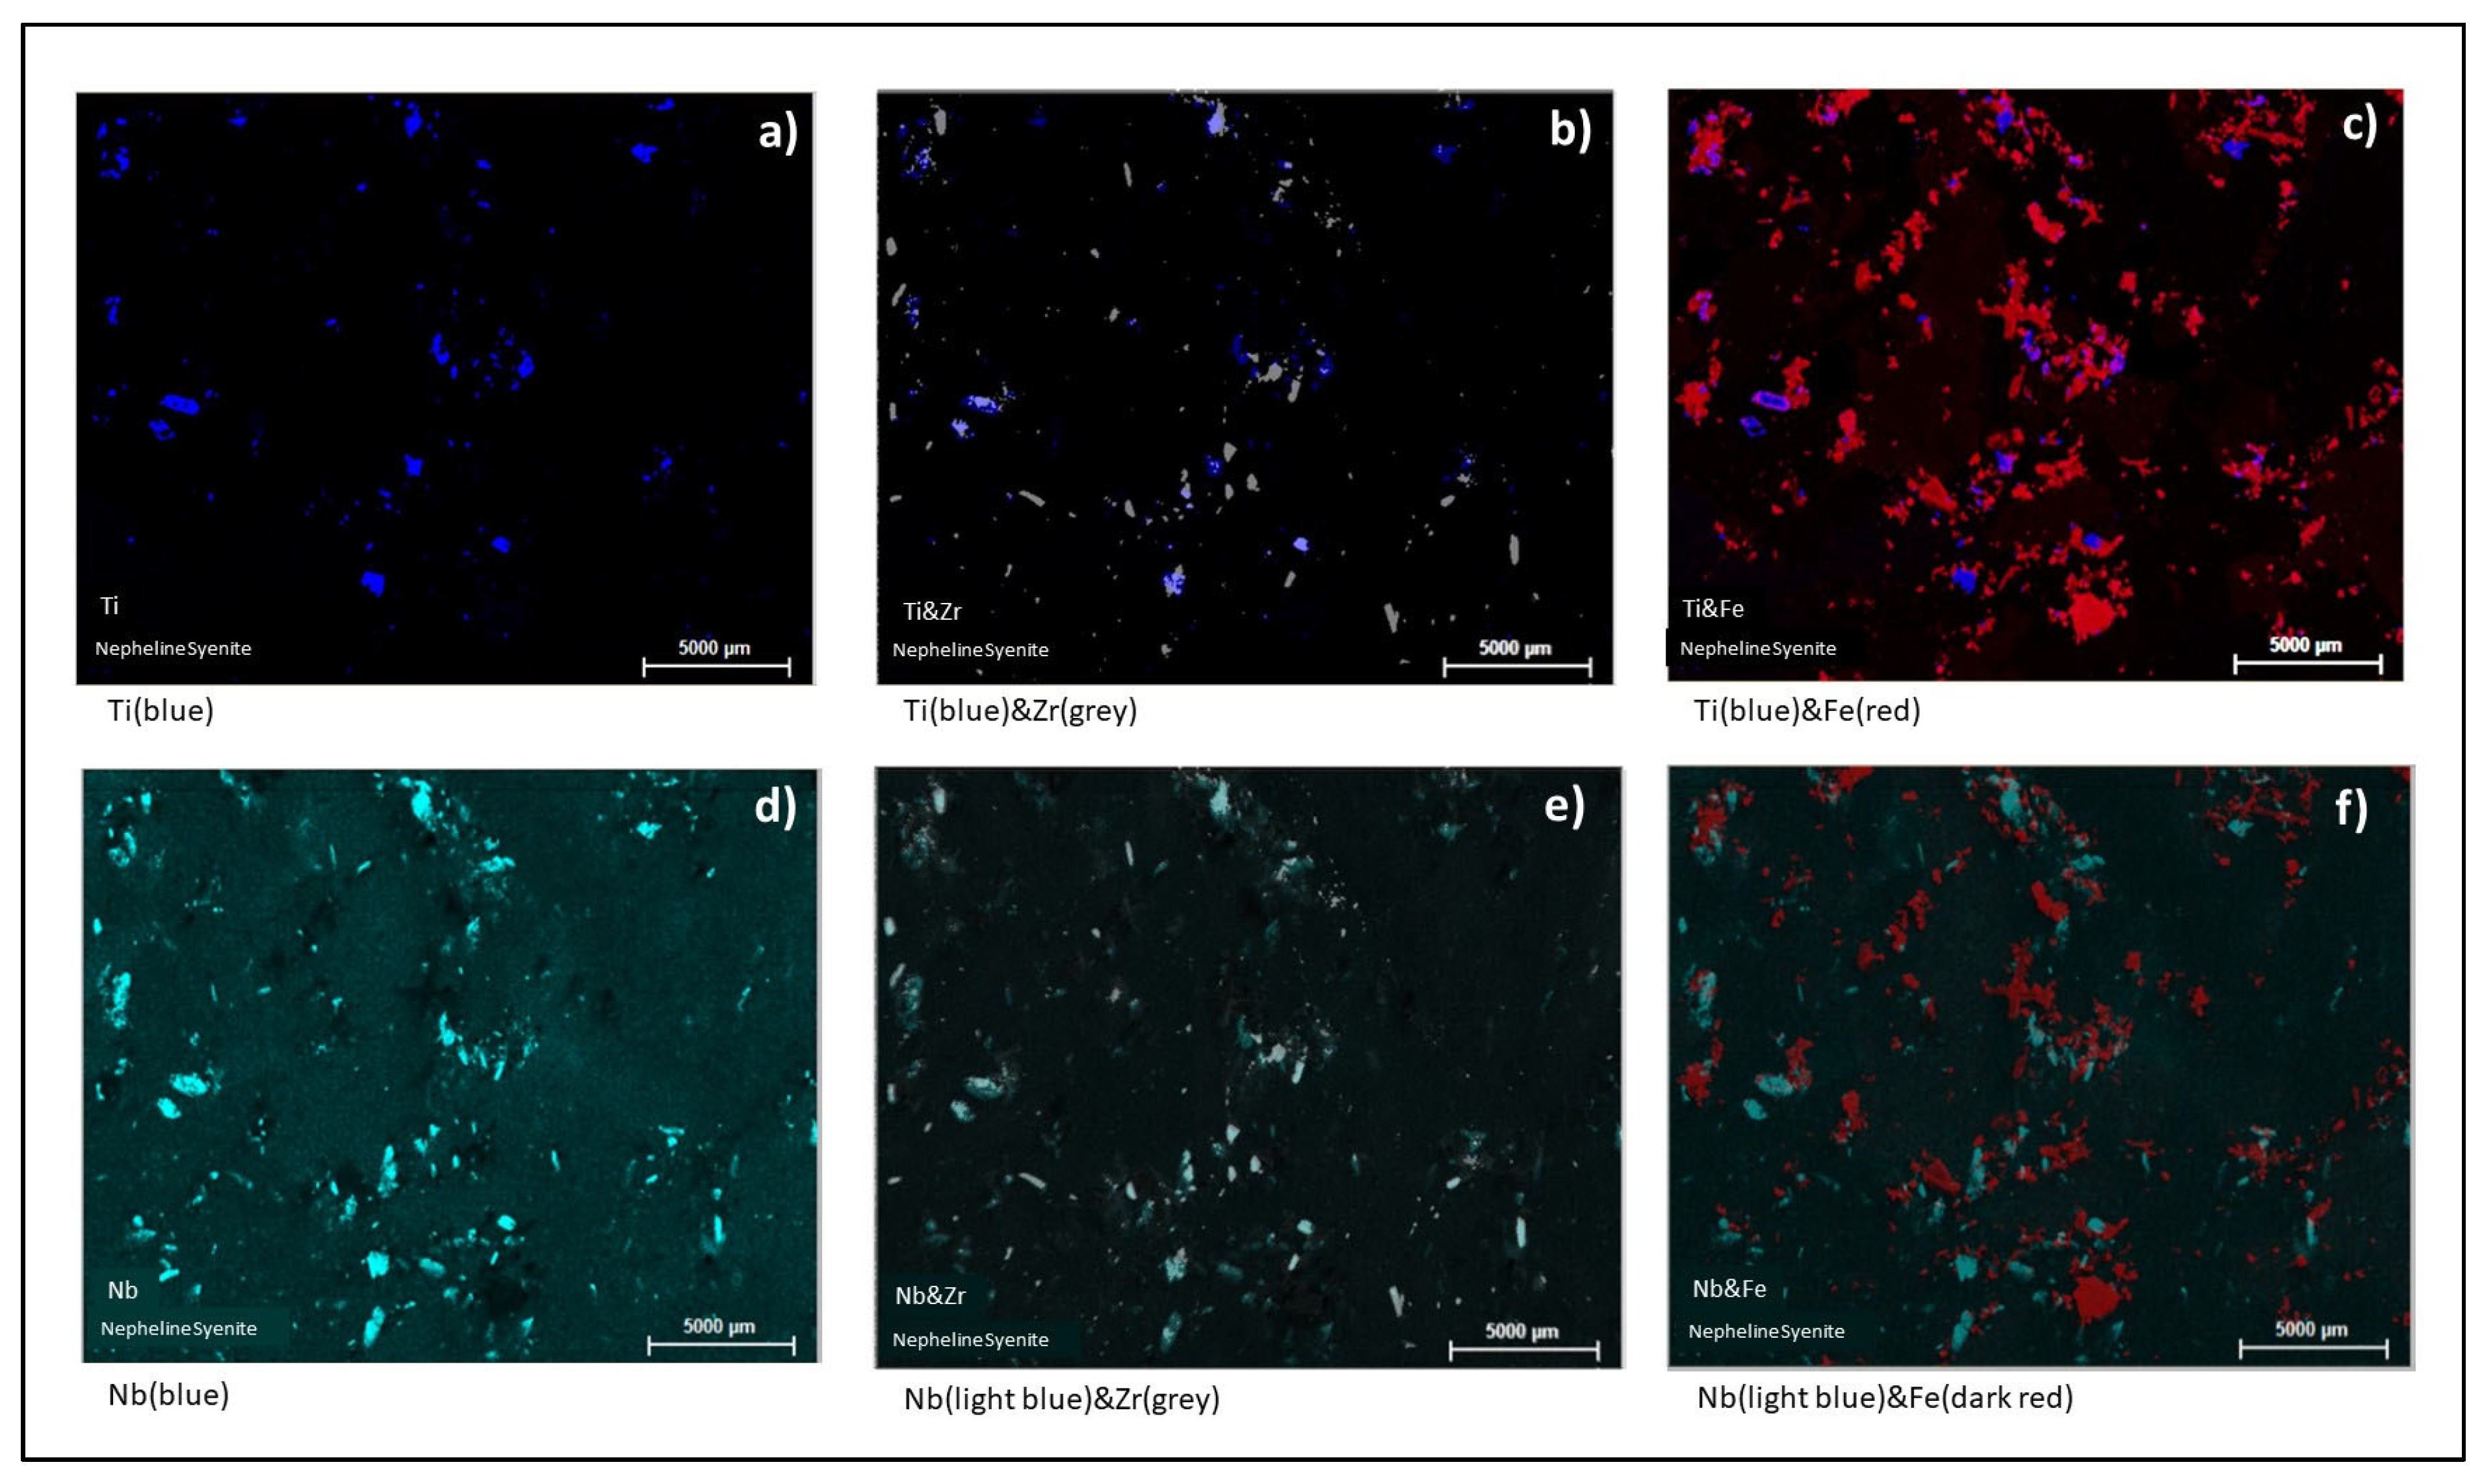
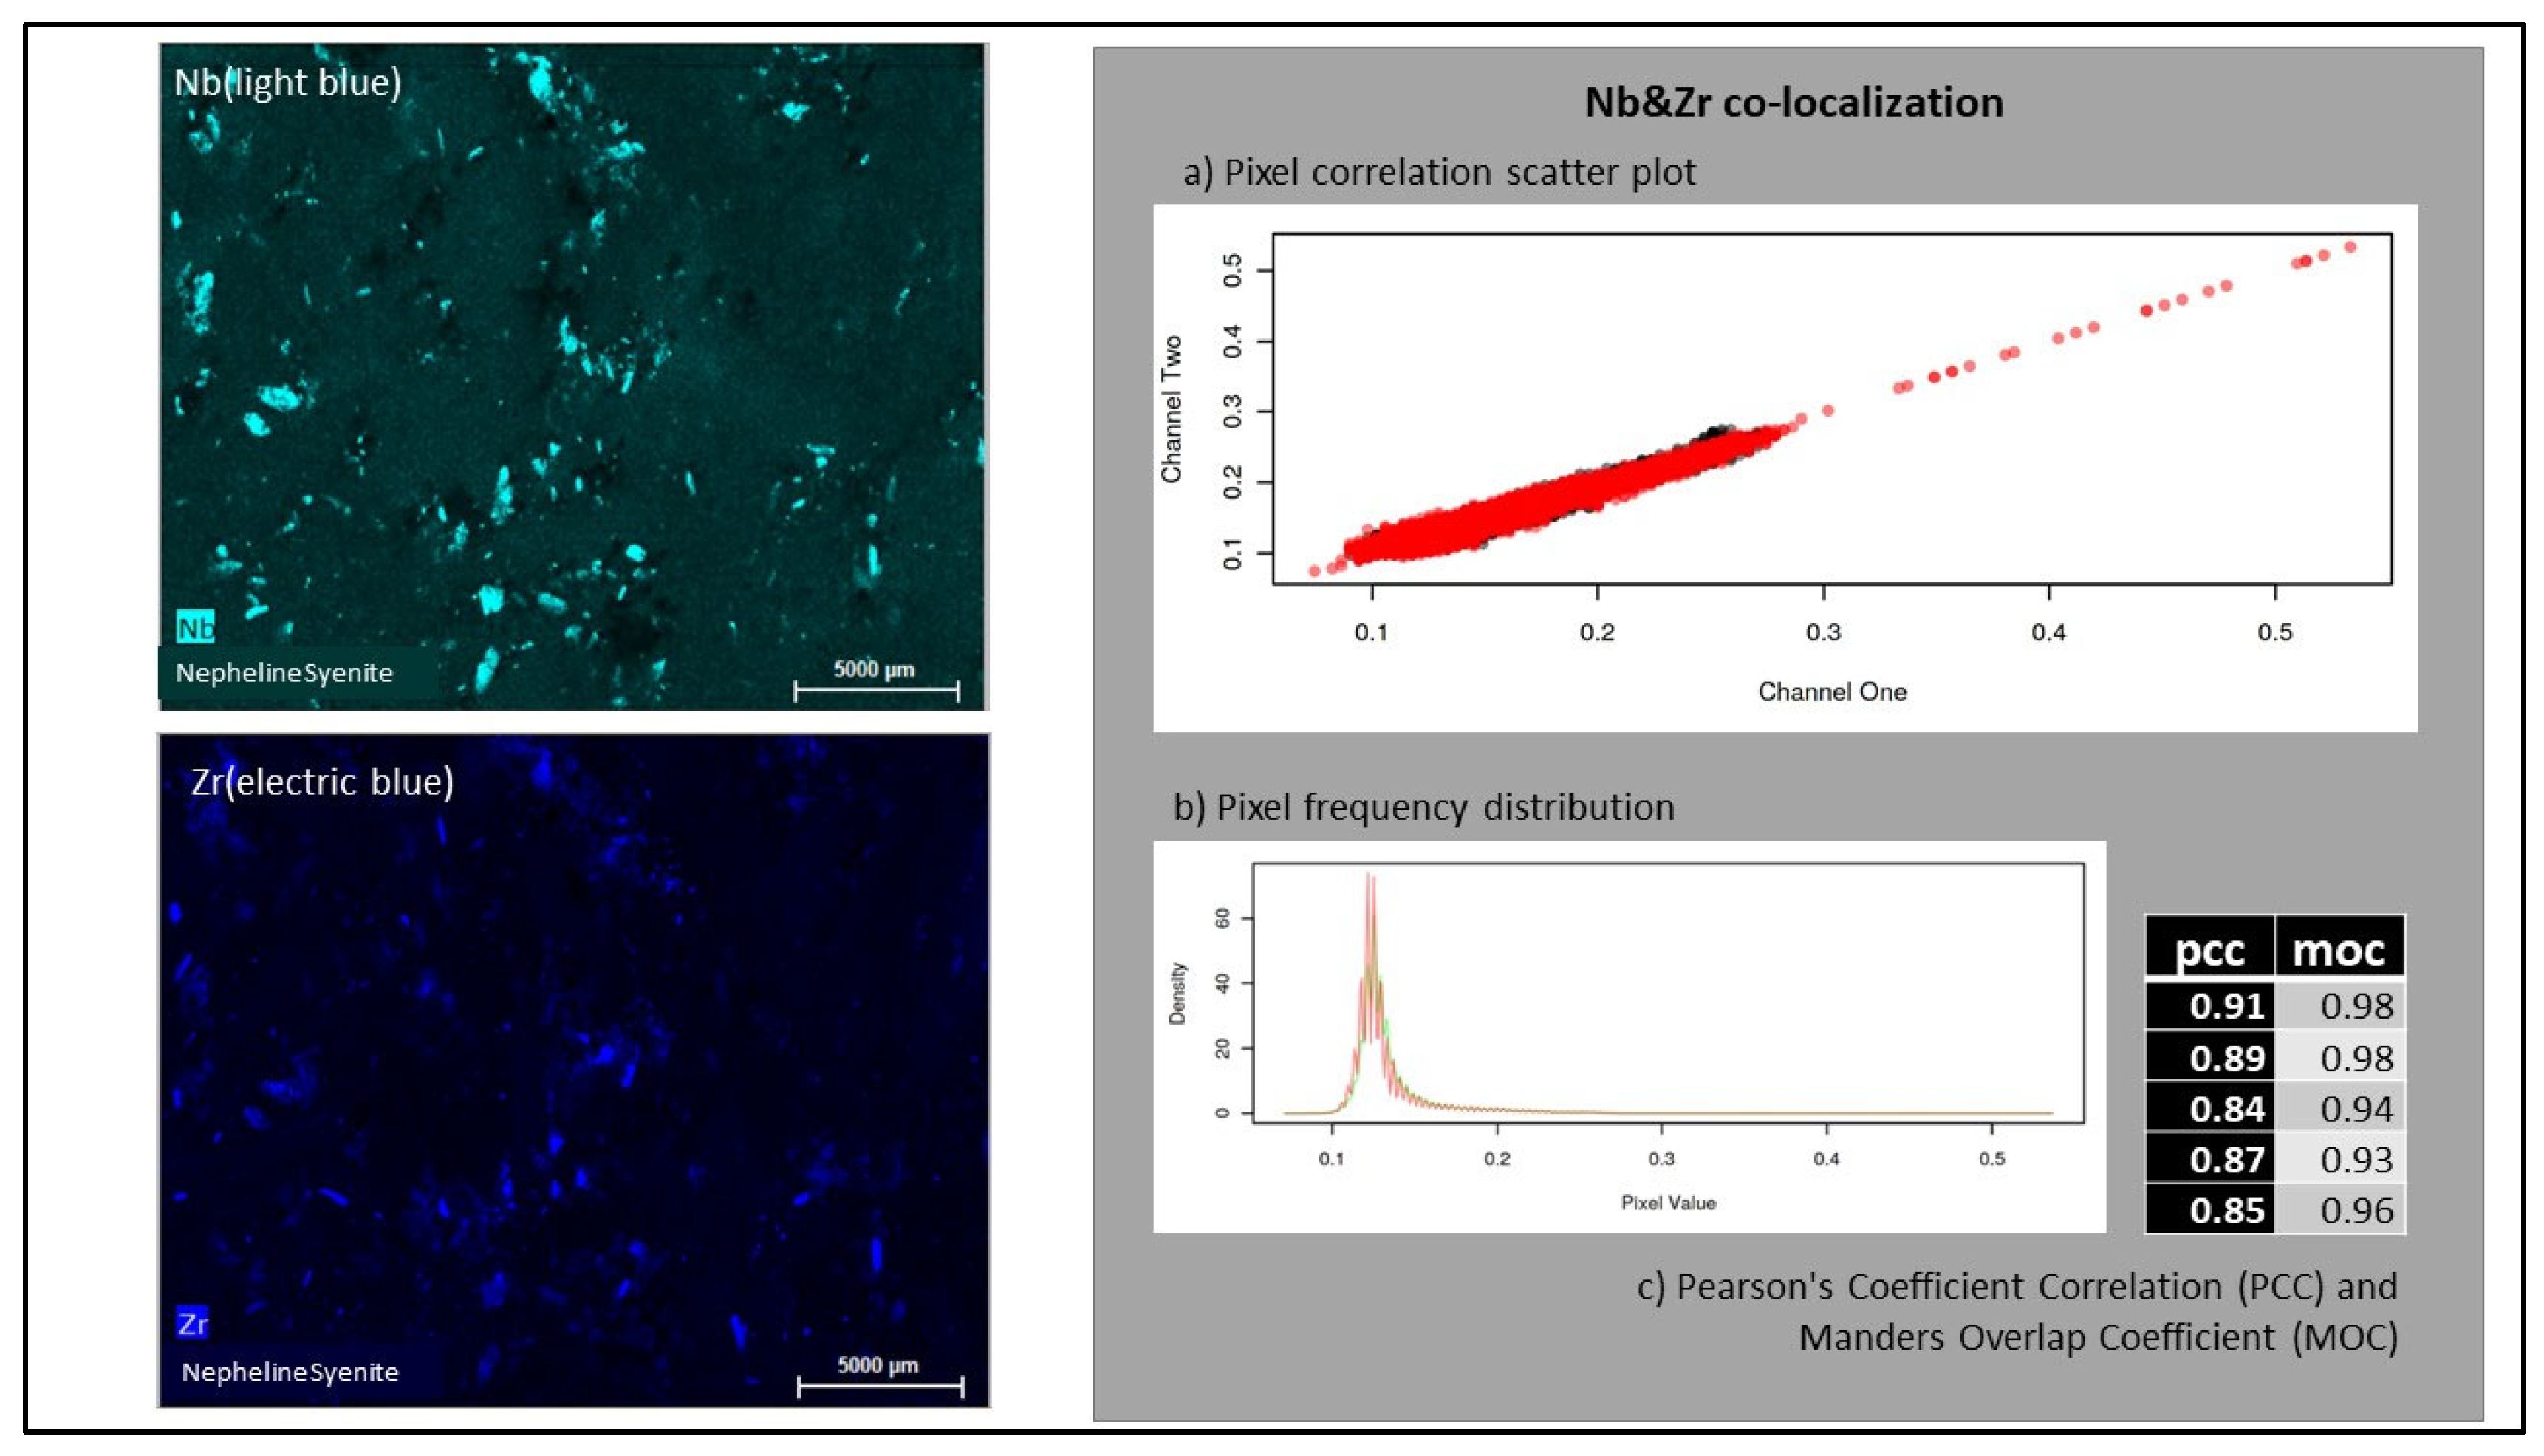
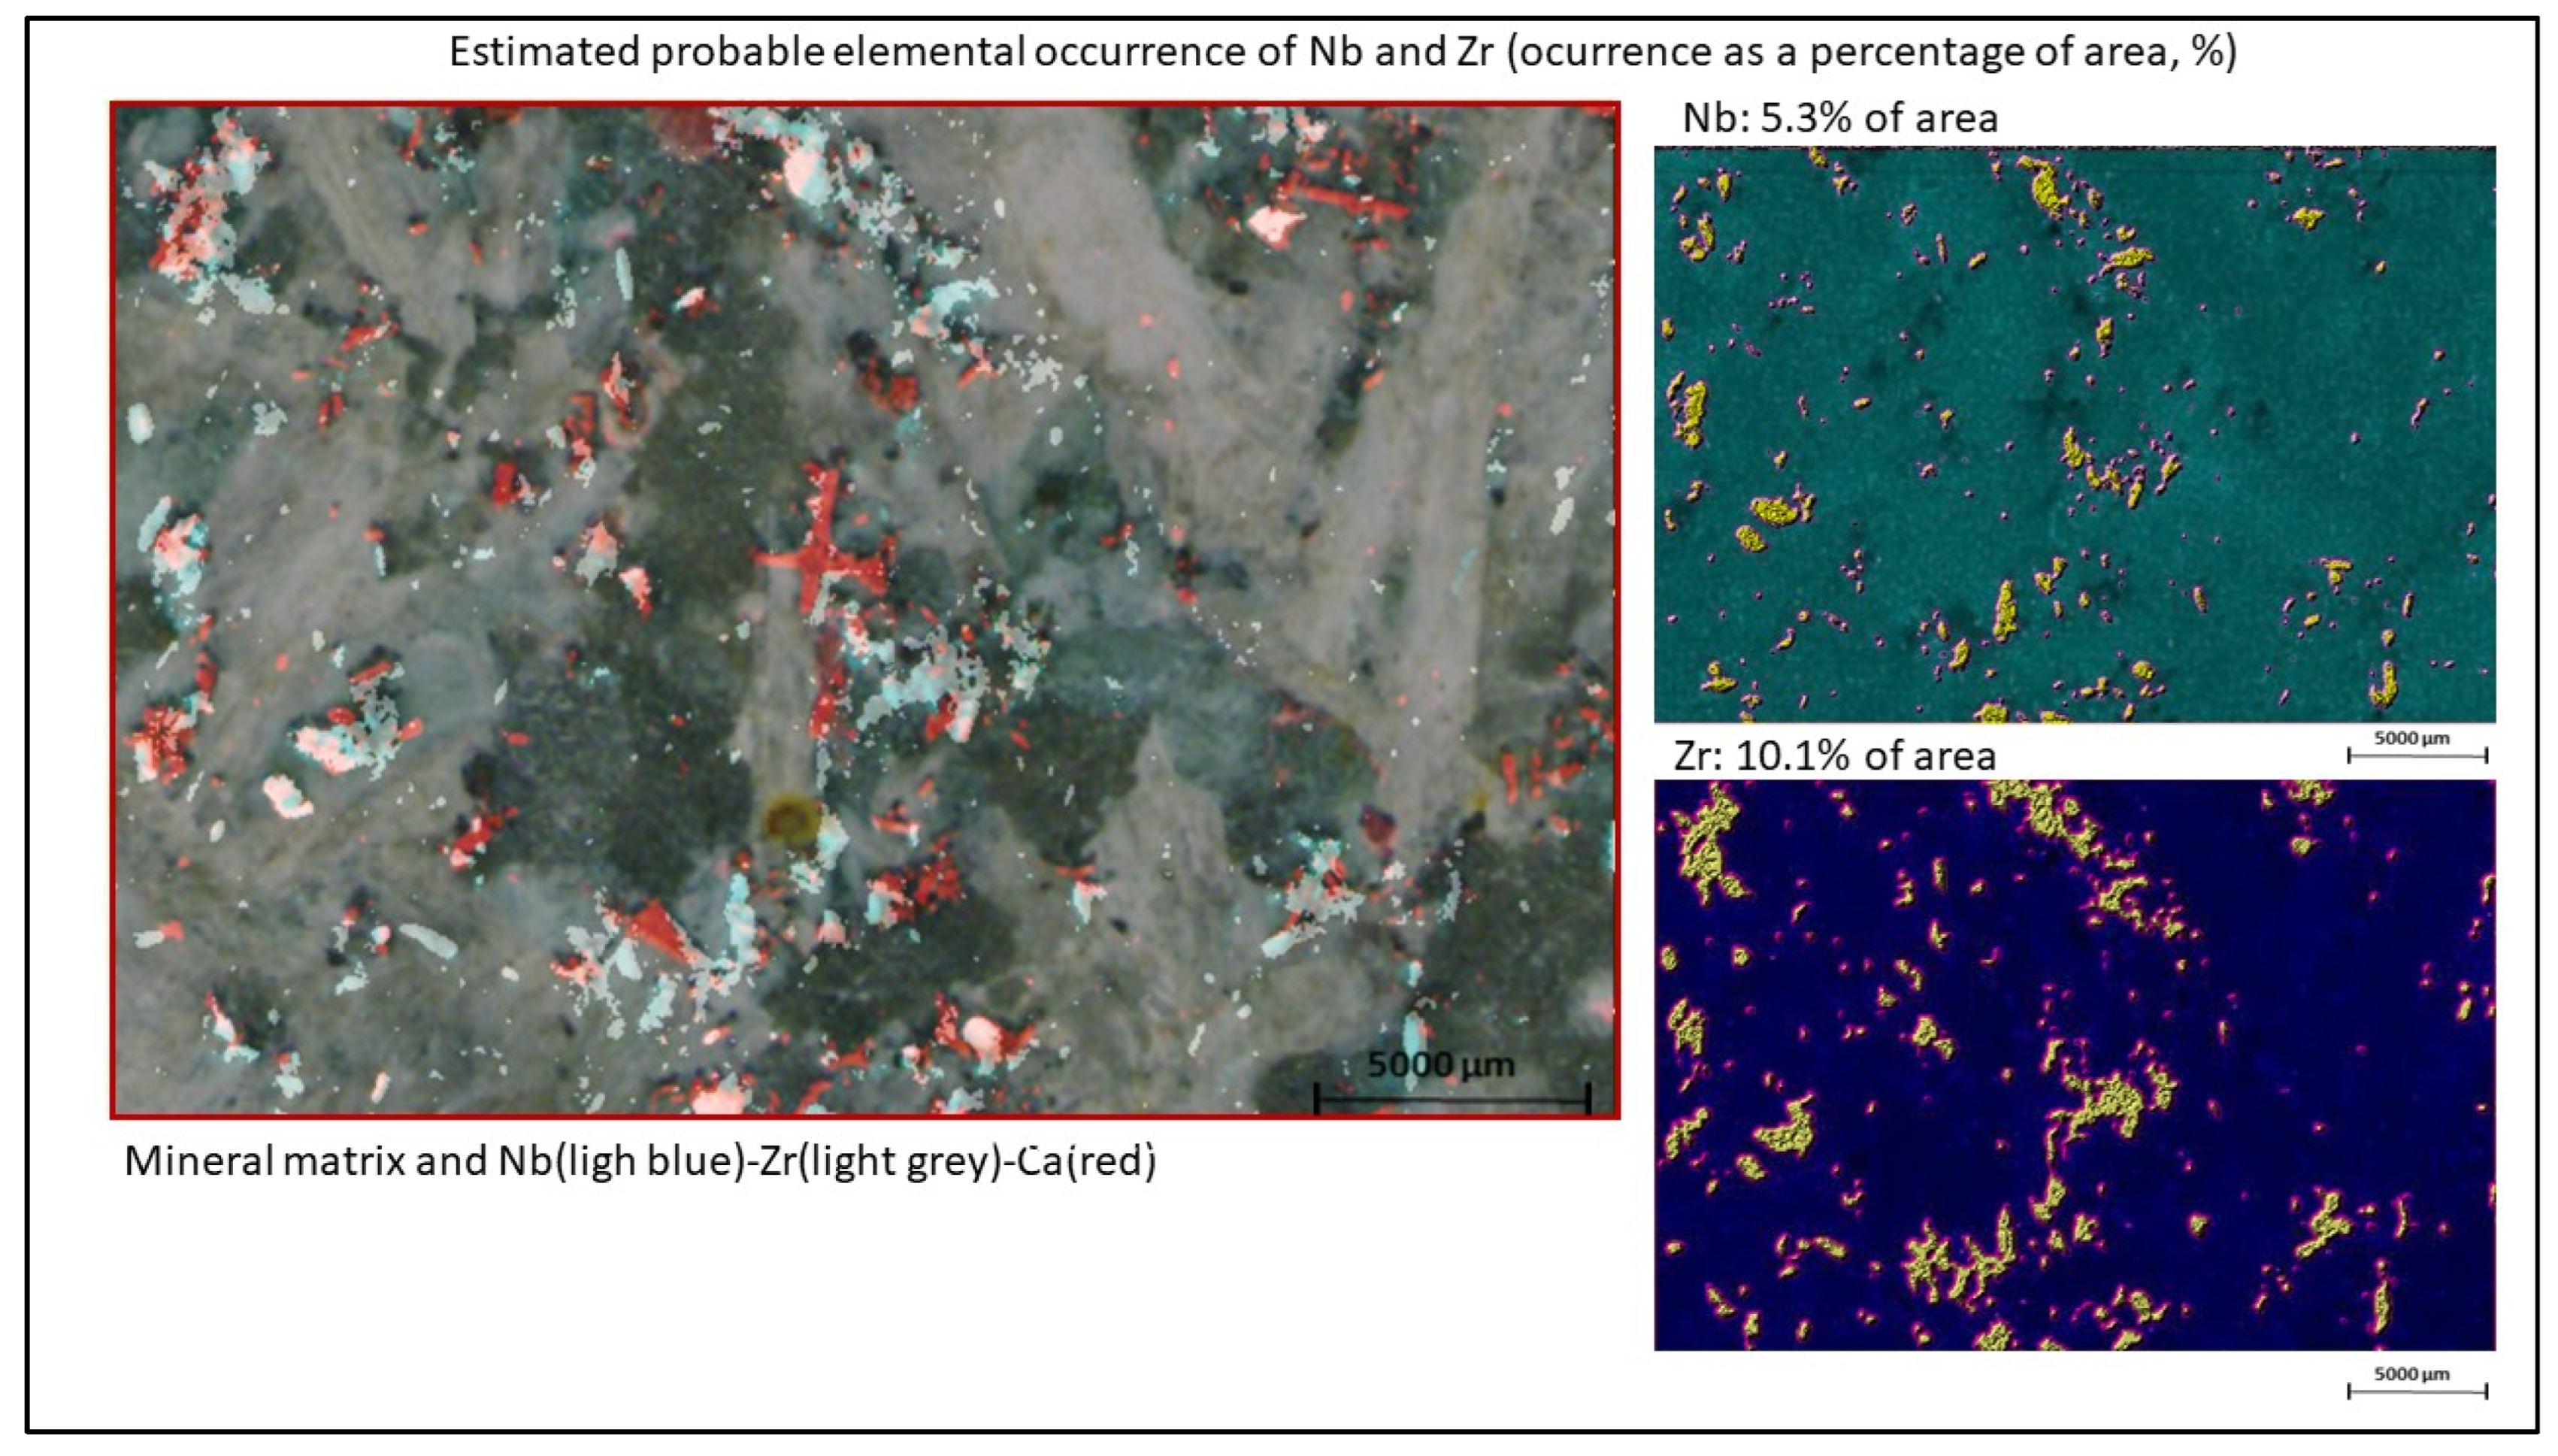
- Nb and Zr have very good spatial correspondence at micrometric scale (Figure 13) in areas with and without Si;


3.1.1. K, Al, Na, and Cl Silicate Phase Minerals
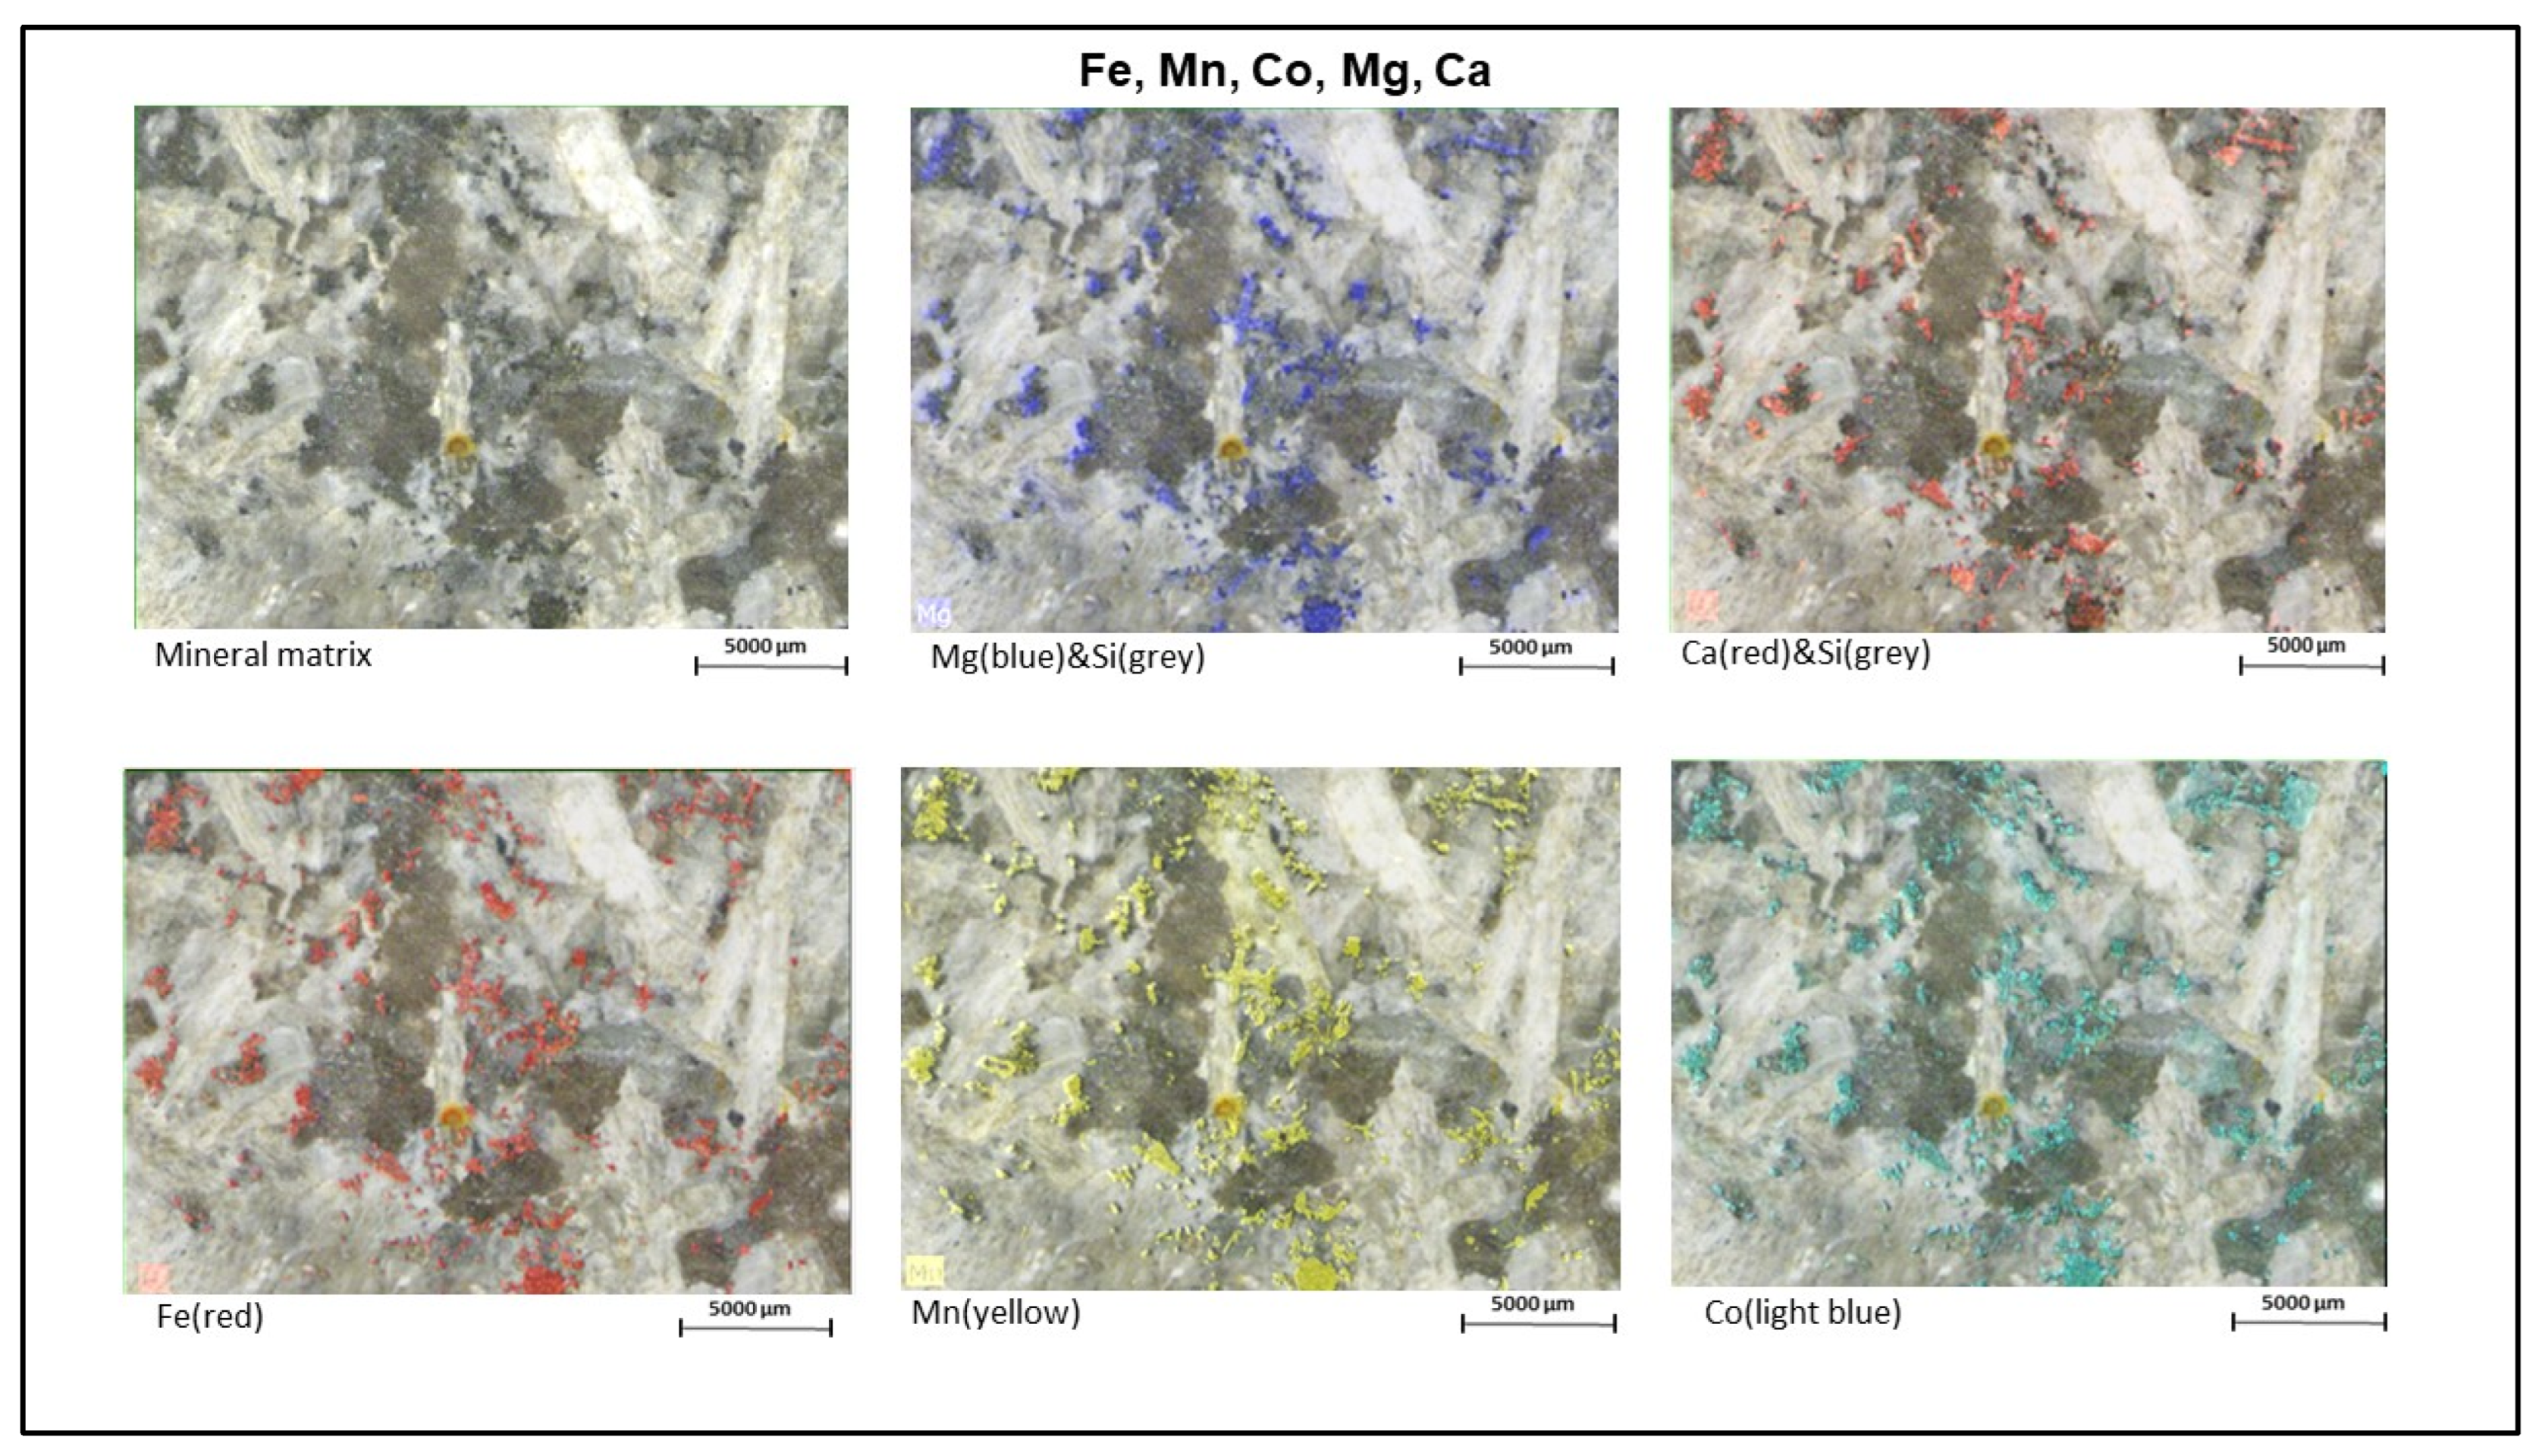
3.1.2. Mg, Ca, and Transition Metals
3.1.3. Ti, HFSE, and Zr-REE-Nb Enrichments
4. Discussion and Conclusions
Author Contributions
Funding
Data Availability Statement
Acknowledgments
Conflicts of Interest
References
- Halama, R.; Vennemann, T.; Siebel, W.; Markl, G. The Gronnedal-Ika Carbonatite-Syenite Complex, South Greenland: Carbonatite Formation by Liquid Immiscibility. J. Pet. 2004, 46, 191–217. [Google Scholar] [CrossRef]
- Manjate, V.A. Whole-rock geochemical, U-Pb and Sm-Nd isotope characteristics of the Dongueni Mont nepheline syenite intrusion, Mozambique. Geosci. Front. 2017, 8, 1063–1071. [Google Scholar] [CrossRef]
- Melluso, L.; Guarino, V.; Lustrino, M.; Morra, V.; Gennaro, R.D. The REE- and HFSE-bearing phases in the Itatiaia alkaline complex (Brazil) and geochemical evolution of feldspar-rich felsic melts. Miner. Mag. 2017, 81, 217–250. [Google Scholar] [CrossRef]
- Gronen, L.H.; Sindern, S.; Katzmarzyk, J.L.; Bormann, U.; Hellmann, A.; Wotruba, H.; Meyer, F.M. Mineralogical and Chemical Characterization of Zr-REE-Nb Ores from Khalzan Buregtei (Mongolia)—Approaches to More Efficient Extraction of Rare Metals from Alkaline Granitoids. Minerals 2019, 9, 217. [Google Scholar] [CrossRef]
- Laznicka, P. 12.8.2. Alkaline metallogeny and giant deposits. In Giant Metallic Deposits: Future Sources of Industrial Metals, 1st ed.; Laznicka, P., Ed.; Springer: Berlin/Heidelberg, Germany, 2006; pp. 463–470. [Google Scholar] [CrossRef]
- Yang, X.; Satur, J.V.; Sanematsu, K.; Laukkanen, J.; Saastamoinen, T. Beneficiation studies of a complex REE ore. Miner. Eng. 2015, 71, 55–64. [Google Scholar] [CrossRef]
- Jena, S.; Dhawan, N.; Rao, D.; Misra, P.; Mishra, B.; Das, B. Studies on extraction of potassium values from nepheline syenite. Int. J. Miner. Process. 2014, 133, 13–22. [Google Scholar] [CrossRef]
- Leading Edge Materials Produces High Purity Nepheline Co-Product from Norra Karr Rare Element Project. Available online: https://leadingedgematerials.com/leading-edge-materials-produces-high-purity-nepheline-co-product-from-norra-karr-rare-element-project/ (accessed on 15 June 2022).
- Cinar, M.; Durgut, E. Mineral beneficiation of nepheline syenite with combination of dry magnetic separation and flotation methods. Physi. Probl. Mineral Proc. 2019, 55, 1227–1238. [Google Scholar] [CrossRef]
- Vicente, C.B.B. Potential of Monchique Nepheline Syenite for incorporation in the Ceramic Industry (Potencial do Sienito Nefelínico de Monchique Para Incorporação na Indústria Cerâmica). Master’s Thesis in Geolgical Engineering, NOVA-School of Science and Technology, Caparica, Portugal, 2015. Available online: http://hdl.handle.net/10362/16340 (accessed on 15 July 2022).
- Deniz, K.; Kadioğlu, Y.K.; Koralay, T.; Güllü, B. The distribution of elements in the alteration of feldspatic minerals. Bull. Miner. Res. Explor. 2021, 165, 1–34. [Google Scholar] [CrossRef]
- Kogarko, L. Chemical Composition and Petrogenetic Implications of Apatite in the Khibiny Apatite-Nepheline Deposits (Kola Peninsula). Minerals 2018, 8, 532. [Google Scholar] [CrossRef] [Green Version]
- Liferovich, R.P.; Mitchell, R.H. Apatite-group minerals from nepheline syenite, Pilansberg alkaline complex, South Africa. Miner. Mag. 2006, 70, 463–484. [Google Scholar] [CrossRef]
- Barranco, I.; Tvarijonaviciute, A.; Perez-Patiño, C.; Vicente-Carrillo, A.; Parrilla, I.; Ceron, J.J.; Martinez, E.A.; Rodriguez-Martinez, H.; Roca, J. Glutathione Peroxidase 5 Is Expressed by the Entire Pig Male Genital Tract and Once in the Seminal Plasma Contributes to Sperm Survival and In Vivo Fertility. PLoS ONE 2016, 11, e0162958. [Google Scholar] [CrossRef] [PubMed]
- Flude, S.; Haschke, M.; Storey, M. Application of benchtop micro-XRF to geological materials. Miner. Mag. 2017, 81, 923–948. [Google Scholar] [CrossRef]
- Kaskes, P.; Déhais, T.; de Graaff, S.J.; Goderis, S.; Claeys, P. Micro–X-ray fluorescence (μXRF) analysis of proximal impactites: High-resolution element mapping, digital image analysis, and quantifications. In Large Meteorite Impacts and Planetary Evolution VI: Geological Society of America Special Paper; Reimold, W.U., Koeberl, C., Eds.; GeoScienceWorld: McLean, VA, USA, 2021; Volume 550, pp. 171–206. [Google Scholar] [CrossRef]
- Mendes, F. Contribution à l’étude géochronologique par la méthode du strontion, des formations cristallines du Portugal. In Parue au Boletin do Museu e Laboratorio Mineralogico e Geologico da Faculdade de Ciencias Universidade de Lisboa; Universidade de Lisboa: Lisboa, Portugal, 1967; Volume 11, pp. 104–107. [Google Scholar]
- Santos, A.R. Estudo geológico e geoquímico do Maciço de Monchique. Bol. Mus. Lab. Min. Geol. Fac. Univ. Lisboa 1973, 13, 143–251. [Google Scholar]
- Rock, N.M.S. Alguns Aspectos Geológicos, Petrológicos e Geoquímicos do Complexo Eruptivo de Monchique; Communicações dos Serviços Geológicos de Portugal: Portugal, Lisboa, 1983; Volume 69, pp. 325–369. [Google Scholar]
- Rock, N.M.S. Chemical mineralogy of the Monchique alkaline complex, southern Portugal. Contrib. Miner. Pet. 1982, 81, 64–78. [Google Scholar] [CrossRef]
- Gonçalves, F. Subsídios Para o Conhecimento Geológico do Maciço Eruptivo de Monchique. Serv. Geol. Portugal Nova Sér. 1971, 18, 62p. Available online: https://openlibrary.org/books/OL3099889M (accessed on 15 July 2022).
- Geologia do Algarve Escala 1:100 000, Geologia de Portugal Escala 1:200 000, Folha 7, Geoportal, LNEG. Available online: https://geoportal.lneg.pt/ (accessed on 15 July 2022).
- González-Clavijo, E.J.; Valadares, V. A Estrutura do Complexo de Monchique; Ciências da Terra (UNL): Lisboa, Portugal, 2003; Volume 5, pp. C37–C40. [Google Scholar]
- Simão, J.; Bravo, M.S.; Ribeiro, M.L. Distribution of Rare Earths and Other Incompatible Elements in the Monchique Massif; Preliminary Note (Distribuição de Terras Raras e Outros Elementos Incompatíveis no Maciço de Monchique; Nota Preliminar). Colecção DCT—Ciências da Terra. 2010, p. 229. Available online: https://run.unl.pt/handle/10362/4686 (accessed on 15 July 2022).
- Rock, N.M.S. Petrology and Petrogenesis of the Monchique Alkaline Complex, Southern Portugal. J. Pet. 1978, 19, 171–214. [Google Scholar] [CrossRef]
- Oliveira, J.T. Carta geológica dePortugal, escala 1/200000. In Notícia Explicativa da Folha 7; Serviços Geológicos de Portugal: Lisboa, Portugal, 1984. [Google Scholar]
- Rock, N.M.S. Comparative geochemistry of nepheline syenites, tinguaites, phonolites and fenites from southern Portugal and East Africa. Bol. Soc. Geol. Portugal 1980, 22, 421–434. [Google Scholar]
- Simão, J. Igneous Rocks as an Ornamental Stone. Causes, Conditions and Mechanisms of Change. Technological Implications (Rochas ígneas Como Pedra Ornamental. Causas, Condicionantes e Mecanismos de Alteração. Implicações Tecnológicas). PhD Thesis, Geolgical Engineering, NOVA-School of Science and Technology, Caparica, Portugal, 2003. [Google Scholar]
- Valdares, V.L. The Alkaline Complex of Monchique. New Cartography, Geochemistry and Geochronology Data (O Complexo Alcalino de Monchique. Novos Dados de Cartografia, Geoquímica e Geocronologia). Master’s Thesis, Dinamic Geology, Faculdade de Ciências da Universidade, Lisboa, Portugal, 2004. [Google Scholar]
- Pessanha, S.; Samouco, A.; Adão, R.; Carvalho, M.L.; Santos, J.P.; Amaro, P. Detection limits evaluation of a portable energy dispersive X-ray fluorescence setup using different filter combinations. X-Ray Spectrom. 2017, 46, 102–106. [Google Scholar] [CrossRef]
- R Core Team. R: A Language and Environment for Statistical Computing; R Foundation for Statistical Computing: Vienna, Austria, 2013; Available online: https://www.R-project.org/ (accessed on 19 April 2022).
- Hothorn, T.; Everitt, B.S. A Handbook of Statistical Analyses Using R. Document. 2005. Available online: https://cran.r-project.org/web/packages/HSAUR3 (accessed on 2 May 2020).
- Hothorn, T.; Everitt, B.S. A Handbook of Statistical Analyses Using R, 3rd ed.; CRC Press: Boca Raton, FL, USA, 2017. [Google Scholar]
- Rahlf, T. Data Visualisation with R—100 Examples; Springer: Berlin/Heidelberg, Germany, 2017; ISBN 978-3-319-49751-8. [Google Scholar]
- Hooper, E.S.; Weller, H.; Amelon, S.K. Countcolors. An R package for quantification of the fluorescence emitted by Pseudo-gymnoascus destructans lesions on the wing membranes of hibernating bats. J. Wildl. Dis. 2020, 56, 759–767. [Google Scholar] [CrossRef]
- Weller, H. Package ‘countcolors’. 2019, p. 10. Available online: https://cran.r-project.org/web/packages/countcolors/countcolors.pdf (accessed on 18 July 2022).
- Barbosa, S.; Dias, A.; Ferraz, A.; Amaro, S.; Brito, M.G.; Almeida, J.A.; Pessanha, S. The Dual Paradigm of Mining Waste: “From Ecotoxicological Sources to Potential Polymetallic Resources”—An Example from Iberian Pyrite Belt (Portugal). Mater. Proc. 2021, 5, 23. [Google Scholar] [CrossRef]
- Barbosa, S.; Dias, A.; Pacheco, M. Investigating metals and metalloids in soil at micrometric scale using µ-XRF spectros-copy—a case study. ICE J. Environ. Geotech. 2022. submitted. [Google Scholar]
- Ahmed, M.; Lai, T.H.; Kim, D.R. colocr: An R package for conducting co-localization analysis on fluorescence microscopy images. PeerJ 2019, 7, e7255. [Google Scholar] [CrossRef] [PubMed]
- Ahmed, M. Package ‘Using Colocr. An R Package for Conducting Co-Localization Analysis’. 2020, p. 10. Available online: https://cran.rproject.org/web/packages/countcolors/countcolors.pdf (accessed on 18 July 2022).
- Li, W.; Chakraborty, S.; Nagashima, K.; Costa, F. Multicomponent diffusion of F, Cl and OH in apatite with application to magma ascent rates. Earth Planet. Sci. Lett. 2020, 550, 116545. [Google Scholar] [CrossRef]
- Scott, J.A.; Humphreys, M.C.; Mather, T.A.; Pyle, D.M.; Stock, M.J. Insights into the behaviour of S, F, and Cl at Santiaguito Volcano, Guatemala, from apatite and glass. Lithos 2015, 232, 375–394. [Google Scholar] [CrossRef]
- Horstman, E. The distribution of lithium, rubidium and caesium in igneous and sedimentary rocks. Geochim. et Cosmochim. Acta 1957, 12, 1–28. [Google Scholar] [CrossRef]
- Chiwona, A.G.; Cortés, J.A.; Gaulton, R.G.; Manning, D.A.C. Petrology and geochemistry of selected nepheline syenites from Malawi and their potential as alternative potash sources. J. Afr. Earth Sc. 2020, 164, 103769. [Google Scholar] [CrossRef]
- Davidson, J. Strontium in igneous rocks. In Geochemistry. Encyclopedia of Earth Science; Springer: Berlin/Heidelberg, Germany, 2006; pp. 599–600. [Google Scholar] [CrossRef]
- Neumann, H. Notes on the mineralogy and geochemistry of zinc. Miner. Mag. J. Miner. Soc. 1949, 28, 575–581. [Google Scholar] [CrossRef]
- Salminen, R.; Batista, M.J.; Bidovec, M.; Demetriades, A.; De Vivo, B.; De Vos, W.; Duris, M.; Gilucis, A.; Gregorauskiene, V.; Halamic, J.; et al. Part 1 Background Information, Methodology and Maps. Introduction to the Chemistry and Geochemistry of the Elements. Ba-Carium. 2005, 71–77. ISBN 951-690.913-2 (Electronic Version). Available online: http://weppi.gtk.fi/publ/foregsatlas/text/Ba.pdf (accessed on 10 July 2022).
- Alves, P.; Gomes, C.L. Late Sr-Ba pocket mineralization in under-saturated dyke-rocks from the Alkaline Massif of Monchique—Southern Portugal (Mineralização Sr-Ba tardia em cavidades de rochas filonianas subsaturadas do Maciço Alcalino de Monchique). GEOTIC—Sociedade Geológica de Portugal. VIII Congresso Nacional de Geologia. Geosci. Online J. e-Terra 2010, 16, 4. [Google Scholar]
- Salminen, R.; Batista, M.J.; Bidovec, M.; Demetriades, A.; De Vivo, B.; De Vos, W.; Duris, M.; Gilucis, A.; Gregorauskiene, V.; Halamic, J.; et al. Atlas of Europe. Part 1 Background Information, Methodology and Maps. Introduction to the Chemistry and Geochemistry of the Elements. Zn-Zinc. 2005, 417–423. ISBN 951-690.913-2 (Electronic Version). Available online: http://weppi.gtk.fi/publ/foregsatlas/article.php?id=5 (accessed on 10 July 2022).
- Core, D.P.; Kesler, S.E.; Essene, E.J.; Dufresne, E.B.; Clarke, R.; Arms, D.A.; Walko, D.; Rivers, M.L. Copper and zinc in silicate and oxide minerals in igneous rocks from the bingham park city belt, utah: Synchrotron X-ray-fluorescence data. Can. Miner. 2005, 43, 1781–1796. [Google Scholar] [CrossRef]
- Elliott, T.; Steele, R.C.J. The Isotope Geochemistry of Ni. Rev. Miner. Geochem. 2017, 82, 511–542. [Google Scholar] [CrossRef]
- Siebecker, M.G.; Chaney, R.L.; Sparks, D.L. Natural speciation of nickel at the micrometer scale in serpentine (ultramafic) topsoils using microfocused X-ray fluorescence, diffraction, and absorption. Geochem. Trans. 2018, 19, 1–16. [Google Scholar] [CrossRef] [PubMed]
- Hitzman, M.W.; Bookstrom, A.A.; Slack, J.F.; Zientek, M.L. Cobalt—Styles of Deposits and the Search for Primary Deposits; U.S. Geological SurveyOpen-File Report: Reston, WV, USA, 2017; Volume 1155, p. 47. [CrossRef] [Green Version]
- Carr, M.; Turekian, K. The geochemistry of cobalt. Geochim. et Cosmochim. Acta 1961, 23, 9–60. [Google Scholar] [CrossRef]
- Jena, S.K.; Dhawan, N.; Rath, S.S.; Rao, D.S.; Das, B. Investigation of microwave roasting for potash extraction from nepheline syenite. Sep. and Purif. Tech. 2016, 161, 104–111. [Google Scholar] [CrossRef]
- Paulick, H.; Machacek, E. The global rare earth element exploration boom: An analysis of resources outside of China and discussion of development perspectives. Resour. Policy 2017, 52, 134–153. [Google Scholar] [CrossRef]
- Balaram, V. Rare earth elements: A review of applications, occurrence, exploration, analysis, recycling, and environmental impact. Geosci. Front. 2019, 10, 1285–1303. [Google Scholar] [CrossRef]
- Wills, B.A. Mineral Processing, 6th ed.; Butterworth Heinemann: Oxford, UK, 1992. [Google Scholar]
- Bond, F.C. Crushing & Grinding Calculations Part I. Br. Chem. Eng. 1951, 622, 378. [Google Scholar]
- Izatt, R.M.; Izatt, S.R.; Izatt, N.E.; Krakowiak, K.E.; Bruening, R.L.; Navarro, L. Industrial applications of molecular recognition technology to separations of platinum group metals and selective removal of metal impurities from process streams. Green Chem. 2015, 17, 2236–2245. [Google Scholar] [CrossRef]
- Izatt, S.R.; Bruening, R.L.; Krakowiak, K.E.; Izatt, R.M. Molecular recognition technology: Green chemistry separation and recovery of individual rare earth elements from primary and secondary sources. In Proceedings of the International Conference on Science and Technology of Rare Earths, Tirupati, India, 23–25 September 2018; pp. 7–8. [Google Scholar]
- Zhang, W.; Noble, A.; Yang, X.; Honaker, R. A Comprehensive Review of Rare Earth Elements Recovery from Coal-Related Materials. Minerals 2020, 10, 451. [Google Scholar] [CrossRef]

Publisher’s Note: MDPI stays neutral with regard to jurisdictional claims in published maps and institutional affiliations. |
© 2022 by the authors. Licensee MDPI, Basel, Switzerland. This article is an open access article distributed under the terms and conditions of the Creative Commons Attribution (CC BY) license (https://creativecommons.org/licenses/by/4.0/).
Share and Cite
Barbosa, S.; Dias, A.; Durão, D.; Grilo, J.; Baptista, G.; Cagiza, J.; Pessanha, S.; Simão, J.; Almeida, J. Exploring High-Resolution Chemical Distribution Maps of Incompatible and Scarce Metals in a Nepheline Syenite from the Massif of “Serra de Monchique” (Portugal, Iberian Peninsula). Minerals 2022, 12, 1178. https://doi.org/10.3390/min12091178
Barbosa S, Dias A, Durão D, Grilo J, Baptista G, Cagiza J, Pessanha S, Simão J, Almeida J. Exploring High-Resolution Chemical Distribution Maps of Incompatible and Scarce Metals in a Nepheline Syenite from the Massif of “Serra de Monchique” (Portugal, Iberian Peninsula). Minerals. 2022; 12(9):1178. https://doi.org/10.3390/min12091178
Chicago/Turabian StyleBarbosa, Sofia, António Dias, Diogo Durão, José Grilo, Gonçalo Baptista, Jonhsman Cagiza, Sofia Pessanha, Joaquim Simão, and José Almeida. 2022. "Exploring High-Resolution Chemical Distribution Maps of Incompatible and Scarce Metals in a Nepheline Syenite from the Massif of “Serra de Monchique” (Portugal, Iberian Peninsula)" Minerals 12, no. 9: 1178. https://doi.org/10.3390/min12091178