Article

Macro-Microscopic Deterioration Behavior of Gypsum Rock after Wetting and Its Constitutive Model Based on Acoustic Emission

1
State Key Laboratory for Geomechanics & Deep Underground Engineering Xuzhou, China University of Mining & Technology, Xuzhou 221116, China
2
Department of Mechanical, Aerospace and Civil Engineering, School of Engineering, The University of Manchester, Manchester M13 9PL, UK
3
State Key Laboratory for Geomechanics & Deep Underground Engineering Beijing, China University of Mining & Technology, Beijing 100083, China
*
Authors to whom correspondence should be addressed.
Minerals 2022, 12(9), 1168; https://doi.org/10.3390/min12091168
Submission received: 24 July 2022 / Revised: 29 August 2022 / Accepted: 13 September 2022 / Published: 15 September 2022
(This article belongs to the Topic Support Theory and Technology of Geotechnical Engineering)

Abstract

:
Gypsum rock is highly sensitive to a water environment due to its unique physical and chemical properties, such as high solubility. After wetting, the internal microstructure of gypsum rock is damaged, and the mechanical properties deteriorate accordingly, leading to serious engineering problems for gypsum-bearing geotechnical structures. Therefore, it is particularly necessary to investigate the mechanical deterioration behavior of gypsum rock after wetting. In this paper, the mechanical behavior of gypsum rocks with different water contents were studied. The relationship between the rock water content and the water immersion time was established through the water content test. The scanning electron microscope (SEM) images of the gypsum rock after the water immersion showed that the internal microstructure of the gypsum rock became looser and more complex as the immersion time increased. The fractal dimensions of the SEM images were calculated to quantify the degree of damage to the gypsum rocks after wetting. These images showed that the degree of damage increased with the increasing immersion time, but the increase rate tended to be slow. The relationship between the rock water content and the mechanical responses of gypsum rock were established by triaxial compression tests, and the concomitant acoustic emission (AE) characteristics in the loading processes showed that the immersion time had a positive correlation with the AE frequency and a negative correlation with the AE cumulative count. Based on the AE characteristics, a damage constitutive model of gypsum rock as a function of immersion time was developed and this can reproduce the mechanical responses of gypsum rock after wetting.

1. Introduction

With the development of the global economy, urbanization, and infrastructure construction in recent years, more and more geotechnical engineering problems are encountered, and engineering problems resulting from the dissolution and softening of soluble rocks in a water environment occur from time to time [1,2,3,4]. Gypsum rock is a kind of evaporite extensively existing in the earth and often encountered in geotechnical engineering projects and construction, e.g., [5,6,7,8,9]. It is mainly composed of CaSO4·2H2O. Being one of the most soluble common rocks, gypsum rock has unique physical and chemical properties, such as softening and swelling with an increasing rock water content, which cause a series of geotechnical engineering problems. Therefore, it is of great significance to study the mechanical deterioration behavior of gypsum rock after wetting, in order to provide a reference for project construction, e.g., tunnels in gypsum rock, the decoration industry, and the gypsum industry in the urbanization process such as wallboard/plasterboard, ceiling tiles, partitions, and other construction products, as well as the stability of gypsum mining.
A significant amount of research on the damage evolution characteristics of rock materials under the action of water and aqueous solutions has been conducted. For example, Auvray, et al. [10] observed the decomposition and aging process of gypsum ore pillars in goaf by using a scanning electron microscope (SEM). Their results show that the aging rate of the gypsum ore pillar is related to the relative humidity in the goaf. Yilmaz [11] proposed empirical equations to predicate the uniaxial compression strength and modulus of elasticity of the saturated gypsum from the experimental results of the dry gypsum. Li and Einstein [12] proposed a two-dimensional model to investigate the expansion evolution law of a pre-existing cylindrical tube in gypsum rock due to water flow and mineral dissolution. Zhu, et al. [1] tested the basic mechanical properties of gypsum rock with different water immersion times and derived the relationship between the rock brittleness coefficient and the water immersion time, and this was found to effectively reflect the transitions of the rock’s mechanical responses, i.e., from brittle to ductile in a water environment. Yu, et al. [13] studied the mesoscopic mechanism for the weakening processes of gypsum rock in brine solutions with different salinity levels and temperatures and used SEM to analyze the changes in the microstructure of the gypsum rock. Jiang, et al. [2] studied the degrading property of gypsum breccia under wetting–drying cycles with various flow rates by the one-dimensional water saturation experiment. Their results revealed the coupling mechanism of water saturation and mineral dissolution in the deterioration process of the rock. Using molecular dynamics simulations, Ouyang, et al. [14] studied the nanoscale contact process of two quartz particles, one of the major components in rock materials [15,16,17,18], in a water environment, and quantified the tendency of stress-induced mineral dissolution at contact areas. Though extensive research efforts have been devoted to investigating the effect of a water environment on the physical and mechanical behavior of rock materials, a quantitative damage constitutive model for the gypsum-bearing rock as a function of water immersion time is still missing and this is of great interest to practical engineering applications. In addition, a quantitative approach to evaluate the water-induced micro-damage evolution in gypsum rock is still missing.
To address the current research gaps, by using macroscopic and microscopic methods, this paper studies the deterioration behavior of gypsum rock after wetting, including the damage evolution characteristics of the microstructures and the deterioration effect on the mechanical properties. An SEM image-based approach was proposed to quantify the degree of micro-damage. A damage constitutive model based on the experimentally measured AE characteristics was proposed and was found to successfully describe the mechanical responses of gypsum rock after water immersion. Our results are expected to provide a theoretical insight for stability prediction, early warning, and control of surrounding rock in the related engineering projects in humid conditions or in an underground water environment.

2. Materials and Methods

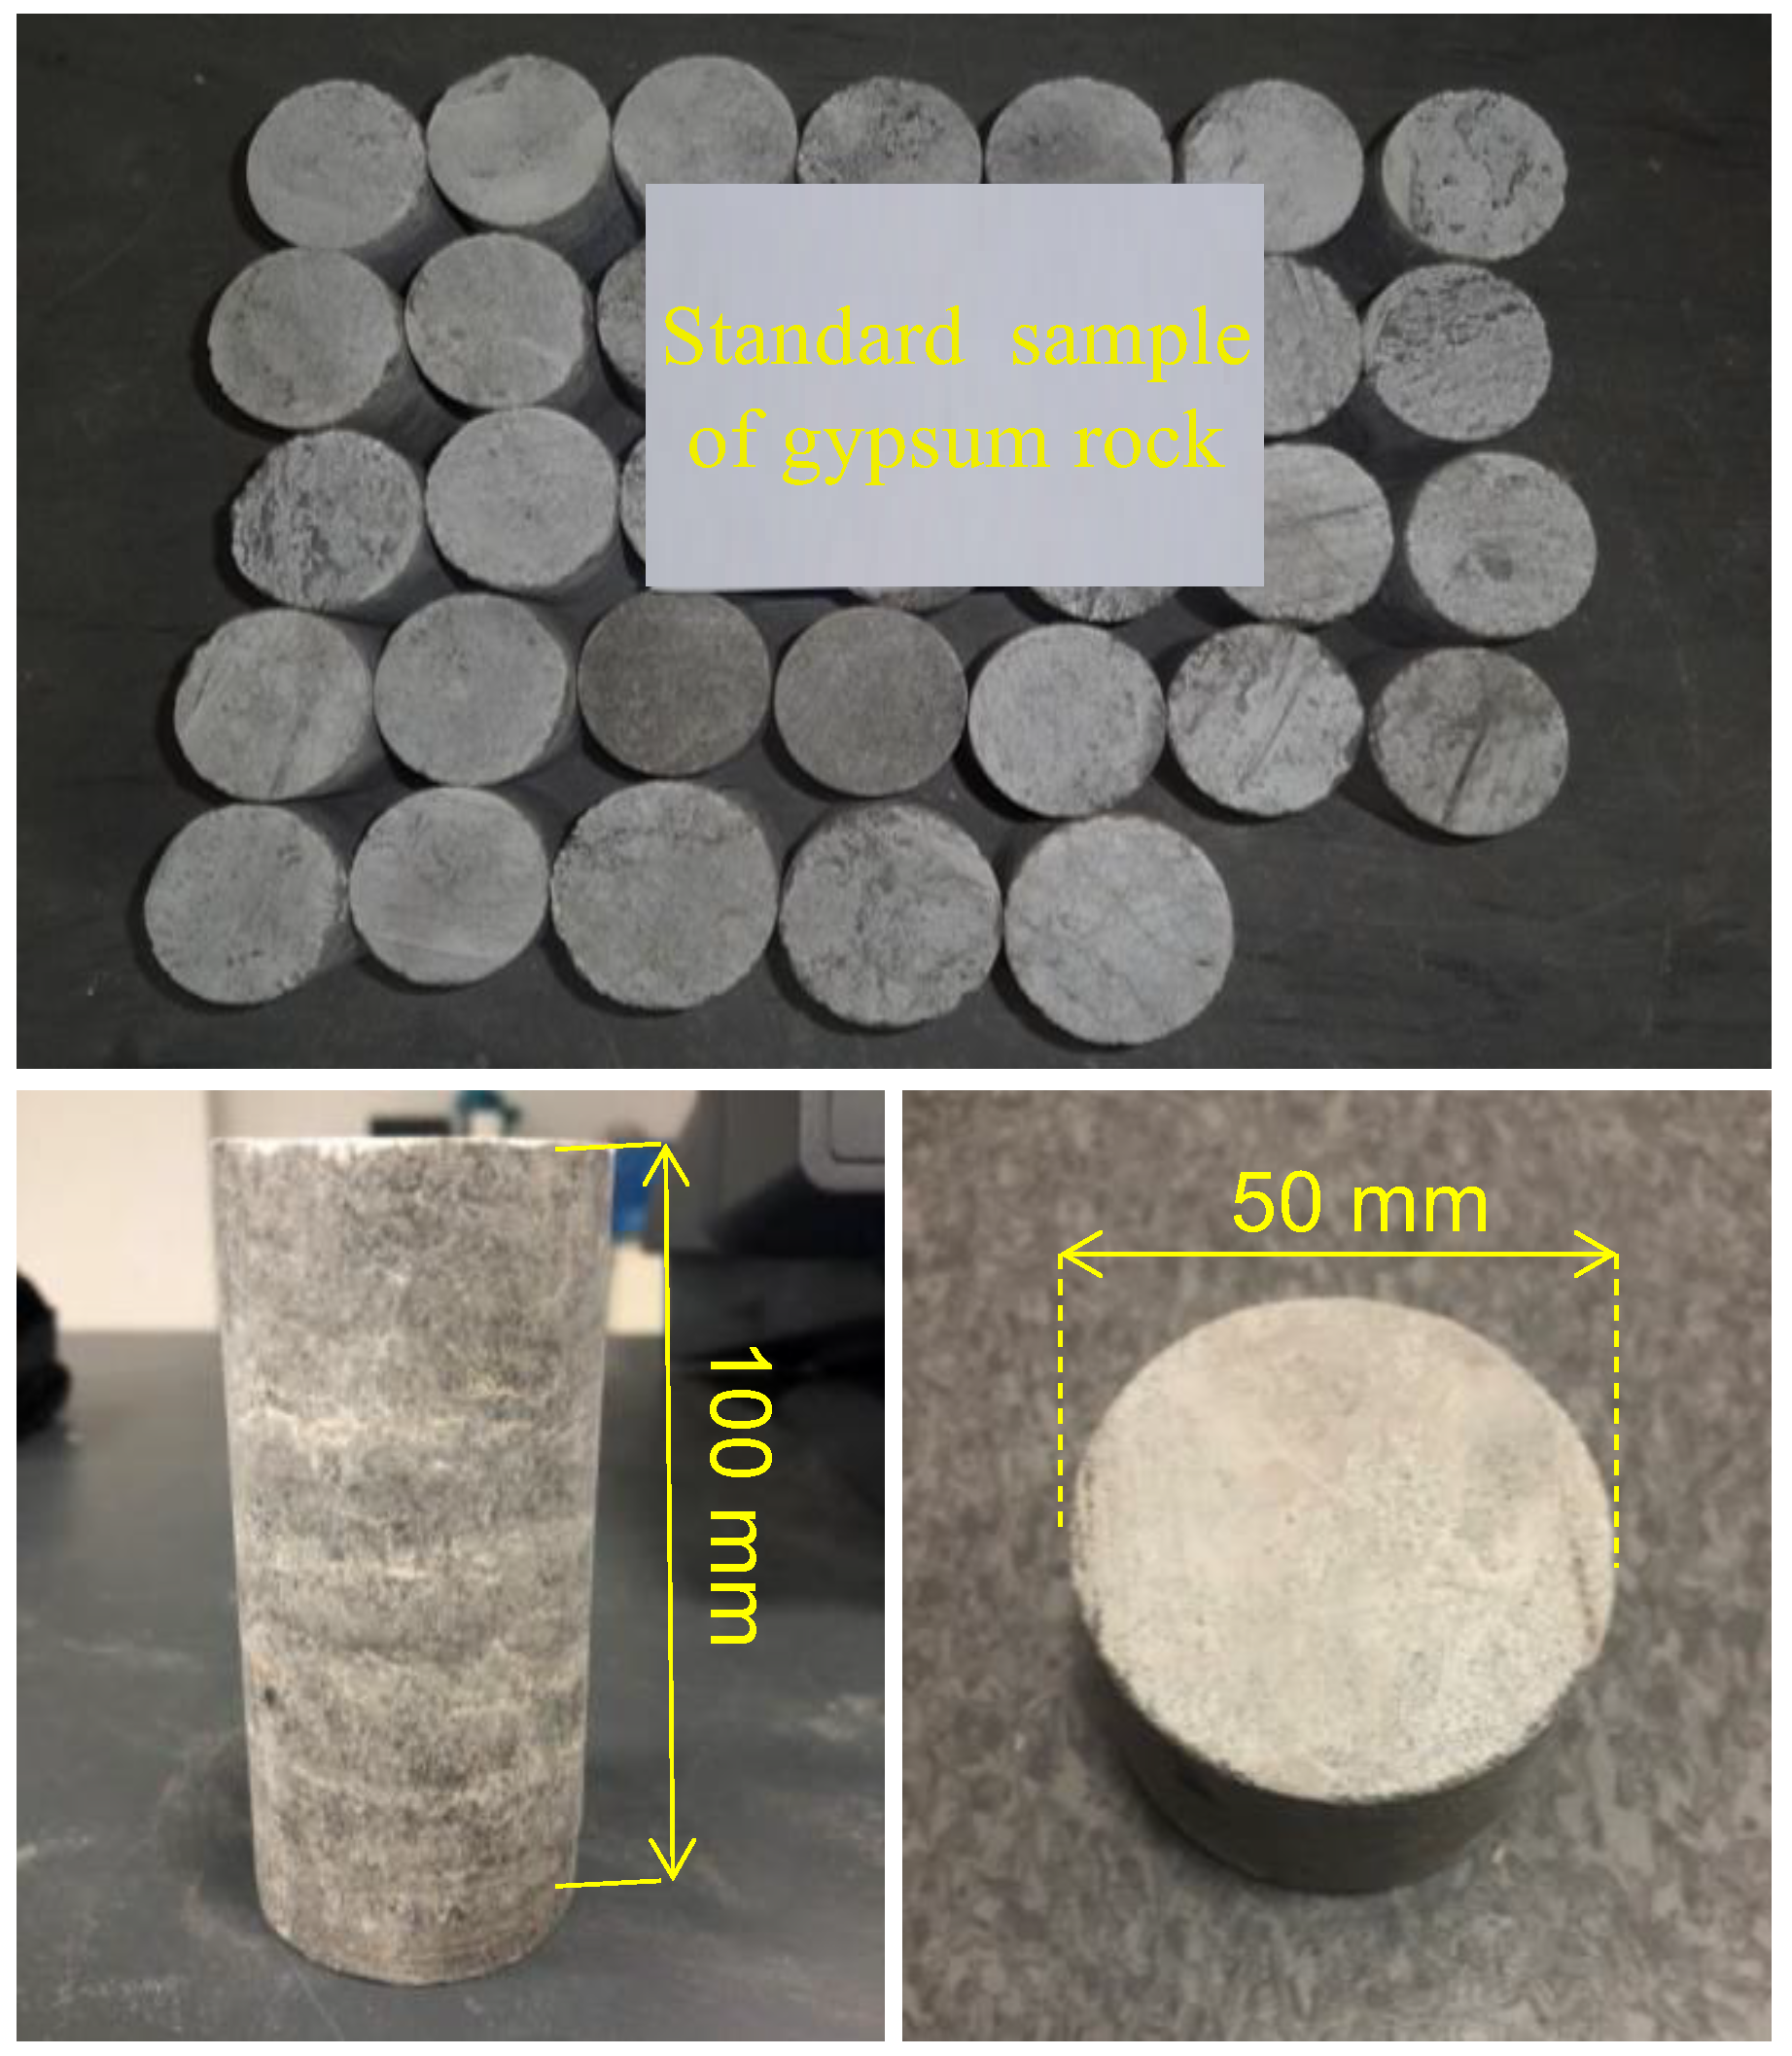
2.1. Specimen Preparation and Micro-Damage Characterization

The hydrophilic softening of gypsum rock occurs after immersion in water and this impacts the compressive strength, the tensile strength, the elastic modulus, Poisson’s ratio, and the other mechanical properties of gypsum rock. To investigate the effect of water immersion time on the mechanical responses of gypsum rock, standard cylinder specimens of gypsum rock of φ50 × 100 mm were prepared (Figure 1). The rock samples were prepared by following these procedures: firstly, large intact rock blocks from a gypsum mine in Jiangsu Province, China, were collected in situ and transported to the laboratory; and secondly, by following the International Society for Rock Mechanics (ISRM) standards [19], the standard cylindrical samples with a diameter of 50 mm and a length of 100 mm were prepared. A test scheme was designed to measure the rock water content in the natural state after immersion in water for 1, 7, 15, and 30 days, respectively. According to the different immersion times, five groups of gypsum rocks were prepared, and three rock samples were selected for each group to ensure replicability. Our subsequent experimental results found very low variability among the samples in the same group. All the rock samples were dried and weighed first. The rock samples were oven dried for 24–48 h at 65 °C until the sample weight was constant. The natural water content in the gypsum rock was determined by following the International Society for Rock Mechanics (ISRM) standards [20]. After each group of immersed samples completed the prearranged immersion time in water, the rock surface water was removed by a damp cloth and the samples were weighed again. The difference between the two weights before ( M 2 ) and after ( M 1 ) water immersion was recorded, and the water content of the rock sample was computed with Equation (1):
ω = M 1 M 2 M 2 = Δ M M 2
Water damages the mechanical properties of gypsum rock by a range of physical and chemical actions such as hydration reaction, water adsorption, and dissolution [1,12]. To better investigate the deterioration mechanism of gypsum rock under the action of water from a microscopic perspective, gypsum rocks, after immersion in water for different numbers of days, were scanned by the TESCAN MAIA3 Field Emission Gun-Scanning Electron Microscope (FEG-SEM) apparatus (manufactured by TESCAN ORSAY HOLDING, Brno, Czech Republic).
The calculation of porosity in rock is closely related to the range of pore size considered. When only pores larger than a certain size are considered, the calculated porosity is relatively low, and thus the porosity and pore (microcrack) distribution are not enough to fully characterize the microstructure of the rock materials before and after damage. For example, the commonly used methods such as mercury intrusion porosimetry (MIP) cannot measure the pore size below a certain threshold. Therefore, based on the self-similarity of the rock pore structure, establishing the relationship between the fractal dimension of the rock microstructure and its degree of damage is an effective way to quantify the damage to the gypsum rock after wetting. We followed the previous work of Shi, et al. [21] to conduct the fractal analysis of the SEM images.

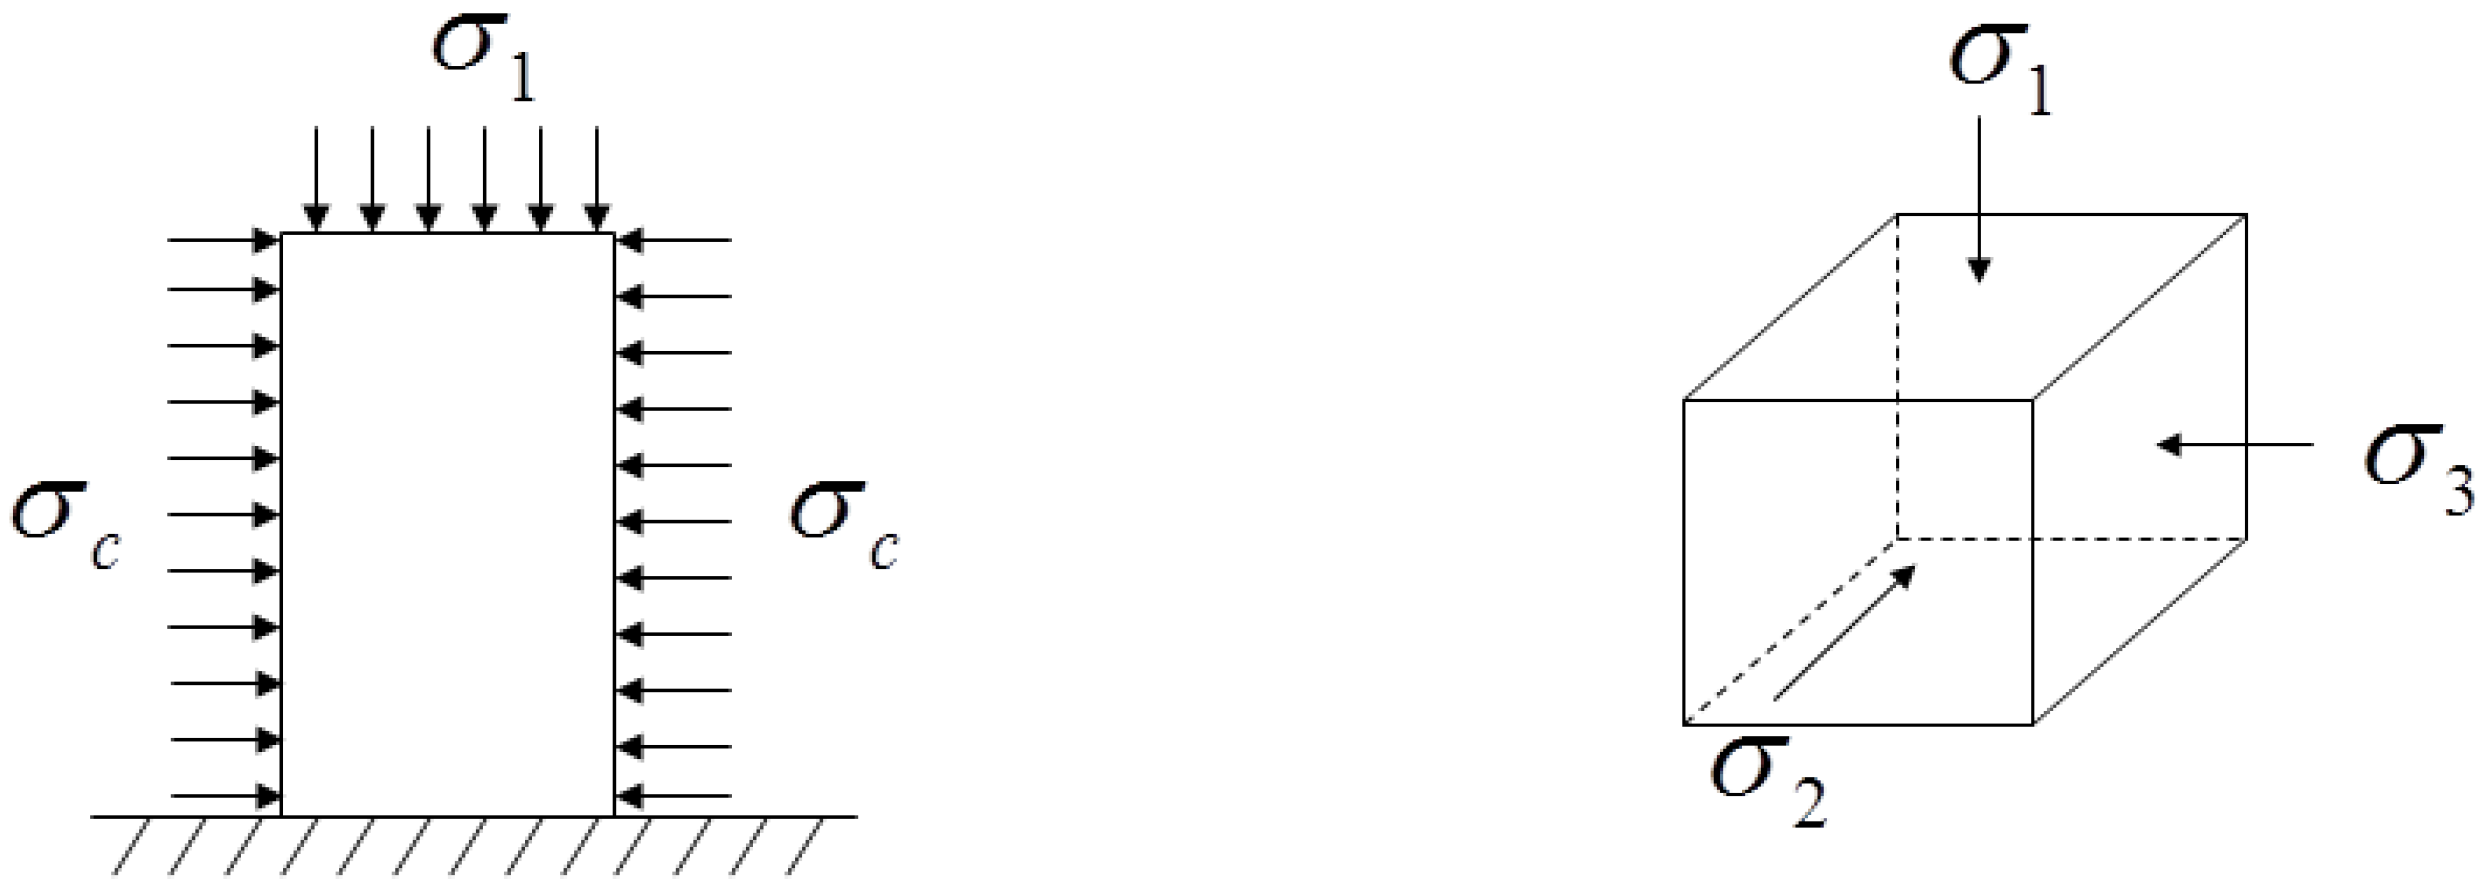
2.2. The Mechanical Test Scheme and Acoustic Emission Monitoring

Using the MTS815.02 electro-hydraulic servo rock mechanics test system (manufactured by MTS Systems Corporation, Eden Prairie, Minnesota, United States), the triaxial compression tests of gypsum rocks in the natural state, after immersion in water for 1, 7, 15, and 30 days, respectively, were carried out, by following the International Society for Rock Mechanics (ISRM) standards [19]. The loading rate was 0.1 mm/min and the constant confining pressure was 5 MPa. The constant confining pressure of 5 MPa was applied by the MTS815.02 rock mechanics test system, using silicone oil as the confining pressure fluid. The specimens were initially sealed with a 0.5 mm thick Teflon heat-shrink tubing and then placed into the triaxial pressure cell. The confining pressure was controlled by an oil pressure intensifier with a rate of 0.1 MPa/s.
The damage evolution of the gypsum rock in the loading process will generate acoustic emission (AE) signals. In our case, these acoustic emission characteristics were only affected by the water immersion time since the rock type (gypsum), shape, and size were all fixed. To further investigate the effect of the water immersion time on the mechanical deterioration of the gypsum rock, the AE signals of the gypsum rock with different water immersion durations during the loading processes were analyzed. As for the AE experimental apparatus and the related parameters setup (e.g., sampling rate and threshold value), we followed the work of Jing, et al. [22]. The Physical Acoustics Corporation (PAC) Express-8 AE system (manufactured by MISTRAS Group, Inc., Princeton, United States) was adopted to monitor the AE signals using four sensors, with the threshold value of 30 dB and the gain on the preamplifier of 40 dB.

2.3. The Damage Constitutive Model Based on AE

Based on the AE characteristics of the gypsum rock under triaxial compression, a constitutive model considering the damage after wetting was established. A microscopic element was taken out from the rock sample, where a circumferential confining pressure σ 2 = σ 3 = σ c was applied, as shown in Figure 2.
It is assumed that the mechanical response of the microscopic element conforms to the generalized Hooke’s law of linear elasticity:
σ 1 = λ + 2 G ε 1 + λ ε 2 + λ ε 3 σ 2 = λ ε 1 + λ + 2 G ε 2 + λ ε 3 σ 3 = λ ε 1 + λ ε 2 + λ + 2 G ε 3
where, σ 1 , σ 2 , σ 3 are three principal stresses, ε 1 , ε 2 , ε 3 are the principal strains corresponding to three principal stress directions, and λ = μ E / 1 + μ 1 2 μ , G = E / 2 1 + μ are Lame constants. Considering that σ 2 = σ 3 = σ c , we can get:
σ 1 = E ε 1 + 2 μ σ 3
By introducing a damage variable D , the principal stress-strain constitutive relationship of the gypsum rock after immersion in water is as follows [23]:
σ 1 = E 1 D ε 1 + 2 μ σ 3
Because the AE count has a good correspondence with the strain energy dissipation due to crack initiation and propagation in the rock sample, it can better reflect the damage evolution characteristics in the rock sample [22]. Therefore, the AE count is used as the characteristic parameter to describe the damage evolution characteristics of the gypsum rock in the loading process [22].
D can use Kachanov’s damage variable [23]:
D = A d A
where A d is the cross-sectional area of the rock sample with damage such as crack generation, propagation, and penetration, and A is the cross-sectional area in the initial state without damage [23].
Let M 0 be the AE cumulative count when the initial section area A is completely destroyed, then the AE cumulative count per unit area is M w = M 0 A . When the damaged area of the rock sample reaches A d , the AE cumulative count M d is:
M d = M 0 A d A
Combining Equations (5) and (6), D can be obtained as follows:
D = M d M 0
Substituting Equation (7) into Equation (4), the constitutive model of the gypsum rock based on the AE can be obtained as:
σ 1 = E 1 M d M 0 ε 1 + 2 μ σ 3
where E and μ can be expressed as the empirical functions of the water immersion time t , as shown in our subsequent sections.

3. Results and Discussion
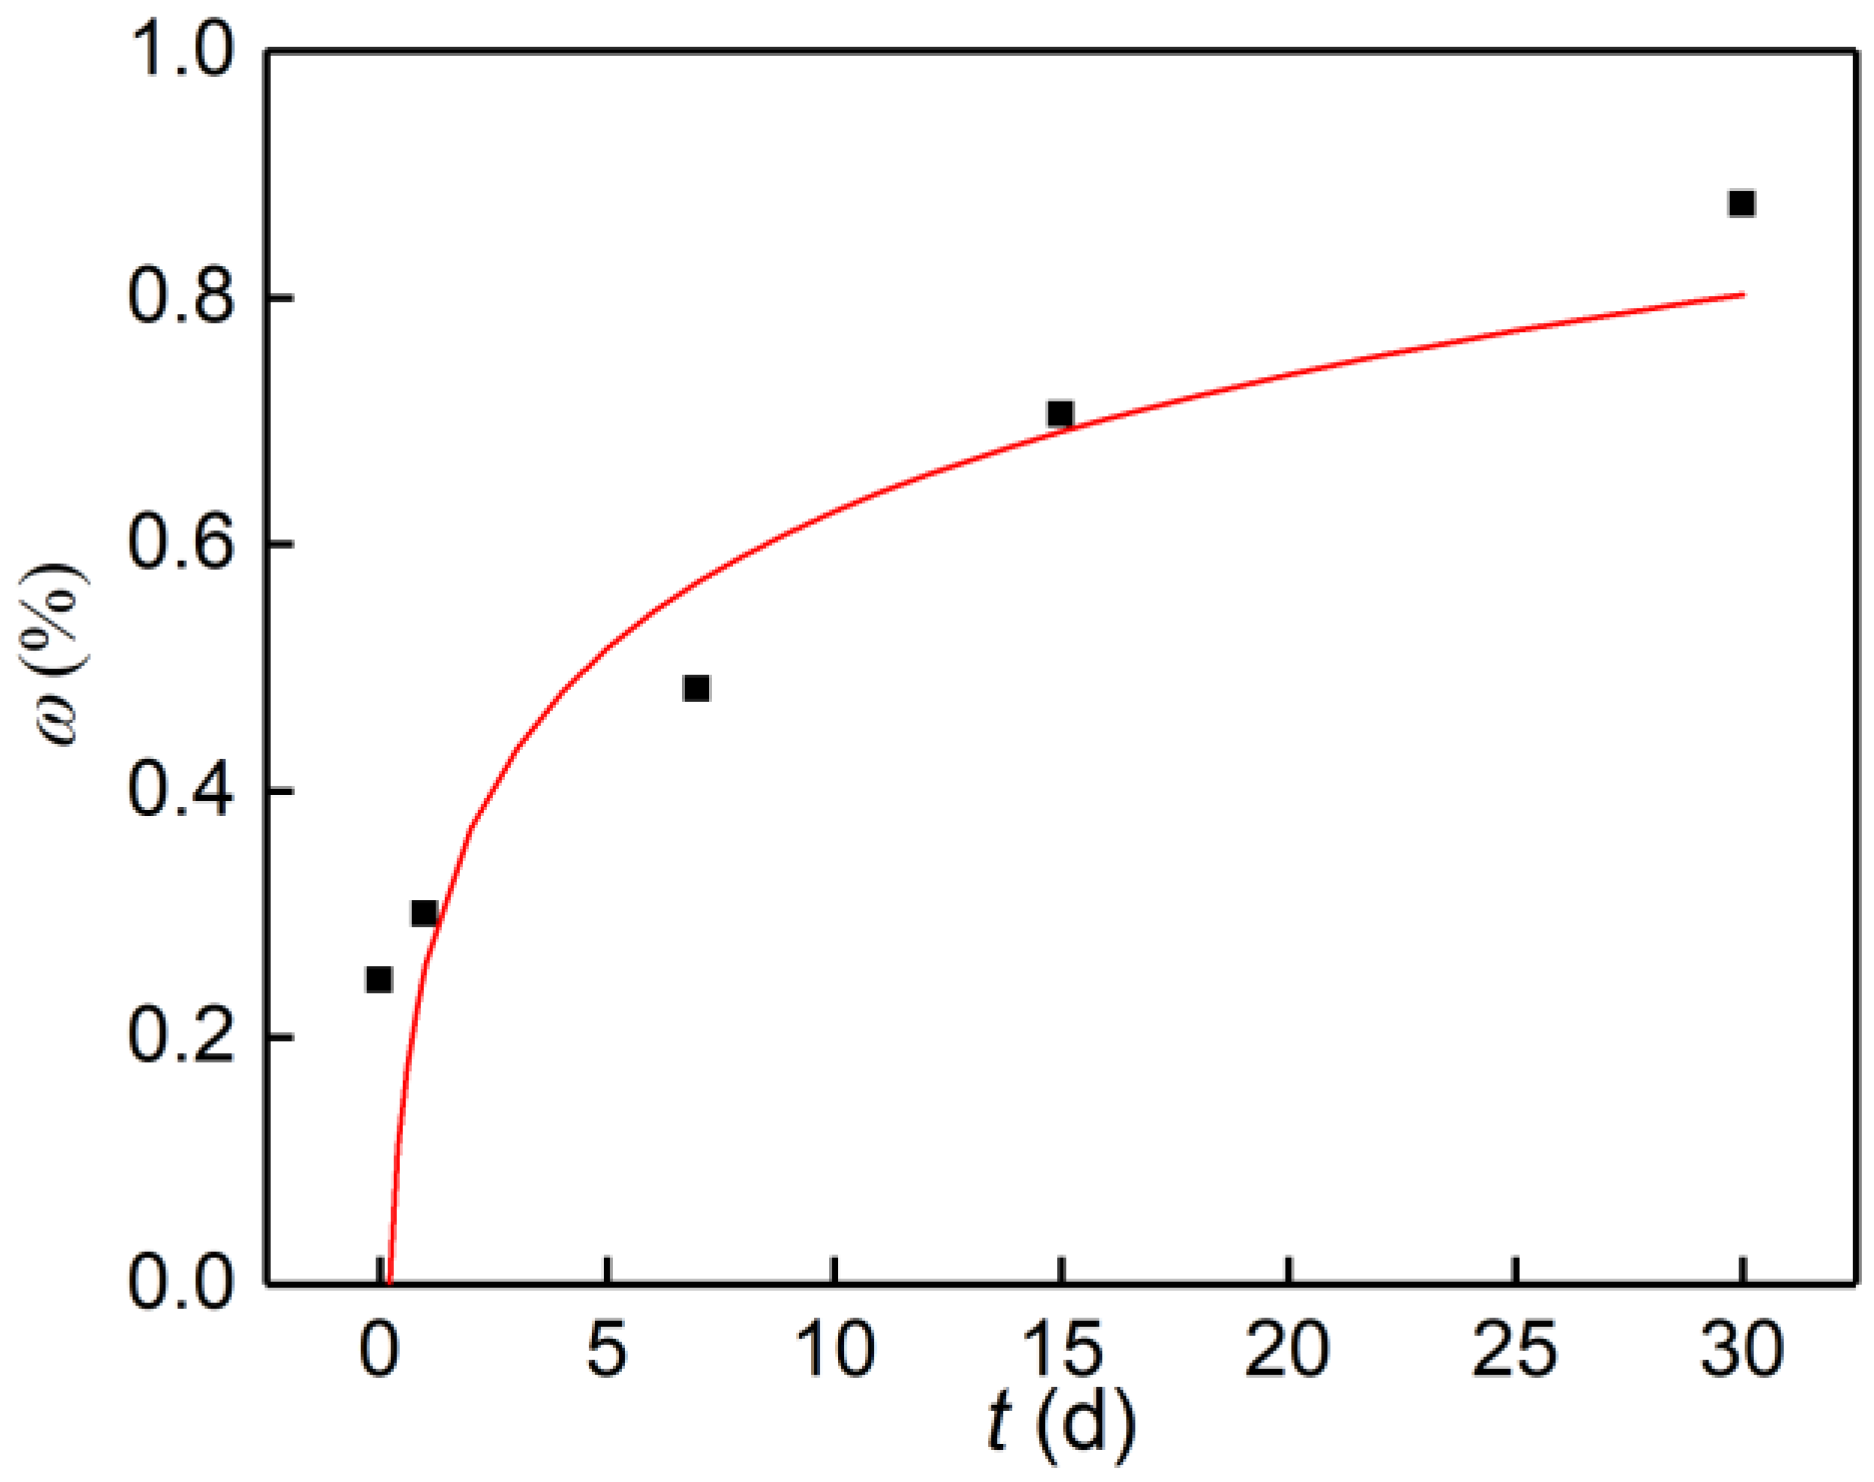
3.1. Water Content

The results are presented in Table 1, which shows that the average rock water content in a natural state, and after immersion in water for 1, 7, 15, and 30 days, was 0.2467%, 0.3001%, 0.4320%, 0.7051%, and 0.8755%, respectively. The average water content of natural gypsum increased by 0.0534% after immersion in water for 1 day, by 0.1853% after immersion for 7 days, by 0.4584% after immersion for 15 days, and by 0.6288% after immersion for 30 days.
The relationship between the water immersion time and the rock water content is presented in Figure 3, which points out that the gypsum rock was highly hydrophilic, and the rock water content grew with the increasing water immersion time. However, this rate of increase declined with the increase in water immersion time. In the initial stage of the water immersion, as the immersion time increased, the air trapped in the internal pores and cracks of the rock sample was slowly discharged and these pore spaces were occupied by water instead. Hence, the water content increased rapidly in the initial stage of the water immersion. However, in the later stage of the water immersion, the internal pores and cracks were slowly filled with water, and the capability of pores and cracks to accommodate water declined. Therefore, the growth rate of the rock water content tended to be slow due to the weakening water adsorption capacity. Following the previous study [1], the Equation (9) below has been adopted to fit the relationship between the water content and the immersion time, and the correlation coefficient is R 2 = 0.8499 .
ω t = 0.16 ln t + 0.258

3.2. Fractal Damage Analysis of Gypsum Rock after Wetting

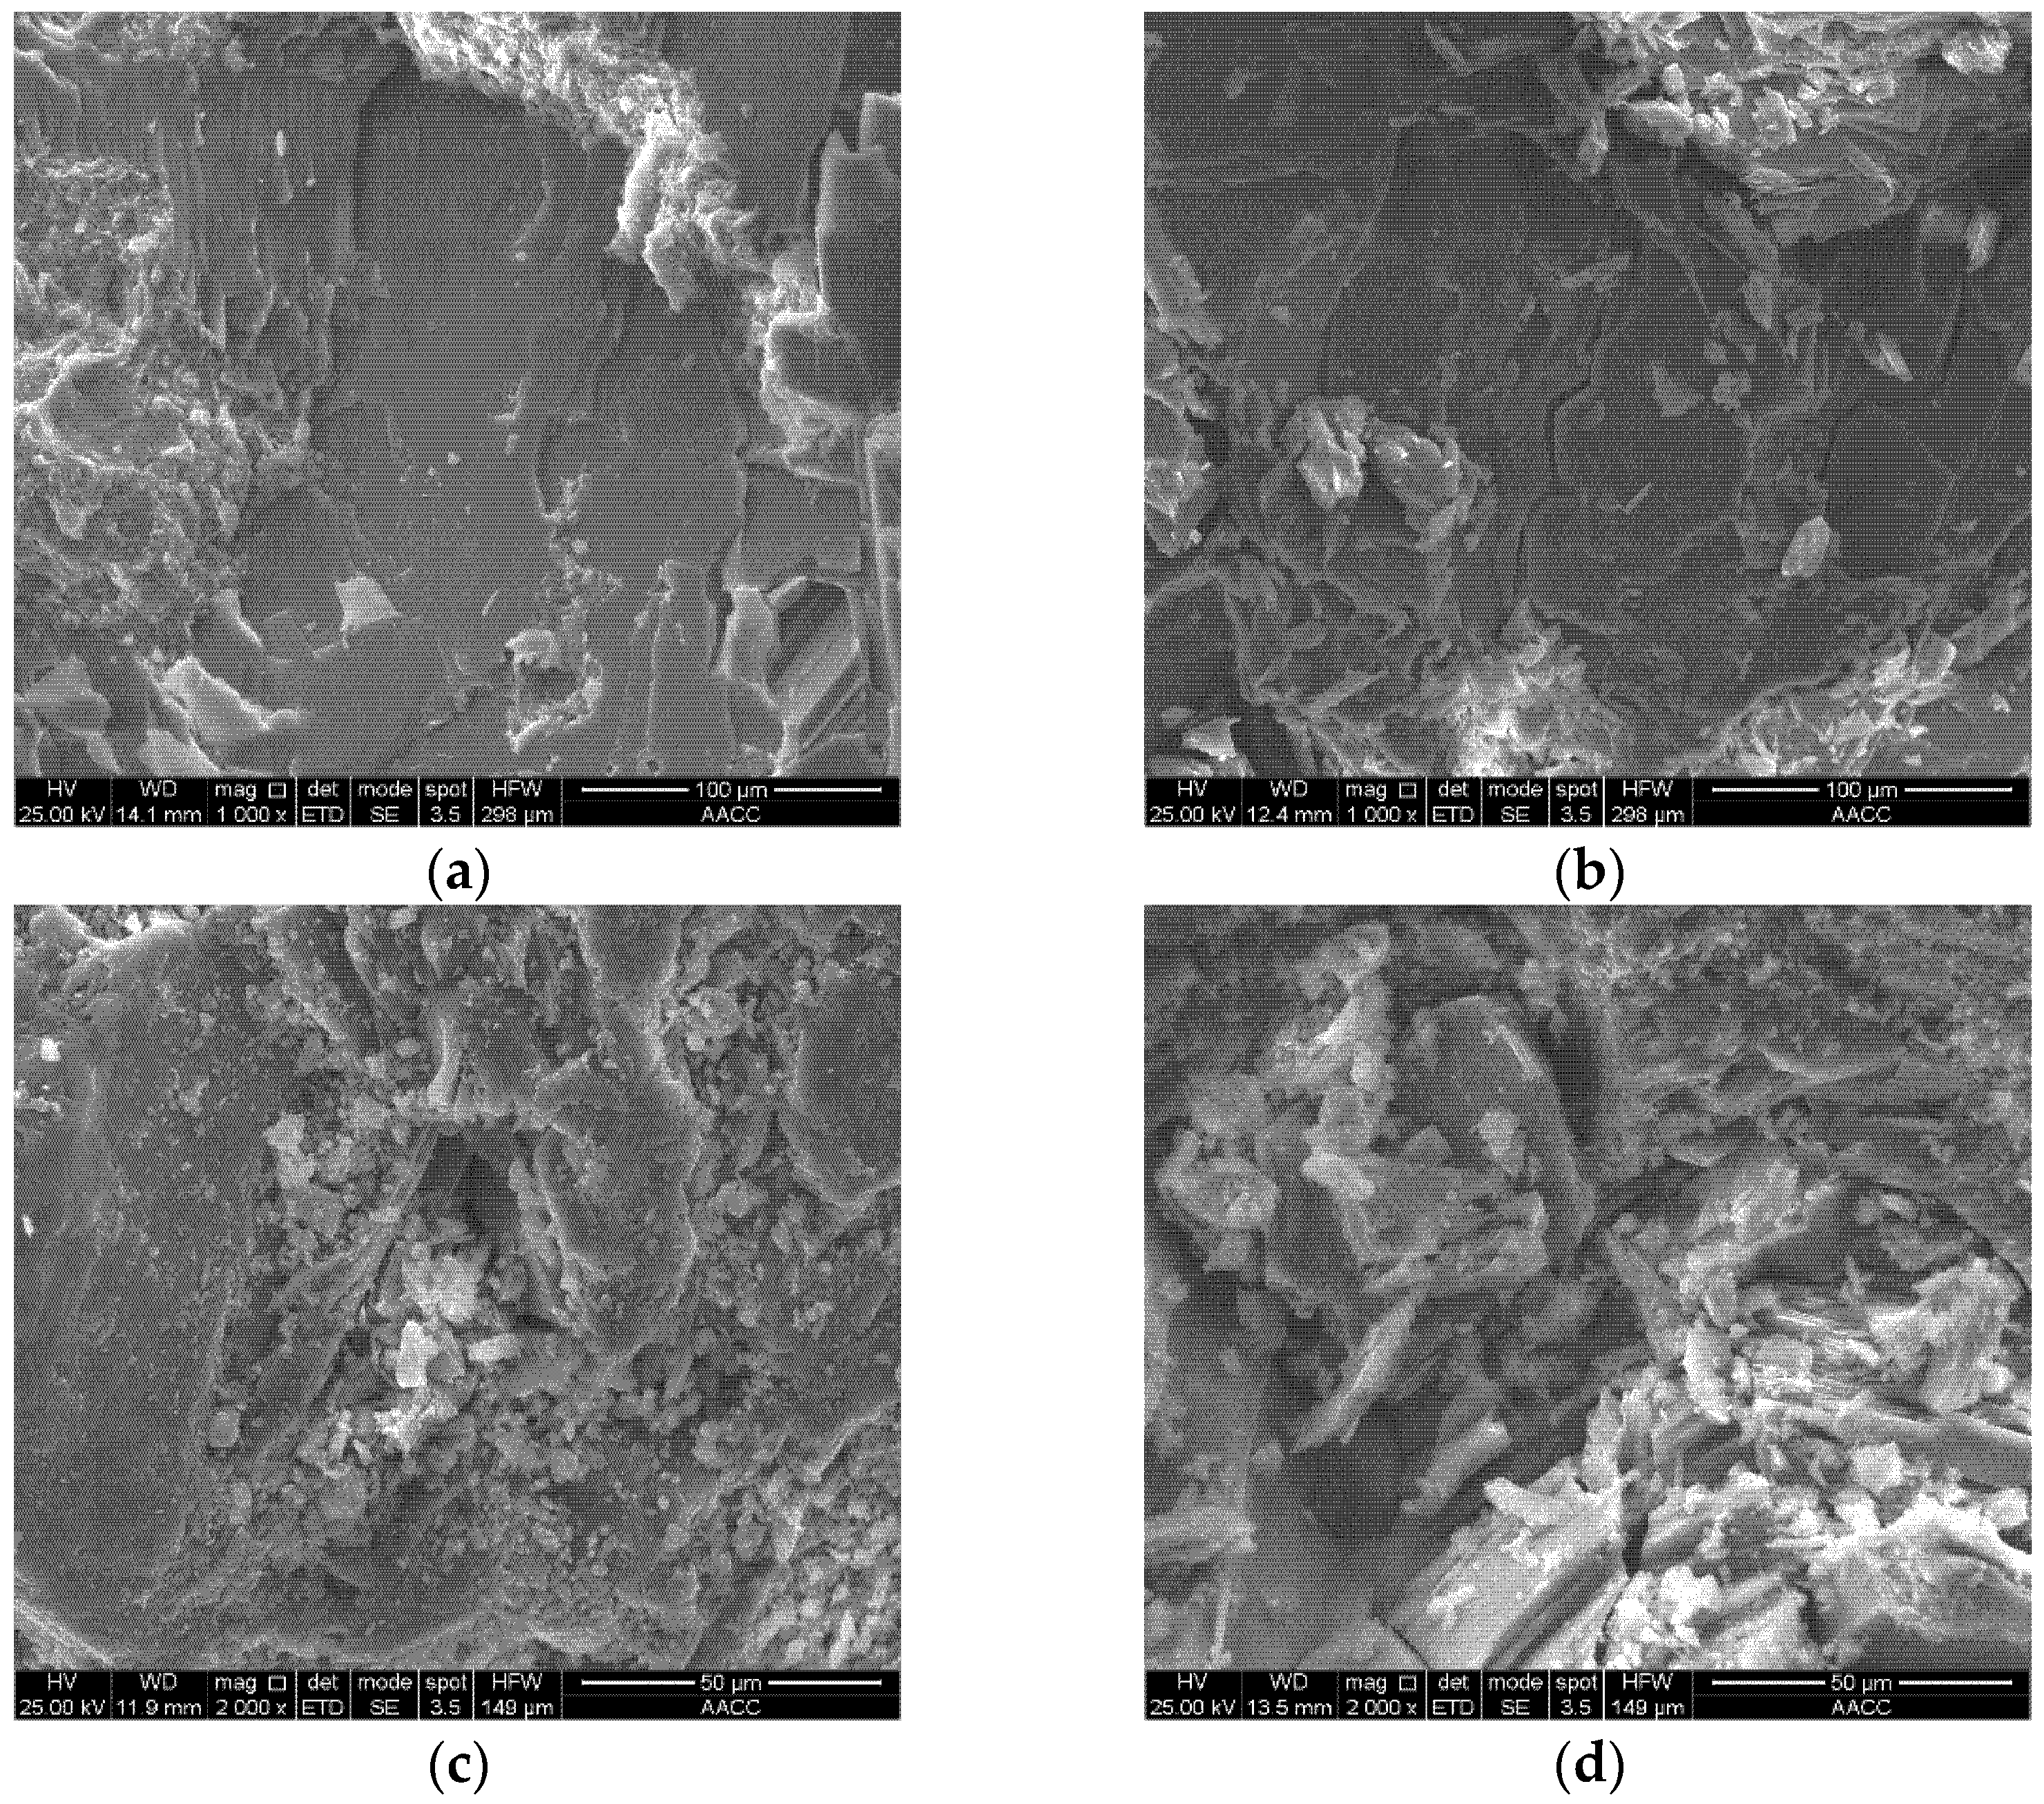
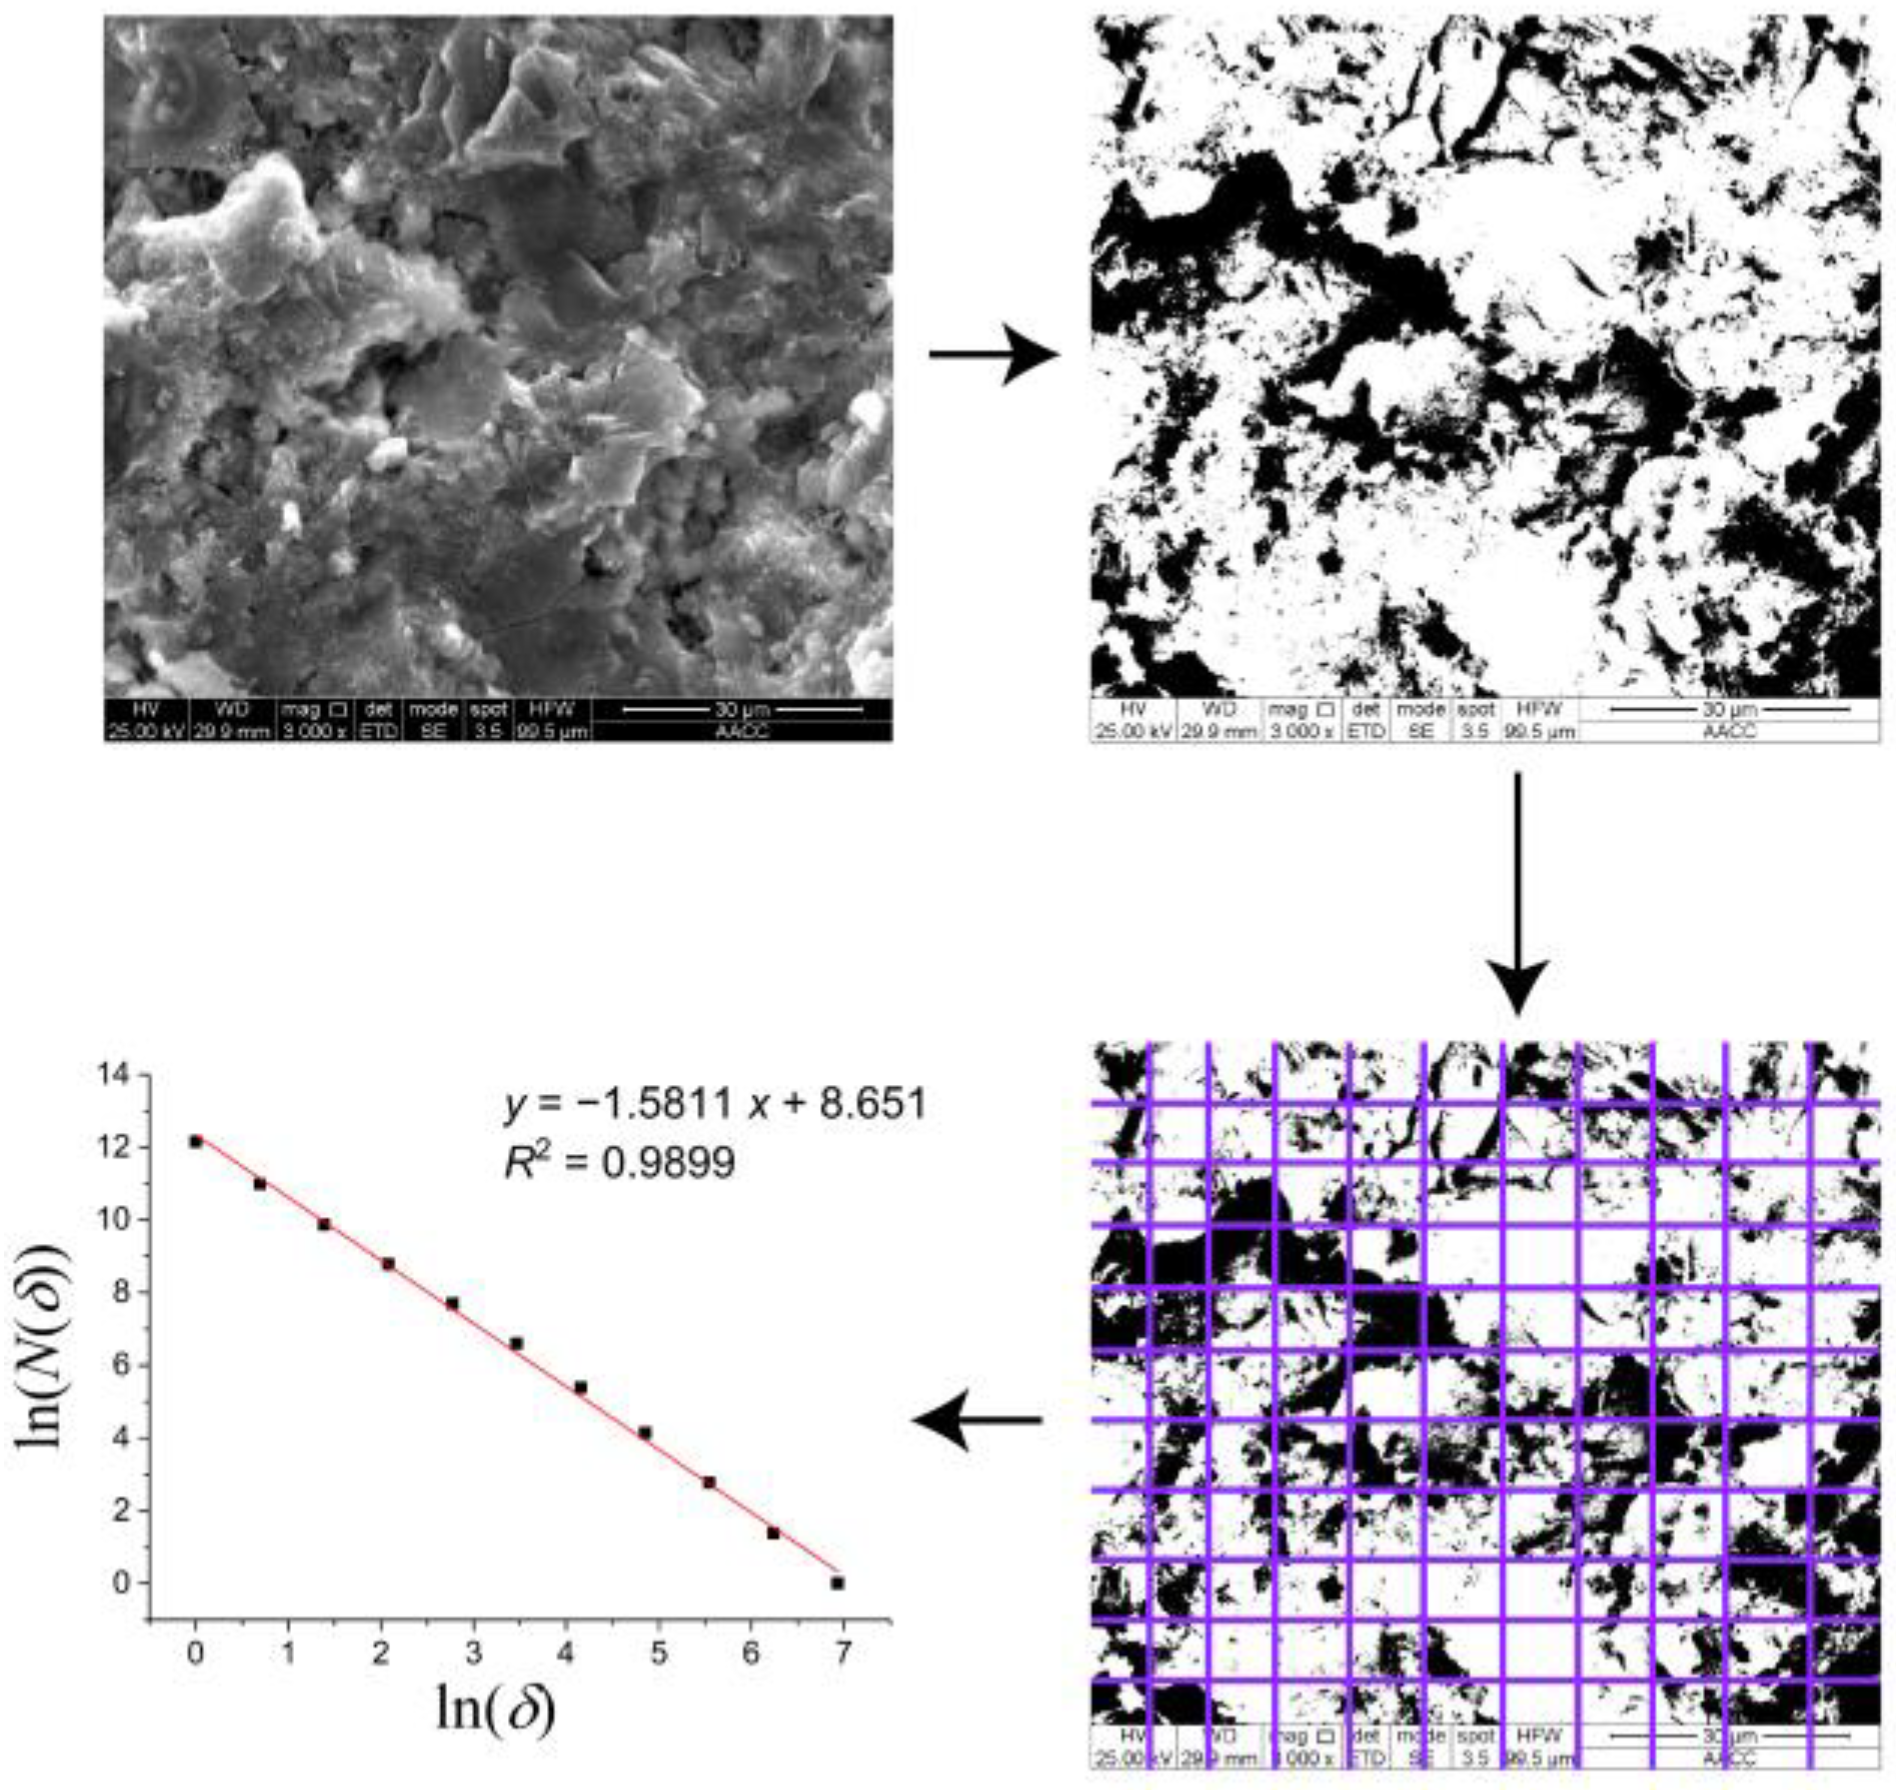
3.2.1. SEM Image Analysis

Figure 4a shows that there were few initial micropores and microcracks on the rock surface for the sample in its natural state. The structural bedding of the rock could be clearly observed, and the bedding was closely connected; therefore, maintaining a dense and hard state. The micropore structure was relatively simple as shown in Figure 4a. After immersion in water for 7 days (Figure 4b), a small number of microcracks was generated. The microscopic structure tended to be loose, coarse, and complex. After immersion in water for 15 days (Figure 4c), the microstructure changed greatly with the more obvious fracturing phenomenon. The pore structure was more complex and looser, which indicated that water had a more pronounced influence on the weakening of the gypsum rock. After 30 days of immersion in water (Figure 4d), there were many microcracks occurring and propagating in the gypsum rock. The internal structure was seriously damaged. It showed that after a long time of water immersion, water would invade the internal micropores of the gypsum rock and dissolve the soluble components in the rock materials, making the internal structure looser and more broken, resulting in a greater increase in porosity and a very complex pore structure [10]. The weakening of gypsum rock by water is not only caused by physical factors, but also by chemical reactions and other factors [10].

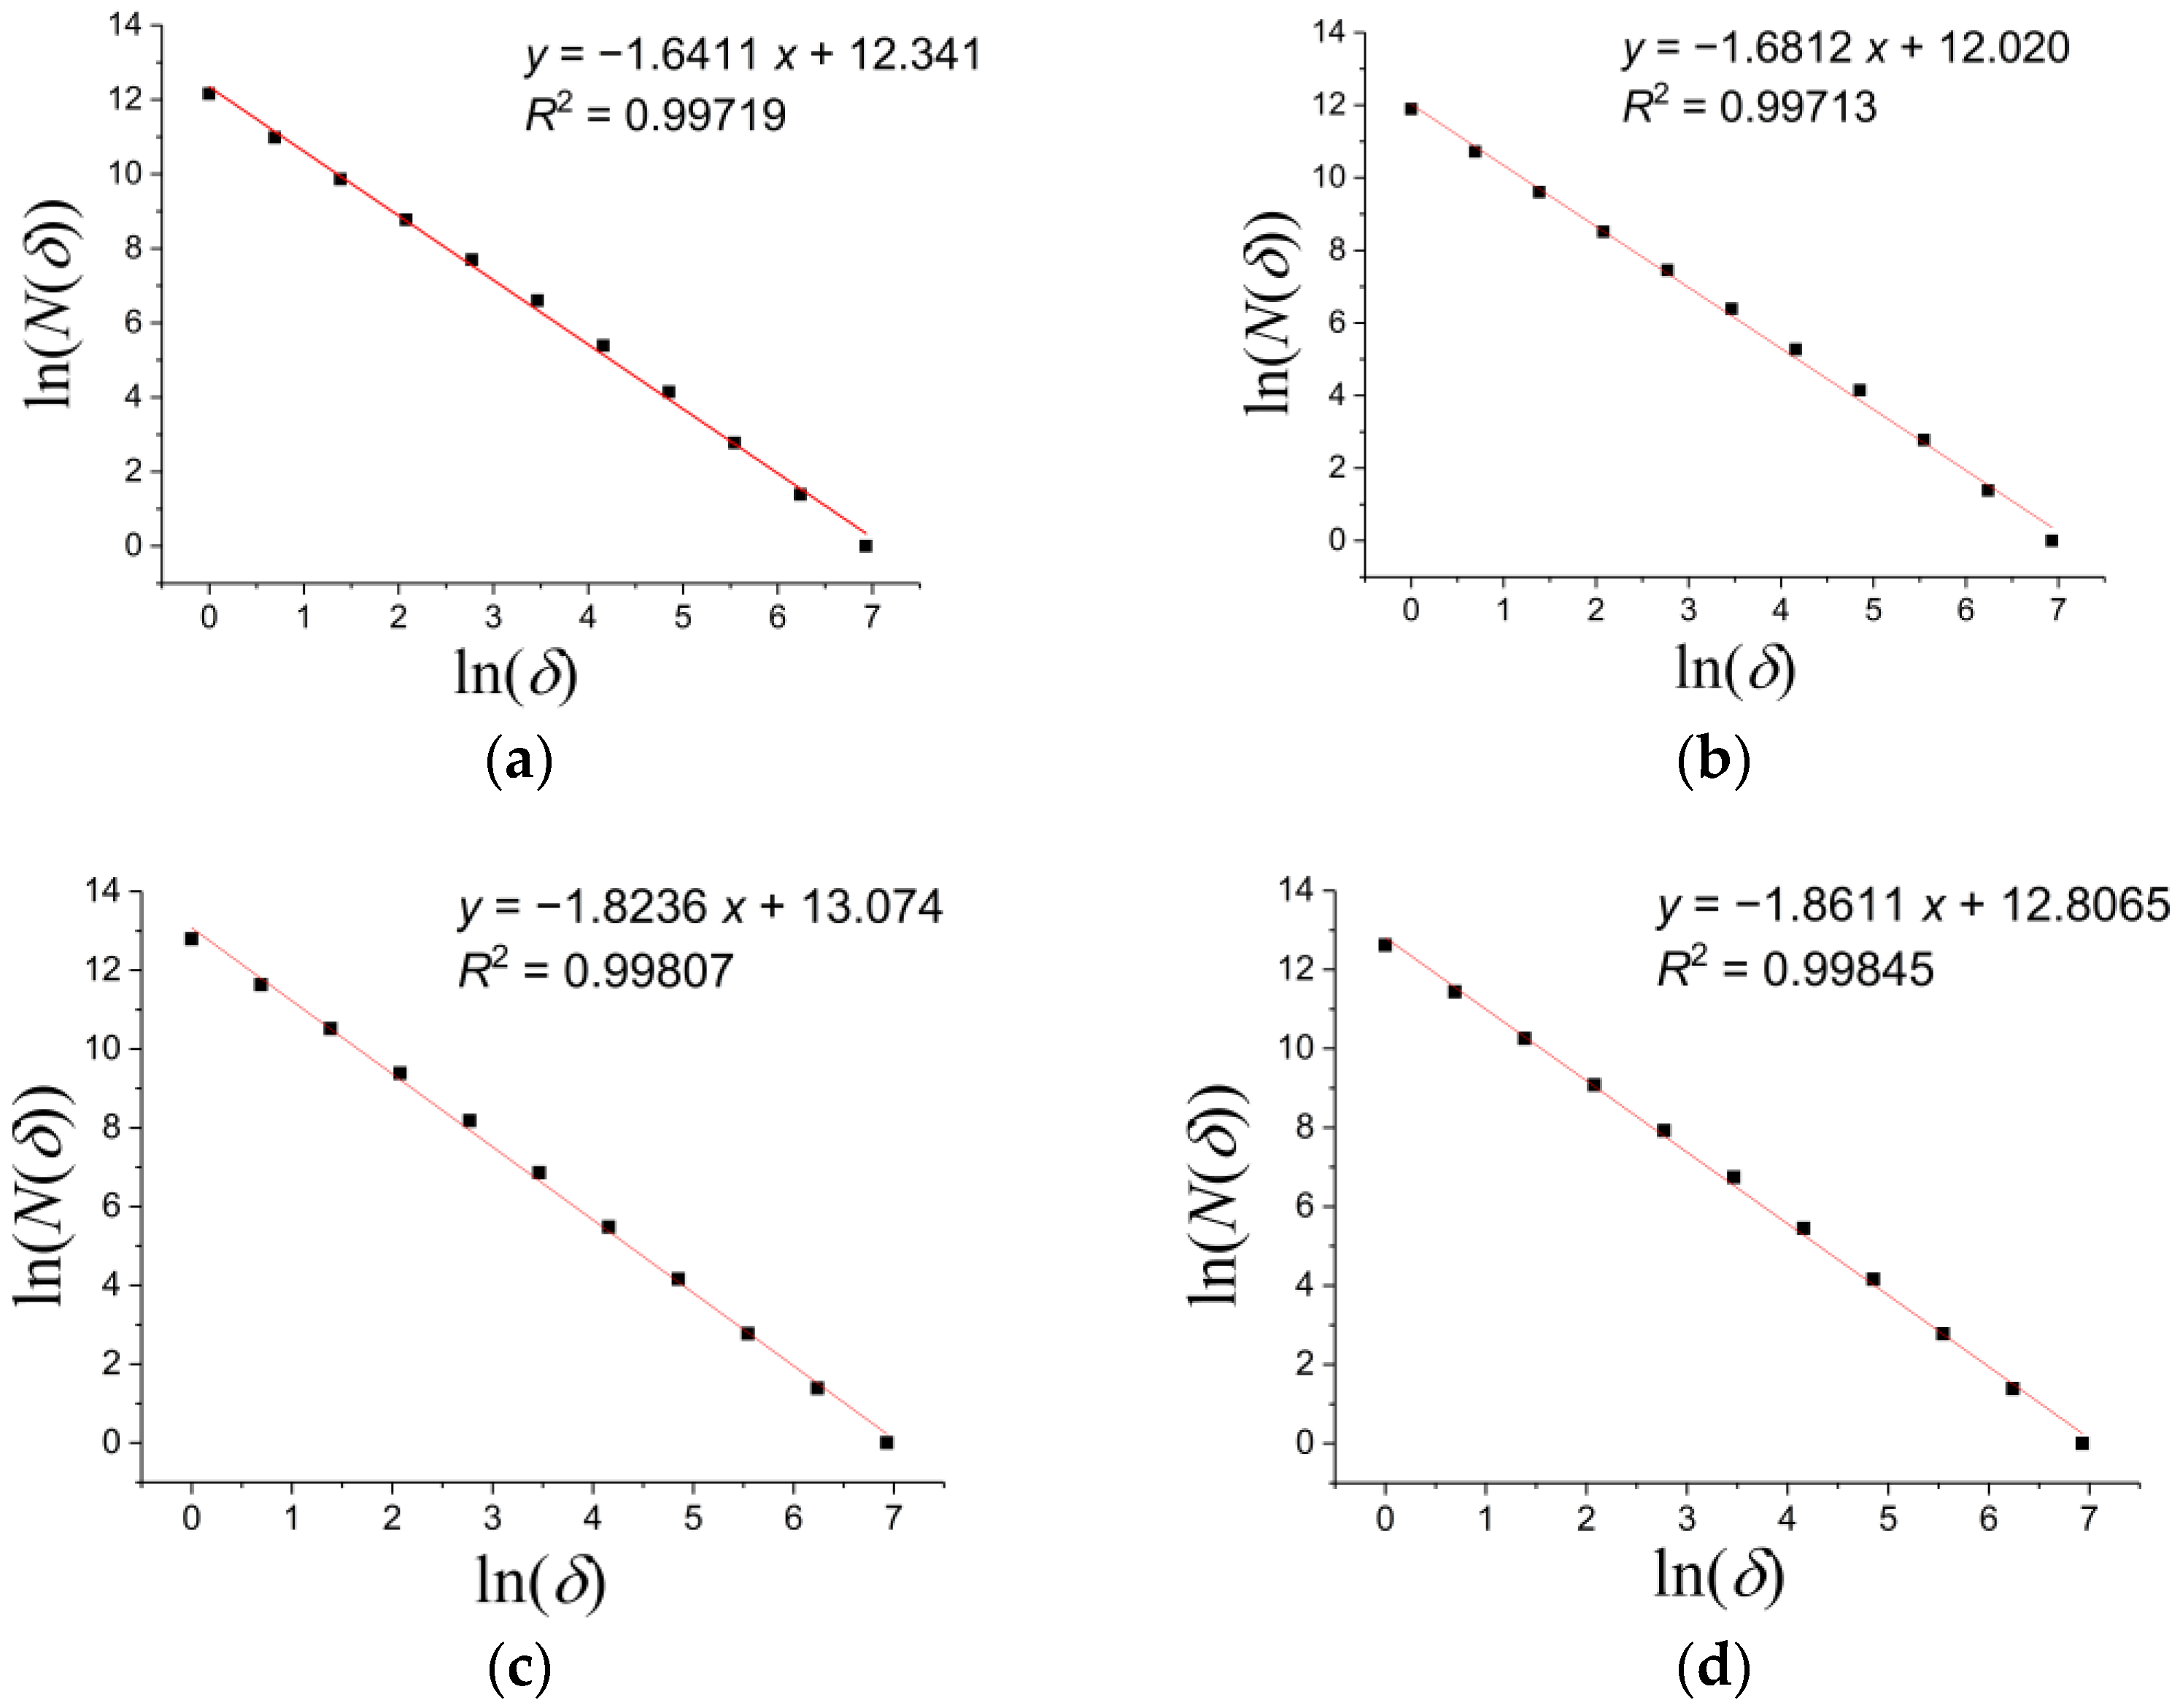
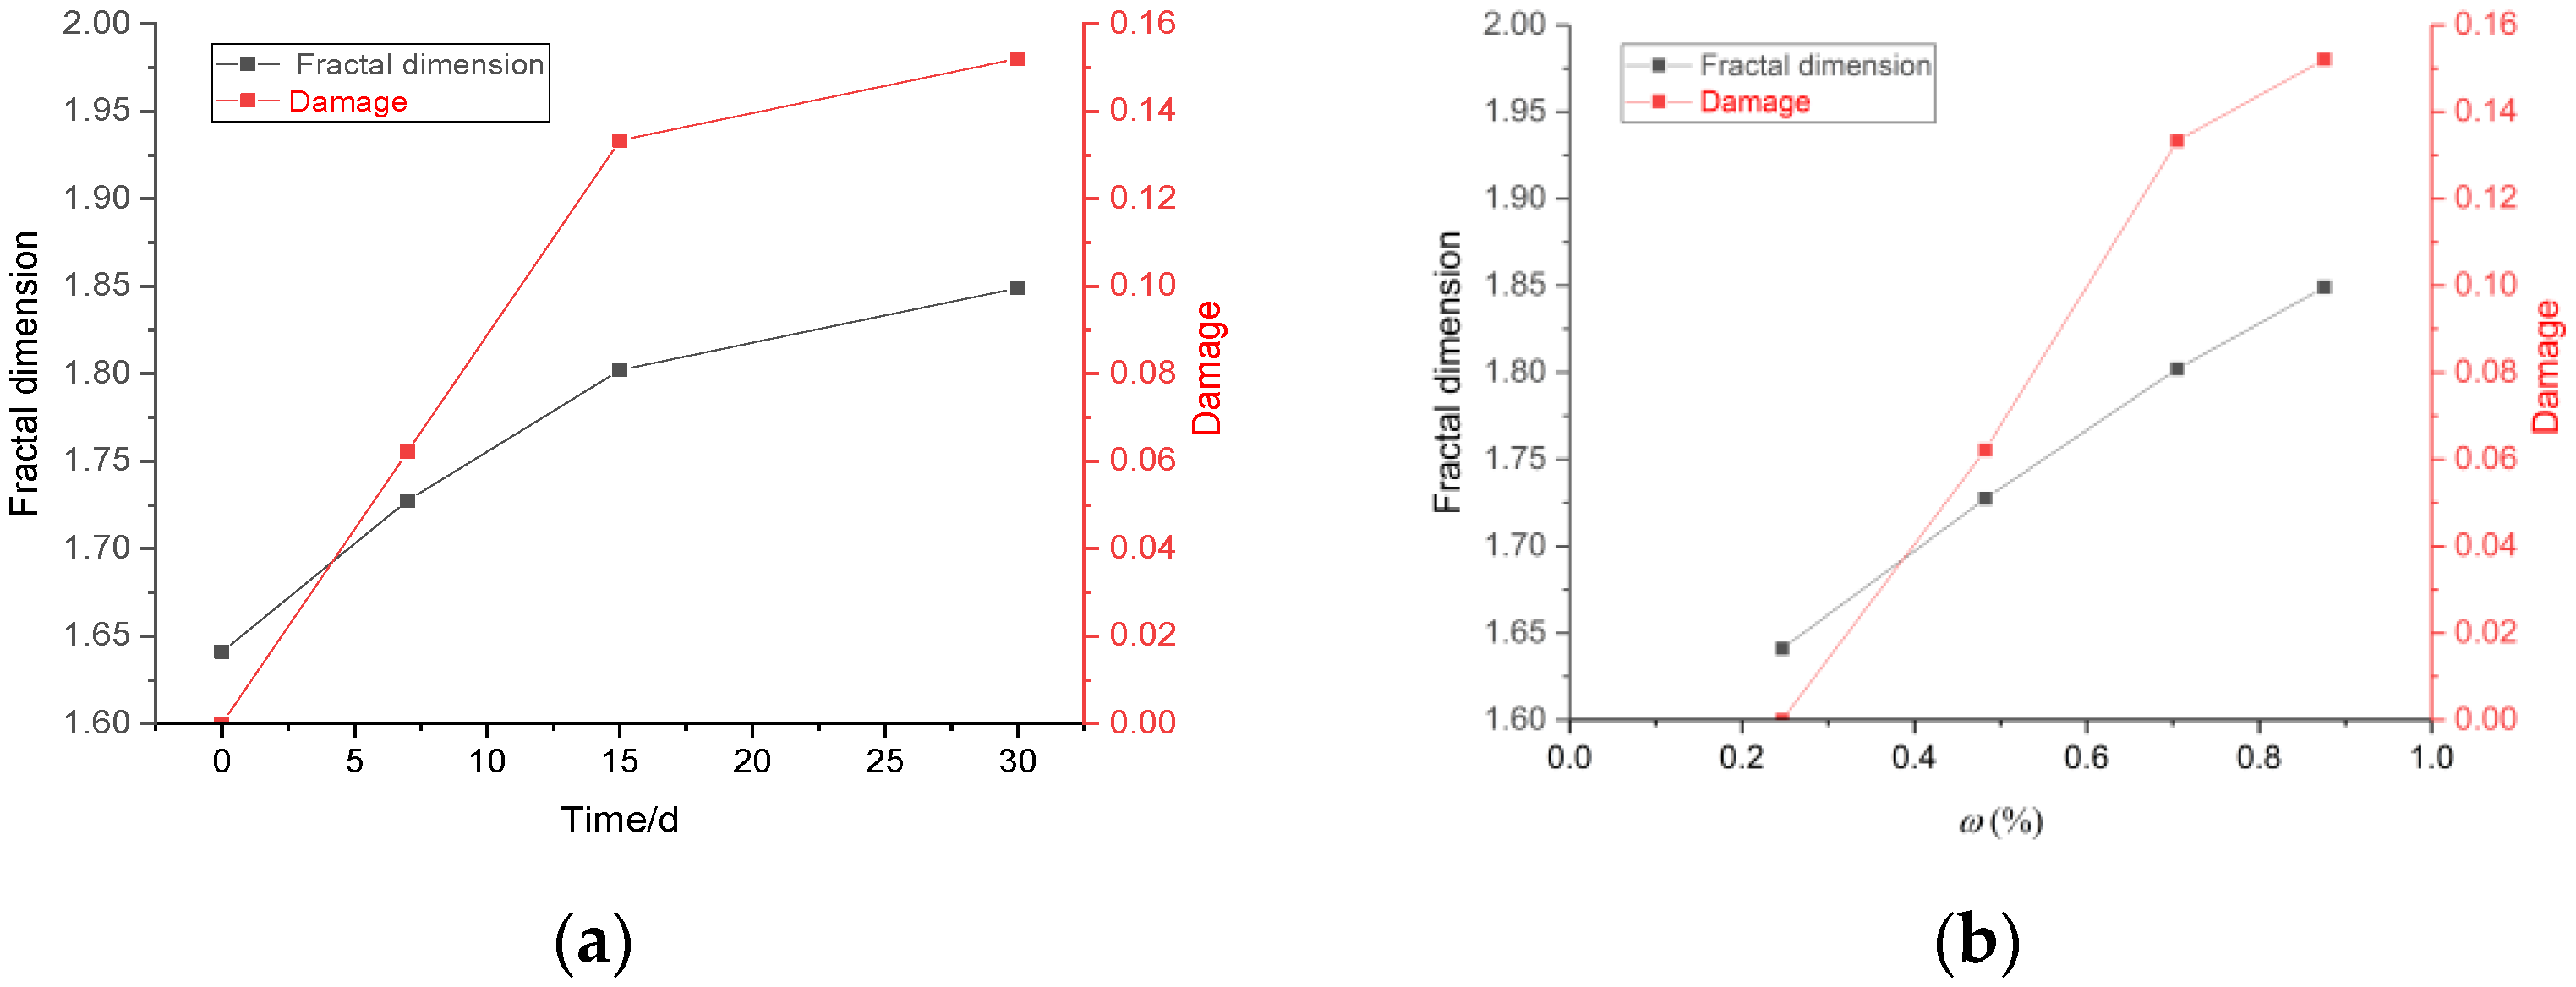
3.2.2. The Fractal Dimension and The Degree of Damage

We followed the previous work of Shi, et al. [21] to conduct the fractal analysis of the SEM images. Firstly, the SEM image of the gypsum rock was transformed into a black-and-white binary image, where the black area indicated the pores and the white area indicated the rock matrix, reflecting that there was less light from the pores compared with that of the rock matrix. The fractal dimension of the SEM image was then computed in a two-dimensional space based on the box-counting dimension method [24,25,26], as shown in Figure 5.
Figure 6 and Table 2 show that the correlation coefficients were greater than 0.99 for all cases; therefore, the calculated fractal dimensions were effective. The statistical self-similarity and the fractal characteristics of the pore structure of the gypsum rock were confirmed. According to the fractal theory, the increase in the fractal dimension indicates the increase in the degree of damage and the increase in complexity of the pore structure. According to the obtained fractal dimensions, the linear relationship between the fractal dimension and the degree of damage to the rock can be expressed as [27]:
D = f f 0 f max f 0
where D is the degree of damage, f is the fractal dimension, f 0 is the fractal dimension of gypsum rock in the natural state, and f max is the maximum fractal dimension of the research object. Note that the maximum fractal dimension of the two-dimensional plane is two.
The relationship between the fractal dimension/degree of damage and the water immersion time is displayed in Figure 7, which shows that the fractal dimension and the degree of damage to gypsum rock increases with the increase in soak time. The fractal dimension and the degree of damage increased rapidly in the first 15 days of water immersion and increased slowly in the latter 15 days of water immersion, indicating that the gypsum hydration reaction, the water absorption, and the dissolution of the gypsum were quick in the early stage of the water immersion. After immersion for 15 days, the rate of these physical and chemical actions became slower.

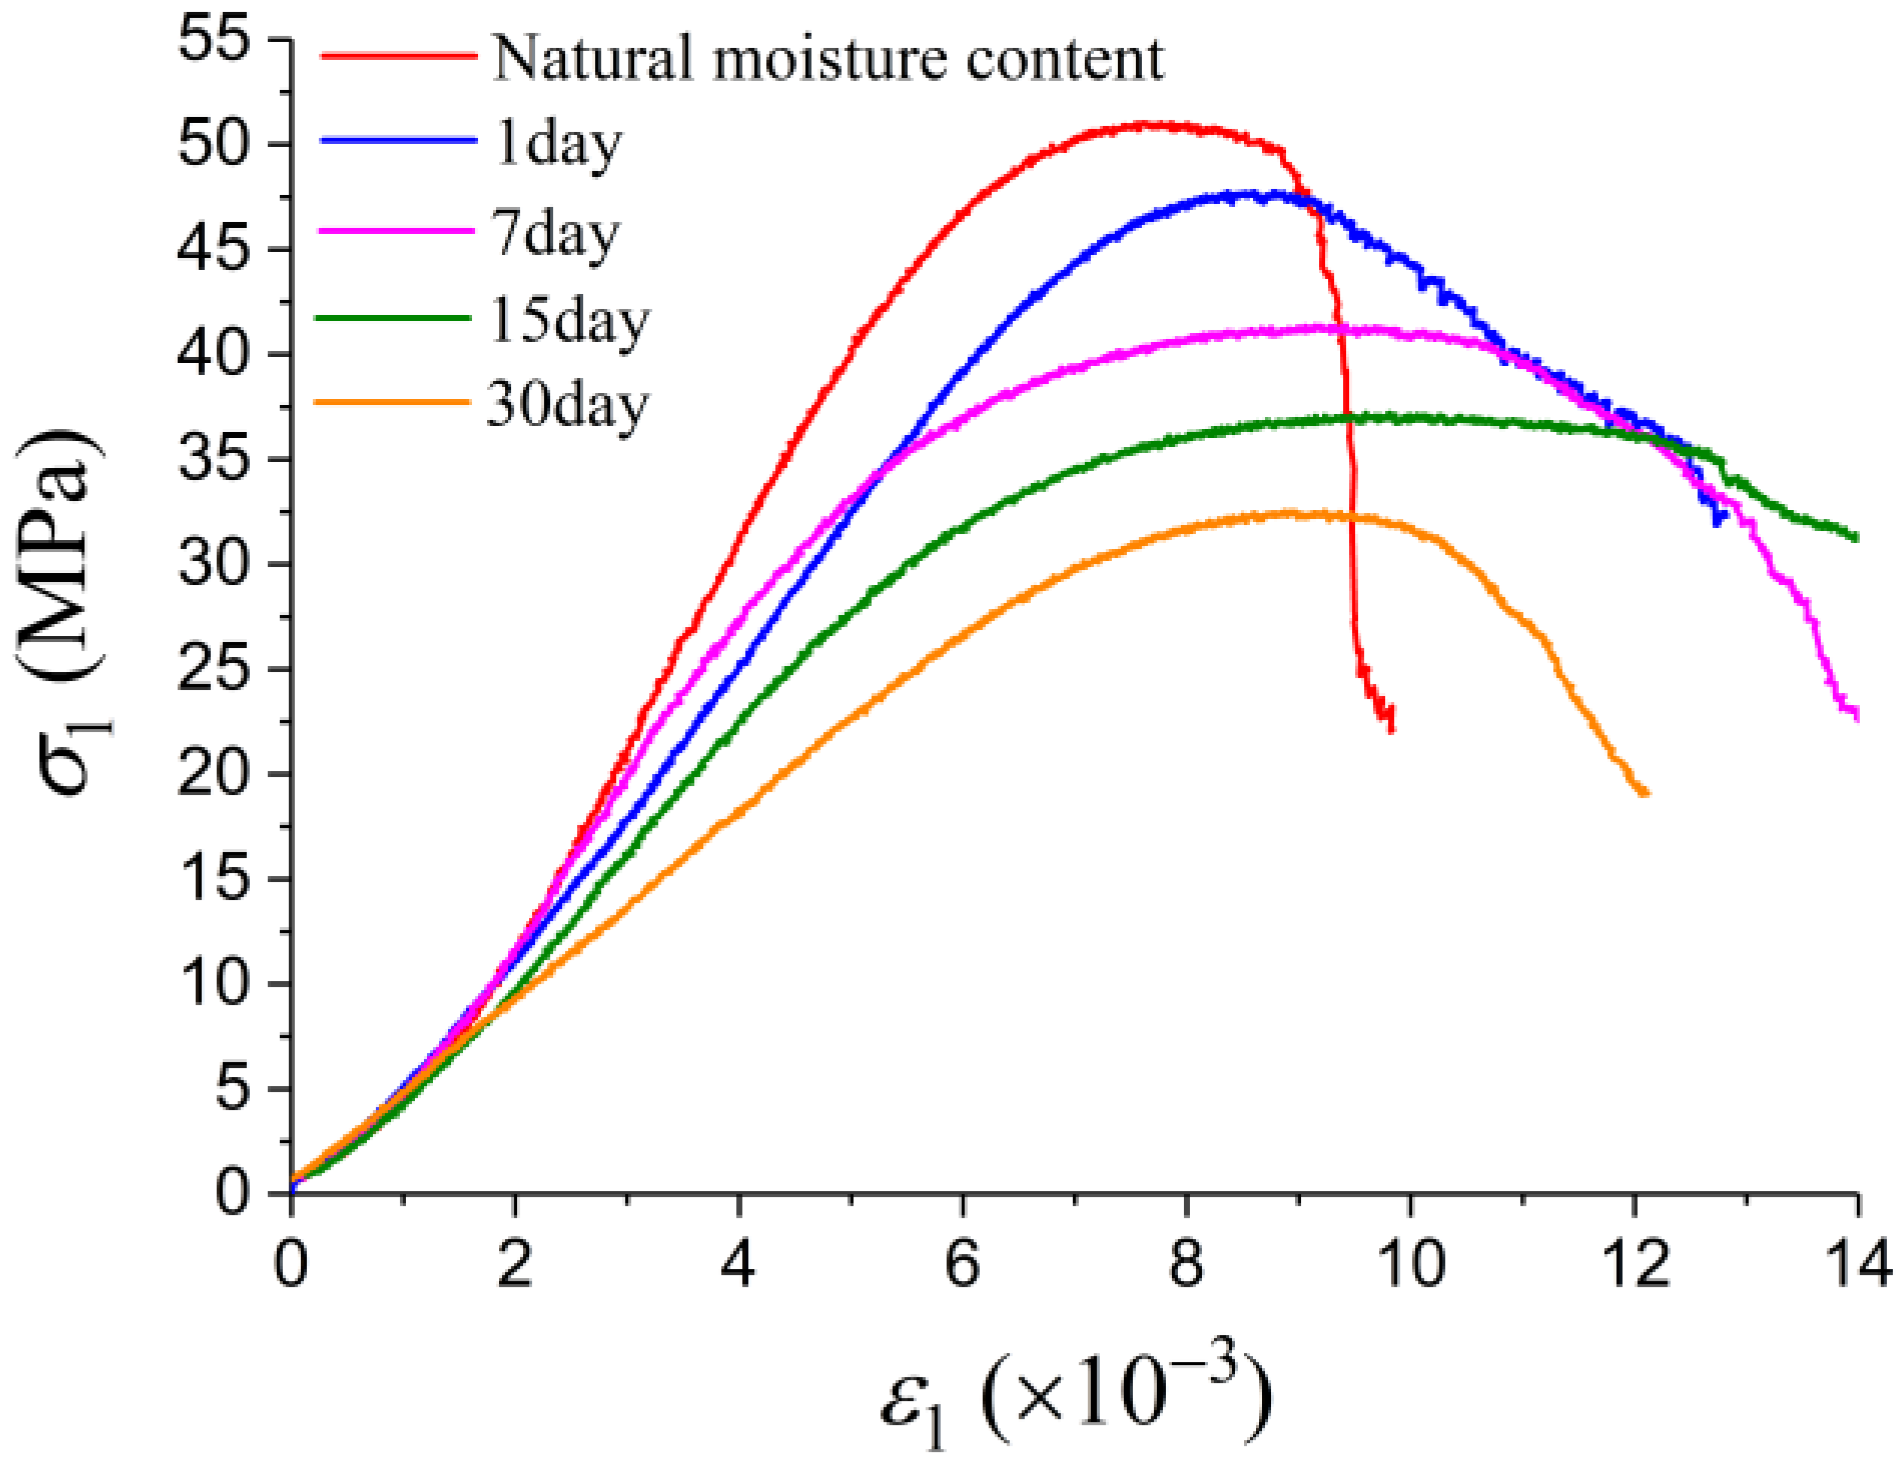
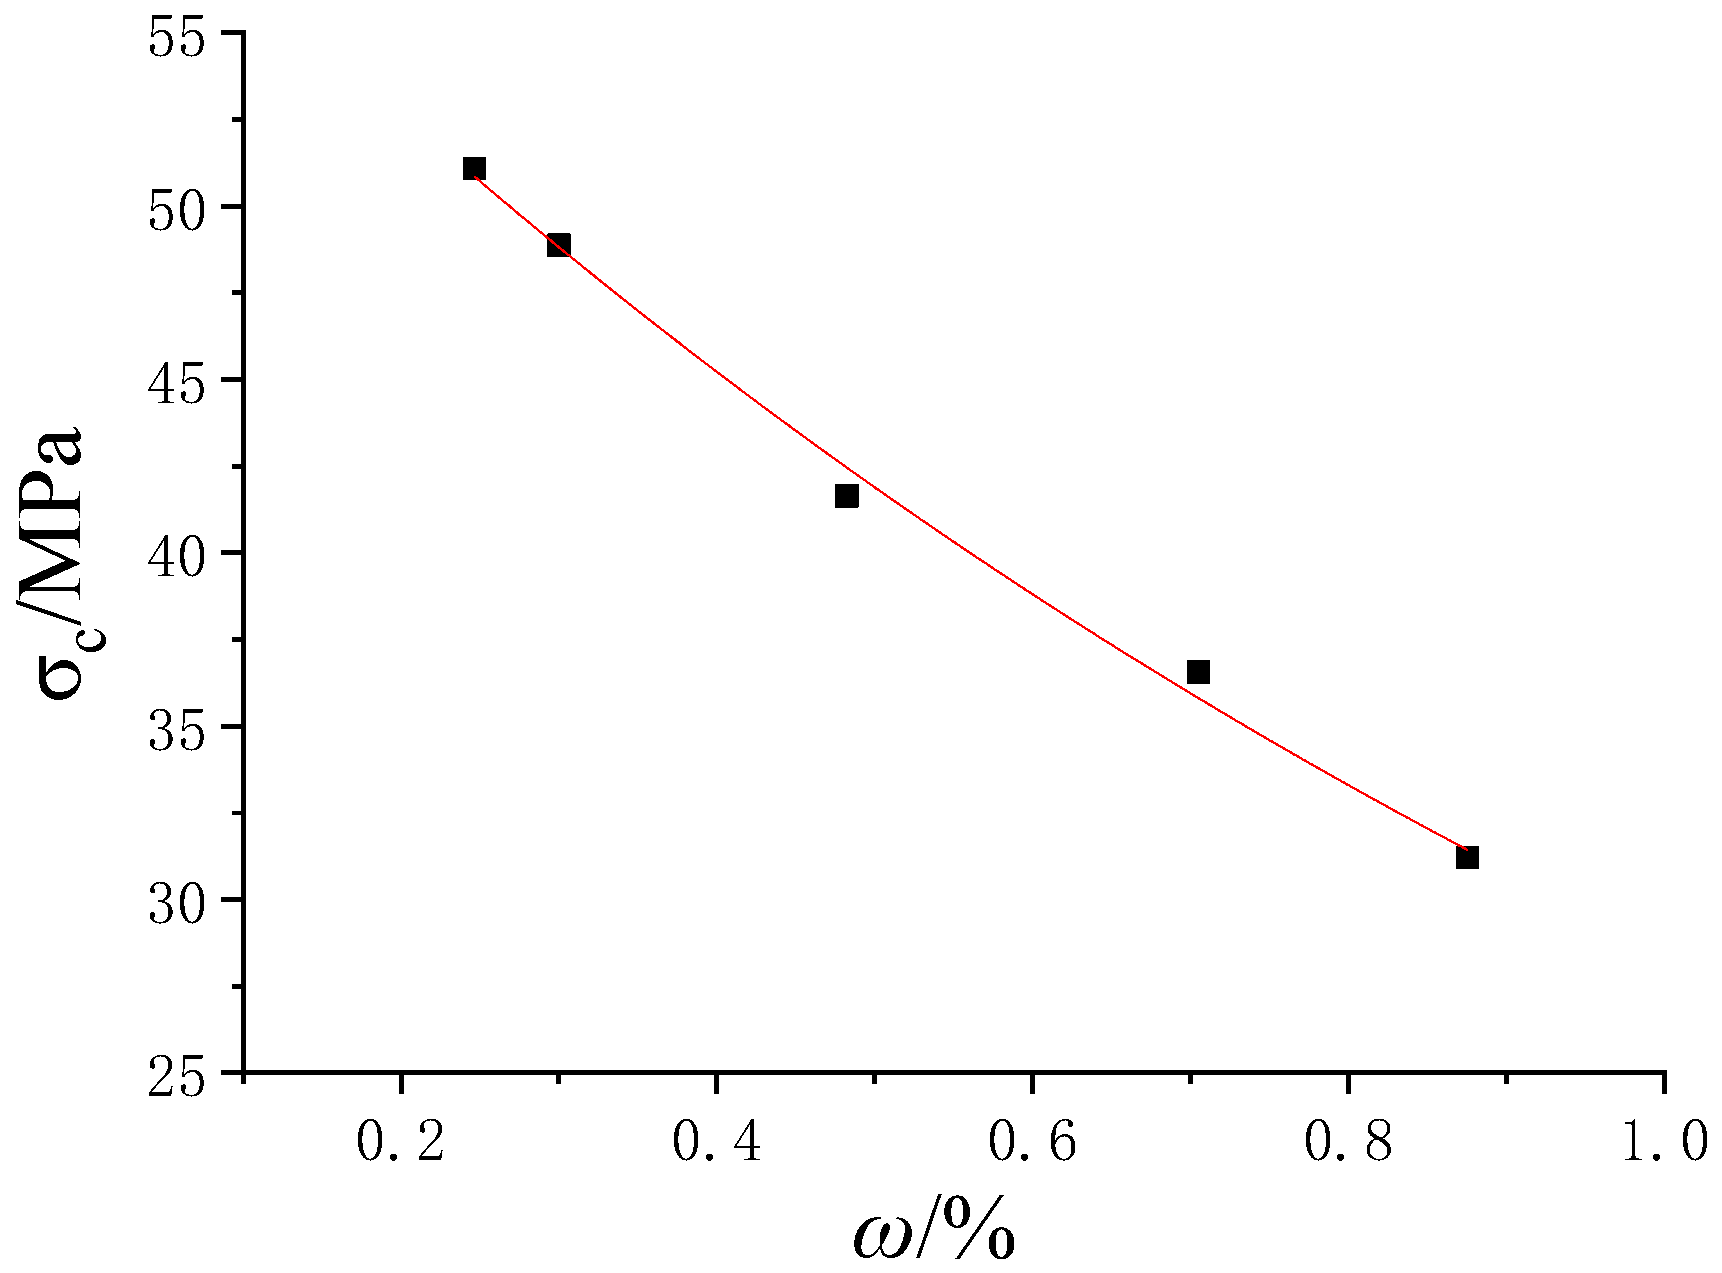
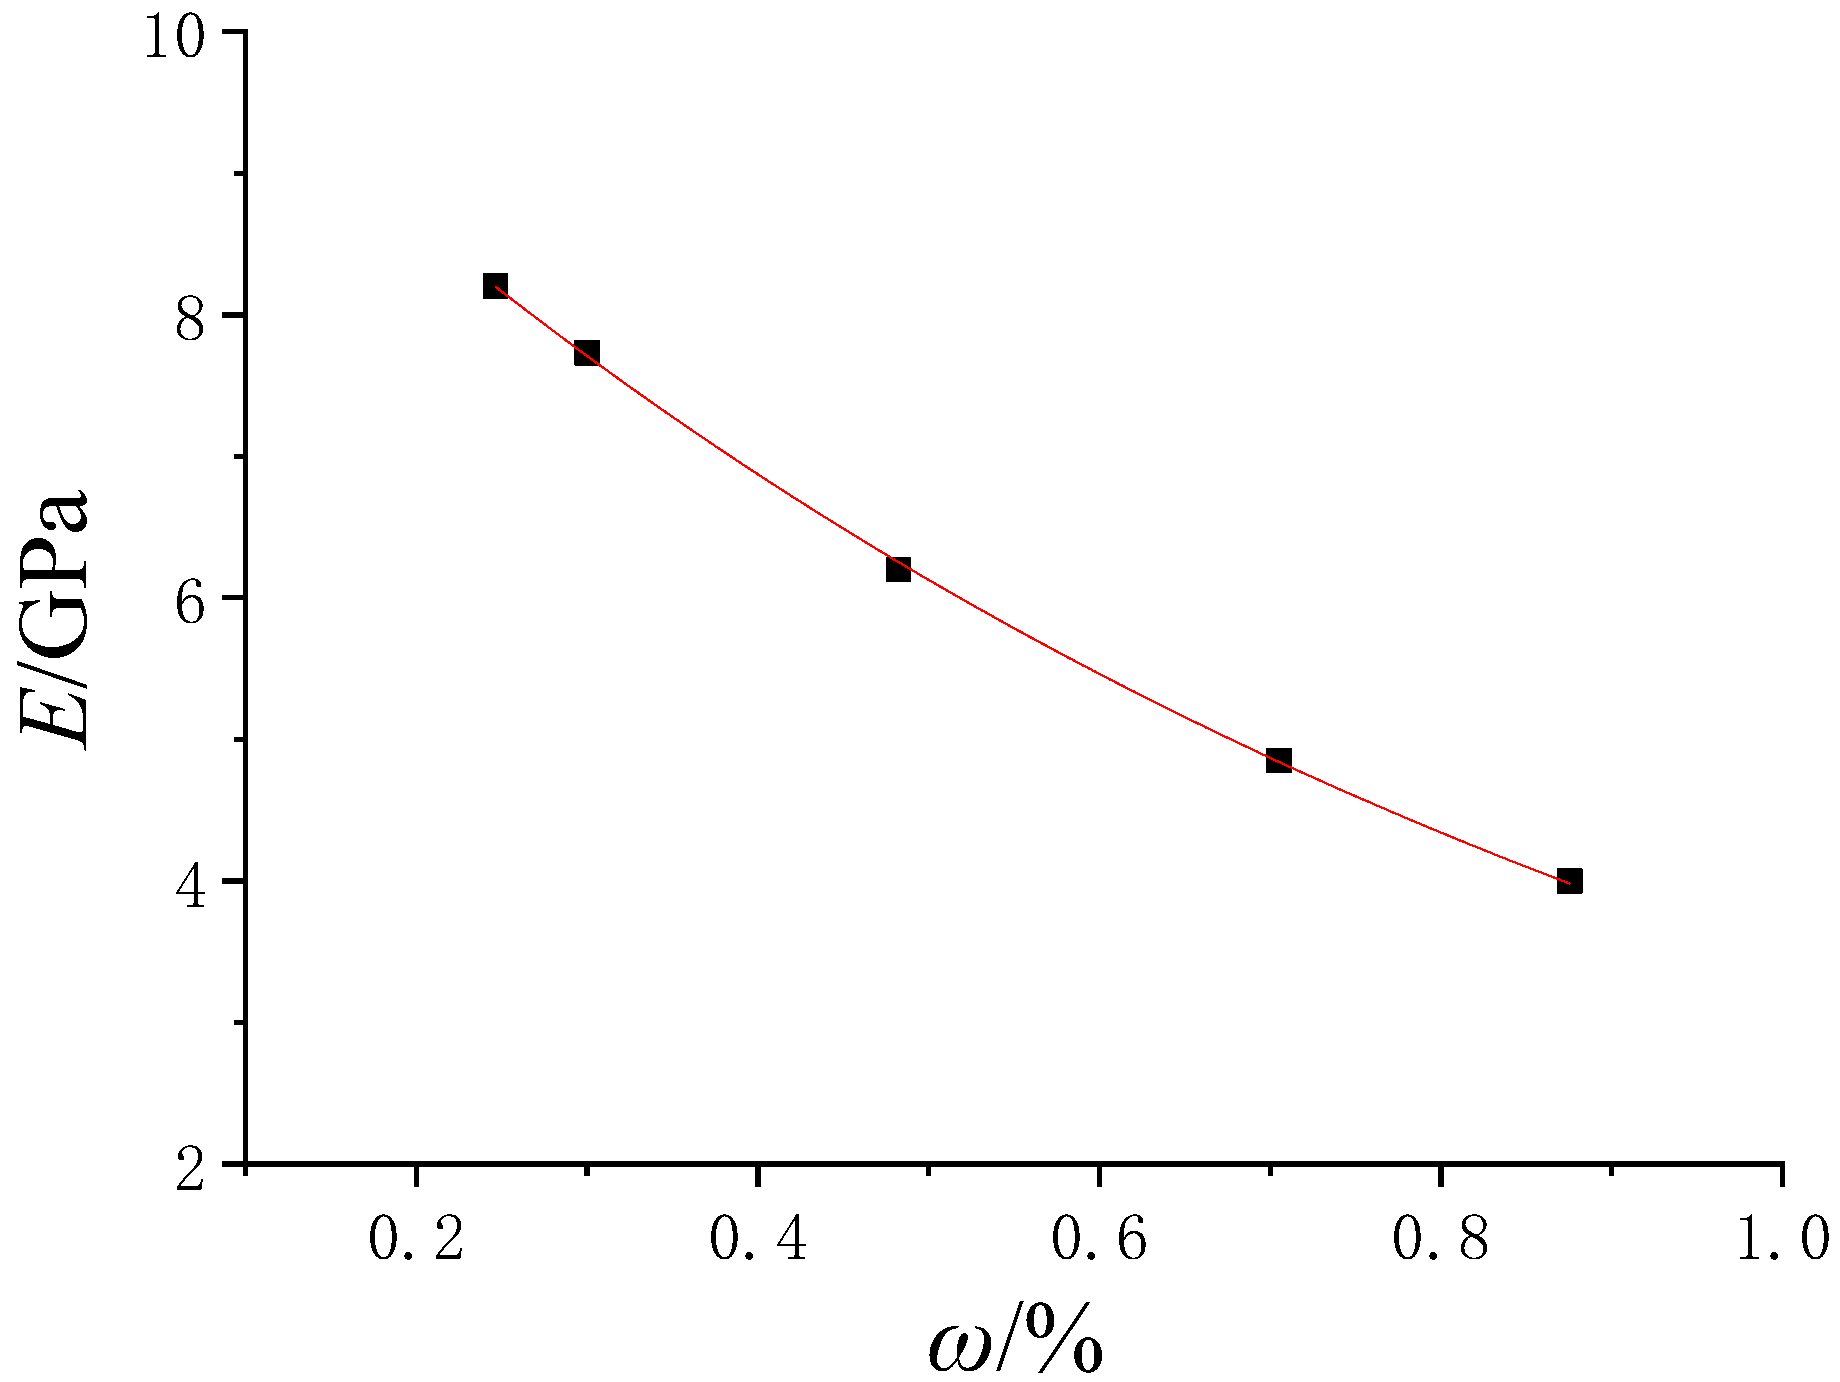
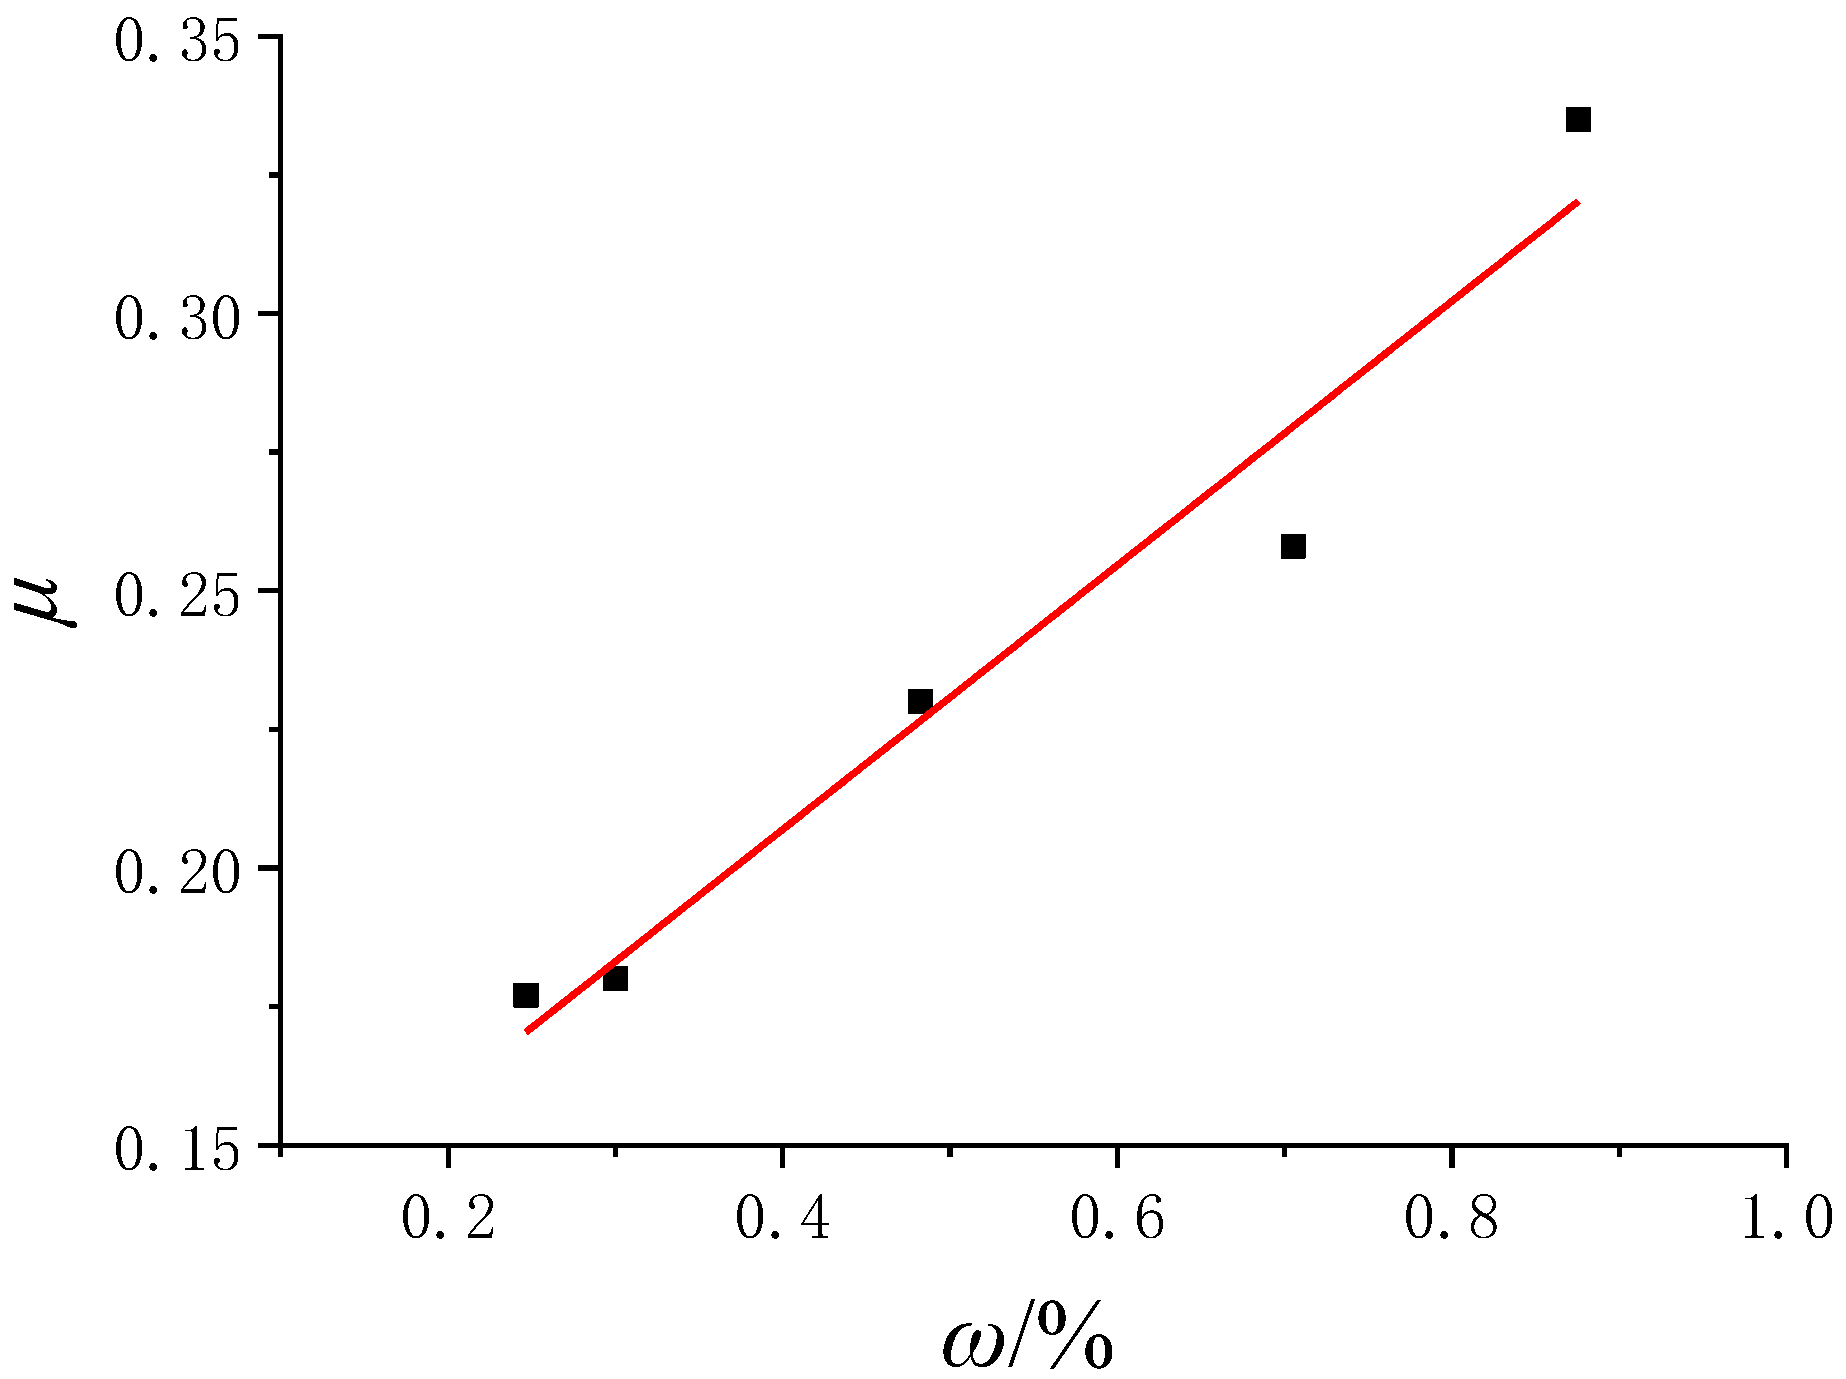
3.3. The Analysis of Strength and Deformability

The mechanical parameters of the gypsum rock obtained from the triaxial compression test are presented in Table 3 and the stress-strain curves are displayed in Figure 8.
The relationship between the triaxial compressive strength and the water content of gypsum rock is shown in Figure 9, which indicates that the triaxial compressive strength of the gypsum rock declined with the increase in soaking time. After soaking in water for 30 days, the average compressive strength decreased significantly from 51.08 MPa to 31.21 MPa. After immersion in water for 1 day, the triaxial compressive strength of the gypsum rock was 48.87 MPa, this being 4.33% lower than that in the natural state. After immersion in water for 7 days, the triaxial compressive strength of the gypsum rock was 41.64 MPa, this being 18.48% lower than that in the natural state. After immersion in water for 15 days, the triaxial compressive strength of the gypsum rock was 36.56 MPa, this being 28.43% lower than that in the natural state. After immersion in water for 30 days, the triaxial compressive strength of the gypsum rock was 31.21 MPa, this being 38.90% lower than that in the natural state. In the initial stage of the water immersion, the compressive strength decreased considerably, and in the later stage, the declining trend gradually slowed down. This shows that the weakening effect of the water on the mechanical properties of the gypsum rock was very significant, especially in the initial stage of the water immersion. The relationship between the triaxial compressive strength of the gypsum rock and the immersion time was approximately exponential. The fitting Equation is displayed in Equation (11), and the correlation coefficient is R 2 = 0.99935 .
σ c = 61.41 e 0.765 ω
The relationship between the elastic modulus and the water content is displayed in Figure 10, which points out that the average elastic modulus of the rock declined with the increasing immersion time. After immersion in water for 1 day, the elastic modulus with the rock water content of 0.2467% was 7.73 GPa, which was 5.73% lower than that in the natural state. After immersion in water for 7 days, the elastic modulus with the rock water content of 0.3001% was 6.20 GPa, which was 12.20% lower than that in the natural state. After immersion in water for 15 days, the elastic modulus with the rock water content of 0.4824% was 4.85 GPa, which was 40.85% lower than that in the natural state. After immersion in water for 30 days, the elastic modulus with the rock water content of 0.8755% was 4.00 GPa, which was 51.22% lower than that in the natural state. In the initial stage of the water immersion, the elastic modulus of the gypsum rock declined significantly, but gradually slowed down in the later stage. The results showed that the weakening effect of water on the deformation property of gypsum rock is very significant, especially in the initial stage of water immersion. It was found that the relationship between the elastic modulus and the water immersion time was approximately exponential. The Equation (12) below has been adopted to fit the data and the correlation coefficient is R 2 = 0.99972 .
E ω = 10.88 e 1.1484 ω
The relationship between Poisson’s ratio and the water content is displayed in Figure 11, which shows that the Poisson’s ratio of the rock increased with the increase in immersion time, showing a linear growth relationship. The growth rate was low in the early stage and high in the late stage. The fitting equation is shown in Equation (13) and the correlation coefficient is R 2 = 0.94088 .
μ ω = 0.2383 ω + 0.11163

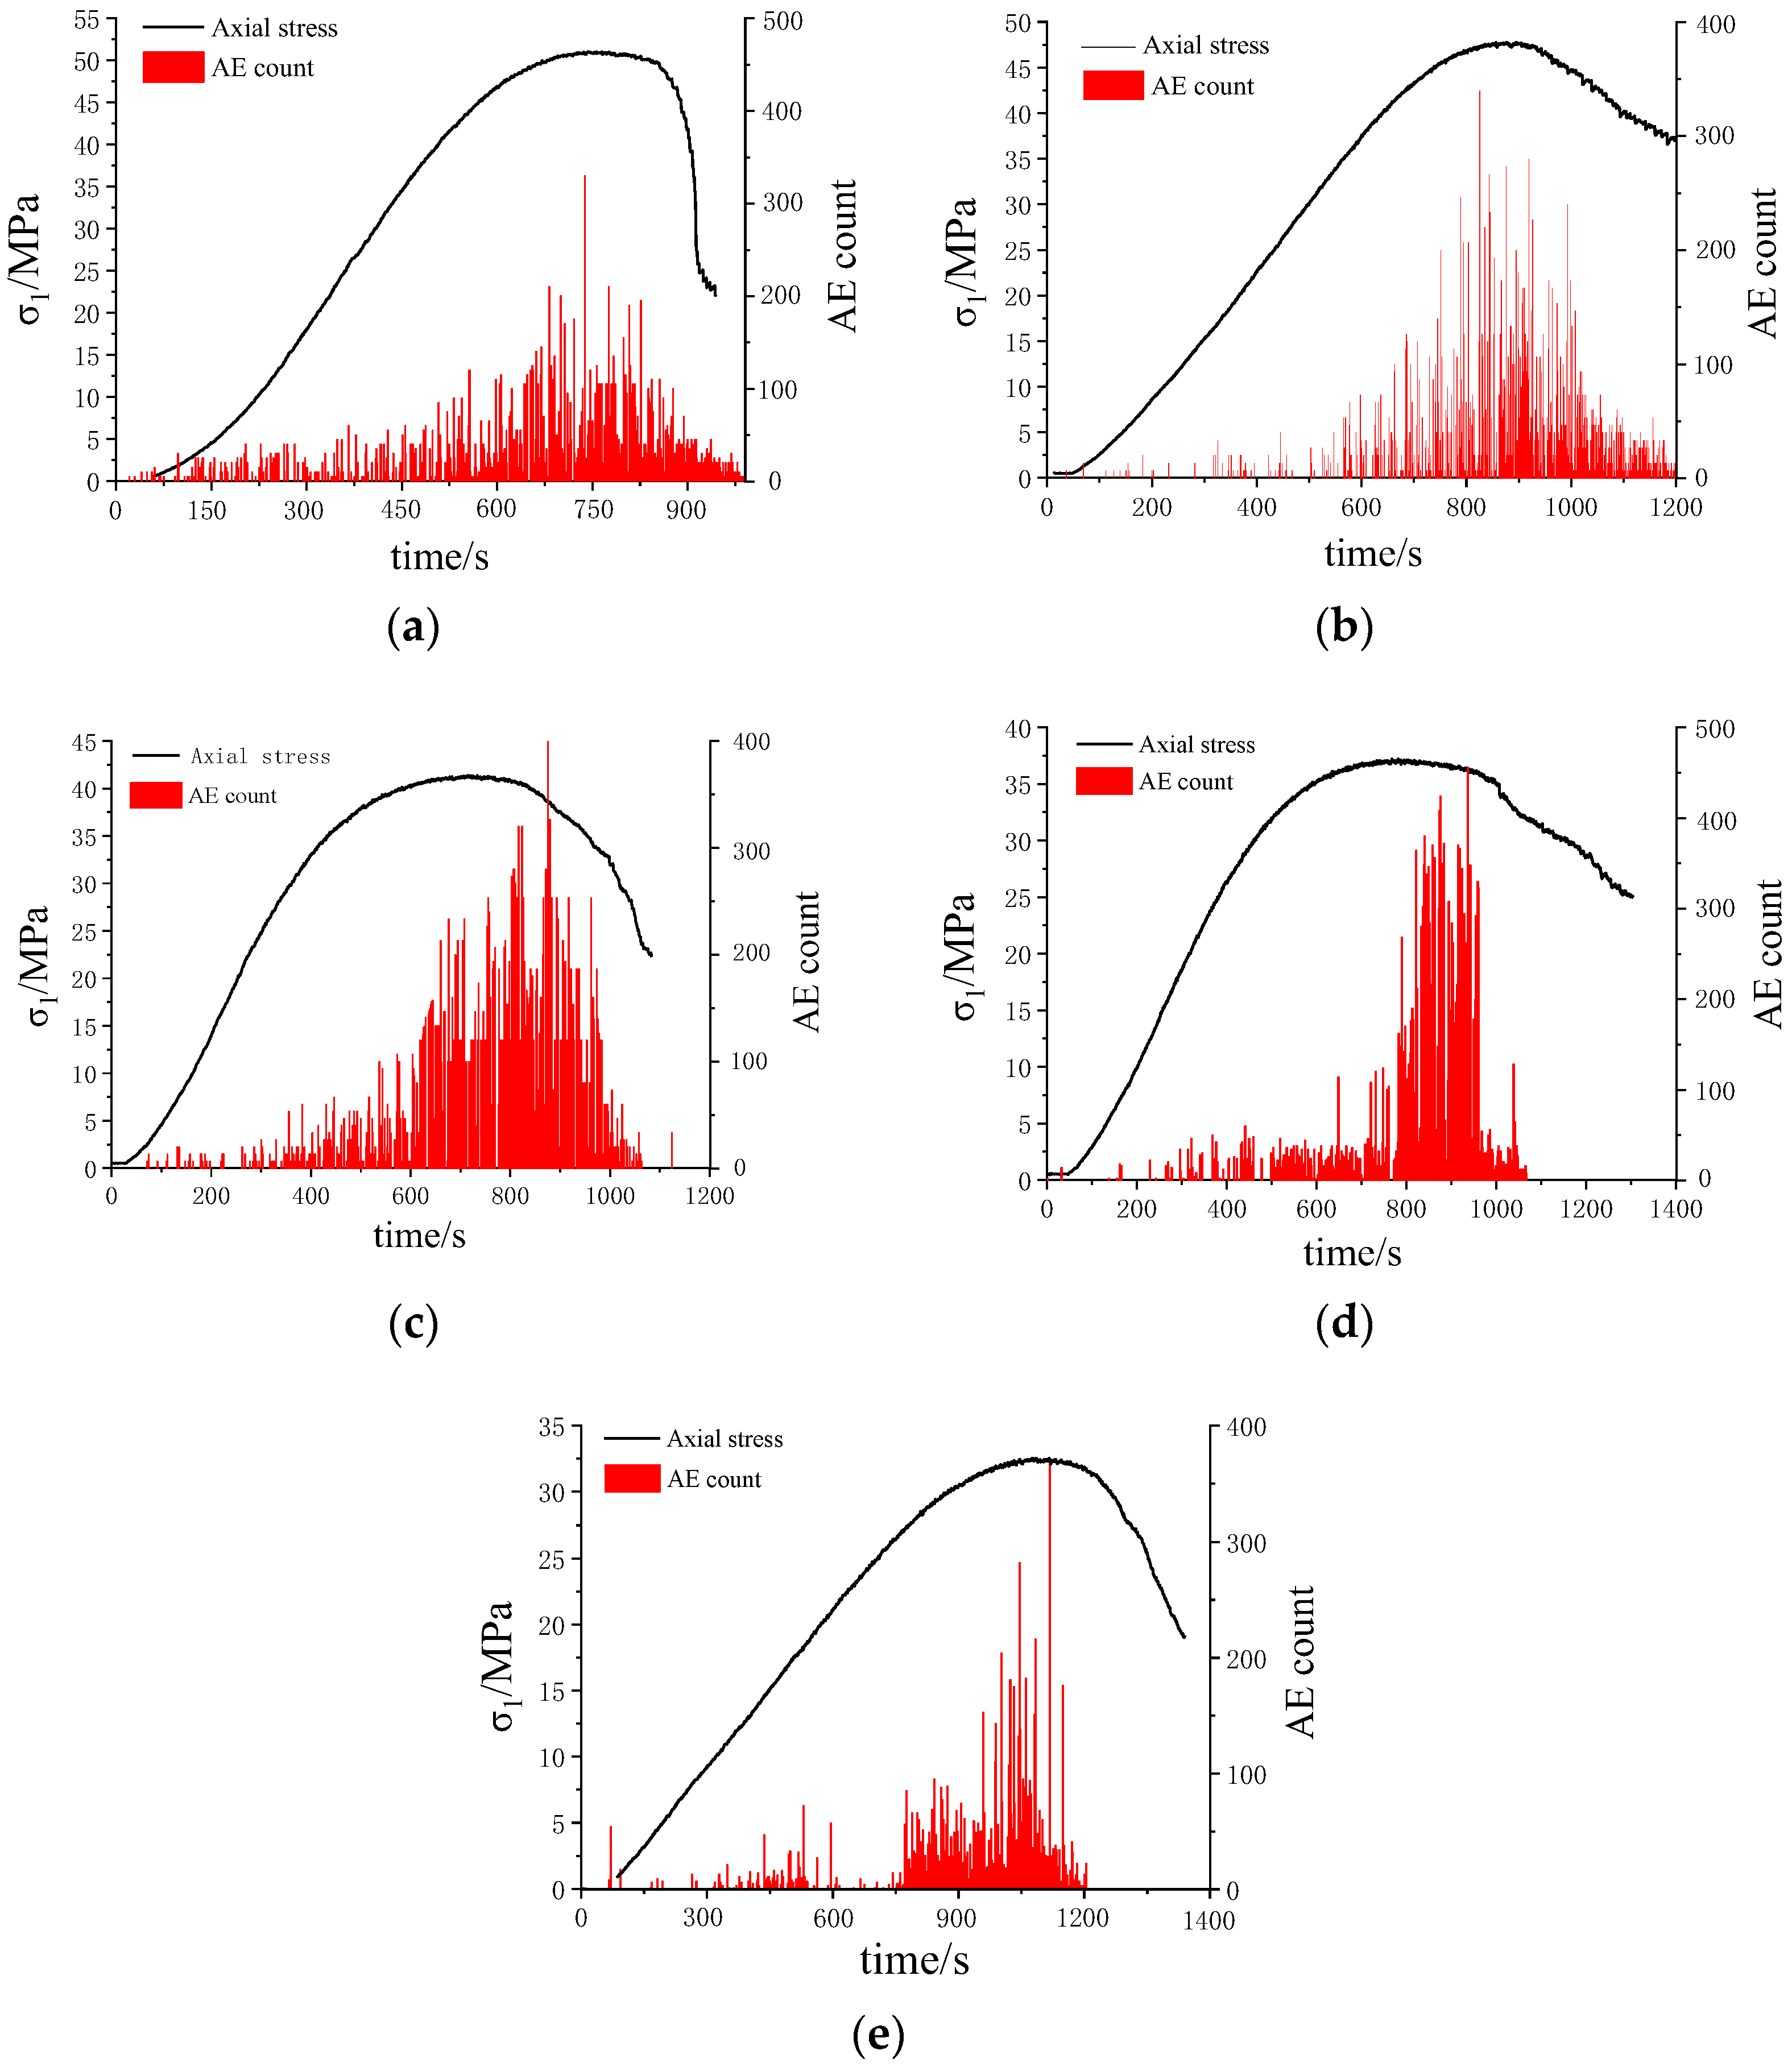
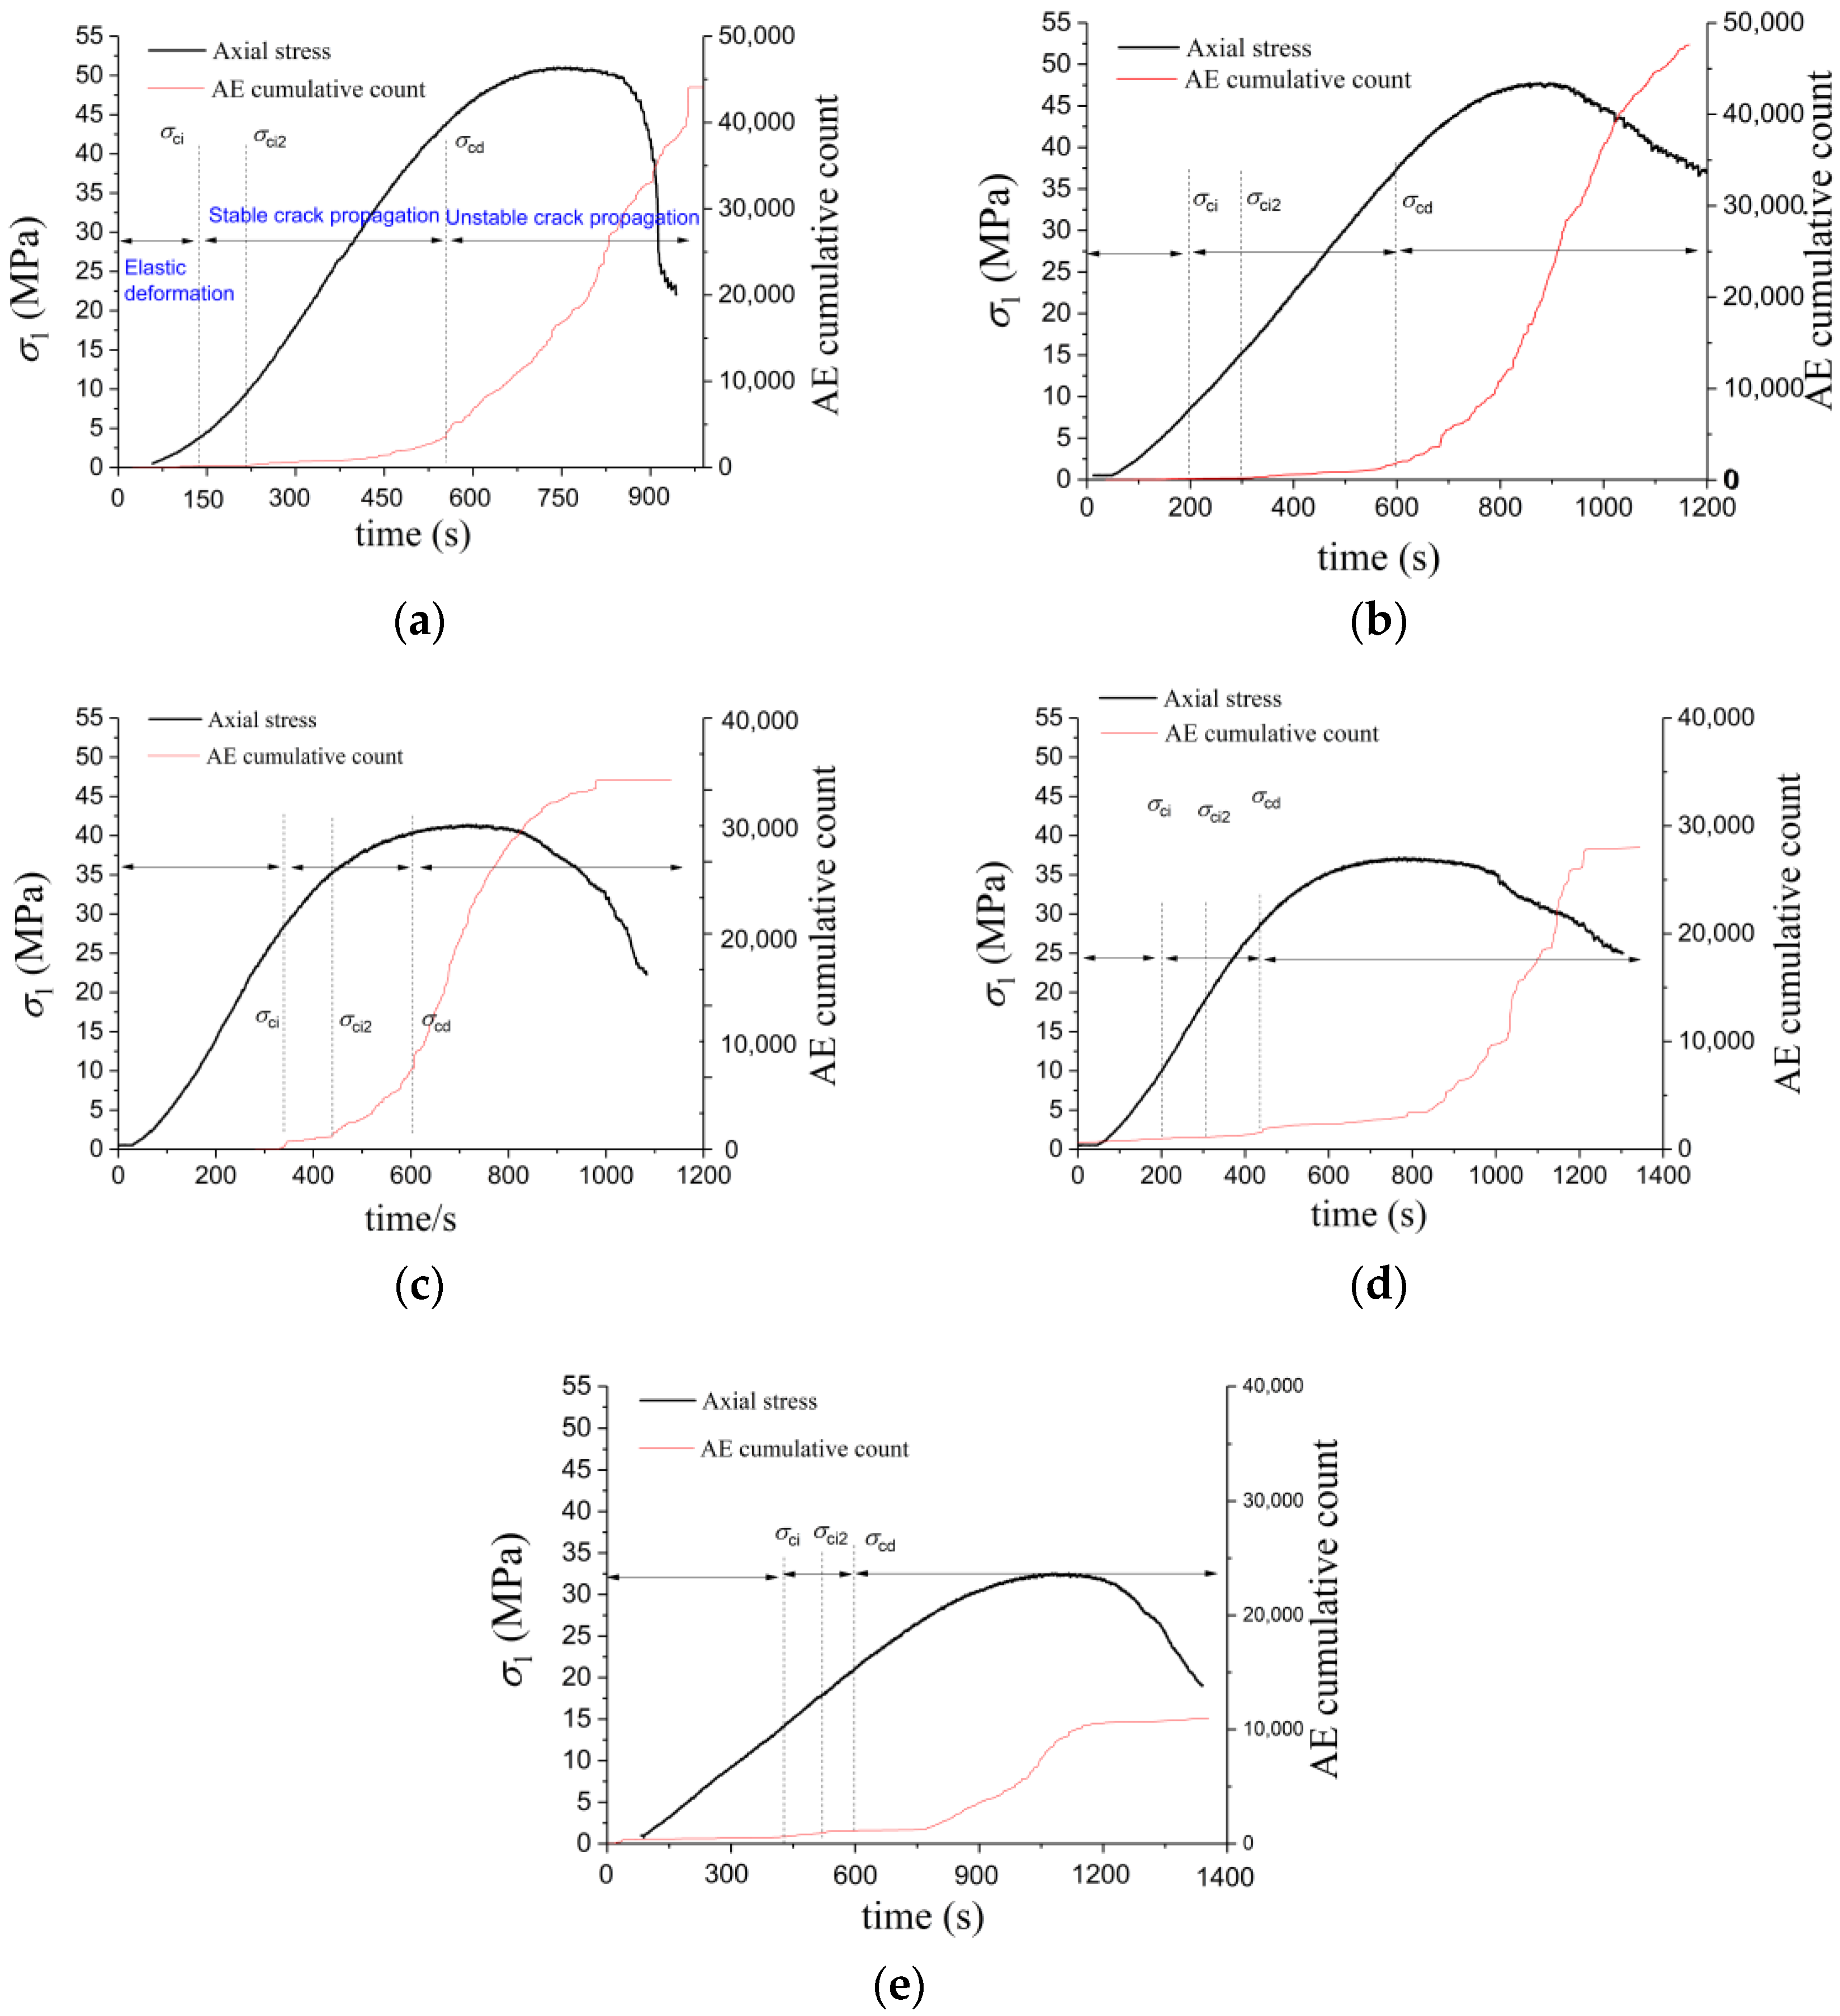
3.4. The Analysis of Acoustic Emission Characteristics

The stress-time-AE count curves of the gypsum rocks with different immersion times are displayed in Figure 12, showing that the AE count of the gypsum rock at the compaction stage was relatively small, which was due to the acoustic emission signals generated by the closure of initial microcracks and joint surfaces in the rock specimen under the combined action of axial stress and confining pressure [22,28]. Before approaching the peak stress, the AE count showed a relatively stable growth trend. When approaching the peak stress, the AE count increased to the maximum and then immediately decreased and stabilized at a lower value. We found that water had a noticeable influence on the acoustic emission characteristics of the gypsum rock. With the water immersion time and the rock water content increasing, the acoustic emission signals of the gypsum rock gradually weakened; and this was due to the weakening and lubrication effect of the water on the rock samples, resulting in the weakening and reduction of the acoustic emission signals.
The stress-time-AE cumulative count curves of the gypsum rocks with the different immersion times are shown in Figure 13. This shows that the AE cumulative count increased slowly in the compaction stage and the linear elastic deformation stage of the loading process, while it rose abruptly near the peak stress and stayed constant in the post-failure stage. This is because in the failure stage, the fracture of the internal microstructure of the gypsum rock was frequent, which made the AE cumulative count increase rapidly. Our results found that as the water immersion time increased, the growth rate of the AE cumulative count in the failure stage slowly increased; while the AE cumulative count in the end of the loading process decreased. This is due to the water immersion having caused serious damage to the internal microstructure of the gypsum rock, leading to the higher initial damage in the rock samples and the more frequent fracture of the internal microstructure in the failure stage. Therefore, the faster growth rate of the AE cumulative count curve could be observed. The water weakened the internal micro-structure of the gypsum rock and then the energy required to reach the peak stress of the gypsum was reduced, therefore, the AE cumulative count at the end of the loading process decreased with the increase in immersion time. In summary, the immersion time was positively correlated with the acoustic emission frequency and negatively correlated with the AE cumulative count. We followed the previous works [28,29,30,31] to identify the stress thresholds in Figure 13. We found that the stable crack propagation stage was generally shortened with the increasing rock water content, which indicates that the gypsum rock softened after the water immersion.

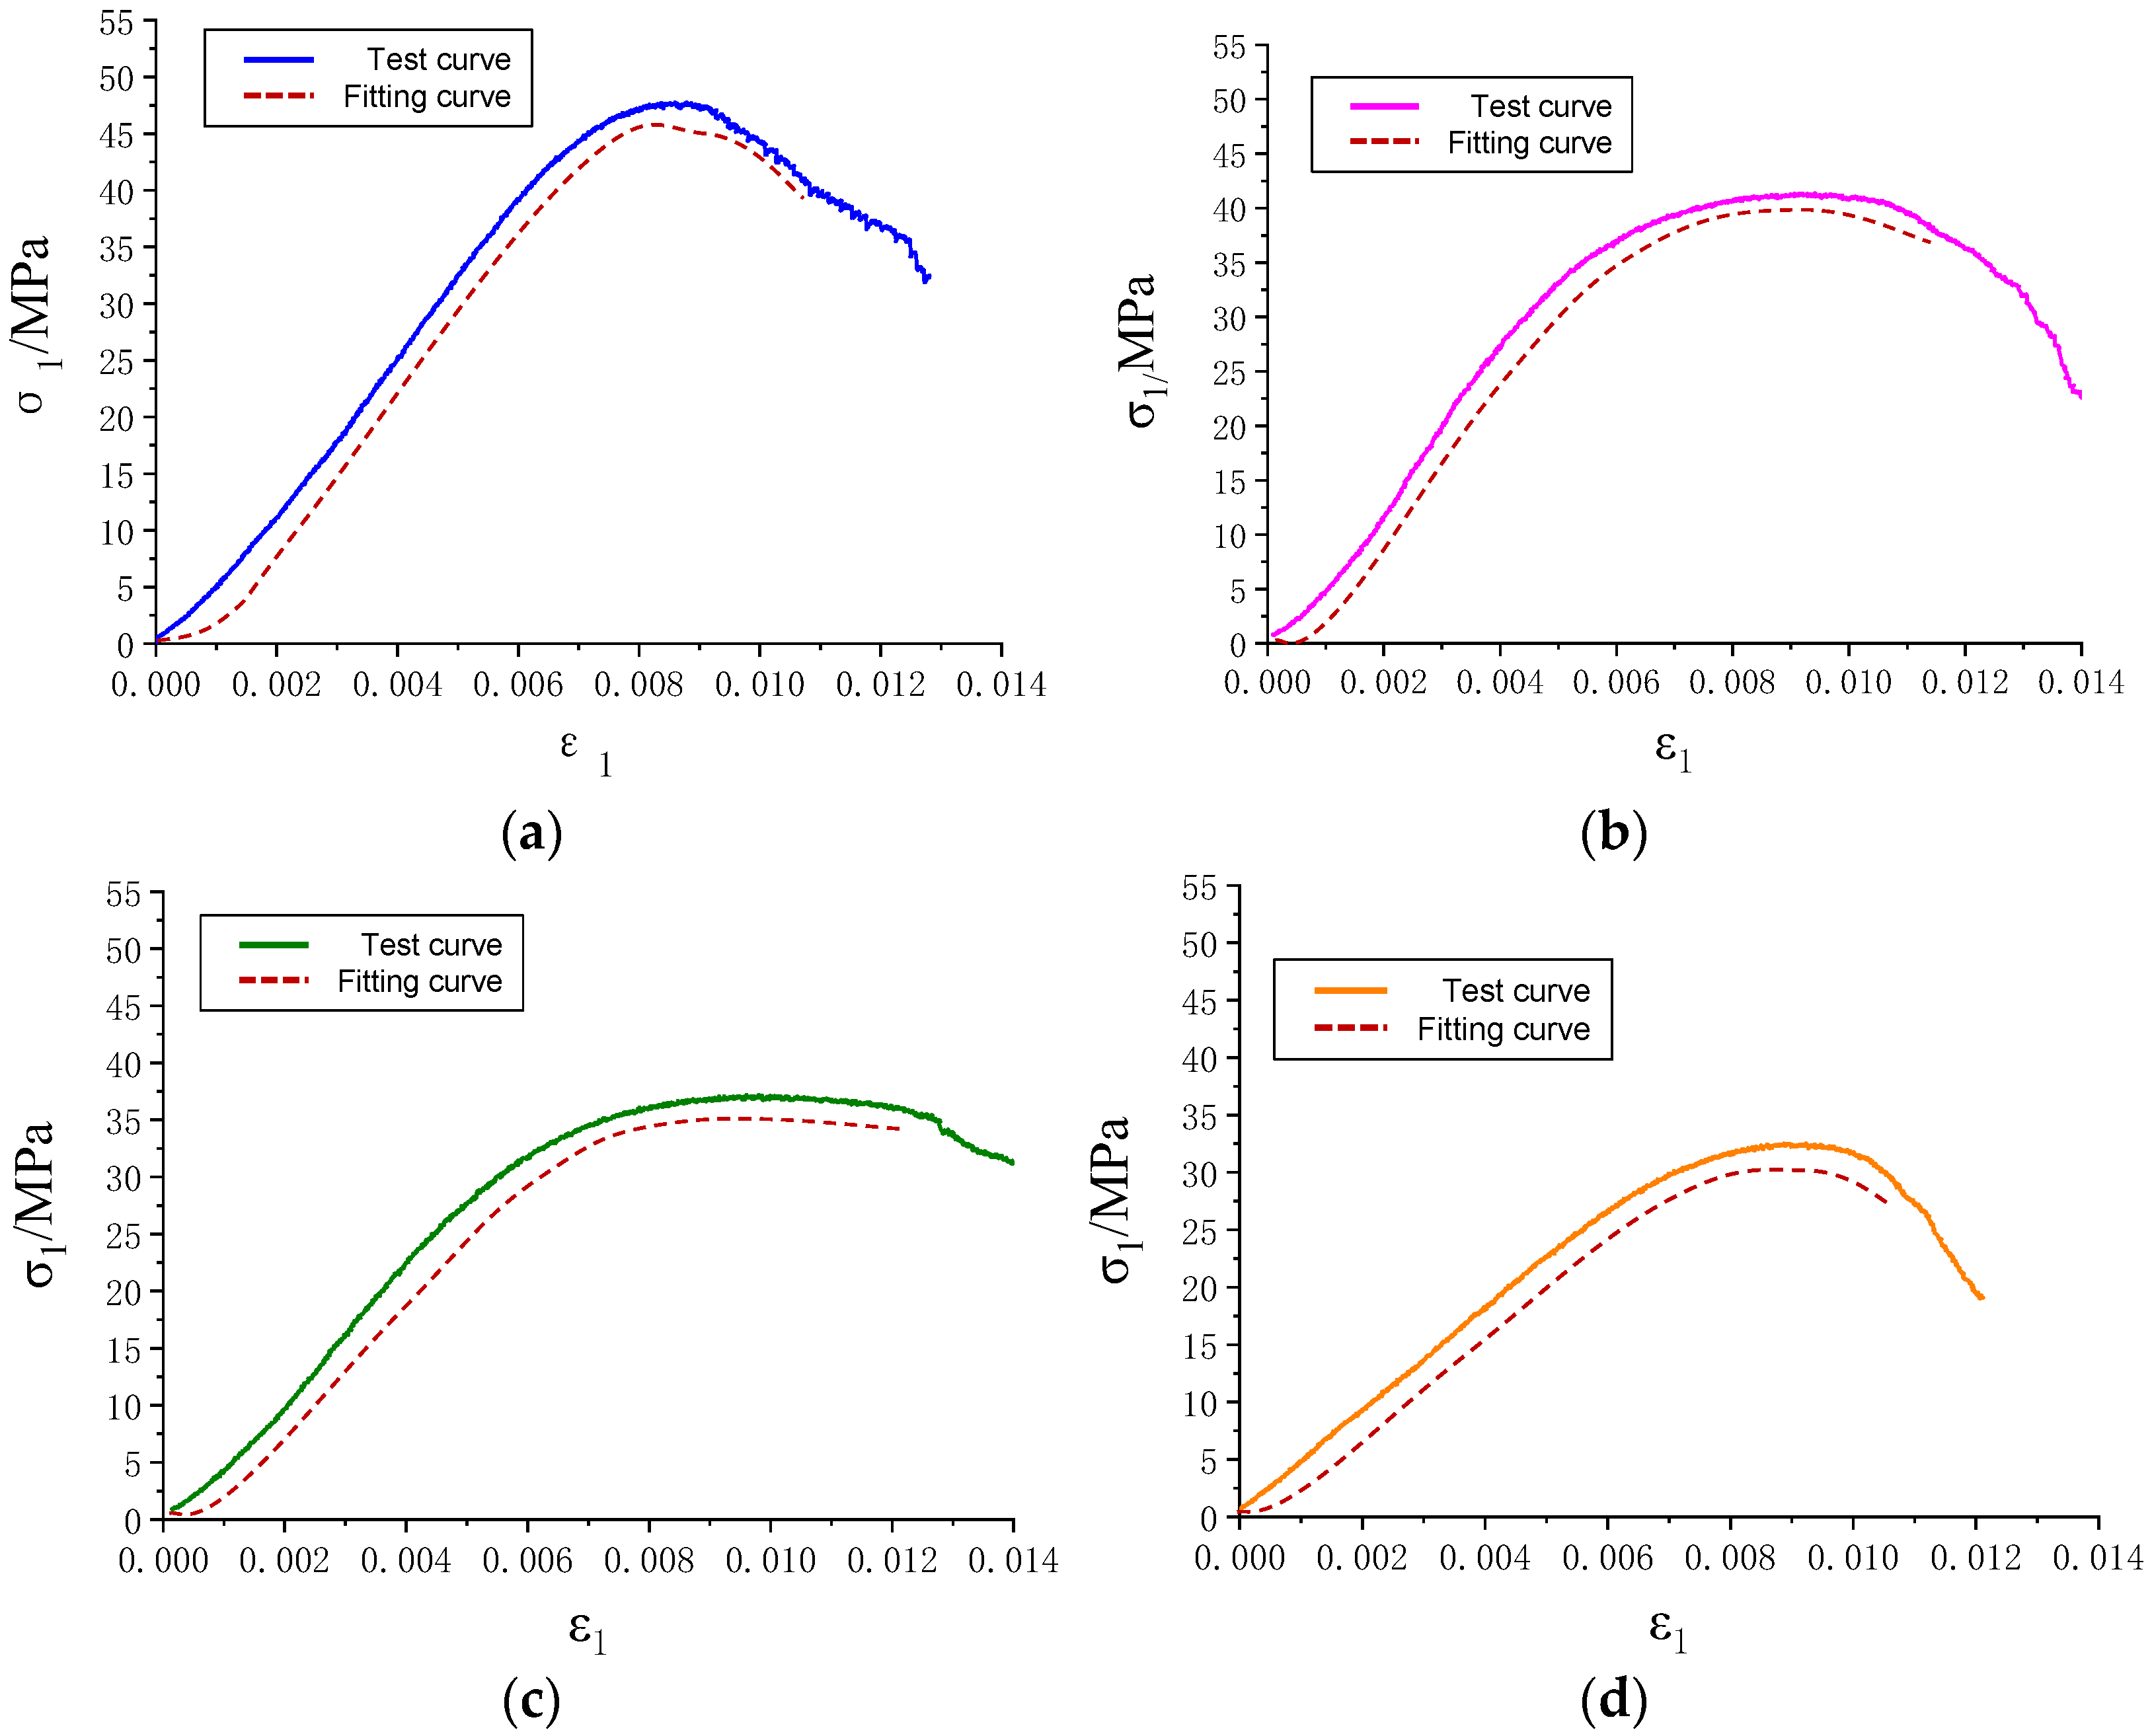
3.5. Validation of the Damage Constitutive Model

By substituting Equations (12)–(13) into Equation (8), the constitutive model of the gypsum rock with the different water content can be obtained as follows:
σ 1 = 10.88 e 1.1484 ω 1 M d M 0 ε 1 + 0.4766 ω + 0.22326 σ 3
Substituting Equation (9) into Equation (14), the constitutive model of the gypsum rock after the different water immersion durations can be derived as follows:
σ 1 = 10.88 e 0.0294 ln t 0.2963 1 M d M 0 ε 1 + 0.0763 ln t + 0.3462 σ 3
Substituting the experimental data into Equation (15), the simulated stress-strain curves of the proposed damage constitutive model based on the AE characteristics can be obtained and compared with the test curves, as shown in Figure 14. It can be seen from Figure 14 that the simulated values were lower, especially in the small regions before and after the peak stress, where the coincidence degree is poor. Due to the aggravation of the damage in the gypsum rock at this stage, the AE signal was interfered with by many external factors. Since the calculation of the damage constitutive model is affected by the damage variable, D , based on the AE characteristics, the errors were produced. However, the linear trend of the curve fitted by our constitutive model is in good agreement with the experimental data. Therefore, the proposed model can effectively reflect the mechanical response of gypsum rock after different water immersion times.

4. Conclusions

  • Gypsum rock’s water content after water immersion was evaluated, and SEM scanning and fractal damage analysis were carried out. Our results indicate that gypsum rock is highly hydrophilic and that the rock water content grows with the increase of immersion time; however, the rate of increase declines as the immersion time increases. The SEM image analysis qualitatively showed that as the water immersion time increased, the complexity of the micropore structure and the porosity of the gypsum rock increased. The further fractal damage calculation quantitatively showed that the fractal dimension and the degree of damage to the rock microstructure increased with the increase in water immersion time; and this increase was quick in the early stage and slow in the later stage of the water immersion.
  • The effect of the water content on the AE characteristics of the gypsum rock during the triaxial compression was significant, especially in the failure stage. With the increase in immersion time, the AE count intensified, due to the dissolving and softening effect of the water on the interior of the gypsum rock, leading to an accelerated failure rate in the failure stage. The AE cumulative count declined with the increase in the immersion time because a longer immersion time increased the degree of damage to the rock microstructure. Hence, the amount of fracture and energy required for rock failure decreased. Our observations on the threshold stress indicated that the wetting induced a shortened stable crack propagation stage during the loading process.
  • A damage constitutive model of gypsum rock after wetting has been developed, where the damage degree is defined based on the AE characteristics during the triaxial compression tests. The model can effectively reproduce the experimental mechanical responses of gypsum rock after different water immersion times.

Author Contributions

Conceptualization, X.X. and W.C.; methodology, X.X.; software, X.X.; validation, X.X., W.C. and Y.Z.; formal analysis, Y.G.; investigation, W.C.; resources, X.X.; data curation, Q.F.; writing—original draft preparation, X.L.; writing—review and editing, W.C.; visualization, C.F.; supervision, Y.Z.; project administration, Y.Z.; funding acquisition, Y.Z. All authors have read and agreed to the published version of the manuscript.

Funding

This work is supported by the National Natural Science Foundation of China (No. 52061135111), the National Natural Science Foundation of China (No. 51874289), and the China Postdoctoral Science Foundation (No. 2020T130702).

Data Availability Statement

The manuscript data used to support the findings of this study are available from the corresponding author upon request.

Conflicts of Interest

The authors declare no conflict of interest. The funders had no role in the design of the study; in the collection, analyses, or interpretation of data; in the writing of the manuscript; or in the decision to publish the results.

References

  1. Zhu, C.; Xu, X.; Liu, W.; Xiong, F.; Lin, Y.; Cao, C.; Liu, X. Softening damage analysis of gypsum rock with water immersion time based on laboratory experiment. IEEE Access 2019, 7, 125575–125585. [Google Scholar] [CrossRef]
  2. Jiang, S.; Huang, M.; Wu, X.; Chen, Z.; Zhang, K. Deterioration behavior of gypsum breccia in surrounding rock under the combined action of cyclic wetting-drying and flow rates. Bull. Eng. Geol. Environ. 2021, 80, 4985–5001. [Google Scholar] [CrossRef]
  3. Jeschke, A.A.; Vosbeck, K.; Dreybrodt, W. Surface controlled dissolution rates of gypsum in aqueous solutions exhibit nonlinear dissolution kinetics. Geochim. Cosmochim. Acta 2001, 65, 27–34. [Google Scholar] [CrossRef]
  4. Wang, J.; Li, S.-C.; Li, L.-P.; Lin, P.; Xu, Z.-H.; Gao, C.-L. Attribute recognition model for risk assessment of water inrush. Bull. Eng. Geol. Environ. 2019, 78, 1057–1071. [Google Scholar] [CrossRef]
  5. Torabi-Kaveh, M.; Heidari, M.; Miri, M. Karstic features in gypsum of Gachsaran Formation (case study; Chamshir Dam reservoir, Iran). Carbonates Evaporites 2012, 27, 291–297. [Google Scholar] [CrossRef]
  6. Auvray, C.; Homand, F.; Sorgi, C. The aging of gypsum in underground mines. Eng. Geol. 2004, 74, 183–196. [Google Scholar] [CrossRef]
  7. Zhu, Y.; Huang, X.; Guo, J.; Xiao, F.; Zhao, F. Experimental study of fatigue characteristics of gypsum rock under cyclic loading. Chin. J. Rock Mech. Eng. 2017, 36, 940. [Google Scholar] [CrossRef]
  8. Sadeghiamirshahidi, M.; Vitton, S.J. Laboratory Study of Gypsum Dissolution Rates for an Abandoned Underground Mine. Rock Mech. Rock Eng. 2019, 52, 2053–2066. [Google Scholar] [CrossRef]
  9. Meng, T.; Xiangxi, M.; Donghua, Z.; Hu, Y. Using micro-computed tomography and scanning electron microscopy to assess the morphological evolution and fractal dimension of a salt-gypsum rock subjected to a coupled thermal-hydrological-chemical environment. Mar. Pet. Geol. 2018, 98, 316–334. [Google Scholar] [CrossRef]
  10. Auvray, C.; Homand, F.; Hoxha, D. The influence of relative humidity on the rate of convergence in an underground gypsum mine. Int. J. Rock Mech. Min. Sci. 2008, 45, 1454–1468. [Google Scholar] [CrossRef]
  11. Yilmaz, I. Influence of water content on the strength and deformability of gypsum. Int. J. Rock Mech. Min. Sci. 2010, 47, 342–347. [Google Scholar] [CrossRef]
  12. Li, W.; Einstein, H.H. Theoretical and numerical investigation of the cavity evolution in gypsum rock. Water Resour. Res. 2017, 53, 9988–10001. [Google Scholar] [CrossRef]
  13. Yu, W.D.; Liang, W.G.; Li, Y.R.; Yu, Y.M. The meso-mechanism study of gypsum rock weakening in brine solutions. Bull. Eng. Geol. Environ. 2016, 75, 359–367. [Google Scholar] [CrossRef]
  14. Ouyang, Y.; Chen, S.; Chen, W.; Zhang, L.; Matthai, S.; Duan, W. Toward the Understanding of Stress-Induced Mineral Dissolution via Molecular Scale Simulations. J. Phys. Chem. C 2020, 124, 19166–19173. [Google Scholar] [CrossRef]
  15. Chen, W.Q.; Sedighi, M.; Jivkov, A.P. Thermo-osmosis in hydrophilic nanochannels: Mechanism and size effect. Nanoscale 2021, 13, 1696–1716. [Google Scholar] [CrossRef]
  16. Chen, S.J.; Chen, W.Q.; Ouyang, Y.; Matthai, S.; Zhang, L. Transitions between nanomechanical and continuum mechanical contacts: New insights from liquid structure. Nanoscale 2019, 11, 22954–22963. [Google Scholar] [CrossRef]
  17. Du, M.R.; Chen, S.J.; Duan, W.H.; Chen, W.Q.; Jing, H.W. Role of multiwalled carbon nanotubes as shear reinforcing nanopins in quasi-brittle matrices. ACS Appl. Nano Mater. 2018, 1, 1731–1740. [Google Scholar] [CrossRef]
  18. Chen, W.; Sedighi, M.; Jivkov, A.P. Thermo-osmosis in silica nanochannels. Jpn. Geotech. Soc. Spec. Publ. 2021, 9, 210–214. [Google Scholar] [CrossRef]
  19. Kovari, K.; Tisa, A.; Einstein, H.; Franklin, J. Suggested methods for determining the strength of rock materials in triaxial compression: Revised version. Intl. J. Rock Mech. Min. Sci. Geomech. Abs. 1983, 20, 285–290. [Google Scholar] [CrossRef]
  20. Franklin, J.A. Suggest methods for determining water content, porosity, density, absorption and related properties and swelling and slake-durability index properties. Int. J. Rock Mech. Min. Sci. Geomech. Abstr. 1979, 16, 141–156. [Google Scholar] [CrossRef]
  21. Shi, X.; Jing, H.; Chen, W.; Gao, Y.; Zhao, Z. Investigation on the Creep Failure Mechanism of Sandy Mudstone Based on Micromesoscopic Mechanics. Geofluids 2021, 2021, 5550733. [Google Scholar] [CrossRef]
  22. Jing, H.; Yin, Q.; Yang, S.; Chen, W. Micro-mesoscopic creep damage evolution and failure mechanism of sandy mudstone. Int. J. Geomech. 2021, 21, 04021010. [Google Scholar] [CrossRef]
  23. Voyiadjis, G.Z.; Kattan, P.I. A comparative study of damage variables in continuum damage mechanics. Int. J. Damage Mech. 2009, 18, 315–340. [Google Scholar] [CrossRef]
  24. Feng, Z.; Sun, X. Box-counting dimensions of fractal interpolation surfaces derived from fractal interpolation functions. J. Math. Anal. Appl. 2014, 412, 416–425. [Google Scholar] [CrossRef]
  25. Ai, T.; Zhang, R.; Zhou, H.W.; Pei, J.L. Box-counting methods to directly estimate the fractal dimension of a rock surface. Appl. Surf. Sci. 2014, 314, 610–621. [Google Scholar] [CrossRef]
  26. Peng, R.; Yang, Y.; Ju, Y.; Mao, L.; Yang, Y. Computation of fractal dimension of rock pores based on gray CT images. Chin. Sci. Bull. 2011, 56, 3346. [Google Scholar] [CrossRef]
  27. Xu, X.; He, M.; Zhu, C.; Lin, Y.; Cao, C. A new calculation model of blasting damage degree—Based on fractal and tie rod damage theory. Eng. Fract. Mech. 2019, 220, 106619. [Google Scholar] [CrossRef]
  28. Ranjith, P.G.; Jasinge, D.; Song, J.; Choi, S. A study of the effect of displacement rate and moisture content on the mechanical properties of concrete: Use of acoustic emission. Mech. Mater. 2008, 40, 453–469. [Google Scholar] [CrossRef]
  29. Chun, Z.; Yun, L.; Gan, F. Influence of temperature on quantification of mesocracks: Implications for physical properties of fine-grained granite. Lithosphere 2021, 2021, 7824057. [Google Scholar] [CrossRef]
  30. Yin, Q.; Jing, H.; Ma, G. Experimental study on mechanical properties of sandstone specimens containing a single hole after high-temperature exposure. Geotech. Lett. 2015, 5, 43–48. [Google Scholar] [CrossRef]
  31. Ren, F.; Zhu, C.; He, M. Moment tensor analysis of acoustic emissions for cracking mechanisms during schist strain burst. Rock Mech. Rock Eng. 2020, 53, 153–170. [Google Scholar] [CrossRef]
Figure 1. A standard sample of gypsum rock.
Minerals 12 01168 g001
Figure 2. The rock sample under triaxial compression and the microscopic element, where σ 1 , σ 2 , and σ 3 are the three principal stresses, and σ c is the applied circumferential confining pressure.
Minerals 12 01168 g002
Figure 3. The relationship between the rock water content and the immersion time.
Minerals 12 01168 g003
Figure 4. SEM images of the rock samples with different water immersion times: (a) Natural, (b) 7 days, (c) 15 days, and (d) 30 days.
Minerals 12 01168 g004
Figure 5. The analysis procedure of the fractal dimension of the SEM image.
Minerals 12 01168 g005
Figure 6. The calculation of the fractal dimension for the gypsum rock with different soak times: (a) Natural, (b) 7 days, (c) 15 days, and (d) 30 days.
Minerals 12 01168 g006
Figure 7. (a) The relationship between the fractal dimension/degree of damage and the water immersion time. (b) The relationship between the fractal dimension/degree of damage and the water content.
Minerals 12 01168 g007
Figure 8. The stress-strain curves of the gypsum rocks after immersion in water for different durations.
Minerals 12 01168 g008
Figure 9. The relationship between the triaxial compressive strength and the rock water content.
Minerals 12 01168 g009
Figure 10. The relationship between the elastic modulus and the rock water content.
Minerals 12 01168 g010
Figure 11. The relationship between the Poisson’s ratio and the rock water content.
Minerals 12 01168 g011
Figure 12. The stress-time-AE count curves of the gypsum rocks with the different immersion times: (a) Natural, (b) 1 day, (c) 7 days, (d) 15 days, and (e) 30 days.
Minerals 12 01168 g012
Figure 13. The stress-time-AE cumulative count curves of the gypsum rocks with the different water immersion durations, where σ ci , σ ci 2 , and σ cd indicate the crack initiation stress, the secondary crack stress, and the crack damage stress: (a) Natural, (b) 1 day, (c) 7 days, (d) 15 days, and (e) 30 days.
Minerals 12 01168 g013
Figure 14. The experimental and simulated curves of the gypsum rocks under triaxial compressions after immersion in water for different durations: (a) 1 day, (b) 7 days, (c) 15 days, and (d) 30 days.
Minerals 12 01168 g014
Table 1. The rock water content after immersion in water for different durations.
Sample t   d M 1   g M 2   g Δ M   g ω   ( % ) ω ¯   ( % )
dz0-1Natural441.91441.150.760.17230.2467
dz0-2444.01442.711.300.2936
dz0-3442.58441.371.210.2741
dz1-11447.37446.111.260.28240.3001
dz1-2445.35443.851.500.3379
dz1-3451.22449.961.260.2800
dz7-17444.28442.122.160.48860.4824
dz7-2448.60446.322.280.5108
dz7-3449.62447.482.140.4479
dz15-115447.84444.683.160.71060.7051
dz15-2449.35446.003.350.7511
dz15-3451.18448.252.930.6537
dz30-130446.01441.354.661.10560.8755
dz30-2444.35440.883.470.7870
dz30-3446.17442.923.250.7338
Table 2. The fractal dimension of the gypsum rock with different immersion times.
Image NumberMagnificationFractal DimensionR2
a10001.64110.99719
b10001.68120.99713
c10001.82360.99807
d10001.86110.99845
Table 3. The mechanical parameters of the gypsum rock obtained from the triaxial compression tests.
Sample Number t   d σ c (MPa) E (GPa)Poisson’s Ratio
Test ValueAverage ValueTest ValueAverage ValueTest ValueAverage Value
sz0-1051.0251.088.458.200.1760.177
sz0-252.548.280.171
sz0-349.687.870.183
sz1-1147.7448.877.617.730.1790.180
sz1-248.667.560.187
sz1-350.218.010.175
sz7-1741.3841.646.226.200.2310.230
sz7-244.276.410.216
sz7-339.285.960.243
sz15-11536.9836.564.984.850.2710.258
sz15-235.844.760.256
sz15-337.184.810.247
sz30-13032.4131.214.084.000.3520.335
sz30-229.683.910.311
sz30-331.544.010.343
Publisher’s Note: MDPI stays neutral with regard to jurisdictional claims in published maps and institutional affiliations.

