
Distribution of Trace Elements (Ag, Pd, Cd, and Mn) between Pyrite and Pyrrhotite and Selectivity of Surficial Nonautonomous Phases in a Hydrothermal System


Abstract
:1. Introduction
2. Methods
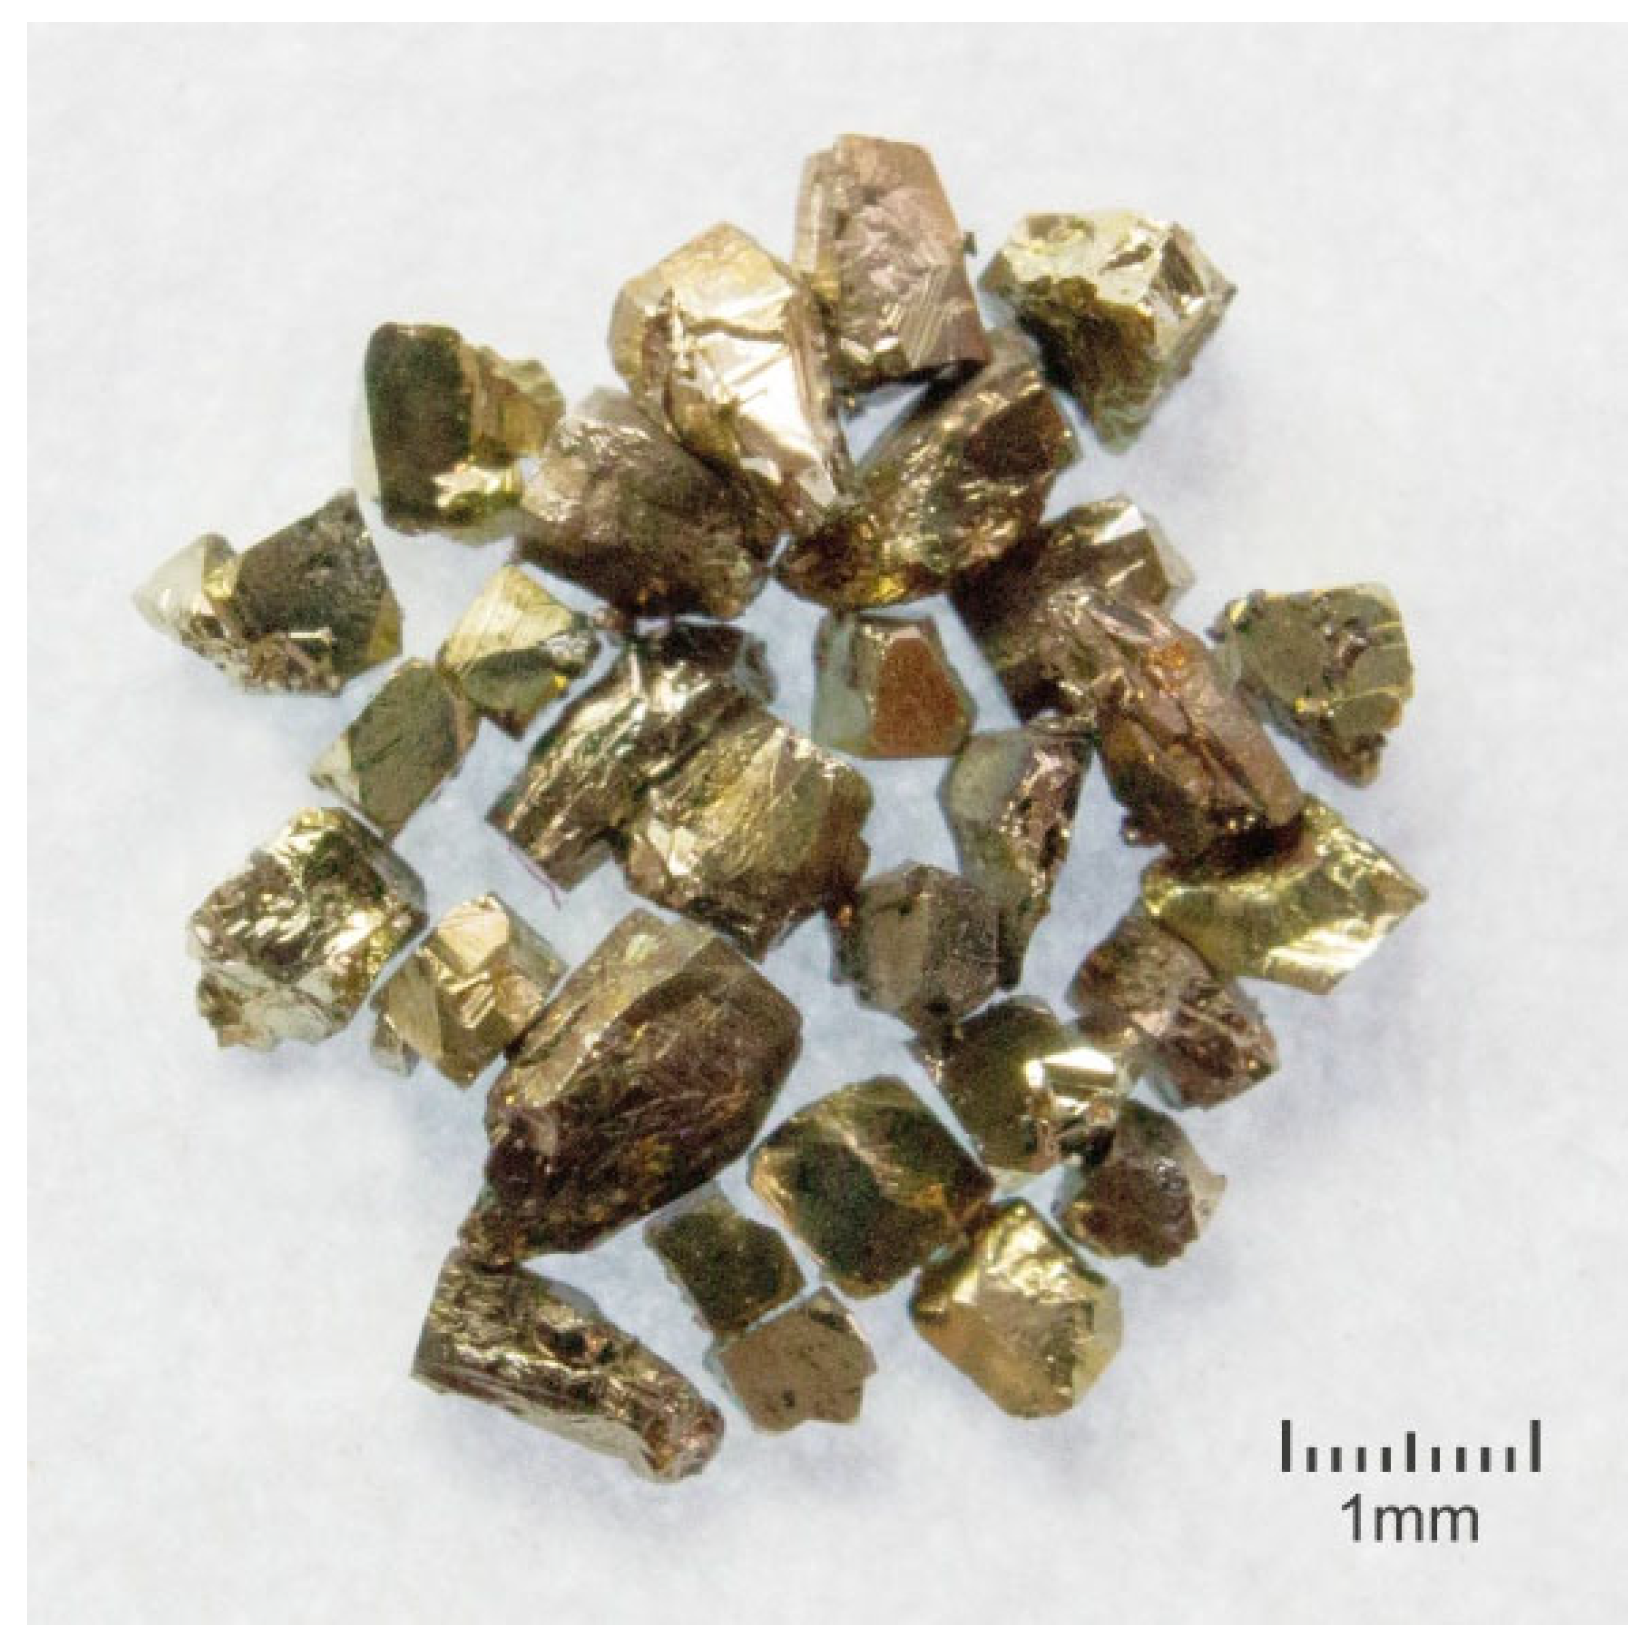
2.1. Experimental Procedure and Obtained Phases
2.2. Analytical Methods
3. Results
3.1. Trace Element Contents and Distribution Coefficients
3.1.1. Atomic Absorption Spectrometry—Analytical Data Selections for Single Crystals
3.1.2. Laser Ablation Inductively Coupled Plasma Mass Spectrometry
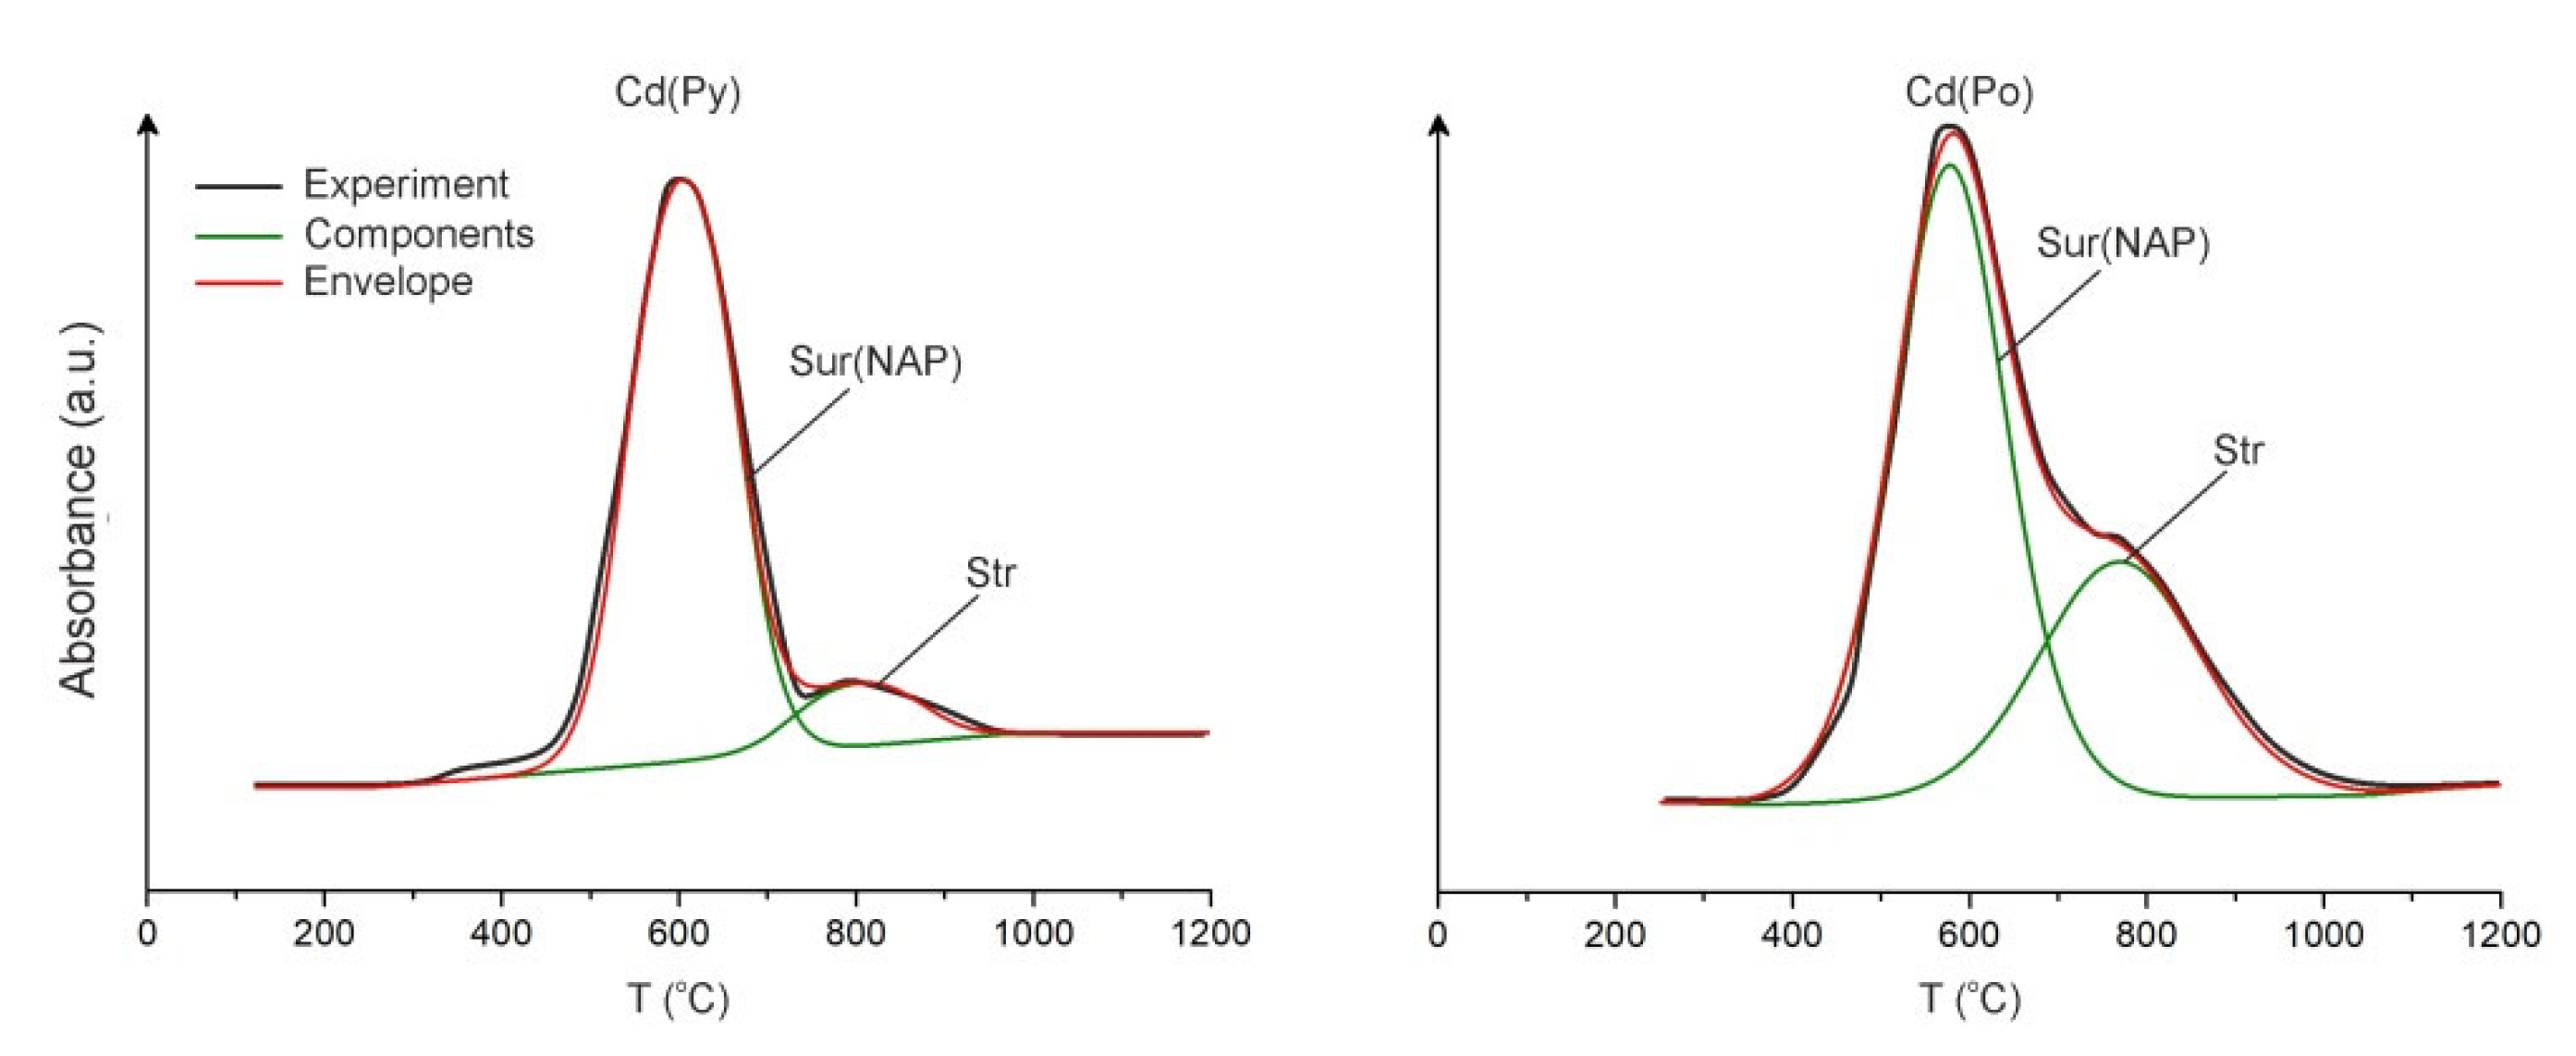
3.1.3. Element Thermo-Release Atomic Absorption Spectrometry and Comparison of Methods
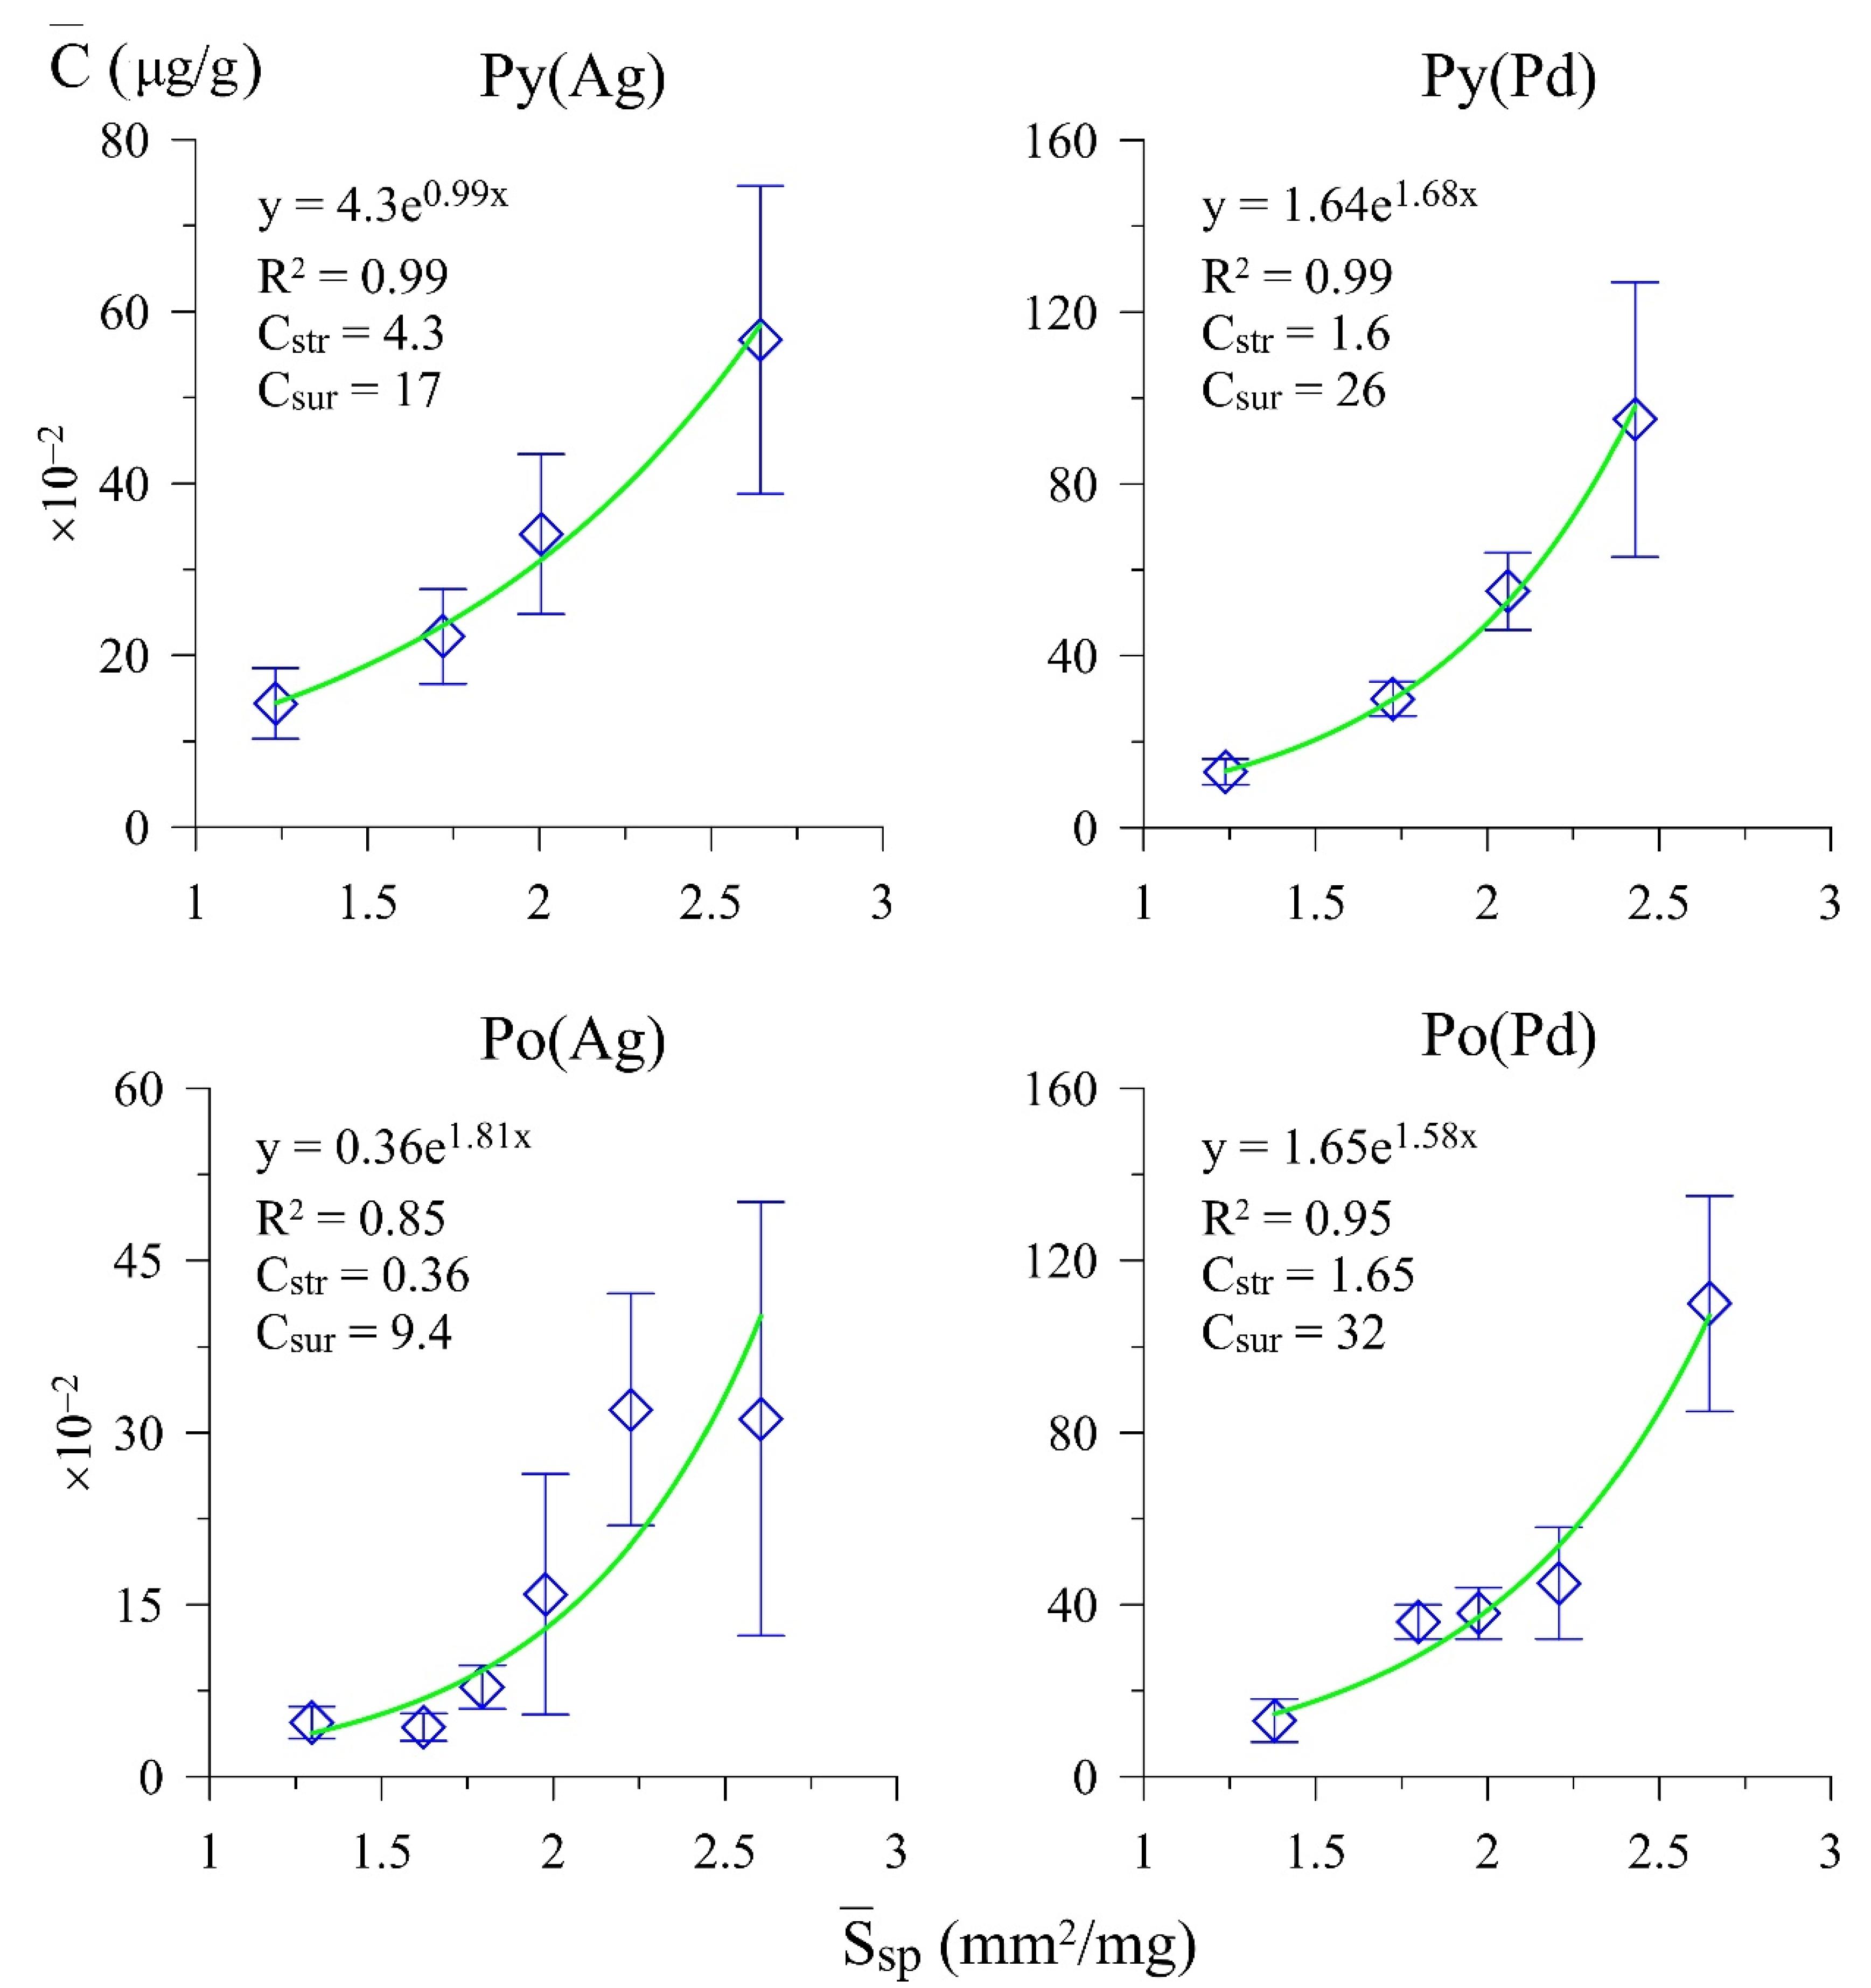
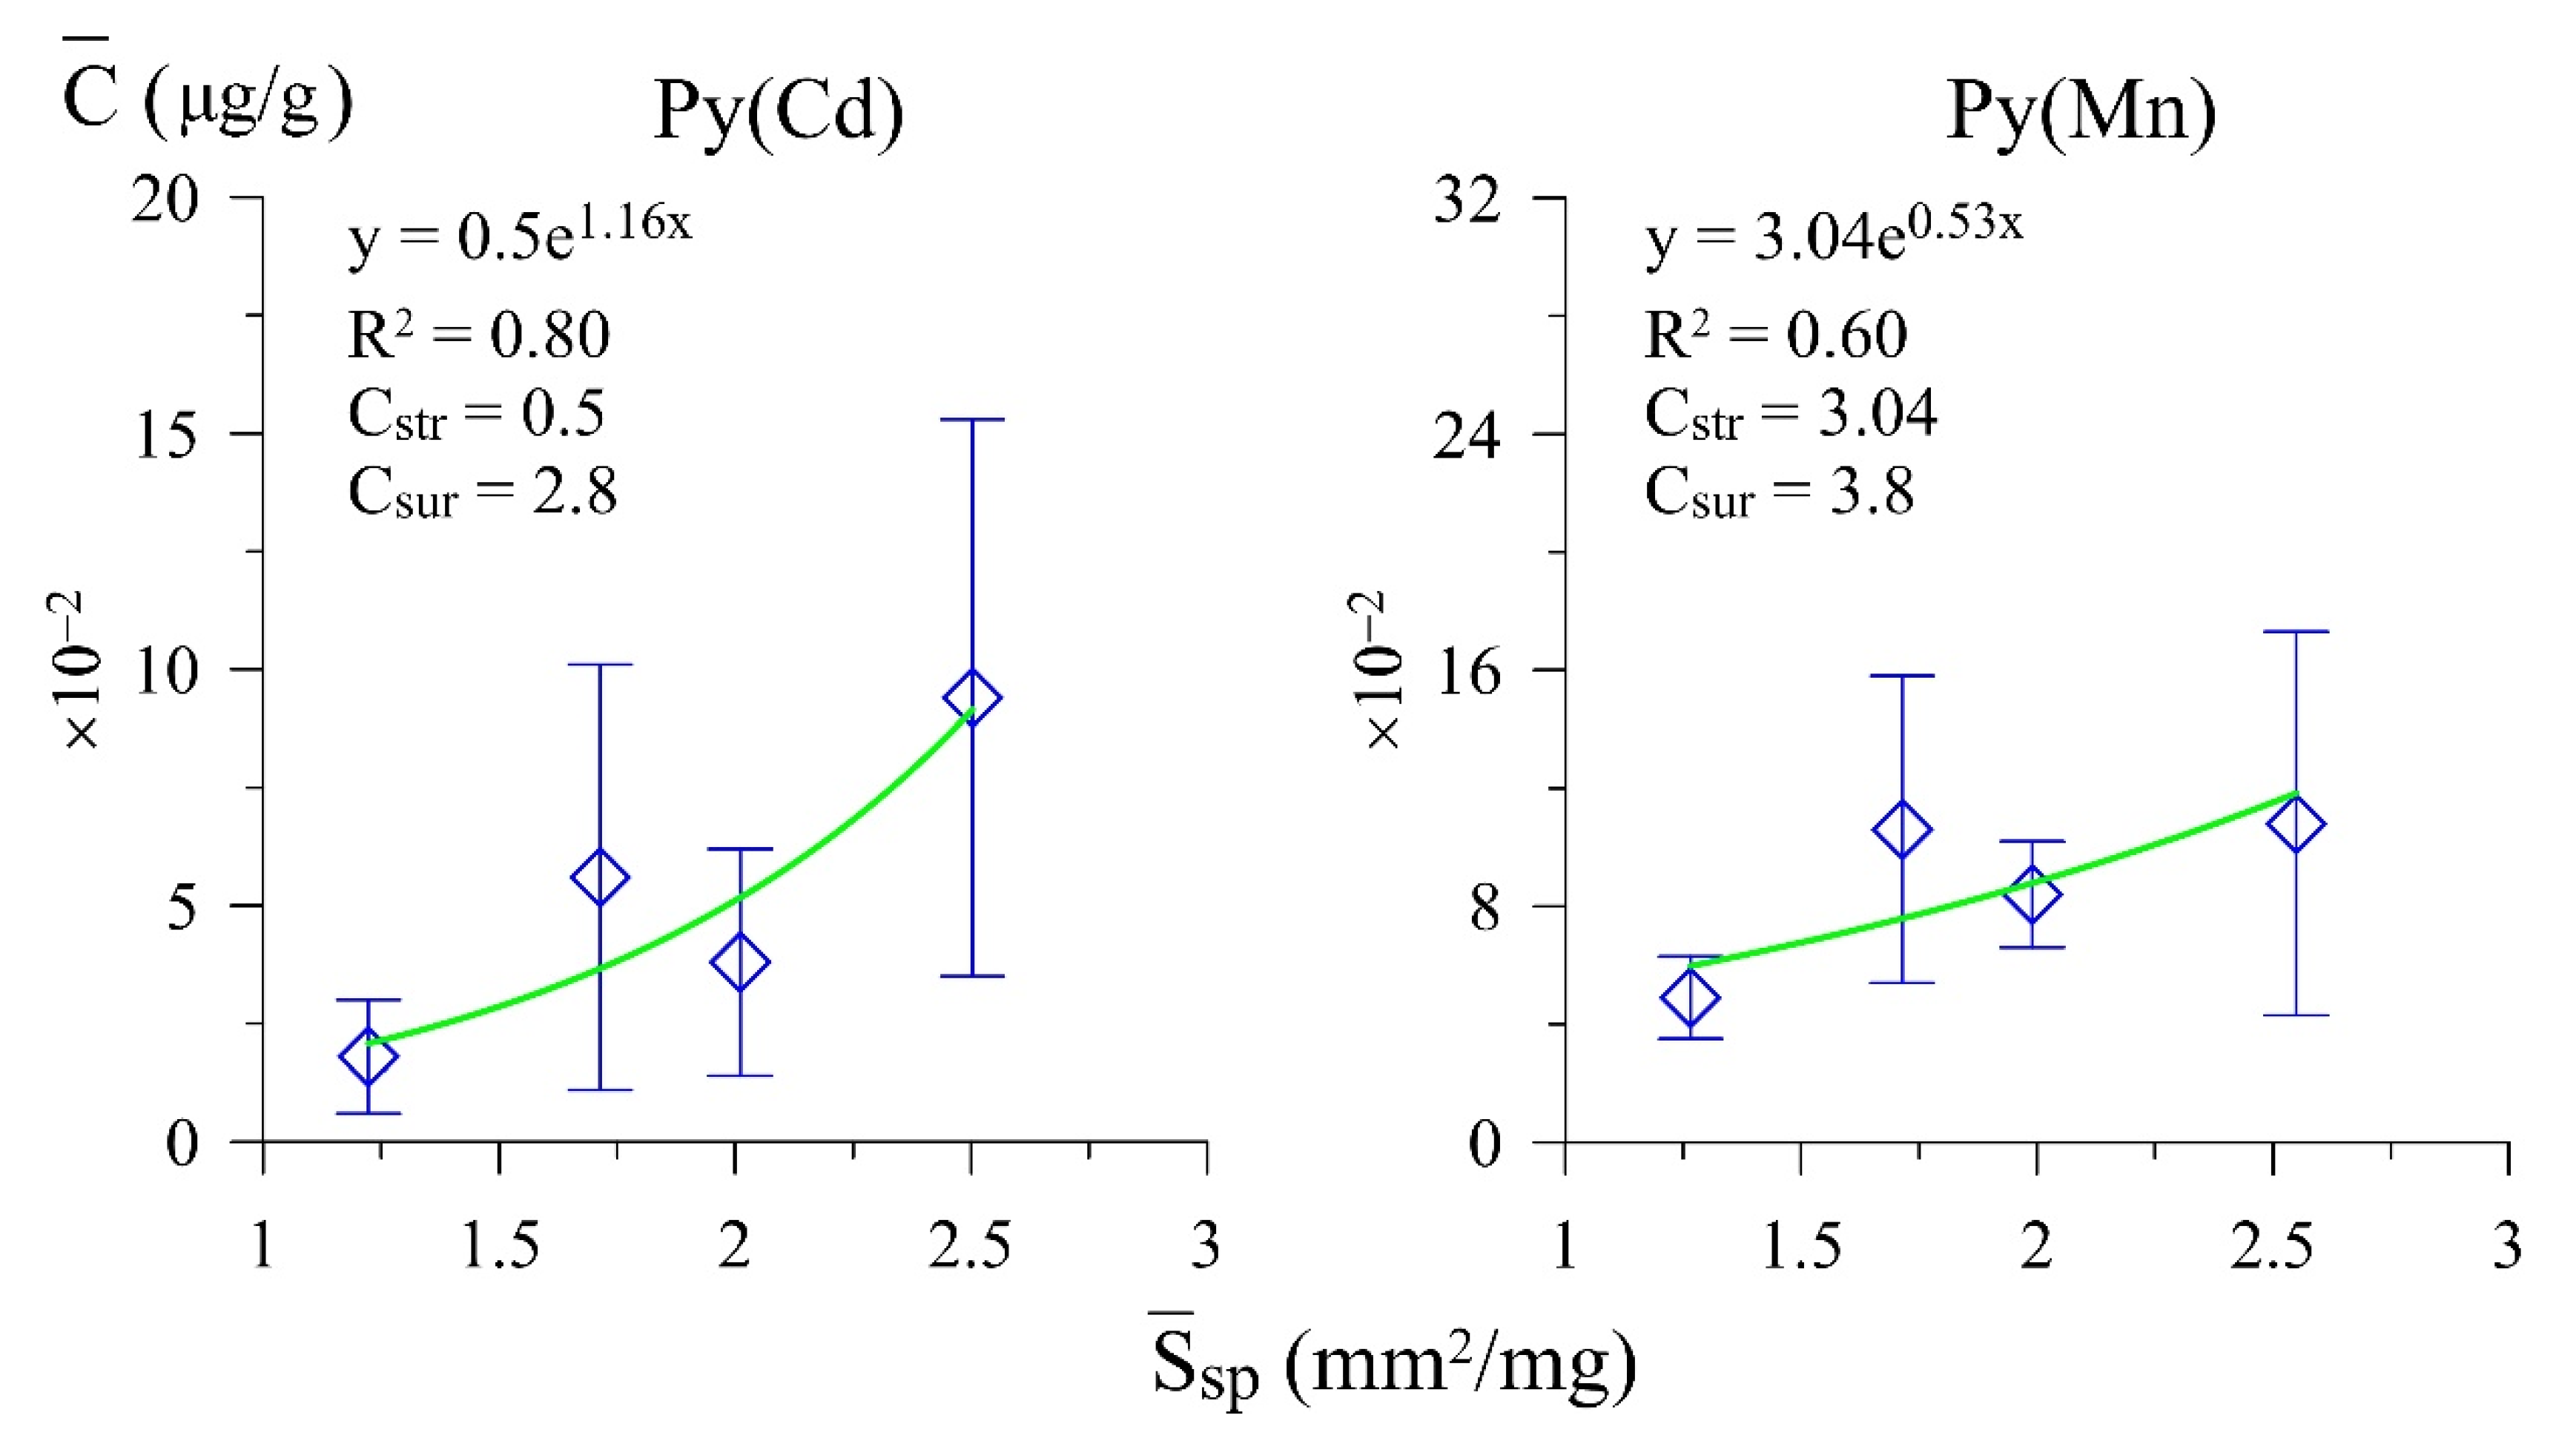
3.2. Selectivity of NAPs for Trace Elements
4. Discussion
4.1. Systems and Trace Element Speciation
4.1.1. Fe–S–Ag
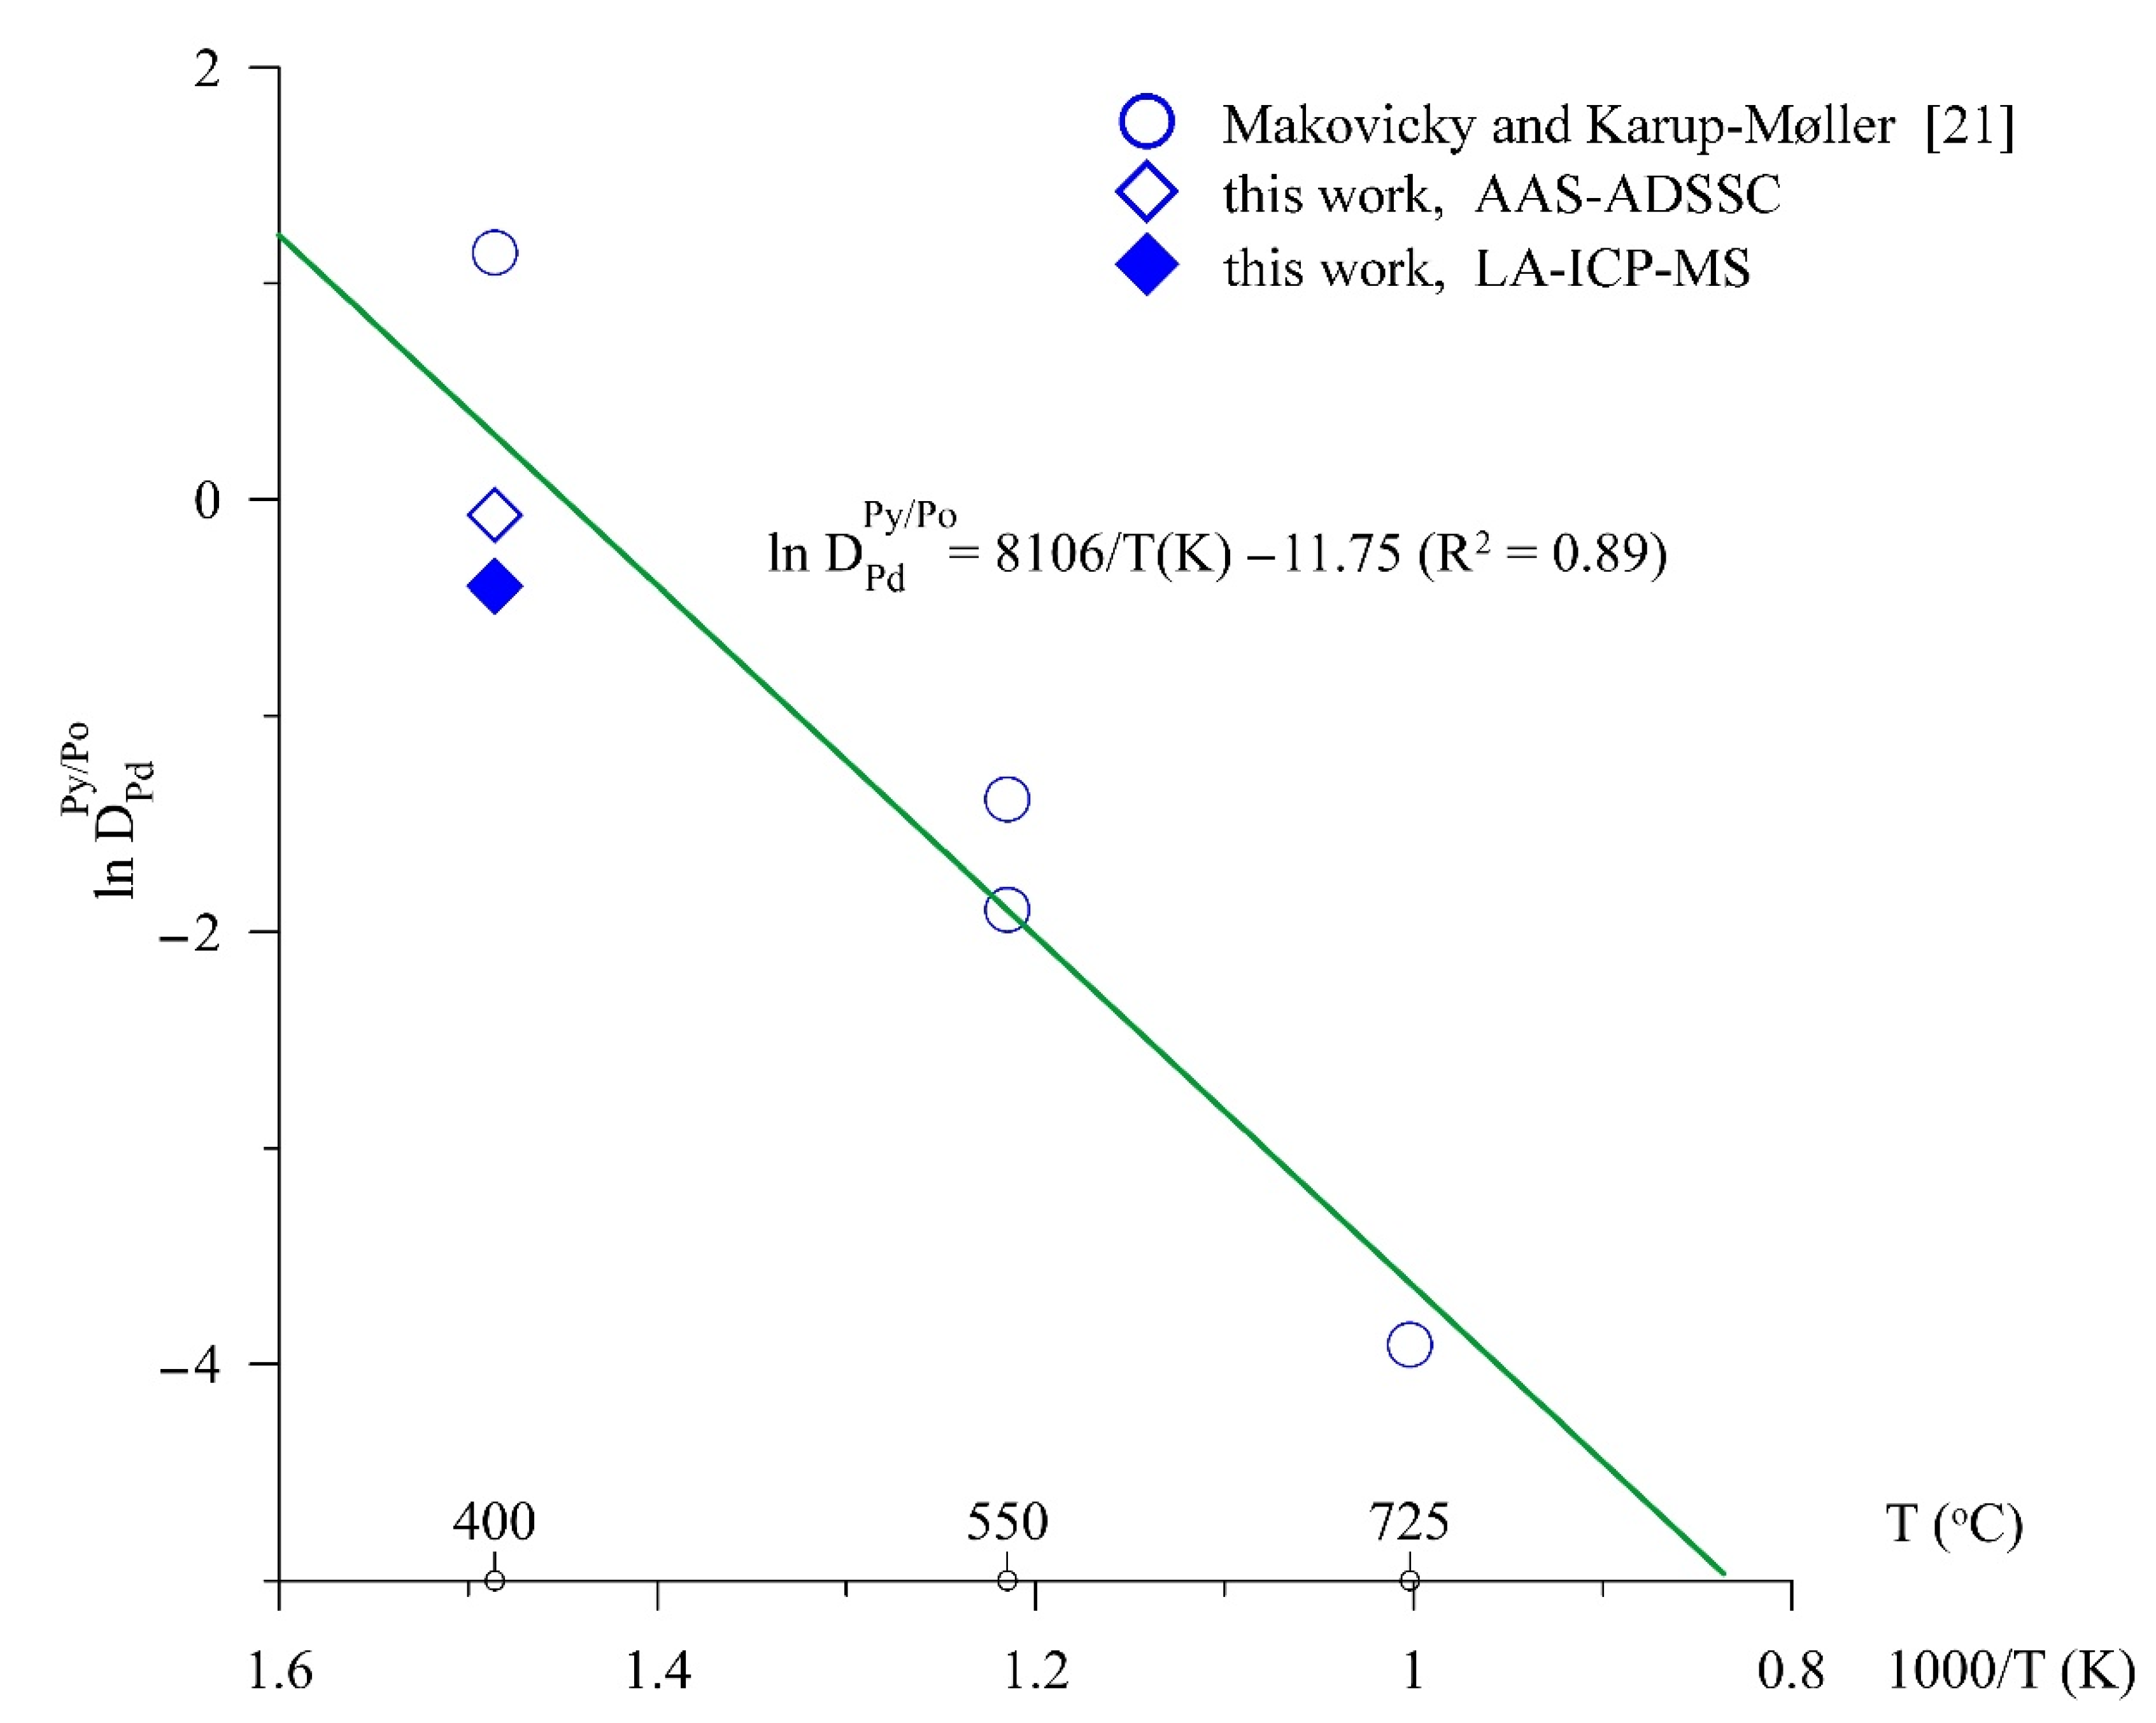
4.1.2. Fe–S–Pd
4.1.3. Fe–S–Cd
4.1.4. Fe–S–Mn
4.2. NAP Selectivity: Comparison of Experimental and Natural Data
5. Conclusions
Author Contributions
Funding
Data Availability Statement
Acknowledgments
Conflicts of Interest
References
- Bezmen, N.I.; Tikhomirova, V.I.; Kosogova, V.P. Pyrite-pyrrhotite geothermometer—Distribution of nickel and cobalt. Geokhimiya 1975, 5, 700–714. (In Russian) [Google Scholar]
- Tauson, V.L. Isomorphism and endocrypty: Novel approaches in studies of behavior of microelements in mineral systems. Geol. Geofiz. 1999, 40, 1488–1494. [Google Scholar]
- Vukmanovic, Z.; Reddy, S.M.; Godel, B.; Barnes, S.J.; Fiorentini, M.L.; Barnes, S.-J.; Kilburn, M.R. Relationship between microstructures and grain-scale trace element distribution in komatiite-hosted magmatic sulphide ores. Lithos 2014, 184–187, 42–61. [Google Scholar] [CrossRef]
- Craig, J.R.; Vokes, F.M. The metamorphism of pyrite and pyritic ores: An overview. Miner. Mag. 1993, 57, 3–18. [Google Scholar] [CrossRef]
- Tauson, V.L.; Lipko, S.V.; Arsent’ev, K.Y.; Smagunov, N.V. Crystal growth through the medium of nonautonomous phase: Implications for element partitioning in ore systems. Crystallogr. Rep. 2019, 64, 496–507. [Google Scholar] [CrossRef]
- Schmidt, O.; Fazan, T.A.; Morais, J.; Fecher, G.H. Microanalysis of the surfaces of natural iron-based minerals by means of synchrotron radiation based experimental techniques. Surf. Sci. 2001, 482–485, 568–573. [Google Scholar] [CrossRef]
- Tauson, V.L. The principle of continuity of phase formation at mineral surfaces. Dokl. Earth Sci. 2009, 425, 471–475. [Google Scholar] [CrossRef]
- Walker, A.T.; Evans, K.A.; Kirkland, C.L. A novel application of image analysis to interpret trace element distribution in magmatic sulfides. Lithos 2020, 362–363, 105451. [Google Scholar] [CrossRef]
- Tauson, V.L.; Akimov, V.V.; Parkhomenko, I.Y.; Nepomnyashchikh, K.V.; Men’shikov, V.I. A study of cadmium incorporation into pyrrhotites of various stoichiometries. Geokhimiya 2004, 42, 152–160. [Google Scholar]
- Tauson, V.L.; Lipko, S.V.; Smagunov, N.V.; Kravtsova, R.G. Trace element partitioning dualism under mineral-fluid interaction: Origin and geochemical significance. Minerals 2018, 8, 282. [Google Scholar] [CrossRef]
- Ikornikova, N.Y.; Egorov, V.M.; Vasenin, A.R. Experimental PTFC diagrams of aqueous solutions of ammonium chloride. Dokl. Akad. Nauk SSSR 1970, 192, 407–409. (In Russian) [Google Scholar]
- Tauson, V.L.; Bessarabova, O.I.; Kravtsova, R.G.; Pastushkova, T.M.; Smagunov, N.V. Determination of binding forms of gold in pyrite by means of statistical analysis. Rus. Geol. Geophys. 2001, 43, 56–64. [Google Scholar]
- Tauson, V.L.; Babkin, D.N.; Akimov, V.V.; Lipko, S.V.; Smagunov, N.V.; Parkhomenko, I.Y. Trace elements as indicators of the physicochemical conditions of mineral formation in hydrothermal sulfide systems. Rus. Geol. Geophys. 2013, 54, 526–543. [Google Scholar] [CrossRef]
- Tauson, V.L.; Lustenberg, E.E. Quantitative determination of modes of gold occurrence in minerals by the statistical analysis of analytical data samplings. Geochem. Int. 2008, 46, 423–428. [Google Scholar] [CrossRef]
- Lipko, S.; Tauson, V.; Bychinskii, V. Gold partitioning in a model multiphase mineral-hydrothermal fluid system: Distribution coefficients, speciation and segregation. Minerals 2020, 10, 890. [Google Scholar] [CrossRef]
- Tauson, V.L.; Parkhomenko, I.Y.; Babkin, D.N.; Men’shikov, V.I.; Lustenberg, E.E. Cadmium and mercury uptake by galena crystals under hydrothermal growth: A spectroscopic and element thermo-release atomic absorption study. Eur. J. Mineral. 2005, 17, 599–610. [Google Scholar] [CrossRef]
- Tauson, V.L.; Lipko, S.V.; Arsent’ev, R.Y.; Mikhlin, Y.L.; Babkin, D.N.; Smagunov, N.V.; Pastushkova, T.M.; Voronova, I.Y.; Belozerova, O.Y. Dualistic distribution coefficients of trace elements in the system mineral-hydrothermal solution. IV. Platinum and silver in pyrite. Geochem. Int. 2017, 55, 753–774. [Google Scholar] [CrossRef]
- Taylor, L.A. The system Ag-Fe-S: Phase equilibria and mineral assemblages. Miner. Depos. 1970, 5, 41–58. [Google Scholar] [CrossRef]
- Palyanova, G.; Kokh, K.; Seryotkin, Y. Transformation of pyrite to pyrrhotite in the presence of Au-Ag alloys at 500 °C. Am. Miner. 2016, 101, 2731–2737. [Google Scholar] [CrossRef]
- Pal’yanova, G.; Mikhlin, Y.; Kokh, K.; Karmanov, N. Experimental constrains on gold and silver solubility in iron sulfides. J. Alloys Compd. 2015, 649, 67–75. [Google Scholar] [CrossRef]
- Makovicky, E.; Karup-Møller, S. The system Pd-Fe-S at 900°, 725°, 550°, and 400 °C. Econ. Geol. 1993, 88, 1269–1278. [Google Scholar] [CrossRef]
- Ballhaus, C.; Ulmer, P. Platinum-group elements in the Merensky Reef: II. Experimental solubilities of platinum and palladium in Fe1-xS from 950 to 450 °C under controlled fS2 and fH2. Geochim. Cosmochim. Acta 1995, 59, 4881–4888. [Google Scholar] [CrossRef]
- Tauson, V.; Lipko, S.; Kravtsova, R.; Smagunov, N.; Belozerova, O.; Voronova, I. Distribution of “invisible” noble metals between pyrite and arsenopyrite exemplified by minerals coexisting in orogenic Au deposits of North-Eastern Russia. Minerals 2019, 9, 660. [Google Scholar] [CrossRef]
- Skinner, B.J.; Luce, F.D. Solid solutions of the type (Ca, Mg, Mn, Fe)S and their use as geothermometers for the enstatite chondrites. Am. Miner. 1971, 56, 1269–1296. [Google Scholar]
- Kravtsova, R.G.; Tauson, V.L.; Makshakov, A.S.; Bryansky, N.V.; Smagunov, N.V. Platinum group elements in arsenopyrites and pyrites of the Natalkinskoe gold deposit (Northeastern Russia). Minerals 2020, 10, 318. [Google Scholar] [CrossRef] [Green Version]


| Mineral | Number of Cryst. (Starting- Final Sample) | Characteristics of the Final Sample | TE Contents ** | ||||||||
|---|---|---|---|---|---|---|---|---|---|---|---|
| Num. of Cryst. | Range of Mass. (mg) | (mg) | (mm) | (mm2/ mg)) | (µg/g) * | ||||||
| Ag, µg/g 10−2 | |||||||||||
| Pyrite | 40–27 | 7 | 0.24–0.77 | 0.47 | 0.455 | 2.643 | 56.7 ± 17.9 | 27.4 | 21.3 | 4.3 | 17.0 |
| 7 | 0.81–1.37 | 1.07 | 0.598 | 2.005 | 34.1 ± 9.3 | ||||||
| 6 | 1.48–1.82 | 1.70 | 0.698 | 1.720 | 22.2 ± 5.5 | ||||||
| 7 | 2.10–8.41 | 4.61 | 0.973 | 1.232 | 14.4 ± 4.1 | ||||||
| Pyrrhotite | 63–38 | 6 | 0.25–0.65 | 0.56 | 0.493 | 2.604 | 31.2 ± 18.9 | 28.3 | 9.9 | 0.36 | 9.4 |
| 7 | 0.72–1.01 | 0.91 | 0.581 | 2.226 | 32.0 ± 10.1 | ||||||
| 5 | 1.03–1.48 | 1.29 | 0.652 | 1.977 | 15.9 ± 10.5 | ||||||
| 8 | 1.51–1.86 | 1.73 | 0.719 | 1.793 | 7.8 ± 1.9 | ||||||
| 5 | 1.87–2.51 | 2.33 | 0.794 | 1.623 | 4.3 ± 1.2 | ||||||
| 7 | 2.54–5.80 | 4.59 | 0.996 | 1.297 | 4.7 ± 1.4 | ||||||
| Pd, µg/g | |||||||||||
| Pyrite | 40–28 | 6 | 0.24–0.77 | 0.60 | 0.493 | 2.431 | 95 ± 32 | 32 | 28 | 1.6 | 26 |
| 7 | 0.81–1.32 | 0.99 | 0.583 | 2.060 | 55 ± 9 | ||||||
| 8 | 1.36–1.82 | 1.69 | 0.697 | 1.725 | 30 ± 4 | ||||||
| 7 | 2.10–8.41 | 4.54 | 0.968 | 1.238 | 13 ± 3 | ||||||
| Pyrrhotite | 54–41 | 9 | 0.25–0.72 | 0.54 | 0.488 | 2.646 | 110 ± 25 | 36 | 32 | 1.6 | 32 |
| 7 | 0.80–1.01 | 0.93 | 0.585 | 2.208 | 45 ± 13 | ||||||
| 9 | 1.03–0.94 | 1.30 | 0.654 | 1.974 | 38 ± 6 | ||||||
| 9 | 1.58–1.87 | 1.72 | 0.718 | 1.798 | 36 ± 4 | ||||||
| 7 | 1.92–5.80 | 3.81 | 0.936 | 1.380 | 13 ± 5 | ||||||
| Cd, µg/g 10−2 | |||||||||||
| Pyrite | 40–22 | 6 | 0.24–0.77 | 0.55 | 0.479 | 2.503 | 9.4 ± 5.9 | 11.3 | 3.4 | 0.5 | 2.8 |
| 5 | 0.81–1.37 | 1.06 | 0.596 | 2.011 | 3.8 ± 2.4 | ||||||
| 5 | 1.48–1.82 | 1.72 | 0.701 | 1.714 | 5.6 ± 4.5 | ||||||
| 6 | 2.10–8.41 | 4.72 | 0.981 | 1.223 | 1.8 ± 1.2 | ||||||
| Pyrrhotite | 63–40 | 8 | 0.25–0.65 | 0.51 | 0.479 | 2.699 | 0.42 ± 0.12 | 1.09 | 0.33 | n/d | |
| 6 | 0.72–1.01 | 0.89 | 0.576 | 2.237 | 0.40 ± 0.23 | ||||||
| 5 | 1.03–1.48 | 1.33 | 0.659 | 1.959 | 0.31 ± 0.13 | ||||||
| 8 | 1.51–1.86 | 1.70 | 0.715 | 1.804 | 0.41 ± 0.16 | ||||||
| 7 | 1.87–2.51 | 2.20 | 0.779 | 1.655 | 0.45 ± 0.21 | ||||||
| 6 | 2.54–5.80 | 4.25 | 0.970 | 1.328 | 0.22 ± 0.12 | ||||||
| Mn, µg/g 10−2 | |||||||||||
| Pyrite | 40–25 | 5 | 0.24–0.77 | 0.52 | 0.470 | 2.549 | 10.8 ± 6.5 | 12.1 | 7.1 | 3.04 | 3.8 |
| 8 | 0.81–1.37 | 1.10 | 0.604 | 1.990 | 8.4 ± 1.8 | ||||||
| 5 | 1.48–1.82 | 1.72 | 0.701 | 1.714 | 10.6 ± 5.2 | ||||||
| 7 | 2.10–8.41 | 4.26 | 0.948 | 1.266 | 4.9 ± 1.4 | ||||||
| Pyrrhotite | 63–56 | 10 | 0.25–0.65 | 0.53 | 0.485 | 2.663 | 41.5 ± 4.0 | 40.9 | 40.2 | n/d | |
| 10 | 0.72–1.01 | 0.89 | 0.576 | 2.237 | 39.7 ± 1.6 | ||||||
| 9 | 1.03–1.48 | 1.21 | 0.638 | 2.018 | 38.8 ± 4.2 | ||||||
| 11 | 1.51–1.86 | 1.70 | 0.715 | 1.804 | 40.9 ± 3.7 | ||||||
| 8 | 1.87–2.51 | 2.16 | 0.775 | 1.668 | 39.8 ± 1.4 | ||||||
| 8 | 2.54–5.80 | 4.38 | 0.980 | 1.316 | 40.4 ± 1.2 | ||||||
| Element | Pyrite | Pyrrhotite | ||||||||||
|---|---|---|---|---|---|---|---|---|---|---|---|---|
| µg/g | at% | µg/g | at% | µg/g | at% | µg/g | at% | wt | at | wt | at | |
| Ag | 430 | 1.59·10−2 | 1700 | 6.31·10−2 | 36 | 1.44·10−3 | 940 | 3.76·10−2 | 11.9 | 11 | 1.8 | 1.7 |
| Pd | 1.6 | 6.01·10−5 | 26 | 9.77·10−4 | 1.6 | 6.48·10−5 | 32 | 1.3·10−3 | 1 | 0.9 | 0.8 | 0.8 |
| Cd | 50 | 1.78·10−3 | 280 | 9.96·10−3 | 33 | 1.26·10−3 | n/d * | 1.5 | 1.4 | n/d | ||
| Mn | 304 | 2.21·10−2 | 380 | 2.77·10−2 | 4020 | 0.315 | n/d | 0.08 | 0.07 | n/d | ||
| Element | Pyrite | Pyrrhotite | ||||||||||
|---|---|---|---|---|---|---|---|---|---|---|---|---|
| µg/g | at% | µg/g | at% | µg/g | at% | µg/g | at% | wt | at | wt | at | |
| Ag | 390 | 1.45·10−2 | 750 | 2.78·10−2 | 26 | 1.04·10−3 | 200 | 7.99·10−3 | 15 | 13.9 | 3.8 | 3.5 |
| Pd | 0.8 | 3·10−5 | 12 | 4.51·10−4 | 1.1 | 4.46·10−5 | 20 | 8.1·10−4 | 0.7 | 0.7 | 0.6 | 0.6 |
| Cd | 29 | 1.03·10−3 | 230 | 8.18·10−3 | 45 | 1.73·10−3 | 120 | 4.6·10−3 | 0.6 | 0.6 | 1.9 | 1.8 |
| Mn | 290 | 2.11·10−2 | 350 | 2.55·10−2 | 4200 | 0.329 | 4440 | 0.348 | 0.07 | 0.06 | 0.08 | 0.07 |
| Method | Mode and Concentration of Cd, µg/g | |||||
|---|---|---|---|---|---|---|
| Structural | Surficial | Str/Sur | ||||
| Py | Po | Py | Po | Py | Po | |
| AAS–ADSSC | 50 | 33 | 280 | n/d | 0.18 | n/d |
| LA-ICP-MS | 29 | 45 | 230 | 120 | 0.13 | 0.38 |
| ETR–AAS | 32 | 50 | 290 | 140 | 0.11 | 0.36 |
| Method | Mineral | Element | S * |
|---|---|---|---|
| AAS–ADSSC | Pyrite | Ag | 4.0 |
| Pd | 16.2 | ||
| Cd | 5.6 | ||
| Mn | 1.2 | ||
| Pyrrhotite | Ag | 26.1 | |
| Pd | 20.0 | ||
| LA-ICP-MS | Pyrite Pyrrhotite | Ag | 1.9 |
| Pd | 15.0 | ||
| Cd | 7.9 | ||
| Mn | 1.2 | ||
| Ag | 7.7 | ||
| Pd | 18.2 | ||
| Cd | 2.7 | ||
| Mn | 1.1 | ||
| ETR–AAS | Pyrite | Cd | 9.1 |
| Pyrrhotite | Cd | 2.8 |
| Element | S | Experimental Conditions | Source of Data |
|---|---|---|---|
| Ag | 5.2 10.4 8.7 3.6 | 500 °C, 1 kbar, NH4Cl-based solutions, growth rate ~0.03–0.09 mm/day | Reference [17] |
| Ag | 3.0 * | 400 °C, 1 kbar, 10% NH4Cl, growth rate ~0.02–0.04 mm/day | This work |
| Pd | 15.6 * | The same | This work |
| Deposit | Sample no. | S * | Reference | |
|---|---|---|---|---|
| Ag | Pd | |||
| Natalkinskoe | Nat-10 | 18.3 | 4.5 | [23] |
| The same | UV-3/13 | 1.8 | 18.4 | “ |
| “ | TPM-1/1 | n/d | 15.6 | [25] |
| “ | M-161/10 | “ | 11.9 | “ |
| Degdekan | DG-10/14 | 1.7 | 6.8 | [23] |
| “ | M-163/10 | n/d | 7.5 | [10] |
| Zolotaya Rechka | ZR-10/13 | 6.4 | 9.4 | [23] |
Publisher’s Note: MDPI stays neutral with regard to jurisdictional claims in published maps and institutional affiliations. |
© 2022 by the authors. Licensee MDPI, Basel, Switzerland. This article is an open access article distributed under the terms and conditions of the Creative Commons Attribution (CC BY) license (https://creativecommons.org/licenses/by/4.0/).
Share and Cite
Lipko, S.; Tauson, V.; Smagunov, N.; Babkin, D.; Parkhomenko, I. Distribution of Trace Elements (Ag, Pd, Cd, and Mn) between Pyrite and Pyrrhotite and Selectivity of Surficial Nonautonomous Phases in a Hydrothermal System. Minerals 2022, 12, 1165. https://doi.org/10.3390/min12091165
Lipko S, Tauson V, Smagunov N, Babkin D, Parkhomenko I. Distribution of Trace Elements (Ag, Pd, Cd, and Mn) between Pyrite and Pyrrhotite and Selectivity of Surficial Nonautonomous Phases in a Hydrothermal System. Minerals. 2022; 12(9):1165. https://doi.org/10.3390/min12091165
Chicago/Turabian StyleLipko, Sergey, Vladimir Tauson, Nikolay Smagunov, Dmitriy Babkin, and Irina Parkhomenko. 2022. "Distribution of Trace Elements (Ag, Pd, Cd, and Mn) between Pyrite and Pyrrhotite and Selectivity of Surficial Nonautonomous Phases in a Hydrothermal System" Minerals 12, no. 9: 1165. https://doi.org/10.3390/min12091165