Article

Experimental Study and Numerical Simulation on Dust Concentration Distribution of Chute at Enclosed Stockyard of Steel Works

School of Metallurgical Engineering, Anhui University of Technology, Ma’anshan 243032, China
*
Author to whom correspondence should be addressed.
Minerals 2022, 12(9), 1164; https://doi.org/10.3390/min12091164
Submission received: 1 August 2022 / Revised: 10 September 2022 / Accepted: 11 September 2022 / Published: 15 September 2022
(This article belongs to the Topic Iron Concentrate Particles)

Abstract

:
To clarify the dust concentration distribution of chute at the enclosed stockyard in steel works during the discharging process of materials, the experimental model based on the similarity principle was established in the laboratory, and the effects of the moisture content of materials, the height of chute, as well as the discharging amount of materials on the dust concentration of the selected four materials (MLG-S, ONM-N-F, MLC-N, and ONM-N) were experimentally investigated. Simultaneously, the dust concentration distribution and the motion trajectory of particles were numerically simulated by FLUENT software based on the gas-solid two-phase flow theory. The results showed that a large amount of dust are generated during the discharging process of materials at the enclosed stockyard, and the dust concentration is negatively depended on the moisture content of materials, while that is positively correlated with the height of chute. As the height of chute is increased from 2.2 m to 3.1 m, the concentration of dust generated by the MLG-S is accelerated from 7335.1 mg/m3 to 8881.1 mg/m3, and the concentration of dust produced by the ONM-N is increased from 1286.7 mg/m3 to 1964.3 mg/m3. Meanwhile, the higher dust concentration is from the materials with smaller particle sizes and more fine particles. Furthermore, the dust concentration in the chute space is gradually increased from the top to the bottom, and the bottom of the chute is the key area for controlling dust pollution.

1. Introduction

Currently, environmental pollution problems, such as industrial dust pollution, global warming, atmospheric pollution, etc., have become increasingly severe and drawn sufficient concern. The steel industry is one of the most seriously polluted and energy-intensive industries all over the world since substantial amounts of fossil fuel are consumed [1,2,3]. Among the pollution, the dust pollution of raw materials sited in steel works is considered to be one of the key issues [4]. A comprehensive stockyard is an indispensable sector of a steel plant, which is mainly used to stockpile and treat the raw materials, such as iron ore, sinter, pellet, coal, and coke [5]. The traditional comprehensive stockyard is an open-air depot, which has been widely utilized in steel works [6]. However, due to the serious dust pollution, the open-air depots have been gradually transformed into the enclosed stockyards [7]. Since the belt conveyor has a certain initial velocity and the drop height of chute is large, the surrounding air is driven by the rapid downward movement of raw materials in the chute, leading to the generation of induced airflow. As a result, the dust particles mingled in the raw materials are out of the motion trail and diffuse into the air under the negative pressure caused by the induced airflow, which contributes to the serious dust pollution of the surrounding environment [8]. The dust particles with a larger size descend under the action of gravity, which can increase the machine wear and reduce the service life of the machine. The fine particle dust float in the air for a long time, endangering the physical and mental health of workers, and even causing dust explosions [9].
Nowadays, some progress has been made on the motion behavior of dust particles, especially on the diffusion of dust particles at the working faces of comprehensive mechanized coal mining, high raise, and transferring chute. Ma et al. [10] investigated the diffusion behaviors and the motion trajectories of dust particles in a small space, and the results provided a theoretical basis for the dust treatment at the transfer point. However, since the airflow at the transfer point is generally in a turbulent state, it is difficult to describe the diffusion law of all particles. Hou et al. [11] researched the dust concentration distribution of the comprehensive mining face by the field test and numerical simulation, and found that the priority scope of dust removal in the roadway are in the region of the windward side, and the zone of driving face. Chen et al. [12] studied the effects of the structure of transferring chutes on the reduction of dust emission, and the test results are consistent with the CFD simulation, which verify that the CFD simulation can be used to qualitatively evaluate the performance of transferring chute in terms of dust emission. Donohue et al. [13] investigated the motion behaviors of dust diffusion in the transferring chute through the DEM-CFD model. The porosity of dust was firstly conducted through the DEM simulation, and then the simulation results were substituted into the CFD model to calculate the flow state of gas in the transferring chute. However, the influence of dust particles on the gas velocity is not dynamically reflected, so the model has low practicability. In this work, the dust concentration distribution of chute at an enclosed stockyard of a steel works in China was systemically investigated. Firstly, an experimental facility was established under laboratory conditions to simulate the actual chute according to the similarity principle. Afterwards, the effects of materials moisture content, the height of chute, and the discharging amount of materials on the diffusion behaviors of dust were experimentally studied. Furthermore, the distribution law and motion trajectory of dust particles in the chute were numerically simulated by FLUENT software based on the experimental results. This work could provide theoretical support for solving the dust pollution of chutes at an enclosed stockyard of steel works.

2. Experimental and Simulation
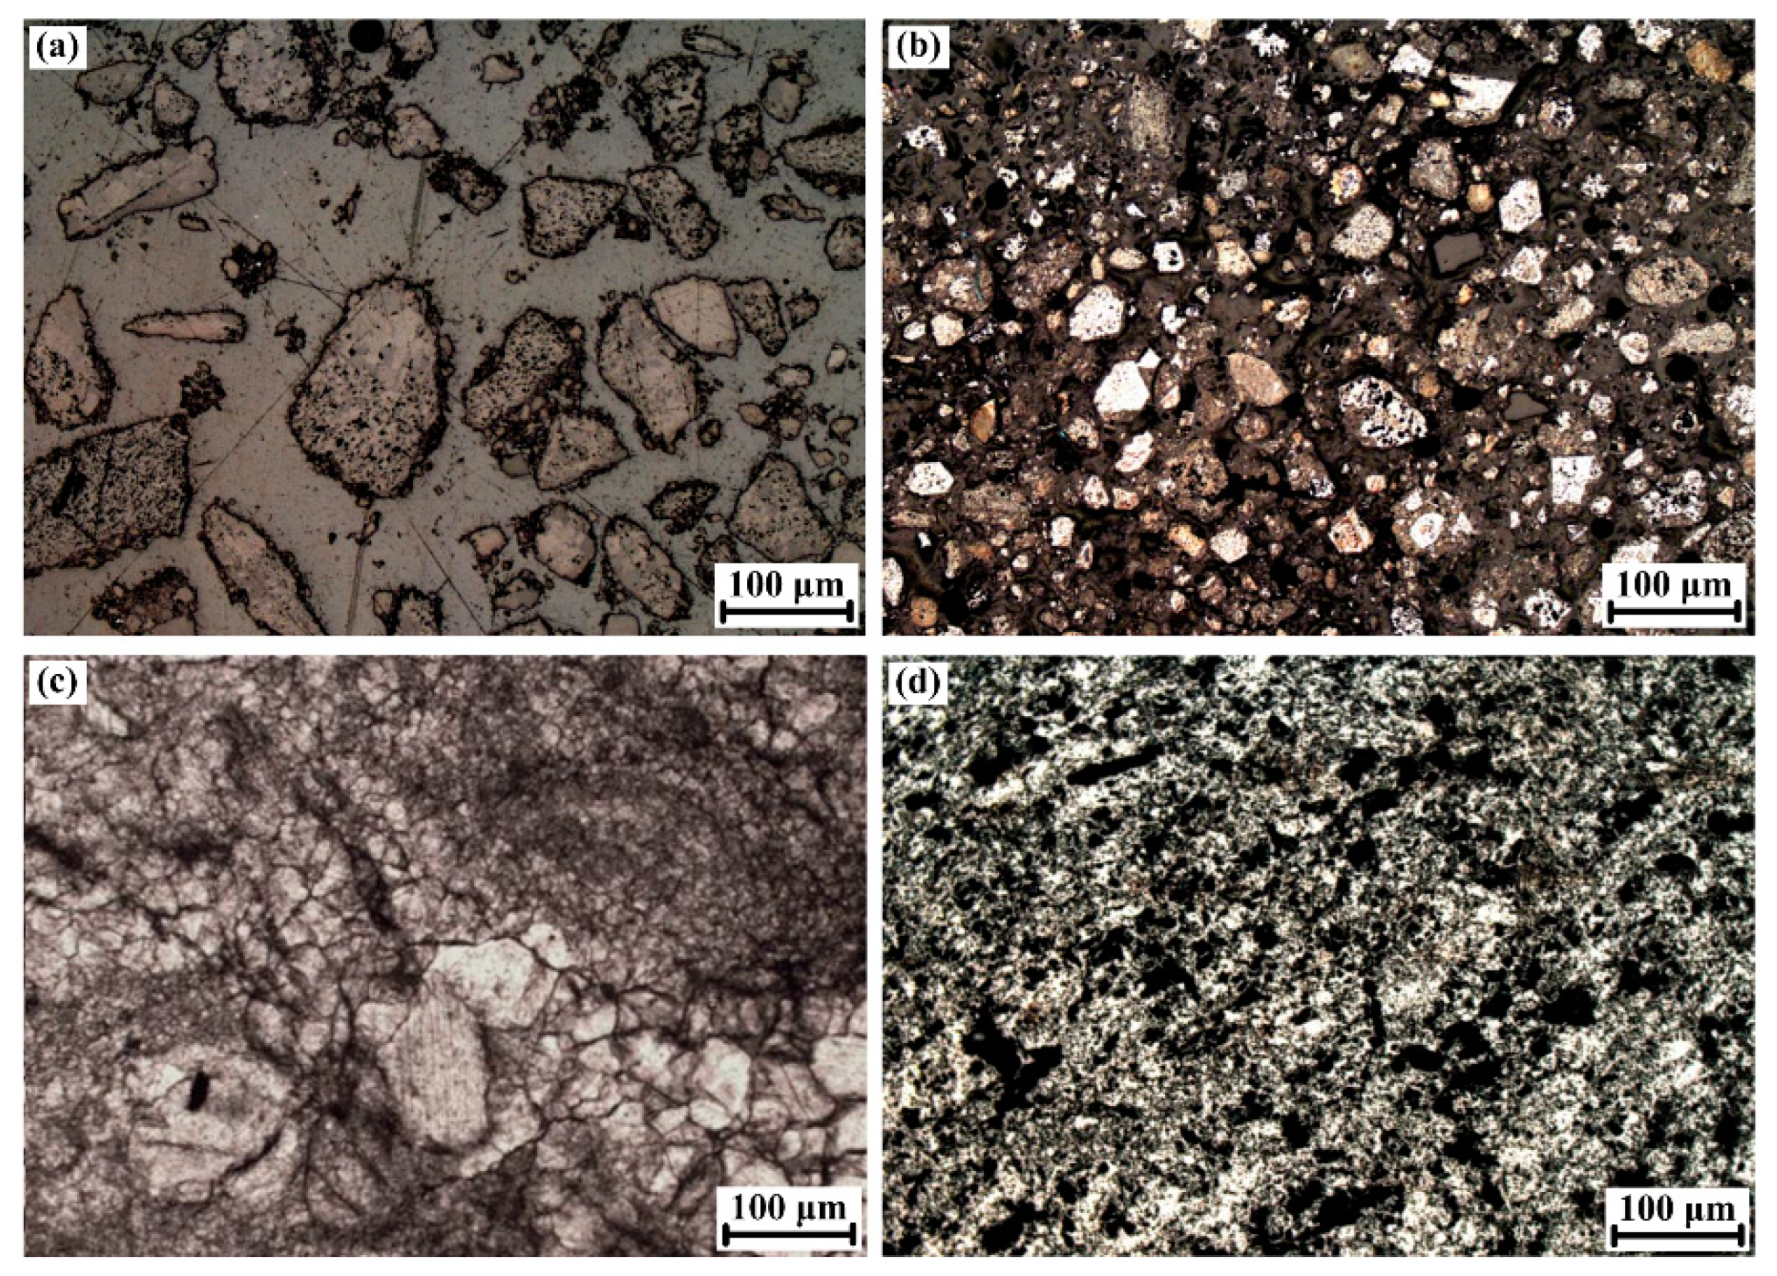
2.1. Raw Materials

The raw materials used in the tests include powdery materials and lumpy materials, which are from a steel plant in China. The powdery materials mainly consist of limestone powder (MLG-S) and screening powder of lump ore (ONM-N-F). The lump materials are mainly comprised of limestone (MLC-N) and lump ore (ONM-N). The selected four materials samples were treated by sorting, coarse screening, and fine screening. Afterwards, the size distributions of materials can be determined, as listed in Table 1. Clearly, 65.6% of the MLG-S particles are concentrated in the range of 0.50–0.85 mm, and 65.4% of the ONM-N-F particles are distributed in the range of 0.85–8.00 mm, which indicates that the size of ONM-N-F is slightly larger than that of MLG-S. Furthermore, 57.5% of the MLC-N particles are greater than 25 mm, while 45.4% of the ONM-N particles are distributed from 10.00 mm to 25.00 mm, suggesting that the size of ONM-N is slightly less than that of MLC-N.
In addition, the optical microstructures of the above selected four materials are shown in Figure 1. It can be seen from Figure 1a that the mineral composition of MLG-S is mainly calcite, containing a small amount of dolomite and quartz, and that the particles of MLG-S are irregular and different in size. In the meanwhile, the mineral composition of ONM-N-F is mainly hematite, containing a small amount of limonite, which is an irregular shape, as seen in Figure 1b. Furthermore, the main mineral of MLC-N is calcite, which presents a dense and massive microstructure, as presented in Figure 1c. Besides, the minerals of ONM-N are mainly composed of hematite and a small amount of quartz and kaolinite, and the microstructure of particles is dense, as shown in Figure 1d.

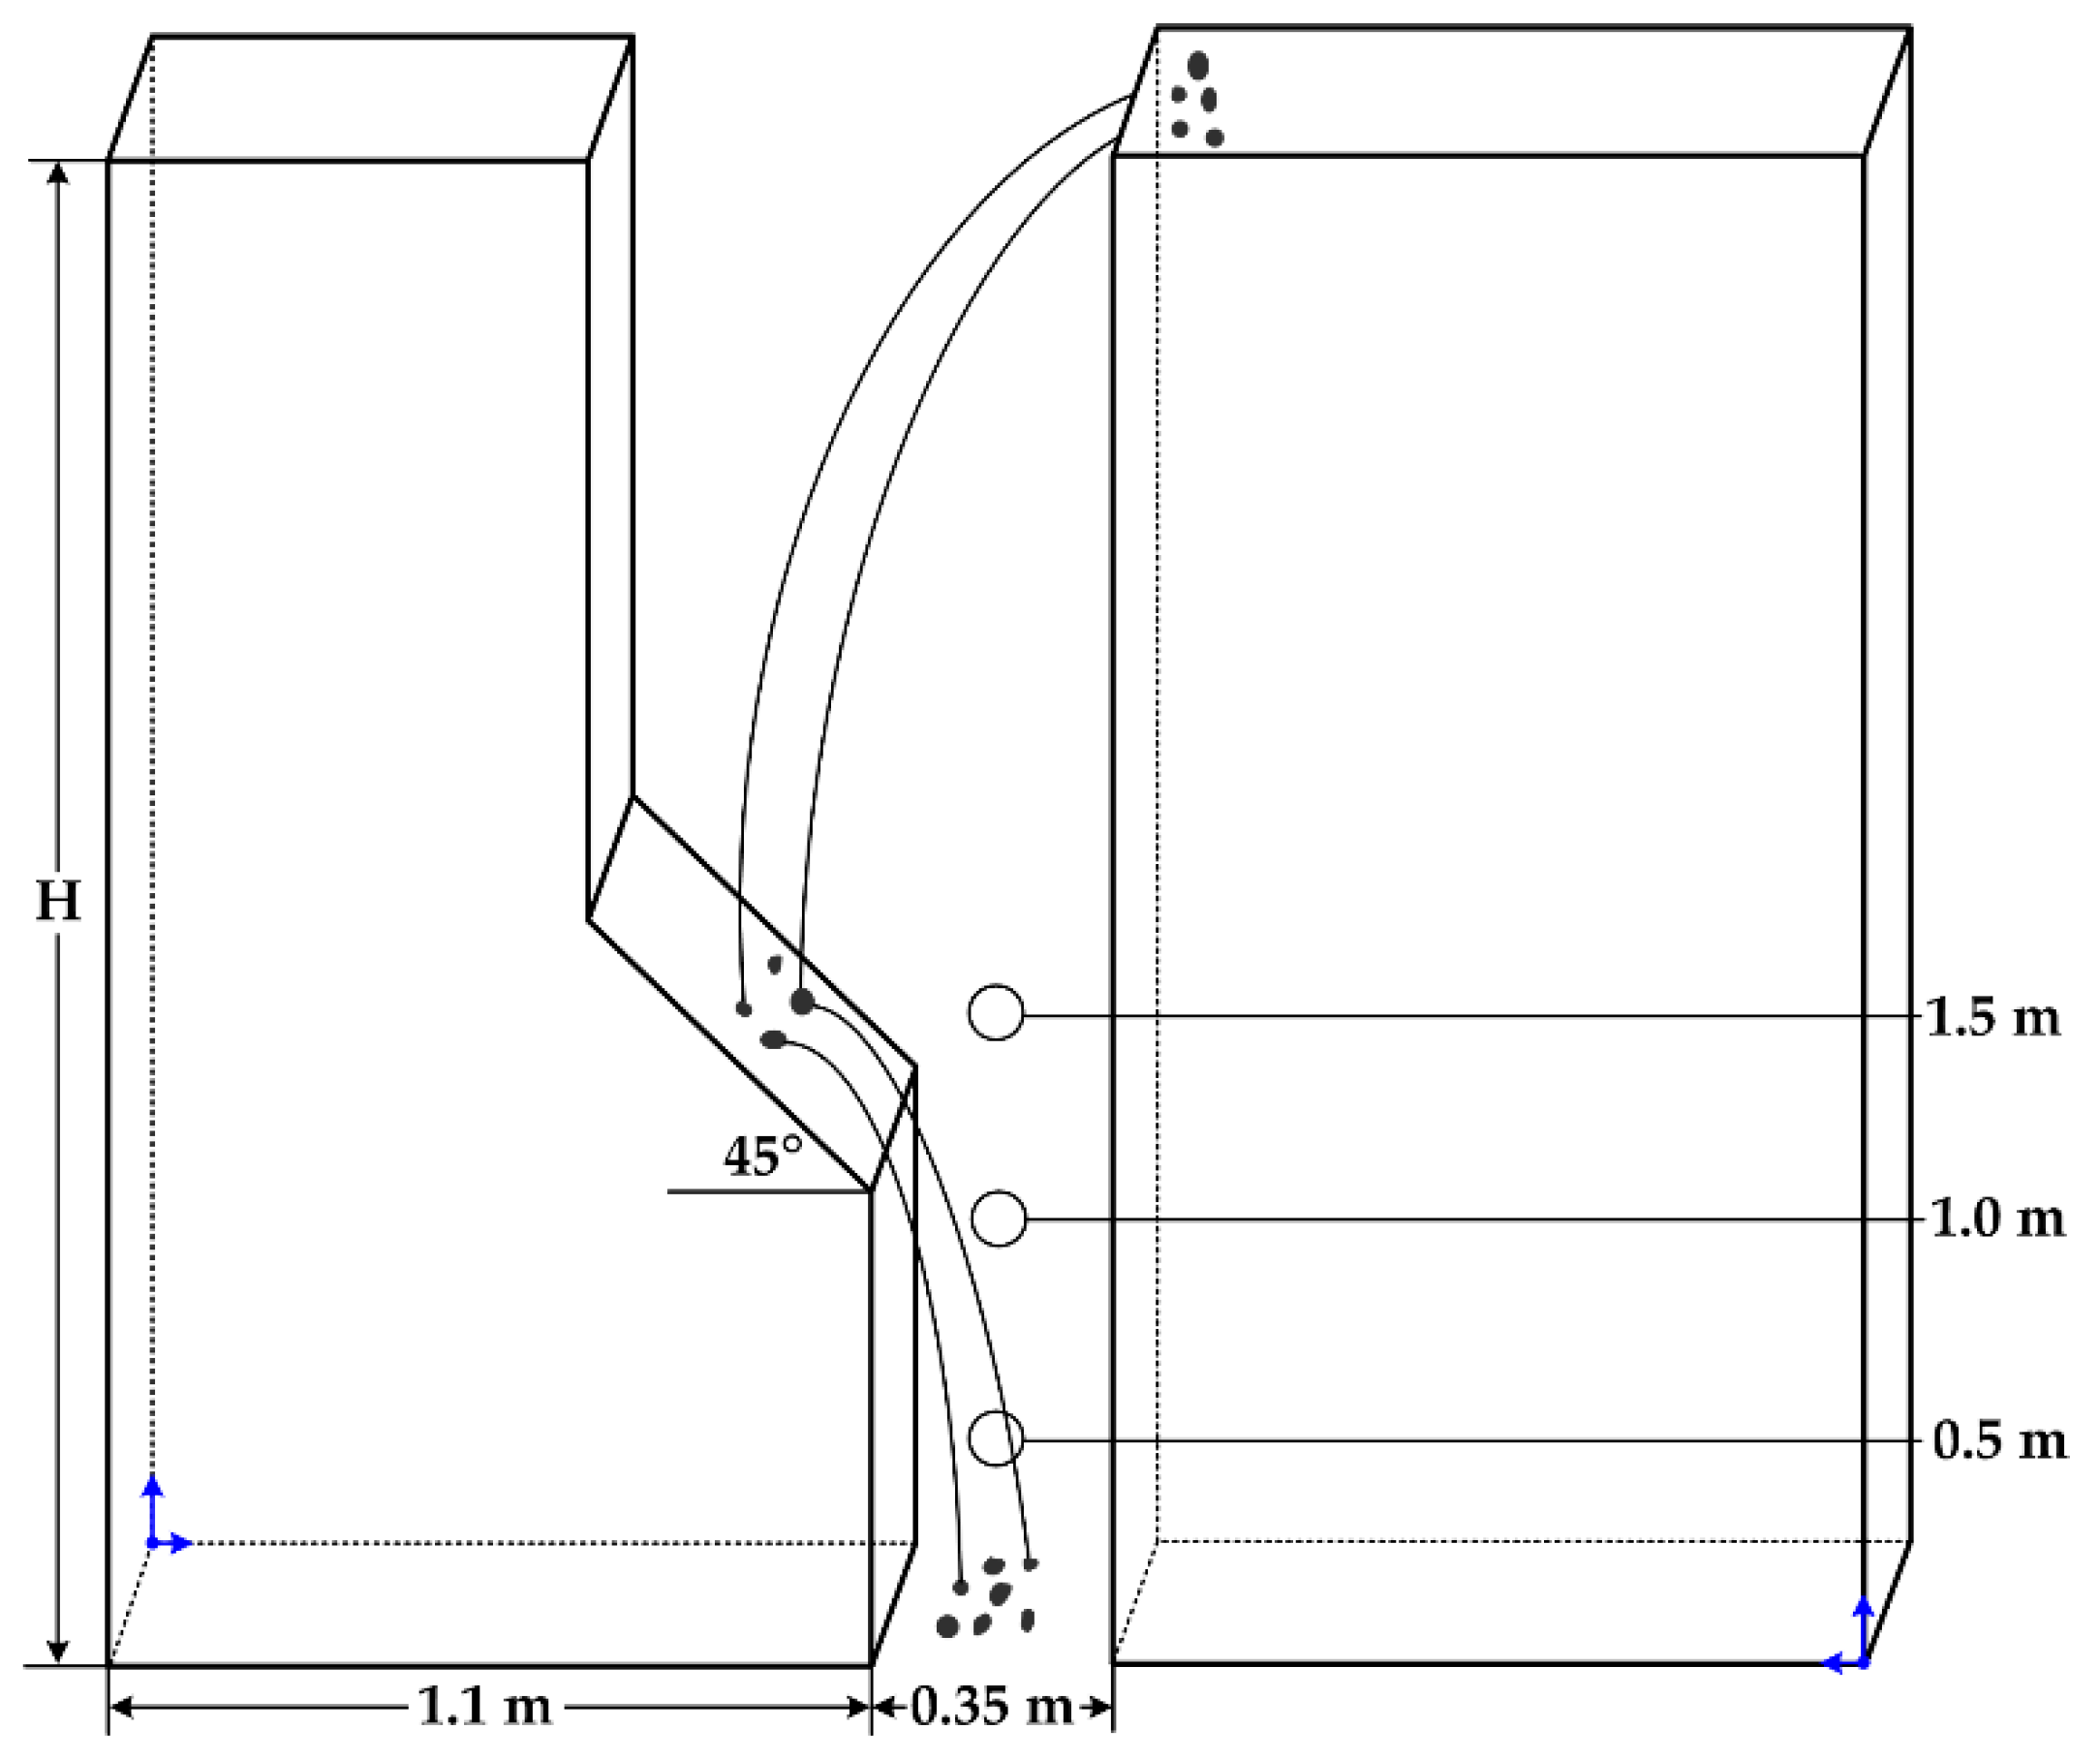
2.2. Experimental Facility and Scheme

The experimental device was set up to simulate the actual chute of a steel works in China, and the design size of the device was theoretically calculated according to the discharging capacity and the stacking method, as seen in Figure 2.
The effects of the moisture content of materials, the discharging amount of materials, and the height of chute on the dust concentration were carried out in the above experimental chute and the experimental scheme is listed in Table 2. According to the previous research, when the moisture content is up to a certain value, the dust concentration is less than 50 mg/m3 during the discharging process of materials, which is defined as the critical moisture. In this work, the critical moistures of MLG-S, ONM-N-F, MLC-N, and ONM-N are 3.0%, 5.0%, 1.8%, and 4.0%, respectively. Thus, the different ranges of moisture content are selected for different materials, as seen in Table 2. Furthermore, the heights of experimental chute (H in Figure 2) in the tests are employed as 2.2 m, 2.5 m, and 3.1 m, which are calculated according to the geometric similarity theory and the laboratory conditions. Simultaneously, when the effects of moisture content on the dust concentration were carried out, the other conditions such as the height of chute and the discharge amount of materials were kept constant, which is also done when considering other influencing factors, as seen in Table 2. Meanwhile, considering the generation mechanism and concentration of dust at different heights are different during the discharging process, the measuring points of dust concentration are arranged at 0.5 m, 1.0 m, and 1.5 m from the bottom of the chute respectively, as shown in Figure 2. During the tests, a certain volume of dust-containing air was extracted by a rotary-vane vacuum pump through a known weight chlorinated polyvinyl chloride (CPVC) fiber membrane filter. Thus, the dust particles in the air were kept on the CPVC. The concentration of dust (Cd) can be conducted according to the gas production and the weight difference of the CPVC before and after sampling, which is shown in Equation (1). In addition, each test was repeated twice and the average values of two experimental results were taken as the final results. The difference between the two results and the average was considered to be the experimental error.
C d = m 2 - m 1 Q × t × 1000
where, m2 is the weight of the CPVC after sampling and m1 is the weight of the CPVC before sampling, mg; Q is the gas flow rate, which is approximately 0.03 m3/min, and t is the sampling time, min.

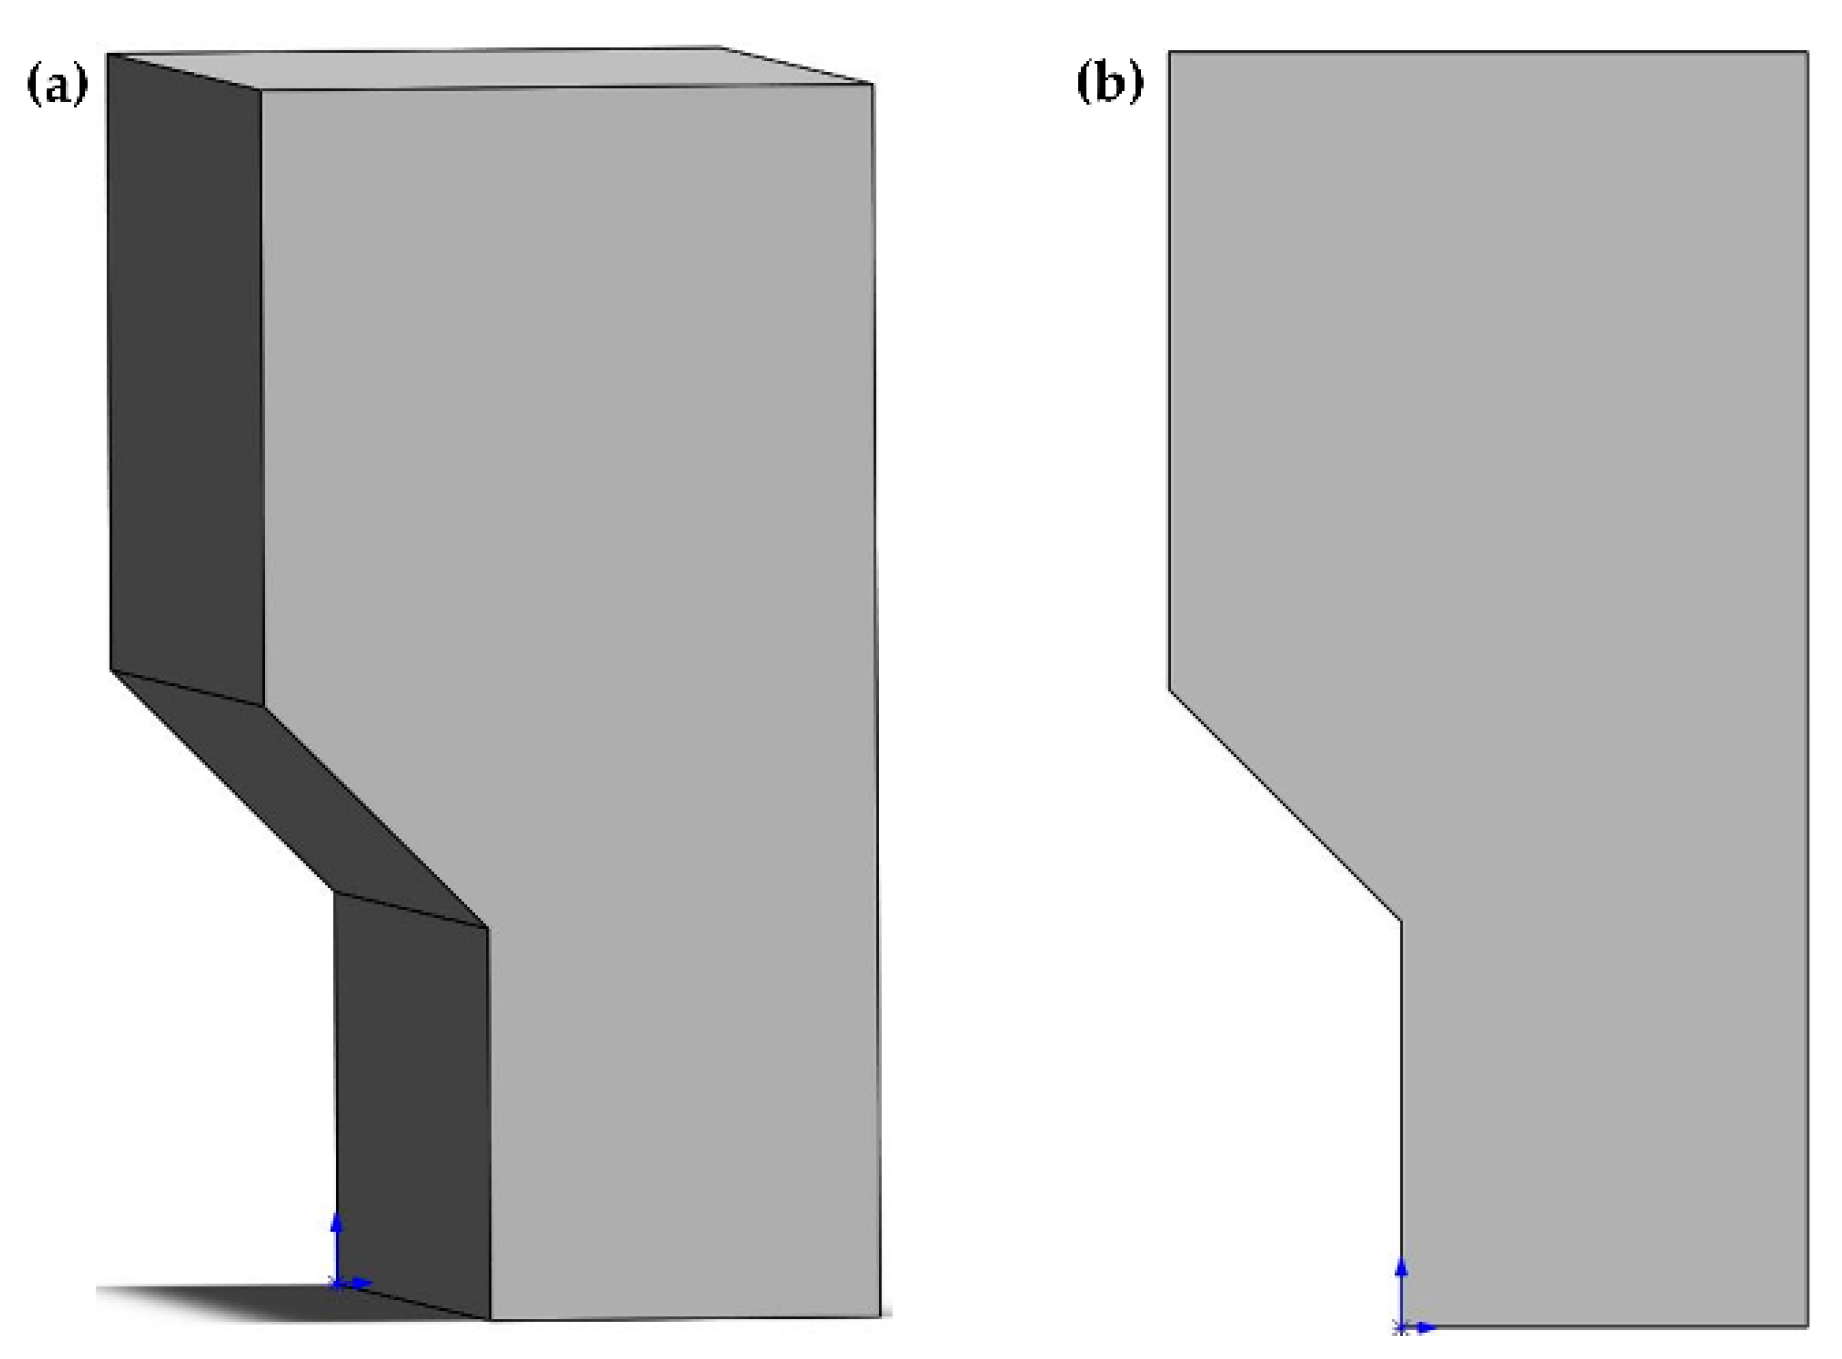
2.3. Simulation Model and Scheme

Based on the experimental results, the concentration distribution of dust and the motion trajectory of particles in the experimental chute were numerically simulated by FLUENT software. According to the actual conditions, some assumptions were proposed in the simulation model. Firstly, the turbulent viscosity of a fluid is isotropic. Secondly, the airflow in the chute is incompressible and conforms to the Boussinesq hypothesis. Thirdly, the chute wall is smooth and airtight. Finally, no other force is considered except the effect of gravity.
The motion of dust particles in the chute essentially belongs to the gas-solid two-phase flow [14,15]. The FLUENT software based on computational fluid dynamics (CFD) was used to simulate the motion of dust particles, and the discrete phase model (DPM) was adopted. Simultaneously, the interaction between the dust particles was ignored, and only the effects of the flow field on the dust particles were considered. In addition, the height of chute is determined as 2.2 m and the discharging amount of materials is kept at 17 kg/s. The continuous phase of the fluid is air with a density of 1.293 kg/m3, and the discrete phases are the MLG-S and the MLC-N with a density of 2750 kg/m3. The three-dimensional model and the simulated section of the chute are shown in Figure 3. During the discharging process, the materials were charged into the chute from the upper side. After that, most of the materials fell on the sloping baffle and rebound to the ground subsequently producing the dust, while part of the materials directly fell on the ground to generate the dust.

3. Results and Discussion

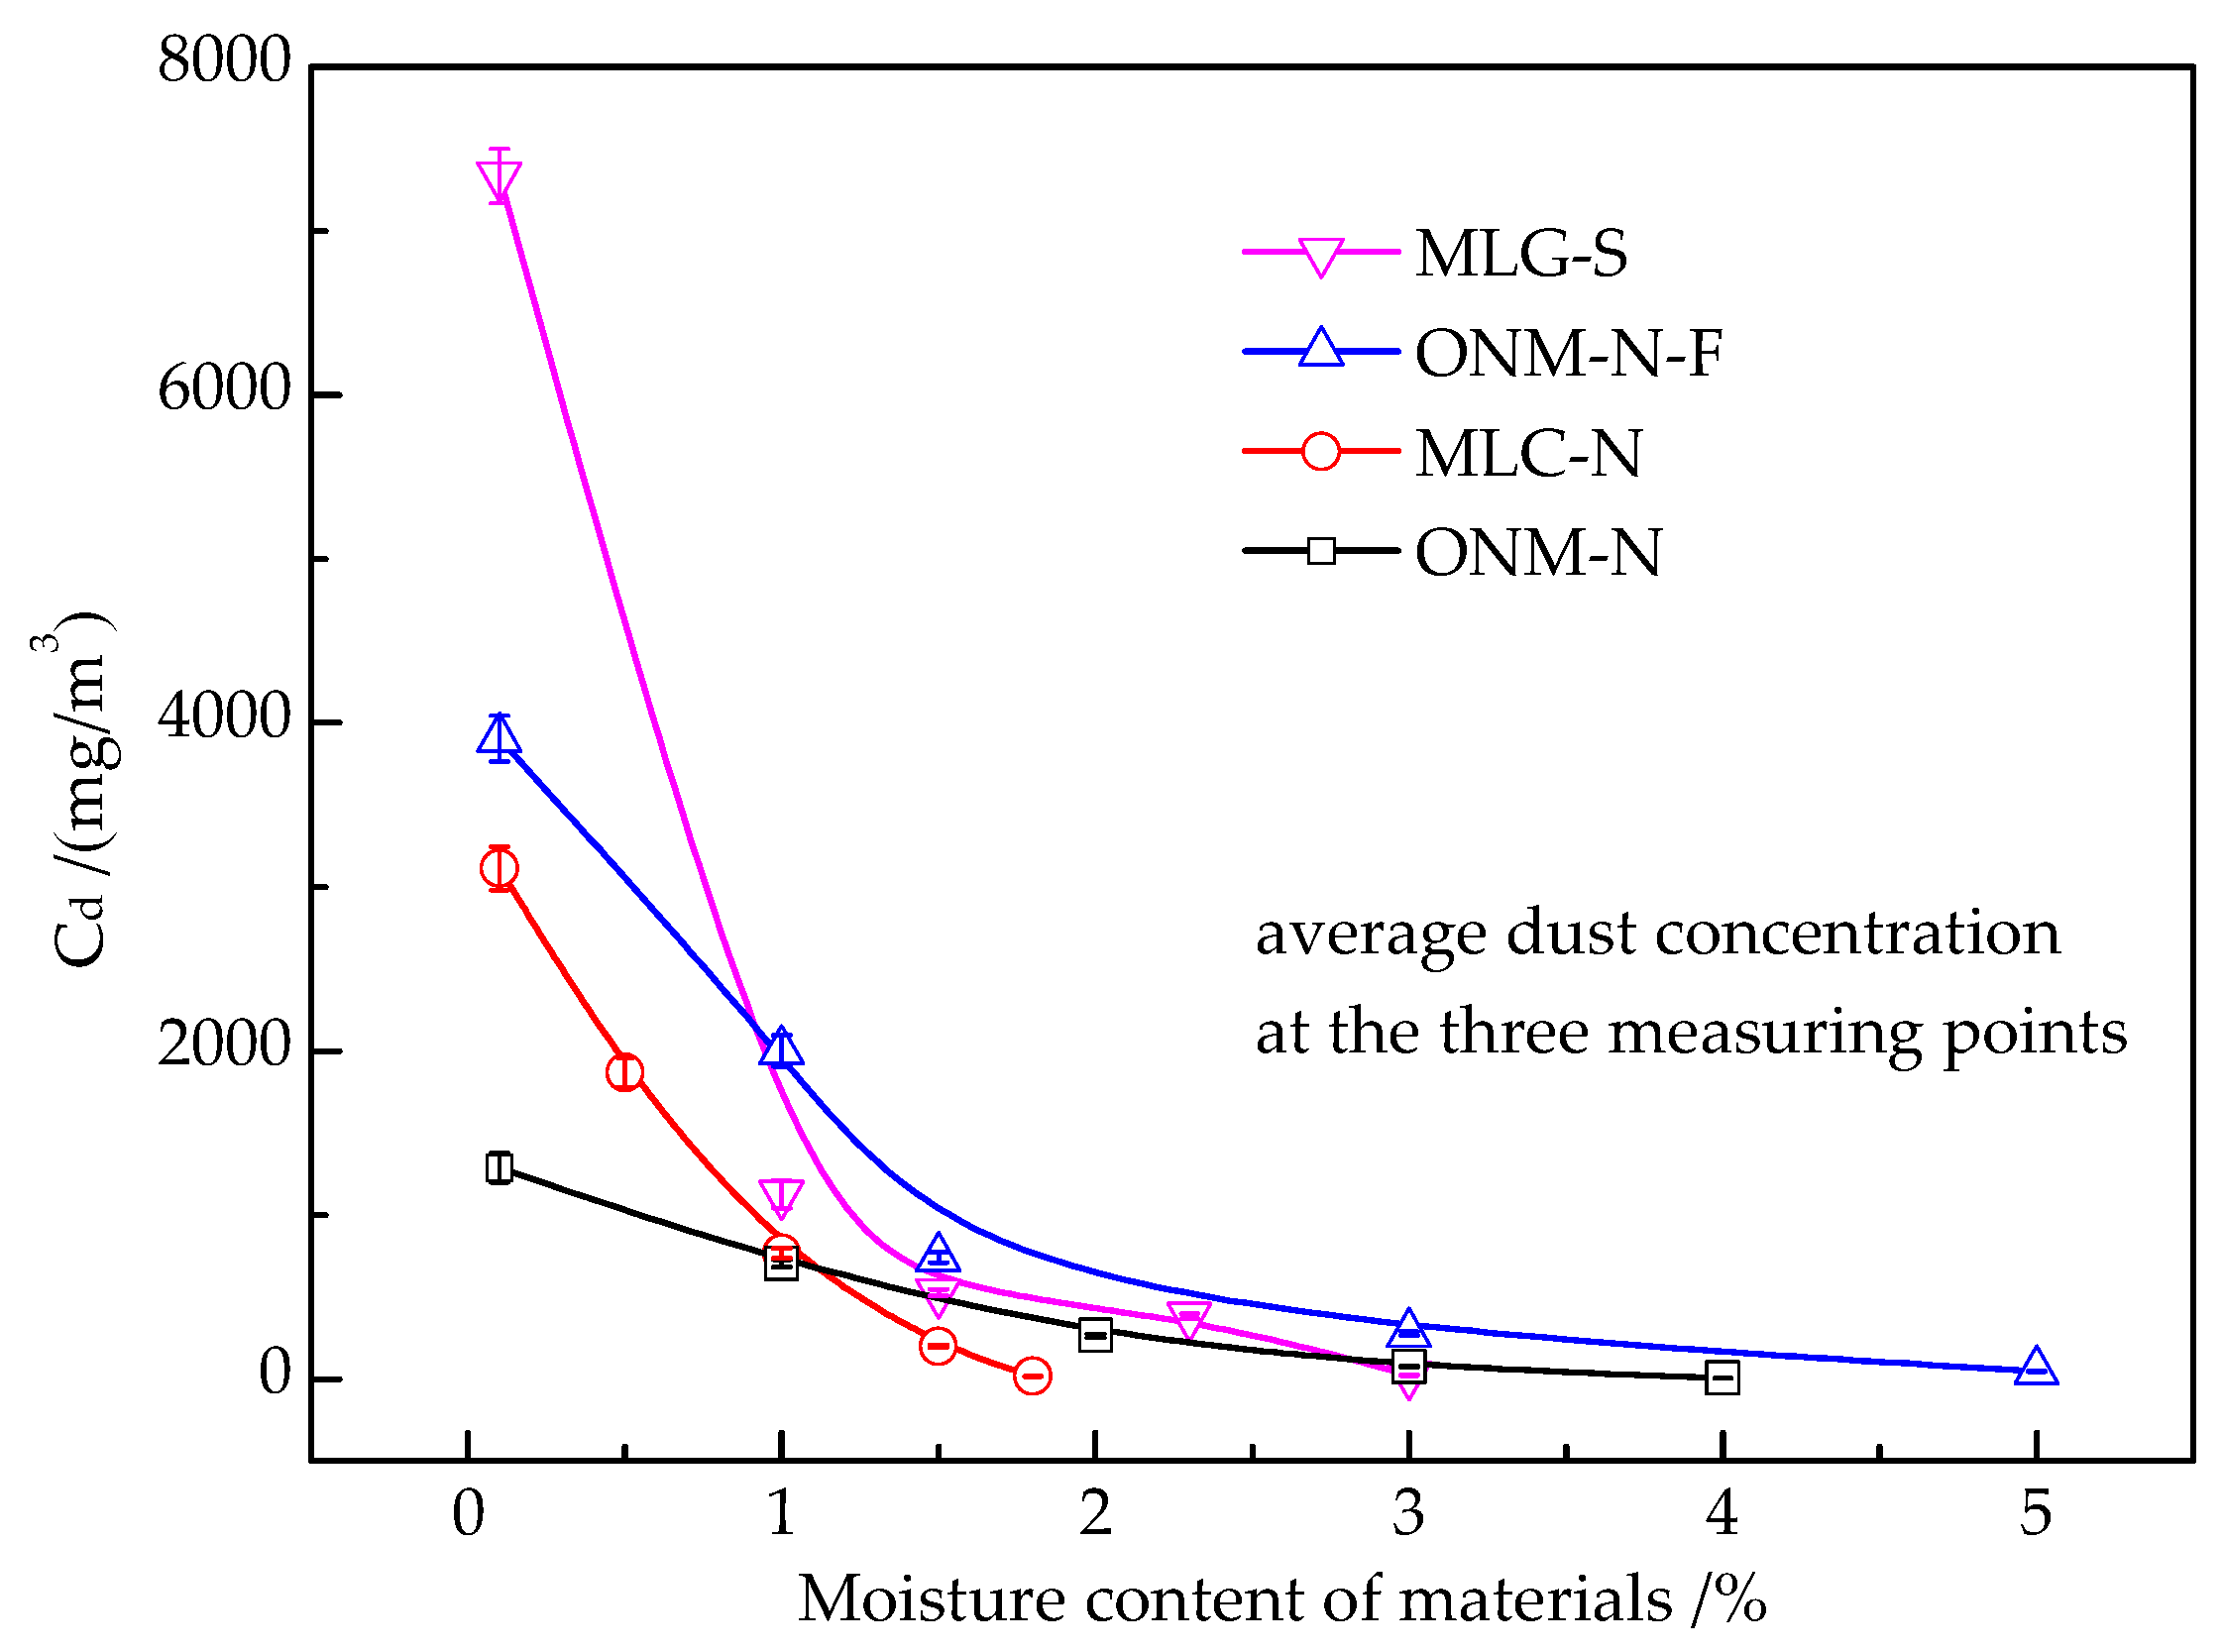
3.1. Effects of the Moisture Content of Materials on the Dust Concentration of Chute

When the discharging amount of materials is approximately 17 kg/s and the height of chute is about 2.2 m, the effects of moisture content of materials on the average dust concentration of chute at the three measuring points are presented in Figure 4. It can be seen that for the selected four materials, with increasing the moisture content of materials, the dust concentration in the chute is gradually decreased. In the case of the same materials, the dust concentration generated from powdery materials is greater than that from lump materials. With increasing the moisture content of materials from 0.1% to 1.5%, the dust concentration generated by the MLG-S is decreased from 7335.1 mg/m3 to 524.1 mg/m3, and the dust concentration produced by the MLC-N is diminished from 3112.5 mg/m3 to 133.3 mg/m3. Meanwhile, as the moisture content is increased from 0.1% to 3%, the dust concentration of ONM-N-F and ONM-N is reduced from 3904.5 mg/m3 to 276.2 mg/m3 and from 1286.7 mg/m3 to 75.6 mg/m3, respectively. With high moisture, fine particles of the materials can aggregate and condense into larger clumps during the falling process. Due to the combination and the molecular forces on the surface between water molecules and dust particles, the dust on the surface of materials is not easy to escape. However, when the moisture content of fine ore is further increased, the decreased magnitude of dust concentration in the chute is leveled-off because it is close to the critical moisture of materials.

3.2. Effects of the Height of Chute on the Dust Concentration of Chute

As the moisture content of materials is about 0.1% and the discharging amount of materials is approximately 17 kg/s, the influence of the height of chute on the average dust concentration at the three measuring points is given in Figure 5. It can be evidently seen that with increasing the height of chute, the concentrations of dust generated by the above four materials are all gradually increased. During the descending process of materials, the descending speed of materials is gradually enhanced by increasing the height of chute since the gravitational potential energy of materials is converted into the kinetic energy, which contributes to the acceleration of the induced airflow because it is dependent on the descending speed of materials [16]. As a result, the concentration of dust is increased.
Furthermore, it is also observed that the height of chute has different effects on the concentration of dust produced by different materials. The concentration of dust produced by the MLG-S is greatly affected by the height of chute, while that produced by the other three materials is slightly affected. As the height of chute is increased from 2.2 m to 3.1 m, the concentration of dust generated by the MLG-S is accelerated from 7335.1 mg/m3 to 8881.1 mg/m3, and the concentration of dust produced by the ONM-N is increased from 1286.7 mg/m3 to 1964.3 mg/m3. During the descending process of materials, most of the particles arrive at the bottom of chute along the original motion track, and a small number of particles may escape into the air, which is depended on the size of the particles. If the particles with large size deviate from the original motion trajectory, they will be naturally settled in a short time due to the gravity. However, the fine particles escaping from the original motion trail into the air are difficult to be rapidly settled. Although the fine particles have been settled, they will enter the air again and become secondary pollution under the impact of materials flow since the residence time of fine particles in the air is long [17]. Therefore, the concentration of dust generated from the MLG-S is greatly affected by the height of chute, and the range of variation is relatively more obvious since its size is the smallest among the four materials.
Through the above results, the evolutions on the dust concentration of chute under different heights and moistures are shown in Figure 6. It can be distinctly seen that the concentration of dust in the chute is reduced with increasing the moisture content of materials, while that is strengthened with increasing the height of chute. According to the above results, the relationships between the dust concentration and the moisture content of materials as well as the height of chute are fitted, and the regression equations for the above four materials are conducted, which are listed in Equations (2)–(5) as follows.
Z 1 = 31199.03451 5834.29438 x 4659.9155 y 2436.08447 y 2 + 863.52325 y 3 1 + 51.34859 x 37.27075 x 2 + 7.69038 x 3 2.32645 y + 0.36672 y 2
Z 2 = 10777.12199 5742.83183 x 434.08134 y + 46.73966 y 2 + 111.91926 y 3 1 + 39.67796 x 54.94336 x 2 + 22.48912 x 3 0.74577 y + 0.13014 y 2
Z 3 = 1758.42988 46654.0807 x + 132179.30645 y + 35173.71702 y 2 10594.64092 y 3 1 + 253.7227 x 59.80087 x 2 + 18.79414 x 3 + 42.24579 y 6.25074 y 2
Z 4 = 951.78505 494.64639 x + 65.56143 y + 20.91653 y 2 11.6746 y 3 1 0.18686 x + 0.64271 x 2 0.3188 x 3 0.04341 y 0.04804 y 2
where, Z1, Z2, Z3, and Z4 are the dust concentrations of chute generated by the MLG-S, MLC-N, ONM-N-F, and ONM-N, respectively, mg/m3. x is the moisture content of materials, and y is the height of chute. Furthermore, x and y are only the numerical values of the moisture content (the value in front of the percent sign) and the height of chute, respectively, without considering the dimensions.

3.3. Effects of the Discharging Amount of Materials on the Dust Concentration of Chute

As the moisture content of materials is about 1.0%, and the height of chute is approximately 2.2 m, the effects of the discharging amount of materials on the average dust concentration of chute at the three measuring points are given in Figure 7. Obviously, the dust concentration of each material is increased with increasing the discharging amount, and the variations of the dust concentration produced by the ONM-N-F and the ONM-N are relatively larger compared with the other two materials. With increasing the discharging amount from 10 kg/s to 34 kg/s, the concentrations of dust in the chute generated by the ONM-N-F and the ONM-N are enhanced from 1466.7 mg/m3 to 4713.3 mg/m3 and from 520 mg/m3 to 2173.2 mg/m3, respectively. In contrast, the dust concentrations of MLG-S and MLC-N are slightly affected by the discharging amount. During the descending process of materials, the efficient collisions of particles exist. Hence, compared with the MLG-S, some particles with a large size in the ONM-N-F can produce more dust since the particle size of ONM-N-F is slightly larger than that of MLG-S. Due to the higher hardness and fewer fine dust particles of MLC-N, the variation range of dust concentration is not as obvious as that of ONM-N with the increase of discharging amount.

3.4. Concentration Distribution of Dust inside the Chute

3.4.1. Concentration Distribution of Dust at Different Measuring Points

Under the condition of 2.2 m chute height, 0.1% moisture content of materials, and 17 kg/s discharging amount of materials, the concentration distributions of dust at different measuring points are shown in Figure 8. With increasing the height of the measuring point, the dust concentrations of the selected materials are decreased, and the large variations of dust concentration can be observed for the MLG-S. Hence, the region with a height of 0.5 m inside the chute is the key area for controlling the dust. With increasing the height of the measuring point from 0.5 m to 1.5 m, the concentration of dust generated by the MLG-S is distinctly reduced from 9453.3 mg/m3 to 4578.6 mg/m3. However, the dust concentrations produced by the other three materials are slightly varied along with the height of the measuring point. Since the fine particles of MLG-S are most among the four materials, some fine particles break away from the original motion track and stay in the air for a long time during the descending process of materials. Because of continuous discharging, the settled fine particles of MLG-S rise to the region of 0.5 m again due to the impact force, resulting in a large amount of dust.

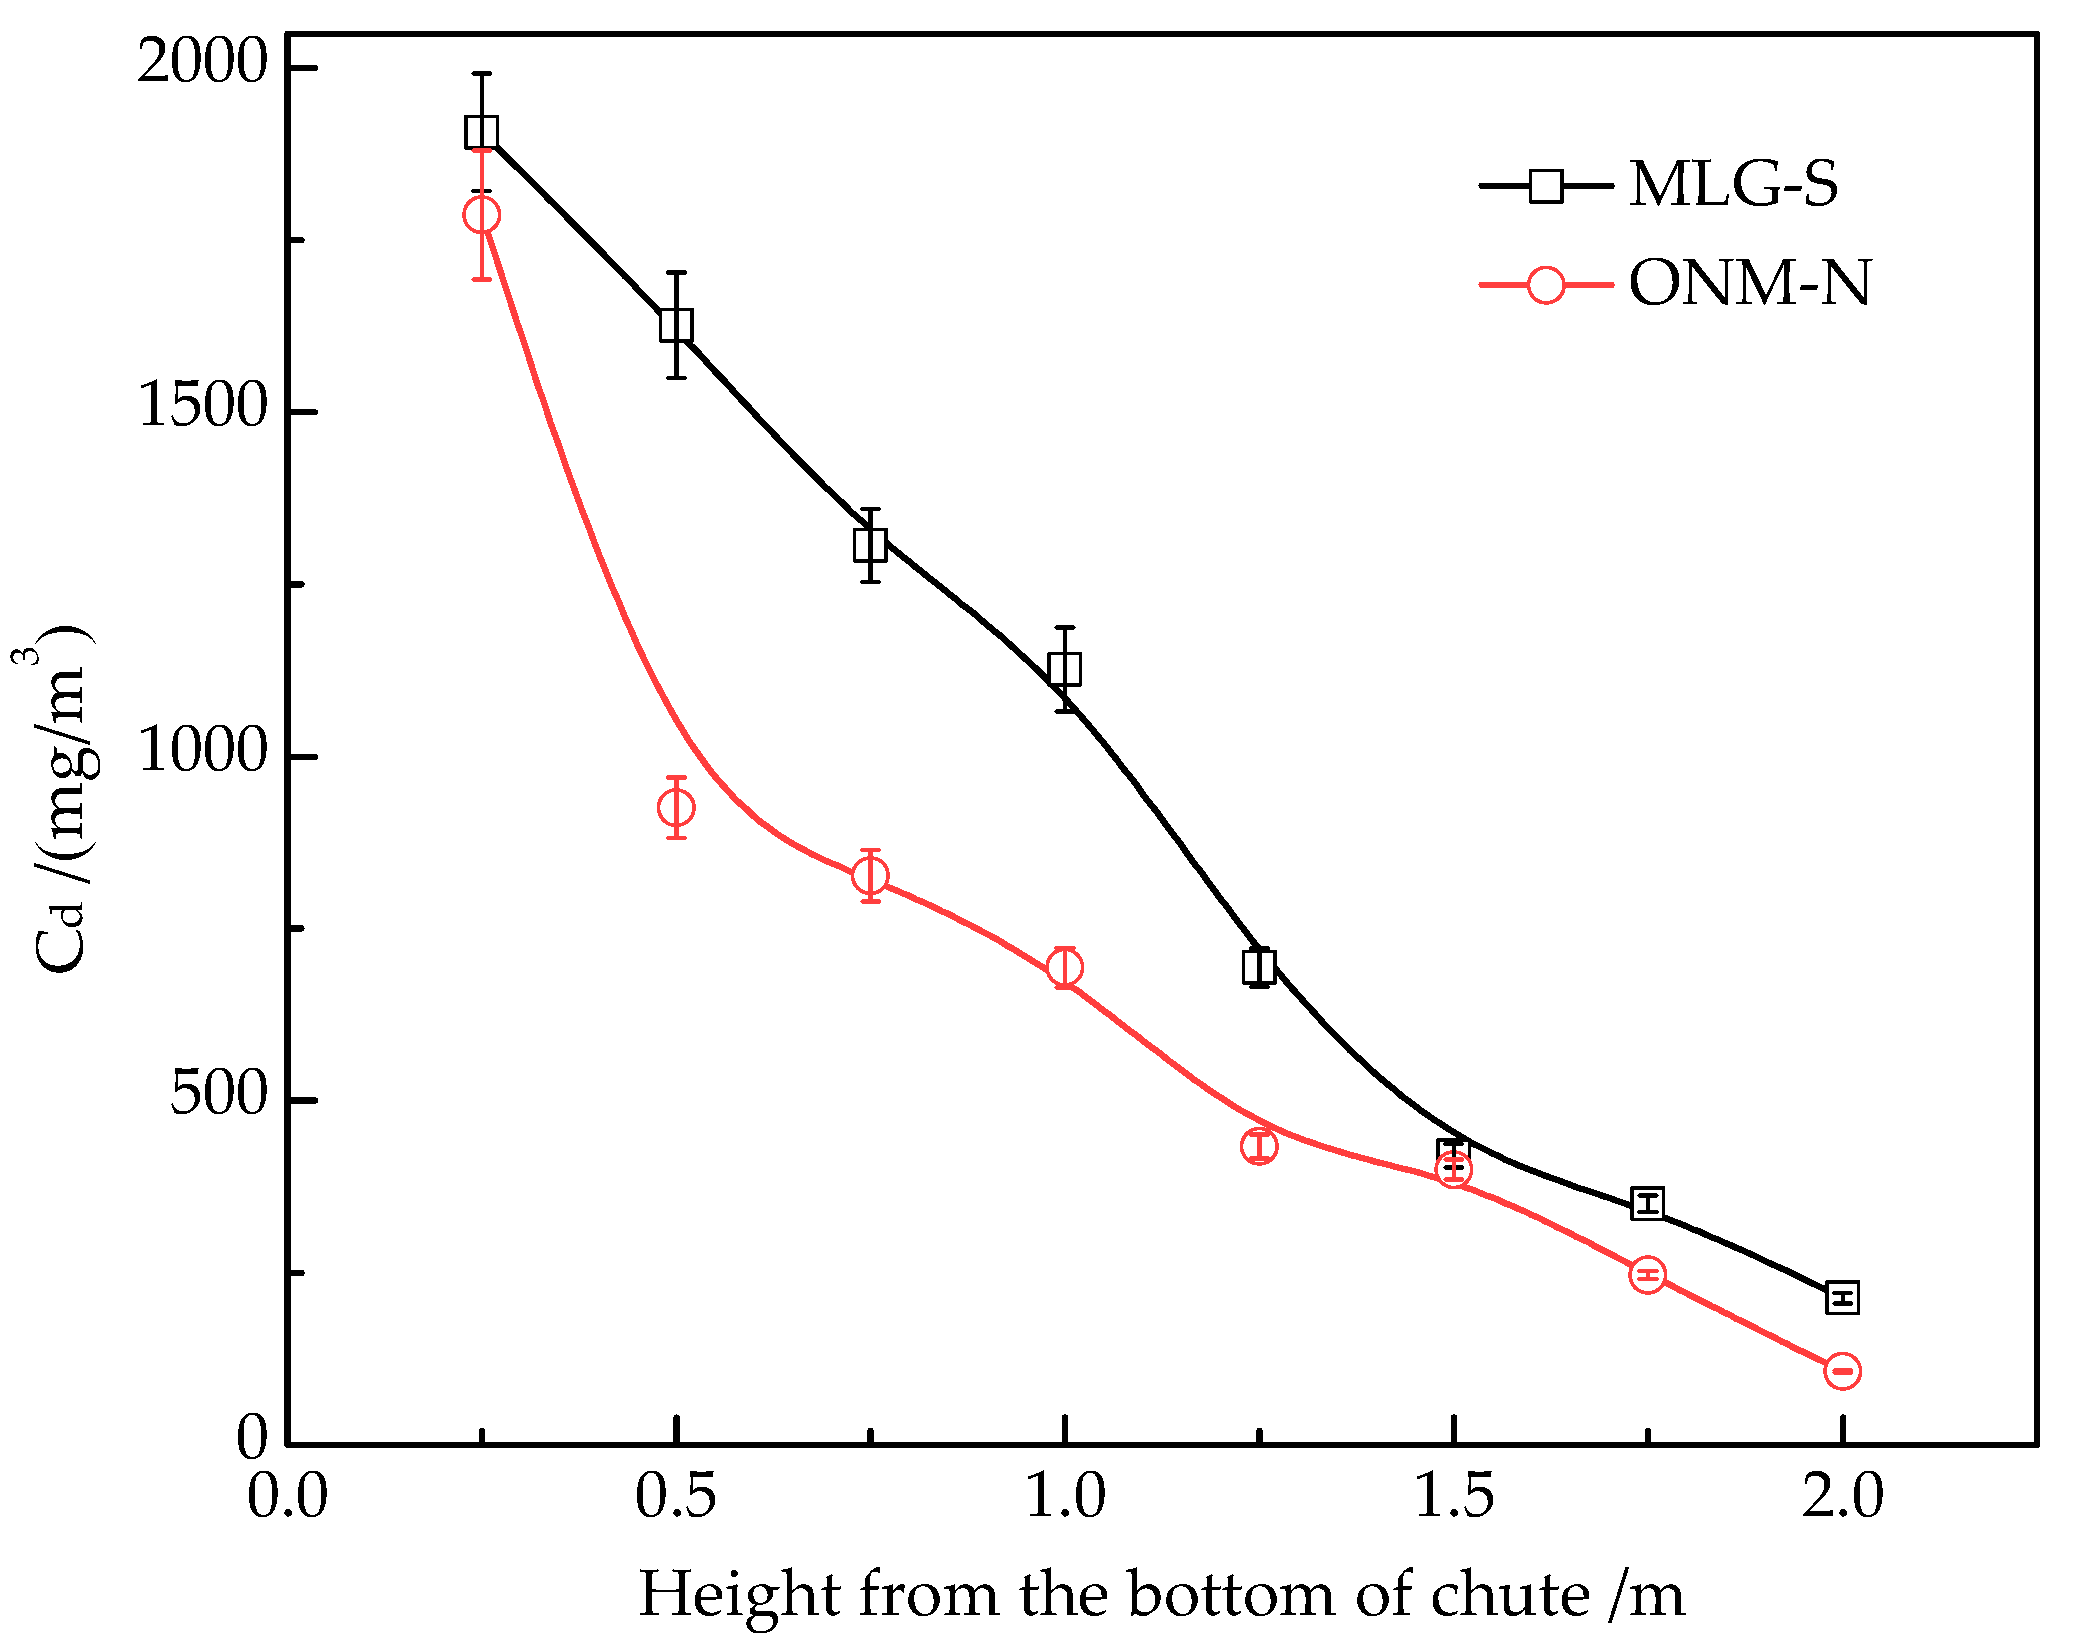
3.4.2. Concentration Distribution of Dust along the Height of Chute

To clarify the distribution law of dust concentration in the whole chute space, the powdery material MLG-S and the lump material ONM-N were selected to measure the concentration distribution inside the dust along the height of chute. As the height of chute is 2.2 m, and the moisture content of materials is about 1.0%, as well as 17 kg/s discharging amount of materials, the concentration distributions of dust produced by the MLG-S and the ONM-N along the height of chute are given in Figure 9. It is also observed that the concentration of dust is gradually decreased from the bottom to the top of chute, and the dust concentration of MLG-S is greater than that of ONM-N. Furthermore, the dust concentration generated from the ONM-N is sharply reduced along the height of chute from 0.25 m to 0.5 m. During the continuous discharging process of materials, due to the impact force, the fine particles of ONM-N are raised, but the fine particles cannot reach a high position since the impact force is small under the condition of a certain discharging amount due to the laboratory conditions, which contribute to the sharp decrease in the dust concentration in the space between 0.25 m and 0.5 m.

3.5. Simulation Results and Analysis

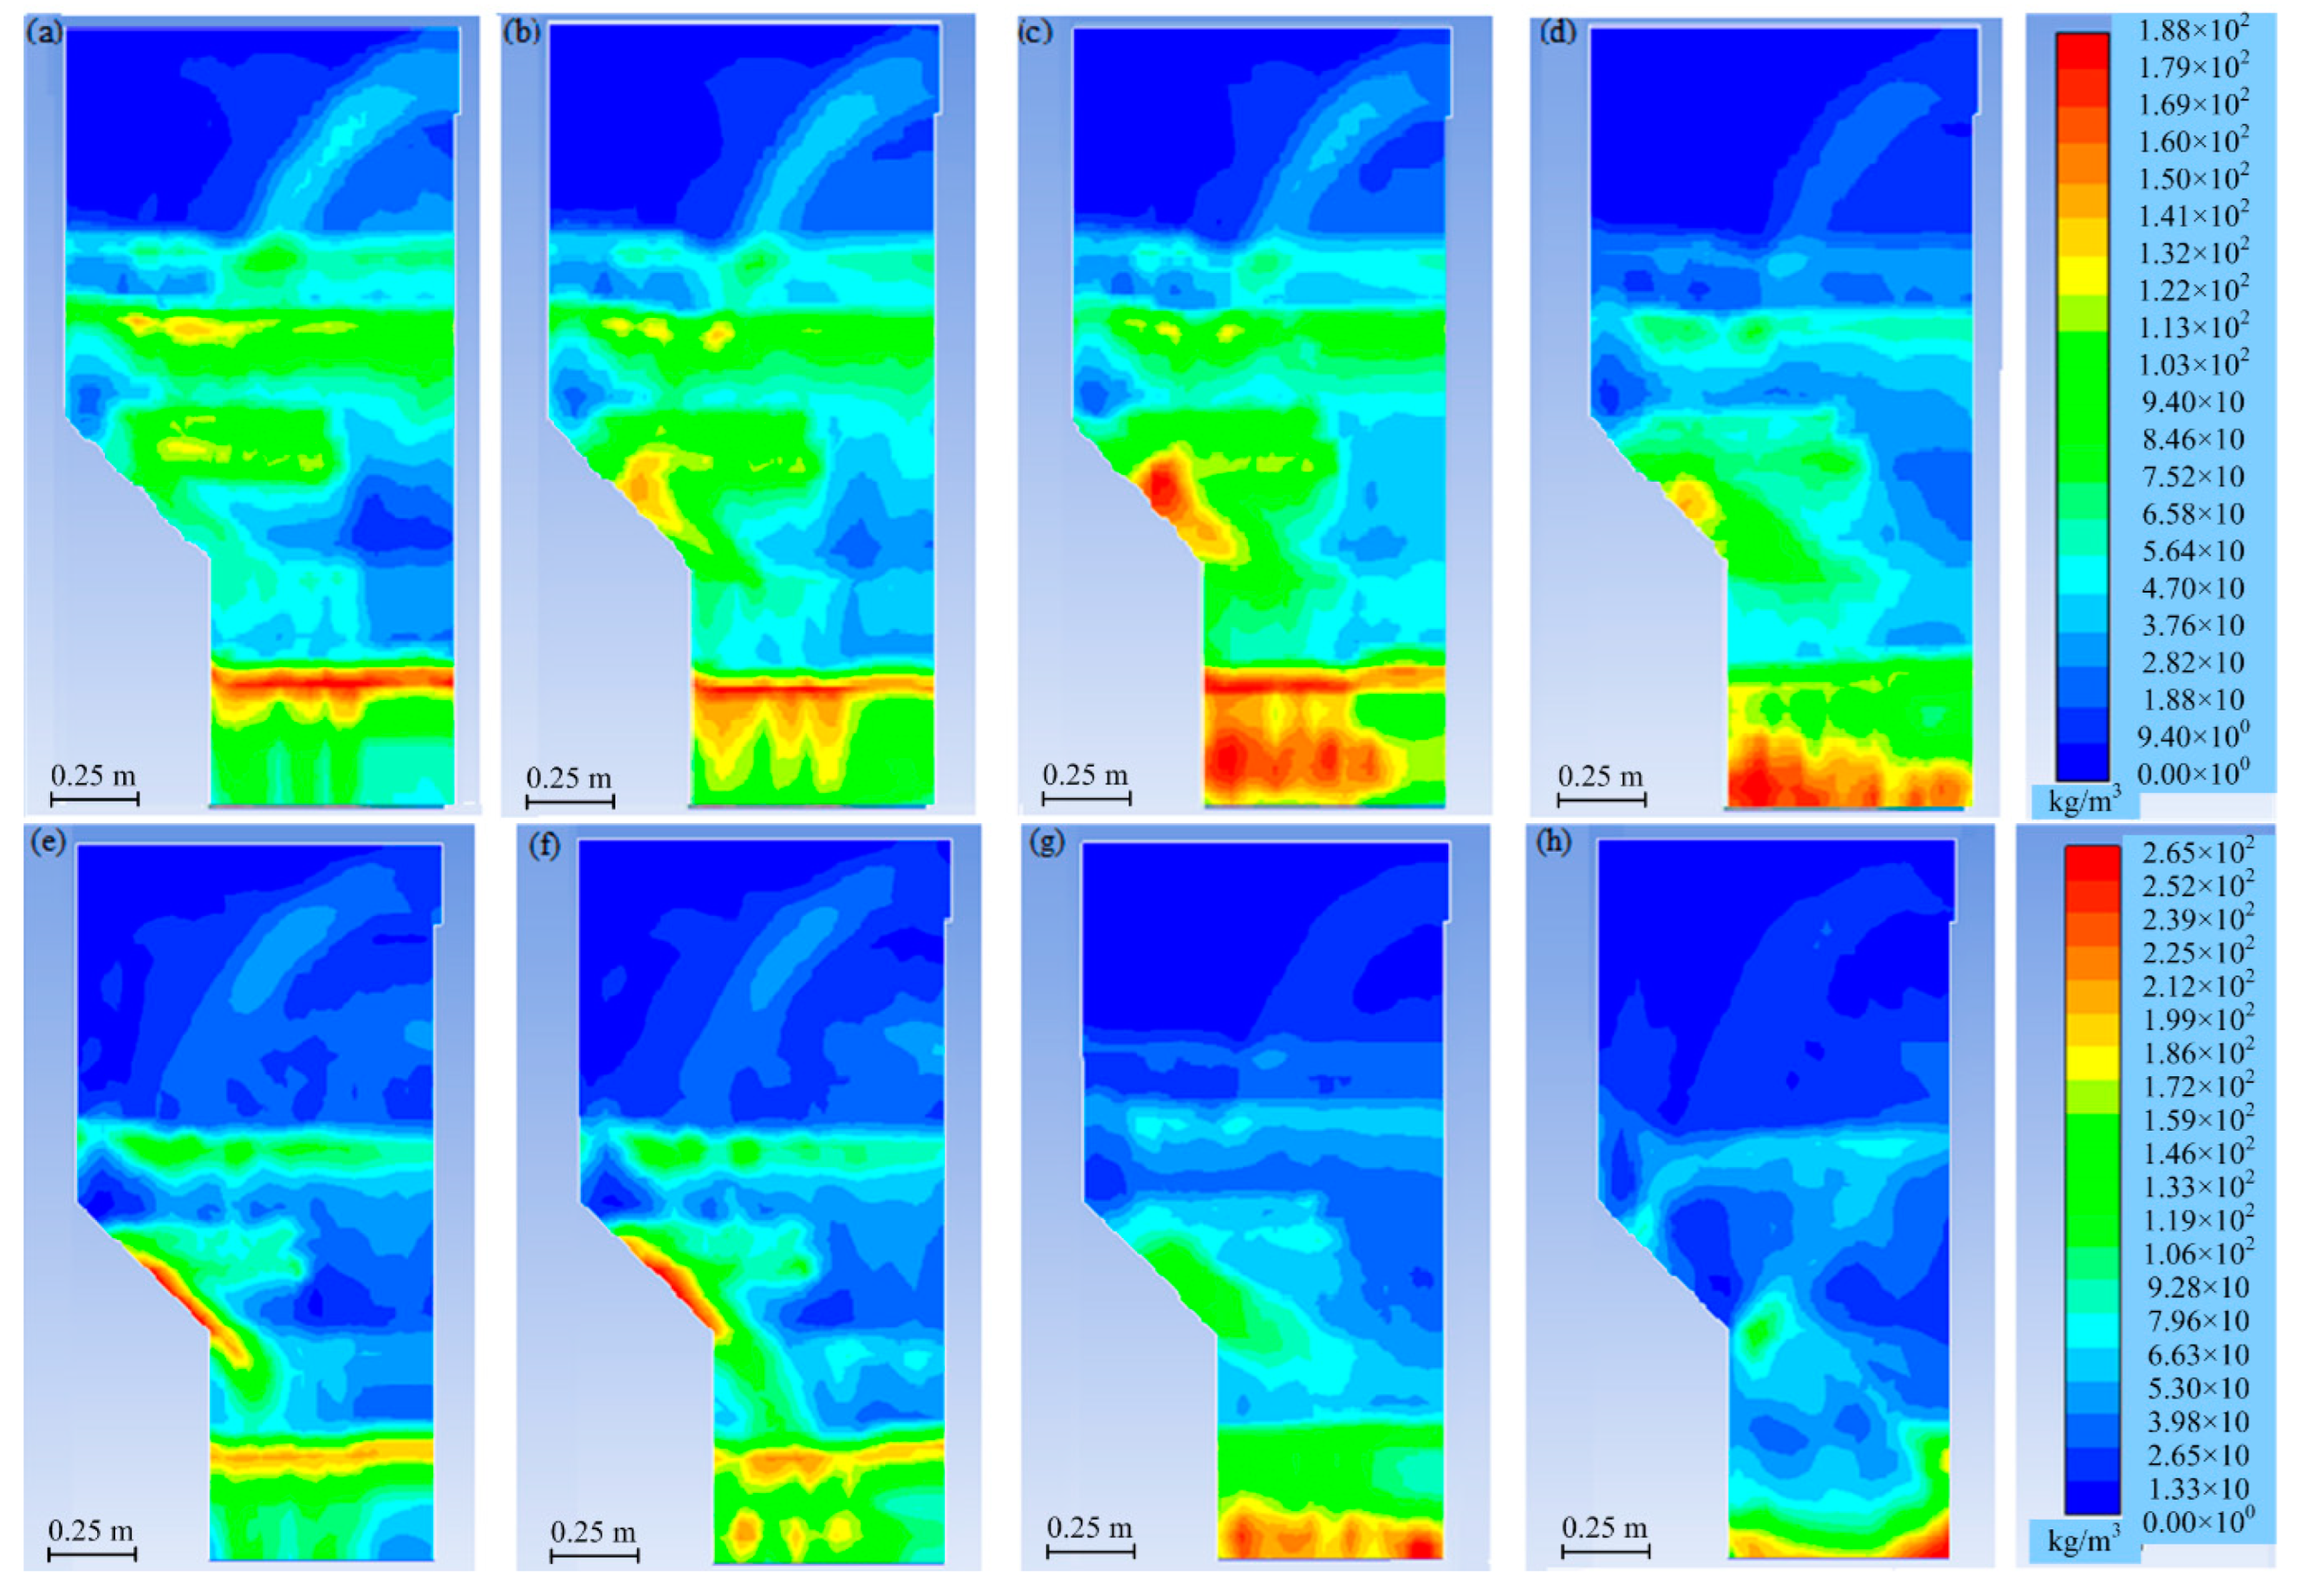
3.5.1. Concentration Distribution of Dust

The concentration distributions of dust produced by the MLG-S and the MLC-N in the chute system running from the start to the end are demonstrated in Figure 10. It can be seen that the collision effects between the particles are large during the falling process of materials. Moreover, the dust concentration near the receiving platform of chute (the slope) is relatively larger, which is mainly due to the fact that the part of materials that collided with the receiving platform can upward rebound to collide with the downward-moving materials. Furthermore, when most materials reach the bottom of the chute, they collide with the belt at the bottom, and some materials rebound to a certain height and continue to collide with the downward materials. Also, it is observed that the collision effects of materials are more severe at the bottom. As the time is about 0.7 s, the dust concentration at the bottom reaches the peak and decreases gradually from bottom to top in the chute space, which is consistent with the experimental results. The belt conveyor is used to transport the materials, and the materials flow is continuous. When the materials continue to reach the bottom of the chute, the dust concentration at the bottom of the chute and near the receiving platform is gradually increased, and the dust concentration in other areas of the chute is also gradually increased.
In addition, since the particle size of lump materials (MLC-N) is large compared with that of powdery materials (MLG-S), the dust concentration produced by the MLC-N in the chute is small, and the duration of high dust concentration is shorter. Due to the large particle size, the particles of MLC-N can only rebound to a lower height after falling and rapidly subside, which causes the dust to be eventually distributed in the chute bottom plate and the position near the receiving platform. With continuous discharging, the dust starts to slowly subside as the time is 0.8 s, and the dust concentration at the bottom of chute achieves its peak. Therefore, the smaller the particle size of the material, the greater the dust concentration during the discharging process of materials and the longer the duration of high dust concentration. The bottom of the chute is the key area for controlling dust pollution.

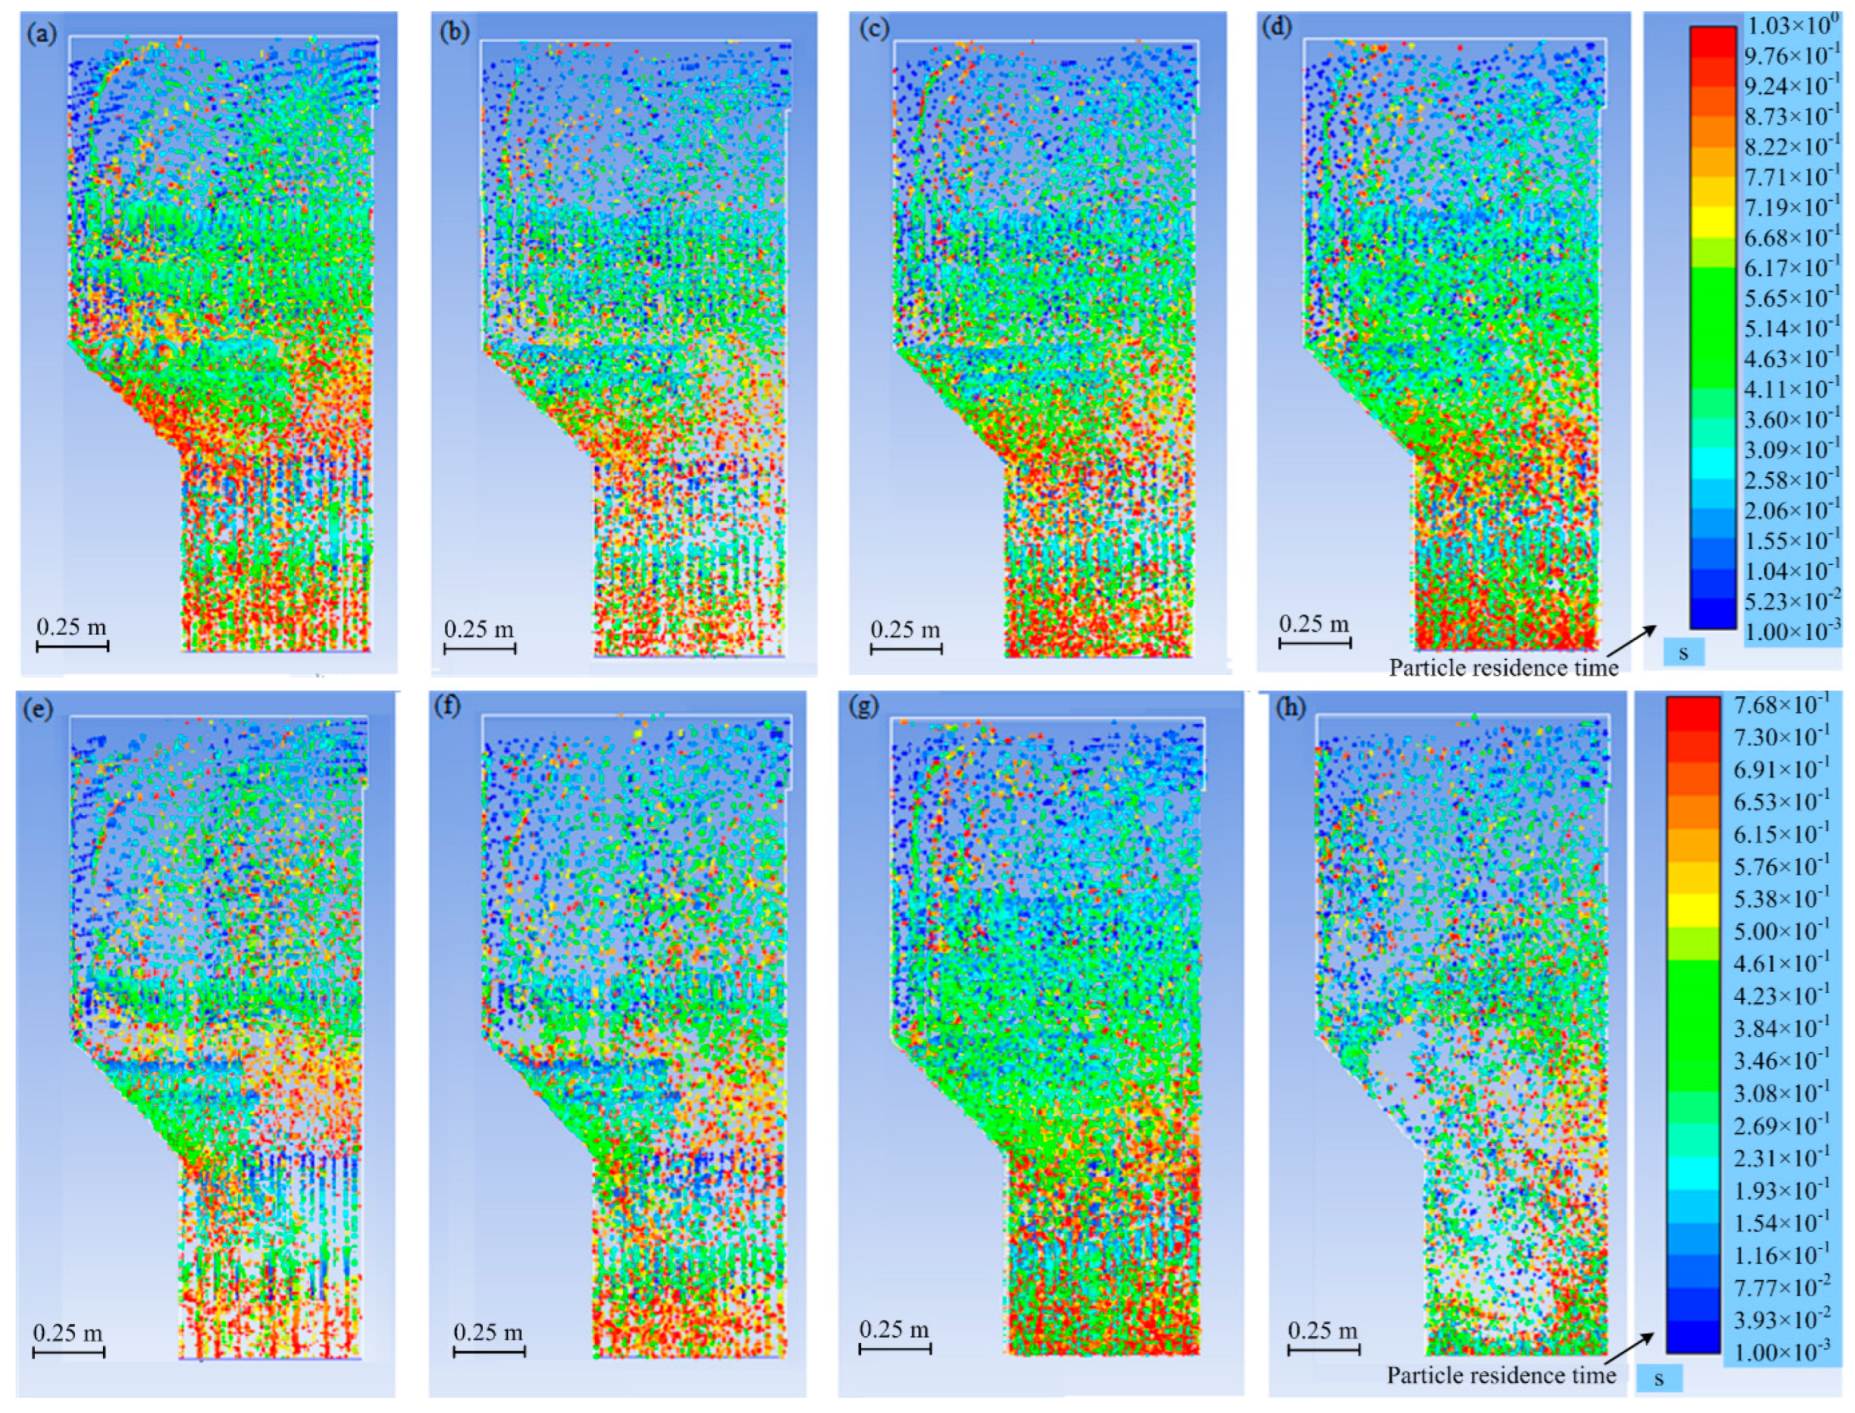
3.5.2. Motion Trajectories of Particles

Figure 11 presents the motion trajectories of particles derived from the MLG-S and the MLC-N in the chute system running from the start to the end. It can be seen that the materials are concentrated at the beginning of descending process. Because the air resistance is not uniform, the particles begin to disperse gradually with the materials descending. The horizontal distribution of the agglomeration particle flow is conducive to the contact between particles and air, and more conducive to the diffusion of particles of the powdery materials with air flow, which verifies the transverse distribution of particle flow in the experiments. With the decrease of the height, more small particles make contact with the airflow since the resistance of the materials to the airflow is increased, resulting in the acceleration of dust concentration.
In addition, from 0.5 s to 0.7 s, the dust concentration in the chute is gradually increased. Subsequently, the particles begin to settle slowly, causing the dust concentration at the bottom of chute is up to the peak. By contrast, the dust concentration of powdery materials (MLG-S) in the chute is maintained at a higher dust concentration as the collision effects between particles during the process of falling are larger and the settling velocity is slow. Due to the small number of fine particles in the lump materials (MLC-N), a large number of materials are settled quickly after bouncing on the ground, and the particles in the space of chute are significantly reduced at 0.8 s.

4. Conclusions

The concentration distribution and diffusion of dust, and the motion trajectories of dust particles inside the chute at an enclosed stockyard in a steel works in China were systematically investigated through experimental analyses and numerical simulation. The following conclusions were drawn.
(1) During the discharging process of materials at the enclosed stockyard, a large amount of dust is generated and more dust is produced from the powdery materials compared with the lump materials. The dust concentration is negatively correlated with the moisture content of materials, while that is positively correlated with the height of chute. With increasing the moisture content of materials from 0.1% to 1.5%, the dust concentration generated by the MLG-S is decreased from 7335.1 mg/m3 to 524.1 mg/m3, and the dust concentration produced by the MLC-N is diminished from 3112.5 mg/m3 to 133.3 mg/m3. Meanwhile, as the moisture content of materials is increased from 0.1% to 3%, the dust concentrations from the ONM-N-F and the ONM-N are reduced from 3904.5 mg/m3 to 276.2 mg/m3 and from 1286.7 mg/m3 to 75.6 mg/m3, respectively.
(2) The dust concentration in the chute space is gradually increased from the top to the bottom, and the dust concentrations at the bottom of the chute can reach the peak. Different materials have different dust concentrations due to their own characteristics and the existence of collision effects during the falling process of materials. With increasing the height of the measuring point from 0.5 m to 1.5 m, the concentration of dust from the MLG-S is distinctly reduced from 9453.3 mg/m3 to 4578.6 mg/m3. However, the dust concentrations of the other three materials slightly varied along the height of the measuring point.
(3) During the discharging process of materials, the dust is mainly concentrated near the receiving platform and the bottom of the chute, and the dust concentration at the bottom can reach its peak. The larger dust concentration and the longer the duration of high dust concentration are conducted from the materials with the smaller particle size. The bottom of the chute is the dust source with the largest concentration, and is the key area for controlling dust pollution.

Author Contributions

Conceptualization, X.W. and H.W.; funding acquisition, H.W.; investigation, L.L.; methodology, L.L. and S.X.; writing—original draft, S.X.; writing—review and editing, H.W. All authors have read and agreed to the published version of the manuscript.

Funding

This research was funded by the National Natural Science Foundation of China (52004001).

Data Availability Statement

Data sharing not applicable.

Conflicts of Interest

The authors declare no conflict of interest.

References

  1. Okosun, T.; Nielson, S.; Zhou, C. Blast furnace hydrogen injection: Investigating impacts and feasibility with computational fluid dynamics. JOM 2022, 74, 1521–1532. [Google Scholar] [CrossRef]
  2. Sundqvist Ökvist, L.; Lundgren, M. Experiences of bio-coal applications in the blast furnace process—Opportunities and limitations. Minerals 2021, 11, 863. [Google Scholar] [CrossRef]
  3. Orre, J.; Ökvist, L.S.; Bodén, A.; Björkman, B. Understanding of blast furnace performance with biomass introduction. Minerals 2021, 11, 157. [Google Scholar] [CrossRef]
  4. Guo, H.W.; Su, B.X.; Bai, Z.L.; Zhang, J.L.; Li, X.Y. Novel recognition method of blast furnace dust composition by multifeature analysis based on comprehensive image-processing techniques. JOM 2014, 66, 2377–2389. [Google Scholar] [CrossRef]
  5. Wen, M. Discussion on the development trend of comprehensive stockyard. Sichuan Metall. 2020, 42, 64–66. [Google Scholar]
  6. Duan, Z.Y.; Liu, Y.Z.; Wang, K.; Zhang, Y.; Lan, Z.J.; Xu, E.L. Review of fugitive dust dispersion law from large open-yard of stockpile. J. Earth Environ. 2017, 8, 307–319. [Google Scholar]
  7. Wu, W.P. Simulation test on materials stacking of type-C closed stockyard of Baosteel. Sinter. Pelletizing 2020, 45, 81–85. [Google Scholar]
  8. Jia, L.; Cao, L.Z. Study on dust escape law of chute based on aerodynamics. Opencast Min. Technol. 2020, 35, 15–18. [Google Scholar]
  9. Eckhoff, R.K. Current status and expected future trends in dust explosion research. J. Loss Prev. Process Ind. 2005, 18, 225–237. [Google Scholar] [CrossRef]
  10. Ma, Y.D.; Luo, G.H.; Guo, Z.H. Numerical simulation on application of diffuse regulation with power dust in transshipping site. J. Safety Environ. 2006, 6, 16–18. [Google Scholar]
  11. Hou, H.T. Comparison of simulation and field measurement on rock powder migration characteristics in fully mechanized excavation face. J. Jiangxi Univ. Sci. Technol. 2016, 37, 61–67. [Google Scholar]
  12. Chen, X.L.; Wheeler, C.A.; Donohue, T.J.; McLean, R.; Roberts, A.W. Evaluation of dust emissions from conveyor transfer chutes using experimental and CFD simulation. Int. J. Miner. Process. 2012, 110–111, 101–108. [Google Scholar] [CrossRef]
  13. Donohue, T.J.; Roberts, A.W.; Wheeler, C.A.; Mcbride, W. Computer simulations as a tool for investigating dust generation in bulk solids handling operations. Part. Part. Syst. Charact. 2009, 26, 265–274. [Google Scholar] [CrossRef]
  14. Sun, H.F.; Li, A.G. Numerical simulation of particle diffusion in process of particle stream oblique projectile motion in chute transfer. J. Safety Environ. 2019, 19, 713–722. [Google Scholar]
  15. Wei, L.B.; Li, D.H.; Miao, C.; Sun, M.Y.; Zhu, X.S.; Zeng, M.; Wang, M.Y. Numerical studies of pulsing airflow separation of fine coal based on Euler-Lagrange method. J. China Coal Soc. 2017, 42, 2149–2156. [Google Scholar]
  16. Li, X.C.; Wang, Q.L.; Liu, Q.; Li, Q.; Luo, H.Q.; Hu, Y.F.; Yang, H. Influence factors for induced airflow of bulk materials in chute transfer station. Mater. Sci. Eng. Powder Metall. 2015, 20, 683–689. [Google Scholar]
  17. Li, X.C.; Li, Q.; Zhang, D.; Hu, Y.F.; Xiong, J.J.; Luo, H.Q.; Jia, B.B.; Hu, H.B. Nonlinear variation influence factors for induced airflow of bulk materials in transfer station. Mater. Sci. Eng. Powder Metall. 2014, 19, 508–513. [Google Scholar]
Figure 1. Optical microstructure of the four materials used in the tests: (a) MLG-S; (b) ONM-N-F; (c) MLC-N; (d) ONM-N.
Minerals 12 01164 g001
Figure 2. Schematic diagram of the experimental device established in laboratory.
Minerals 12 01164 g002
Figure 3. Three dimensional model and section of simulated chute: (a) three dimensional model; (b) section.
Minerals 12 01164 g003
Figure 4. Effects of the moisture content of materials on the average dust concentration of chute at the three measuring points.
Minerals 12 01164 g004
Figure 5. Effects of the height of chute on the average dust concentration of chute at the three measuring points.
Minerals 12 01164 g005
Figure 6. Concentration distribution of dust in the chute under different chute heights and different moistures: (a) MLG-S; (b) MLC-N; (c) ONM-N-F; (d) ONM-N.
Minerals 12 01164 g006
Figure 7. Effects of the discharging amount of materials on the average dust concentration of chute at the three measuring points.
Minerals 12 01164 g007
Figure 8. Concentration distribution of dust at different measuring points inside the chute.
Minerals 12 01164 g008
Figure 9. Concentration distribution of dust along the height of chute.
Minerals 12 01164 g009
Figure 10. Cloud image of the dust concentration distribution in the chute system running from the start to the end: (a) MLG-S 0.5 s; (b) MLG-S, 0.6 s; (c) MLG-S, 0.7 s; (d) MLG-S, 0.8 s; (e) MLC-N, 0.5 s; (f) MLC-N, 0.6 s; (g) MLC-N, 0.7 s; (h) MLC-N, 0.8 s.
Minerals 12 01164 g010
Figure 11. Cloud image of motion trajectories of particles in the chute system running from the start to the end: (a) MLG-S 0.5 s; (b) MLG-S, 0.6 s; (c) MLG-S, 0.7 s; (d) MLG-S, 0.8 s; (e) MLC-N, 0.5 s; (f) MLC-N, 0.6 s; (g) MLC-N, 0.7 s; (h) MLC-N, 0.8 s.
Minerals 12 01164 g011
Table 1. Size distribution of raw materials used in the tests (wt.%).
Size Range/mm<0.150.15–0.50.5–0.850.85–8.08.0–10.010.0–25.0>25.0
MLG-S17.816.665.60.00.00.00.0
ONM-N-F0.00.025.865.48.80.00.0
MLC-N0.00.00.00.014.128.457.5
ONM-N0.00.00.00.027.245.427.4
Table 2. Experimental scheme for investigating the diffusion behaviors and concentrations of dust with different parameters.
MaterialMLG-SONM-N-FMLC-NONM-NOther Conditions
Moisture content of materials/%0.10.10.10.1Height of chute: 2.2 m
Discharge amount of materials: 17 kg/s
1.01.00.51.0
1.51.51.02.0
2.33.01.53.0
3.05.01.84.0
Height of chute/m2.22.22.22.2Moisture content of materials: 0.1%
Discharge amount of materials: 17 kg/s
2.52.52.52.5
3.13.13.13.1
Discharging amount of materials/(kg/s)10101010Moisture content of materials: 1.0%
Height of chute: 2.2 m
17171717
25252525
34343434
Publisher’s Note: MDPI stays neutral with regard to jurisdictional claims in published maps and institutional affiliations.

