
Subsidence Management and Prediction System: A Case Study in Potash Mining


Abstract
:1. Introduction
Case Study
2. Materials and Methods
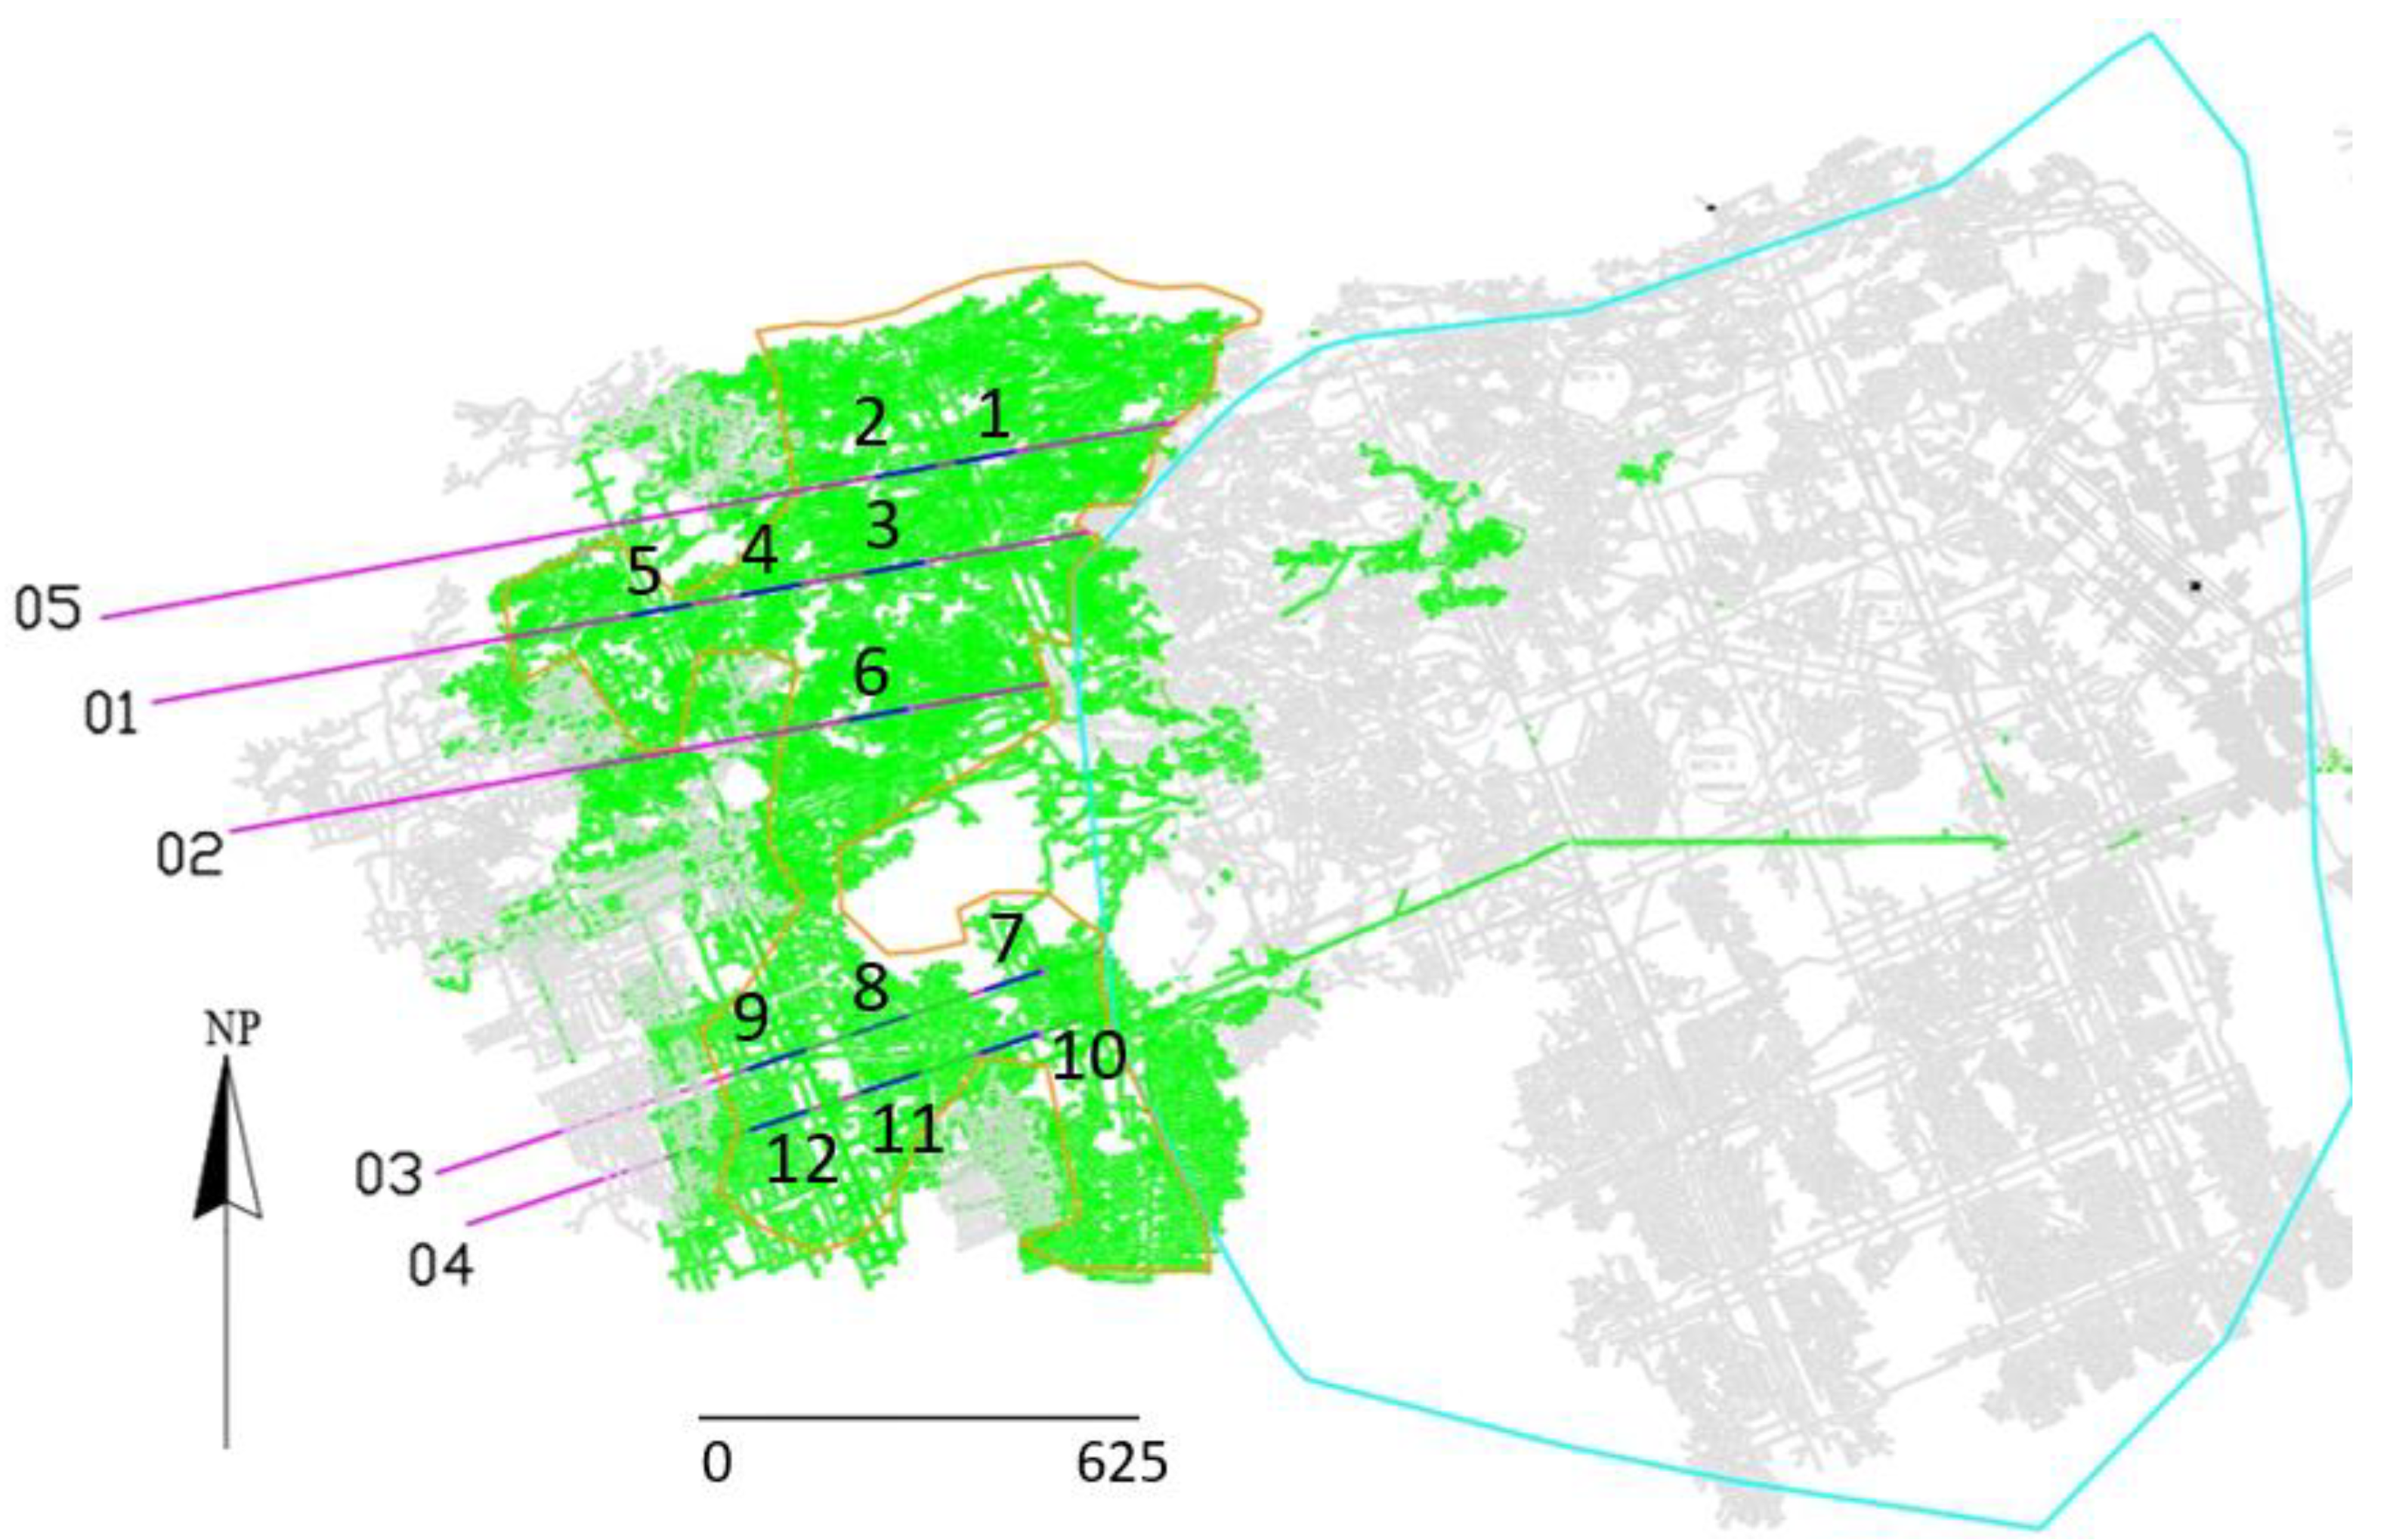
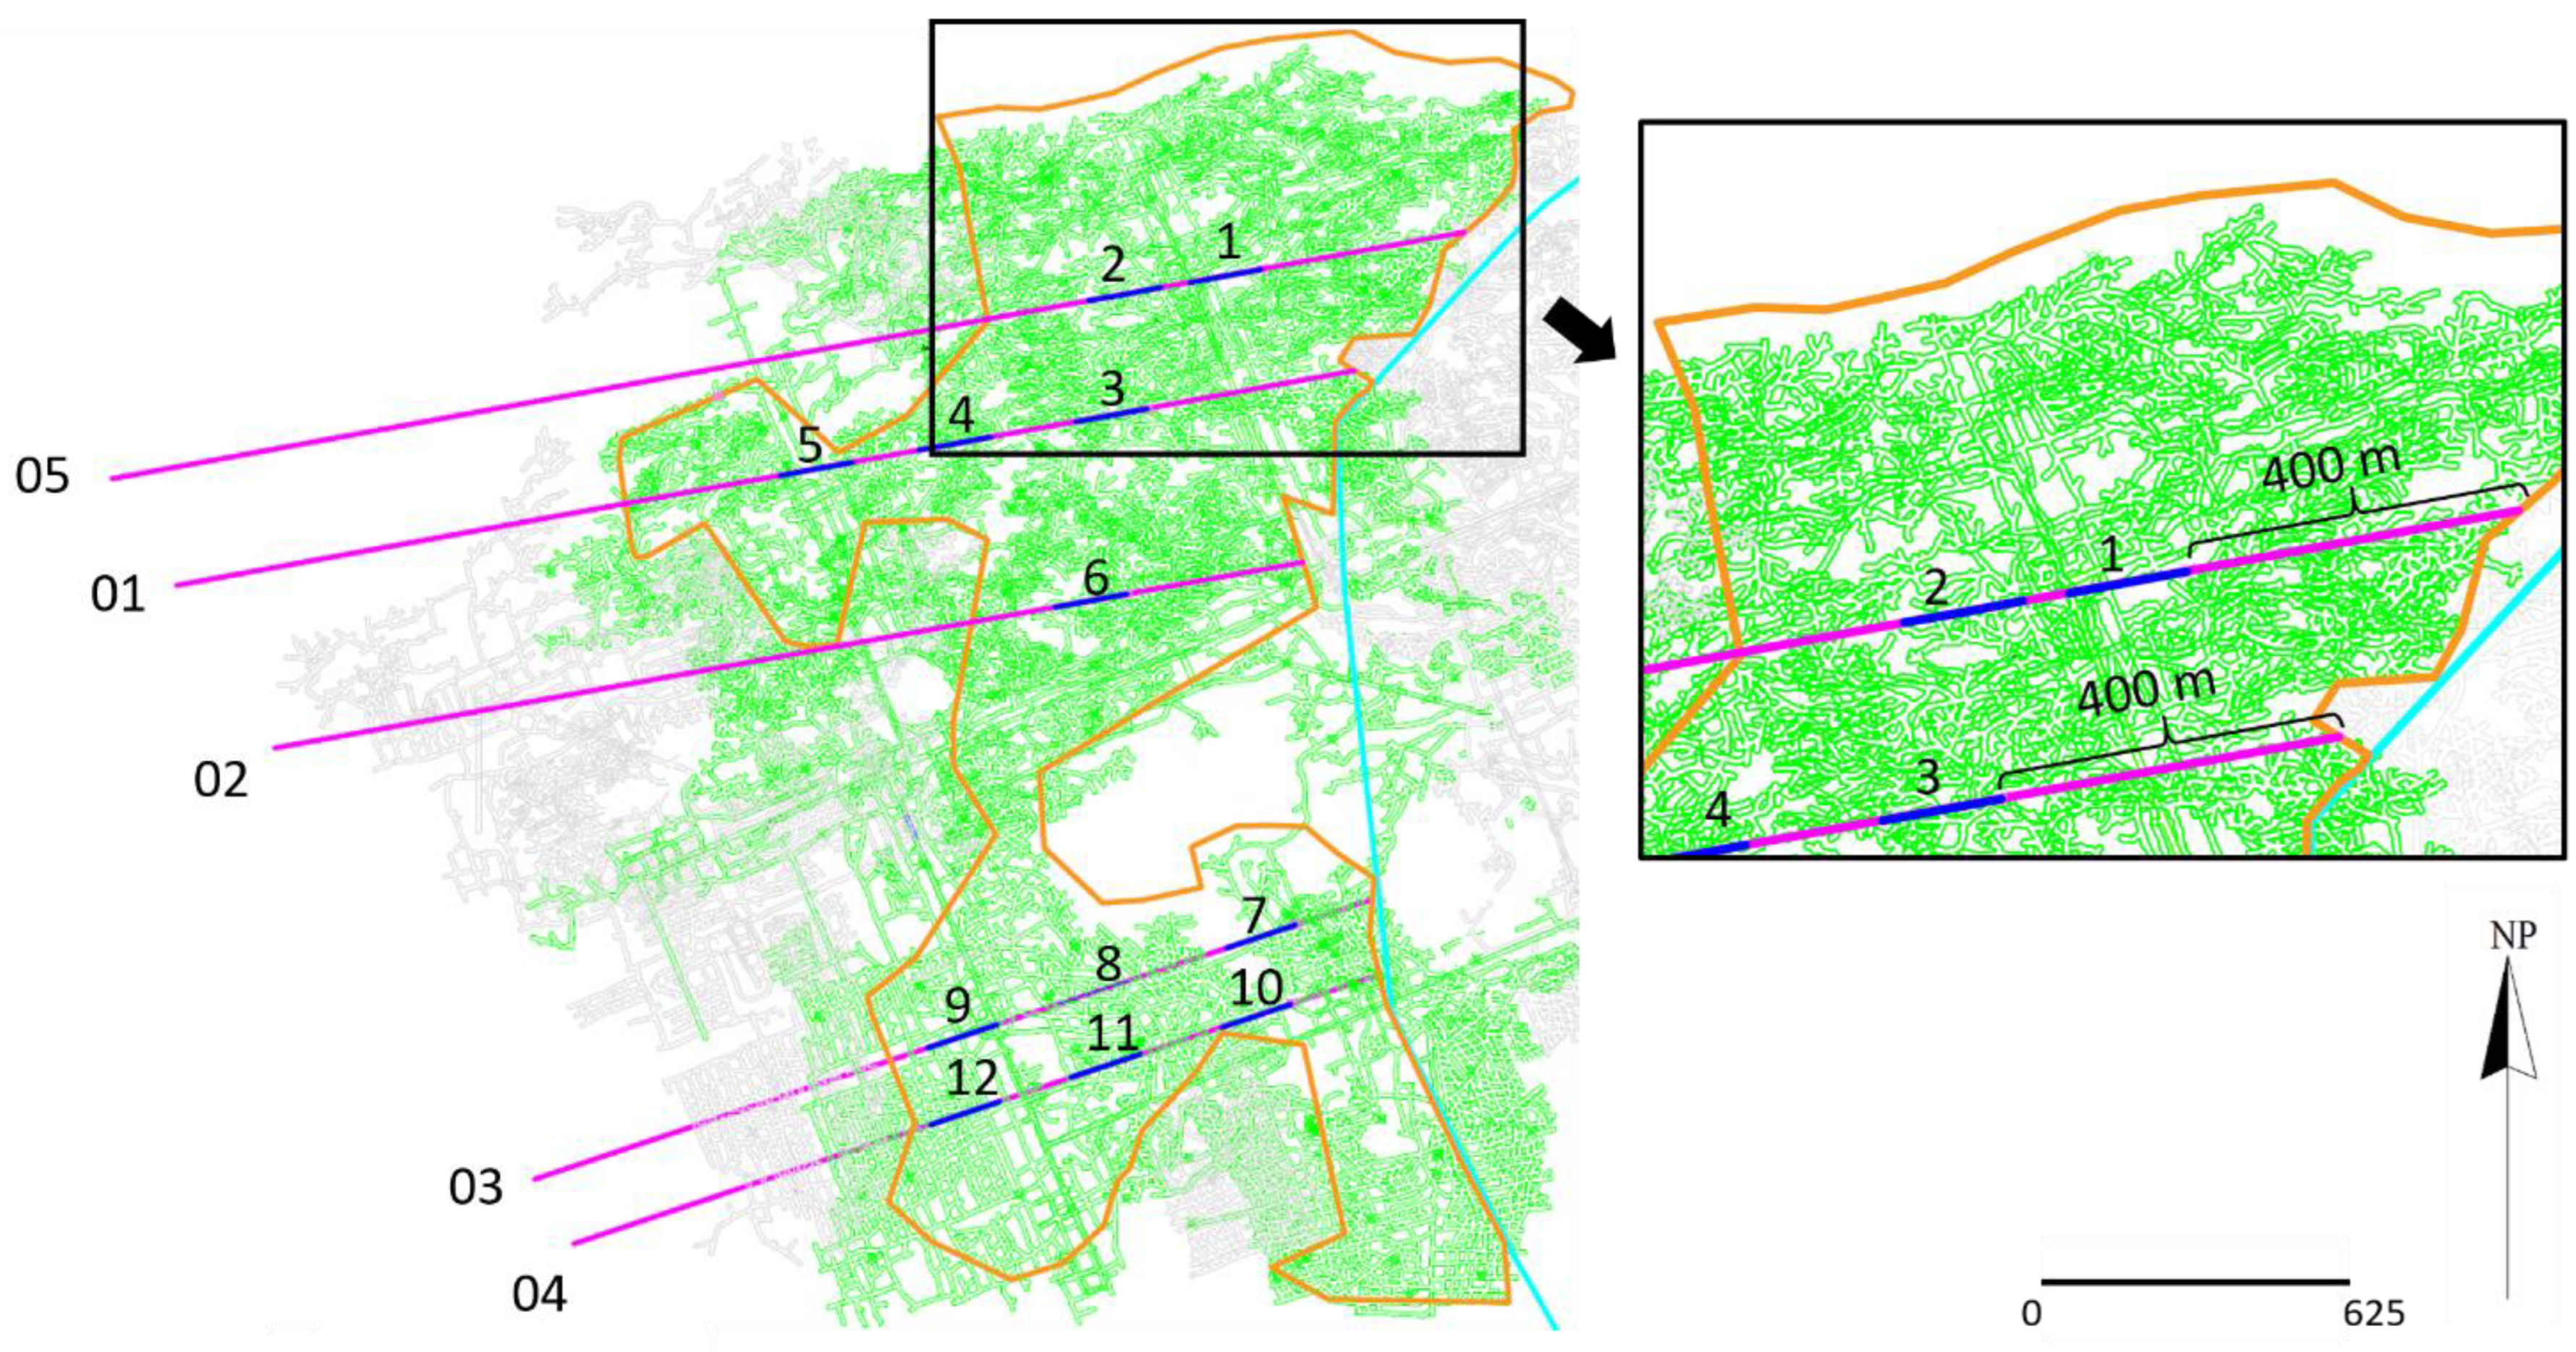
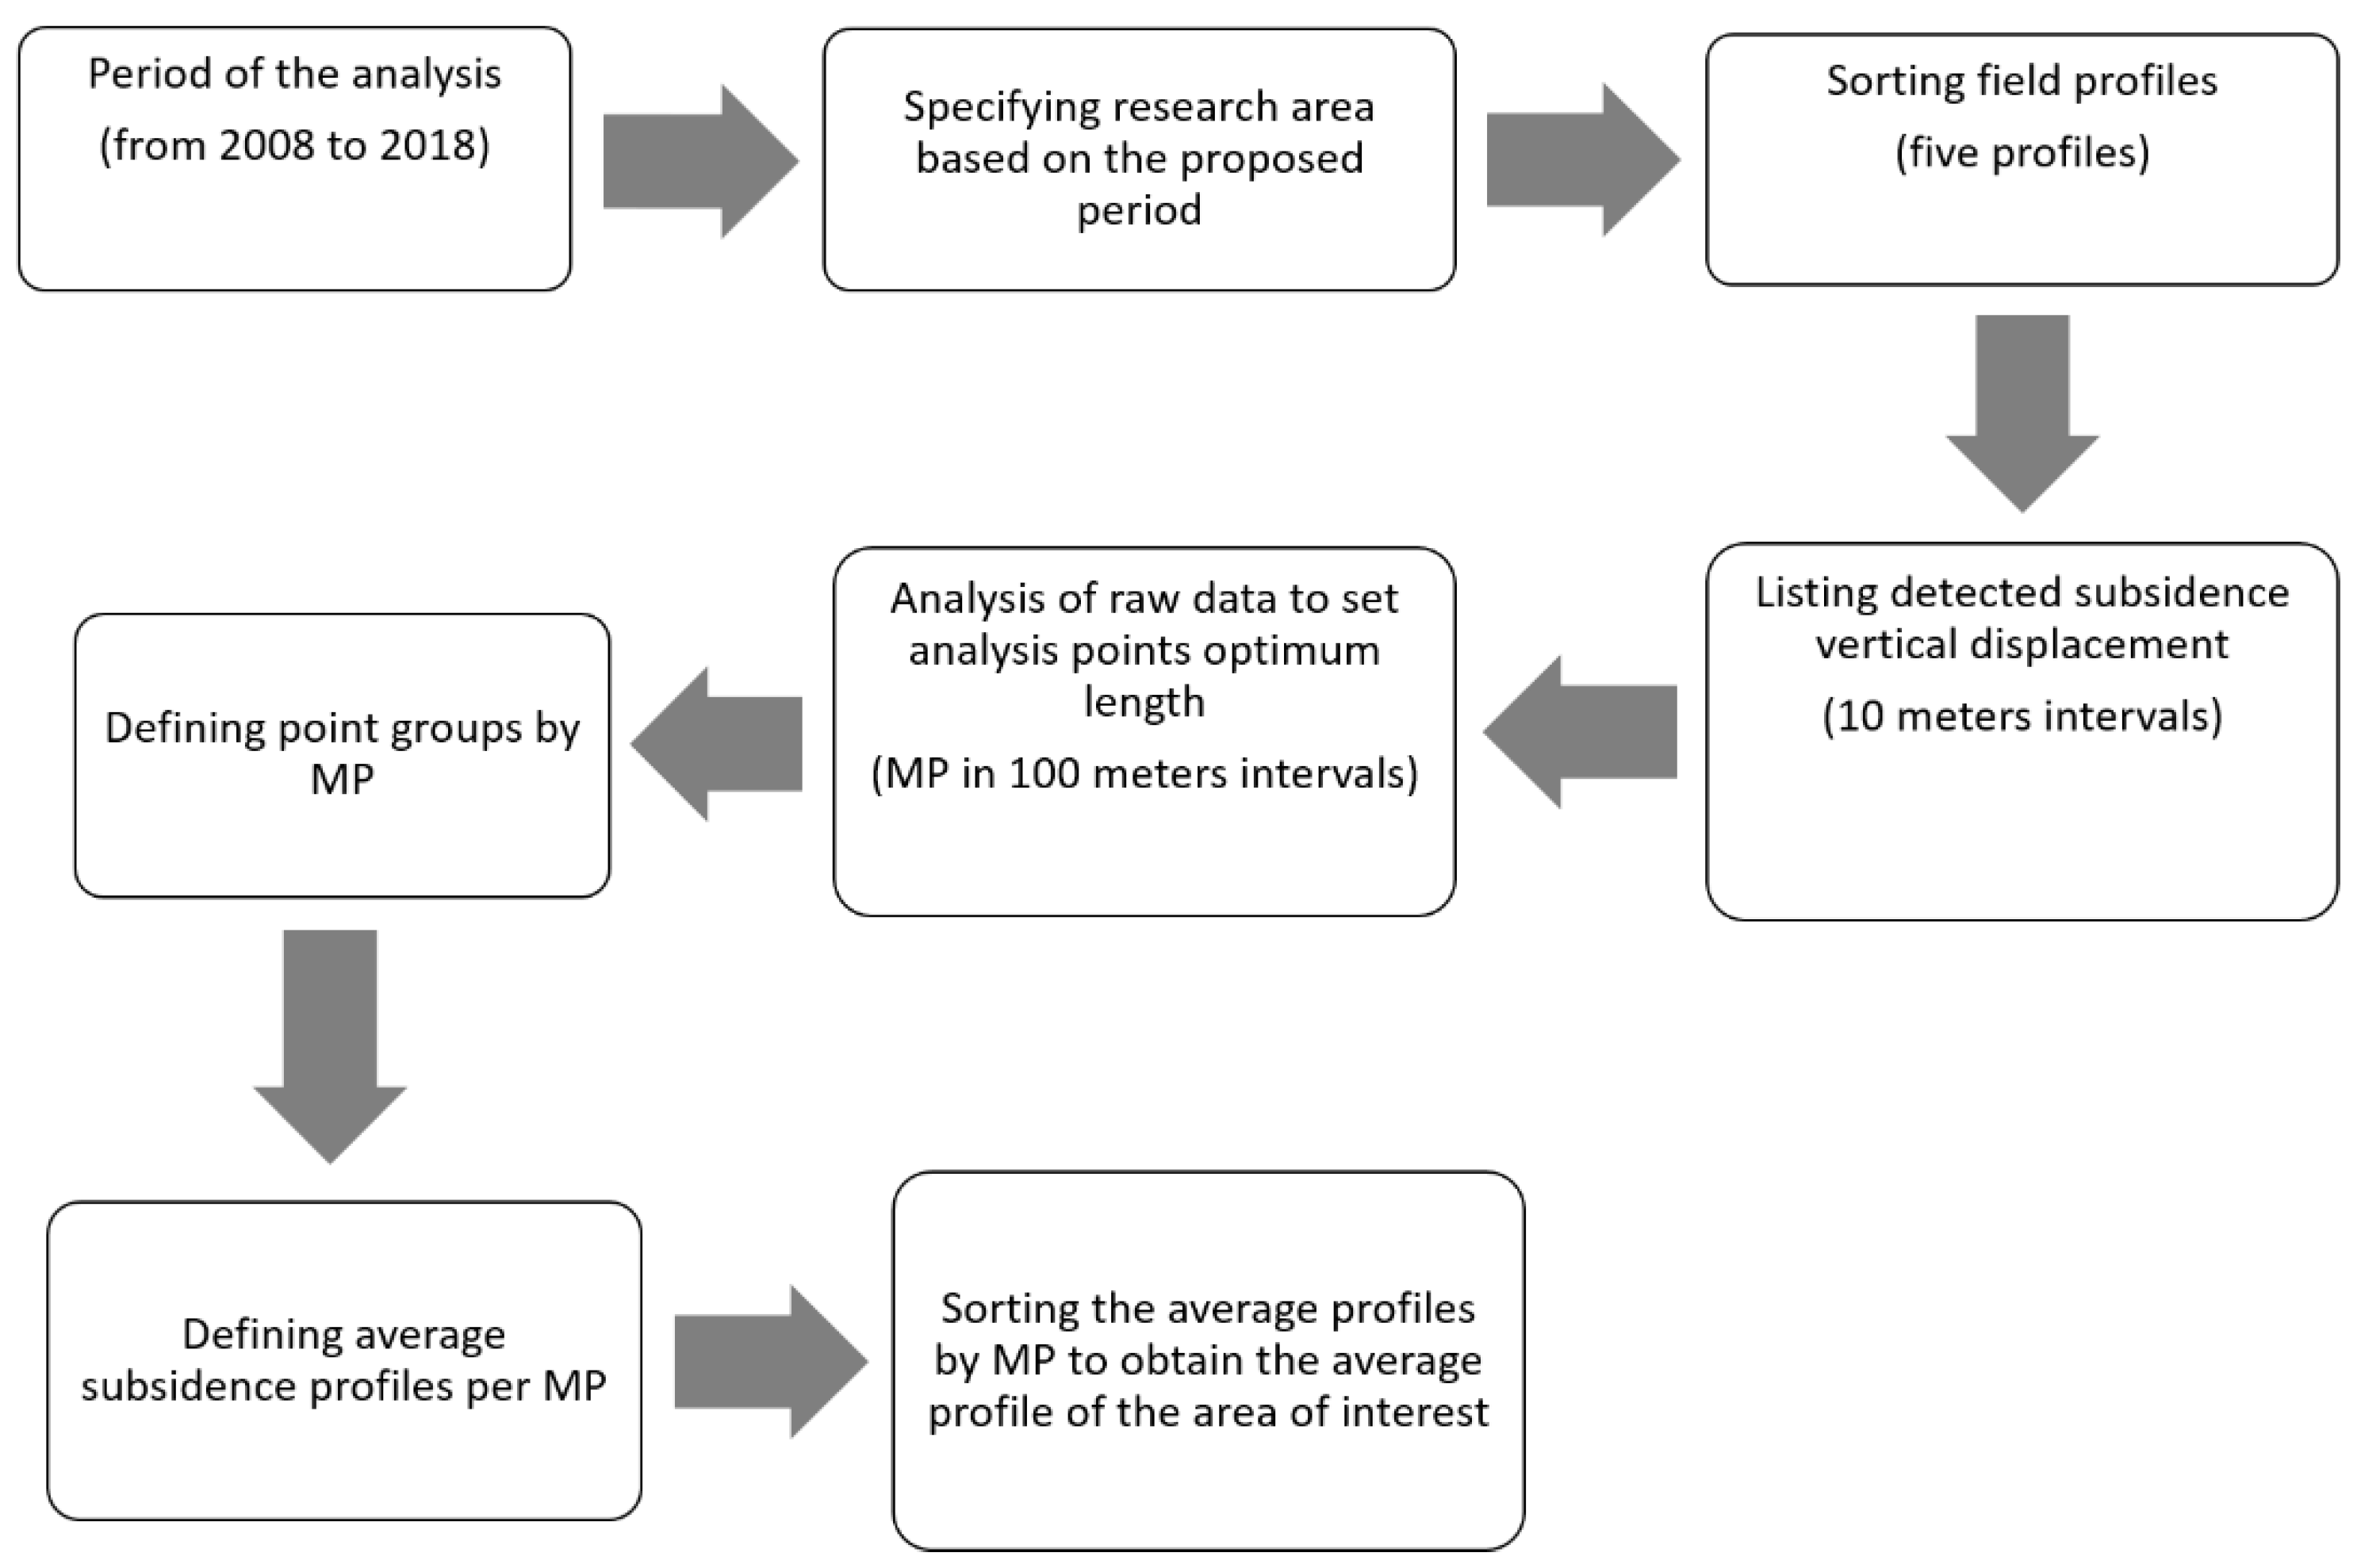
2.1. Data Management
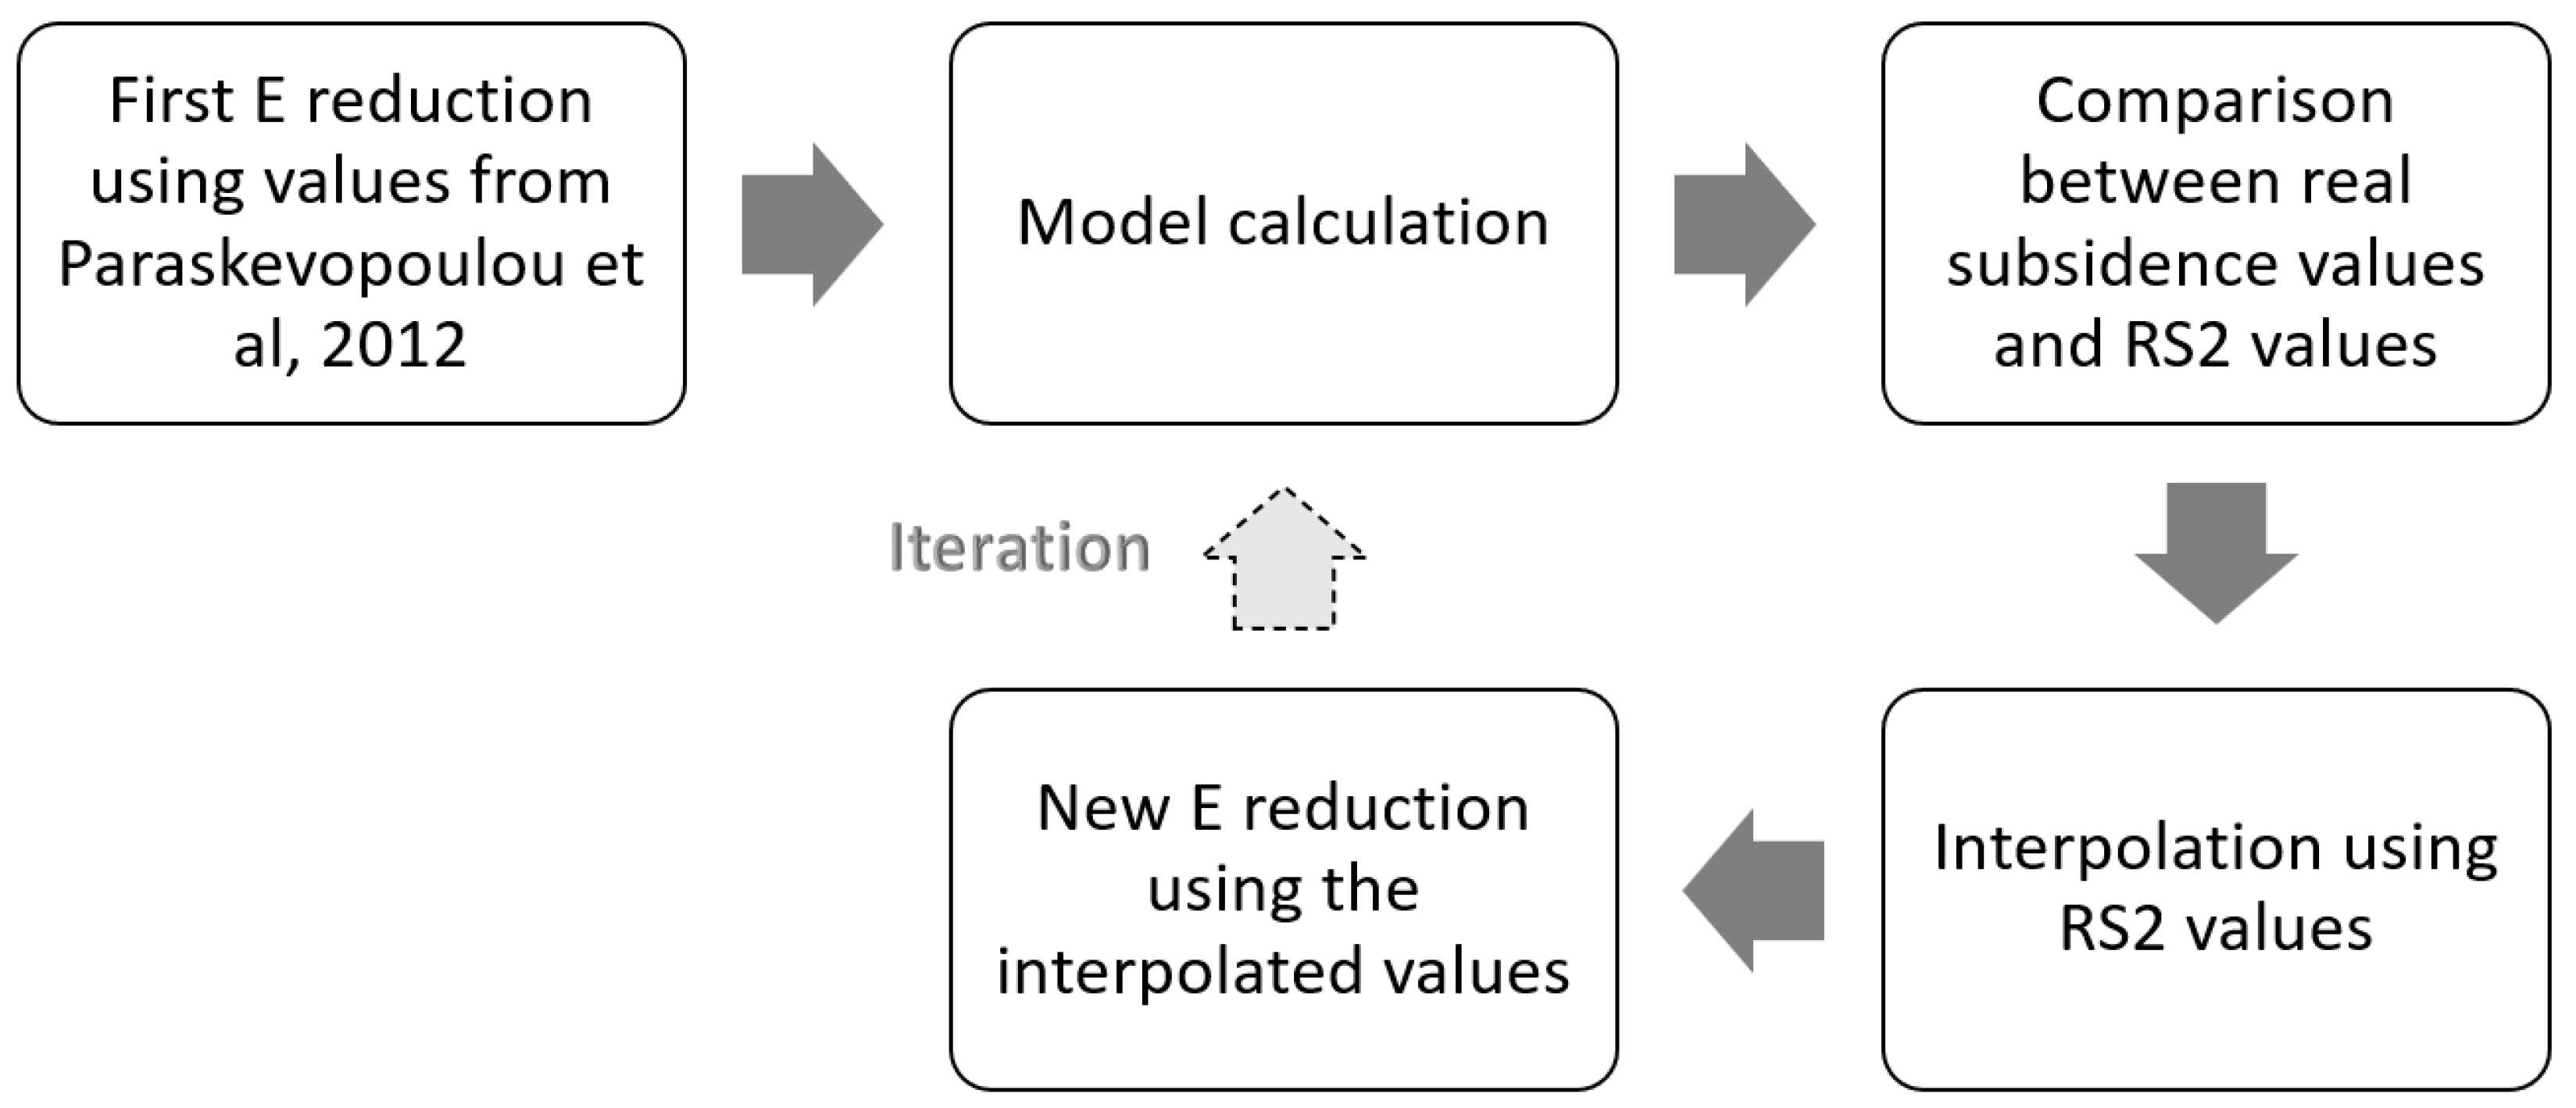
2.2. Data Processing
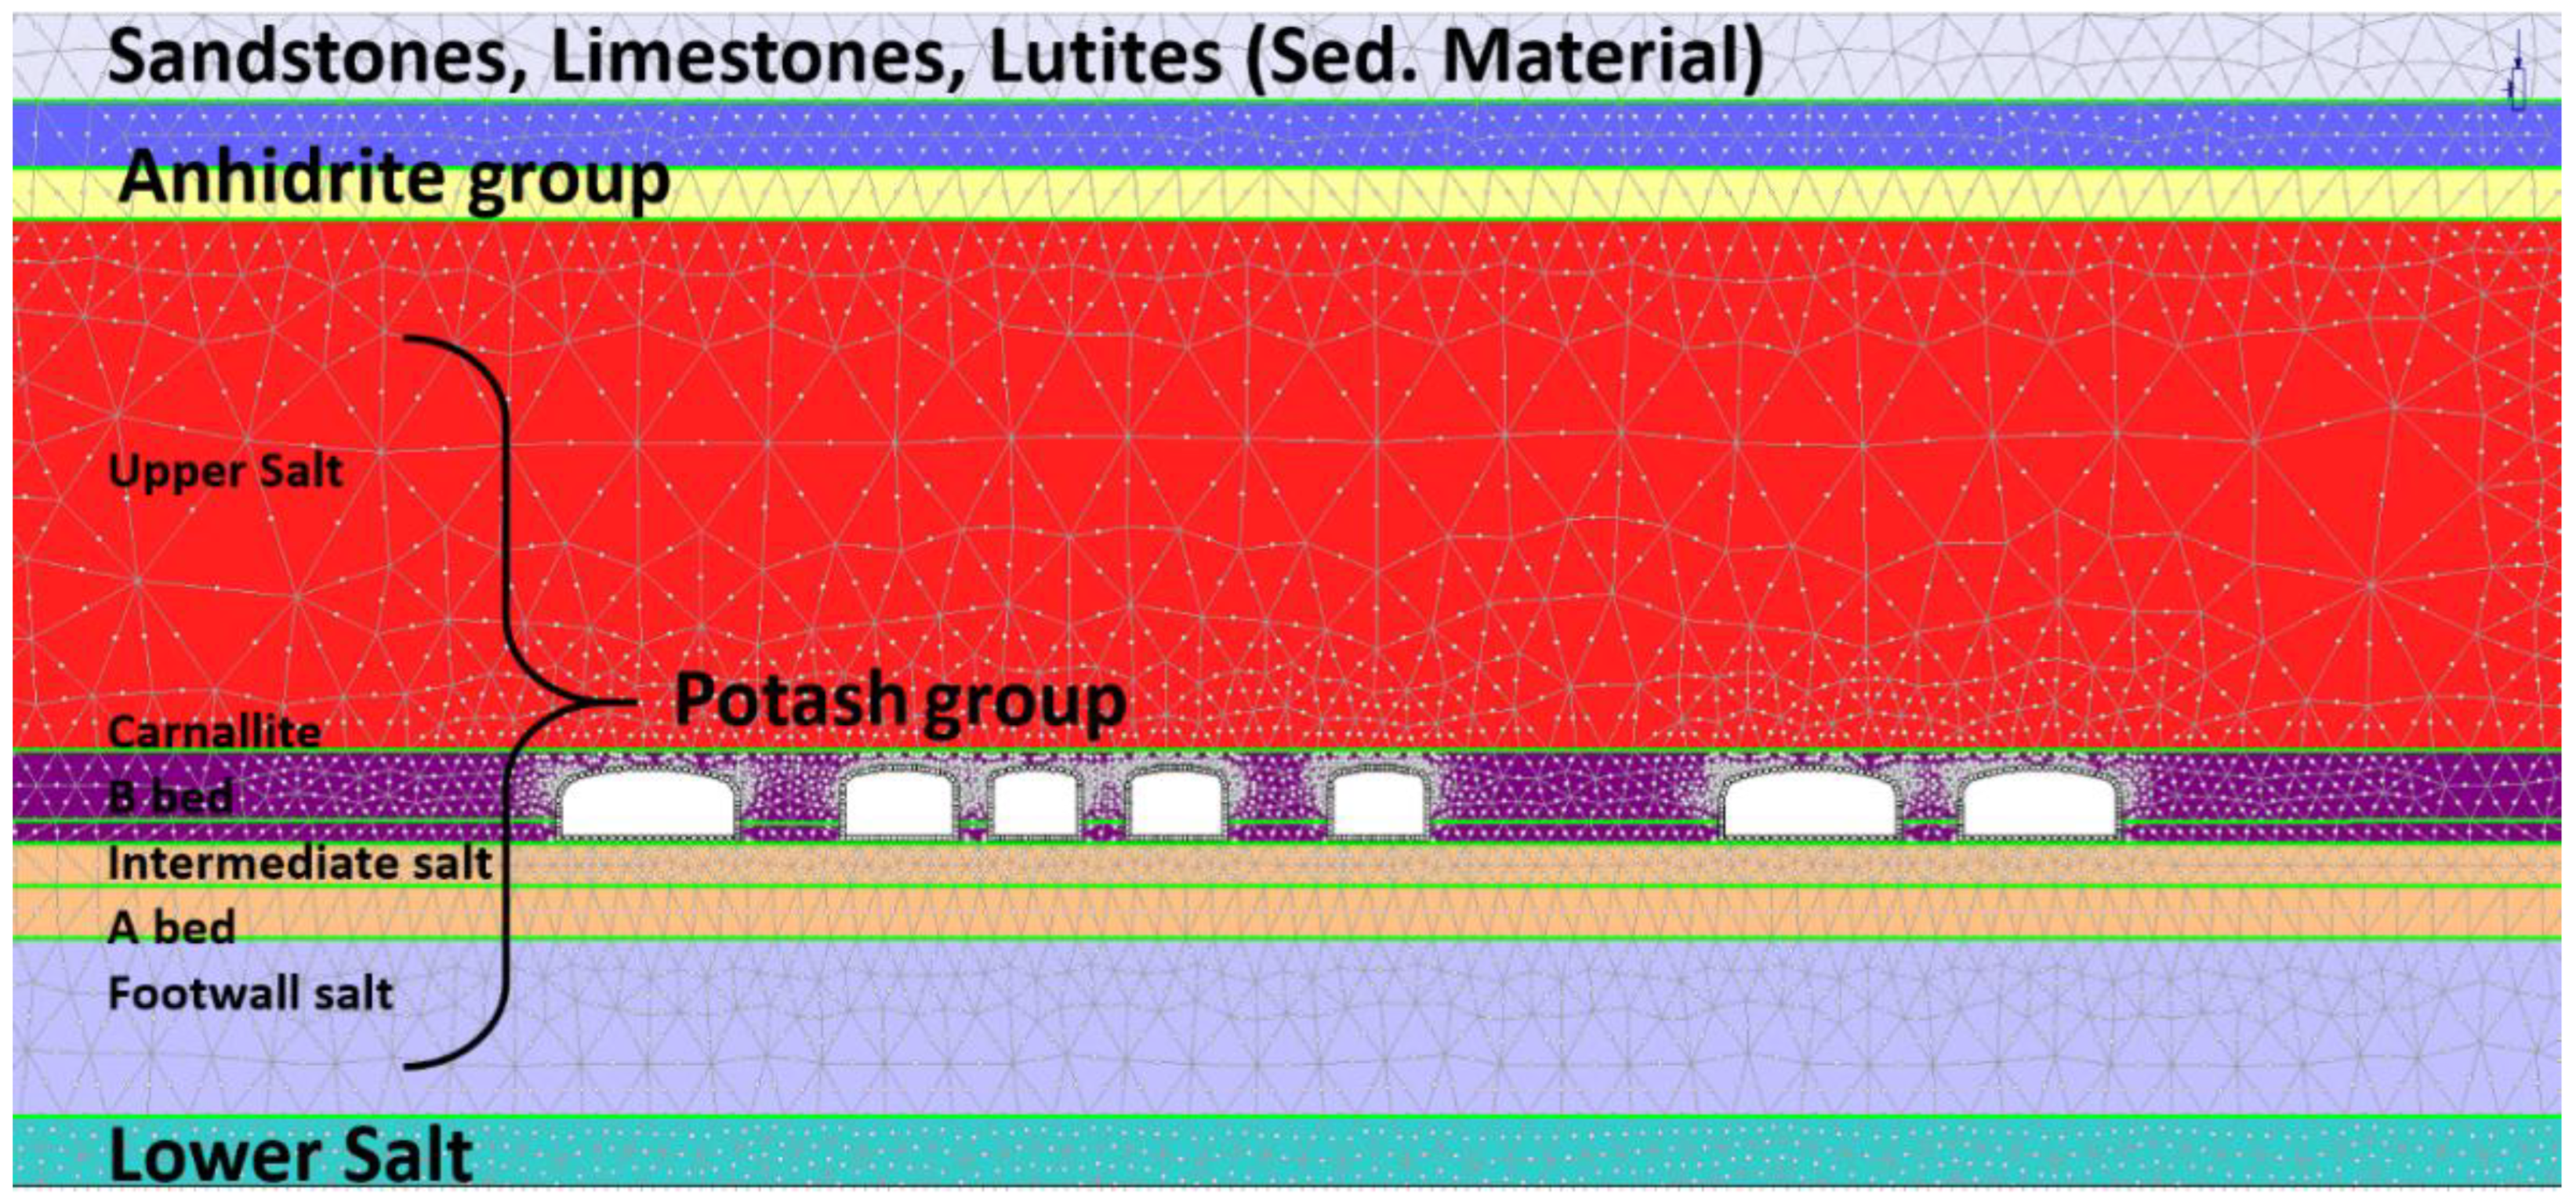
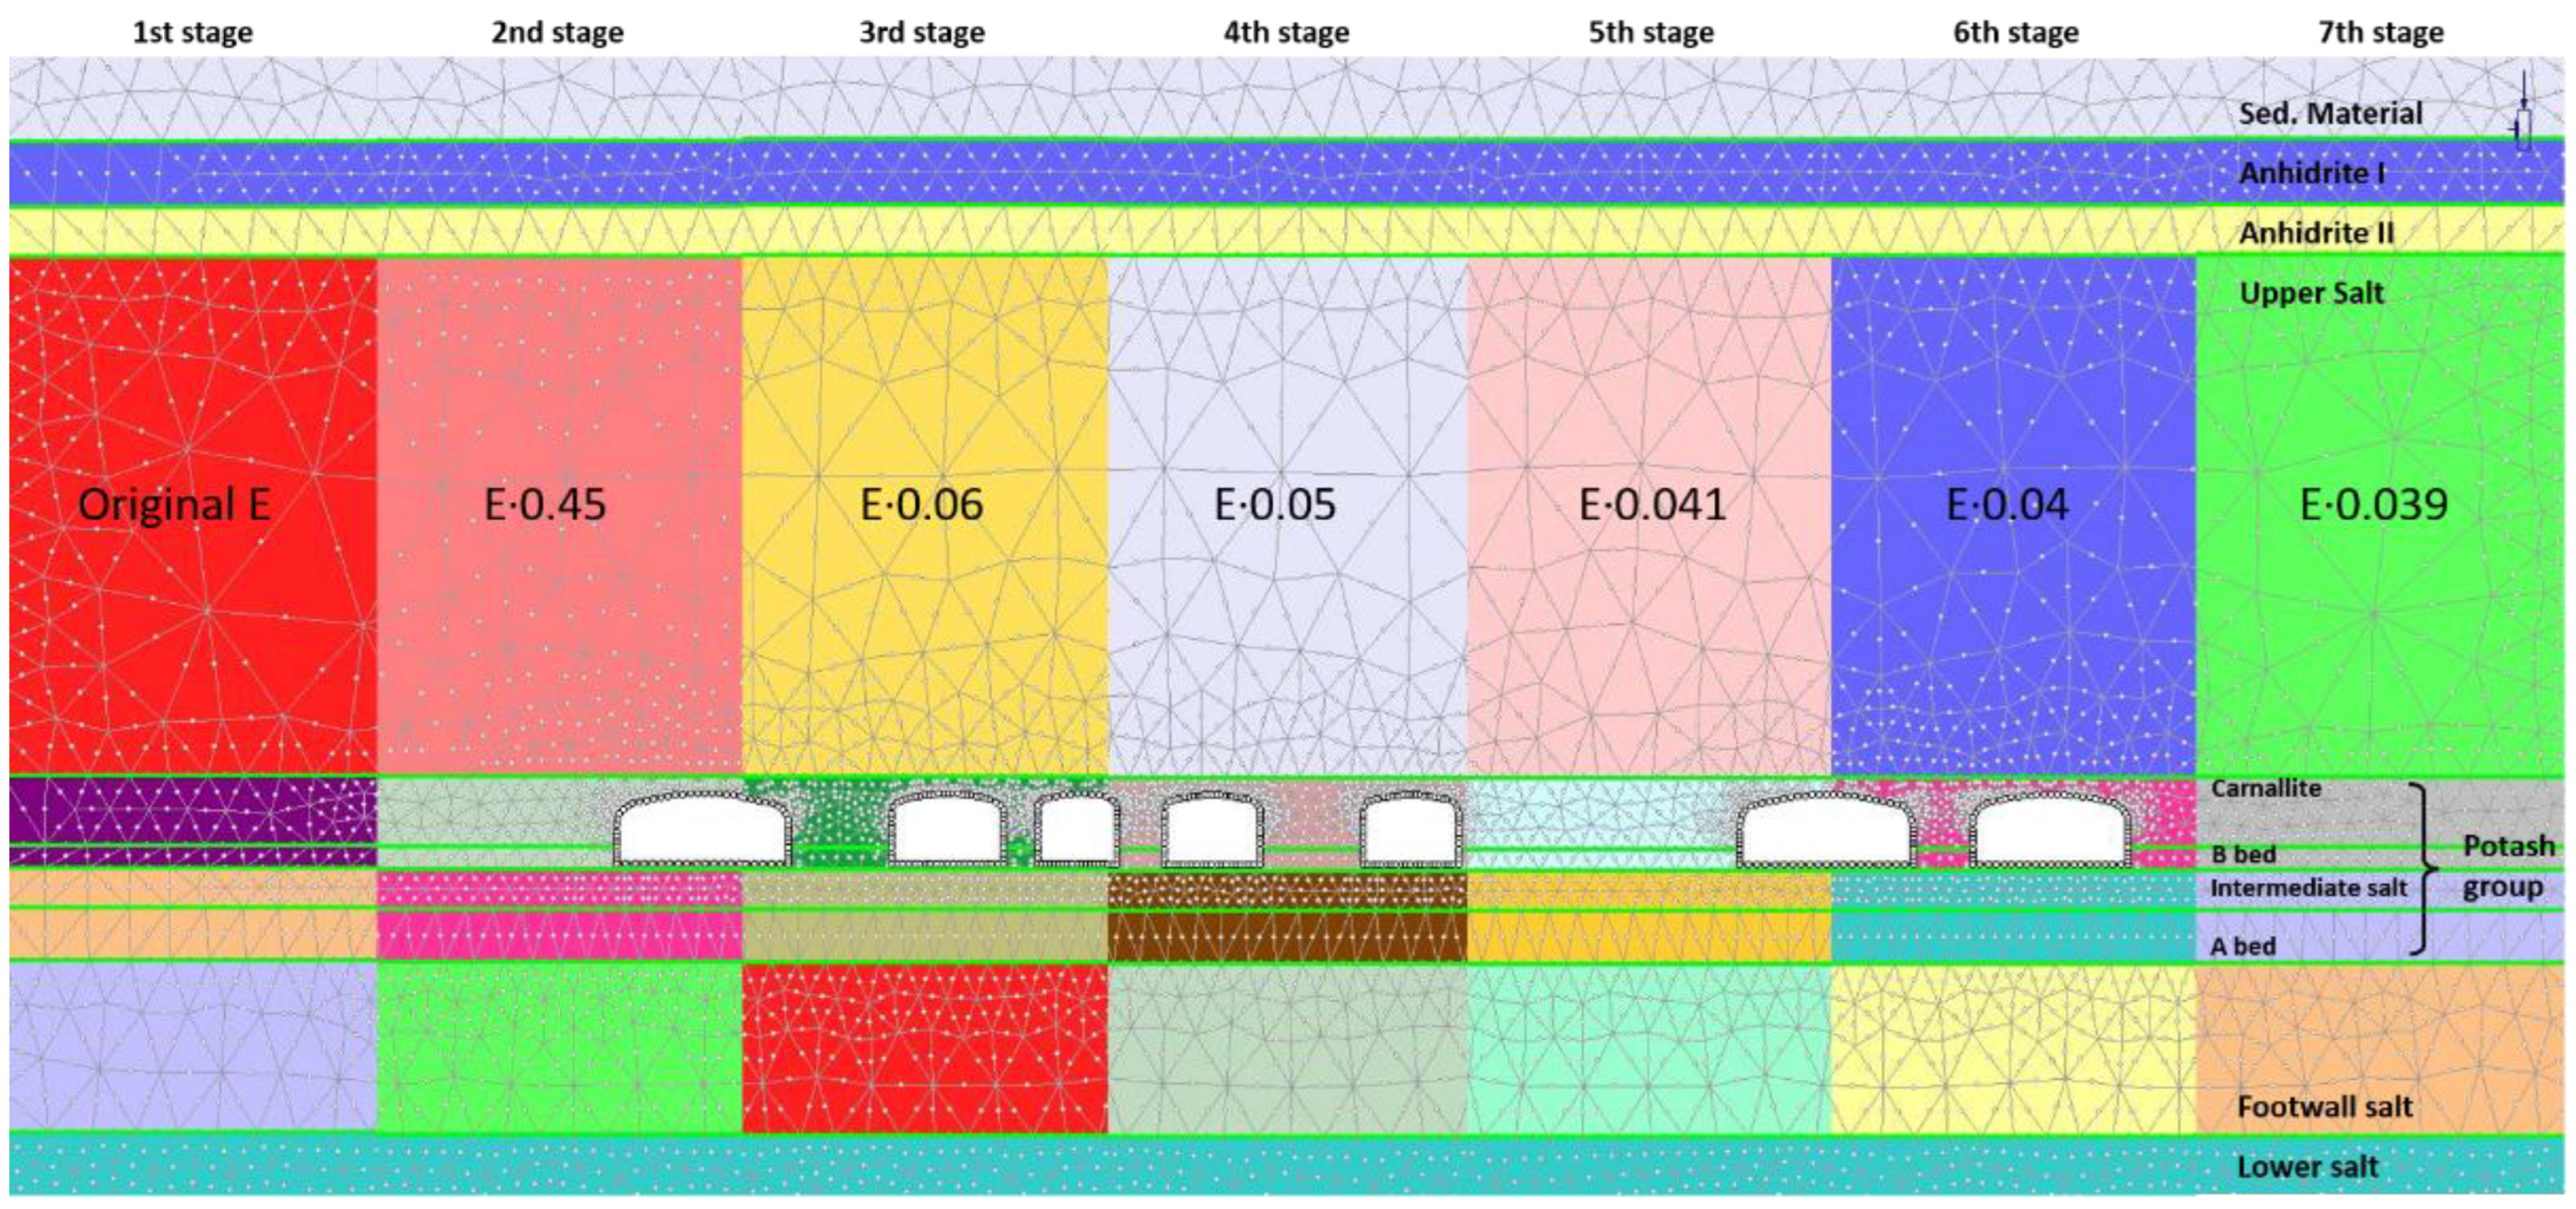
2.3. Numerical Model Definition
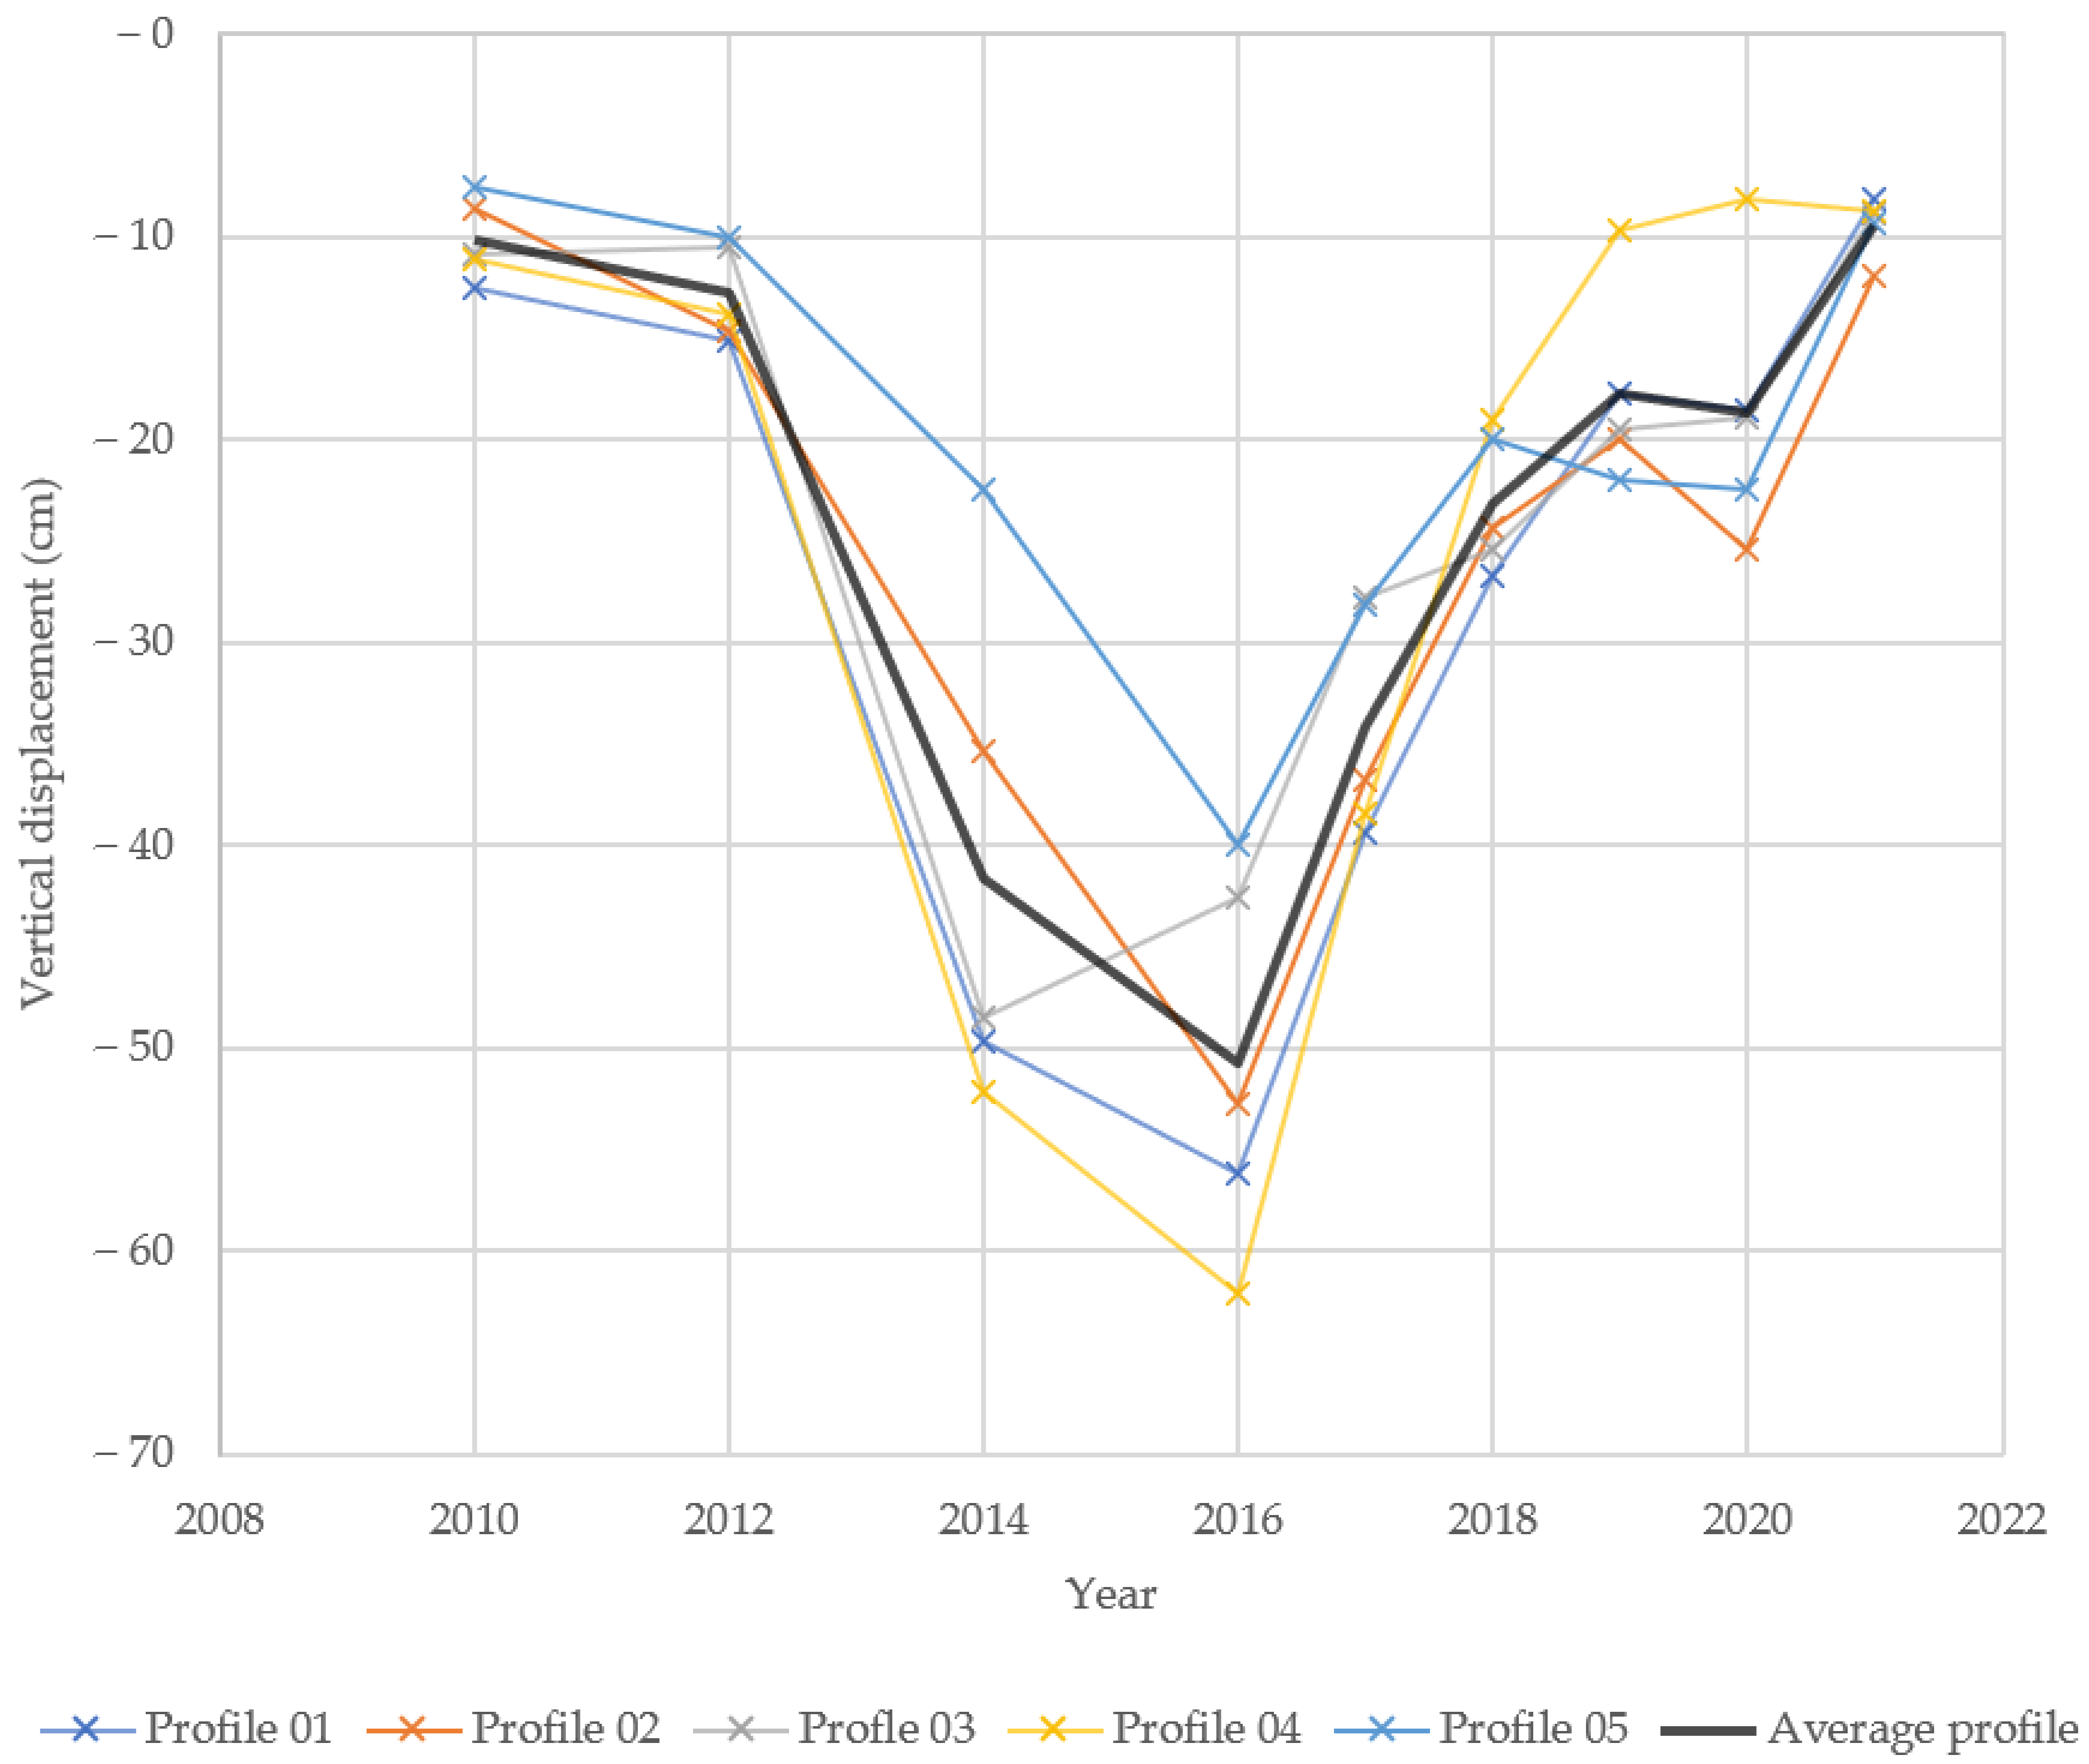
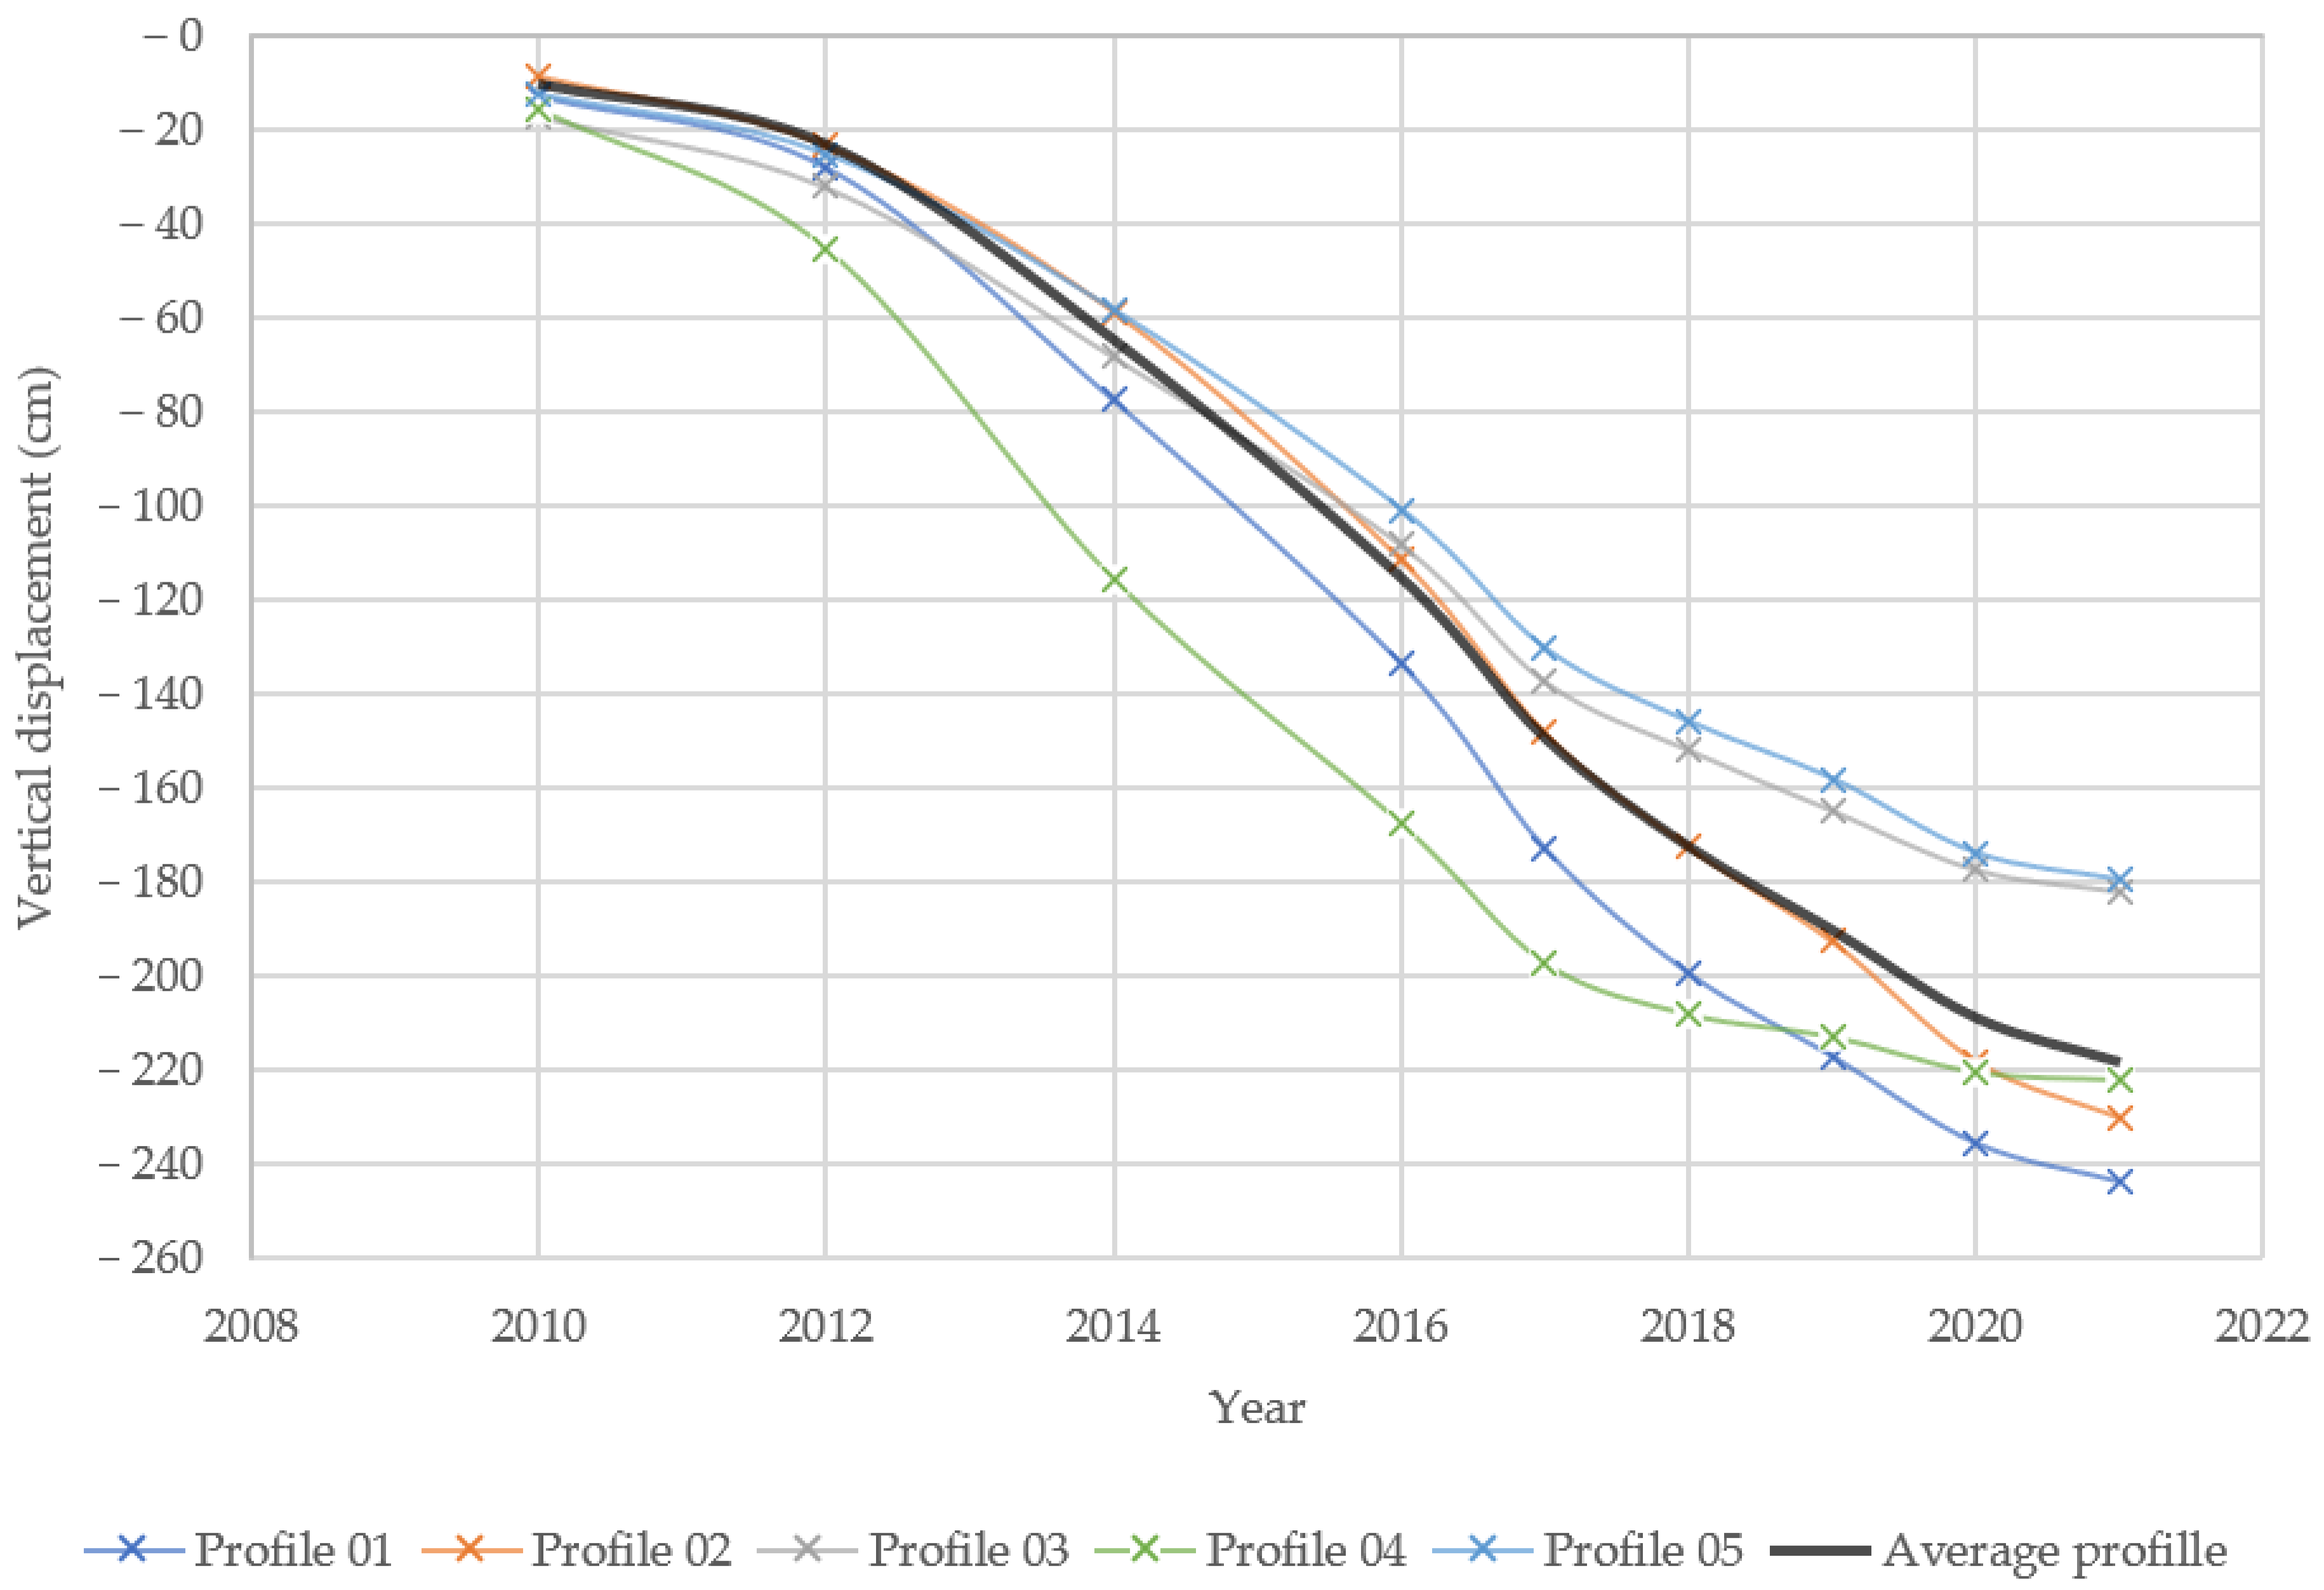
3. Results and Discussion
4. Conclusions
Author Contributions
Funding
Acknowledgments
Conflicts of Interest
References
- Vintró Sánchez, C.; Comajuncosa, J.M. Corporate social responsibility in the mining industry: Criteria and indicators. Dyna 2010, 77, 31–41. [Google Scholar]
- Sanz, J.; Tomasa, O.; Jimenez-Franco, A.; Sidki-Rius, N. Elements and mineral resources. In Nature; Springer International Publishing AG: Cham, Switzerland, 2022. [Google Scholar]
- Álvarez-Vigil, A.; González-Nicieza, C.; Gayarre, F.L.; Álvarez-Fernández, M. Forensic analysis of the evolution of damages to buildings constructed in a mining area (Part II). Eng. Fail. Anal. 2010, 17, 938–960. [Google Scholar] [CrossRef]
- Gayarre, F.L.; Álvarez-Fernández, M.; González-Nicieza, C.; Álvarez-Vigil, A.; García, G.H. Forensic analysis of buildings affected by mining subsidence. Eng. Fail. Anal. 2010, 17, 270–285. [Google Scholar] [CrossRef]
- Helm, P.; Davie, C.; Glendinning, S. Numerical modelling of shallow abandoned mine working subsidence affecting transport infrastructure. Eng. Geol. 2013, 154, 6–19. [Google Scholar] [CrossRef]
- Kratzsch, H. Mining Subsidence Engineering; Springer Science & Business Media: Berlin/Heidelberg, Germany, 2012. [Google Scholar]
- Virgone, K.M.; Ramirez-Andreotta, M.; Mainhagu, J.; Brusseau, M.L. Effective integrated frameworks for assessing mining sustainability. Environ. Geochem. Health 2018, 40, 2635–2655. [Google Scholar] [CrossRef]
- Figueroa-Miranda, S.; Tuxpan-Vargas, J.; Ramos-Leal, J.A.; Hernández-Madrigal, V.M.; Villaseñor-Reyes, C.I. Land subsidence by groundwater over-exploitation from aquifers in tectonic valleys of Central Mexico: A review. Eng. Geol. 2018, 246, 91–106. [Google Scholar] [CrossRef]
- Commission of the European Communities. Promoting Sustainable Development in the EU Non-Energy Extractive Industry; Office for Official Publications of the European Communities: Luxembourg, 2000. [Google Scholar]
- Ford, C. Towards sustainable mining: The Canadian mining industry sustainability initiative. In A Review on Indicators of Sustainability for the Minerals Extraction Industries; Bôas, R.C.V., Shields, D.J., Šolar, S.V., Anciaux, P., Önal, G., Eds.; CYTED-CETEM: Rio de Janeiro, Brazil, 2004. [Google Scholar]
- Nadiri, A.A.; Habibi, I.; Gharekhani, M.; Sadeghfam, S.; Barzegar, R.; Karimzadeh, S. Introducing dynamic land subsidence index based on the ALPRIFT framework using artificial intelligence techniques. Earth Sci. Inform. 2022, 15, 1007–1021. [Google Scholar] [CrossRef]
- Nadiri, A.A.; Moazamnia, M.; Sadeghfam, S.; Barzegar, R. Mapping risk to land subsidence: Developing a two-level modeling strategy by combining multi-criteria decision-making and artificial intelligence techniques. Water 2021, 13, 2622. [Google Scholar] [CrossRef]
- Gharekhani, M.; Nadiri, A.A.; Khatibi, R.; Sadeghfam, S. An investigation into time-variant subsidence potentials using inclusive multiple modelling strategies. J. Environ. Manag. 2021, 294, 112949. [Google Scholar] [CrossRef]
- United Nations. The Sustainable Development Goals Report; United Nations: New York, NY, USA, 2022; ISBN 978-92-1-101448-8. [Google Scholar]
- HUNTS. Surface Subsidence Due to Coal Mining in Illinois. Ph.D. Thesis, University of Illinois at Urbana, Champaign, IL, USA, 1980. [Google Scholar]
- Govindan, K.; Kannan, D.; Shankar, K.M. Evaluating the drivers of corporate social responsibility in the mining industry with multi-criteria approach: A multi-stakeholder perspective. J. Clean. Prod. 2014, 84, 214–232. [Google Scholar] [CrossRef]
- Broughton, P.L. Economic geology of southern Saskatchewan potash mines. Ore Geol. Rev. 2019, 113, 103117. [Google Scholar] [CrossRef]
- Arndt, N.T.; Fontboté, L.; Hedenquist, J.; Kesler, S.E.; Thompson, J.F.; Wood, D.G. Future global mineral resources. Geochem. Perspect. 2017, 6, 1–171. [Google Scholar] [CrossRef]
- Kesler, S.E.; Simon, A.C.; Simon, A.F. Mineral, Resources, Economics and the Environment; Cambridge University Press: Cambridge, UK, 2015. [Google Scholar]
- Baryakh, A.; Fedoseev, A.; Lobanov, S. Deformations and fracture of rock strata during deep level potash mining. Procedia Struct. Integr. 2021, 32, 109–116. [Google Scholar] [CrossRef]
- Paraskevopoulou, C.; Vlachopoulos, N.; Diederichs, M.S. Long term tunnel behaviour and support response analysis using 2D numerical modelling methods. In Proceedings of the 46th US Rock Mechanics/Geomechanics Symposium, Chicago, IL, USA, 24–27 June 2012. [Google Scholar]
- Kovalskii, E.R.; Gromtsev, K.V. Development of the technology of stowing the developed space during mining. J. Min. Inst. 2022, 254, 202–209. [Google Scholar] [CrossRef]
- Khayrutdinov, A.M.; Kongar-Syuryun, C.B.; Kowalik, T.; Tyulyaeva, Y.S. Stress-strain behavior control in rock mass using different-strength backfill. Min. Inf. Anal. Bull. 2020, 10, 42–55. [Google Scholar] [CrossRef]
- Ermolovich, E.A.; Ivannikov, A.L.; Khayrutdinov, M.M.; Kongar-Syuryun, C.B.; Tyulyaeva, Y.S. Creation of a nanomodified backfill based on the waste from enrichment of water-soluble ores. Materials 2022, 15, 3689. [Google Scholar] [CrossRef]
- Marketos, G.; Spiers, C.J.; Govers, R. Impact of rock salt creep law choice on subsidence calculations for hydrocarbon reservoirs overlain by evaporite caprocks. J. Geophys. Res. Solid Earth 2016, 121, 4249–4267. [Google Scholar] [CrossRef]
- Whyatt, J.; Varley, F. Catastrophic failures of underground evaporite mines. In Proceedings of the 27th International Conference on Ground Control in Mining, Morgantown, WV, USA, 29–31 July 2008; College of Engineering and Mineral Resources, West Virginia University: Morgantown, WV, USA, 2008; Volume 2008, p. 113. [Google Scholar]
- King, M. Creep in model pillars of saskatchewan potash. Int. J. Rock Mech. Min. Sci. Géoméch. Abstr. 1973, 10, 363–371. [Google Scholar] [CrossRef]
- Rybak, J.; Khayrutdinov, M.M.; Kuziev, D.A.; Kongar-Syuryun, C.B.; Babyr, N.V. Prediction of the geomechanical state of the rock mass when mining salt deposits with stowing. J. Min. Inst. 2022, 253, 61–70. [Google Scholar] [CrossRef]
- Migliazza, M.; Chiorboli, M.; Giani, G. Comparison of analytical method, 3D finite element model with experimental subsidence measurements resulting from the extension of the Milan underground. Comput. Geotech. 2009, 36, 113–124. [Google Scholar] [CrossRef]
- Parmar, H.; Bafghi, A.Y.; Najafi, M. Impact of ground surface subsidence due to underground mining on surface infrastructure: The case of the Anomaly No. 12 Sechahun, Iran. Environ. Earth Sci. 2019, 78, 409. [Google Scholar] [CrossRef]
- Xu, N.; Kulatilake, P.H.; Tian, H.; Wu, X.; Nan, Y.; Wei, T. Surface subsidence prediction for the WUTONG mine using a 3-D finite difference method. Comput. Geotech. 2013, 48, 134–145. [Google Scholar] [CrossRef]
- Vlachopoulos, N. Back Analysis of a Tunnelling Case Study in Weak Rock of the Alpine System in Northern Greece: Validation and Optimization of Design Analysis Based on Ground Characterization and Numerical Simulation; Library and Archives Canada: Ottawa, ON, Canada, 2011. [Google Scholar]
- Diederichs, M.S. The 2003 Canadian Geotechnical Colloquium: Mechanistic interpretation and practical application of damage and spalling prediction criteria for deep tunnelling. Can. Geotech. J. 2007, 44, 1082–1116. [Google Scholar] [CrossRef]
- Asadi, A.; Shahriar, K.; Goshtasbi, K.; Najm, K. Development of a new mathematical model for prediction of surface subsidence due to inclined coal-seam mining. J. South. Afr. Inst. Min. Metall. 2005, 105, 15–20. [Google Scholar]
- Donnelly, L.; De La Cruz, H.; Asmar, I.; Zapata, O.; Perez, J. The monitoring and prediction of mining subsidence in the Amaga, Angelopolis, Venecia and Bolombolo Regions, Antioquia, Colombia. Eng. Geol. 2001, 59, 103–114. [Google Scholar] [CrossRef]
- Sheorey, P.; Loui, J.; Singh, K.; Singh, S. Ground subsidence observations and a modified influence function method for complete subsidence prediction. Int. J. Rock Mech. Min. Sci. 2000, 37, 801–818. [Google Scholar] [CrossRef]
- Scott, D.; Anumba, C.J. A knowledge-based system for the engineering management of subsidence cases. Struct. Eng. 1999, 77, 3. [Google Scholar]
- Peng, S.S. Surface Subsidence Engineering; Society for Mining, Metallurgy, and Exploration, Inc.: Littleton, CO, USA, 1992. [Google Scholar]
- Bahuguna, P.; Srivastava, A.; Saxena, N. A critical review of mine subsidence prediction methods. Int. J. Min. Sci. Technol. 1991, 13, 369–382. [Google Scholar] [CrossRef]
- Sanmiquel, L.; Bascompta, M.; Vintró, C.; Yubero, T. Subsidence management system for underground mining. Minerals 2018, 8, 243. [Google Scholar] [CrossRef]
- Carnec, C.; Delacourt, C. Three years of mining subsidence monitored by SAR interferometry, near Gardanne, France. J. Appl. Geophys. 2000, 43, 43–54. [Google Scholar] [CrossRef]
- Zhang, A.; Lu, J.; Kim, J.-W. Detecting mining-induced ground deformation and associated hazards using spaceborne InSAR techniques. Geomat. Nat. Hazards Risk 2017, 9, 211–223. [Google Scholar] [CrossRef]
- Modeste, G.; Doubre, C.; Masson, F. Time evolution of mining-related residual subsidence monitored over a 24-year period using InSAR in southern Alsace, France. Int. J. Appl. Earth Obs. Geoinf. 2021, 102, 102392. [Google Scholar] [CrossRef]
- Choi, J.-K.; Won, J.-S.; Lee, S.; Kim, S.-W.; Kim, K.-D.; Jung, H.-S. Integration of a subsidence model and SAR interferometry for a coal mine subsidence hazard map in Taebaek, Korea. Int. J. Remote Sens. 2011, 32, 8161–8181. [Google Scholar] [CrossRef]
- Herrera, G.; Fernández, M.; Tomás, R.; González-Nicieza, C.; López-Sánchez, J.; Vigil, A. Forensic analysis of buildings affected by mining subsidence based on Differential Interferometry (Part III). Eng. Fail. Anal. 2012, 24, 67–76. [Google Scholar] [CrossRef]
- Samsonov, S.; Baryakh, A. Estimation of deformation intensity above a flooded potash mine near Berezniki (Perm Krai, Russia) with SAR interferometry. Remote Sens. 2020, 12, 3215. [Google Scholar] [CrossRef]
- Yang, L.; Qiu, J.; Jiang, H.; Hu, S.; Li, H.; Li, S. Use of cemented super-fine unclassified tailings backfill for control of subsidence. Minerals 2017, 7, 216. [Google Scholar] [CrossRef]
- Lee, S.; Park, I. Application of decision tree model for the ground subsidence hazard mapping near abandoned underground coal mines. J. Environ. Manag. 2013, 127, 166–176. [Google Scholar] [CrossRef]
- Bell, F.G.; Stacey, T.R.; Genske, D.D. Mining subsidence and its effect on the environment: Some differing examples. Environ. Earth Sci. 2000, 40, 135–152. [Google Scholar] [CrossRef]
- Rateb, A.; Abotalib, A.Z. Inferencing the land subsidence in the Nile Delta using Sentinel-1 satellites and GPS between 2015 and 2019. Sci. Total Environ. 2020, 729, 138868. [Google Scholar] [CrossRef]
- Bitelli, G.; Bonsignore, F.; Del Conte, S.; Novali, F.; Pellegrino, I.; Vittuari, L. Integrated use of advanced InSAR and GPS data for subsidence monitoring. In Engineering Geology for Society and Territory-Volume 5; Lollino, G., Manconi, A., Guzzetti, F., Culshaw, M., Bobrowsky, P., Luino, F., Eds.; Springer: Cham, Switzerland, 2015; pp. 147–150. [Google Scholar]
- Bürgmann, R.; Hilley, G.; Ferretti, A.; Novali, F. Resolving vertical tectonics in the San Francisco Bay Area from permanent scatterer InSAR and GPS analysis. Geology 2006, 34, 221. [Google Scholar] [CrossRef]
- de Orellana, A.C. Pressure solution creep and non-associated plasticity in the mechanical behavior of potash mine openings. Int. J. Rock Mech. Min. Sci. Géoméch. Abstr. 1996, 33, 347–370. [Google Scholar] [CrossRef]
- Cendón, D.; Ayora, C.; Pueyo, J.; Taberner, C. The geochemical evolution of the Catalan potash subbasin, South Pyrenean foreland basin (Spain). Chem. Geol. 2003, 200, 339–357. [Google Scholar] [CrossRef]


| Lithology | Sedimentary Material | Anhydrite Material 01 | Anhydrite Material 02 | Upper Salt | Potassic Layer 01 | Potassic Layer 02 | Footwall Salt | Lower Salt |
|---|---|---|---|---|---|---|---|---|
| Unit weight (kN/m3) | 26.55 | 29.7 | 23.5 | 23.7 | 19.8 | 21 | 21 | 21 |
| Poisson ratio | 0.31 | 0.3 | 0.26 | 0.29 | 0.145 | 0.215 | 0.2 | 0.2 |
| Young’s modulus (kPa) | 3.57 × 10⁷ | 4 × 10⁷ | 3.09 × 10⁶ | 5.3 × 10⁶ | 5.19 × 10⁶ | 2.19 × 10⁶ | 1.38 × 10⁶ | 1.38 × 10⁶ |
| Tensile strength (kPa) | 4850 | 6040 | 2680 | 3900 | 2330 | 2650 | 2500 | 2500 |
| Friction angle (degrees) | 34 | 33 | 30 | 35 | 36 | 45 | 45 | 35 |
| Cohesion (kPa) | 6970 | 13,600 | 9755 | 3800 | 2100 | 3277.5 | 2900 | 2900 |
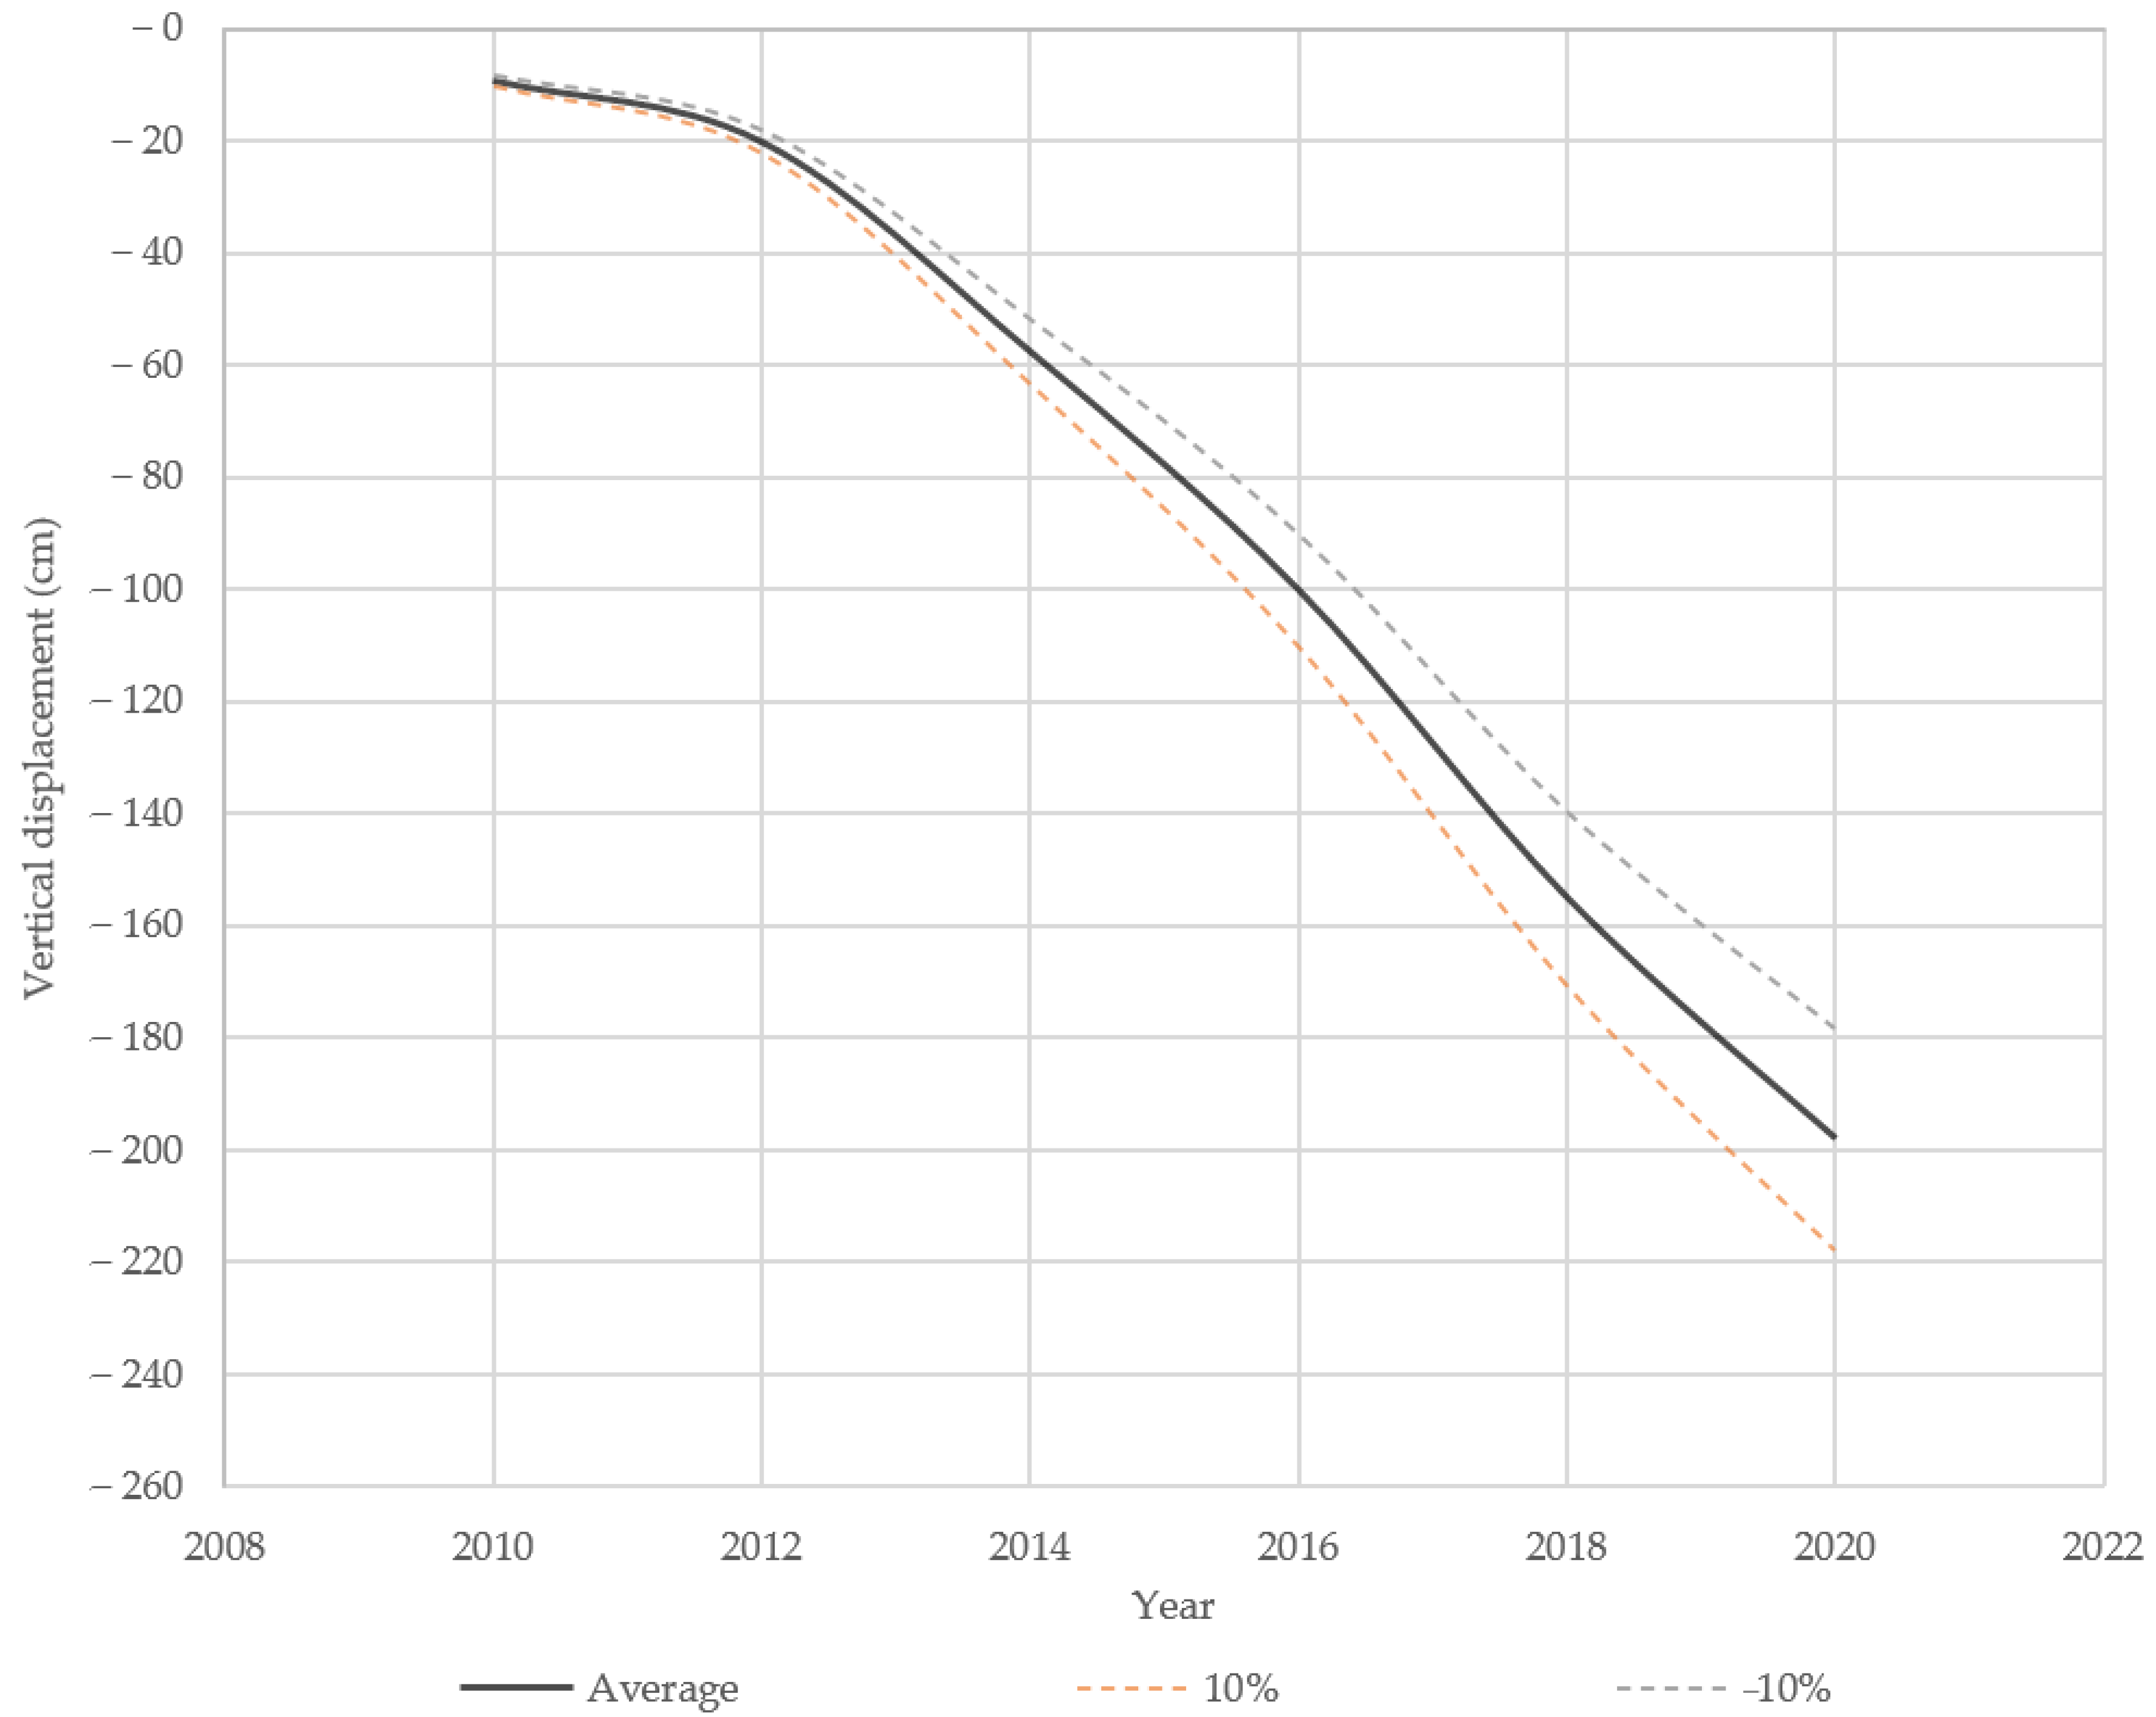
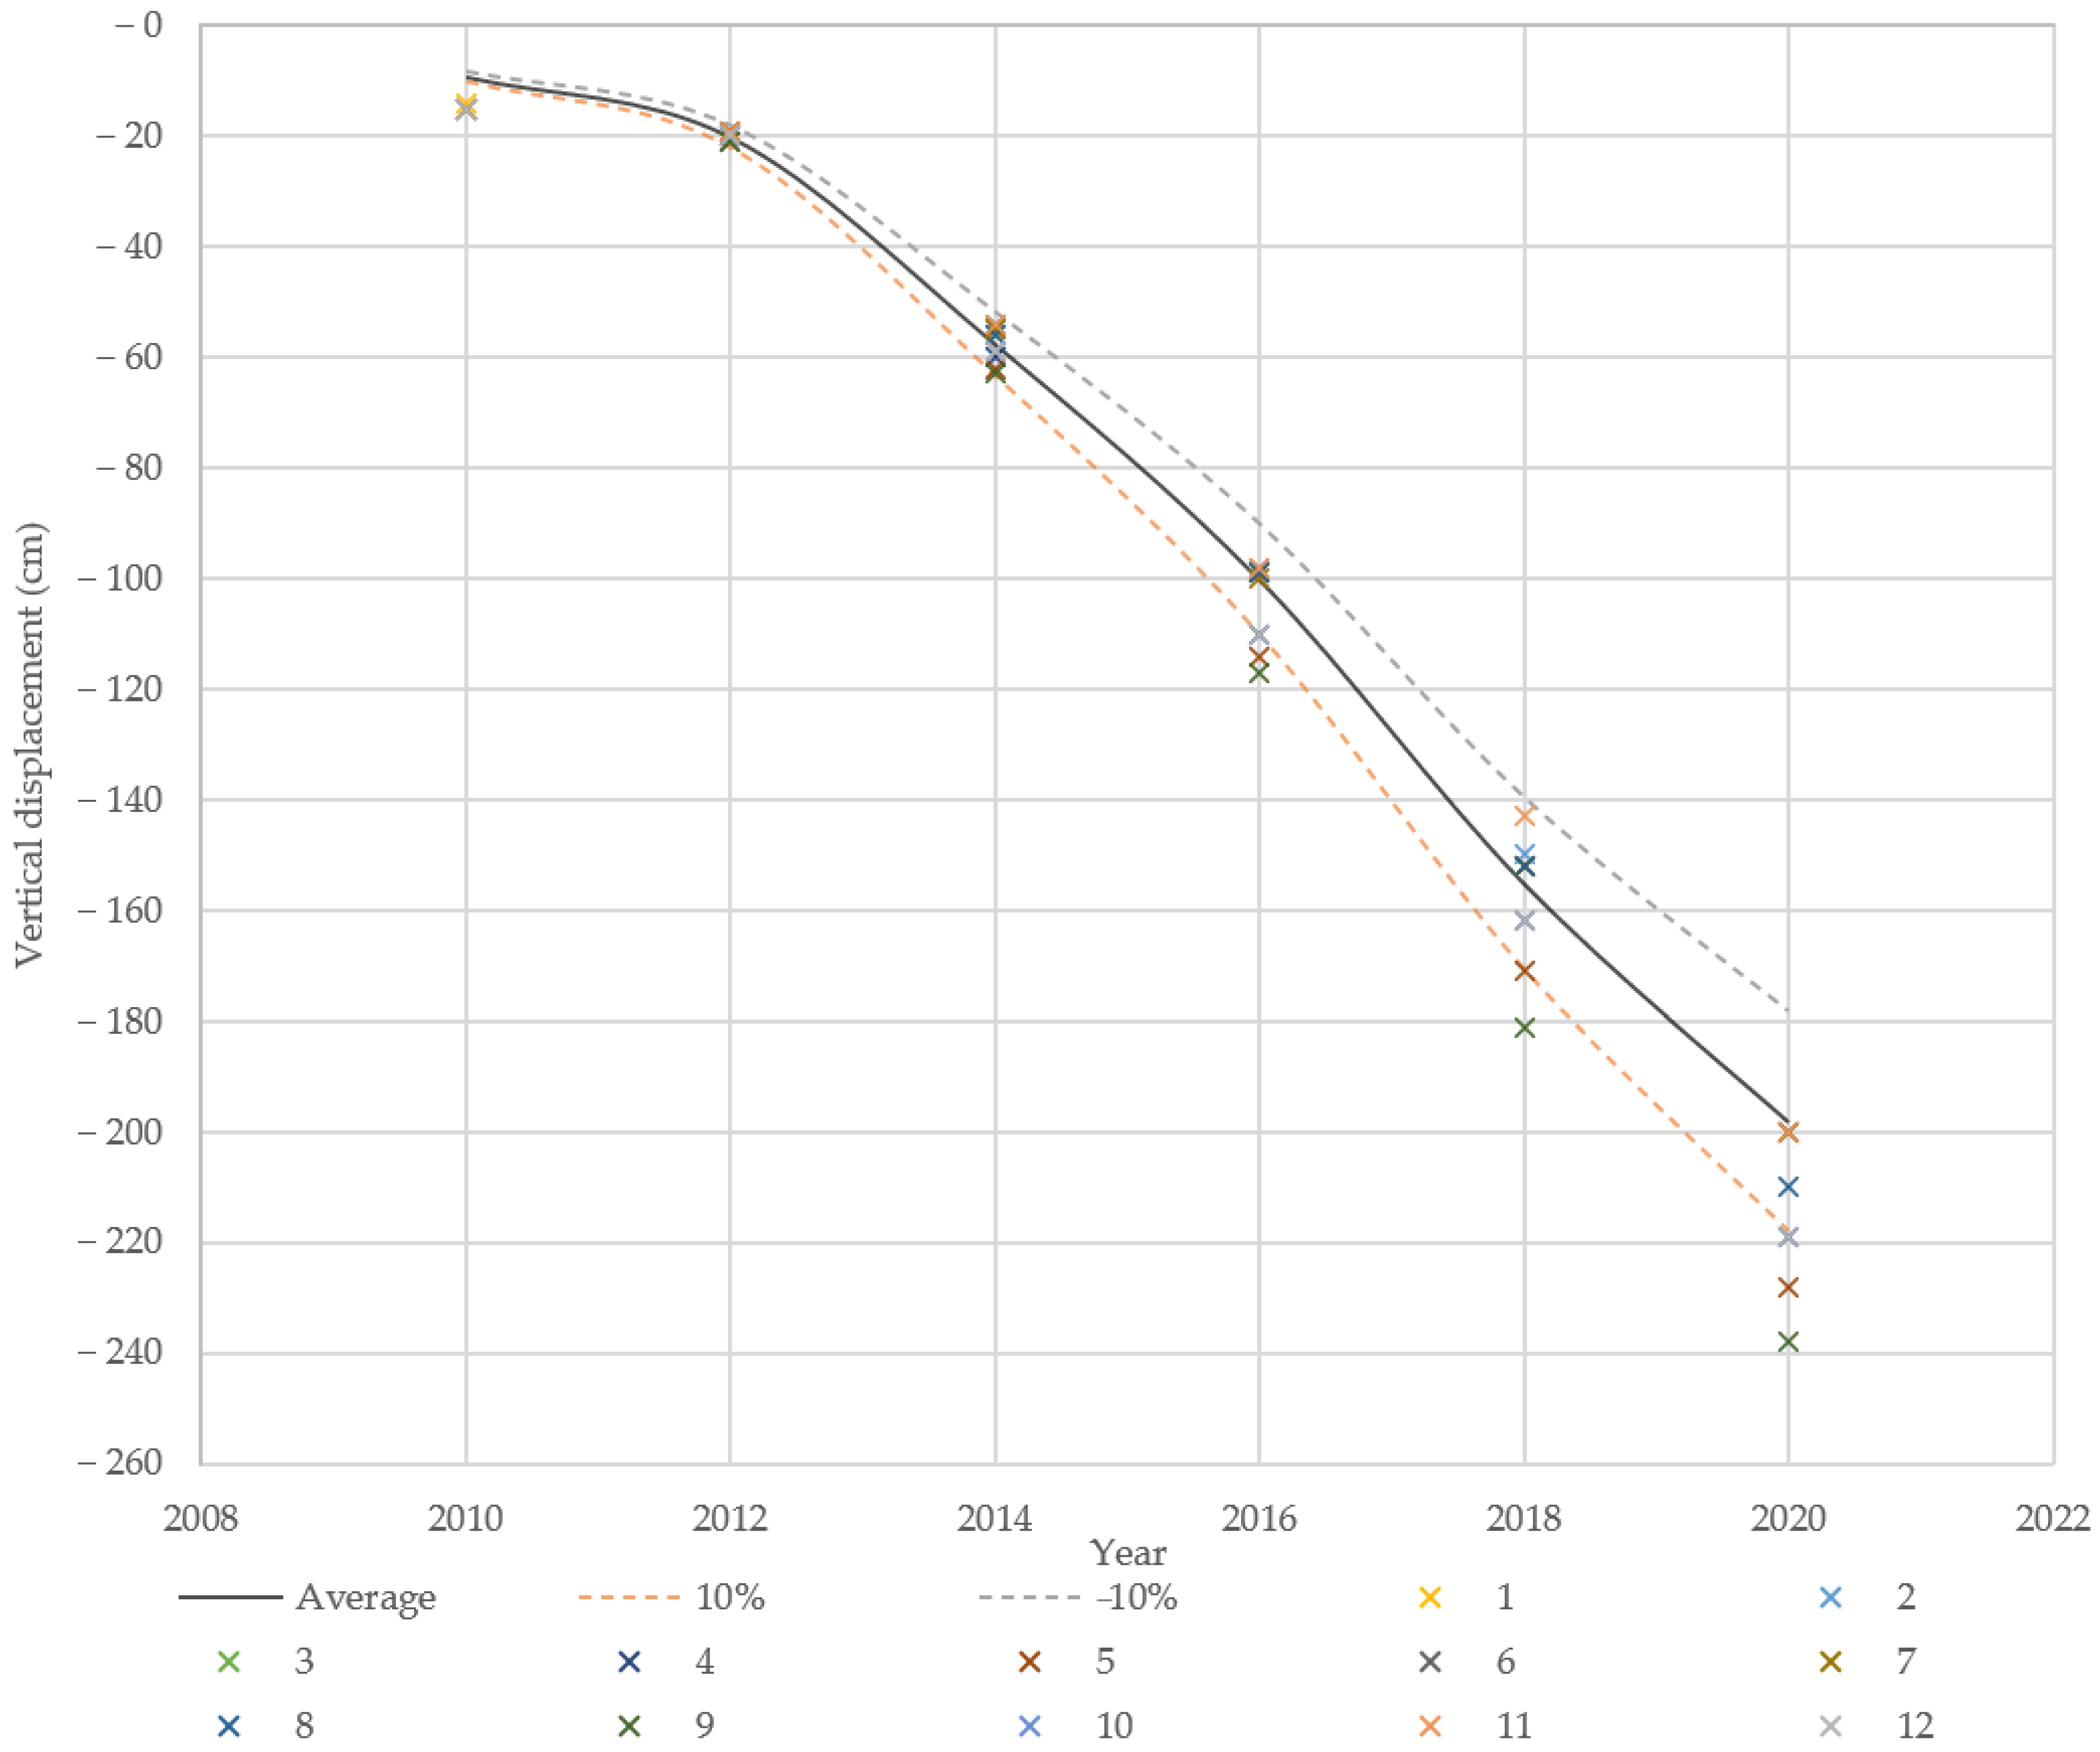
| Stage | Average Subsidence Value (cm) | +10% Error (cm) | −10% Error (cm) | Mining Zones Tested with RS2 Software (cm) | |||||||||||
|---|---|---|---|---|---|---|---|---|---|---|---|---|---|---|---|
| 01 | 02 | 03 | 04 | 05 | 06 | 07 | 08 | 09 | 10 | 11 | 12 | ||||
| 01 | −9.197 | −10.117 | −8.277 | −14.200 | −15.000 | −15.000 | −15.200 | −15.200 | −15.000 | −15.000 | −15.000 | −15.200 | −15.200 | −15.000 | −15.200 |
| 02 | −20.096 | −22.106 | −18.086 | −19.000 | −19.000 | −20.000 | −19.900 | −21.000 | −19.000 | −19.000 | −20.000 | −20.900 | −19.900 | −19.000 | −19.900 |
| 03 | −57.531 | −63.284 | −51.778 | −54.200 | −54.000 | −56.000 | −60.000 | −62.000 | −55.000 | −55.000 | −56.000 | −62.700 | −59.000 | −54.000 | −59.000 |
| 04 | −100.116 | −110.128 | −90.104 | −99.000 | −98.000 | −99.000 | −110.000 | −114.000 | −99.000 | −100.000 | −99.000 | −117.000 | −110.000 | −98.000 | −110.000 |
| 05 | −155.067 | −170.574 | −139.560 | −152.000 | −150.000 | −152.000 | −162.000 | −171.000 | −152.000 | −152.000 | −152.000 | −181.000 | −162.000 | −143.000 | −162.000 |
| 06 | −198.082 | −217.890 | −178.274 | −200.000 | −200.000 | −200.000 | −219.000 | −228.000 | −200.000 | −200.000 | −210.000 | −238.000 | −219.000 | −200.00 | −219.000 |
| 07 | −209.125 | −230.038 | −188.213 | −257.000 | −247.000 | −257.000 | −276.000 | −285.000 | −260.000 | −260.000 | −260.000 | −304.000 | −280.000 | −250.000 | −276.000 |
Publisher’s Note: MDPI stays neutral with regard to jurisdictional claims in published maps and institutional affiliations. |
© 2022 by the authors. Licensee MDPI, Basel, Switzerland. This article is an open access article distributed under the terms and conditions of the Creative Commons Attribution (CC BY) license (https://creativecommons.org/licenses/by/4.0/).
Share and Cite
Sidki-Rius, N.; Sanmiquel, L.; Bascompta, M.; Parcerisa, D. Subsidence Management and Prediction System: A Case Study in Potash Mining. Minerals 2022, 12, 1155. https://doi.org/10.3390/min12091155
Sidki-Rius N, Sanmiquel L, Bascompta M, Parcerisa D. Subsidence Management and Prediction System: A Case Study in Potash Mining. Minerals. 2022; 12(9):1155. https://doi.org/10.3390/min12091155
Chicago/Turabian StyleSidki-Rius, Nor, Lluís Sanmiquel, Marc Bascompta, and David Parcerisa. 2022. "Subsidence Management and Prediction System: A Case Study in Potash Mining" Minerals 12, no. 9: 1155. https://doi.org/10.3390/min12091155