Article

Geochemical Characteristics and Chemostratigraphic Analysis of Wufeng and Lower Longmaxi Shales, Southwest China

1
Institute of Mineral Resources, Chinese Academy of Geological Sciences, Beijing 100037, China
2
Chinese Academy of Geological Sciences, China University of Geosciences, Beijing 100083, China
3
State Key Laboratory of Biogeology and Environmental Geology, China University of Geosciences, Beijing 100083, China
4
School of the Earth Sciences and Resources, China University of Geosciences, Beijing 100083, China
*
Author to whom correspondence should be addressed.
Minerals 2022, 12(9), 1124; https://doi.org/10.3390/min12091124
Submission received: 22 July 2022 / Revised: 28 August 2022 / Accepted: 1 September 2022 / Published: 3 September 2022

Abstract

:
The demand for shale gas has propelled researchers to focus on precise and high-resolution stratigraphic divisions for homogeneous shales, of which the late-Ordovician Wufeng (O3w) and the early-Silurian Longmaxi (S1l) formations in southwest China are two of the best candidates for shale gas exploration in China. However, systematic chemostratigraphic work for these strata is still sparse, and the existing chemostratigraphic work either lack representativeness in terms of the proxies used or are subjective during their division procedures. Thus, automatic division process based on multi proxies and an objective statistical technique was applied to establish a quantitative, high-resolution, and robust chemostratigraphic scheme for the Wufeng and lower Longmaxi shales. The geochemical analysis unveils that the Wufeng and Lower Longmaxi shales show prominent heterogeneities in terrigenous inputs, redox conditions, and paleoproductivity, enabling the potential application of chemostratigraphy to these strata. Based on these heterogeneities, the chemostratigraphic scheme for the Wufeng and Lower Longmaxi shales has been established, and the whole strata could be divided into 13 chemozones using constrained clustering analysis. The chemostratigraphic scheme could not only be comparable to the regional sequence stratigraphic scheme but also more objective and higher-resolution. The high TOC content and brittle minerals within chemozone C1 makes it the most preferable layer for shale gas exploration and development. This research gives a systematic chemostratigraphic analysis on Wufeng and Lower Longmaxi shales, which testifies the feasibility and potential of usage of chemostratigraphy for Chinese shale gas exploration and development.

1. Introduction

Increasing energy demands have motivated interests in unconventional shale gas, and North America, especially the United States, has gradually initiated a worldwide shale gas revolution. Consequently, characterizing shales has become a constant research focus both in scientific studies (e.g., [1]) and industry production (e.g., [2]), in which the precise and high-resolution division and correlation of mudstone successions has become one of the most critical steps [3,4]. However, the macroscopic homogeneity, mineralogic complexity, and limited availability of biostratigraphic constraints of such rocks make it difficult from the perspective of traditional approaches [2,5,6,7]. Thus, new methodologies are needed to resolve it.
Chemostratigraphy, which utilizes chemical fingerprints or variations of geochemical traits in sedimentary successions for stratigraphic correlation [8,9], could be such a technique. This is because shales are found to have significant heterogeneities from a geochemistry perspective (e.g., [3,10]). An increasing number of researchers are thus attempting to employ the chemostratigraphic technique to establish the stratigraphic correlation scheme (e.g., [6,7,9,10,11,12]). Other than that, this new technique allows better discrimination of rock species (e.g., [13]) and has been applied widely and successfully for unconventional oil and gas development in North America (e.g., [10,12]).
Two essential steps constitute the chemostratigraphic technique. The first one is the choice of the geochemical fingerprints [14]. Initially, the geochemical fingerprint refers to the geochemical characteristics of rocks and can be used to recognize the similar events, processes, and depositional units of a particular age and/or corresponding depositional units elsewhere on a spatiotemporal scale [8]. These geochemical characteristics can be ascribed to the paleo-climatic conditions, tectonic setting, and local environmental conditions during sedimentation [7,11,12]. Shales often contain various vital stratigraphic information needed for the correlation process, such as the paleoredox condition, paleoproductivity, preservation, and relative sea-level eustasy, which significantly contribute to the geochemical heterogeneity of shales [4,9,15]. Thus, the proxies used to unveil the geochemical information of strata should be comprehensive. Currently, efforts to use easily available and high-resolution elemental proxies, including their ratios (e.g., [5,11,16,17]), have attempted to establish chemostratigraphic correlation schemes; Ratcliffe et al. [5] applied inorganic whole-rock geochemical data to create a regional chemostratigraphic correlation framework of the Eagle Ford Formation. The recognition of chemozones is another integral step for chemostratigraphy. The chemozone is the unique rock record defined by chemostratigraphic proxies and recognizable through unique geochemical signature(s) [8]. At present, considerable chemostratigraphic correlation work is still finished based on the monoproxy (monoelement or monogeochemical meaning) by an artificial zonation process, which is fraught with subjectivity and causes biased results (e.g., [13,18]).
China has invested abundantly in shale gas exploration and development, and there is a general conclusion that the Upper Ordovician Wufeng and the Lower Silurian Longmaxi Fm (formation), distributed widely in the southwest of China [19], are two of the best candidates for shale gas exploration. Although commercial shale gas has been produced in the Changning, Weiyuan, and Jiaoshiba areas of China, chemostratigraphic studies have not been systematically done for these Fms. The majority of the existing chemostratigraphic work (e.g., [20]) is either insufficiently representative in terms of the proxies used or has subjective division procedures. Thus, this paper takes the Wufeng and the Lower Longmaxi Fms. on the Liutang section as research objects and carries out a chemostratigraphic analysis based on multiple and comprehensive geochemical proxies and constrained clustering analysis, with the aim of establishing a high-resolution chemostratigraphic scheme for the strata and exploring a quantitative, high-resolution, and robust chemostratigraphic division method for ‘homogeneous’ shales.

2. Geological Setting

During the Middle-Late Ordovician to Early Silurian periods, the Wufeng and the Longmaxi Fms. were extensively deposited in the deep and restricted continental shelf of the Yangtze platform [19,21,22]. Due to the Caledonian orogeny, the strata were surrounded by the ‘Chuanzhong’ paleo-uplift in the north and the ‘Qianzhong’ paleo-uplift in the south [20,23] (see Figure 1 for details). Regionally, the Wufeng and the Longmaxi Fm. are broadly deposited in the Middle-Upper Yangtze area. The Upper Ordovician Wufeng Fm. (O3w) is dominated by black siliceous and several-meter-thick carbonaceous mudstone. The top layer of the Upper Ordovician Wufeng Fm., commonly known as the Guanyinqiao layer (GYQ), is often comprised of bioclastic limestone and features abundant Brachiopoda and Radiolaria fossils. The Lower Silurian Longmaxi Fm. (S1l) conformably overlies the Wufeng Fm. and can be divided into two members. The Lower Longmaxi is characterized by black arenaceous shale, carbonaceous shale, graptolite shale, and interbedded with bentonite, indicating a deep-water shelf sedimentary environment. In contrast, the Upper Longmaxi is mainly composed of grayish-yellowish green shale, arenaceous shale, and is interbedded with siltstones, revealing a relatively shallow deposition condition.
The Liutang section, as one of the most typical profiles for studying the Wufeng and Longmaxi Fms [23], is located in Shizhu County, Chongqing Municipality, and is near the Jiaoshiba area which is the largest shale gas field in China. Geologically, Liutang is located in the southern part of the Middle-Upper Yangtze Craton and is adjacent to the southeast Sichuan Basin (Figure 1). The depositions with coarse grains often lead to biased chemostratigraphic results. Thus, in this study, the Upper Longmaxi is ignored due to its high content of arenaceous compositions. The Wufeng Fm. comprises black siliceous and calcareous shales, and contains abundant Brachiopoda and Radiolaria with a thickness of approximately 10 m. The Lower Longmaxi Fm., with a thickness of over 90 m, is mainly characterized by black arenaceous and carbonaceous shales, while on the top of the Lower Longmaxi, arenaceous components are increased dramatically.

3. Materials and Methods

3.1. Materials

The Wufeng and the Lower Longmaxi Fm. were well preserved and outcropped on the Liutang section. A total of 192 samples, with an average sampling step of approximately 0.5 m, were collected from the bottom of the Wufeng Fm. to the Lower Longmaxi Fm. Thin sections were made for every sample, and they then were identified to ensure that the samples were fresh and did not suffer from any heavy chemical alterations. Then, all qualified sampled were ground into powder using an agate grinder and subjected to geochemical analysis.

3.2. Geochemical Analysis Method

The Wavelength Dispersive X-ray Fluorescence Spectrometer (XRF) in the Micro Structure Analytical Laboratory of Beijing was used to acquire the contents of the major and trace elements. The major elements, such as Al, Si, Ca, and Ti, were measured as a percentage of metallic-oxides, and the trace elements, such as V, Cr, Rb, Y were measured in mg/kg (ppm). Calibration was performed with 25 rock reference materials (GBW07101-07125) certified by the Chinese Academy of Geological Sciences. The total organic carbon (TOC) was measured in the laboratory at the Academy of Science, China University of Geosciences (Beijing) using a Total Carbon and Total Nitrogen Analyzer of Jena TOC/TN Multi NC2100S (1300128S), and was scaled with % w/w. Prior to the measurement, the samples were ground into fine powder and then treated with nitric acid (2 N or 2 mol/L) to remove inorganic carbon. The datasets for the geochemical measurements are documented in Supplementary Material Table S1. Average Shale (AS) [24] was used for analytical control and data comparison purposes.
In order to unveil the geochemical characteristics of the succession so as to select representative geochemical proxies used in the chemostratigraphic process, the geochemical analysis was implemented; during this procedure, several geochemical transformations should be calculated. The Al-normalized values (Al-normalized value = element/Alsample) of elements were firstly calculated to remove the effects of terrigenous inputs ([25] Calvert and Pederson, 1993). Then, the enrichment factor value EFelement was calculated based on Average Shales (AS; [24]) to assess the enrichment level of the elements, and the calculating formula is as follows: EF = (Element/Al)sample ÷ (Element/Al)AS [25]. Finally, the value of excess Si (Siexc) was calculated using the formula Siexc = [(SiO2/Al2O3)sample − (SiO2/Al2O3)AS] × Al2O3sample (AS = Average Shales). Through this process, the terrigenous inputs were deducted [26].

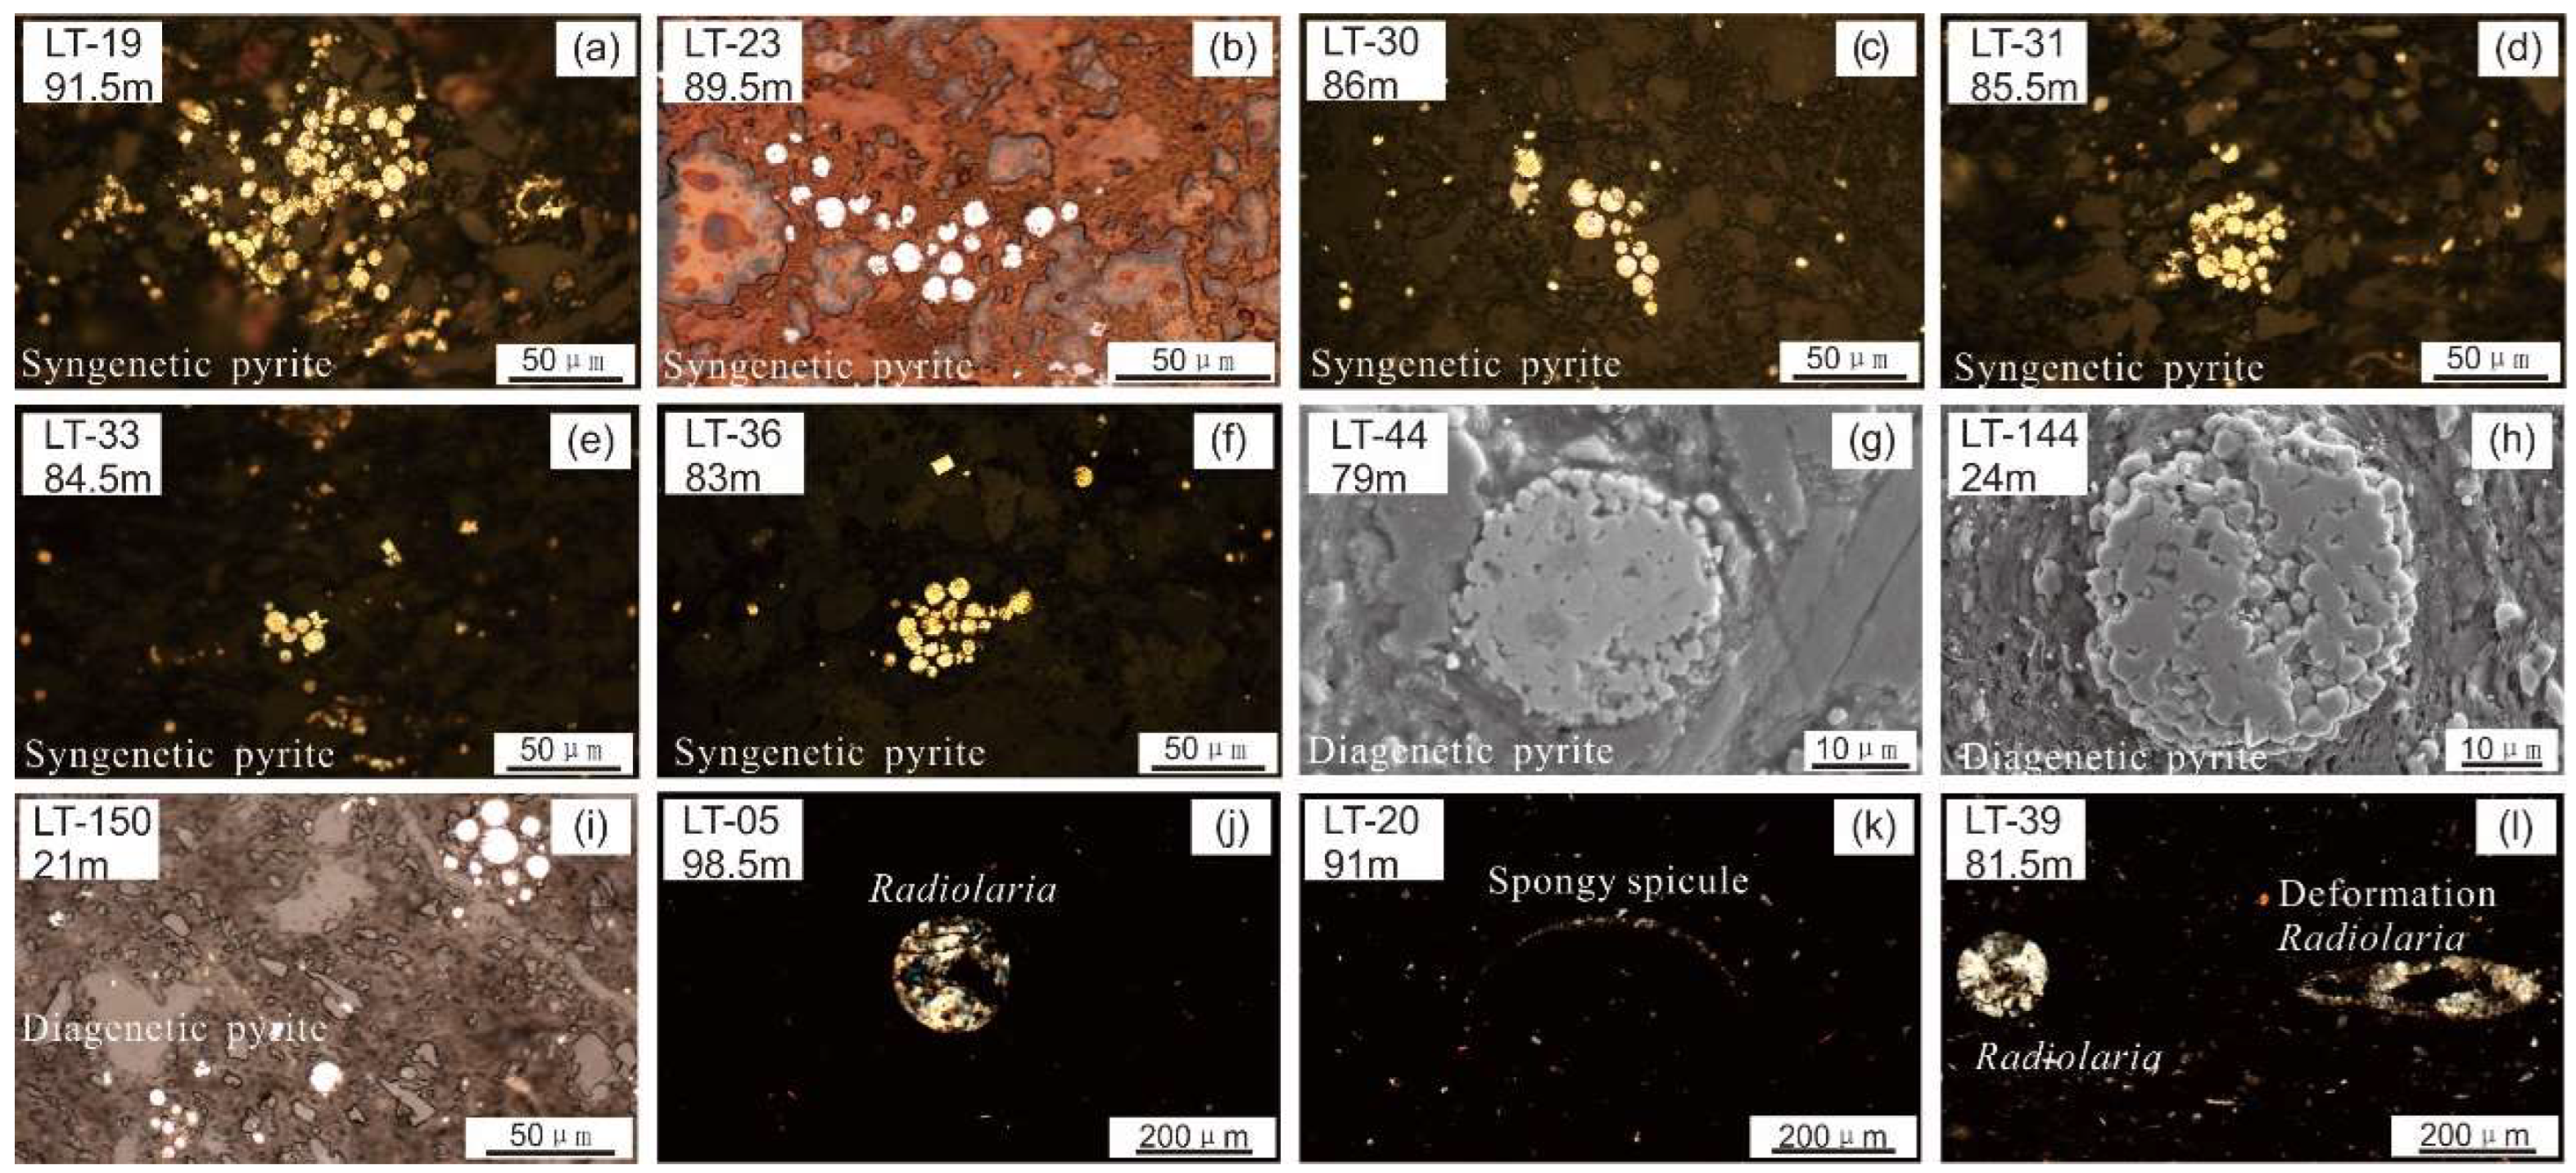
3.3. Scanning Electron Microscopy (SEM)

Scanning electron microscopy (SEM) is an observation method. It uses a narrow focused high-energy electron beam to scan the sample, excites various physical information through the interaction between the beam and the material, and collects, amplifies, and reimages this information to achieve the purpose of characterizing the microscopic morphology of the material [27]. The SEM were carried out on a JEOL JSM-6700F SEM at KYKY Technology Co., LTD, Beijing, China, to investigate the morphology of framboid pyrites.

3.4. Multivariate Statistics

After the selection of geochemical proxies, the next most important step for chemostratigraphy is finding a reasonable method for determining the zonation of the geochemical data that results in a reliable and interpretive stratigraphic scheme for the succession of interest [6,10,11,12,13,18,28,29,30]. Traditionally, the zonation of geochemical data was conducted in an artificial way that was affected by the experience and knowledge of operators. Consequently, automatic zonation by software programs, especially using the constrained clustering technique, known as hierarchical cluster analysis, was introduced [11,31].
Constrained clustering analysis is a multivariate statistical approach that sorts the hyperdimensional clusters (or samples) based on the similarity coefficient between two neighboring clusters without disordering their original sequence [6]. The similarity refers to the distance between two clusters. In consideration of possible correlations existing among variables of rock samples, the ‘Euclidian Distance’ method is the preferred way of measuring the distance [6,10]. Thus, the distance between two clusters has been computed based on the length of the straight line drawn between two clusters. The working principle of ‘Euclidian Distance’ is that it will measure only the direct distance between two centroids. Consequently, the ‘K-means method’ is thought to be more appropriate. In this method, each cluster is represented by the center of the cluster. In order to maximize the inter-cluster difference and minimize the intra-cluster difference, the ‘Minimum Variance’ or so-called ‘Ward’s Method [32] is the optimal one to calculate the centroids of newly-merged clusters in geological statistical applications [10,33,34]. This method makes whichever merger of two clusters, resulting in a minimum increase in total within-cluster variance [33]. The result of constrained clustering analysis is visualized in the form of a dendrogram, in which the geological samples are arranged according to the stratigraphic depth (in meters) [35]. Furthermore, the ultimate number of clusters depends on selecting the cut-off values in the dendrogram [11,36]. The broken-stick model (abbreviated as the bstick model) proposed by Bennett [36] is an efficient way to estimate the statistically significant number of zones in the dendrograms. We used this method to estimate the optimal number of chemozones. The constrained clustering analysis and the bstick model were realized using the Rioja package under CRAN R software.
Prior to multivariate statistical analysis, an EDA (Exploratory Data Analysis, EDA) analysis of raw data was performed in order to identify outliers (<10%) and zeros (<10%), and these were replaced by two-thirds of the determination limits and the corresponding statistical medians, respectively. Notably, the raw datasets, whether trace elements or major elements, were expressed as ppm to conduct the EDA process more conveniently and accurately (e.g., [11]).

4. Results

4.1. Geochemistry

On the Liutang section, Al2O3, SiO2, and CaO were three of the most abundant oxides, their contents are 2.93~20.0%, 32.4~91.9%, and 0.02~17.3%, respectively, with average values of 14.4%, 66.7%, and 0.45%. The contents of Al2O3 and SiO2 were close to the Average Shale (AS, Al2O3 = 16.6%, and SiO2 = 58.9%), while the content of CaO was far lower than the Average Shale (AS, CaO = 2.24%). By comparison, it can be deduced that the content of SiO2 gradually increased from the dark-color shale to light-color shale to arenaceous shale, with the average value of 58.9%, 65.5%, and 64.9%, respectively, while the content of CaO in those rocks decreased from the bottom to the upper profile, with average values of 2.24%, 0.32%, and 0.15%, respectively (see Table 1 for details).
Within Wufeng and the Lower Longmaxi Fm., the contents of the terrigenous elements, Rb, Y, and Ti, were generally equivalent to the Average Shale (AS) as reflected by the Al-normalized value and the enrichment factor (EF). Their average EF values were 0.99, 0.92, and 0.96, respectively, while, in the interval of the dark-color shales, their contents showed prominent fluctuating characteristics with EF values of 0.43~2.17, 0.39~3.94, and 0.66~1.78, respectively (see Table 1 for details).
The V/Cr ratio in the Liutang section, reflecting the redox conditions of the bottom water [37], was between 1.05 and 9.28. Moreover, the V/Cr value significantly decreased from the bottom dark-color shales to the middle shales and then to the top argillaceous shales with average values of 4.43, 2.02, and 1.56, respectively. The statistical analysis of the TOC, reflecting total organic carbon within the strata, and the paleo-oceanic productivity indicator, excess Si (Siexc), show that both the TOC and Siexcdecreased from bottom to top. From the dark-color shale to shale to the argillaceous shale, the average TOC and the average Siexc were 3.21%~1.68%~0.31% and 39.44~11.05~5.84, respectively (see Table 1 for details).

4.2. Chemostratigraphy Zonation

Based on various proxies, namely, the terrigenous inputs SiO2/(SiO2 + 5Al2O3), carbonate minerals (Ca), redox (V/Cr), and paleo-productivity conditions (TOC and Siexc), the constrained clustering analysis of WuFeng and Longmaxi Fm. generated a dendrogram (Figure 2), allowing us to identify chemozones of various hierarchical orders [8]. The bstick model (Figure 3) indicates that three, eleven, and thirteen are all statistically significant numbers of chemozones. However, too few chemozones (or clusters) may not reveal clear local patterns [11] and also cannot illustrate the high-resolution features of chemostratigraphy. Thus, three chemozones were first obtained by selecting a cutoff value of 4803, and they were, respectively, labeled as C1 (84~101 m), C2 (16~84 m), and C3 (0~16 m) in ascending stratigraphic order. They were thought to represent the regional stratigraphic pattern and were regarded as first-level chemozones there. Then, to better illustrate the geologically local features of the strata, the cutoff point was moved into 3720, and the second-level chemozones were recognized in C1 and C2; except for C3, the subchemozones of C1 were labeled as C1-1 (92.5~101 m), C1-2 (91.5~92.5 m), C1-3 (87~91.5 m), and C1-4 (84~87 m) in ascending stratigraphic order; the subchemozones of C2 were labeled as C2-1 (72~84 m), C2-2 (44~72 m), C2-3 (40~44 m), C2-4 (29.5~40 m), C2-5 (28.5~29.5 m), and C2-6 (16~28.5 m). Notably, the boundaries between these chemozones correlate well to the changing points of the proxy’s profiles (Figure 4). Nevertheless, some local geochemical turning points (Figure 4) on profiles of SiO2/(SiO2 + 5Al2O3), V/Cr, TOC, and Siexc have not been thoroughly unveiled. Thus, by shifting the cutoff value to 2573, four third-level chemozones can be obtained. They were labeled as C2-1A (77~84 m), C2-1B (72~77 m), C2-2A (66~72 m), and C2-2B (44~66 m). The boundary between C2-2A and C2-2B is especially prominent on profiles of proxies (Figure 4). See Figure 2 for details. The final number of chemozones is thirteen (Figure 4), which is statistically significant, just as shown by the bstick model (Figure 2).
The broken-stick model (abbreviated as the bstick model) proposed by Bennett [36] is an efficient way to estimate the statistically significant number of zones in the dendrograms. We used this method to estimate the optimal number of chemozones, which was realized using the bstick.chclust function within the R. As depicted in Figure 2, the numbers 3, 11, and 13 are all statistically significant, and of course, the numbers 2, 4, 6, 8, 10, and 11 are also significant numbers of chemozones. However, too few chemozones (or clusters) may not reveal clear regional patterns [11] and also cannot illustrate the high-resolution features of chemostratigraphy. Thus, we firstly selected the Euclidean distance of 4803 in the dendrogram as the cutoff point, then three chemozones were gained (that is, the three first-level chemozones, C1, C2, and C3), and they were thought to represent the regional stratigraphic pattern, and were regarded as first-level chemozones. Then, to better illustrate the geologically local features of the strata, we moved the cutoff values into 3720, then eleven chemozones (C1-1, C1-2, C1-3, C1-4, C2-1, C2-2, C2-3, C2-4, C2-5, C2-6, C3) were gained, as shown in Figure 4, and designated as the second-level chemozones. Notably, the boundaries between these chemozones correlate well to the changing points of the proxy’s profiles (Figure 4). Nevertheless, some local geochemical turning points (Figure 4) on profiles of SiO2/(SiO2 + 5Al2O3), V/Cr, TOC, and Siexc were not wholly unveiled, so we shifted the cutoff value into 2573, then four third-level chemozones were obtained (C2-1A, C2-1B, C2-2A, and C2-2B). The boundary between C2-2A and C2-2B was especially prominent on profiles of proxies (Figure 4). Then, the final number of chemozones was thirteen (Figure 4), which is statistically significant, just as shown in the bstick model (Figure 2). On one hand, this hierarchical method unveiled the regional pattern of the strata, and on the other hand, dug into the local features of the strata.

5. Discussion

5.1. Sedimentary Geochemical Characteristics

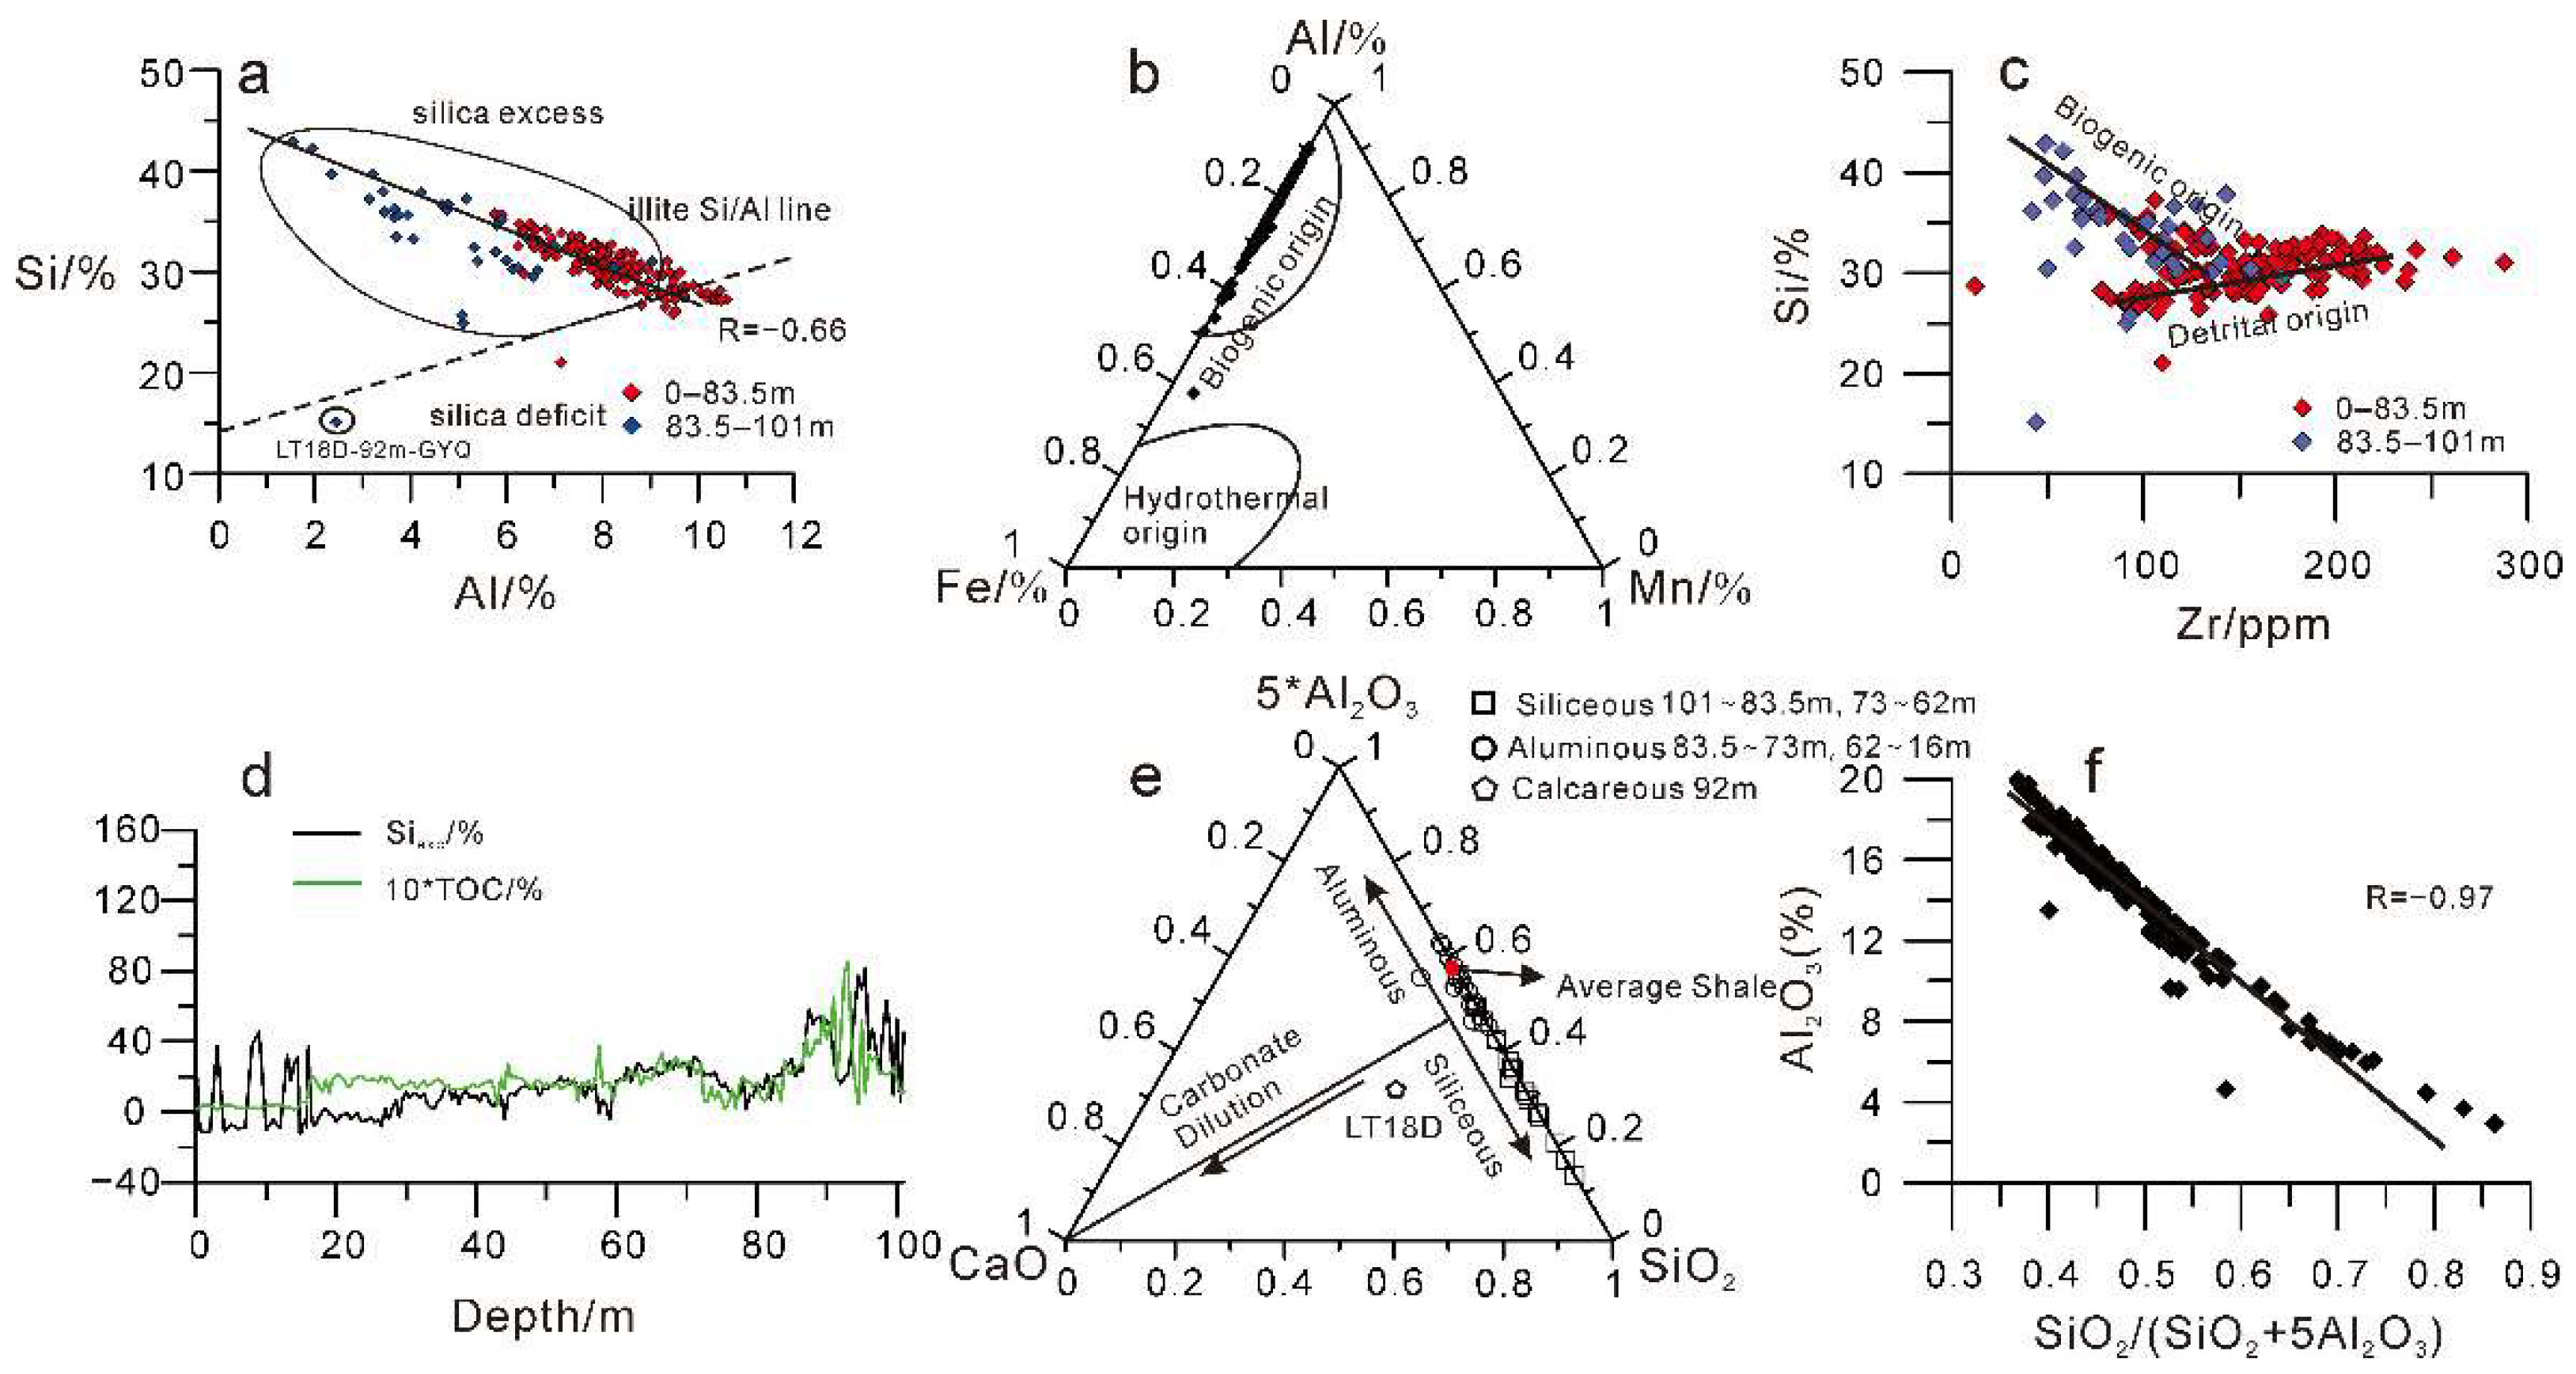
5.1.1. Paleoproductivity

Abundant existing research on the Wufeng and Longmaxi shales have demonstrated that the upper Wufeng and the lower Longmaxi succession are dominated by siliceous shales. Thus, Si could be an optimal candidate for recovering paleoproductivity. Generally, the silica in the strata can be contributed by authigenic (clay-mineral-transformed origin), hydrothermal, terrigenous, and biogenic influxes.
The Si-Al crossplot was used to estimate the clay-mineral-transformed silica. As shown in Figure 5a, almost all samples are plotted above the illite Si/Al line, especially for the samples within Wufeng and Lower Longmax Fms. (83.5–101 m), indicating that silica in the strata should not be attributed to the mineral transformation from smectite into illite. Moreover, the strong negative correlation between Al and Si (−0.66, Figure 5a) also implies a biogenic origin of silica. The Al-Fe-Mn ternary diagram is useful in assessing the difference in chemical composition between hydrothermal and non-hydrothermal siliceous rock [38]. As shown in Figure 5b, almost all samples are plotted at the biogenic area, indicating that silica in the Wufeng and the Lower Longmaxi Fms. has not been affected by hydrothermal influxes [39]. Thus, the diagenetic remobilization of silica has not occurred.
Element Zr is typically associated with heavy mineral zircon and can be used as terrigenous proxy. Thus, a Si (%)-Zr (ppm) cross-plot can be used to determine whether the Si in the strata is contributed to by terrigenous or biogenic inputs. A positive correlation between Zr and Si indicates the terrigenous contribution of SiO2, while a negative between them implies biogenic contribution. As shown in Figure 5c, the Si (%)-Zr (ppm) cross-plot shows that the silica within Wufeng Fm. and bottom of the Lower Longmaxi Fm. belong to the biogenic origin, which could be validated by the appearance of siliceous organisms within the strata (see Figure 6j–l). Nevertheless, the silica from the upper part of Lower Longmaxi Fm. is characterized by terrigenous inputs, which is consistent with previous work on geochemical characteristics of Wufeng and Longmaxi Fms. [40,41].
Excess Si (Siexc) is the fraction that deducts the terrigenous inputs [26]. It can be calculated using the formula Siexc = [(SiO2/Al2O3)sample − (SiO2/Al2O3)AS] × Al2O3sample (AS = Average Shales). Moreover, TOC content is the direct reflection of paleoproductivity; high TOC indicates high productivity level. As shown in Figure 5, Siexc and TOC show the same trend (Figure 5d). Thus, after excluding the possibility of authigenic and hydrothermal contribution, Siexc could be an efficient proxy of paleoproductivity.
Generally, the high Siexc value means a high paleoproductivity level. As shown in Figure 2, the value of Siexc is high at intervals of 83.5~101 m and 62~73 m, indicating that the Wufeng Fm. and Lower Longmaxi Fm. at the corresponding depths have a higher level of paleoproductivity. The siliceous Radiolaria and Spongy spicule (Figure 6j,l) appearing at Wufeng and the bottom of the Lower Longmaxi may be the reason for the increase in Siexc. However, the value of Siexc in the Guanyinqiao layer (GYQ, 91.5~93 m) is significantly lower than in the adjacent layers, indicating that the number of siliceous organisms in this interval has dramatically decreased, which is mainly because the GYQ layer belongs to calcareous submarine sediments [42]. At the intervals of 73~83.5 m and 16~62 m, the value of Siexc is extremely low, indicating a normal-to-low level of paleoproductivity. At the intervals of 0~16 m, the value of Siexc repeatedly fluctuates, indicating that the level of paleoproductivity in the strata has changed frequently at the topmost level of Lower Longmaxi.

5.1.2. Terrigenous Inputs

Al2O3, SiO2, and CaO are three of the most abundant components within shale rocks, their proportion decides the rock types and properties. Al2O3 represents terrigenous inputs [25,43], SiO2 in the strata, as discussed above, is mainly derived from biogenic sources, while CaO is derived from both terrigenous inputs and authigenic oceanic sources [43,44]. In consideration of the low content of Al2O3 compared with SiO2, and to facilitate the comparison with the average shales, five multiples of Al2O3 were used as one member in the 5Al2O3-CaO-SiO2 ternary diagram (Figure 5e). As shown in Figure 5e, only one sample (sample LT-18D) was plotted on the carbonate dilution line. Thus, the ratio SiO2/(SiO2 + 5Al2O3) can be further used to ensure whether there are aluminous or siliceous depositions for the remaining samples. Generally, Si/Al is the proxy of biogenic quartz [12,28]. As shown in Figure 5f, a strong negative correlation (−0.97) between Al2O3 (%) and SiO2/(SiO2 + 5Al2O3) emerged, indicating they were mutually diluted between Al2O3 and SiO2. Thus, SiO2/(SiO2 + 5Al2O3) could also be used as a biogenic vs. terrestrial proxy, and the lower ratio indicates more terrigenous inputs and vice versa.
The sample LT-18D represents the lithology of the Guanyinqiao (GYQ) layer or Top Wufeng Fm. As shown in Figure 5e, this sample is diluted by the carbonate, indicating a marine origin of the CaO within the GYQ layer. The numerous Brachiopoda found in the strata reveals that the CaO in the GYQ layer is originated from biogenic sources, while it has terrigenous contributions for other layers. When leaving out sample LT-18D, almost all samples show no effects of carbonate dilution and are similar to Average Shales. In detail, the curve of SiO2/(SiO2 + 5Al2O3) (Figure 4) shows that samples in Wufeng, the bottom of Lower Longmaxi (83.5~101 m), and the middle of Lower Longmaxi Fm. (62~73 m) are siliceous. The positive excursion of Siexc (Figure 4) indicates that the increase in silica within the strata of 83.5~101 m and 62~73 m is mainly caused by the biogenic contribution. The samples within the interval of 73~83.5 m and 16~62 m of Longmaxi are aluminous, and thus contain more terrigenous contributions, while, the samples at 0~16 m show repeated fluctuation between aluminous and siliceous.
Generally, Rb, Ti, and Y represent terrigenous inputs [43]. Thus, the profiles of Al-normalized values of these elements could also be used to unveil the terrigenous characteristics of the strata. As shown in Figure 7, the Al-normalized values of Rb, Ti, and Y show similar changing trends. In the interval of 83.5~101 m, the curves of Rb/Al, Ti/Al, and Y/Al show dramatic fluctuation, indicating multiple sources and slow depositional rate in Wufeng and the Bottom Longmaxi Fm. The abundant occurrence of fossils, such as Brachiopods and Radiolaria, within the strata indicate that this fluctuation may be closely related to pulsed biological contribution. In the interval of 83.5~16 m, Rb/Al, Ti/Al, and Y/Al show a slight magnitude of fluctuation indicating that the strata are characterized by a mono provenance and high depositional rate. This characterization is the geochemical response to the fast contemporaneous convergence between ‘Dianqiangui’ and ‘Cathaysia’ and a simultaneously fast global regressive event [45,46]. The continuous uplifting of the ancient lands and the consistent warming of climate conditions [47,48] contributed abundant deposition materials to the basin during the deposition of middle Lower Longmaxi Fm. The global regressive event could account for the decline in regional sea levels and increase in the accumulation rate of the strata. Within the interval of 0~16m, Rb/Al, Ti/Al, and Y/Al fluctuate dramatically (Figure 7), indicating that multiple provenance areas contribute deposition materials to the basin simultaneously. Combined with the coeval distribution patterns of land and sea around the basins, the ‘Xuefeng’ paleo-uplift and the ‘Qianzhong’ paleo-uplift were the most possible provenance areas, this is because the Yangtze area in South China was confined by these ancient lands during this period [20]. In addition, the large-scale tectonic movement which led to the uplift of the Yangtze area [49] resulted in an overall regressive event in South China and the formation of a shallow-water deposition condition, under which the accumulation rate became accelerated. The increase in the arenaceous components within this interval also proves the shallowing of deposition water.
Through the analysis above, it can be concluded that the provenance has changed several times during the depositional periods of Wufeng and Lower Longmaxi Fm. The Wufeng and the bottom of the Lower Longmaxi (83.5~101 m) are mainly characterized by biogenic inputs. During the deposition periods of middle and upper layers of the Lower Longmaxi, the strata are composed of terrigenous inputs (16~83.5 m). Until the topmost of the Lower Longmaxi (0~16 m), multiple provenance areas contributed deposition materials to the Basin simultaneously. The GYQ (Guanyinqiao) layer is a set of biogenic calcareous depositions.

5.1.3. Redox Conditions

The redox condition of the sedimentary water controls the enrichment/depletion of certain elements, especially multivalent trace elements, and the preservation of total organic carbon (TOC) [50,51]. Thus, studying the redox conditions of the Wufeng and Longmaxi Fm. is critically important for shale gas exploration. Oxic conditions occurred when O2 concentrations in bottom waters exceed 2 m1 O2/L H2O. The content of O2 ranges from 0.2 to 2 m1 O2/L H2O in suboxic environments and is below 0.2 m1 O2/L H2O during anoxic conditions [52](Tyson and Pearson, 1991).
The elements vanadium (V) and chromium (Cr) are typical multivalent trace elements [43,53,54,55], which are highly sensitive to the redox conditions of bottom water. The ratio of V/Cr can reflect the redox condition of bottom water. Generally, V/Cr < 2, under oxic conditions and 2.0 < V/Cr < 4.25 in suboxic conditions, while under anoxic water, V/Cr > 4.25 [37].
On the Liutang section, the V/Cr ratio of all samples is between 1.05 and 9.28, with an average value of 2.42. As shown in Figure 4, the V/Cr ratio profile clearly indicates the redox conditions of the strata. The successions at 23~33 m, 62~73 m, 83.5~87 m, 91.5~93.5 m, and 95.5~97 m were deposited under suboxic conditions. The strata deposited in the intervals of 87~91.5m and 93.5~95.5 m were characterized by anoxic deposition conditions, while the remaining layers were deposited under oxic depositional conditions.
The Framboidal pyrite developed well in the whole section (Figure 6a–i). The morphological significance of the framboidal pyrite can also indicate the redox conditions of the underlying water during deposition. Generally, the framboidal pyrite formed under the oxic condition is called diagenetic pyrite, with characteristics of large and uneven particle sizes, while the framboidal pyrite formed under the reductive condition is called syngenetic pyrite with characteristics of small and even particle sizes. Wignall and Newton [56] pointed out that the maximum particle size of framboidal pyrite formed under the oxic-suboxic sedimentary water can be greater than 20 μm, and the maximum size of the framboidal pyrite formed under the reducing environment is generally less than 20 μm.
Statistics of particle size of framboidal pyrites in the strata show that at the depths of 91.5 m, 89.5 m, 86 m, 85.5 m, 84.5 m, and 83 m, the particle size of framboidal pyrites is 3.4~10.8 μm, 2.0~12.4 μm, 4.3~13.3 μm, 4.1~9.9 μm, 4.7~9.9 μm, and 4.4~10.5 μm, respectively, and the proportion of pyrites with particle size greater than 10 μm is less than 0.1% (Figure 4; Figure 6a–f), indicating that they are syngenetic pyrites and deposited under reductive conditions. While at depths of 79 m, 24 m, 21 m, 18 m and 17 m, the particle size of framboidal pyrites is 16.5~28 μm, 27.5~40 μm, 2.2~33.7 μm, 2.9~27.2 μm, and 2.0~41.9 μm, respectively (Figure 4 and Figure 6g–i), unveiling that the corresponding pyrites belong to diagenetic pyrites and are deposited under oxic conditions.
Combined with the V/Cr and statistics of framboidal pyrites, it can be concluded that the top of the Wufeng Fm. and the bottom of the Lower Longmaxi Fm. (83.5~101 m) were deposited under reductive conditions, while the middle and upper intervals of the Lower Longmaxi Fm. (0~83.5 m) were deposited under relatively oxic conditions.

5.2. Chemostratigraphy

5.2.1. Chemozones

Chemostratigraphy can be defined as using the variability of the chemical elements, or fingerprints, to evaluate the stratigraphic relationships within a succession, and some essential proxies, including elements and ratios, can reflect the chemical variability [8,9]. As discussed above, the target successions show heterogeneities in terrigenous inputs, calcareous contents, redox, and paleoproductivity conditions. Thus, the proxies used in the present study for chemostratigraphic purposes are closely related to these aspects. The proxies used for the chemostratigraphic work and their geological meanings are tabulated in Table 2.
Figure 4 shows the chemostratigraphic scheme for the Wufeng and Longmaxi Fms. acquired based on the proxies tabulated in Table 2 and the constrained clustering analysis. For details, refer to chapter ‘Chemostratigraphy zonation.’ The division results of chemozones rely on the changing trends of the geochemical proxies.
For the first-level chemozones, C1 is characterized by higher values of SiO2/(SiO2 + 5Al2O3), V/Cr, TOC, and Siexc than C2, while C3 has characteristics of fluctuating SiO2/(SiO2 + 5Al2O3), Siexc, and extremely low values of V/Cr, TOC.
As for the second-level subchemozones, C1-1 is characterized by increasing trends of SiO2/(SiO2 + 5Al2O3), V/Cr, TOC, and Siexc. C1-2 and C1-4 contain lower SiO2/(SiO2 + 5Al2O3), V/Cr, Siexc, and more Ca than the adjacent C1-1 and C1-3. C2-6 is characterized by lower values of SiO2/(SiO2 + 5Al2O3), V/Cr, Siexc, and Ca than C2-5. C2-4 is characterized by lower Ca than both C2-5 and C2-3. C2-2 contains lower Ca than C2-3. Although the contents of the proxies within C2-1 and C2-2 are similar, the slight difference in V/Cr and TOC make them distinguished.
For the third-level subchemozones, C2-1A and C2-1B have characteristics of low SiO2/(SiO2 + 5Al2O3), V/Cr, TOC, and Siexc. However, there are two obvious turn points: one of them is located at the curve of SiO2/(SiO2 + 5Al2O3), the other is located at the curve of Siexc, which distinguishes C2-1A and C2-1B (see Figure 4 for details). In terms of C2-2A and C2-2B, C2-2A has higher SiO2/(SiO2 + 5Al2O3), V/Cr, TOC, and Siexc than C2-2B. Details of the principal geochemical parameters used to recognize each chemozone (including three levels of chemozones) are summarized in Table 3.

5.2.2. Paleoenvironmental Significance of Chemozones

The proxies used for a chemostratigraphic scheme include biogenic/terrigenous inputs, redox conditions, paleoproductivity, and carbonate. The sedimentary paleoenvironment controls their contents. Thus, every chemozone implies a unique paleoenvironmental condition.
The Chemozone C1 mainly consists of biogenic siliceous and calcareous sequences deposited in deep water. It is characterized by high values of SiO2/(SiO2 + 5Al2O3) (>0.5) and Calcium (Ca) with an abundant occurrence of siliceous Radiolaria and Brachiopod fossils. Simultaneously, the high TOC (>2%) and Siexc (>10) verify high paleoproductivity conditions within C1 chemozone. However, some local differences can also be unveiled by V/Cr and Ca in C1, which subdivide the C1 into C1-1, C1-2, C1-3, and C1-4. C1-1 and C1-3 were featured with dysoxic-anoxic water conditions and high paleoproductivity, indicating deep-water deposition conditions. High SiO2/(SiO2 + 5Al2O3) and Siexc reveal that they are siliceous. By comparison, C1-2 and C1-4 are deposited in comparatively shallow water with lower SiO2/(SiO2 + 5Al2O3), V/Cr, and Siexc values. High calcium levels suggest C1-2 and C1-4 are a set of calcareous deposition.
The chemozone C2 was almost all deposited in the shallow and oxic shelf environment, except C2-2A (dysoxic). At the bottom of C2 or C2-1A, the sequences turn from siliceous to aluminous, which indicates the first increase in terrigenous inputs for the whole section. This increase continues until C2-2A, which has typical characteristics with high values of SiO2/(SiO2 + 5Al2O3) (>0.5), V/Cr (2~4.25), TOC (>2%), and Siexc (>10). The terrigenous inputs rose again from C2-2B. This interruption in the increase in terrigenous inputs may be interpreted as the persistent biological influence of siliceous Radiolarian on C2-2A. Chemozones C2-3, C2-4, C2-5, and C2-6 are very similar geochemically, as all of them were deposited in a shallow shelf paleoenvironment. High calcium in C2-3 and C2-5 makes them distinguishable from other subchemozones (C2-4 and C2-6). Considering that the carbonate dilution function has not influenced the C2 (see Figure 5e), the calcium in C2-3 and C2-5 may originate from late diagenetic hydrothermal fluid rather than a biogenic source or seawater input, which is different from biogenic zones (C1-2 and C1-4).
Similar to C2, C3 is deposited in a shallow and oxic shelf environment. However, it is noted that the values of V/Cr and TOC are much lower in the latter, which means that C3 has a shallower and more oxidized sedimentary environment than C2. Furthermore, C3 is typically characterized by a fluctuating Siexc, SiO2/(SiO2 + 5Al2O3) (Figure 4). The terrigenous proxies, Rb/Al, Ti/Al, and Y/Al, show the same changing trends (Figure 7), indicating multiple provenances during C3 period.
The sedimentary paleoenvironmental revealed by various chemical proxies within chemozones can be attributed to global eustasy and paleoenvironments in South China. During the early and middle periods of the Upper Ordovician, the Yangtze area of South China belonged to the semi-restricted euxinic basin [23]. Wufeng shales, except for the top Guanyinqiao (GYQ) layer, were deposited under this anoxic and deep-water condition. Thus, C1-1 is typically characterized by anoxic, high TOC, and low calcium content. At the end of the late Ordovician period, global sea levels, including in South China, dropped dramatically under the effect of the Gondwana glaciation [22], resulting in the oxidization of seawater in the research area. Thence, C1-2 is characterized by more oxic and more calcium than C1-1. At the start of the Lower Silurian period, deglaciation occurred, and global sea levels rose due to global warming, which was partially ascribed to the volcanism [57]. Moreover, this event affected almost all of the worldwide epicontinental seas [58], including the Yangtze region of South China. Thus, C1-3 shows geochemical characteristics of anoxic, high TOC, low calcium, and even high paleoproductivity. Following this sea level rising event, the global sea level started to decline again [45], which contributed to regressive seawater and the formation of the prograding sequences in the Yangtze area of South China, and the research area turned into a shallow shelf [23]. The simultaneous global-warming paleoclimatic conditions [47,48] accelerated the weathering of surrounding paleo-uplifts leading to abundant terrigenous materials transported into the Longmaxi successions. Consequently, subchemozones C1-4 and C2 are characterized by high terrigenous inputs, high oxygen, and low TOC. During the final deposition stage of the Lower Silurian Fm., the Yangtze area uplifted as a whole [49], and a complete marine regression occurred in the research area. Moreover, multiple paleo-uplifts, including ‘Xuefeng’ and ‘Qianzhong,’ brought massive terrestrial inputs into the basin, which helps explain why chemozone C3 has a multi-provenance characteristic. This extremely shallow-water condition also resulted in the lowest TOC and V/Cr in chemozone C3 of the section.

5.2.3. Regional Correlation

The global eustasy is the main factor controlling the deposition of the Wufeng and Longmaxi Fms., which is also validated by the geochemical proxies and previous research (e.g., [22,45,49]). Thus, the existing stratigraphic framework for the strata is acquired mainly based on the sequence stratigraphy. The wells JY-1, PY-1, and DY-1 (see Figure 1 for their detailed locations), located at the depositional center of Wufeng and Longmaxi, are actually the most-studied wells (e.g., [3,59,60,61]), of which the JY-1 well is located at the Jiaoshiba gas field and is the first industrial gas field in China, with recoverable resources of approximately 200 billion cubic meters. Thus, we compared the chemostratigraphic scheme with the sequence schemes derived from these wells. Two kinds of stratigraphic schemes can be obtained from the sequence stratigraphic results for JY-1, PY-1, and DY-1 wells. The first is the results described by Wang et al. [60] that the Wufeng and the Lower Longmaxi are comprised of an alternating Transgressive System Tract (TST) and a Highstand System Tract (HST) (Figure 8). The second is described by Chen et al. [3], Guo [59], and Zhang et al. [61]: the Wufeng Fm. consists of TST and HST, while the Lower Longmaxi is composed of TST, Early Highstand System Tract (EHST), and Late Highstand System Tract (LHST) (Figure 8). The existing sequence stratigraphic schemes confirm that two major transgressive-regressive cycles have occurred during the Wufeng and Lower Longmaxi periods, which is consistent with our chemostratigraphic finding that the chemozones C1-1 and C1-3 represent two transgressive phases, and the other chemozones (C1-2, and C1-4 to C3) are the depositions during regressive phases.
The chemostratigraphic profile can be used to construct the sequence-stratigraphic framework (e.g., [7]). TSTs are defined by retrogradational successions with a constant increase in accommodation [52]. Thus, TSTs are characterized by a general decline in terrigenous proxies and basin restriction proxies (e.g., [7]). HSTs are defined by progradational successions with a constant decrease in accommodation [52] and are characterized by an increase in terrigenous inputs and minimal levels of basin restriction [7]. LSTs (Lowstand System Tracts) are also defined by progradational successions [52] but are characterized by an increase in proxies of basin restriction [7]. SiO2/(SiO2 + 5Al2O3) was used as a proxy of terrigenous inputs, lower SiO2/(SiO2 + 5Al2O3) indicates more terrigenous inputs. Accordingly, the chemozones C1-1 and C1-3 can be correlated to TSTs due to their high contents of SiO2/(SiO2 + 5Al2O3), V/Cr, TOC, Siexc, and low Ca, which indicate retrogradational successions. The chemozones C1-2, C1-4, and C3 can be correlated to HSTs due to their low contents of SiO2/(SiO2 + 5Al2O3), V/Cr, TOC, Siexc, and high Ca which indicate progradational successions. See Figure 8 for details.
Through the comparisons above, it can be concluded that chemostratigraphy is an efficient way of establishing stratigraphic schemes but with much higher resolution than traditional methods. For example, chemostratigraphy can recognize the boundaries of chemozones C1-4, C2-1A, C2-1B, C2-2A, C2-2B, C2-3, C2-4, C2-5, and C2-6, which is difficult for the sequence-stratigraphic method.

5.2.4. Identification of Sweet Spot

The chemostratigraphic work above provides a precise stratigraphic scheme, and when combined with geochemical fingerprints, such as elements and their ratios, it can also help with the evaluation of stratigraphic properties [2,29,30], which is the preferred process for sweet-spot identification.
Generally, total organic carbon (TOC) content determines the designation of a layer as a sweet spot, and the content of brittle minerals (for example, quartz and carbonate) decides the possibility of shales being fractured. Based on the high-resolution division results above and the geochemistry analysis, it is clear that the chemozone C1 may be the optimal candidate for the sweet-spot layer due to its high TOC contents and anoxic–suboxic sedimentary conditions. Moreover, the abundant siliceous and calcareous matters (Figure 4), especially biogenic silica in C1-1, C1-3, and C1-4, and biogenic calcium in C1-2, deduce the difficulty in fracturing shales. Thus, chemozone C1 (83.5–101 m) is thought to be the sweet-spot layer for shale gas exploration and development.

6. Conclusions

The sedimentary geochemical analysis indicates that the macroscopically-homogeneous Wufeng and Lower Longmaxi shales show prominent geochemical heterogeneities in paleoproductivity, terrigenous inputs, and redox conditions. Generally, the upper Wufeng and the bottom of the Lower Longmaxi shales are characterized by high paleoproductivity, low terrestrial contribution, and anoxic deposition conditions, while the upper part of the Lower Longmaxi shales feature a gradual decrease in paleoproductivity, high terrigenous inputs, and oxic deposition conditions. The geochemical analysis also recognized two transgressive-regressive cycles on Liutang section, which is consistent with two coeval global eustasy events. Based on these geochemical heterogeneities, the chemostratigraphic scheme for the Wufeng and Lower Longmaxi shales was established using the constrained clustering analysis, and a total of 13 chemozones could be gained which are comparable to the regional sequence stratigraphic schemes and with higher resolution. Moreover, the chemozone C1 (83.5–101 m), characterized by high TOC content and high brittle minerals, is thought to be the most preferable layer for shale gas exploration and development.

Supplementary Materials

The following supporting information can be downloaded at: https://www.mdpi.com/article/10.3390/min12091124/s1, Table S1: Measured XRF datasets.

Author Contributions

Conceptualization, Z.Z.; methodology, S.Y. and Z.Z.; software, S.Y.; validation, S.Y.; formal analysis, S.Y.; investigation, Y.H.; resources, Y.H.; data curation, Z.Z.; writing—original draft preparation, S.Y. and Z.Z.; writing—review and editing, S.Y. and Z.Z.; visualization, S.Y.; supervision, S.Y.; project administration, Y.H.; funding acquisition, Y.H.. All authors have read and agreed to the published version of the manuscript.

Funding

This research was funded by [National Natural Science Foundation of China] grant number [41972112, 41373082]; [China Geological Survey] grant number [DD20190010].

Data Availability Statement

Data is contained within the article or supplementary material.

Conflicts of Interest

The authors declare no conflict of interest.

References

  1. Curtis, J.B. Fractured shale–gas systems. AAPG Bull. 2002, 86, 1921–1938. [Google Scholar]
  2. Sano, J.L.; Ratcliffe, K.T.; Spain, D.R. Chemostratigraphy of the Haynesville shale. In Geology of the Haynesville Gas Shale in East Texas and West Louisiana; Hammes, U., Gale, J., Eds.; AAPG Memoir: Tulsa, OK, USA, 2013; Volume 105, pp. 137–154. [Google Scholar]
  3. Chen, L.; Lu, Y.C.; Jiang, S.; Li, J.Q.; Guo, T.L.; Luo, C.; Xing, F.C. Sequence stratigraphy and its application in marine shale gas exploration: A case study of the Lower Silurian Longmaxi Formation in the Jiaoshiba shale gas field and its adjacent area in southeast Sichuan Basin, SW China. J. Nat. Gas Sci. Eng. 2015, 27, 410–423. [Google Scholar] [CrossRef]
  4. Slatt, R.M.; Rodriguez, N.D. Comparative sequence stratigraphy and organic geochemistry of gas shales: Commonality or coincidence? J. Nat. Gas Sci. Eng. 2012, 8, 68–84. [Google Scholar] [CrossRef]
  5. Ratcliffe, K.T.; Wright, A.M.; Schmidt, K. Application of inorganic whole–rock geochemistry to shale resource plays: An example from the Eagle Ford Shale Formation, Texas. Sediment. Rec. 2012, 10, 4–9. [Google Scholar] [CrossRef]
  6. Turner, B.W. Utilization of Chemostratigraphic Proxies for Generating and Refining Sequence Stratigraphic Frameworks in Mudrocks and Shales. Ph.D. Thesis, University of Oklahoma Graduate College, Norman, OK, USA, 2016; pp. 1–98. [Google Scholar]
  7. Turner, B.W.; Tréanton, J.A.; Slatt, R.M. The use of chemostratigraphy to refine ambiguous sequence stratigraphic correlations in marine mudrocks. An example from the Woodford Shale, Oklahoma, USA. J. Geol. Soc. 2016, 173, 854–868. [Google Scholar] [CrossRef]
  8. Ramkumar, M. Chemostratigraphy: Concepts, Techniques, and Applications; Elsevier: Amsterdam, The Netherlands, 2015; pp. 1–432. [Google Scholar]
  9. Weissert, H.; Joachimski, M.; Sarnthein, M. Chemostratigraphy. Newsl. Stratigr. 2008, 42, 145–179. [Google Scholar] [CrossRef]
  10. Turner, B.W.; Molinares–Blanco, C.E.; Slatt, R.M. Chemostratigraphic, palynostratigraphic, and sequence–stratigraphic analysis of the Woodford Shale, Wyche Farm Quarry, Pontotoc County, Oklahoma. Interpretation 2015, 3, SH1–SH9. [Google Scholar] [CrossRef]
  11. Montero-Serrano, J.C.; Palarea–Albaladejo, J.; Martín–Fernández, J.A.; Martínez–Santana, M.; Gutiérrez–Martín, J.V. Sedimentary chemofacies characterization by means of multivariate analysis. Sediment. Geol. 2010, 228, 218–228. [Google Scholar] [CrossRef]
  12. Pearce, T.J.; Besly, B.M.; Wray, D.S.; Wright, D.K. Chemostratigraphy: A method to improve interwell correlation in barren sequences—A case study using onshore Duckmantian/Stephanian sequences (West Midlands, UK). Sediment. Geol. 1999, 124, 197–220. [Google Scholar] [CrossRef]
  13. Dypvik, H.; Harris, N.B. Geochemical facies analysis of fine-grained siliciclasics using Th/U, Zr/Rb and (Zr+Rb)/Sr ratios. Chem. Geol. 2001, 181, 131–146. [Google Scholar] [CrossRef]
  14. Kiipli, T.; Kallaste, T.; Nestor, V. Composition and correlation of volcanic ash beds of Silurian age from the eastern Baltic. Geol. Mag. 2010, 147, 895–909. [Google Scholar] [CrossRef]
  15. Algeo, T.J. Can marine anoxic events draw down the trace element inventory of seawater? Geology 2004, 32, 1057–1060. [Google Scholar] [CrossRef]
  16. Aldahan, A.; Possnert, G.; Scherer, R.; Shi, N.; Backman, J.; Boström, K. Trace–element and major–element stratigraphy in quaternary sediments from the Arctic Ocean and implications for glacial termination. J. Sediment. Res. 2000, 70, 1095–1106. [Google Scholar] [CrossRef]
  17. Aehnelt, M.; Worden, R.H.; Canham, A.C.; Hill, S.J.; Hodgson, D.M.; Flint, S.S. Geochemical correlation in an exhumed submarine channel complex (Tabernas Basin, Se Spain): Comparison to sedimentological correlation at various length scales. J. Sediment. Res. 2013, 83, 669–690. [Google Scholar] [CrossRef]
  18. Craigie, N.W. Applications of chemostratigraphy in Cretaceous sediments encountered in the North Central Rub’ al–Khali Basin, Saudi Arabia. J. Afr. Earth Sci. 2015, 104, 27–42. [Google Scholar] [CrossRef]
  19. Liu, B.J.; Xu, X.S. Geographic Evolution of Paleolithofacies in South China, 1st ed.; Science Press: Beijing, China, 1993. [Google Scholar]
  20. Mu, C.L.; Zhou, K.K.; Liang, W.; Ge, X.Y. Early Paleozoic sedimentary environment of hydrocarbon source rocks in the middle–upper Yangtze region and petroleum and gas exploration. Acta Geol. Sin. 2011, 85, 526–532. [Google Scholar]
  21. Rong, J.Y. The Hirnantia fauna in China and the discussion of boundary between Ordovician and Silurian. Acta Stratigr. Sin. 1979, 3, 1–29. [Google Scholar]
  22. Rong, J.Y.; Zhan, R.B. Ordovician–Silurian brachiopod fauna turnover in South China. Geoscience 1999, 13, 390–394. [Google Scholar]
  23. Liu, S.G.; Wang, S.Y.; Sun, W.; Ran, B.; Yang, D.; Luo, C.; Ye, Y.H.; Bai, Z.Q.; Qiu, J.W.; Zhang, X. Characteristics of black shale in Wufeng Formation and Longmaxi Formation in Sichuan Basin and its peripheral areas. J. Chengdu Univ. Technol. 2013, 40, 621–639. [Google Scholar]
  24. Wedepohl, K.H. Environmental influences on the chemical composition of shales and clays. Phys. Chem. Earth 1971, 8, 307–333. [Google Scholar] [CrossRef]
  25. Calvert, S.E.; Pedersen, T.F. Geochemistry of recent oxic and anoxic marine sediments: Implications for the geological record. Mar. Geol. 1993, 113, 67–88. [Google Scholar] [CrossRef]
  26. Brumsack, K.J. The trace metal content of recent organic carbon–rich sediments: Implications for Cretaceous black shale formation. Palaeogeogr. Palaeoclimatol. Palaeoecol. 2006, 232, 344–361. [Google Scholar] [CrossRef]
  27. Seiler, H. Secondary electron emission in the scanning electron microscope. J. Appl. Phys. 1983, 54, R1–R18. [Google Scholar] [CrossRef]
  28. Pearce, T.J.; Jarvis, I. Applications of geochemical data to modelling sediment dispersal patterns in distal turbidites: Late Quaternary of the Madeira abyssal plain. J. Sediment. Res. 1992, 62, 1112–1129. [Google Scholar]
  29. Ratcliffe, K.T.; Martin, J.; Pearce, T.J.; Hughes, A.D.; Lawton, D.E.; Wray, D.S.; Bessa, F. A regional chemostratigraphically–defined correlation framework for the late Triassic TAG–I Formation in Blocks 402 and 405a, Algeria. Pet. Geosci. 2006, 12, 3–12. [Google Scholar] [CrossRef]
  30. Ratcliffe, K.T.; Wilson, A.; Payenberg, T.; Rittersbacher, A.; Hildred, G.V.; Flint, S.S. Ground truthing chemostratigraphic correlations in fluvial systems. AAPG Bull. 2015, 99, 155–180. [Google Scholar] [CrossRef]
  31. Reátegui, K.; Martínez, M.; Esteves, I.; Gutiérrez, J.V.; Martínez, A.; Meléndez, W.; Urbanzi, F. Geochemistry of the Mirador Formation (Late Eocene–Early Oligocene), southwestern Venezuela: Chemostratigraphic constraints on provenance and the influence of the sea level. Geochem. J. 2005, 39, 213–226. [Google Scholar] [CrossRef]
  32. Ward, J.H. Hierarchical grouping to optimize an objective function. J. Am. Stat. Assoc. 1963, 58, 236–244. [Google Scholar] [CrossRef]
  33. Romesburg, H.C. Cluster Analysis for Researchers, 1st ed.; Lifetime Learning Publications: Belmont, CA, USA, 1984. [Google Scholar]
  34. Templ, M.; Filzmoser, P.; Reimann, C. Cluster analysis applied to regional geochemical data: Problems and possibilities. Appl. Geochem. 2008, 23, 2198–2213. [Google Scholar] [CrossRef]
  35. Gill, D.; Shomrony, A.; Fligelman, H. Numerical zonation of Log suites and Log facies recognition by multivariate clustering. AAPG Bull. 1993, 77, 1781–1791. [Google Scholar]
  36. Bennett, K.D. Determination of the number of zones in a biostratigraphical sequence. New Phytol. 1996, 132, 155–170. [Google Scholar] [CrossRef] [PubMed]
  37. Jones, B.; Manning, D.A.C. Comparison of geochemical indices used for the interpretation of palaeoredox conditions in ancient mudstones. Chem. Geol. 1994, 111, 111–129. [Google Scholar] [CrossRef]
  38. Adachi, M.; Yamamoto, K.; Sugisaki, R. Hydrothermal chert and associated siliceous rocks from the northern Pacific: Their geological signifcance and indication of ocean ridge activity. Sediment. Geol. 1986, 47, 125–148. [Google Scholar] [CrossRef]
  39. Liang, Y.; Zhang, J.; Liu, T.; Tang, X.; Li, Z.; Ding, J.; Wang, Y.; Yang, S. Evidence for Biogenic Silica Occurrence in the Lower Silurian Longmaxi Shale in Southeastern Chongqing, China. Minerals 2020, 10, 945. [Google Scholar] [CrossRef]
  40. Dong, T.; He, S.; Chen, M.; Hou, Y.; Guo, X.; Wei, C.; Han, Y.; Yang, R. Quartz types and origins in the paleozoic Wufeng-Longmaxi Formations, Eastern Sichuan Basin, China: Implications for porosity preservation in shale. Mar. Pet. Geol. 2019, 106, 62–73. [Google Scholar] [CrossRef]
  41. Guan, Q.; Dong, D.; Zhang, H.; Sun, S.; Zhang, S.; Guo, W. Types of biogenic quartz and its coupling storage mechanism in organic-rich shales: A case study of the Upper Ordovician Wufeng Formation to Lower Silurian Longmaxi Formation in the Sichuan Basin, SW China. Pet. Explor. Dev. 2021, 48, 813–823. [Google Scholar] [CrossRef]
  42. Rong, J.Y.; Chen, X. Faunal differentiation, biofacies and lithofacies pattern of late Ordovician (Ashgillian) in South China. Acta Palaeontol. Sin. 1987, 26, 507–533. [Google Scholar]
  43. Tribovillard, N.; Algeo, T.J.; Lyons, T.; Riboulleau, A. Trace metals as paleoredox and paleoproductivity proxies–An update. Chem. Geol. 2006, 232, 12–32. [Google Scholar] [CrossRef]
  44. Banner, J.L. Application of the trace element and isotope geochemistry of strontium to studies of carbonate diagenesis. Sedimentology 1995, 42, 805–824. [Google Scholar] [CrossRef]
  45. Bourque, P.A.; Malo, M.; Kirkwood, D. Paleogeography and tectono–sedimentary history at the margin of Laurentia during Silurian to earliest Devonian time: The Gaspé Belt, Québec. Geol. Soc. Am. Bull. 2000, 112, 4–20. [Google Scholar] [CrossRef]
  46. Johnson, M.E.; Rong, J.Y.; Yang, X.C. Intercontinental correlation by sea–level events in the Early Silurian of North America and China (Yangtze Plantform). Geol. Soc. Am. Bull. 1985, 96, 1384–1397. [Google Scholar] [CrossRef]
  47. Kiipli, E.; Kiipli, T.; Kallaste, T.; Siir, S. Al203/Ti02 ratio of the clay fraction of Late Ordovician–Silurian carbonate rocks as an indicator of paleoclimate of the Fennoscandian Shield. Palaeogeogr. Palaeoclimatol. Palaeoecol. 2012, 365–366, 312–320. [Google Scholar] [CrossRef]
  48. Li, Y.; Kershaw, S. Reef reconstruction after extinction event of Latest Ordovician in Yangtze Platform, South China. Facies 2003, 48, 269–284. [Google Scholar]
  49. Zhang, T.S.; Chen, X.H.; Bian, L.Z.; Yu, J.H.; Lan, G.Z.; Wan, Y. Tectonic control of the Silurian reef distribution and development on Upper Yangtze Platform. Acta Sedimentol. Sin. 1996, 14, 84–93. [Google Scholar]
  50. Berner, R.A. The long–term carbon cycle, fossil fuels and atmospheric composition. Nature 2003, 426, 323–326. [Google Scholar] [CrossRef] [PubMed]
  51. Huang, Y.J.; Wang, C.S.; Chen, X. Response of reactive phosphorus burial to the sedimentary transition from Cretaceous black shales to oceanic red beds in Southern Tibet. Acta Geol. Sin. 2007, 81, 1012–1018. [Google Scholar]
  52. Tyson, R.V.; Pearson, T.H. Modern and ancient continental shelf anoxia: An overview. Geol. Soc. Lond. Spec. Publ. 1991, 58, 1–24. [Google Scholar] [CrossRef]
  53. Algeo, T.J.; Maynard, J.B. Trace–element behavior and redox facies in core shales of Upper Pensylvanian Kansas–type caclothems. Chem. Geol. 2004, 206, 289–318. [Google Scholar] [CrossRef]
  54. Wehrli, B.; Stumm, W. Vanadyl in natural waters: Adsorption and hydrolysis promote oxygenation. Geochim. Cosmochim. Acta 1989, 53, 69–77. [Google Scholar] [CrossRef]
  55. Wanty, R.B.; Goldhaber, R. Thermodynamics and kinetics of reactions involving vanadium in natural systems: Accumulation of vanadium in sedimentary rock. Geochim. Cosmochim. Acta 1992, 56, 1471–1483. [Google Scholar] [CrossRef]
  56. Wignall, P.B.; Newton, R. Pyrite framboid diameter as a measure of oxygen deficiency in ancient mudrocks. Am. J. Sci. 1998, 298, 537–552. [Google Scholar] [CrossRef]
  57. Su, W.B.; Huff, W.D.; Ettensohn, F.R.; Liu, X.M.; Zhang, J.E.; Li, Z.M. K-bentonite, black-shale and flysch successions at the Ordovician–Silurian transition, South China: Possible sedimentary responses to the accretion of Cathaysia to the Yangtze Block and its implications for the evolution of Gondwana. Gondwana Res. 2009, 15, 111–130. [Google Scholar] [CrossRef]
  58. Branchley, P.T.; Newell, G. A facies analysis of upper Ordovician regressive sequences in the Oslo region, Norway–a record of glacio eustatic changes. Palaeogeogr. Palaeoclimatol. Palaeoecol. 1980, 31, 1–38. [Google Scholar] [CrossRef]
  59. Guo, X.S. Sequence stratigraphy and evolution model of the Wufeng–Longmaxi shale in the Upper Yangtze area. Earth Sci. 2017, 42, 1069–1082. [Google Scholar]
  60. Wang, T.; Yang, K.M.; Xiong, L.; Shi, H.L.; Zhang, Q.L.; Wei, L.M.; He, X.L. Shale sequence stratigraphy of wufeng–longmaxi formation in southern sichuan and their control on reservoirs. Acta Pet. Sin. 2015, 36, 915–925. [Google Scholar]
  61. Zhang, J.Y.; Lu, Y.C.; Fu, X.Y.; Zhang, S.W. Sequence stratigraphic framework and sedimentary evolution of the Wufeng Formation—The 1st member of Longmaxi Formation in Fuling area, Sichuan Basin. Geol. Sci. Technol. Inf. 2017, 36, 65–72. [Google Scholar]
Figure 1. Paleogeographic map of Yangtze area during the late Ordovician and early Silurian periods, and the location of Liutang section.
Minerals 12 01124 g001
Figure 2. The dendrogram derived from the constrained clustering analysis.
Minerals 12 01124 g002
Figure 3. The bstick model illustrating the statistically significant number of chemozones.
Minerals 12 01124 g003
Figure 4. The chemostratigraphic scheme of the Wufeng and the Lower Longmaxi Fm., and profiles of geochemical proxies, as well as the statistics of framboid pyrites.
Minerals 12 01124 g004
Figure 5. The geochemical diagrams. In Figure 5a,e, sample LT-18D (sampled from GYQ layer at depth of 92 m) was plotted at an area far from other samples because this sample is calcareous shale and diluted by the carbonate. (a) the scatter plot between Al and Si; (b) the Al-Fe-Mn ternary diagram; (c) the scatter plot between Zr and Si; (d) the Siexc and 10*TOC profiles; (e) the 5*Al2O3-CaO-SiO2 ternary diagram; (f) the scatter plot between SiO2/(SiO2 + 5Al2O3) and Al2O3.
Minerals 12 01124 g005
Figure 6. The syngenetic and diagenetic framboidal pyrites and biomarkers unveiled in the strata. (af,il) are photographed under microscopy (+); (g,h) are photographed under scanning electron microscopy.
Minerals 12 01124 g006
Figure 7. The Rb/Al, Ti/Al, and Y/Al profiles.
Minerals 12 01124 g007
Figure 8. The chemostratigraphic scheme and its comparison with the regional sequence-stratigraphic schemes. a is revised from Wang et al. [60]; b is from Guo et al. [59]; c is from Zhang et al. [61]; d is from Chen et al. [3].
Minerals 12 01124 g008
Table 1. The statistical results of geochemical proxies used in this work.
LocationAl2O3 %SiO2 %CaO %EF (Rb)EF (Y)EF (Ti)V/CrTOC %Siexc
WholeRange2.93~20.0032.44~91.910.02~17.310.43~2.170.39~3.940.54~1.781.05~9.280.13~8.5212.47~81.52
(0~101 m)Average14.3666.680.450.990.920.962.421.8115.78
Arenaceous ShalesRange9.74~20.0058.26~79.800.05~0.340.56~1.080.47~1.000.54~0.871.05~2.140.13~0.5712.47~45.25
0~16 mAverage16.6764.930.150.89 0.63 0.74 1.56 0.31 5.84
ShalesRange11.17~18.7045.08~76.480.03~8.990.78~1.190.50~1.420.76~1.171.10~4.160.16~3.768.15~36.89
16~83.5 mAverage15.3765.550.320.99 0.82 0.98 2.02 1.68 11.05
Dark ShalesRange2.9~17.132.44~91.90.02~17.30.43~2.170.39~3.940.66~1.781.33~9.280.44~8.526.03~81.52
83.5~101 mAverage9.1871.981.121.06 1.46 1.03 4.433.21 39.44
Average Shales16.6258.932.241.00 1.00 1.00 1.44 0.00
Table 2. Proxies employed for the chemostratigraphic purposes and their geological interpretations.
ProxiesGeological Interpretations
SiO2/(SiO2 + 5Al2O3)Biogenic vs. terrigenous inputs
V/CrRedox condition
TOCCoupling between paleoproductivity and redox conditions
SiexcPaleoproductivity
CaCarbonate mineral
Table 3. The geochemical characteristics of chemozones.
ChemozonesDepth/mCharacteristics
C30~16SiO2/(SiO2 + 5Al2O3) and Siexc fluctuating, V/Cr < 2, TOC < 2%, Ca = 0%
C2-616~28.5SiO2/(SiO2 + 5Al2O3) < 0.5, V/Cr = 2±, TOC < 2%, Siexc < 10, Ca = 0%
C2-528.5~29.5SiO2/(SiO2 + 5Al2O3) < 0.5, V/Cr = 2±, TOC < 2%, Siexc < 10, Ca > 1%
C2-429.5~40SiO2/(SiO2 + 5Al2O3) < 0.5, V/Cr < 2, TOC < 2%, Siexc = 10±, Ca = 0%±
C2-340~44SiO2/(SiO2 + 5Al2O3) < 0.5, V/Cr < 2, TOC < 2%, Siexc = 10±, Ca > 1%
C2-2B44~66SiO2/(SiO2 + 5Al2O3) < 0.5, V/Cr < 2, TOC < 2%, Siexc = 10±, Ca = 0%±
C2-2A66~72SiO2/(SiO2 + 5Al2O3) > 0.5, 2 < V/Cr < 4.25, TOC > 2%, Siexc > 10, Ca = 0%
C2-1B72~77SiO2/(SiO2 + 5Al2O3) < 0.5, V/Cr < 2, TOC < 2%, Siexc > 10, Ca = 0%; SiO2/(SiO2 + 5Al2O3) and Siexc showing increasing trend
C2-1A77~84SiO2/(SiO2 + 5Al2O3) < 0.5, V/Cr < 2, TOC < 2%, Siexc > 10, Ca = 0%; SiO2/(SiO2 + 5Al2O3) and Siexc showing decreasing trend
C1-484~87SiO2/(SiO2 + 5Al2O3) > 0.5, 2 < V/Cr < 4.25, TOC > 2%, Siexc > 10, Ca > 1%
C1-387~91.5SiO2/(SiO2 + 5Al2O3) > 0.5, 4.25 < V/Cr, TOC > 2%, Siexc > 10, Ca < 1%
C1-291.5~92.5SiO2/(SiO2 + 5Al2O3) > 0.5, 2 <V/Cr < 4.25, TOC > 2%, Siexc > 10, Ca > 1%
C1-192.5~101SiO2/(SiO2 + 5Al2O3) > 0.5, V/Cr > 2, TOC > 2%, Siexc > 10, Ca = 0%
Publisher’s Note: MDPI stays neutral with regard to jurisdictional claims in published maps and institutional affiliations.

