Article

Uranium in Source Rocks: Role of Redox Conditions and Correlation with Productivity in the Example of the Bazhenov Formation

1
Skoltech Center for Hydrocarbon Recovery, Skolkovo Institute of Science and Technology, Bolshoy Boulevard 30, bld. 1, 121205 Moscow, Russia
2
Hydroisotop GmbH, Woelkestrasse 9, 85301 Schweitenkirchen, Bayern, Germany
*
Author to whom correspondence should be addressed.
Minerals 2022, 12(8), 976; https://doi.org/10.3390/min12080976
Submission received: 23 May 2022 / Revised: 25 July 2022 / Accepted: 26 July 2022 / Published: 31 July 2022

Abstract

:
The paper reports comprehensive analysis of different factors affecting uranium content in oil source rocks and the relationship between uranium content and productivity of source rocks. The analysis of data for 13 wells of the Bazhenov Formation (Western Siberia, Russia) was carried out. The uranium content of the rocks was measured by gamma-ray spectrometry on core samples. In order to analyze factors affecting uranium accumulation in source rocks, we studied content and characteristics of organic matter (Rock-Eval pyrolysis), and also mineral, element, and isotope composition of rocks. We have shown that redox conditions at the sedimentation stage have the most pronounced impact on the uranium accumulation in the rocks of the Bazhenov Formation. It was also shown that productive intervals, containing increased amounts of mobile hydrocarbons, are characterized by low (<20 ppm) concentration of uranium. However, the intervals, containing phosphorite minerals may show better reservoir properties and oil saturation at higher concentration of uranium. The analysis of correlations and relationships between uranium content and Rock-Eval pyrolysis indexes (oil saturation index and productivity index) enabled formulation of criteria for selection of oil-saturated intervals using the spectral gamma and pulsed neutron spectroscopy log data.

1. Introduction

Oil source rocks are characterized by increased uranium content, reaching values above 100 ppm. The patterns of the vertical variations in uranium concentration differ significantly for different wells and formations. These variations are associated with a number of factors affecting the accumulation of uranium during the formation of the deposits and further geological history. Despite the established connection between variations in the uranium content and the conditions of hydrocarbon formation processes, uranium concentration data are mainly used for identification of source rock lithological boundaries, well-to-well log correlation (in combination with other logging data), as well as for core-to-log data integration [1,2,3]. At the same time, the use of uranium data for studies of hydrocarbon formation and source rock productivity remains limited [4,5,6]. One of the main reasons for such lack of application is insufficient knowledge of the factors that determine uranium accumulation at the sedimentation stage and subsequent changes in uranium concentration during rock catagenesis. The uranium behavior in the earth’s crust has been considered in a wide range of geochemical studies and has been studied in a huge number of works since the early 1960s. The most systematic uranium study was carried out in the research [7]. In this work, the main processes and factors influencing the uranium accumulation were analyzed. Subsequently, uranium research continued and was reflected in the following works [8,9,10,11]. Uranium content, as well as U/TOC ratio (TOC: total organic carbon), are influenced by a range of different factors such as uranium concentration in seawater, degree of uranium accumulation by marine organisms, redox conditions and sedimentation rate, the lithological composition of sediments, the content of phosphate minerals, diagenesis, and catagenesis conditions and others [7,8,9,10,11,12,13,14,15]. The implication of many factors results in a potentially important amount of information provided by uranium content data. However, it also significantly complicates uranium content interpretation. The purpose of the current study was to overview the factors affecting the amount of uranium in the rocks and relate the uranium concentrations and organic matter content and composition to the productivity of the Bazhenov Formation deposits.

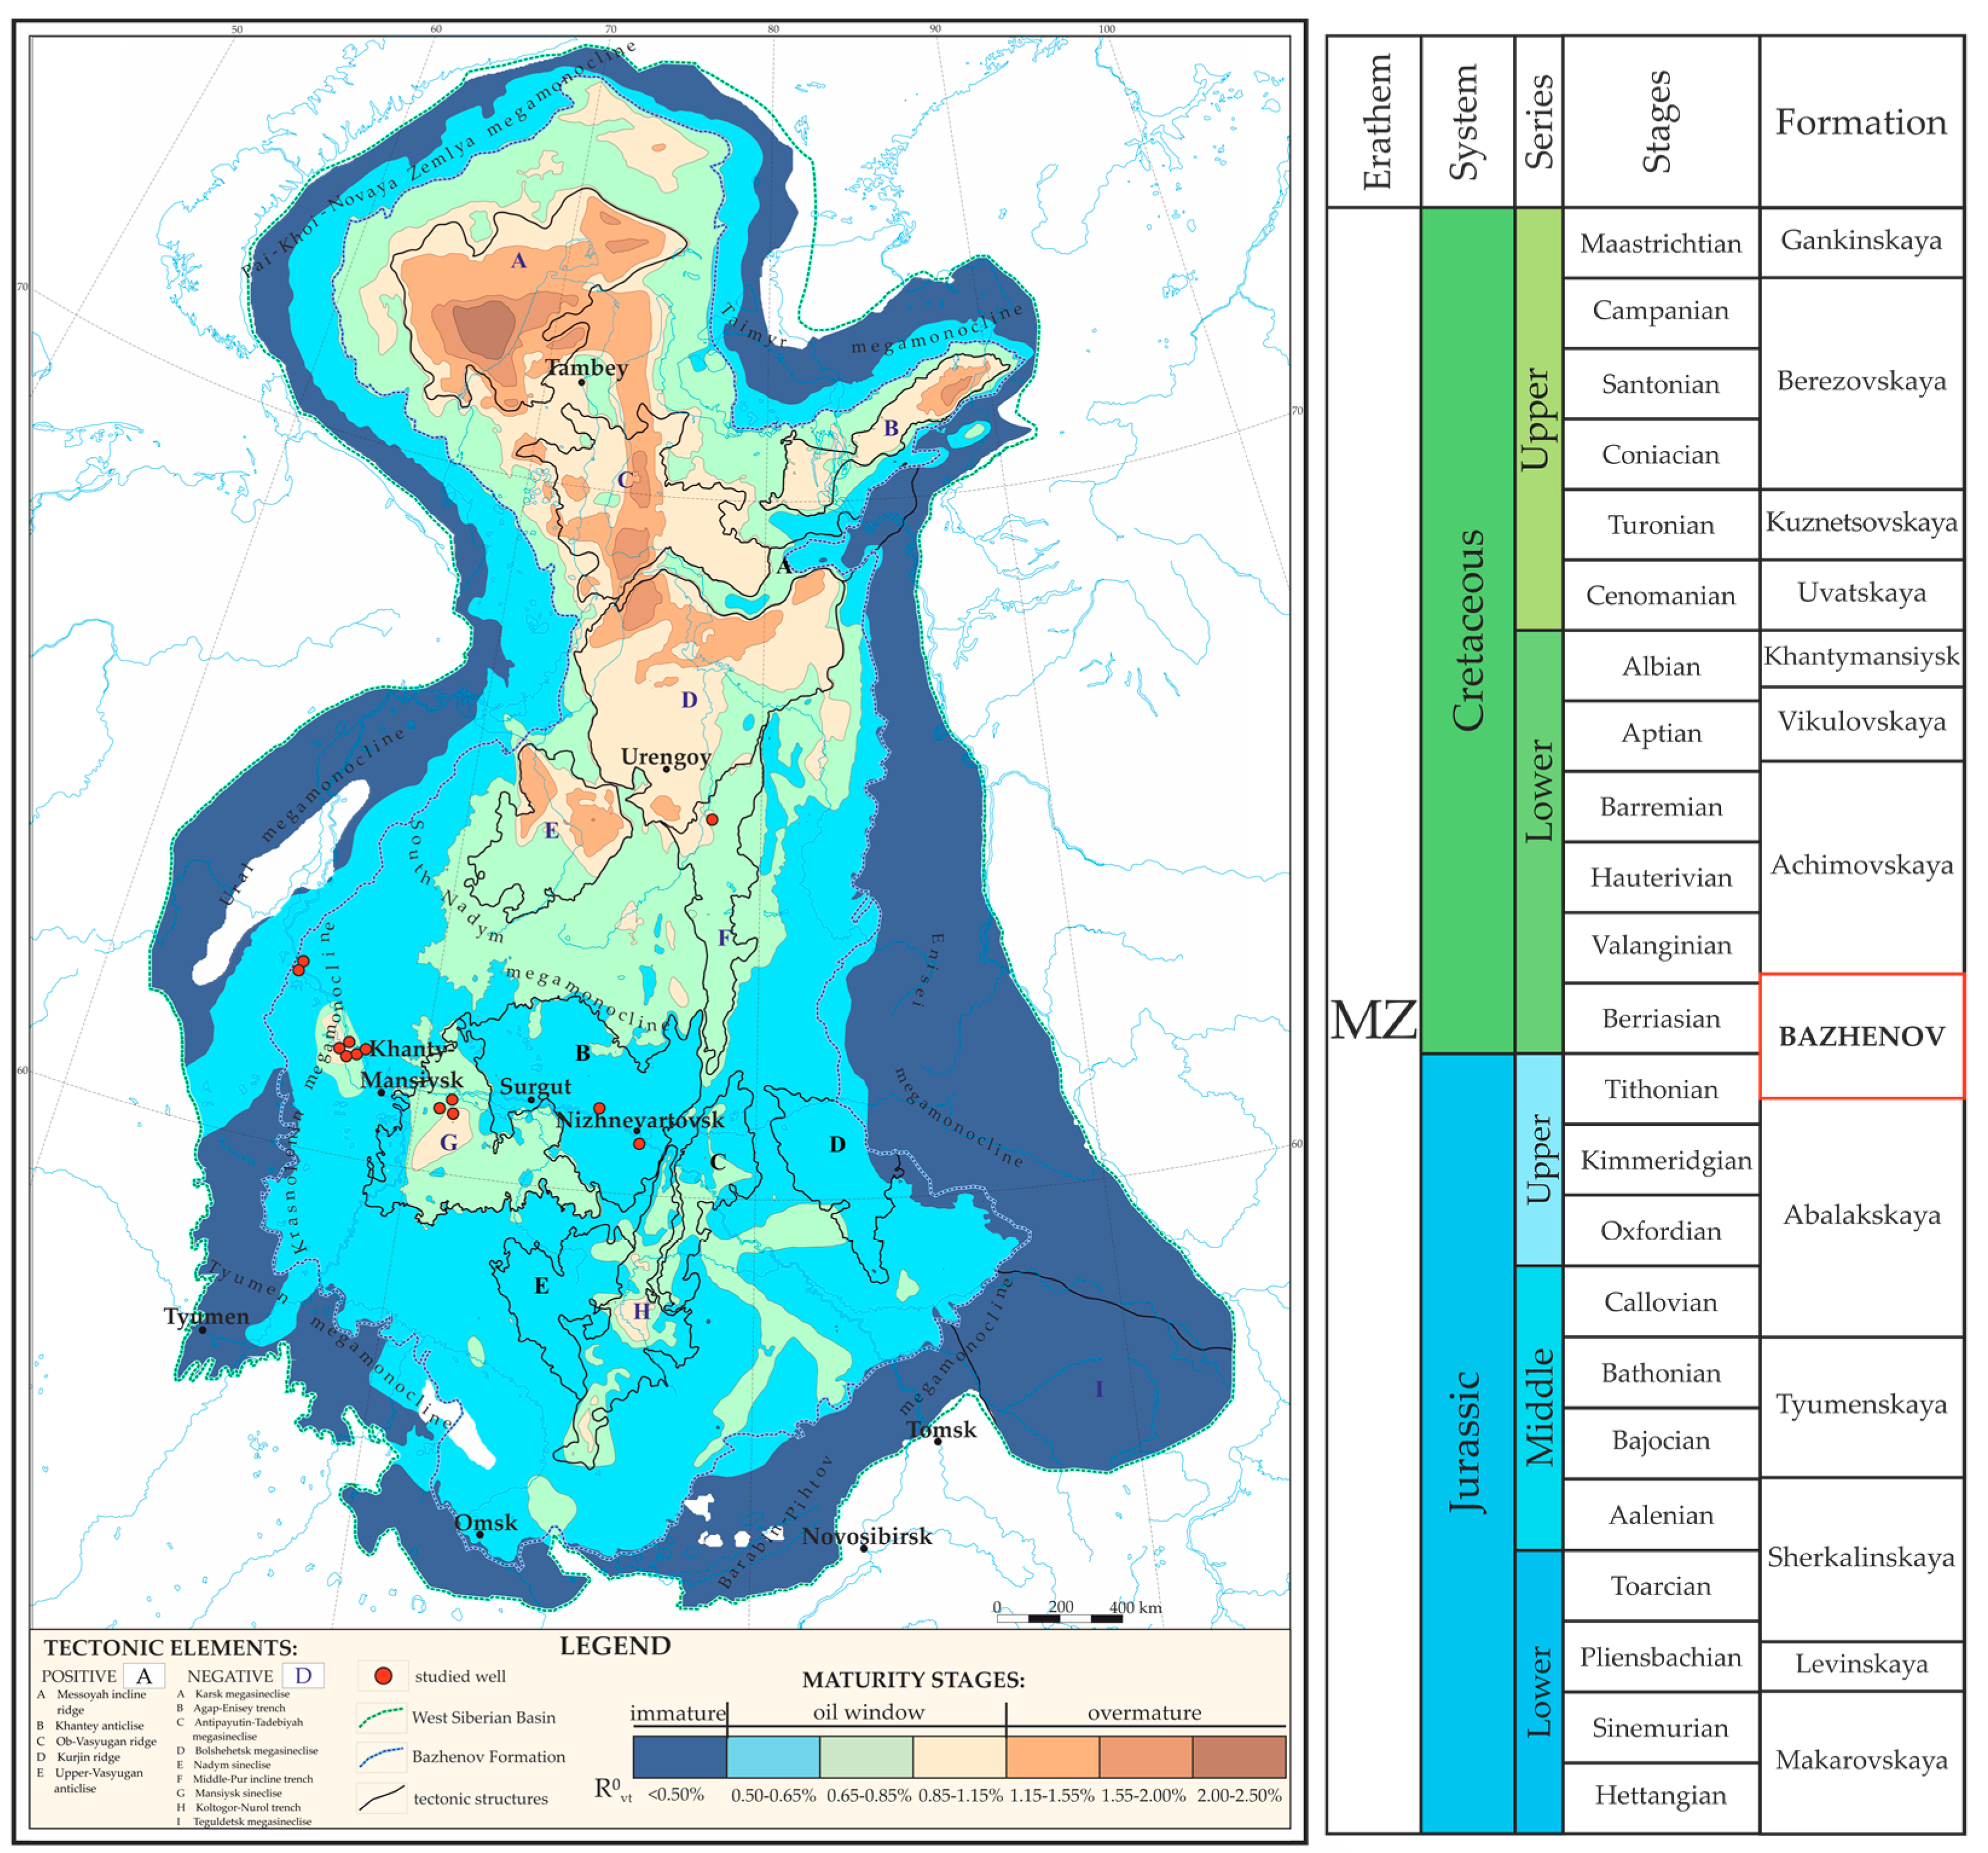
2. Regional Settings

The Bazhenov Formation (BF) is one of the largest oil source formations in the world in terms of its area and hydrocarbon resources. The Upper Jurassic-Lower Cretaceous deposits of the Formation (J3–K1) are distributed throughout the West Siberian oil and gas Basin, covering over 1 million km2. These deposits occur at depths of 2500–3000 meters between Upper Jurassic terrigenous rocks and Lower Cretaceous mudstones [16,17,18]. The thickness of the formation varies from 25 to 80 m, with an average of 30–40 m. The rocks are represented by siliceous, clayey-siliceous, carbonate, and clayey-carbonate-siliceous varieties with high organic matter (OM) content [19,20]. The BF rocks are characterized by low porosity and permeability and thus are classified as oil shale. The total initial OM of the Bazhenov Formation reaches 30 wt. %, with average values of 10–15 wt.% and is represented by solid kerogen, and light and heavy hydrocarbons [21,22]. OM content of the upper BF subformation (strata) is several percent higher than in the lower one, which allows us to distinguish between the upper and lower subformations in logging diagrams. In the vast area of the West Siberian Basin, the nature of OM remains the same and is represented by type II kerogen. Its phase composition depends on OM maturity [22,23]. The Bazhenov Formation is increased in gamma-ray logging values associated with an increased uranium content. The lower strata of the BF are characterized by lower values of uranium content (up to 25 ppm), while the upper strata are characterized by higher concentrations of uranium, reaching 150 ppm. The lower strata are mainly composed of kerogen-clayey and clayey-kerogen silicites. In the upper part of the lower strata, we distinguish an interval of radiolarites with radiolarian shell fragments and developed secondary dolomites and limestones. The upper strata are represented by organic-rich clayey-carbonate and carbonate-clayey silicites and contain a large amount of biogenic carbonate associated with remains of the shell debris (bivalve) and coccolithophores [24,25]. Due to poor reservoir properties, two main technologies are used for hydrocarbon production from BF. The first is multi-stage hydraulic fracturing, which is applicable for the intervals containing the highest free hydrocarbons content with smaller amounts of solid kerogen and demonstrating increased reservoir properties. The second includes thermal reservoir stimulation resulting in the partial conversion of kerogen and heavy fractions into mobile hydrocarbons.
In the current study, we analyzed uranium concentration, the content and composition of organic matter in the Bazhenov Formation rocks from 13 wells located in the central and northern parts of the Basin (Figure 1). The BF deposits of the studied wells are identical in terms of lithological composition and initial OM content, but demonstrate different degrees of maturation (catagenetic transformation) [26].

3. Methods

We report data on the uranium concentration, the content, and composition of organic matter. We have conducted extended lithological-petrophysical and isotopic-geochemical studies for several sections within the BF interval, including determining the lithological composition, reservoir properties, sulfur isotopic composition, and elemental composition rocks, including selected micro-elements.
The distribution of uranium content in the rocks was determined by spectral gamma-ray analyzer. The principle of gamma spectrometer operation is based on the intensity of the registered spectra of rocks’ natural radioactivity on the mass fraction of potassium, uranium, and thorium in the studied rocks [28].
The total organic carbon and petroleum generation characteristics were measured by Rock-Eval pyrolysis using pyrolyser HAWK Resource Workstation (Wildcat technology, San Diego, CA, USA) [29,30,31,32,33,34]. Following the procedure of measurements, the amounts of thermally desorbed hydrocarbon gases (S0, mg HC/g rock), liquid hydrocarbons (S1, mg HC/g rock), the amounts of kerogen cracking hydrocarbon products (S2, mg HC/g rock), and oxygen-containing products (S3, mg CO2/g rock) were measured during pyrolysis in inert gas at increasing temperature. The amount of non-pyrolyzed kerogen (S4, mg CO2/g rock) was measured separately at oxidizing stage of analysis. Total organic carbon (TOC, %) was calculated using the data on all the organic carbon-containing compounds. Following the procedure described in [23], the pyrolysis procedure was performed twice: for the original sample and the same sample after extraction with chloroform (the measured values of S0, S1, S2, S3, and TOC obtained for samples after extraction are marked by index “ex”). Double analysis of the samples allowed us to determine the corrected amount of kerogen decomposition products S2ex and corrected indices Tmaxex [23]. The following indices were used to determine the OM quality: hydrogen index HI (mg HC/g TOC), given by a ratio of the among of organic carbon S2 to TOC content (HI = S2/TOC·100%), oxygen index OI (mg CO2/g TOC), given by a ratio of S3 to TOC content (OI = S3/TOC·100%). During data interpretation and estimation of the OM maturity, the following indices were also taken into account: oil saturation index (OSI = S0 + S1/TOC·100%, mg HC/g TOC), PI—productivity index (PI = S0 + S1/(S0 + S1 + S2)), and coefficient Kgocex = GOCex/TOCex·100%, reflecting the percent of the residual generative organic carbon (GOC) in TOCex = GOCex + NGOCex [23,26,32,33]. Generative organic carbon content GOC (wt.%) = (S0 + S1 + S2)·0.085 + S3·12/440 + (S3CO + S3’CO)·12/280, non-generative organic carbon content NGOC (wt.%) = S4CO·12/280 + S4CO2·12/440.
The contents of uranium, vanadium, phosphorus oxide (P2O5), and manganese oxide (MnO) were determined during chemical elemental analysis with X-ray fluorescence analysis (XRF).
The sulfur isotope composition in rock samples was analyzed using Thermo Scientific DELTA V Plus mass spectrometer equipped by Flash HT elemental analyzer [35].

4. Results and Discussions

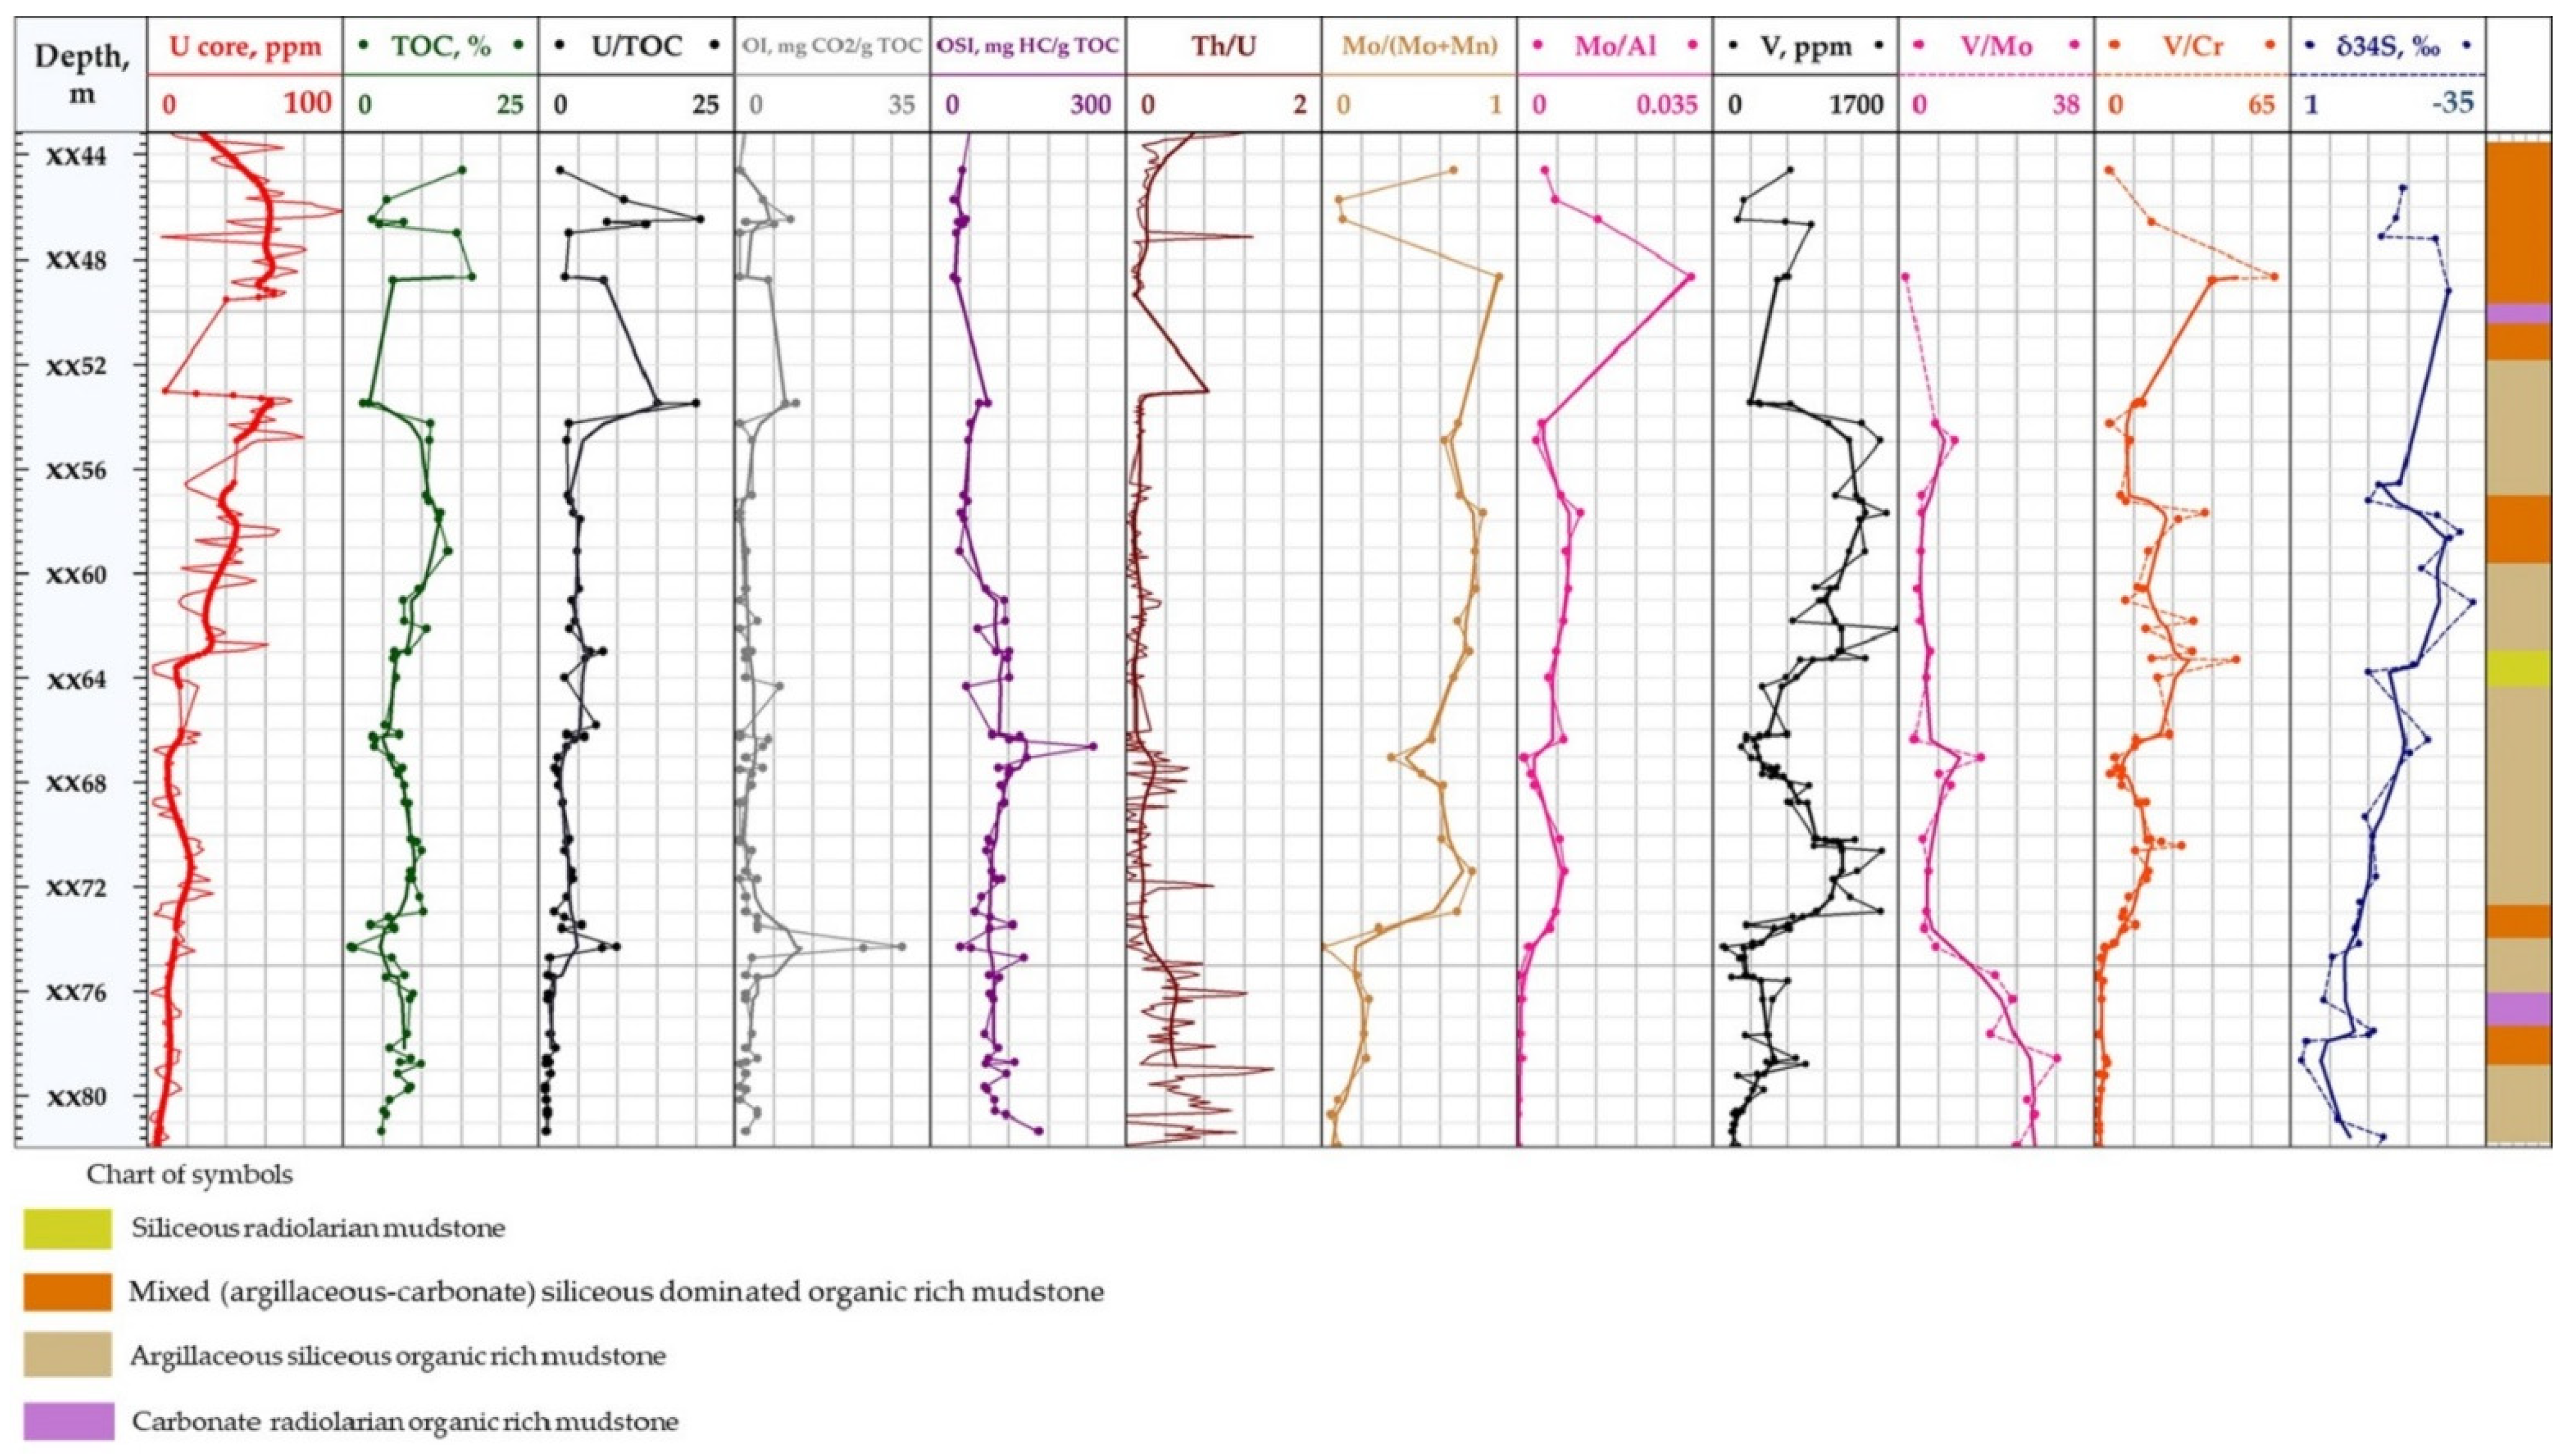
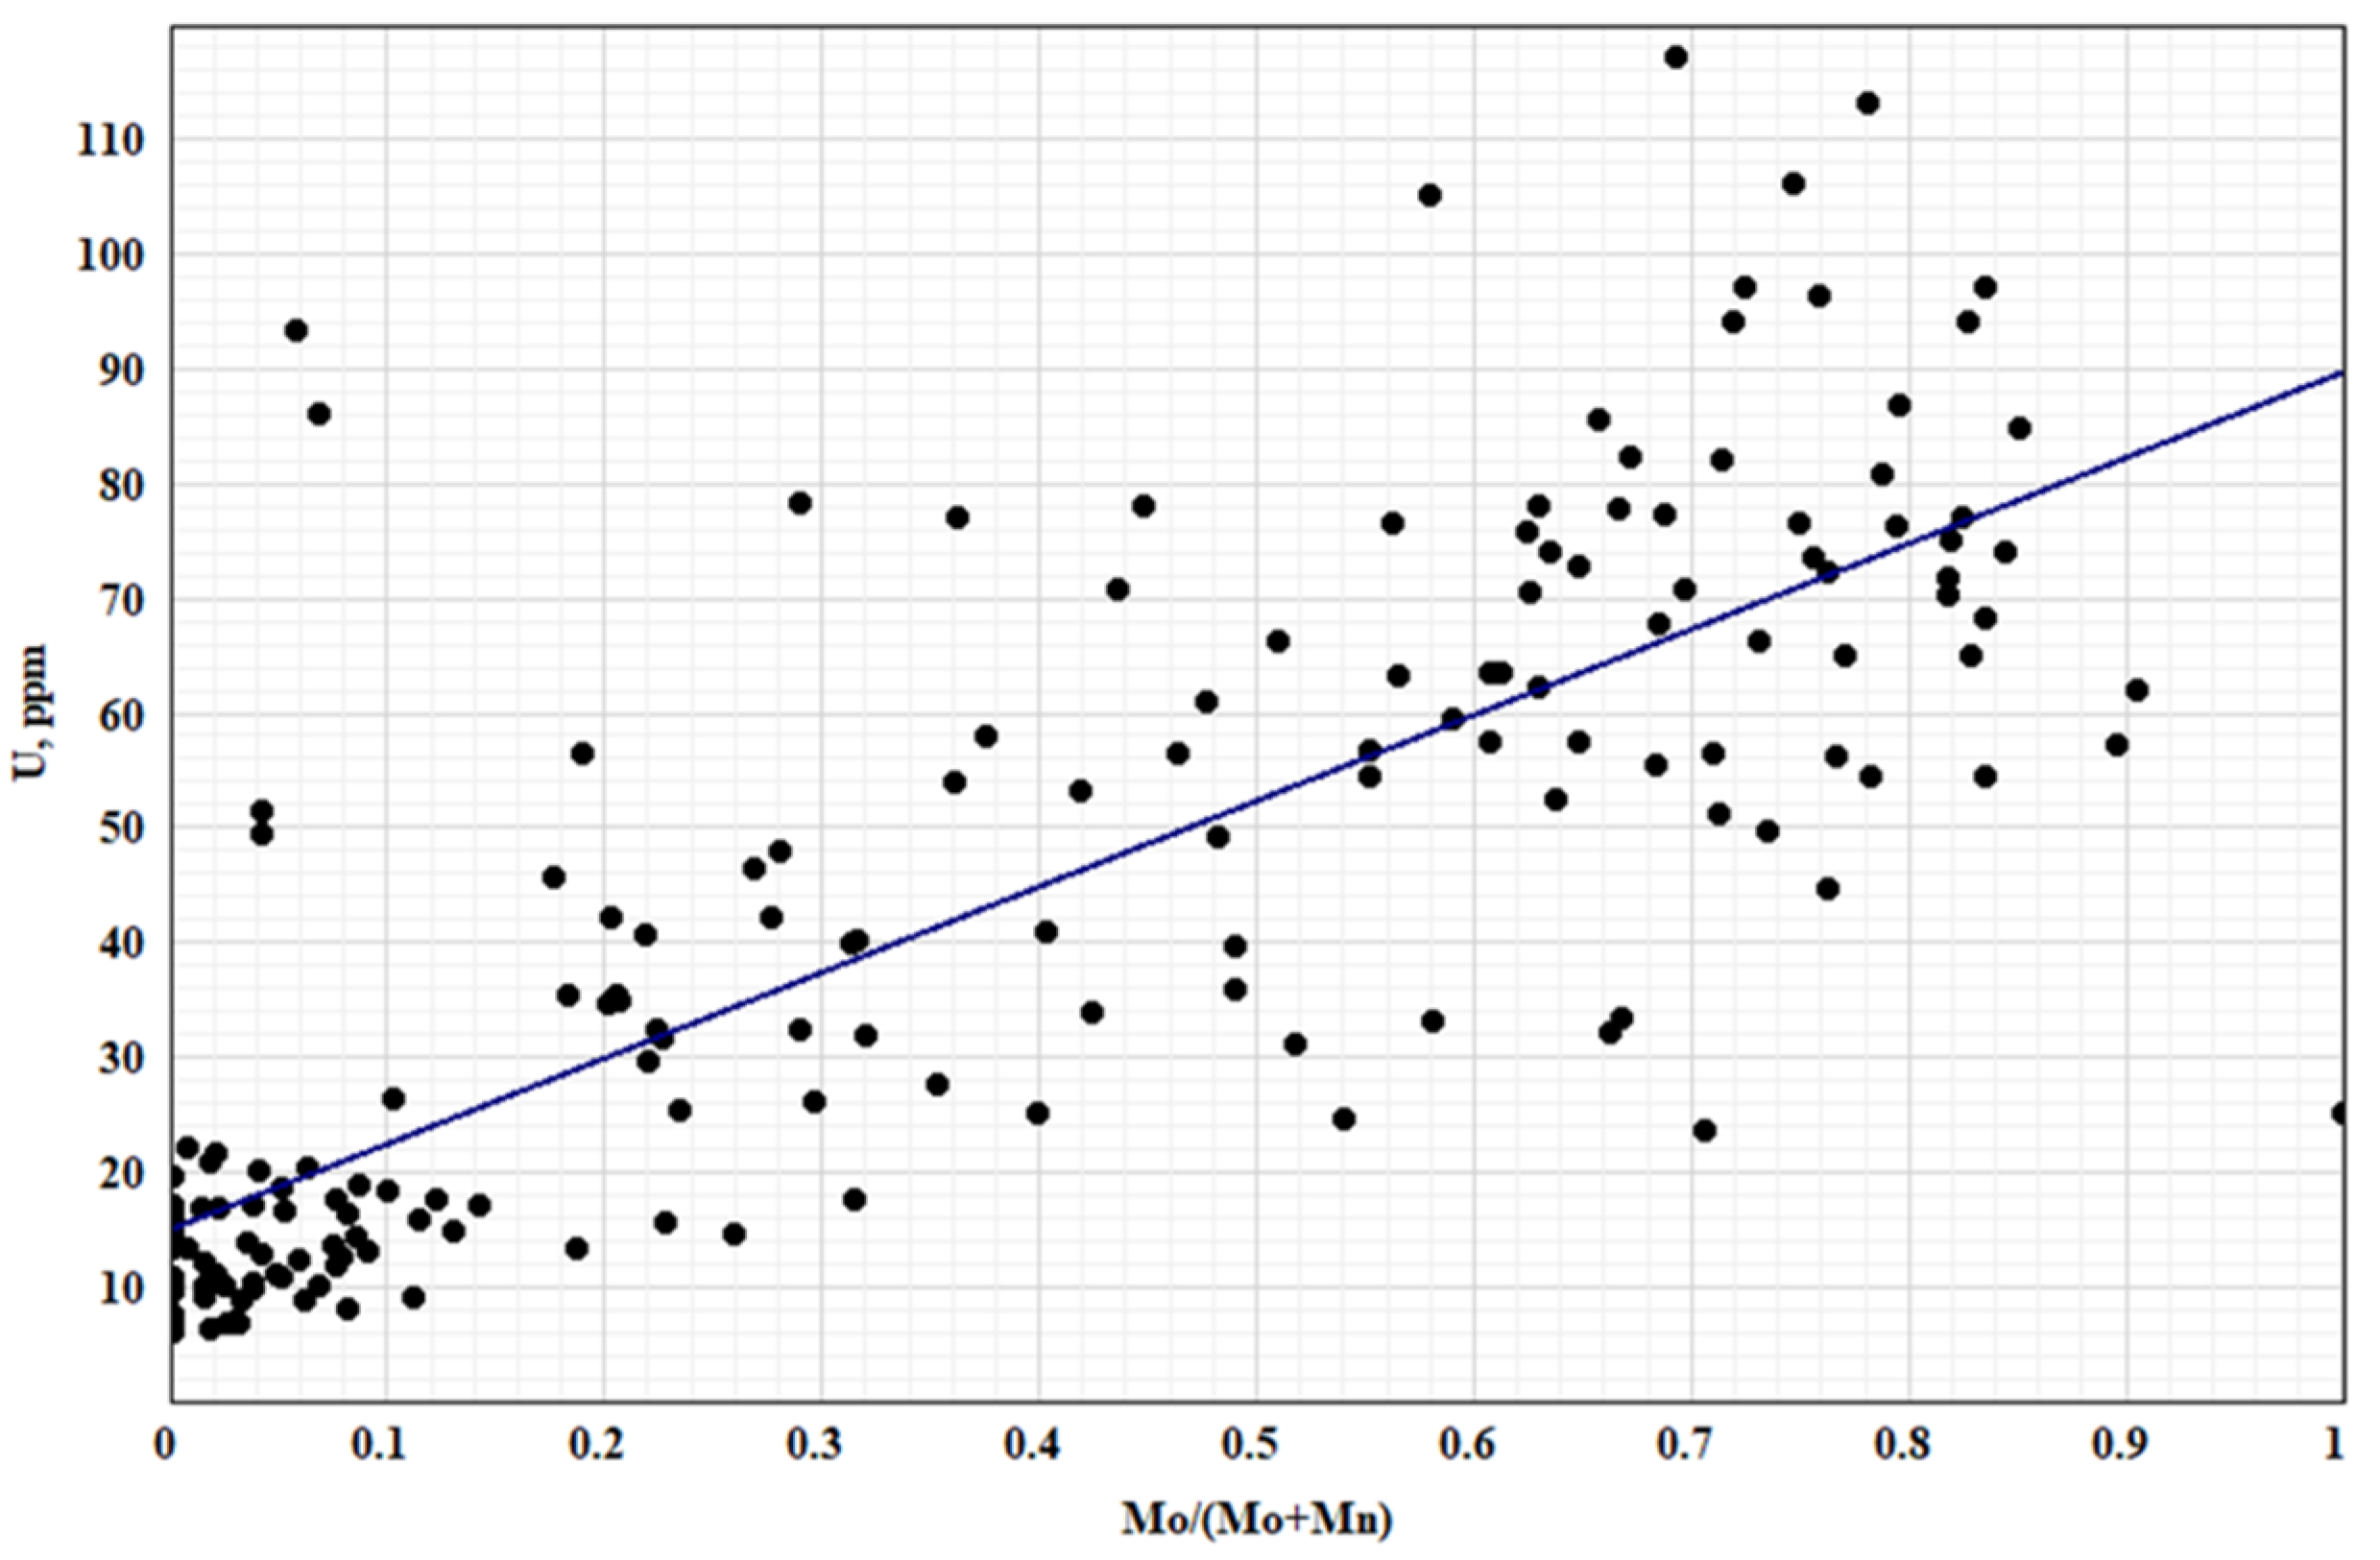
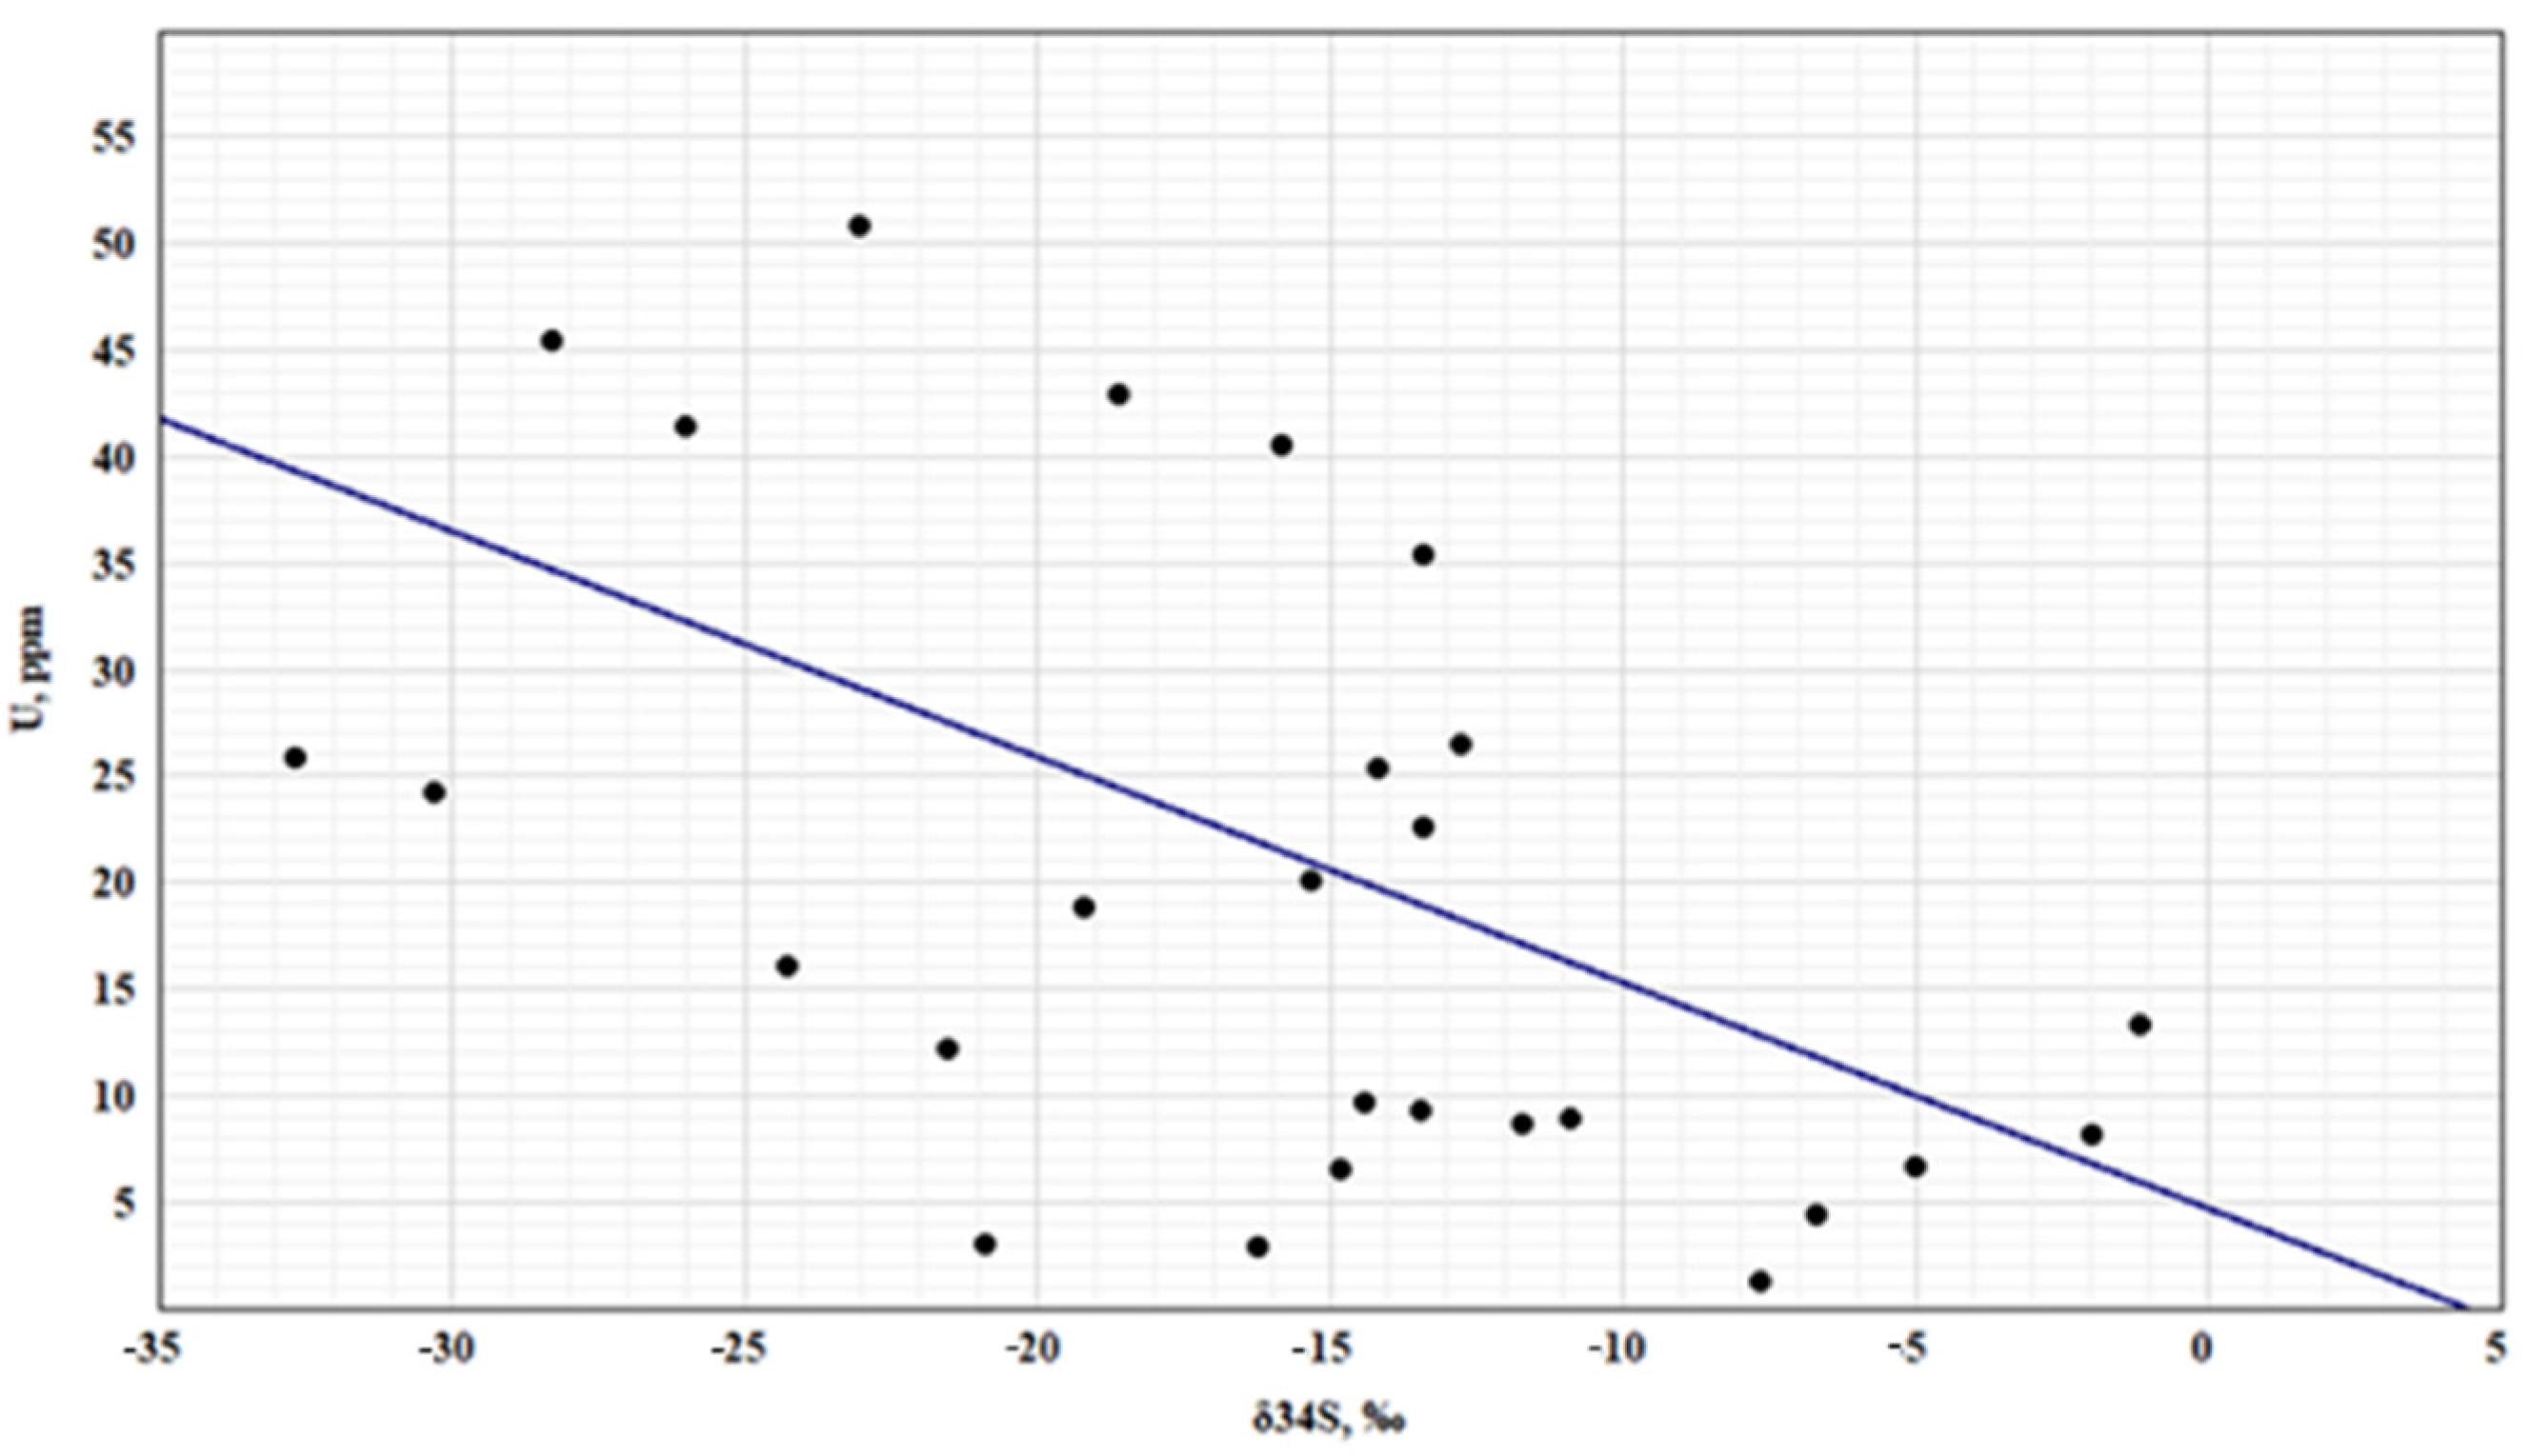
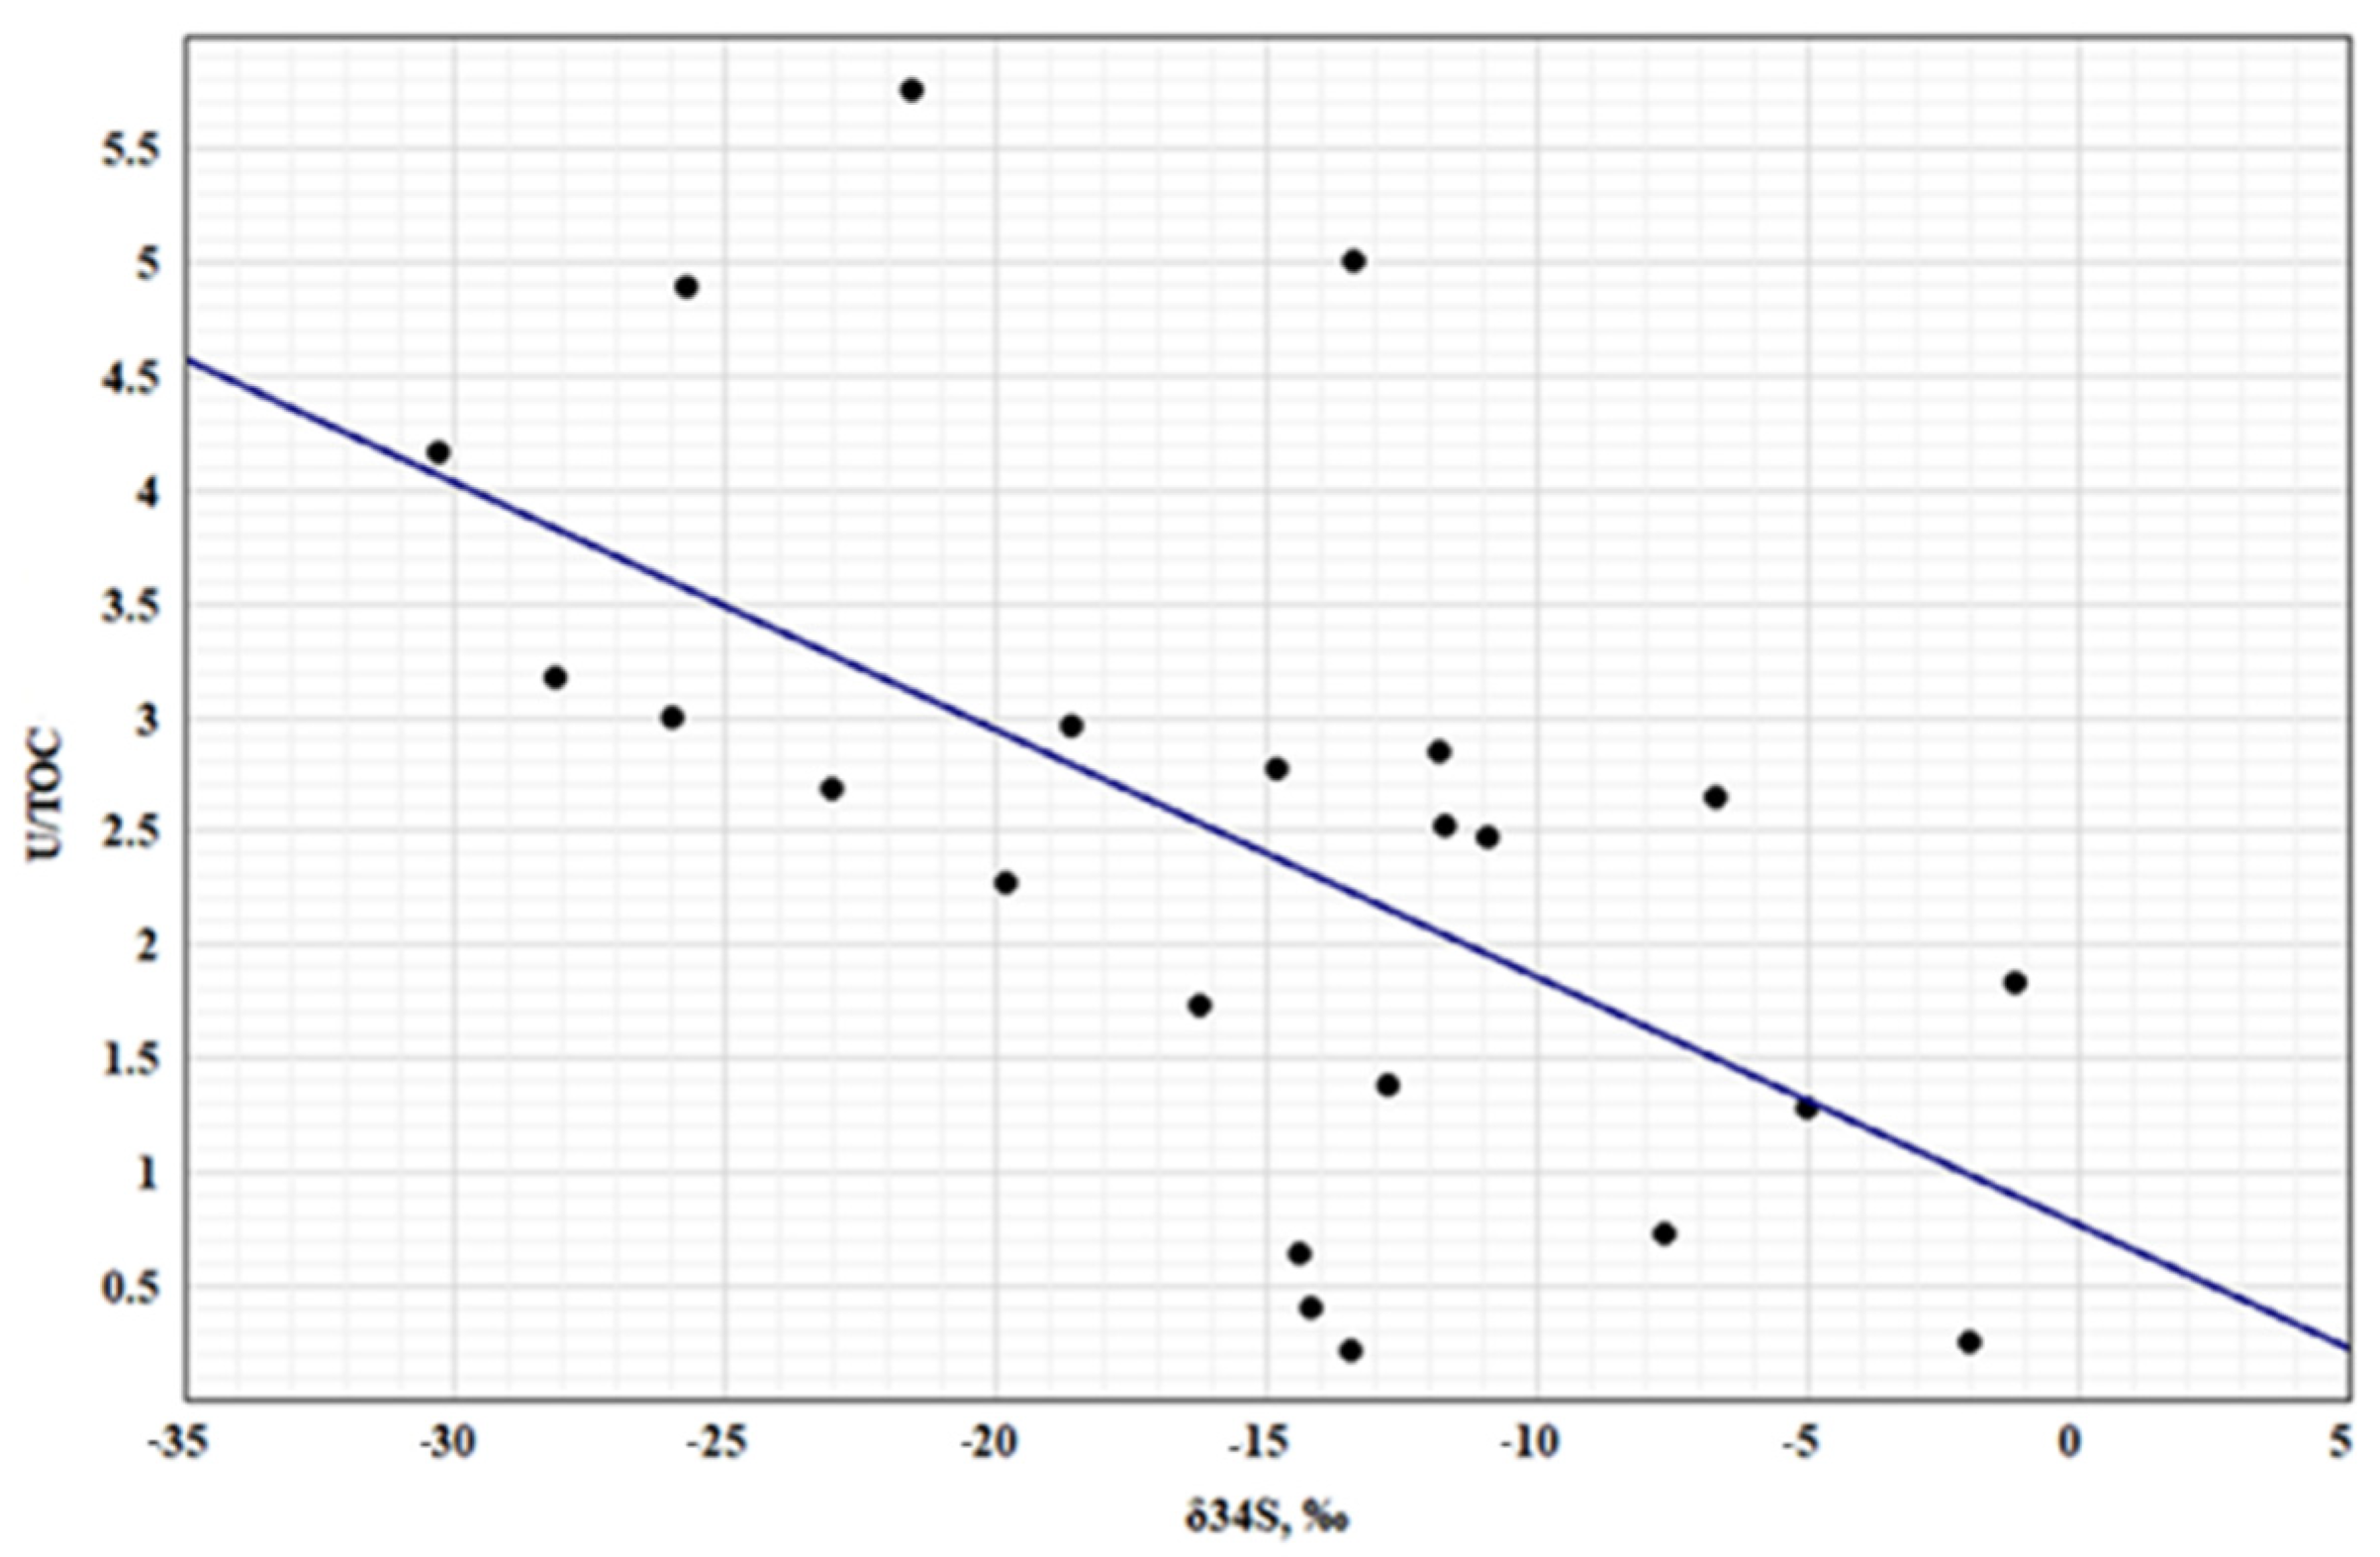
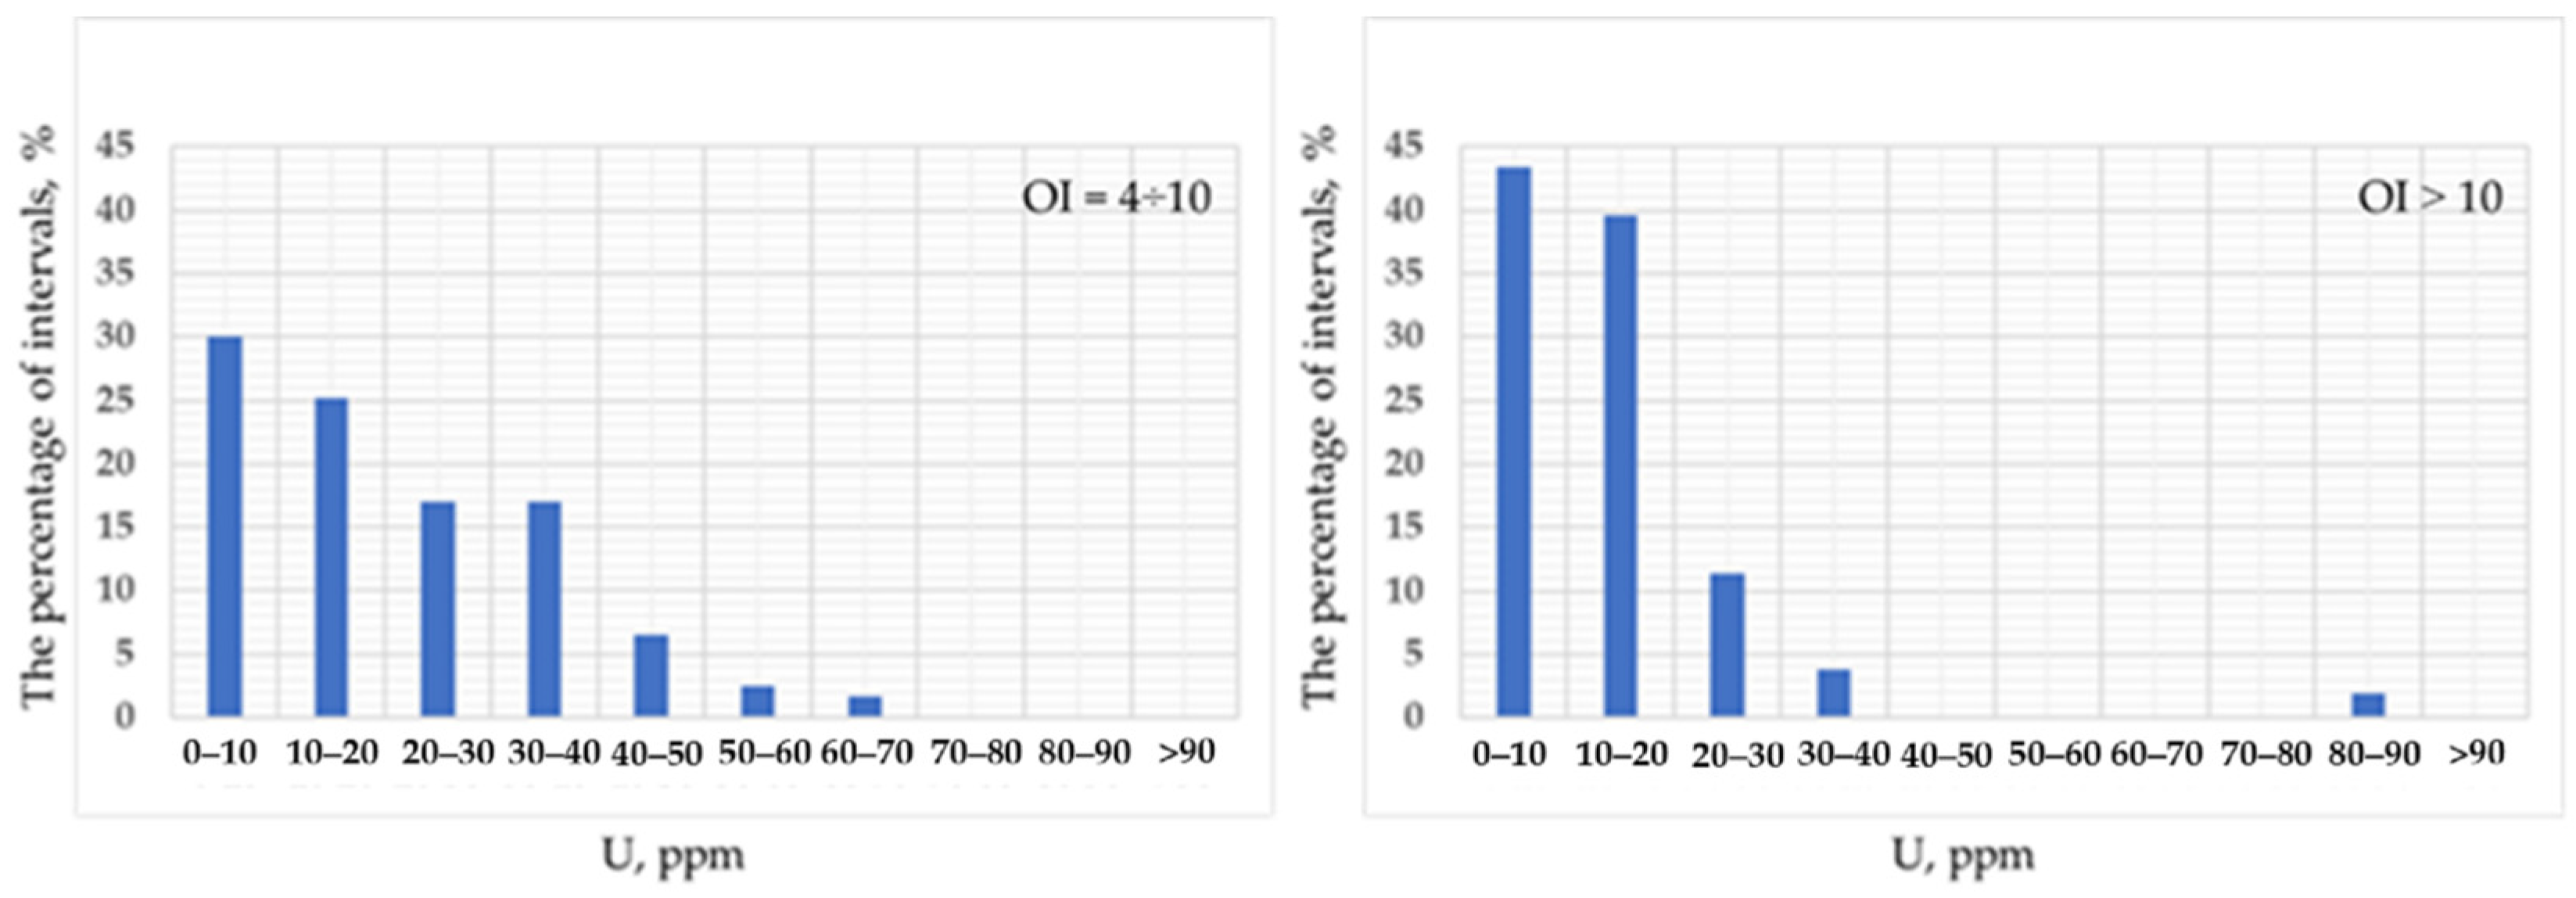
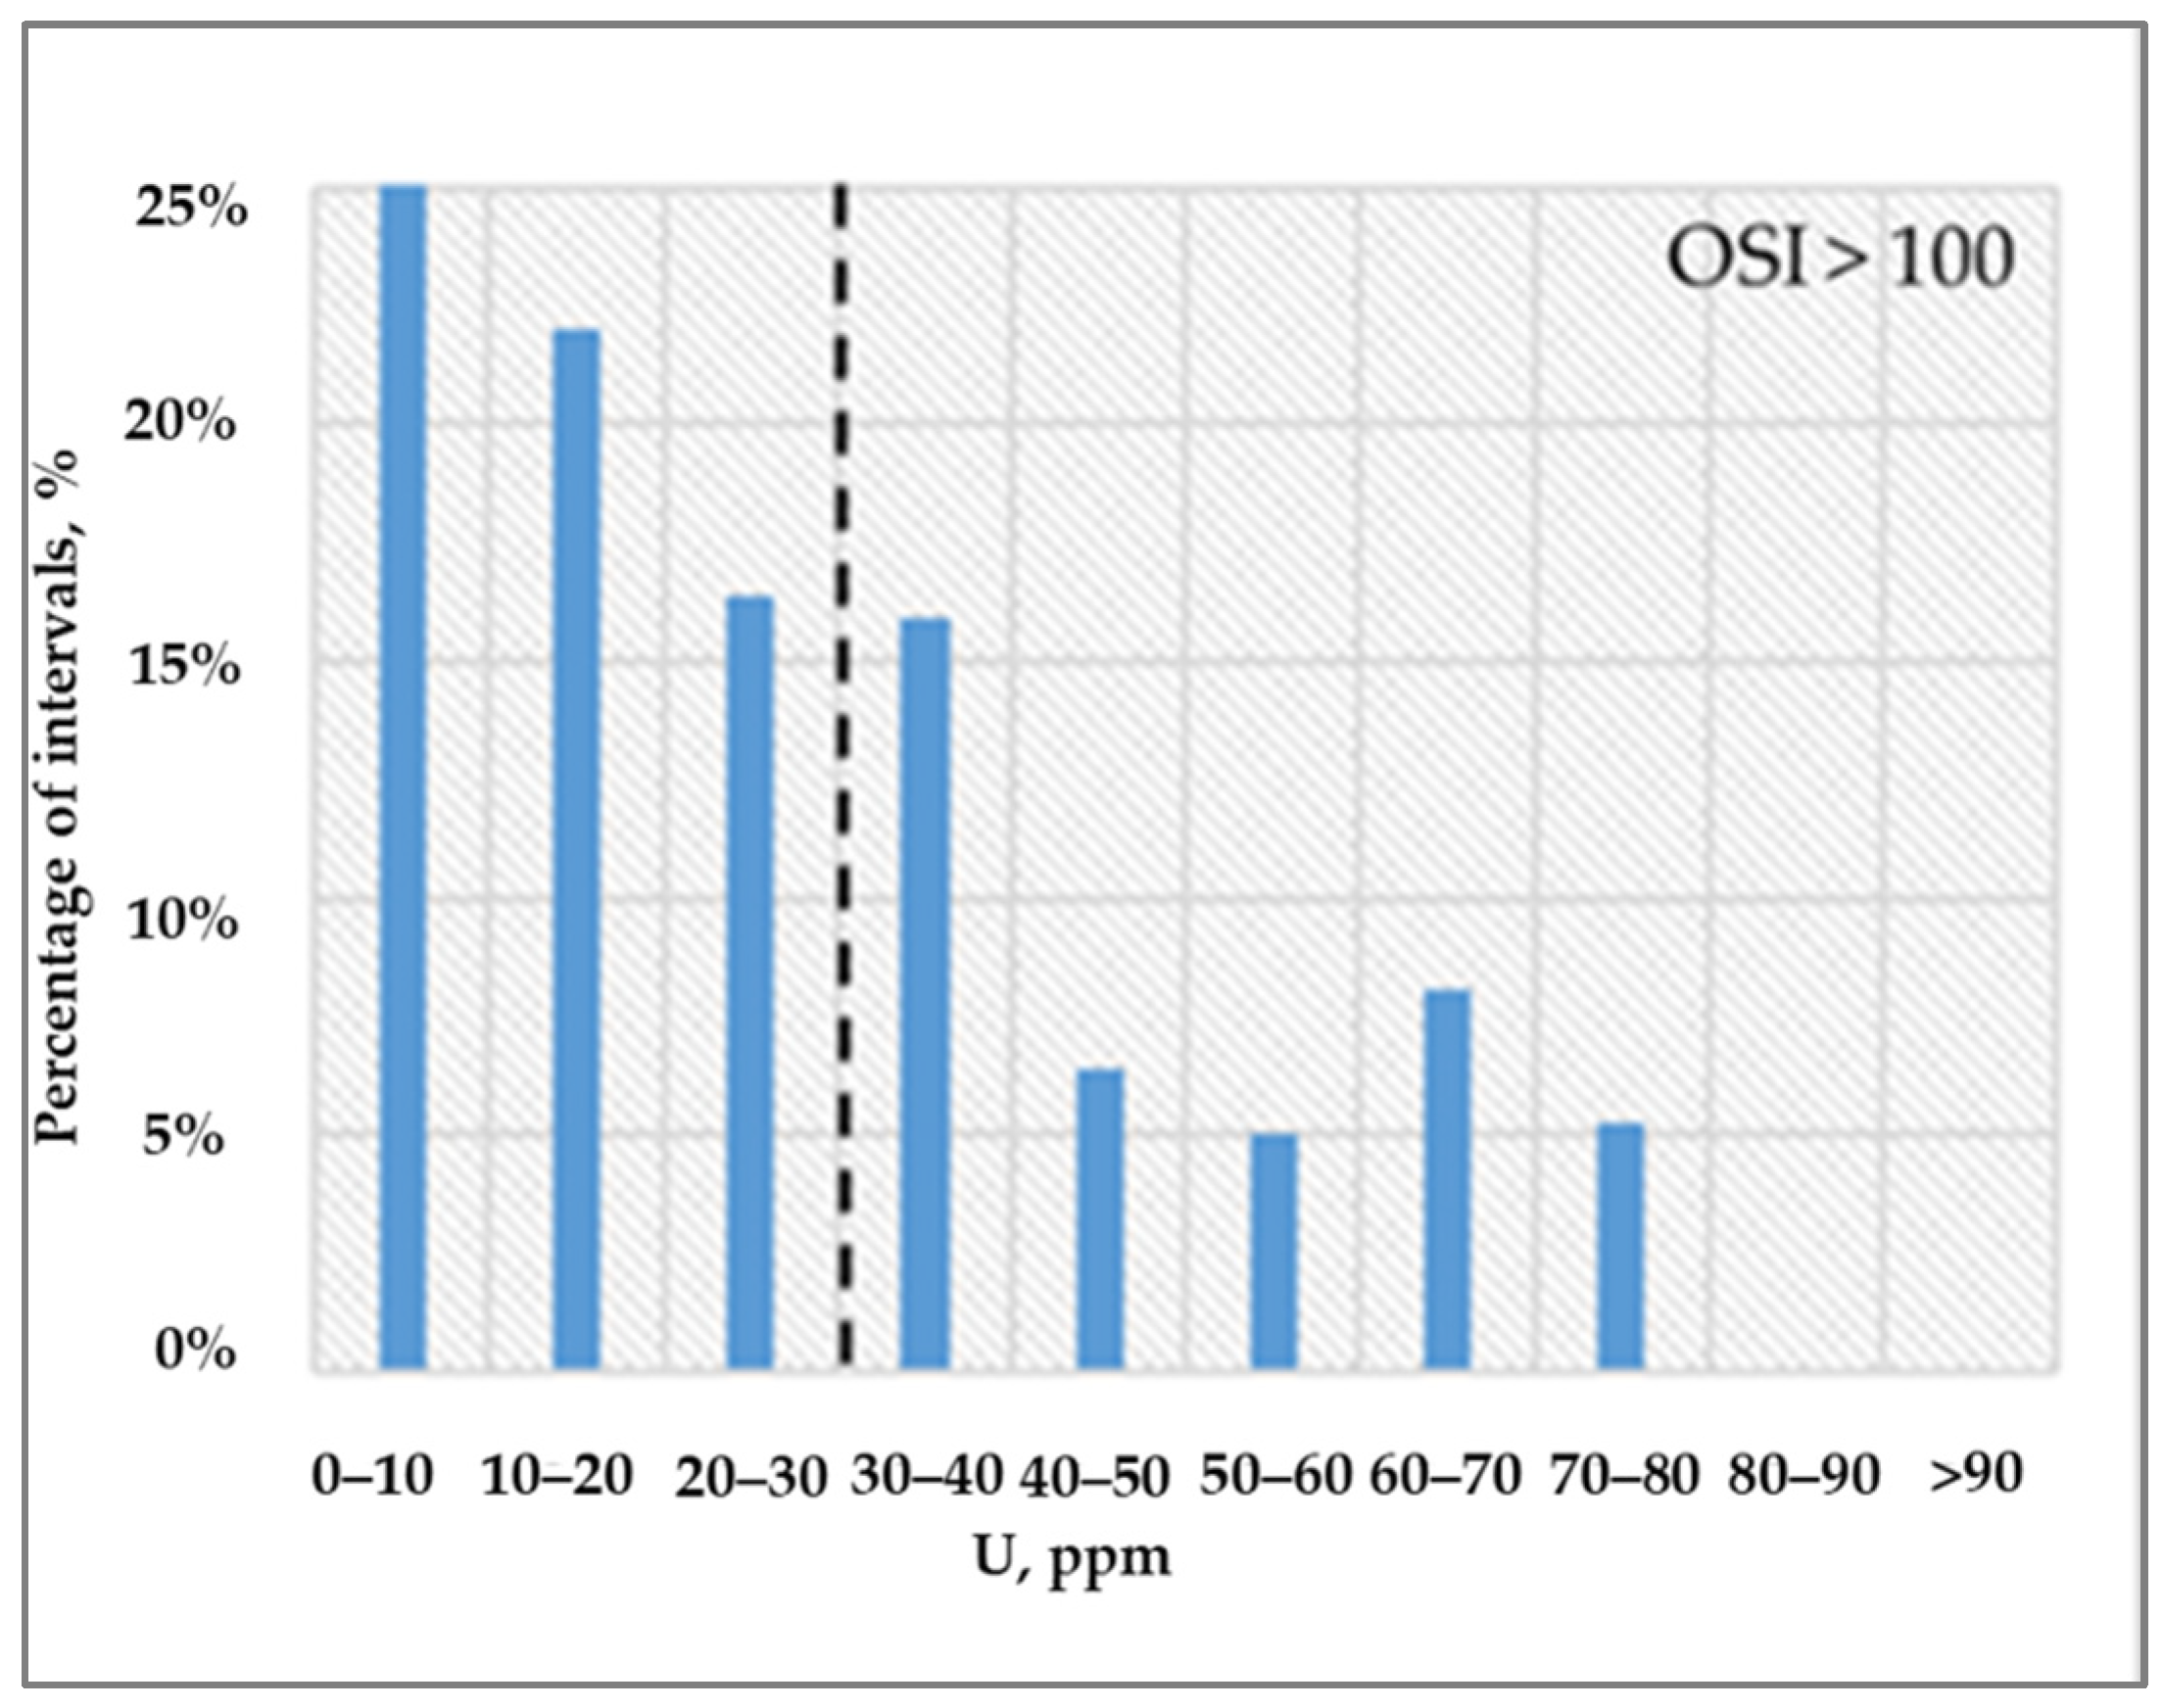
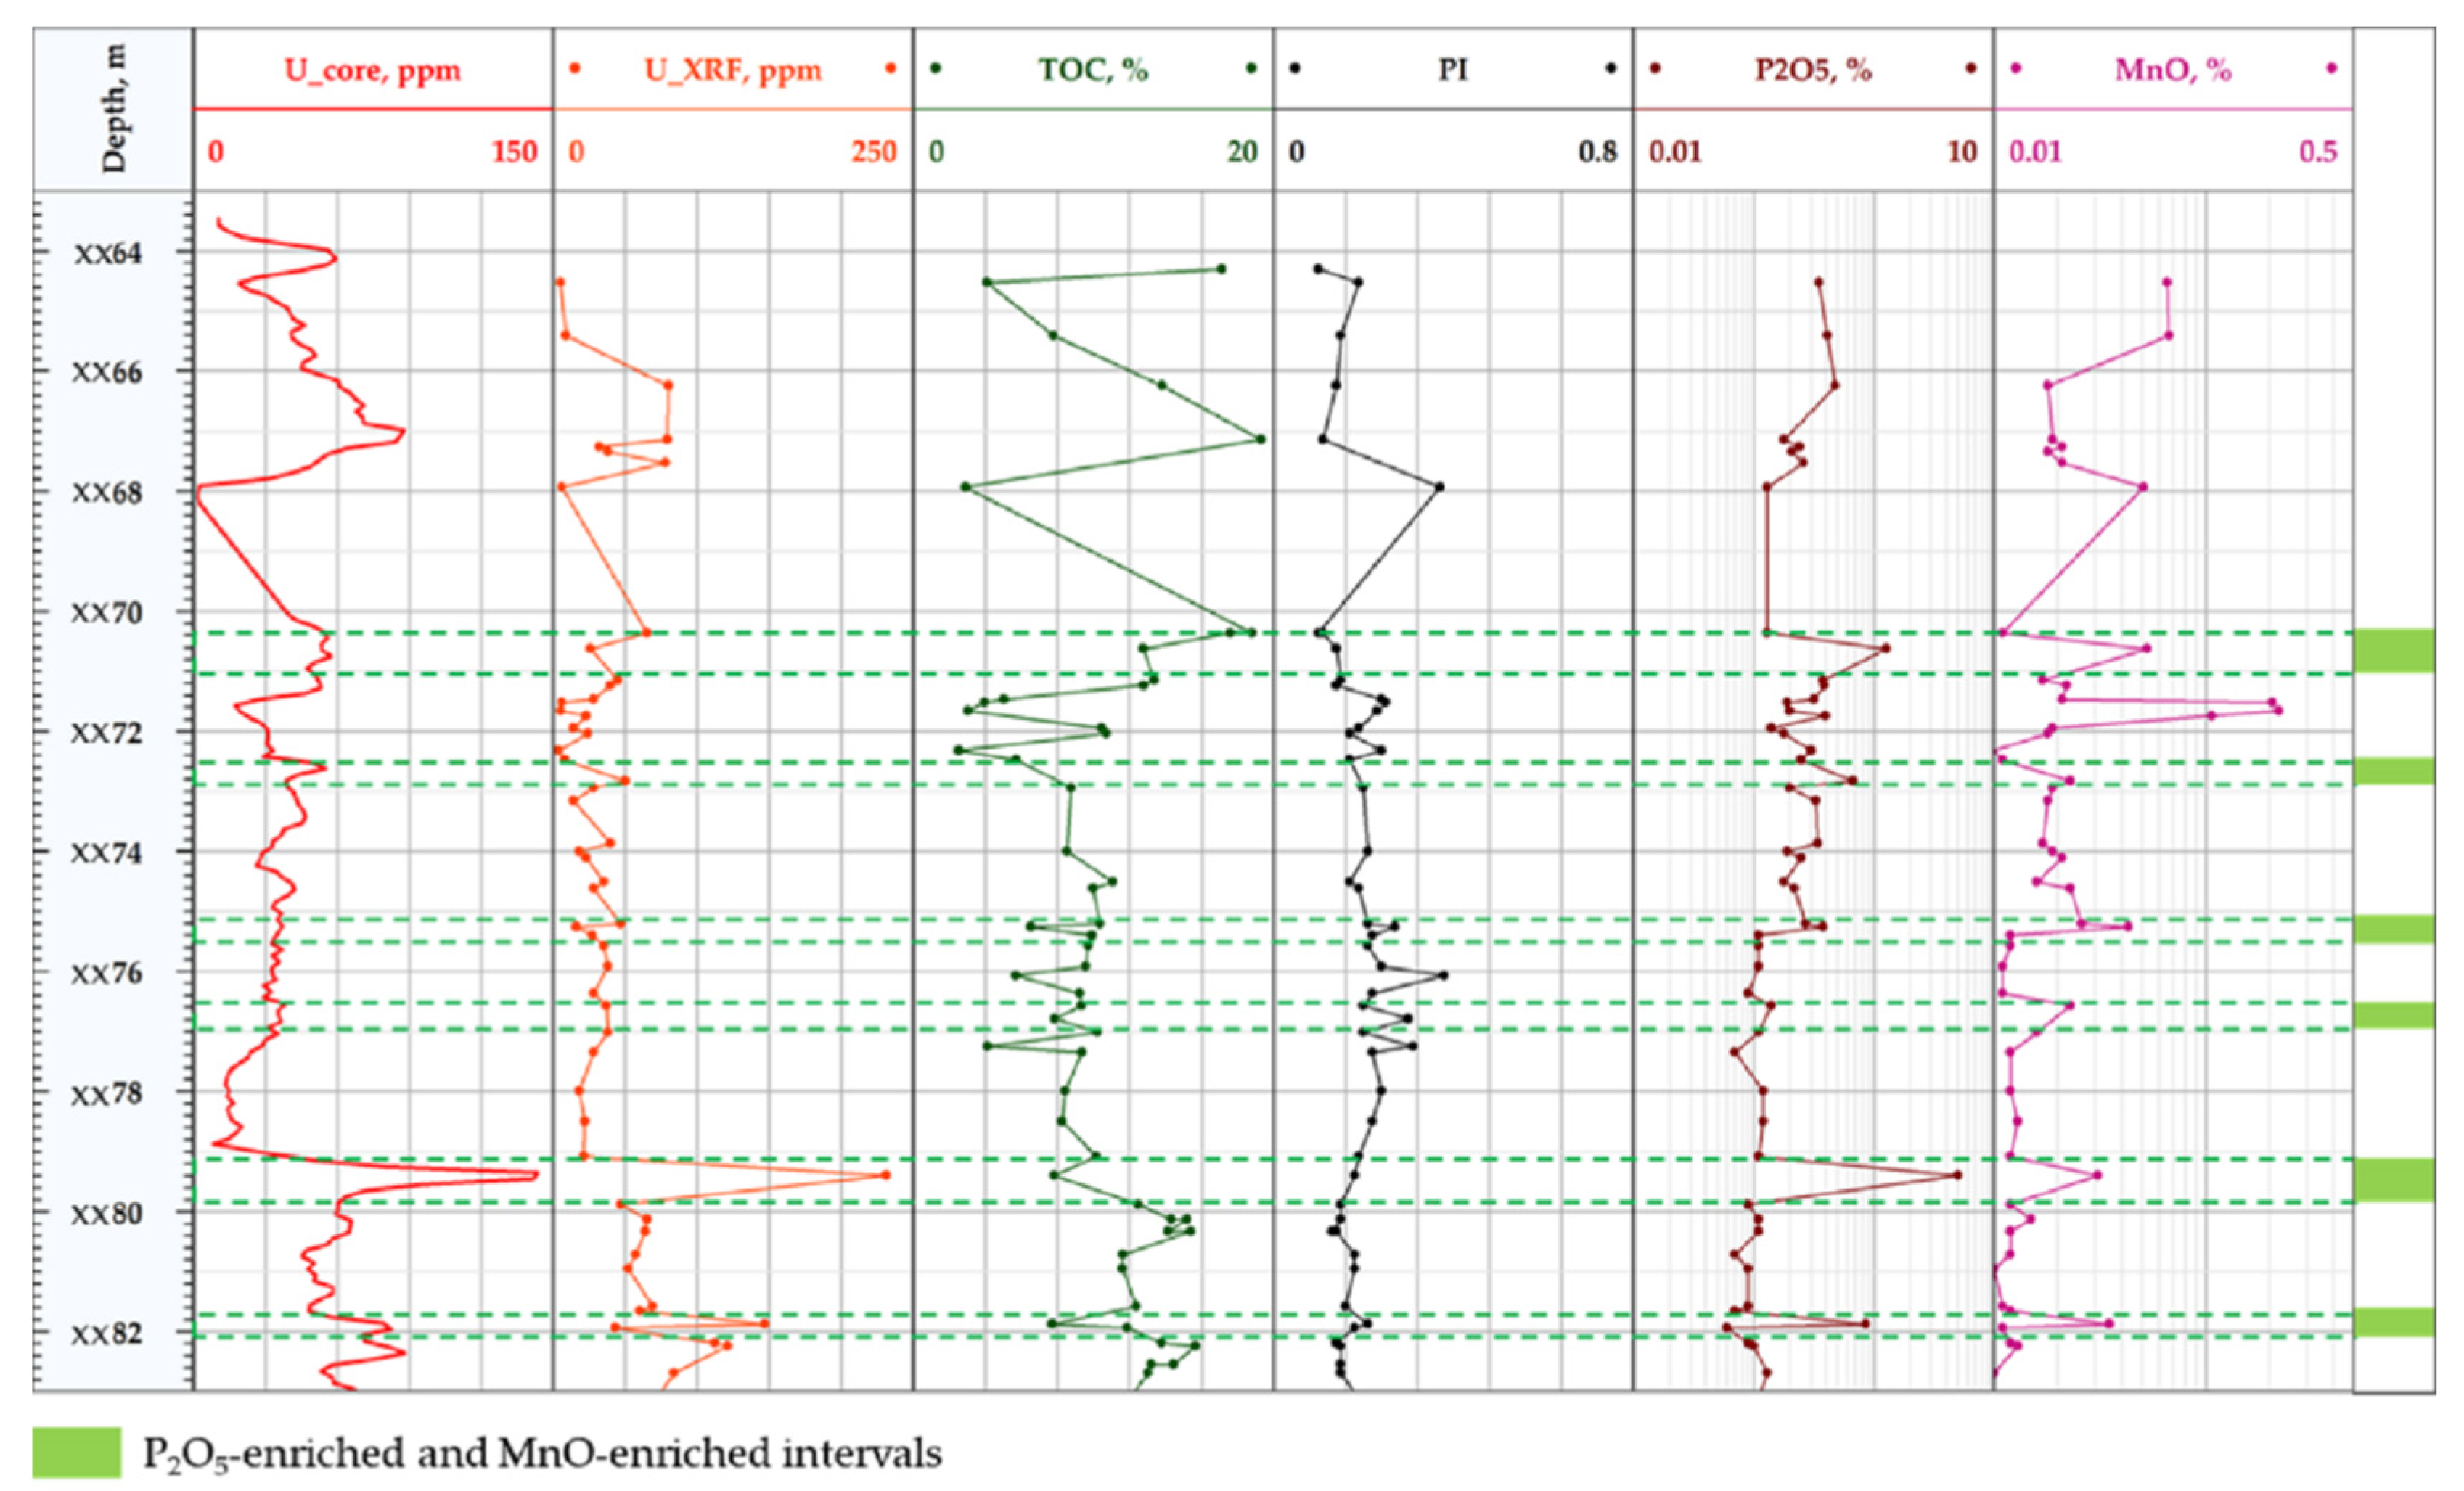
4.1. Role of Redox Conditions in Uranium Accumulation in Source Rocks

In this section, we consider results of lithological, geochemical, and isotope studies obtained for two wells located in the central part of the West Siberia Basin, attributed to the Frolovskaya megadepression (Salym region).
Figure 2 shows the distribution of uranium (U core), vanadium (V), sulfur isotopic composition (δ34S), total organic carbon (TOC), oxygen index (OI), oil saturation index (OSI), and ratios U/TOC, Th/U, Mo/(Mo + Mn), Mo/Al, V/Mo, and V/Cr for well 1. Figure 3 shows the distribution of uranium content (U core), TOC, OI, OSI, and ratios U/TOC, Th/U, Mo/(Mo + Mn), and Mo/Al for well 2.
According to the obtained results, uranium content variations strongly correlate with parameters indicating redox conditions at the sedimentation stage, such as oxygen index, vanadium, molybdenum, Mo/Al, Mo/(Mo + Mn), V/Mo, and V/Cr ratios. In particular, Figure 4 shows the correlation of uranium content with vanadium content for well 1. We also observe (Figure 5) a correlation uranium concentration with the Mo/(Mn + Mo) ratio (well 2), one of the most sensitive indicators of redox conditions for the BF rocks [36,37,38,39].
The correlations shown in Figure 2 and Figure 3 indicate a change in redox environments, from slightly oxidizing conditions in the lower part of the BF to reducing in the middle and upper parts of the BF. For example (Figure 3), the lower part of the BF is characterized by low uranium content and low Mo/(Mn + Mo) ratio, while the upper part is characterized by increased uranium content and high Mo/(Mn + Mo) ratio.
Figure 2 represents the distribution of the sulfur isotopic composition δ34S. Comparison of the uranium content, the U/TOC ratio, and the sulfur isotopic composition (Figure 6 and Figure 7) demonstrates that rocks with high content of uranium and organic matter are characterized by high sulfide sulfur content and low content of the heavy sulfur isotope (δ34S varies from −40 to −30‰CDT). According to the data of [40] and the results of other studies [41], high pyrite content with low sulfur isotopic composition values indicates reducing conditions and the presence of hydrogen sulfide at the sedimentation stage.
In Figure 8, we report a U-TOC diagram for the samples from 11 wells. The colors of dots represent oxygen index values (OI), which characterizes the oxygen content in the Bazhenov Formation organic matter. Increased values of OI correspond to more oxidizing conditions, while low values of OI correspond to reductive conditions of marine sedimentation [42]. In Figure 8, points are falling into low organic matter (TOC < 5 wt. %), and low uranium values (uranium concentration < 20 ppm) intervals are characterized by increased oxygen index values. In contrast, lower oxygen index values are typical for intervals with high uranium and organic matter contents.
Figure 9 shows diagrams of the uranium concentration distribution at fixed oxygen index values: OI = 4–10 (left), OI > 10 (right). The higher the oxygen indexes, the lower the percentage of intervals with a uranium content > 20 ppm, and vice versa.
Thus, we conclude that low uranium concentration and TOC values characterize the intervals formed in relatively more intensive oxidizing conditions. The intervals formed in reducing conditions show significantly higher uranium concentration and TOC values. The observed pattern of the uranium behavior in BF rocks is similar to that observed for the modern marine sediments [43].

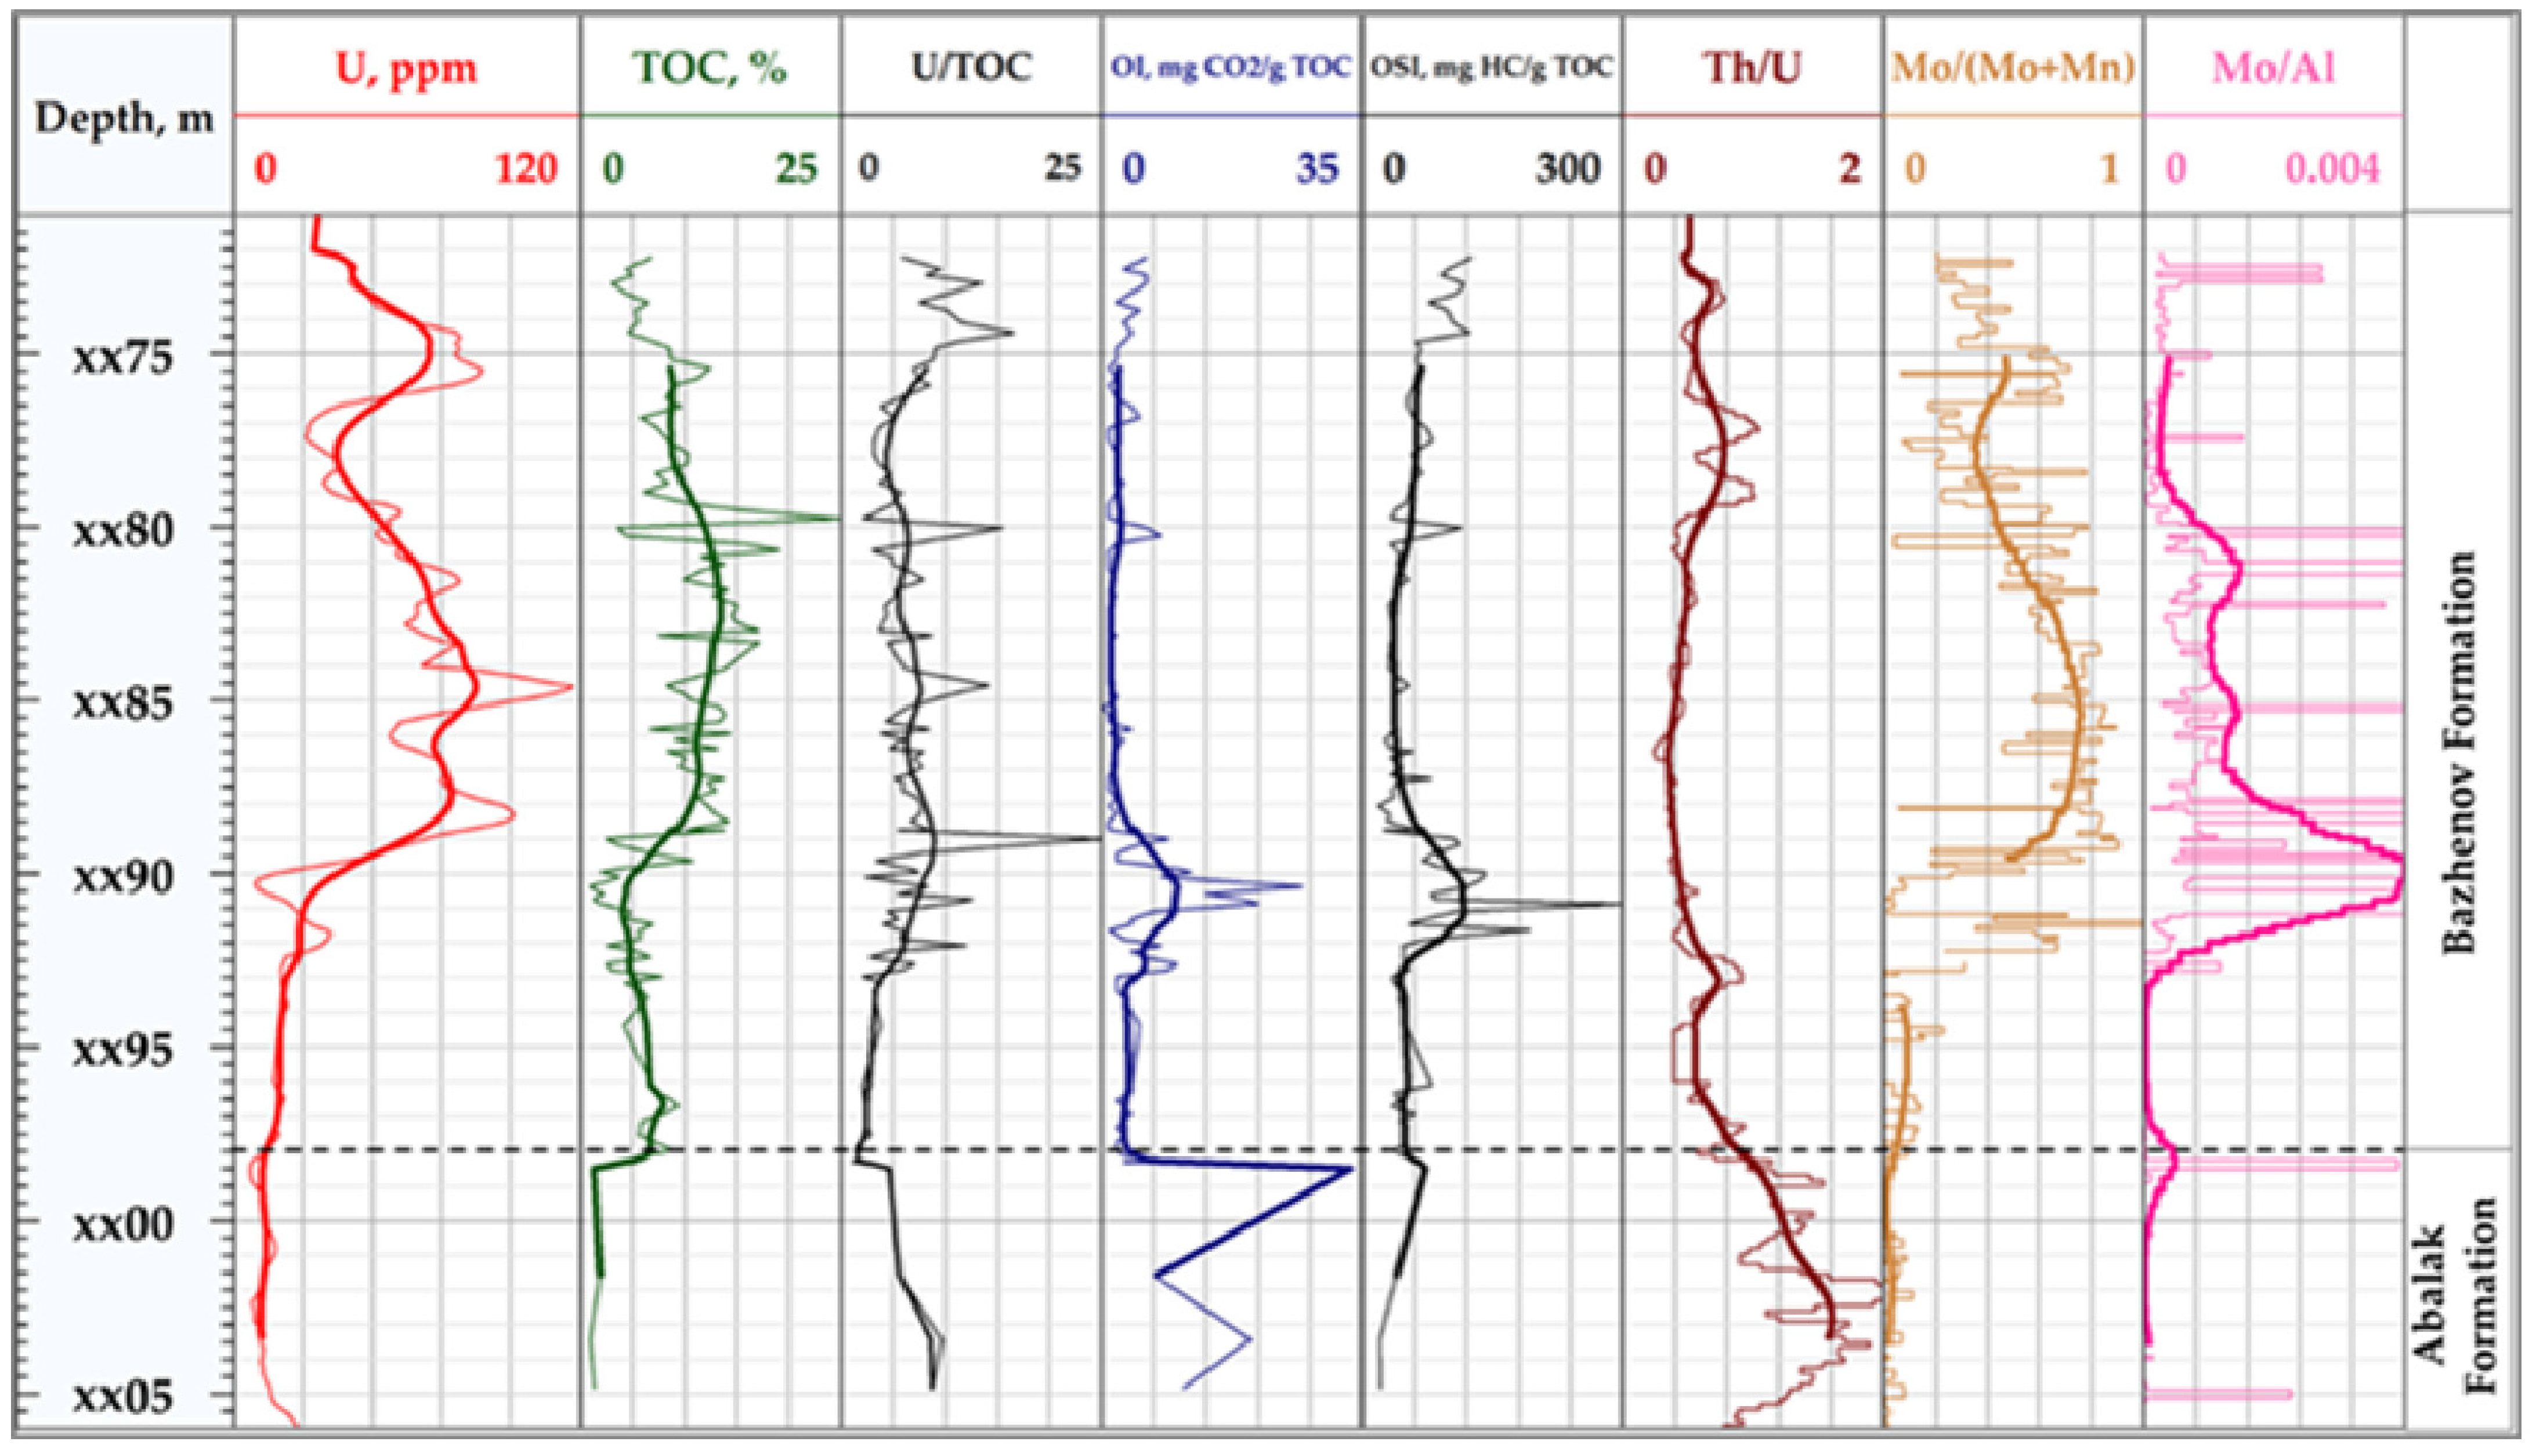
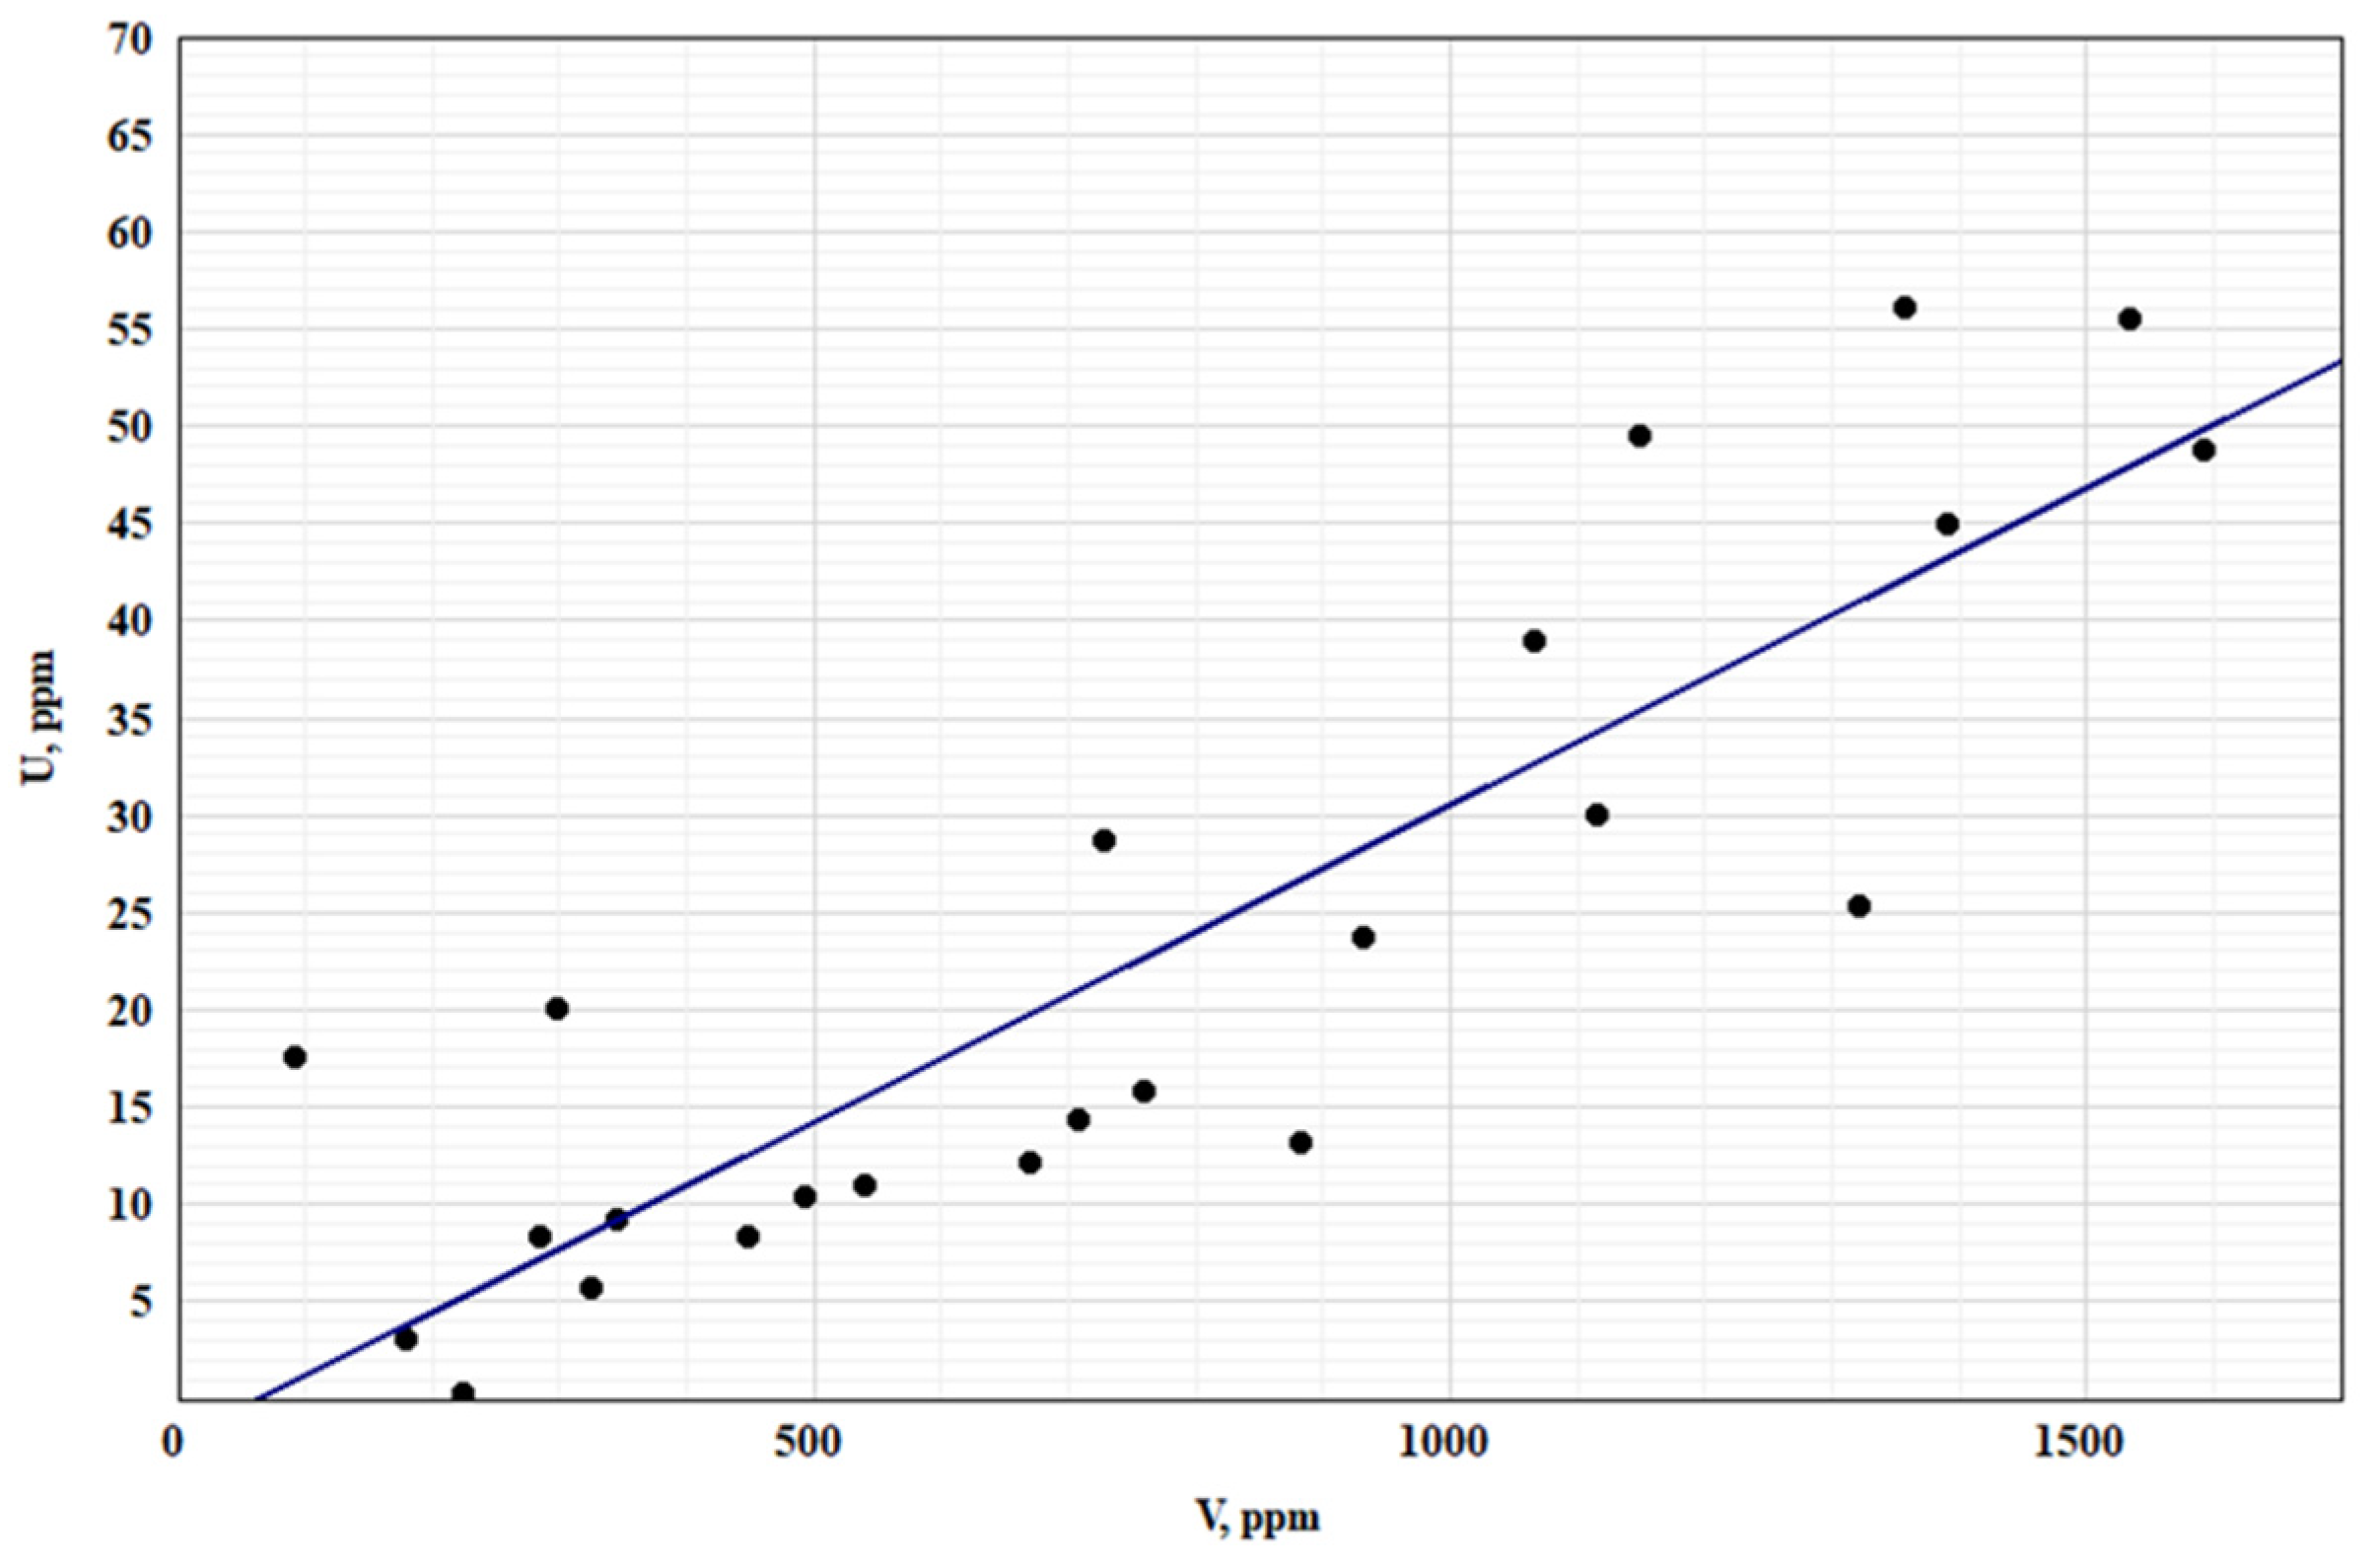
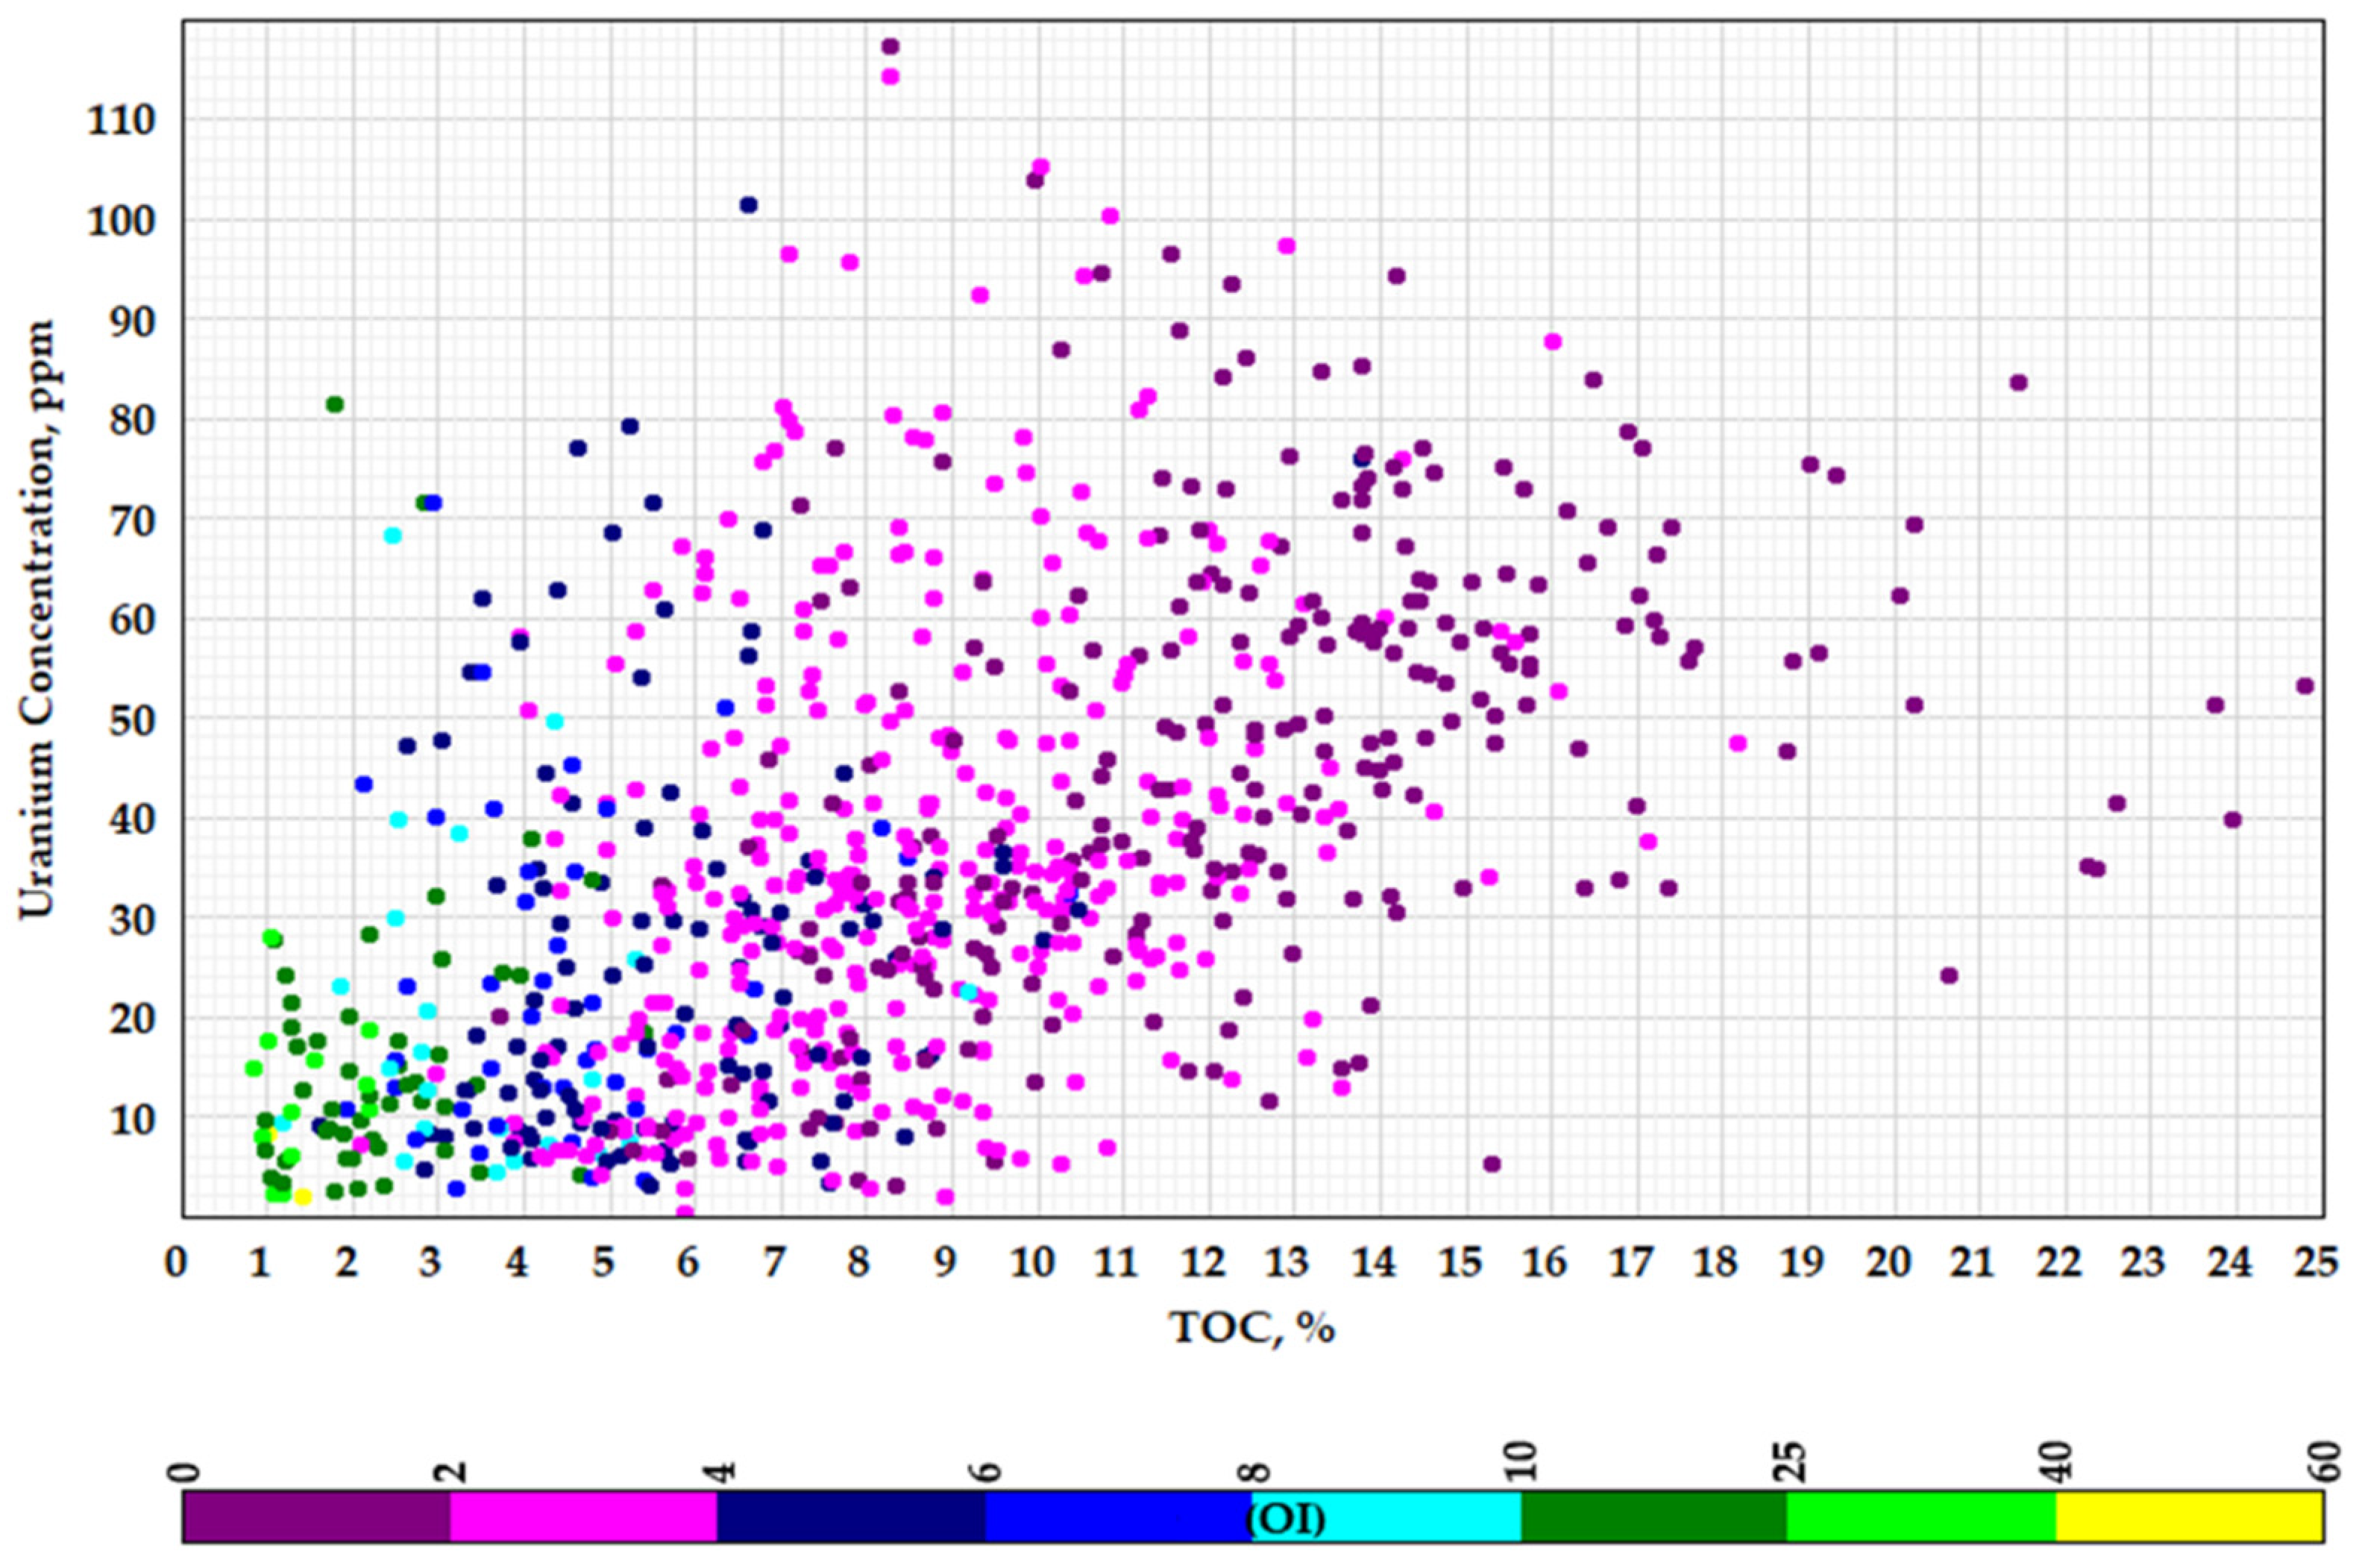
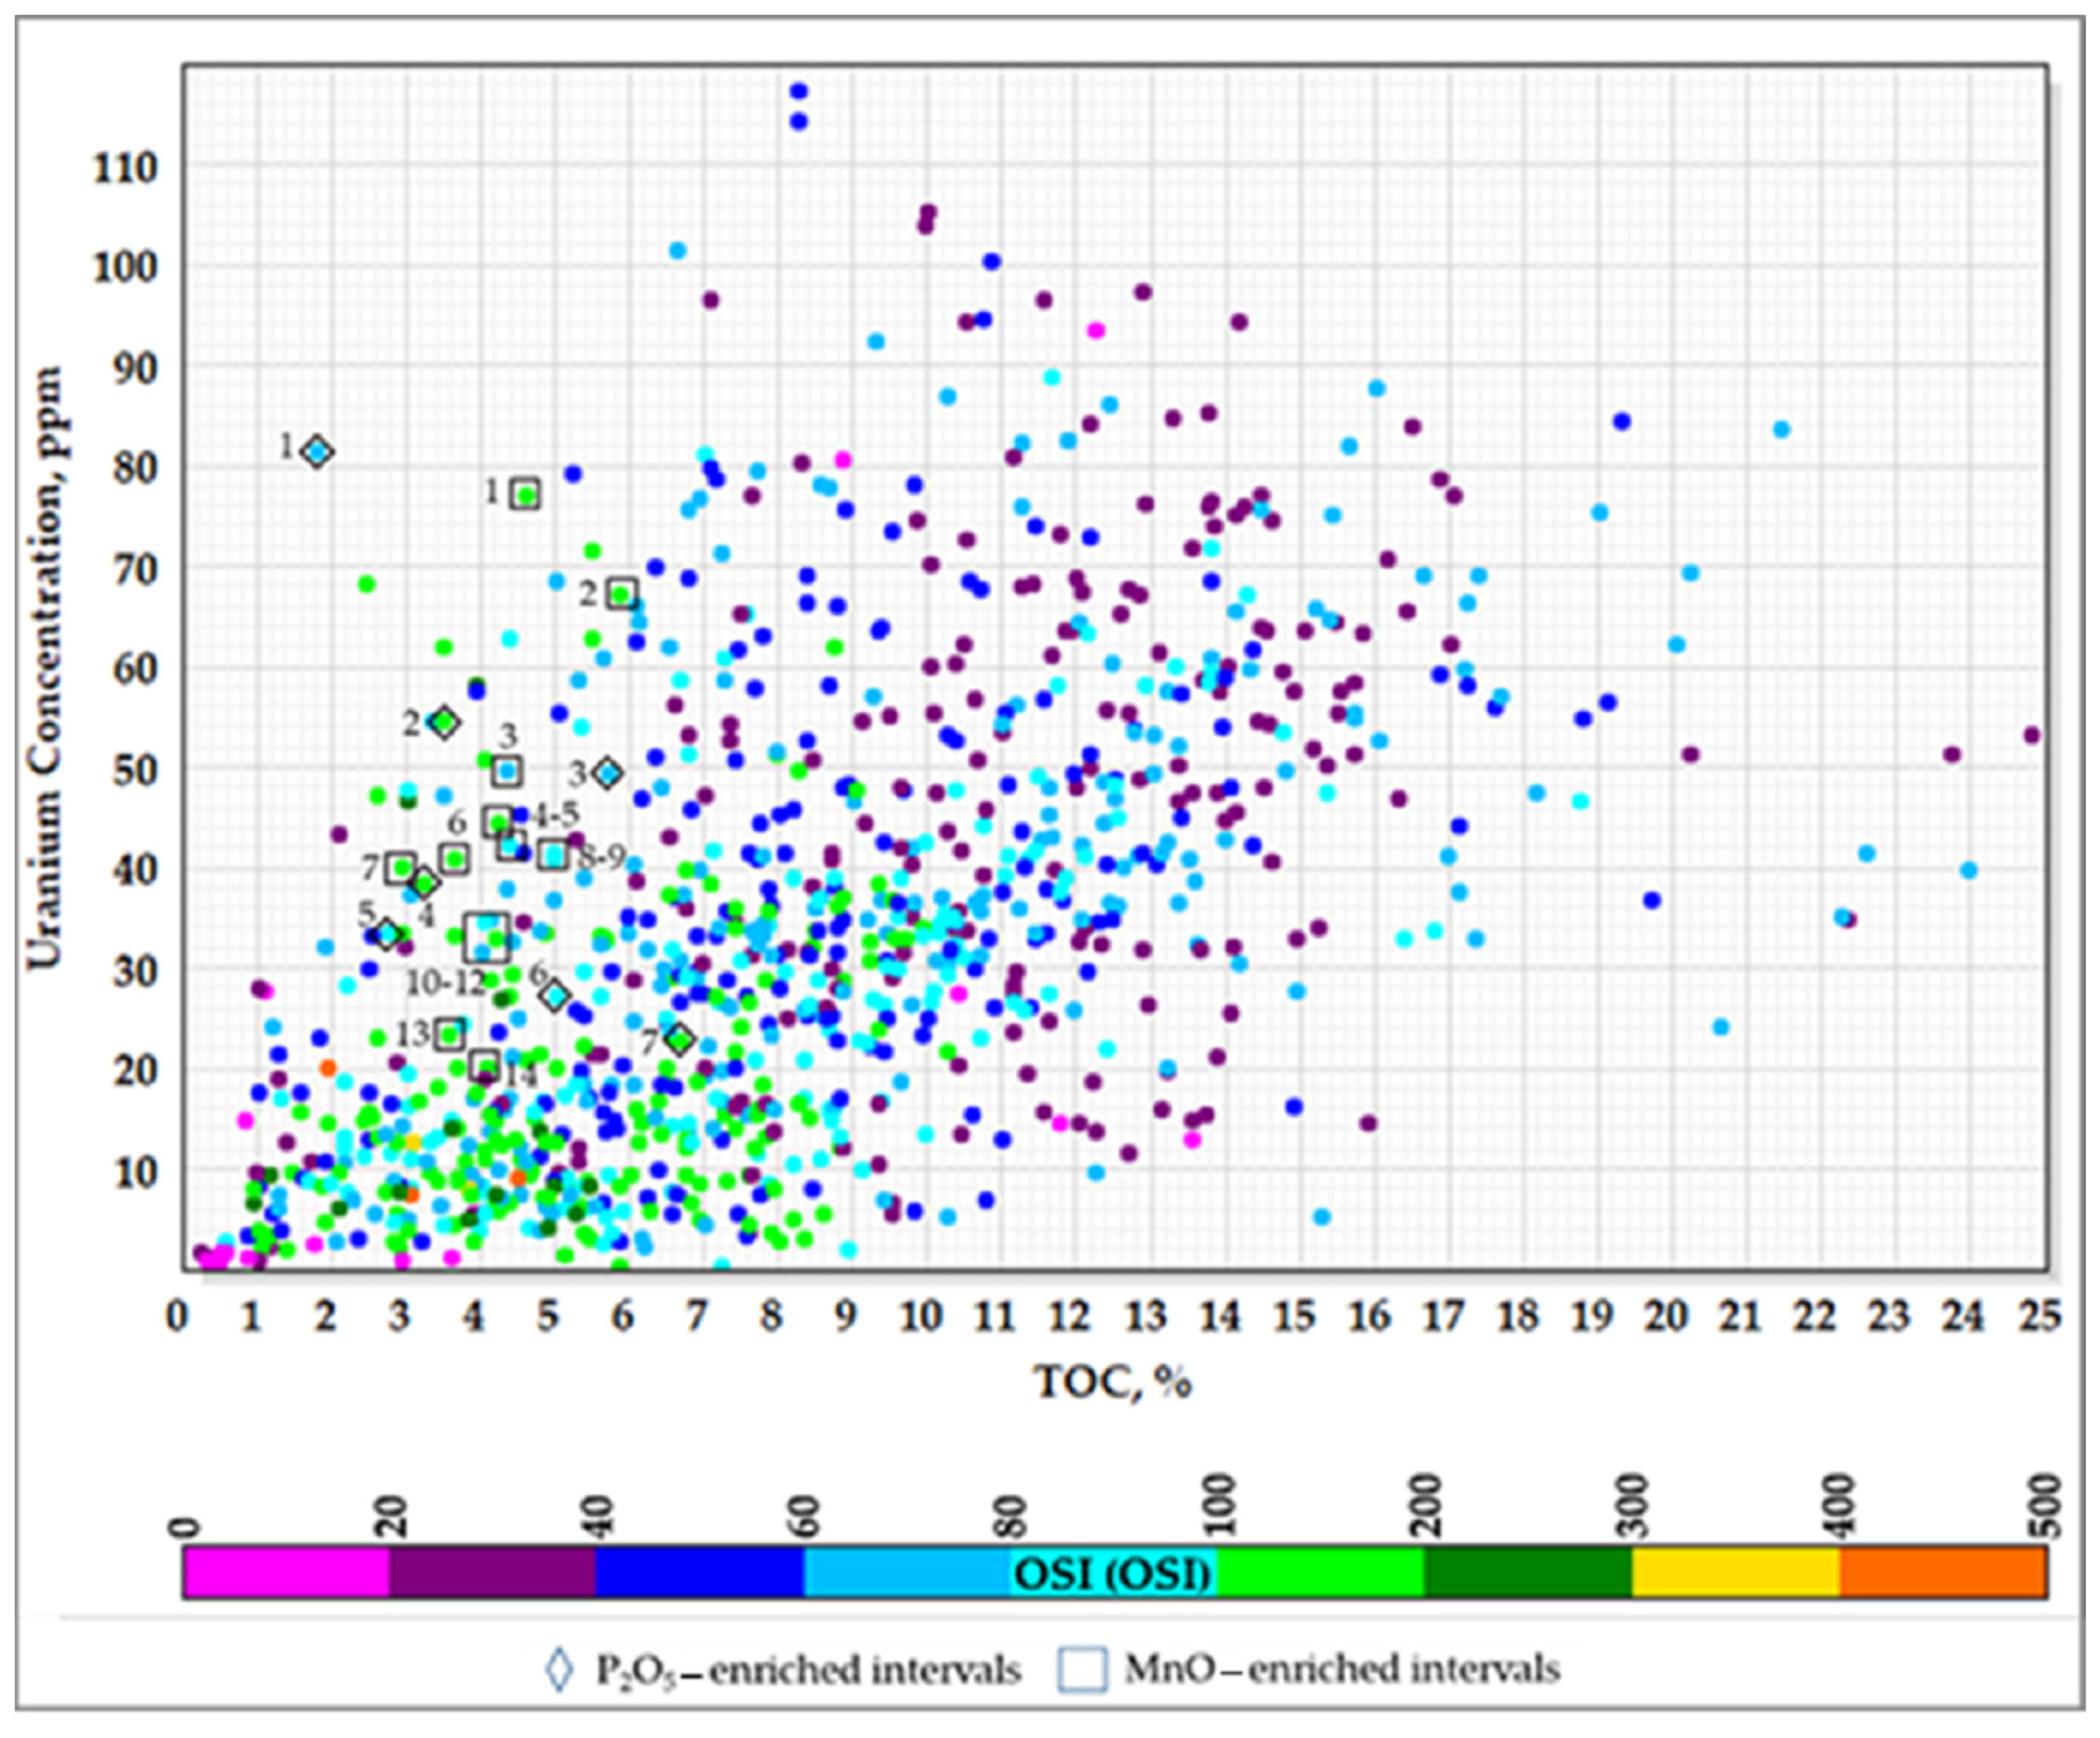
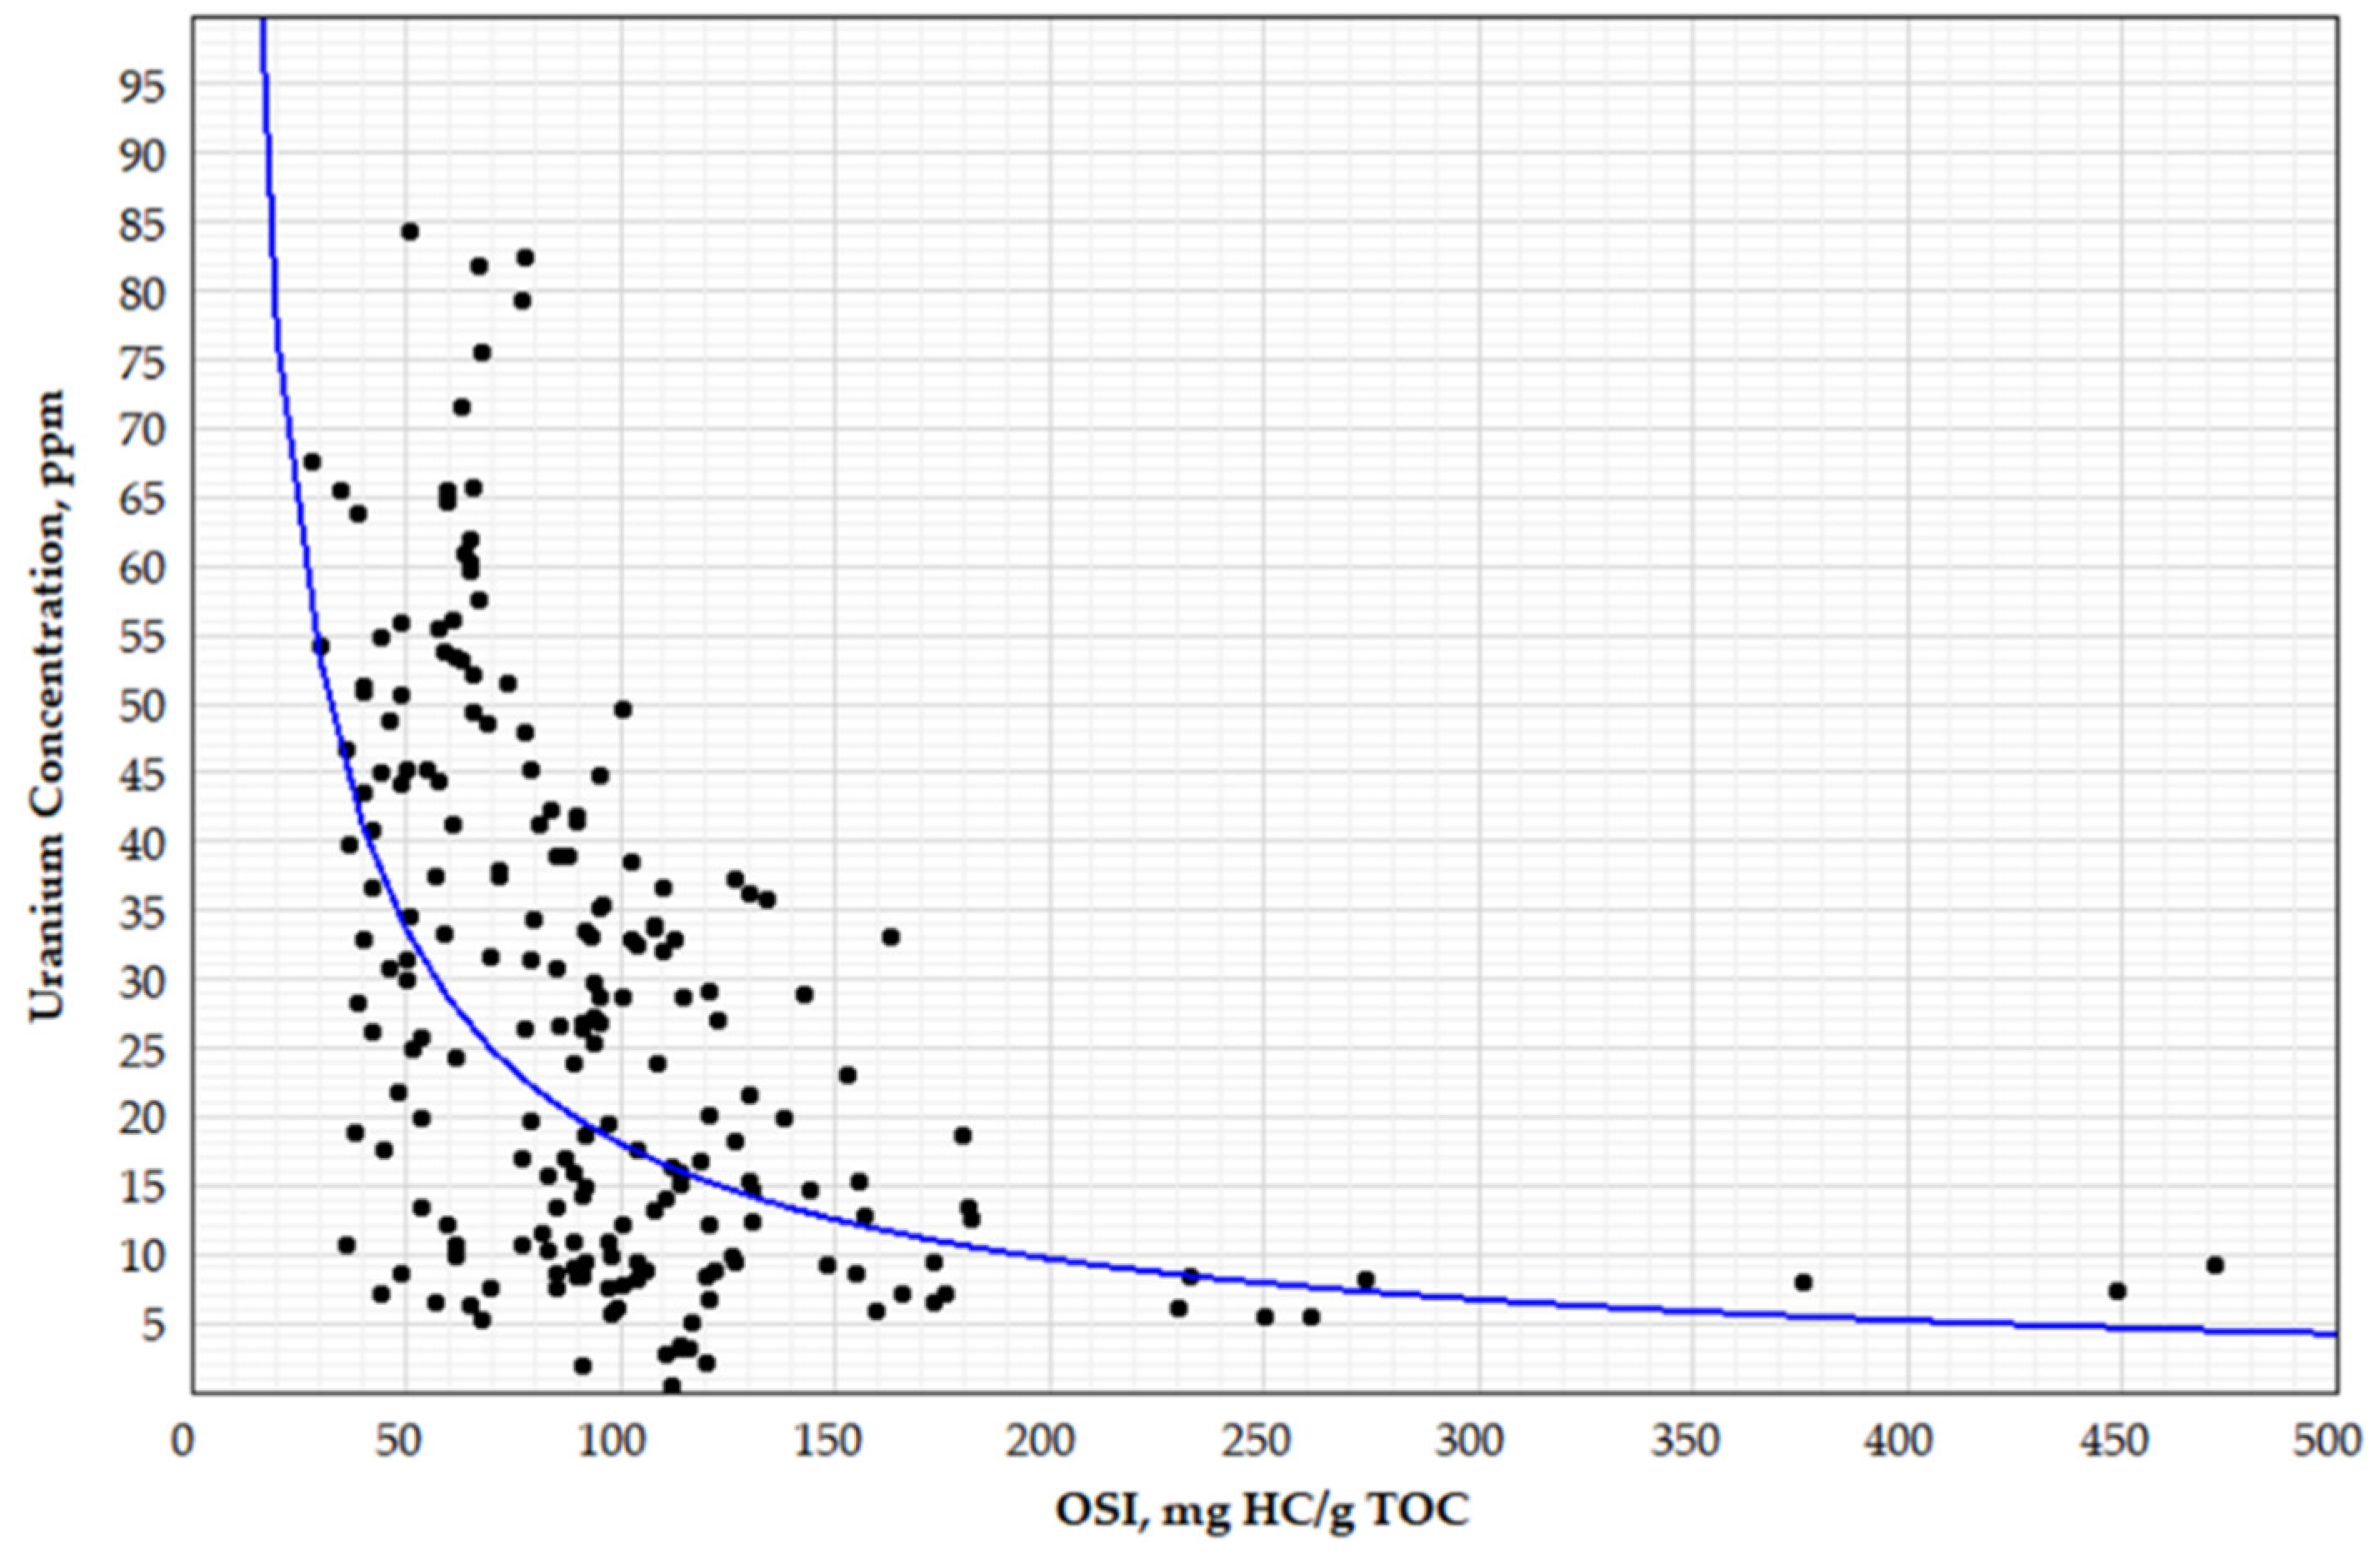
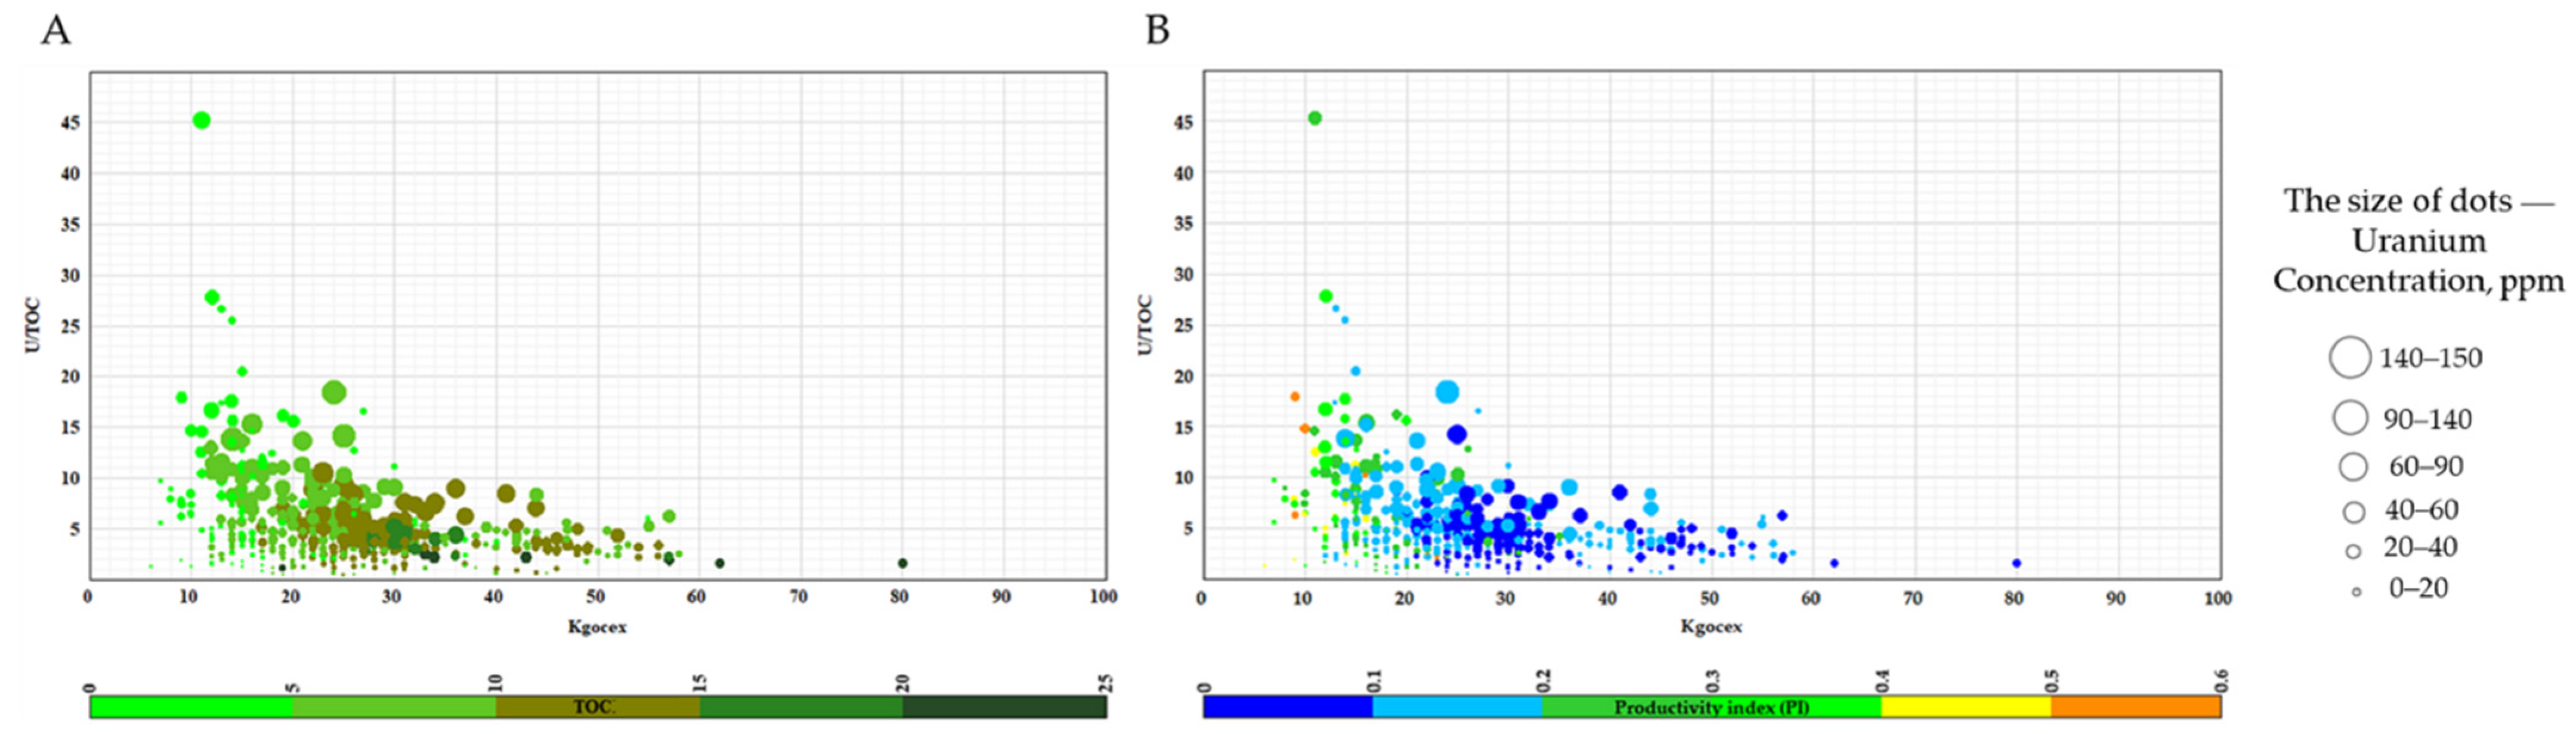
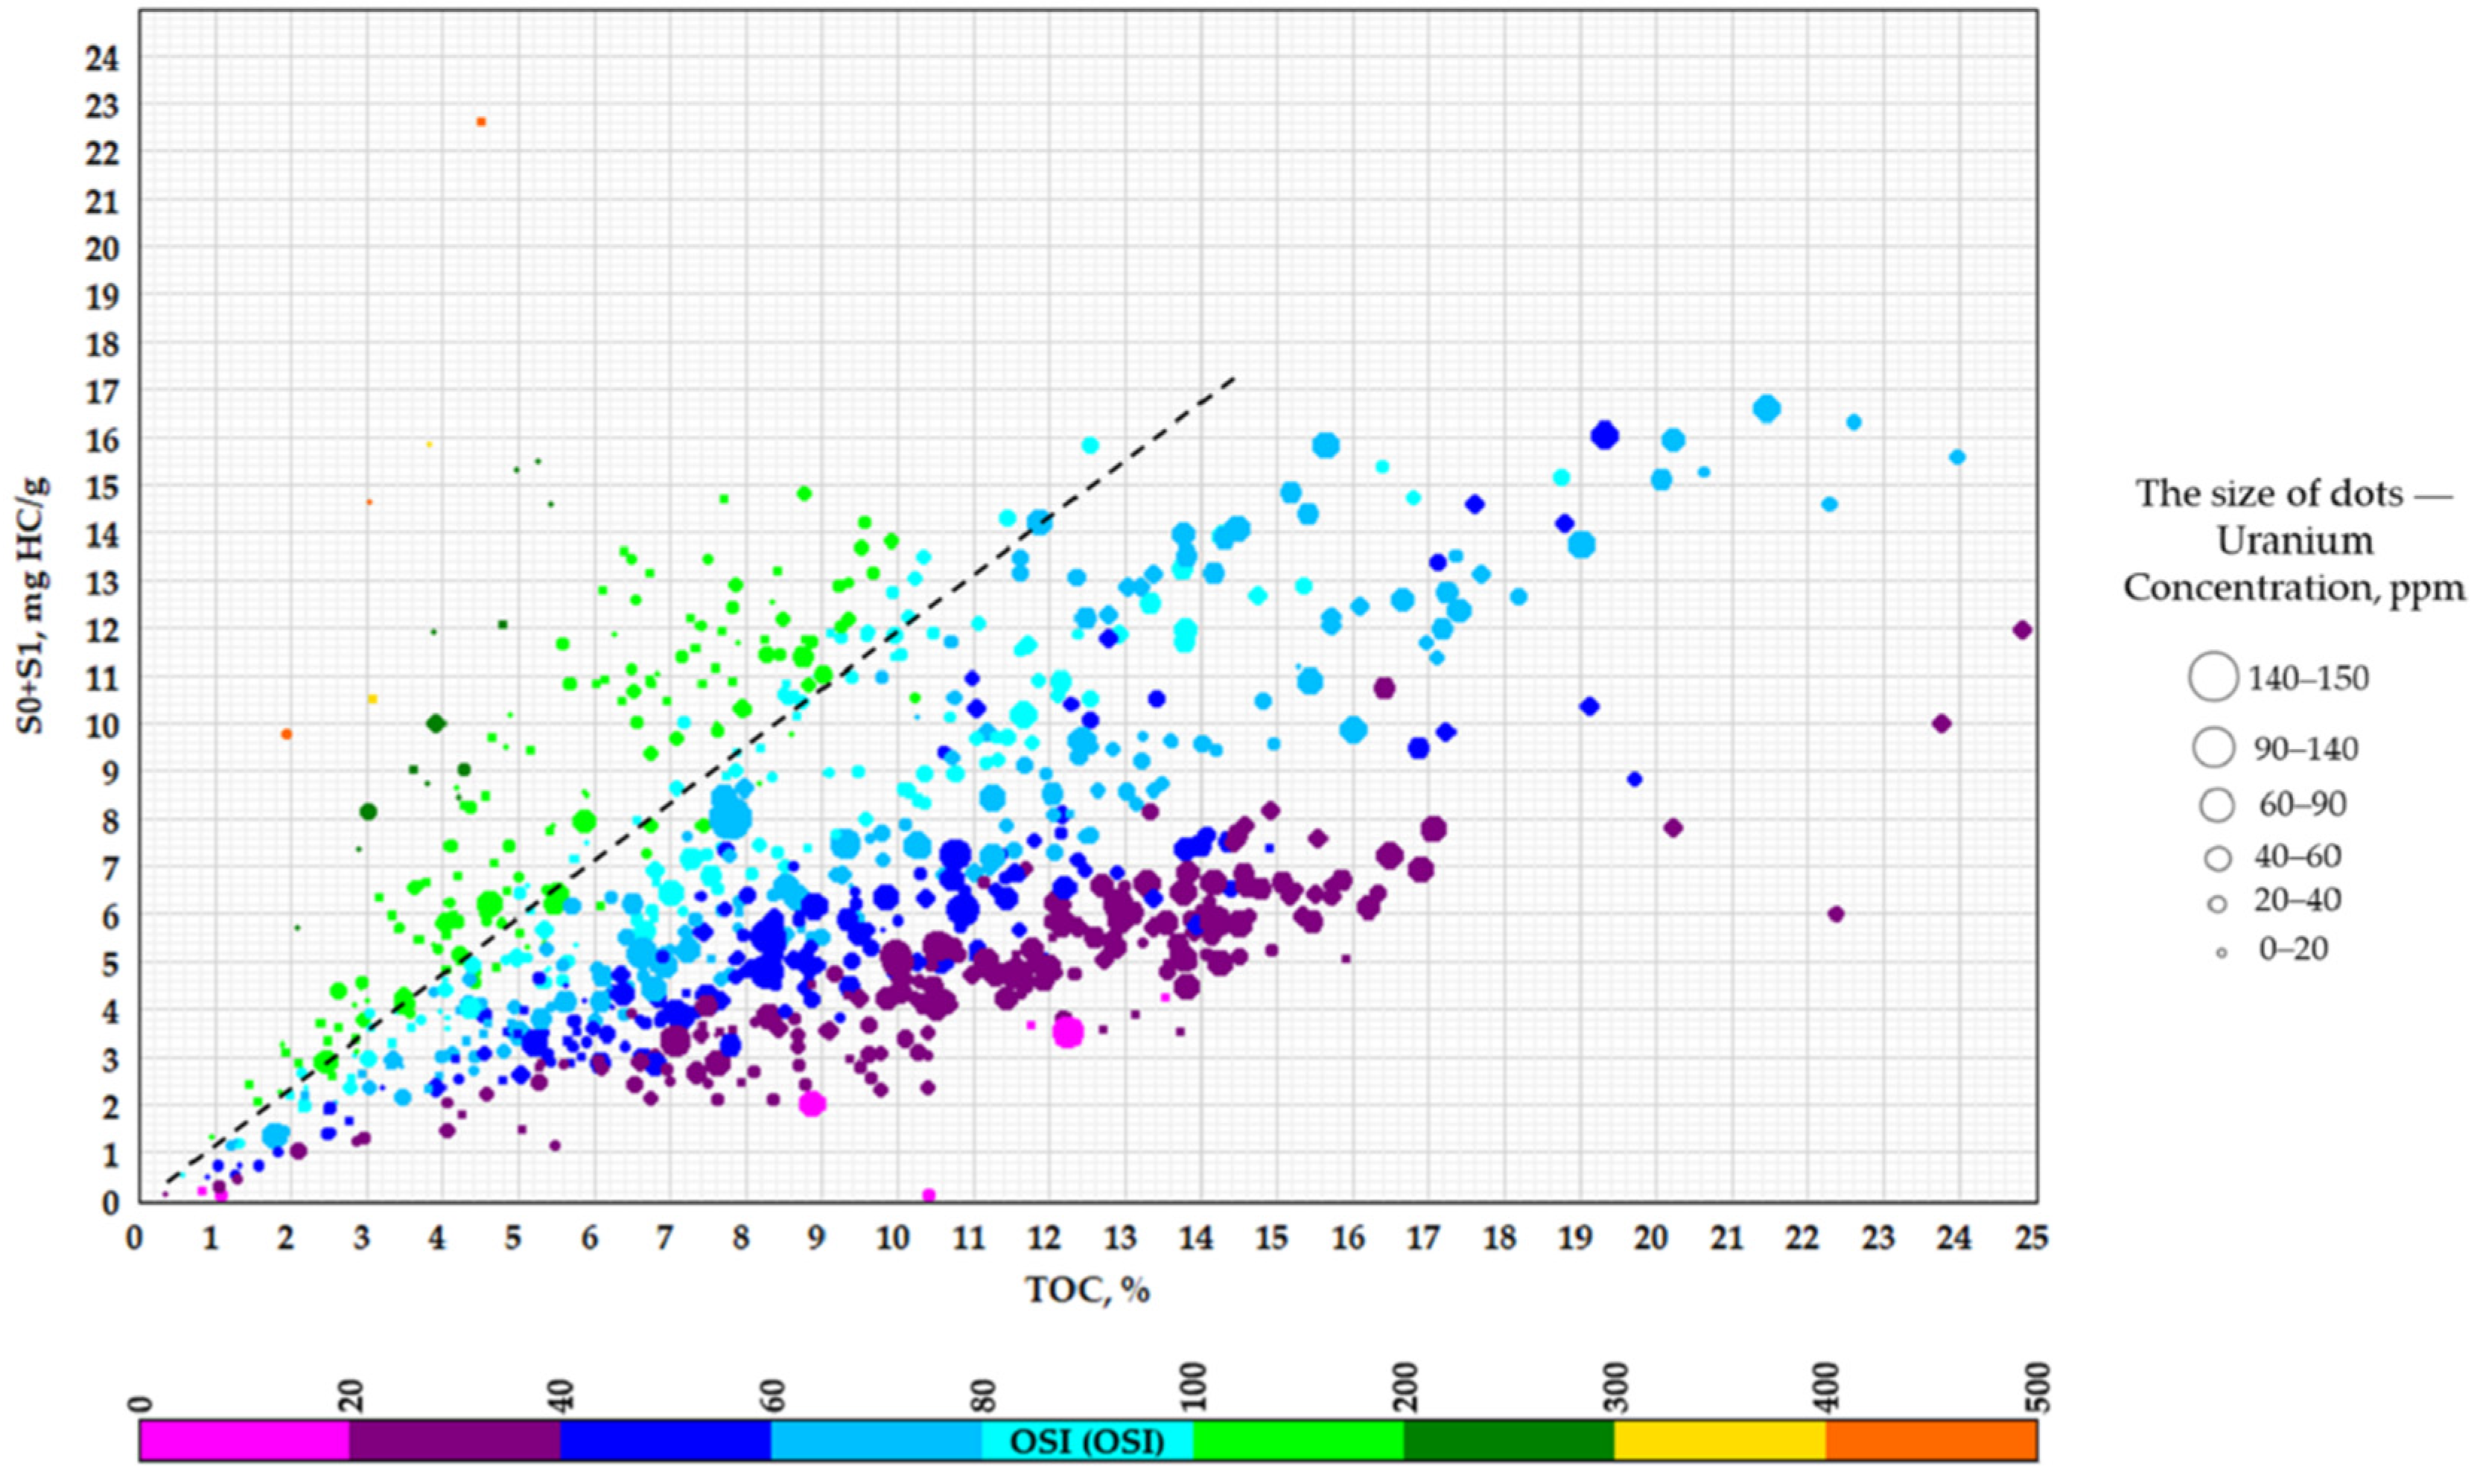
4.2. Relationship of Uranium Content, Total Organic Carbon, Mineral Composition, and Productivity of Source Rocks

In order to study the relationship between the uranium content with productivity, we used gamma-ray spectrometry on core and pyrolysis data on more than 900 core samples from 13 wells of the Bazhenov Formation. The U-TOC diagram integrating the data from these wells is shown in Figure 10. The color of points shows oil saturation index.
The data in Figure 10 do not reveal a clear correlation between OSI, TOC, and U. Nevertheless, they indicate that most of the points with increased oil saturation indices (>100) [44] are located in the quadrant with low uranium (<20 ppm) and TOC contents (<10 wt.%). Intervals with higher uranium values predominantly show lower oil saturation index values. The results of data processing are shown in Figure 11. According to these data, at OSI > 100, only 35% of the intervals are characterized by more than 30 ppm of uranium content. Therefore, the remaining 65% is characterized by less than 30 ppm uranium concentrations.
Figure 12 shows the relationship between uranium concentration and OSI for three wells located within one oilfield and characterized by the same catagenetic maturity of OM (Kgoc ≈ 55). As follows from Figure 12, OSI values > 200 are achieved for uranium content below 10 ppm. For higher uranium content, the oil saturation index decreases.
In Figure 13, we present U/TOC—Kgocex diagrams, where the dot color reflects TOC (Figure 13A) and PI (Figure 13B), and the size of the dots reflects the uranium concentration. According to the diagrams, the values of U/TOC ratio and PI increase with an increase in maturity (decrease in Kgocex). In the range 20 < Kgocex < 65, we observe a gradual increase in the U/TOC ratio from 0 to 10 with decrease in Kgocex. In this range, the productivity index PI varies from 0.1 to 0.2 (light blue and blue colors, Figure 13B) with few exceptions. In the range Kgocex < 20, we observe a sharp increase in the U/TOC ratio from 5 to 45 with decrease in Kgocex. The productivity index in this range varies from 0.2 to 0.6 (green, yellow, and orange dots, Figure 13B).
The increase in U/TOC ratio with increase in maturity (decrease in Kgocex) can be explained by decrease in TOC during catagenesis. Increase in PI values with maturation is a result of additional porosity formation during the kerogen transformation into mobile hydrocarbons [45,46].
The relationship between uranium content, TOC, and oil saturation is illustrated by the diagram for S0 + S1 − TOC, where the color corresponds to OSI values and the dot size reflects uranium concentration (Figure 14). The dotted line corresponds to OSI = 100. According to [44], this line distinguishes accumulating (reservoir rocks) and non-productive intervals. As follows from the diagram, reservoir intervals are characterized by lower uranium content (0–20 ppm).
Following the results discussed above, increased values of the productivity index PI and increased mobile hydrocarbon content are associated with intervals formed in the presence of oxygen in the water and having lower uranium concentrations. Such conditions mainly appear at shallow depths, when the vital activity of marine organisms develops in bottom sediments. Intervals with high uranium content are formed during sedimentation under reducing conditions and sulfidic environments. These intervals are source rocks characterized by the highest TOC values. However, their reservoir properties are reduced due to the small volume of void space and ultra-low permeability associated with the presence of solid organic matter kerogen and highly viscous heavy hydrocarbon fractions.
It is particularly important to note that the points obtained from samples with increased P2O5 and MnO content (up to 9% and up to 1%, respectively) fall out of the described pattern. In Figure 10, these points are marked with rhombuses and squares. According to lithological and petrophysical studies, these points in the upper left corner of the diagram (Figure 10) correspond to the increased porosity and permeability intervals, which provide higher oil saturation values. Data on uranium, P2O5, MnO content, and pyrolysis indices are shown in Table 1 and Table 2. Increased uranium content is associated with uranium concentration by phosphate minerals (P2O5) and pyrolusite (MnO). High uranium content in phosphate minerals is explained by incorporating uranium into the crystal structure of fluorapatite [9,47]. Rocks enriched in pyrolusite (MnO) exhibit increased uranium contents due to the reducing properties of manganese oxide, which transform water-soluble U+6 into insoluble U+4.
Figure 15 shows an example of the depth distribution of MnO and P2O5 content, uranium content, productivity index, and total organic carbon content for one of the studied wells. It is important to emphasize that the uranium peaks are directly related to the increasing P2O5, and MnO concentration, and the maximum uranium peak equal to 150 ppm corresponds to the maximum P2O5 peak. According to Figure 15, the maximum P2O5 and MnO content reach 9.4% and 0.2%, respectively, while the minimum values are 0.06% and 0.01%, respectively. At the same time, maxima are characterized by reduced organic carbon content and increased PI compared to the background values.
Thus, intervals with increased phosphate and pyrolusite content are exceptions to the identified pattern of low uranium content and increased oil saturation. However, these intervals can be identified by higher U/TOC ratios, which can reach the highest values within the Bazhenov interval.

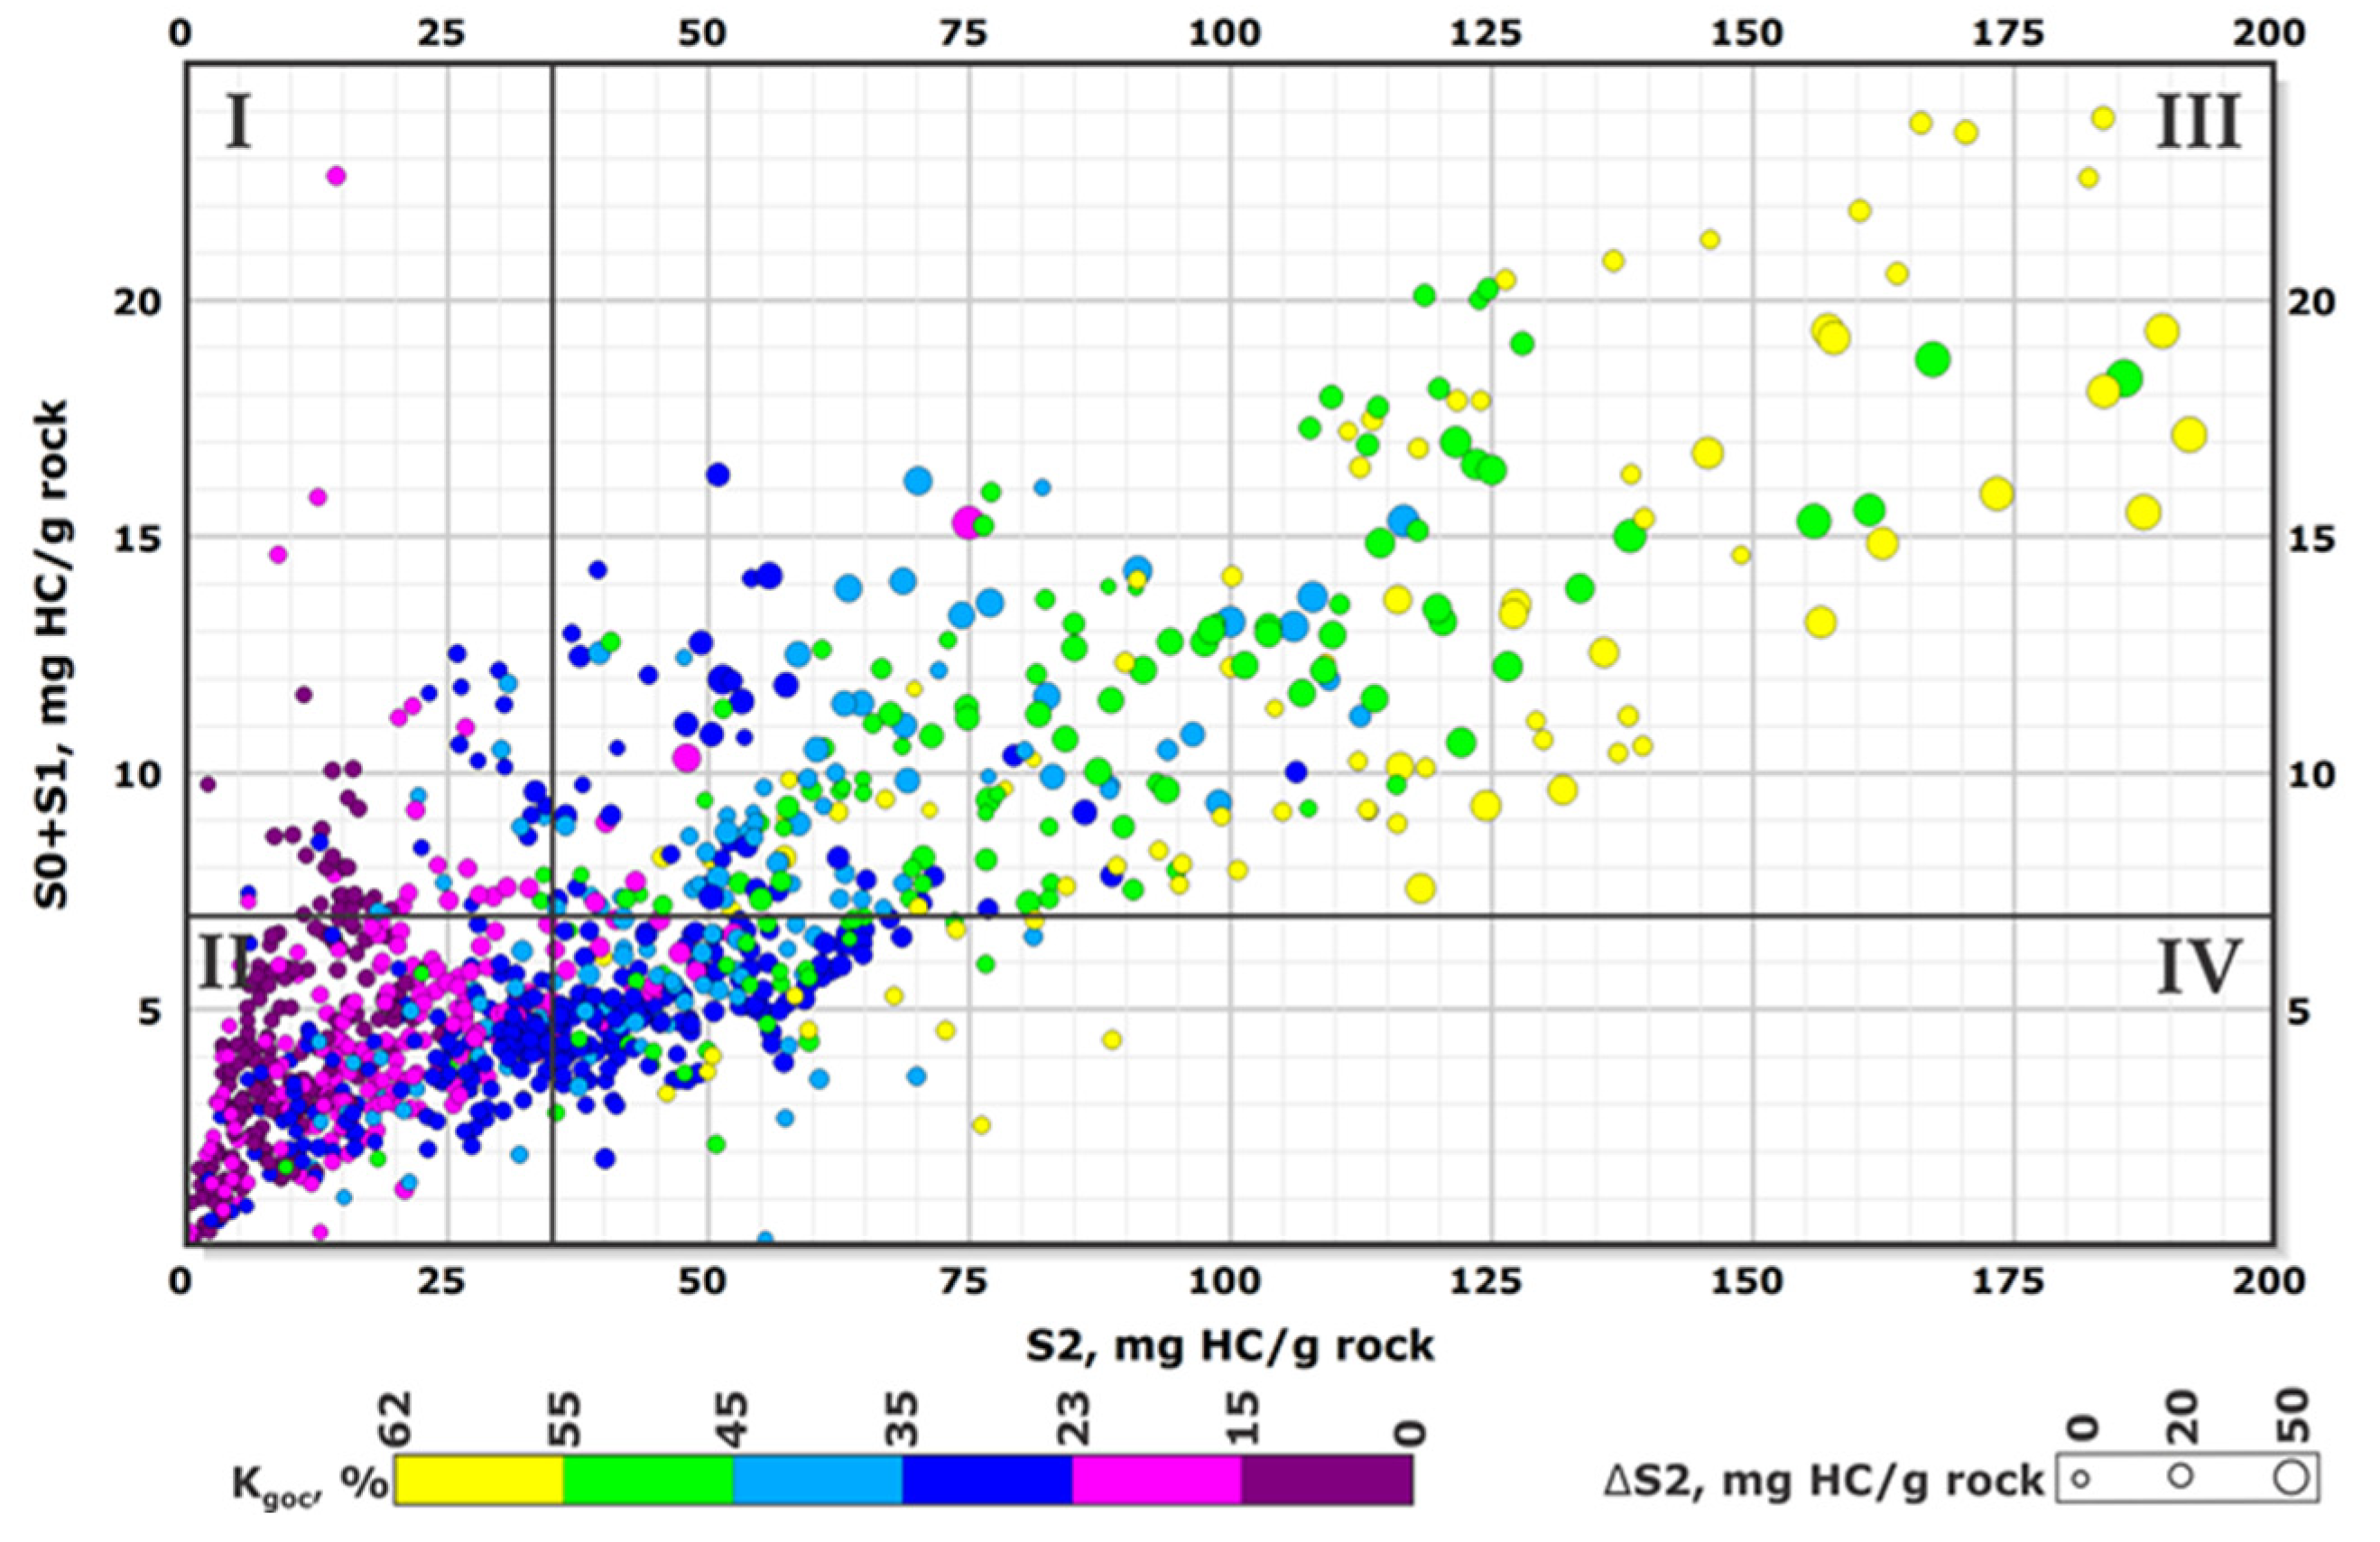
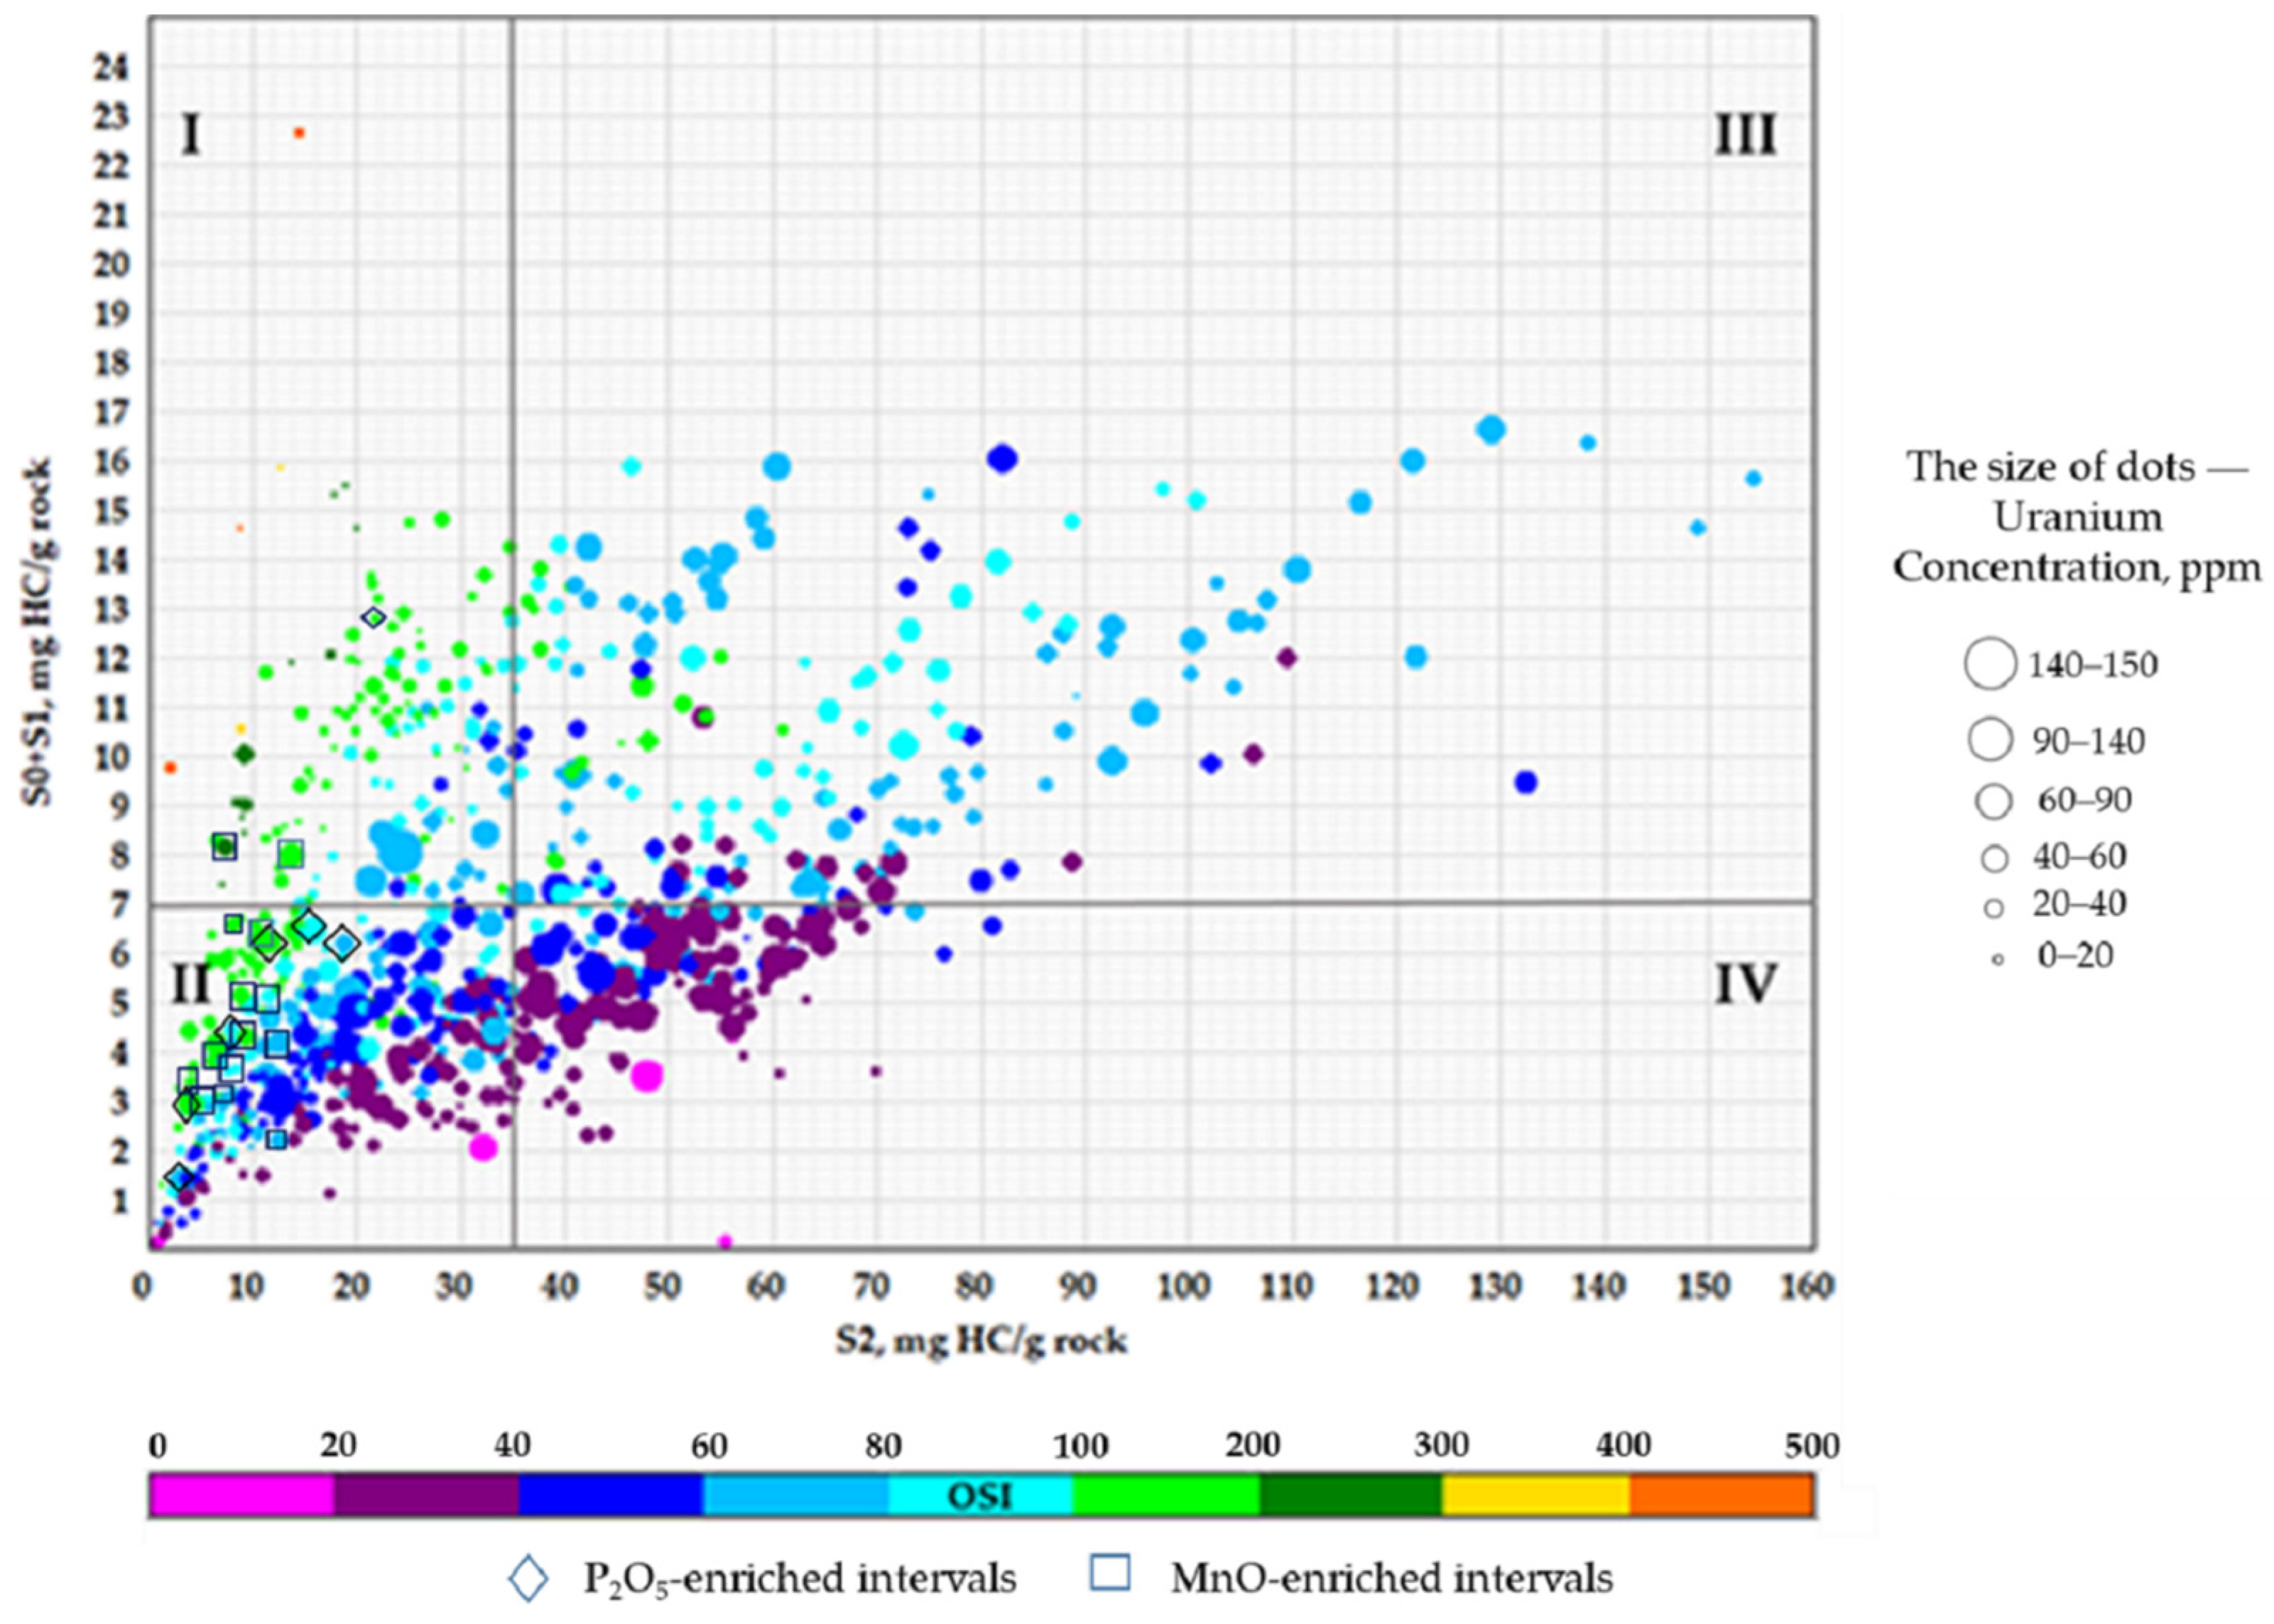
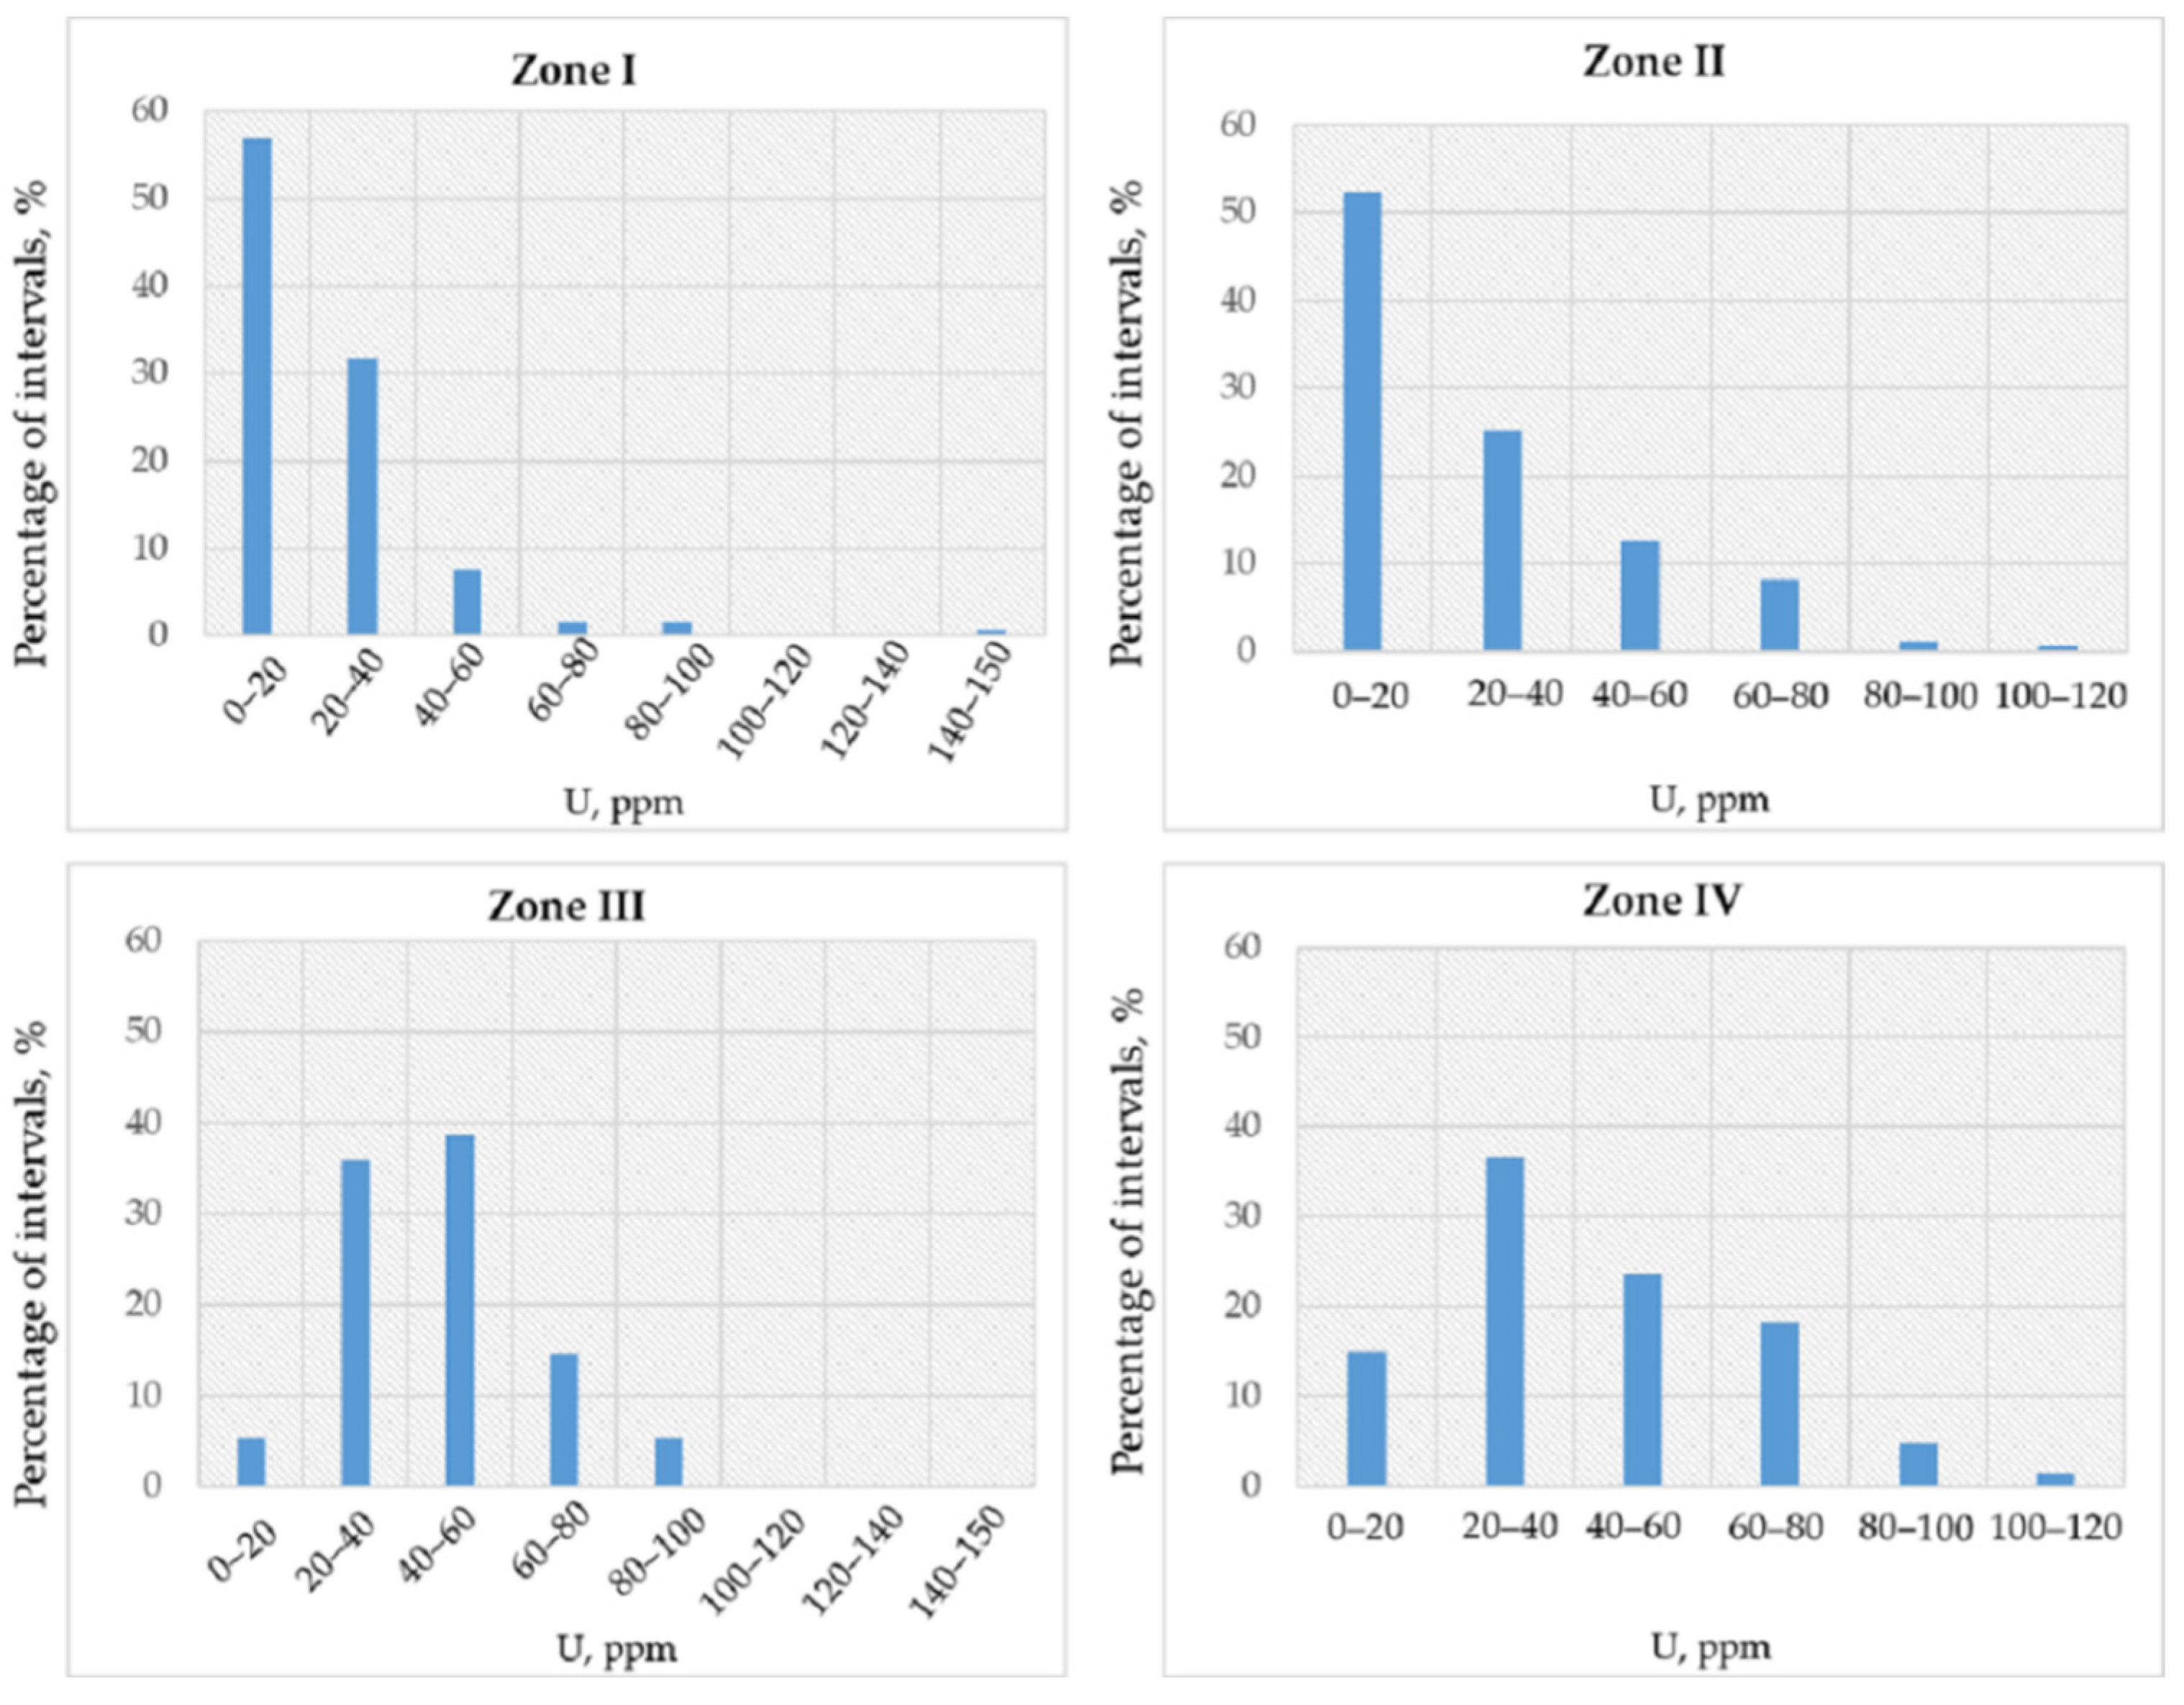
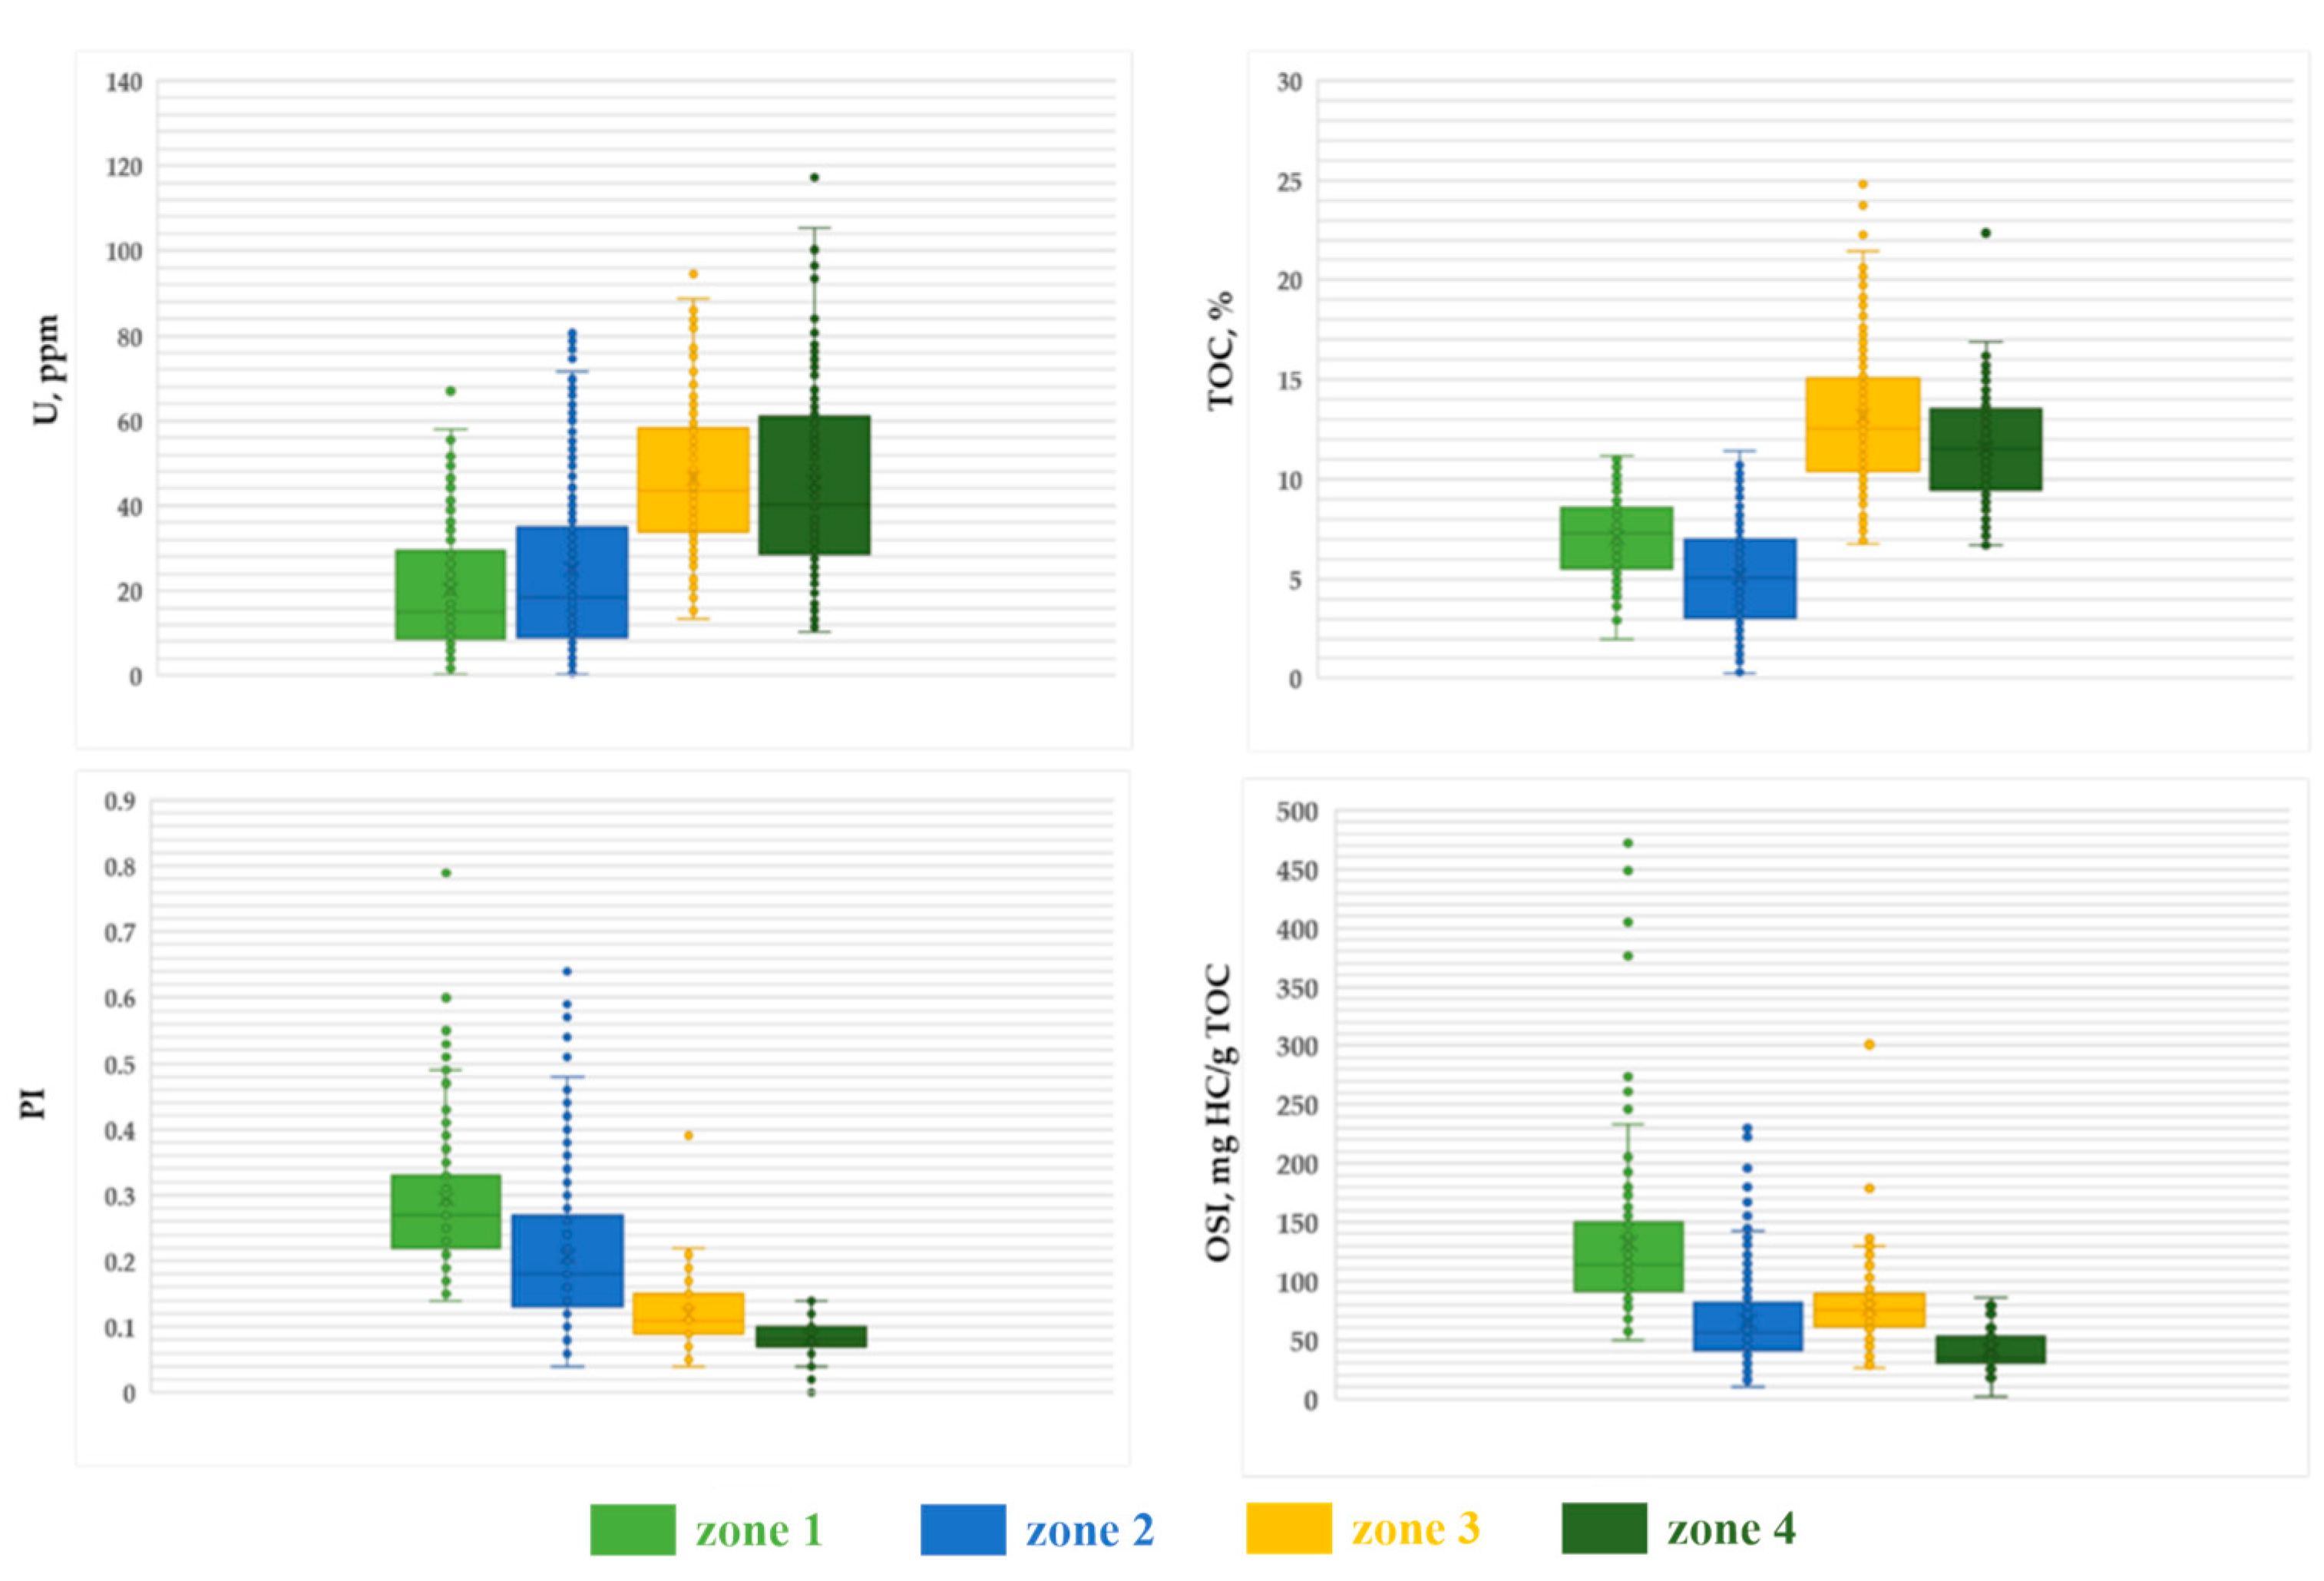
4.3. Classification of Productive Intervals by Uranium Content and U/TOC Ratio

To classify productive intervals by uranium content, we used the diagram (S0 + S1) − S2 (Figure 16), which was previously used in [26] to analyze productive intervals using the pyrolysis data. The maturity values expressed in units of pyrolyzable organic carbon share (Kgoc) are highlighted in color.
The authors of [26] have identified four quadrants in Figure 16. Quadrant I includes rock samples with increased reservoir properties and oil saturation (natural reservoir) intervals. Quadrant II corresponds to the conditional productive reservoirs with low oil saturation that may result from a fluid loss during core recovery and storage. Promising intervals of Quadrant II are characterized by higher values of S1 and OSI, and lower S2. Quadrant III includes promising intervals for thermal treatment, and Quadrant IV includes intervals unsuitable for oil production. For the analysis, this diagram (Figure 16) has been supplemented with data on uranium concentration (dot size) and OSI (shown in color).
Figure 17 illustrates that Quadrants I and II (productive and conditionally productive intervals) are characterized by low uranium content and high OSI values. In contrast, Quadrants III and IV (S2 > 35 mg HC/g rock) are characterized by higher uranium content and lower OSI. The uranium distributions in these intervals are shown in the diagrams (Figure 18). Furthermore, box plots for uranium and pyrolysis indices are presented in Figure 19. Box plots make it possible to consider the distribution of the studied parameters.
For example, the box plot of OSI values illustrates that the median values were: Quadrants I—110 mg HC/g TOC, Quadrants II—≈55 mg HC/g TOC, Quadrants III—≈75 mg HC/g TOC, Quadrants IV—≈35 mg HC/g TOC. The box plot of PI values illustrates that the median values were: Quadrants I—0.27, Quadrants II—0.18, Quadrants III—≈0.11, Quadrants IV—0.08.
Moreover, the box plot of U values shows that the median values were: Quadrants I—≈15 ppm, Quadrants II—≈18 ppm, and, respectively, Quadrants III and IV—≈43 and ≈40 ppm. Furthermore, the box plot of TOC values shows that the median values were: Quadrants I—≈7%, Quadrants II—5%, and, respectively, Quadrants III and IV—≈12.5 and ≈11.5%.
The selected zones differ in all four presented parameters (OSI, PI, TOC, U). Furthermore, these parameters are different not only in median values, but also in the minimum and maximum values.
From the data presented in Figure 17, Figure 18 and Figure 19, we have established the types of productive intervals in terms of the uranium content. The results are summarized in Table 3.
The reported diagrams allow us to establish the relationship between productivity and uranium content of the Bazhenov Formation intervals. U vs. TOC, S0 + S1 vs. TOC, and S0 + S1 vs. S2 plots demonstrate a pronounced difference in the uranium concentration and the organic matter content for productive and non-productive intervals. The U − TOC diagram is a working tool for differentiation of the Bazhenov Formation section. It allows us to distinguish between productive intervals (radiolarites), intervals enriched in phosphates (P2O5), and pyrolusite (MnO), as well as the non-productive part of the section, which differ in uranium and organic matter content. The S0 + S1 − TOC diagram demonstrates clear differences between the upper, middle, and lower parts of the Bazhenov Formation cross-section [48] and can also be applied for the subdivision into members.

5. Conclusions

In the current study, we have considered the factors affecting the uranium content and U/TOC ratio in the rocks of the Bazhenov Formation as an example of source rock organic-rich formations. We demonstrate that the behavior of uranium is closely related to changes in redox conditions during sedimentation and early diagenesis stages. Under reducing conditions and H2S in the bottom water, increased uranium accumulation is associated with its transition from soluble to an insoluble form and sorption of uranium by kerogen of the rock. In rocks formed under these conditions, the uranium content can reach maximum values of more than 100 ppm. In the case of the presence of oxygen in the water (shallow depth, intense water exchange), the uranium content in sediments is related to its concentration in the mineral components of continental inflow and to the concentration of uranium in marine organisms, since some species can accumulate uranium from seawater. In the rocks formed under such conditions, the uranium content may decrease to values typical of the continental inflow (1–4 ppm).
The relationship between the uranium content and the potential productivity of rocks was studied by comparing the data on uranium concentration with the organic matter content and oil saturation index using diagrams of S0 + S1 − TOC and S0 + S1 − S2. We have shown that the intervals with the maximum oil saturation index are characterized by uranium content in the range of 1–20 ppm. These intervals should be considered promising for development using multi-stage hydraulic fracturing technologies applied to low-permeability reservoirs. Intervals with intermediate uranium contents from 20 to 40 ppm should be considered conditionally productive. Greater maturity of organic matter and higher U/TOC ratios can be considered as factors enhancing oil recovery potential.
The intervals with uranium content above 40 ppm and high TOC are characterized by low productivity index and low oil saturation index. For this reason, these intervals can be classified as non-promising for oil production. Nevertheless, these intervals may be promising for the production of hydrocarbons generated from kerogen using thermal methods of oil recovery, especially in case of low maturity of organic matter.
However, the above-discussed uranium-based productivity criteria cannot be directly applied to the classification of the phosphorite intervals, which can have high oil saturation for high uranium concentrations (from 20 to 100 ppm).
The obtained results provide the criteria for identifying the productive intervals within the Bazhenov Formation cross-section according to spectral gamma and pulsed neutron spectroscopy log data, and their classification in terms of the methods for oil production.

Author Contributions

Conceptualization, M.S. and N.K.; methodology, M.S.; software, N.K. and P.M.; validation, M.S., E.K. and E.L.; formal analysis, E.L. and A.V.; investigation, N.K. and M.S.; resources, E.K. and A.V.; data curation, N.K. and P.M.; writing—original draft preparation, N.K.; writing—review and editing, M.S., E.K. and E.L.; visualization, N.K.; supervision, M.S., E.K. and E.L. All authors have read and agreed to the published version of the manuscript.

Funding

This work was supported by the Ministry of Science and Higher Education of the Russian Federation under agreement No. 075-10-2022-011.

Acknowledgments

Evgeniy Bastrakov is thanked for his advices and ideas.

Conflicts of Interest

The authors declare no conflict of interest.

References

  1. Fertl, W.H. Gamma ray spectral evaluation techniques identify fractured shale reservoirs and source-rock characteristics. J. Pet. Technol. 1980, 32, 11. [Google Scholar] [CrossRef]
  2. Gudok, N.S.; Bogdanovich, N.N.; Martynov, V.G. Opredelenie Fizicheskih Svojstv Neftevodosoderzhashchih Porod; Nedra: Moscow, Russia, 2007. [Google Scholar]
  3. Parfenova, T.M.; Melenevskij, V.N.; Moskvin, V.I. Ispol’zovanie gamma-karotazha dlya opredeleniya soderzhaniya organicheskogo veshchestva v vysokouglerodistyh osadochnyh formaciyah (na primere Bazhenovskoj svity). Neftyanaya Gazov. Promyshlennost’. Geol. Geofiz. Razrab. Neftyanyh Mestorozhdenij 1999, 11, 29–34. [Google Scholar]
  4. Dudaev, S.A. Petrophysical background of the study of the clay collectors of the caucasus with gamma spectrometry data. Logger 2011, 6, 12–25. [Google Scholar]
  5. Kulyapin, P.S. Development of Interpretative and Petroelastic Models of Reservoir Rocks of Multicomponent Composition and Complex Structure of Capacitive Space. Ph.D. Thesis, National University of Oil and Gas “Gubkin University”, Moscow, Russia, 2016. [Google Scholar]
  6. Mann, U.; Müller, P.J. Source rock evaluation by well log analysis (Lower Toarcian, Hils syncline). In Organic Geochemistry in Petroleum Exploration: Proceedings of the 13th International Meeting on Organic Geochemistry, Venice, Italy 21–25 September 1987; Elsevier: Amsterdam, The Netherlands, 1988; pp. 109–119. [Google Scholar]
  7. Swanson, V.E. Geology and Geochemistry of Uranium in Marine Black Shales: A Review; Geology Survey Professional Paper 356-C; United States Government Printing Office: Washington, DA, USA, 1961; pp. 1–110.
  8. Lüning, S.; Kolonic, S. Uranium spectral gamma-ray response as a proxy for organic richness in black shales: Applicability and limitations. J. Pet. Geol. 2003, 26, 153–174. [Google Scholar] [CrossRef]
  9. Zubkov, M.Y. Peculiarities of uranium distribution in bituminous deposits of the Bazhenov formation (Western Siberia). Logger 2015, 5, 3–32. [Google Scholar]
  10. Bastrakov, E.; Boreham, C.; Edwards, D.; Jarrett, A. Uranium in organic-rich shales as a tool for predicting hydrocarbon potential: Proterozoic to Cretaceous examples from Australia. In Proceedings of the 20th Australian Organic Geochemistry Conference: Origins of Oil, Old Organics and Organisms, Canberra, Australia, 3–7 December 2018. [Google Scholar]
  11. Khaustova, N. U/Corg Ratio within Unconventional Reservoirs: Indicator of Oil Generation Processes and Criteria for Productive Intervals Determination During the Bazhenov Formation Investigation. In Proceedings of the EAGE/SPE Workshop on Shale Science, Moscow, Russia, 8–9 April 2019. [Google Scholar]
  12. Partin, C.A.; Bekker, A.; Planavsky, N.J.; Scott, C.T.; Gill, B.C.; Li, C.; Podkovyrov, V.; Maslov, A.; Konhauser, K.O.; Lalonde, S.V.; et al. Large-scale fluctuations in Precambrian atmospheric and oceanic oxygen levels from the record of U in shales. Earth Planet. Sci. Lett. 2013, 369, 284–293. [Google Scholar] [CrossRef]
  13. Kizil’shtejn, L.Y.; Chernikov, B.A. Rol’ Organicheskogo Veshchestva Zemnoj Kory v Obrazovanii Mestorozhdenij Urana; Izdvo Rostovskogo Universiteta: Rostov-na-Donu, Russia, 1999. [Google Scholar]
  14. Cumberland, S.A.; Douglas, G.; Grice, K.; Moreau, J.W. Uranium mobility in organic matter-rich sediments: A review of geological and geochemical processes. Earth-Sci. Rev. 2016, 159, 160–185. [Google Scholar] [CrossRef] [Green Version]
  15. Swanson, V.E. Oil Yield and Uranium Content of Black Shales; Geology Survey Professional Paper 356-A; United States Government Printing Office: Washington, DA, USA, 1960.
  16. Ulmishek, G.F. Petroleum Geology and Resources of the West Siberian Basin, Russia; Version 1; United States Geological Survey (USGS): Reston, VA, USA, 2003.
  17. Braduchan, Y.V.; Gurari, F.G.; Zakharov, V.A. Bazhenovskij Gorizont Zapadnoj Sibiri (Stratigrafija, Ekosistema, Neftenosnost); Vyshemiskij, V.S., Ed.; The Bazhenov Horizon of the Western Siberia (Stratigraphy, Ecosystem, Oil Content); Nauka: Novosibirsk, Russia, 1986. [Google Scholar]
  18. Zanin, Y.N.; Zamirailova, A.G.; Eder, V.G. Some aspects of the Bazhenov Formation genesis in the Central parts of the West-Siberian sedimentary Basin. Lithosphera 2005, 4, 118–135. [Google Scholar]
  19. Kontorovich, A.E.; Yan, P.A.; Zamirailova, A.G.; Kostyreva, E.A.; Eder, V.G. Classification of rocks of the Bazhenov Formation. Russ. Geol. Geophys. 2016, 57, 1606–1612. [Google Scholar] [CrossRef]
  20. Nemova, V.D.; Panchenko, I.V. The factors of productivity of Bazhenov Horizon in Frolov Megadepression. Neftegazov. Geologiya. Teor. Pract. 2017, T.12, 4. [Google Scholar] [CrossRef]
  21. Kontorovich, A.E.; Bogorodskaya, L.I.; Borisova, L.S.; Burshtein, L.M.; Ismagilov, Z.R.; Efimova, O.S.; Kostyreva, E.A.; Lemina, N.M.; Ryzhkova, S.V.; Sozinov, S.A.; et al. Geochemistry and catagenetic transformation of kerogen from the bazhenov horizon. Geoshemistry 2019, 64, 585–593. [Google Scholar] [CrossRef]
  22. Goncharov, I.V.; Samoilenko, V.V.; van Graas, G.W.; Trushkov, P.V.; Oblasov, N.V.; Fadeeva, S.V.; Veklich, M.A.; Kashapov, R.S.; Sidorov, D.A. Petroleum generation and migration in the southern Tyumen region, Western Siberia Basin, Russia. Org. Geochem. 2021, 152, 104178. [Google Scholar] [CrossRef]
  23. Kozlova, E.V.; Fadeeva, N.P.; Kalmykov, G.A.; Balushkina, N.S.; Pronina, N.V.; Poludetkina, E.N.; Kostenko, O.V.; Yurchenko, A.Y.; Borisov, R.S.; Bychkov, A.Y.; et al. Technology for studying the geochemical parameters of organic matter in kerogen-saturated sediments (by the example of the Bazhenov formation, Western Siberia). Vestn. MGU Geol. 2015, 5, 44–54. [Google Scholar]
  24. Panchenko, I.V.; Nemova, V.D.; Smirnova, M.E.; Ilyina, M.V.; Baraboshkin, E.Y.; Ilyin, V.S. Stratification and detailed correlation of bazhenov horizon in the central part of the western siberia according to lithological and paleontological core analysis and well logging. Geol. Nefti Gaza 2016, 6, 22–34. [Google Scholar]
  25. Zanin, Y.N.; Zamirajlova, A.G.; Eder, V.G. Uran, torij i kalij v chernyh slancah bazhenovskoj svity Zapadno-Sibirskogo morskogo bassejna. Litol. Polezn. Iskop. 2016, 1, 82. [Google Scholar]
  26. Spasennykh, M.; Maglevannaia, P.; Kozlova, E.; Bulatov, T.; Leushina, E.; Morozov, N. Geochemical Trends Reflecting Hydrocarbon Generation, Migration and Accumulation in Unconventional Reservoirs Based on Pyrolysis Data (on the Example of the Bazhenov Formation). Geosciences 2021, 11, 307. [Google Scholar] [CrossRef]
  27. Fomin, A.N. Tectonic Scheme: Scheme of Catagenesis of Organic Matter in the Top of the Upper Jurassic Deposits of the West Siberian Megabasin, Scale: 1:2500000. 2004. Available online: https://www.geokniga.org/maps/14136 (accessed on 25 July 2022).
  28. Coretest Systems, Inc. EGL-255 Profil’nyj Gamma-Registrator (Spektral’nyj); Rukovodstvo Pol’zovatelya: Moscow, Russia, 2012. [Google Scholar]
  29. Lopatin, N.V.; Emets, T.P. Pyrolysis in Oil and Gas Geochemistry; Nauka: Moscow, Russia, 1987. [Google Scholar]
  30. Espitalie, J.; Marquis, F.; Barsony, I. Geochemical logging. In Analytical Pyrolysis—Techniques and Applications; Voorhees, K.J., Ed.; Butterworth-Heinemann: Boston, MA, USA, 1984; pp. 276–304. [Google Scholar]
  31. Maende, A.; Weldon, W.D. Pyrolysis and TOC Identification of Tight Oil Sweet Spots. In Proceedings of the Unconventional Resources Technology Conference, Denver, CO, USA, 12–14 August 2013; pp. 2573–2583. [Google Scholar] [CrossRef]
  32. Langford, F.F.; Blanc-Valleron, M.M. Interpreting Rock-Eval pyrolysis data using graphs of pyrolyzable hydrocarbons vs total organic carbon. AAPG Bull. 1990, 74, 799–804. [Google Scholar]
  33. Jarvie, D.M. Shale resource systems for oil and gas: Part 1—Shale-gas resource systems. In AAPG Memoir 97, Shale Reservoirs—Giant Resources for the 21st Century; Breyer, J.A., Laubach, S.E., Eds.; AAPG: Tulsa, OK, USA, 2012; pp. 69–87. [Google Scholar] [CrossRef]
  34. Behar, F.; Beaumont, V.; Penteado, H.L.D.B. Rock-Eval 6 Technology: Performances and Developments. Oil Gas Sci. Technol.—Rev. IFP 2001, 562, 111–134. [Google Scholar] [CrossRef]
  35. Coplen, T.B.; Hopple, J.A.; Böhlke, J.K.; Peiser, H.S.; Rieder, S.E.; Krouse, H.R.; Rosman, K.J.R.; Ding, T.; Vocke, R.D., Jr.; Révész, K.M.; et al. Compilation of Minimum and Maximum Isotope Ratios of Selected Elements in Naturally Occurring Terrestrial Materials and Reagents; Water-Resources Investigations Report 01-4222; United States Geological Survey (USGS): Reston, VA, USA, 2002.
  36. Leushina, E.; Bulatov, T.; Kozlova, E.; Panchenko, I.; Voropaev, A.; Karamov, T.; Yermakov, Y.; Bogdanovich, N.; Spasennykh, M. Upper Jurassic–Lower Cretaceous Source Rocks in the North of Western Siberia: Comprehensive Geochemical Characterization and Reconstruction of Paleo-Sedimentation Conditions. Geosciences 2021, 11, 320. [Google Scholar] [CrossRef]
  37. Baioumy, H.; Lehmann, B. Anomalous enrichment of redox-sensitive trace elements in the marine black shales from the Duwi Formation, Egypt: Evidence for the late Cretaceous Tethys anoxia. J. Afr. Earth Sci. 2017, 133, 7–14. [Google Scholar] [CrossRef]
  38. Elbaz-Poulichet, F.; Seidel, J.L.; Jézéquel, D.; Metzger, E.; Prévot, F.; Simonucci, C.; Sarazin, G.; Viollier, E.; Etcheber, H.; Jouanneau, J.M.; et al. Sedimentary record of redox-sensitive elements (U, Mn, Mo) in a transitory anoxic basin (the Thau lagoon, France). Mar. Chem. 2005, 95, 271–281. [Google Scholar] [CrossRef]
  39. Zanin, Y.N.; Zamirajlova, A.G.; Eder, V.G. Nikel’, molibden, kobal’t v chernyh slancah bazhenovskoj svity Zapadno-Sibirskogo morskogo bassejna. Geohimiya 2017, 2, 161–170. [Google Scholar]
  40. Idrisova, E.; Gabitov, R.; Karamov, T.; Voropaev, A.; Liu, M.-C.; Bogdanovich, N.; Spasennykh, M. Pyrite Morphology and δ34S as Indicators of Deposition Environment in Organic-Rich Shales. Geosciences 2021, 11, 355. [Google Scholar] [CrossRef]
  41. Newton, R.; Bottrell, S. Stable isotopes of carbon and sulphur as indicators of environmental change: Past and present. J. Geol. Soc. 2007, 164, 691–708. [Google Scholar] [CrossRef]
  42. Melenevskii, V.N.; Tolstokorov, S.V.; Klimin, M.A. Diagenesis of organic matter in peat: Rock–eval pyrolysis data. Geochem. Int. 2019, 57, 227–231. [Google Scholar] [CrossRef]
  43. Khaustova, N.; Tikhomirova, Y.; Korost, S.; Poludetkina, E.; Voropaev, A.; Mironenko, M.; Spasennykh, M. The Study of Uranium Accumulation in Marine Bottom Sediments: Effect of Redox Conditions at the Time of Sedimentation. Geosciences 2021, 11, 332. [Google Scholar] [CrossRef]
  44. Dakhnova, M.V.; Mozhegova, S.V.; Nazarova, E.S.; Paizanskaya, I.L. Evaluation of reserves of shale oil using geochemical parameters. Geol. Nefti Gaza 2015, 4, 55–61. [Google Scholar]
  45. Kalmykov, A.G.; Karpov, Y.A.; Topchy, M.S.; Fomina, M.M.; Manuilova, E.A.; Sheremetyeva, E.V.; Tretyakova, I.O.; Pronina, N.V.; Shishkov, V.A.; Balushkina, N.S.; et al. Vliyanie katageneticheskoj zrelosti na formirovanie kollektorov s organicheskoj poristost’yu v bazhenovskoj svite i osobennosti ih rasprostraneniya. Georesursy 2019, 21. [Google Scholar]
  46. Karpov, Y.A.; Balushkina, N.S.; Stupakova, A.V.; Fomina, M.M.; Topchy, M.S.; Miftakhova, A.A.; Kalmykov, A.G.; Kalmykov, G.A. Kriterii rasprostraneniya nefteproduktivnyh porod bazhenovskoj vysokouglerodistoj formacii s razvitoj sistemoj porovoj emkosti v kerogene. Vestn. Mosk. Univ. Ser. 4 Geol. 2019, 2. [Google Scholar]
  47. Kalmykov, A.G.; Manuilova, E.A.; Kalmykov, G.A.; Belokhin, V.S.; Korobova, N.I.; Makarova, O.M.; Kozlova, E.V.; Khamidullin, R.A.; Shishkov, V.A.; Ivanova, A.G. Fosfatsoderzhashchie prosloi bazhenovskoj svity kak vozmozhnyj kollektor. Vestn. Mosk. Univ. Ser. 4 Geol. 2016, 5, 60–66. [Google Scholar]
  48. Kozlova, E.V.; Spasennyh, M.Y.; Kalmykov, G.A.; Gutman, I.S.; Potemkin, G.N.; Alekseev, A.D. Balans uglevodorodnyh soedinenij neftyanogo ryada v pirolizuemom organicheskom veshchestve bazhenovskoj svity. Neftyanoe Hozyajstvo 2017, 3, 18–21. [Google Scholar] [CrossRef]
Figure 1. The geological map (modified after [27]) with location of studied wells and stratigraphic column.
Minerals 12 00976 g001
Figure 2. Logview well 1: U, Th/U, TOC (total organic carbon), OI (oxygen index), OSI (oil saturation index), U/TOC, V, V/Mo, V/Cr, Mo/Al, and Mo/(Mo + Mn), δ34S (sulfur isotopic composition).
Minerals 12 00976 g002
Figure 3. Logview well 2: U, Th/U, TOC (total organic carbon), OI (oxygen index), OSI (oil saturation index), U/TOC, Mo/Al, and Mo/(Mo + Mn).
Minerals 12 00976 g003
Figure 4. Cross-plot of uranium and vanadium concentrations for well 1, Bazhenov Formation. Blue line corresponds to equation U = 0.03·V − 2.05, where the correlation coefficient R = 0.87.
Minerals 12 00976 g004
Figure 5. Cross-plot of uranium concentration and Mo/(Mo + Mn) ratio for well 2, Bazhenov Formation. Blue line corresponds to equation U = 74.81·Mo/(Mo + Mn) + 14.95, where the correlation coefficient R = 0.81.
Minerals 12 00976 g005
Figure 6. Cross-plot of uranium concentration and sulfur isotopic composition for well 1, Bazhenov Formation. Blue line corresponds to equation U = −1.06·δ34S + 4.69, where the correlation coefficient R = 0.46.
Minerals 12 00976 g006
Figure 7. Cross-plot of U/TOC and sulfur isotopic composition for well 1, Bazhenov Formation. Blue line corresponds to equation U/TOC = −0.11·δ34S + 0.77, where the correlation coefficient R = 0.57.
Minerals 12 00976 g007
Figure 8. Cross-plot of uranium concentration (measured by gamma-ray spectrometry on core samples) and TOC (total organic carbon) according to the study of 11 wells. Dot color corresponds to the values of OI (oxygen index).
Minerals 12 00976 g008
Figure 9. The proportion of intervals (%) with values of OI = 4 ÷ 10, and OI > 10 as a function of uranium content.
Minerals 12 00976 g009
Figure 10. Cross-plot of the uranium concentration and total organic carbon (TOC) according to the study of 12 wells penetrating the BF. The color of the dots reflects the oil saturation index (OSI) values.
Minerals 12 00976 g010
Figure 11. The number of intervals with OSI > 100 for different uranium concentrations.
Minerals 12 00976 g011
Figure 12. Uranium concentration as a function of oil saturation index (OSI) according to the study of 3 wells drilled at oil fields [26] characterized by low-maturity kerogen (Kgoc ≈ 55). Blue line corresponds to the equation U = 1133*OSI−0.9, where the determination coefficient R2 = 0.25.
Minerals 12 00976 g012
Figure 13. U/TOC–Kgocex diagram based on pyrolysis studies of 11 wells. The dot color corresponds to the total organic carbon TOC (A) and the productivity index PI (B), and the dot size reflects the uranium concentration.
Minerals 12 00976 g013
Figure 14. S0 + S1 − TOC diagram from pyrolysis studies of 11 wells, where color indicates OSI value and dot size reflects uranium concentration. The dotted line separates dots with OSI > 100 from other dots, for which OSI < 100 (see color fill).
Minerals 12 00976 g014
Figure 15. Example of depth distributions of MnO, P2O5, and uranium concentration (from gamma-ray spectrometry on core samples and XRF), as well as pyrolysis productivity indices (PI) and total organic carbon (TOC).
Minerals 12 00976 g015
Figure 16. Diagram S0 + S1 vs. S2 [26], Quadrants I–IV. The color indicates Kgoc, the proportion of generative organic carbon in TOC wt.%, and the size of dots reflects the content of ΔS2.
Minerals 12 00976 g016
Figure 17. Diagram S0 + S1 − S2 from core studies of 11 wells. Dot color reflects oil saturation index (OSI), and dot size corresponds to the uranium concentration.
Minerals 12 00976 g017
Figure 18. Diagrams of uranium distribution for Quadrants I–IV.
Minerals 12 00976 g018
Figure 19. Box-plots for 4 productivity types. Uranium content, TOC, oil saturation, and productivity indices are shown.
Minerals 12 00976 g019
Table 1. Pyrolysis parameters, the concentration of uranium and phosphates (P2O5) for the intervals with high uranium content and low organic matter content (Figure 10).
№ Layer with
Phosphate
U, ppmTOC, %U/TOCPIOSIS0 + S1,
mg HC/g Rock
HI, mg HC/g TOCP2O5, %
1821.8460.27701.31889.37
2553.5160.31154.32710.28
3505.790.17666.13290.25
4403.2120.321966.43798.33
5342.5130.24591.91850.3
6285.060.24946.42970.32
7246.640.315312.63581.4
Table 2. Pyrolysis parameters, the concentration of uranium and MnO for the intervals with high uranium content and low organic matter content (Figure 10).
№ Layer with PyrolusiteU, ppmTOC, %U/TOCPIOSIS0 + S1,
mg HC/g Rock
HI, mg HC/g TOCMnO, %
1774.6170.351246.22350.19–0.22
2685.9120.361308.02331.05
3504.4120.24794.12520.84
4444.2100.351115.12110.24–0.33
5424.4100.31994.92190.24–0.33
6403.6110.381023.91700.17
7403.0140.361173.82090.23
8405.080.28915.12320.33
9385.080.33744.11530.24
10314.080.39693.01100.24–0.29
11344.480.551788.31460.24–0.29
12324.470.29643.01560.24–0.29
13233.660.421616.62250.29
14224.250.16542.52930.24
Table 3. Types of productive intervals as a function of uranium and total organic carbon, U/TOC ratio.
Interval TypeAverage Values of U, TOC, U/TOC
with Standard Deviations
Comments
IIntervals with increased oil saturation and improved reservoir properties. In terms of productivity, they are similar to tight oil reservoirs, for which hydraulic fracturing and multi-stage hydraulic fracturing technologies can be efficiently applied.U = 20 ± 14 ppmTOC = 7 ± 2%U/TOC = 3 ± 2
ppm U/%TOC
U < 25 ppm for more than 60% of intervals.
IIConditionally productive intervals. Differ from the intervals of Quadrant I by lower oil saturation (S1), which may be associated with partial loss of fluid during sample extraction and storage. U = 26 ± 21 ppmTOC = 5 ± 3%U/TOC = 6 ± 5
ppm U/%TOC
U < 20 ppm for more than 50% of intervals. Phosphorite intervals.
IIIOil-saturated source rocks with high potential for HC production using thermal EOR, promoting the conversion of kerogen and high-viscosity hydrocarbons into mobile hydrocarbons. The closer the point is to the upright position, the more promising the interval is under thermal treatment.U = 46 ± 17 ppmTOC = 13 ± 4%U/TOC = 4 ± 1
ppm U/%TOC
20 < U < 60 ppm for the 75% of intervals.
IVIntervals with decreased oil saturation, and moderate potential for HC production using thermal EOR. U = 46 ± 22 ppmTOC = 12 ± 3%U/TOC = 4 ± 2
ppm U/%TOC
20 < U < 60 ppm for the ≈60% of intervals.
Publisher’s Note: MDPI stays neutral with regard to jurisdictional claims in published maps and institutional affiliations.

