Article

Petrogenesis, Sources, and Tectonic Settings of Triassic Volcanic Rocks in the Ela Mountain Area of the East Kunlun Orogen: Insights from Geochronology, Geochemistry and Hf Isotopic Compositions

1
College of Earth Sciences, Jilin University, Changchun 130061, China
2
Jilin Institute of Geological Sciences, Changchun 130021, China
*
Author to whom correspondence should be addressed.
Minerals 2022, 12(9), 1085; https://doi.org/10.3390/min12091085
Submission received: 21 July 2022 / Revised: 24 August 2022 / Accepted: 24 August 2022 / Published: 27 August 2022
(This article belongs to the Special Issue Isotopic Tracers of Mantle and Magma Evolution)

Abstract

:
The Ela Mountain area is located at the easternmost point of the East Kunlun Orogen, in which voluminous igneous rocks developed in the Triassic period, and it is a good place to investigate the tectonic evolution of the Paleo-Tethys Ocean. In this study, petrological, geochemical, zircon U-Pb geochronology and zircon Hf isotope studies were carried out on the volcanic rocks in the Ela Mountain area. Dacite (239.3 ± 1.4 Ma) exhibits calc-alkaline I-type characteristics, and rhyolite (237.8 ± 2.1 Ma) is similar to high-K calc-alkaline highly fractionated I-type volcanic rock. The petrogenesis shows that both rhyolite and dacite originated from the partial melting of the mafic lower crust of the Mesoproterozoic under relatively high temperature and low pressure. Dacite and rhyolite were derived from the same or similar parent magma, and they are volcanic rocks with different differentiation degrees formed in the same magmatic pulse activity. Differing from rhyolite and dacite, basaltic andesite shows a relatively young age (234 ± 1.2 Ma), mainly originating from the partial melting of the lithospheric mantle modified by subducted slab-derived fluids; the magma was contaminated with a small amount of crustal source components and experienced the fractional crystallization of mafic minerals before the eruption to the surface. This study on the tectonic environment of these volcanic rocks shows that they were formed in the environment of slab failure in the late stage of syn-collision, and that they are different types of volcanic rocks from different sources under similar tectonic environments. The volcanic rocks of the Ela Mountain area in this contribution provide important evidence for Middle Triassic to Late Triassic syn-collisional magmatism in the slab failure stages. The results of this study constrain the lower age limit of the closure of the Paleo-Tethys Ocean and the initial time of extension of the late stage of syn-collision, providing important information regarding regional tectonic evolution processes and volcanic activity history. They can be applied to regional tectonic evolution, petrology, volcanic stratigraphy and mineral deposits related to volcanic rocks.

1. Introduction

The East Kunlun Orogen is a typical composite orogenic belt, with a large amount of information related to the evolution of the Proto-Tethys Ocean and the Paleo-Tethys Ocean, which has experienced multiple complex tectonic collage processes. Its complex geodynamic evolution, tectono-magmatic activity, and multi-stage marginal orogeny and collisional orogeny, with huge potential for mineral resources, have attracted great attention in the geological community, and many related research works have been carried out. In recent years, more and more magmatic activities related to the subduction of the Paleo-Tethys Ocean have been identified in the East Kunlun Orogen, such as 264 Ma Jialuhe Syenogranite [1]; 259 Ma Wulonggou granodiorite [2]; 252 Ma Jiamuge’er rhyolite porphyry [3]; 251 Ma Xiangjiananshan granodiorite [4]; 248 Ma Nuomuhong quartz diorite [5]; 247 Ma Wutuo monzogranite [6], etc. However, the closure time of the Paleo-Tethys Ocean is still controversial. The difficulty lies in the fact that unlike the Himalaya Orogen, which has developed voluminous syn-collisional S-type granitic rocks, the East Kunlun Orogen is a marginal accretion orogenic belt formed by the subduction of the Paleo-Tethys Ocean to the north during the Late Paleozoic to the Mesozoic [7], which does not develop extensive syn-collisional S-type granitic rocks, so the syn-collisional process is relatively difficult to identify. During the Late Triassic, the mafic dikes with intraplate basalt characteristics [8,9] and extension-related A-type granites [10,11] appeared simultaneously, reflecting the extensional tectonic setting of post-collision. These previous achievements basically clarify the respective dynamic evolution background of the Early Triassic and Late Triassic in the East Kunlun Orogen, but there is great controversy about the formation environment of igneous rocks in the Middle Triassic–early Late Triassic in the East Kunlun Orogen, including post-collision [12,13], syn-collision [14,15,16], and subduction [17,18,19]. In addition, the Ela Mountain area is located at the easternmost point of the East Kunlun Orogen, which is the junction between the East Kunlun Orogen and the West Qinling Orogen. This area is located in remote areas with a low degree of geological work. The previous geochronology and geological isotope data are not sufficient. In addition, compared with the Triassic intrusive rocks in the East Kunlun Orogen, the contemporaneous volcanic rocks in the sedimentary basins are rarely studied, and the existing research is mainly concentrated on the volcanic rocks of a part of the Elashan Formation in the Late Triassic widely developed in the East Kunlun Orogen [10,11], but there are few reports on the Middle Triassic volcanic rocks, which hinders our understanding of the regional tectonic evolution and volcanic activity from the Middle Triassic to the early Late Triassic in the East Kunlun Orogen. Based on the above questions, we provide the geochronology, geochemistry and Hf isotope data of different types of volcanic rocks in the Ela Mountain area from the Middle Triassic to the early Late Triassic, and discuss the petrogenesis, source, tectonic setting, and geological significance of these volcanic rocks, constraining the closure time of the Paleo-Tethys Ocean in the East Kunlun Orogen. By collecting data and comparing them with previous data, we summarize and refine the tectonic evolution of the East Kunlun Orogen in the Triassic. This study provides important information for the regional tectonic evolution process, volcanic eruption sequence, and volcanic activity history of the East Kunlun Orogen.

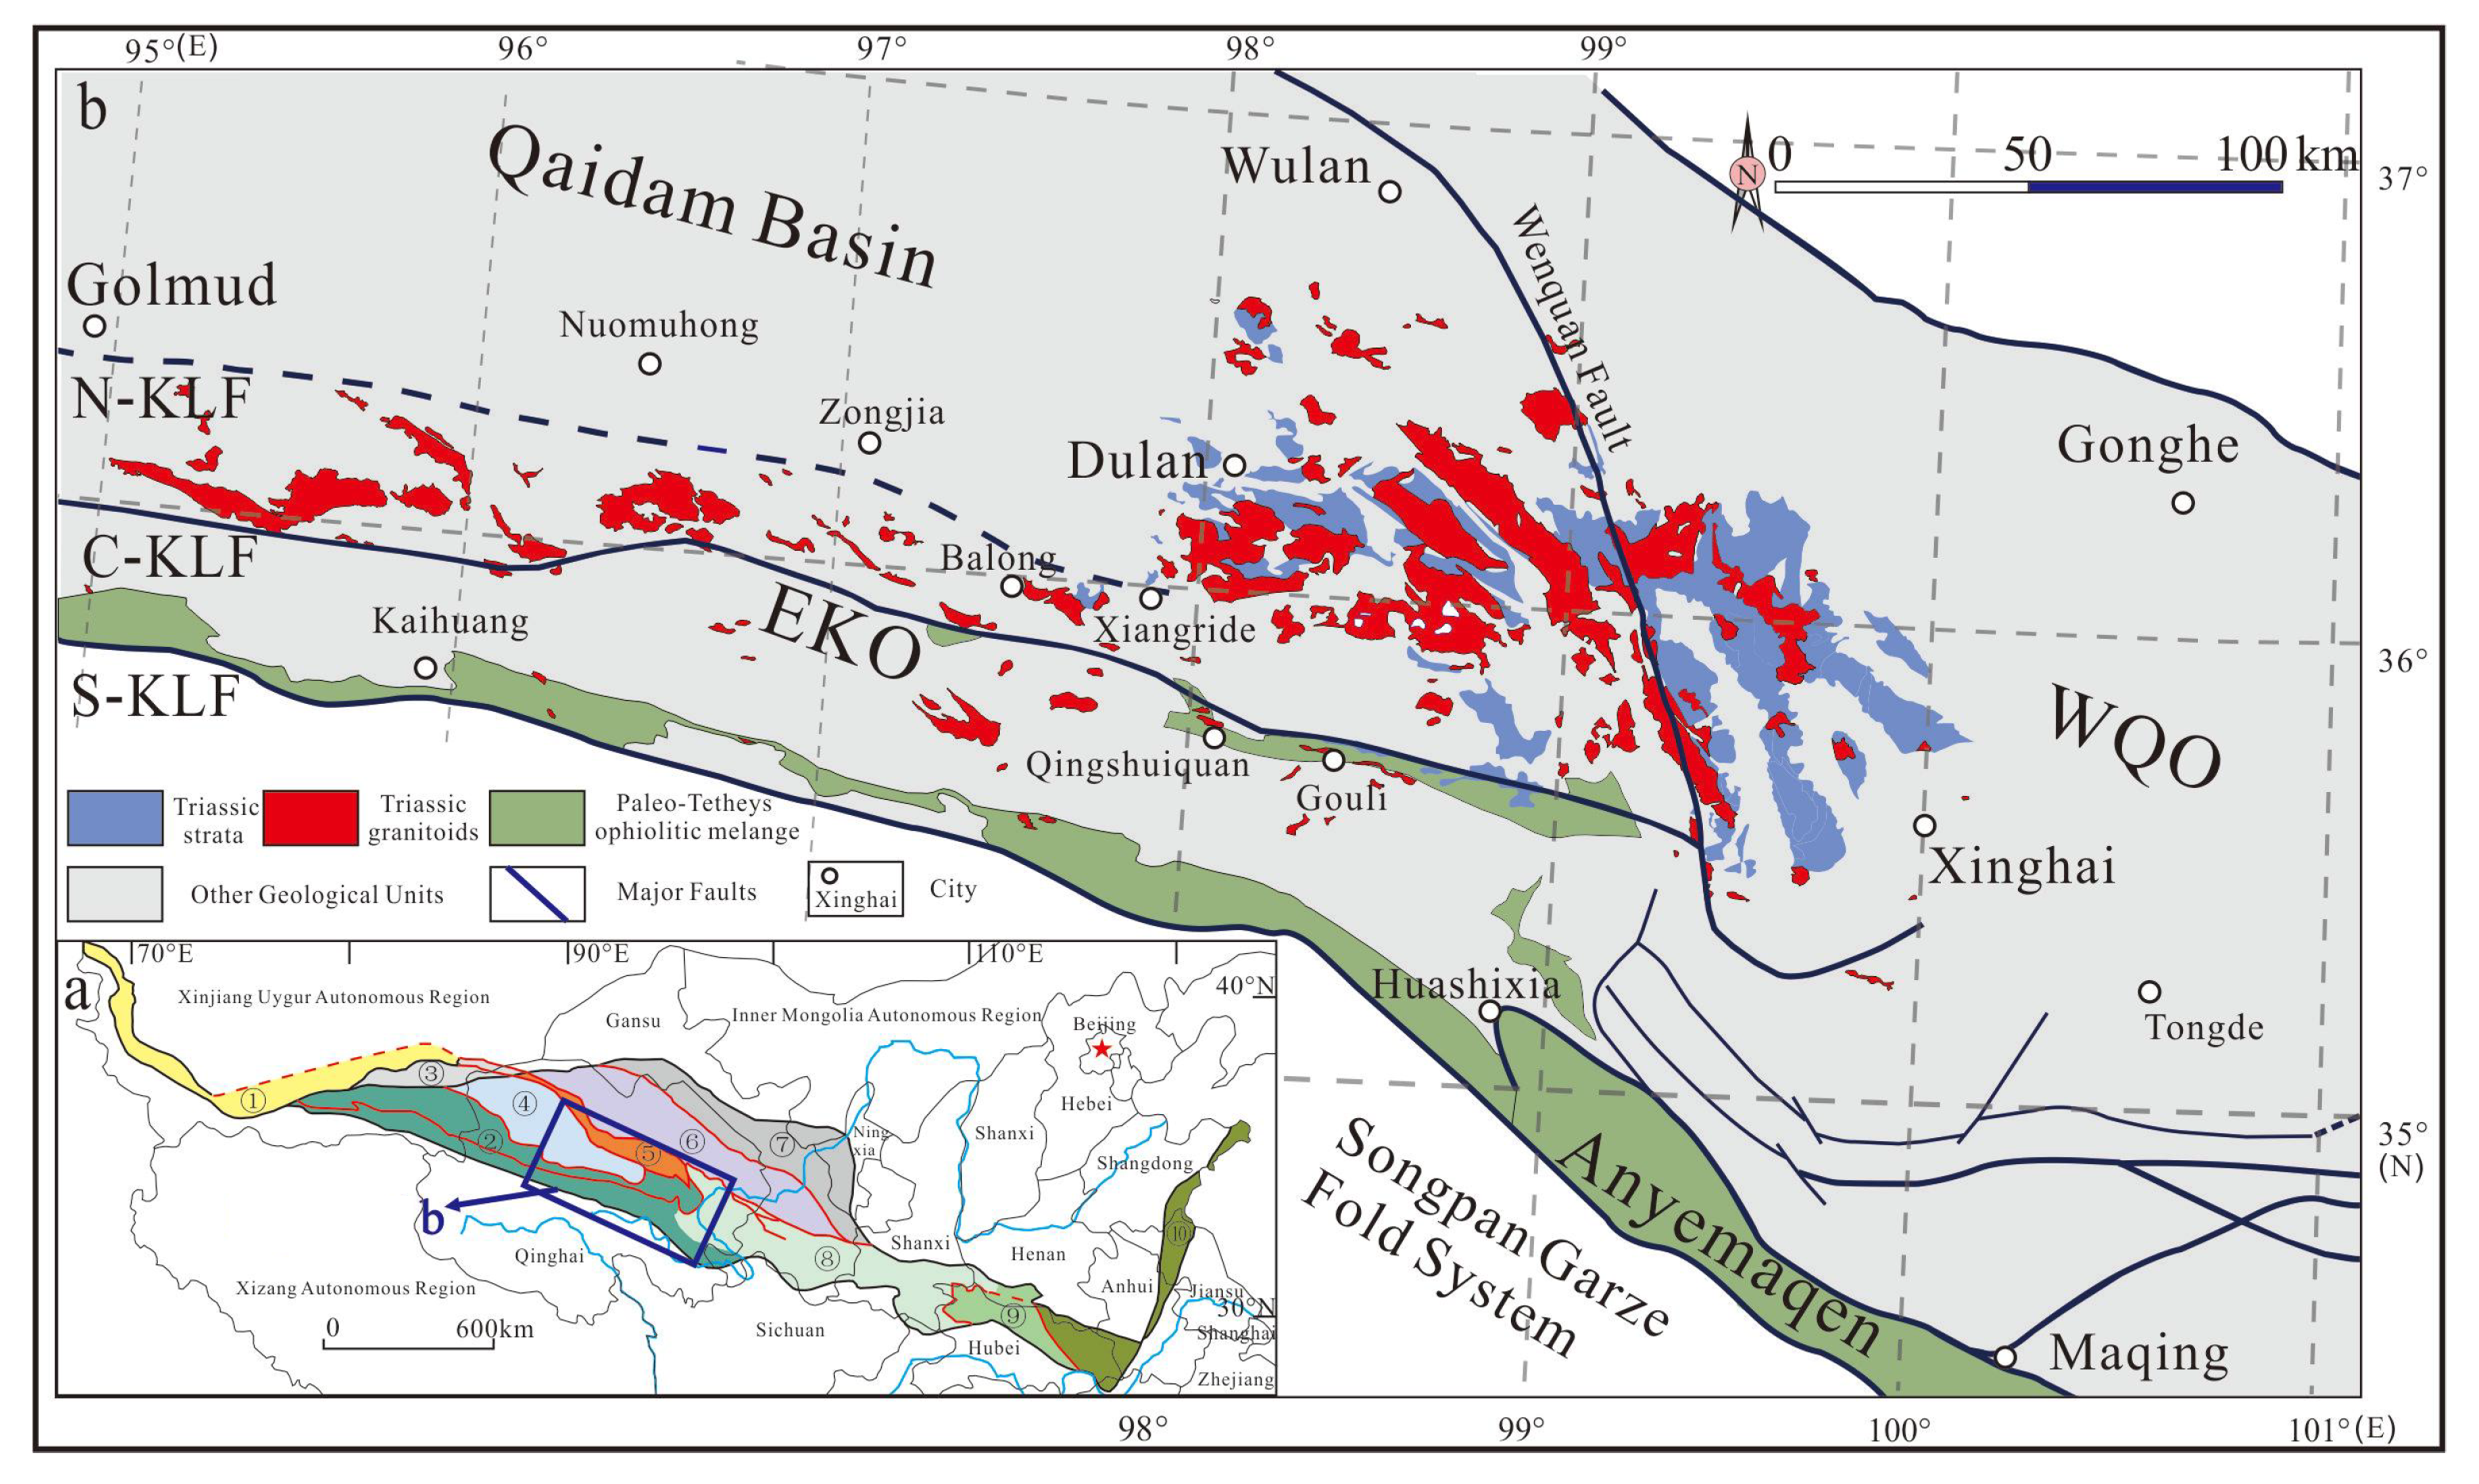
2. Geological Background

The East Kunlun Orogen is located in the northern part of the Qinghai-Tibet Plateau, which is a part of the Central Orogenic Belt in China (Figure 1a). It is located in the southern margin of the Qaidam Basin, north of the Bayanhar–Songpan–Garze Fold System, connected to the West Qinling Orogen in the east, and separated from the Western Kunlun Orogen by the Altun Fault. According to the major faults of the North Kunlun Fault, Middle Kunlun Fault, and South Kunlun as well as the Aynemaqen Fault, the East Kunlun Orogen is divided into different tectonic units from north to south: the Northern Kunlun Caledonian back-arc rift valley belt, the central Kunlun basement uplift granite belt and the Southern Kunlun compound margin belt [7].
The study area is located in the Ela Mountain area east of the Wenquan Fault, which is the easternmost part of the East Kunlun Orogen (Figure 1b). The NW-trending Wenquan Fault plays a significant role in controlling the intrusive rocks, volcanic rocks, stratigraphic deposition and polymetallic deposits in the study area (Figure 2). Precambrian strata are sporadically exposed in the Ela Mountain area, namely the Jinshuikou group, which is the metamorphic crystalline basement in the East Kunlun Orogen. It is divided into the Baishahe Formation and the Xiaomiao Formation from bottom to top, with ages from the Paleoproterozoic to the Mesoproterozoic. The Triassic strata are widely exposed, including the Early Triassic Hongshuichuan Formation, the Early–Middle Naocangjiangou Formation, the Middle Triassic Xilikete Formation and the Late Triassic Elashan Formation. The intrusive rocks and volcanic rocks in the area were mostly developed in the Triassic, and the distribution direction is also NW-oriented. The lithology combination of intrusive rocks is mainly granodiorite, monzogranite and syenogranite, with a small amount of diorite and quartz diorite. Volcanic rocks are widely distributed, including basaltic andesite, andesite, rhyolite, dacite and pyroclastic rocks, mainly in the strata of the Naocangjiangou Formation and the Elashan Formation.

3. Materials and Methods

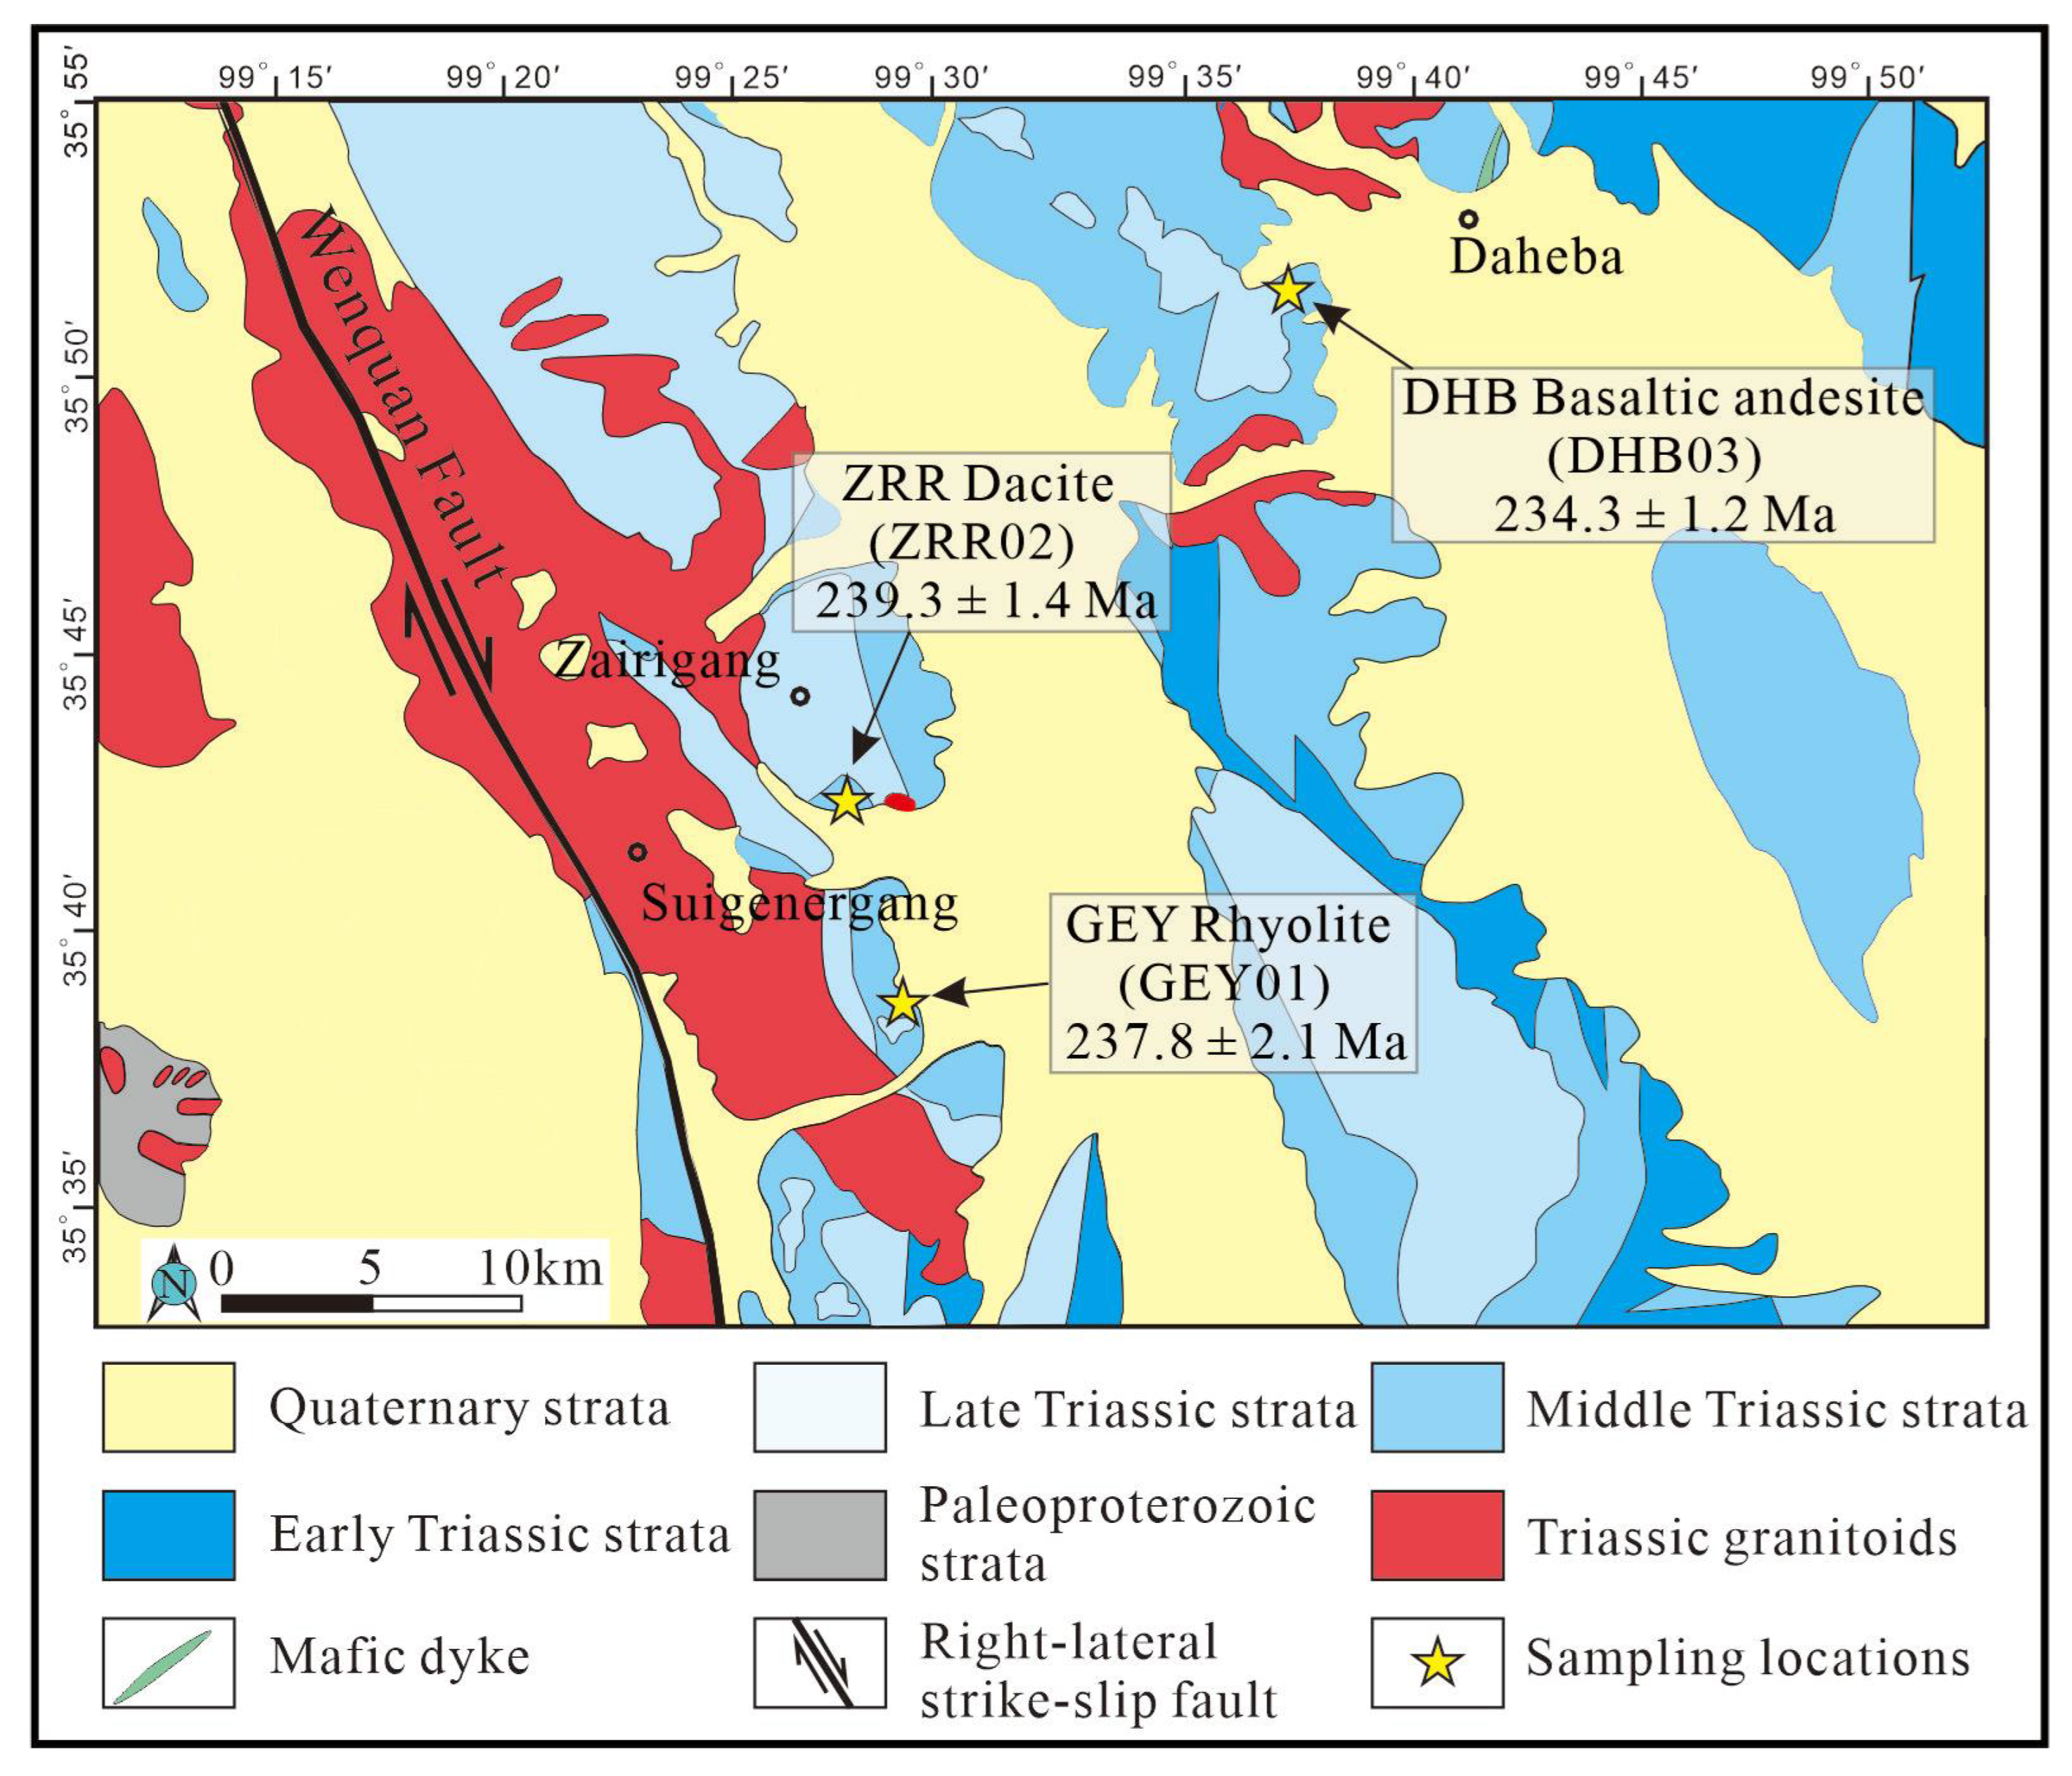
3.1. Sampling and Petrography

Based on field investigations, we collected ZRR dacite (ZRR02), GEY rhyolite (GEY01) and DHB basaltic andesite (DHB03) for petrography, zircon geochronology, zircon Hf isotope analysis, and major oxides as well as trace elements analyses of whole rocks. The sampling positions are shown in Figure 2, and the petrographic characteristics of the different volcanic rocks are described as follows:
ZRR dacite (ZRR02): The samples were collected in the Zairirigou polymetallic mining area, with the coordinates of 35°42′10″ N, 99°27′20″ E (Figure 2). The fresh surfaces of the rocks are grey, with a porphyritic texture and a massive structure (Figure 3a). The porphyritic minerals’ content accounts for about 40 vol.%, mainly plagioclase. A small amount of quartz phenocryst can be seen sporadically. The porphyritic crystal particles of plagioclase are generally between 1 and 3 mm, and are slightly epidotized as well as sericitized. The matrix content is about 60 vol.%, with a felsic-pilotaxitic texture, which is composed of microcrystalline quartz and feldspar (Figure 3b,c).
GEY rhyolite (GEY01): The samples were collected in the Ge’eryin polymetallic mining area with the coordinates of 35°38′40″ N, 99°27′57″ E (Figure 2). The fresh surface of the rhyolite is grayish white, with a porphyritic texture and a massive structure (Figure 3d). The porphyritic minerals’ content accounts for about 20 vol.%. The porphyritic minerals are mainly quartz and K-feldspar. The diameter of porphyritic grains is 0.4–2 mm, and phenocrysts are eroded. The matrix content accounts for about 80 vol.%, and is mainly composed of microcrystalline-cryptocrystalline quartz and feldspar particles (Figure 3e,f).
DHB basaltic andesite (DHB03): The samples were collected about 5 km southwest of Daheba Township, with the coordinates of 35°51′33″ N, 99°37′07″ E (Figure 2). The exposed area of the basaltic andesite is small (<0.1 km2), with an unconformity contact relationship over the sandstone of the Middle Triassic Xilikete Formation. The rock is gray-black, with a porphyritic texture and a massive structure (Figure 3g). The porphyritic minerals’ content accounts for 30 vol.%, with crystal sizes from 0.2 to 2 mm (Figure 3h). The porphyritic minerals are mainly plagioclase, amphibole, and pyroxene. The matrix content accounts for about 70 vol.%, mainly composed of microcrystal plagioclase, brown volcanic glass, and microcrystal mafic minerals. Microphotographs show that quartz xenocrystals occasionally exist in basalt andesite. The quartz xenocrystal is corroded in an oval shape, surrounded by microcrystalline hornblende around the quartz xenocrystal, forming the xenocrystal reverse corona texture (Figure 3i).

3.2. Analytical Methods

3.2.1. Zircon U-Pb Dating

The fresh volcanic rock samples for zircon analyses were collected from natural outcrops. After mechanical crushing, gravity separation, magnetic separation, and gravity liquid separation, single-mineral zircon crystals were finally selected under a binocular microscope. The well-crystallized zircons were selected for target making, and transmittance-reflectance microscopy photography as well as cathodoluminescence images were completed by Hebei Hongxin Geological Exploration Technology Service Co., Ltd., Langfang, China. The content of trace elements in zircon and U-Pb isotopic dating was analyzed by LA–ICP–MS at Yanduzhongshi Geological Analysis Laboratory Ltd., Beijing, China. The laser ablation system was a New Wave UP213; the ICP–MS was a Brook M90. In this test, the diameter of the ablation spot is 30 μm. In the process of laser ablation, He gas was used as the carrier gas of the ablation material, and argon was used as the compensation gas to adjust the sensitivity. They were mixed by a homogenizer before entering ICP. Each sample point resolution included about 20–30 s of a blank signal and 50 s of a sample signal. Zircon standard 91,500 and Plesovice were used as external standards for isotope fractionation correction in U-Pb isotope dating. Both standard sample 91,500 and Plesovice coincide with the values recommended [22]. The trace element content of zircon was quantitatively calculated using SRM610 as the external standard and Si as the internal standard.
Andersen’s [23] method was used to correct the isotope ratio, and the error between the isotope ratio and the age measured at a single point was 1σ. The isotope ratios of samples were calculated using ZSkits data processing software (ZSkits 1.1.0, Yanduzhongshi Geological Analysis Laboratory Ltd., Beijing, China), and the plotting of a U-Pb age concordia diagram in addition to the calculation of weighted average age were performed using Isoplot software [24]. The zircon U-Pb data of the volcanic rocks in this study are listed in Table 1.

3.2.2. Whole-Rock Major and Trace Element Analyses

The whole-rock major and trace element analyses for the volcanic rocks were carried out at Yanduzhongshi Geological Analysis Laboratory Ltd., Beijing, China. The samples of the fresh volcanic rocks collected in the field were coarsely crushed to centimeter–millimeter blocks by a jaw crusher. The artificially selected non-altered samples were washed with purified water, dried and crushed to a 200 mesh powder by a ball mill for testing. The main elements were analyzed by wavelength dispersion X-ray fluorescence spectrometry. Firstly, the powder sample was weighed and mixed with Li2B4O7 (1:8) flux, and then heated to 1150 °C by a melting prototype to make it melt into a uniform glass plate in a platinum crucible. The standard material covering the element content range of the sample was selected to prepare the melting plate according to the above method. The fluorescence intensity of the element analysis line of the standard material was measured, and the regression analysis was carried out by a mathematical correction model. The fluorescence intensity of unknown samples was measured, and the element content was calculated by substituting the regression equation. Standard curves were obtained by using rock composition analyses of GSR series rock standard materials (GSR-2 and GSR-11). The error of the test results was less than 1%. The trace elements were analyzed by inductively coupled plasma mass spectrometry (ICP–MS, M90, analytic jena, Beijing, China). For the trace element test, 0.1000 g of the 200 mesh powder sample was accurately weighed and placed in a polytetrafluoro crucible, with 1 mL of HF and 3 mL of HNO3 added. The crucible was placed on an electric heating plate at 190 °C for 72 h, heated and evaporated to dryness. The 20% HNO3 extract was added and diluted to 25 mL in a plastic colorimetric tube. The solution was diluted with secondary water and diluted to 25 mL and shaken well, and the solution was directly used for ICP–MS determination. According to the monitoring standard samples, GSR-2 and GSR-11, the error of all of the test data was less than 5%, and the analysis error of some extremely low-content elements and volatile elements was less than 10%. The whole-rock major and trace element data of the volcanic rocks in this study are listed in Table 2.

3.2.3. Zircon In Situ Lu-Hf Isotopic Analyses

The in situ Hf isotope ratio analysis of zircon was completed by Wuhan Sample Solution Analytical Technology Co., Ltd., Hubei, China. The test method was an LA–MC–ICP–MS analysis. The laser ablation system was a Geolas HD (Coherent, Germany), and the MC–ICP–MS system was a Neptune Plus (Thermo Fisher Scientific, Bremen, Germany). A “wire” signal smoothing device was included in this laser ablation system, by which smooth signals were produced even at very low laser repetition rates down to 1 Hz [29]. Helium was used as a carrier gas in the laser ablation process, and a small amount of nitrogen was introduced to improve the sensitivity of the Hf element [30]. The analysis uses a Neptune Plus high-performance cone combination. The actual laser output energy density is 7.0 J/cm2, and the single-point erosion mode is adopted. The erosion diameter of the experimental test point is 44 μm. Detailed instrument operating conditions and analytical methods can be found in [30]. 179Hf/177Hf = 0.7325 and 173Yb/171Yb = 1.132685 [31] were used to calculate the mass fractionation coefficients of βHf and βYb. We used 176Yb/173Yb = 0.79639 [31] to deduct the same amount of ectopic interference of 176Yb to 176Hf. 176Lu/175Lu = 0.02656 [32] was used to deduct the same amount of ectopic interference of 176Lu with a relatively small interference degree on 176Hf. The standard sample Plešovice was used for external calibration to further optimize the analysis test results. The standard samples 91,500 and GJ-1 were used as the second standard samples to monitor the data correction quality. The analysis data were processed by ICPMSDataCal software [33]. The internationally used high-Yb/Hf-ratio standard sample Temora 2 was used to monitor the test data of the high-Yb/Hf-ratio zircon. The Hf isotopic compositions of Plešovice, 91,500, and GJ-1 have been reported by [34]. The zircon Hf isotopic data for the volcanic rocks in this study are listed in Table 3.

4. Results

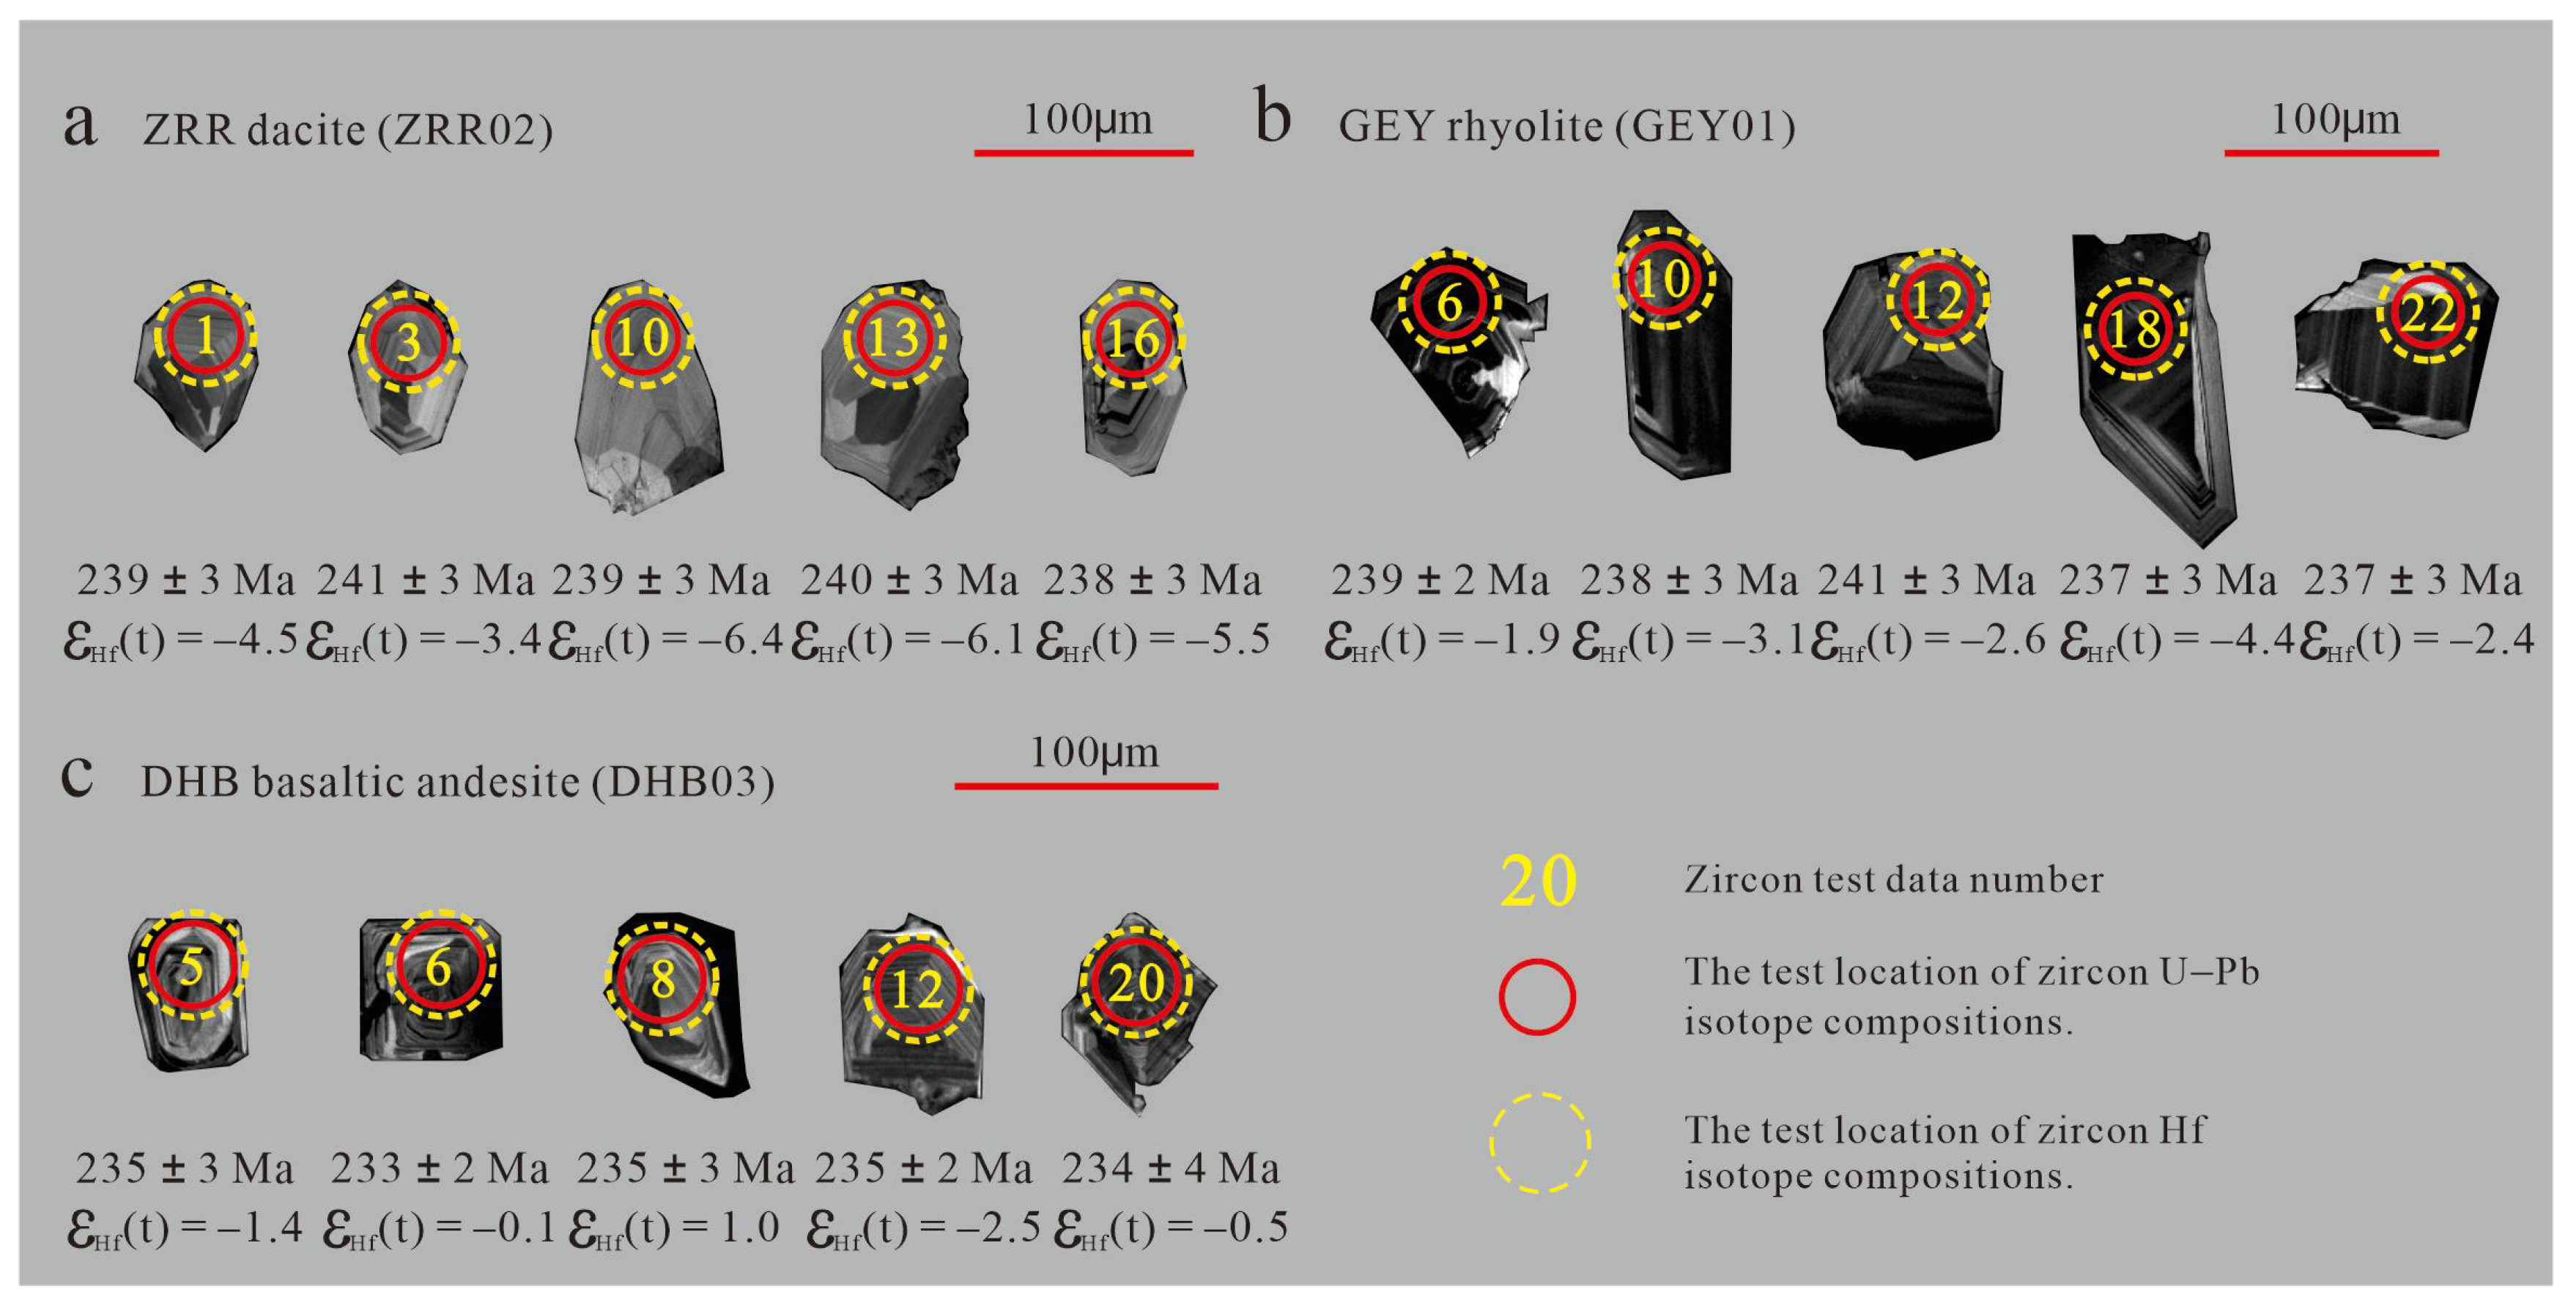
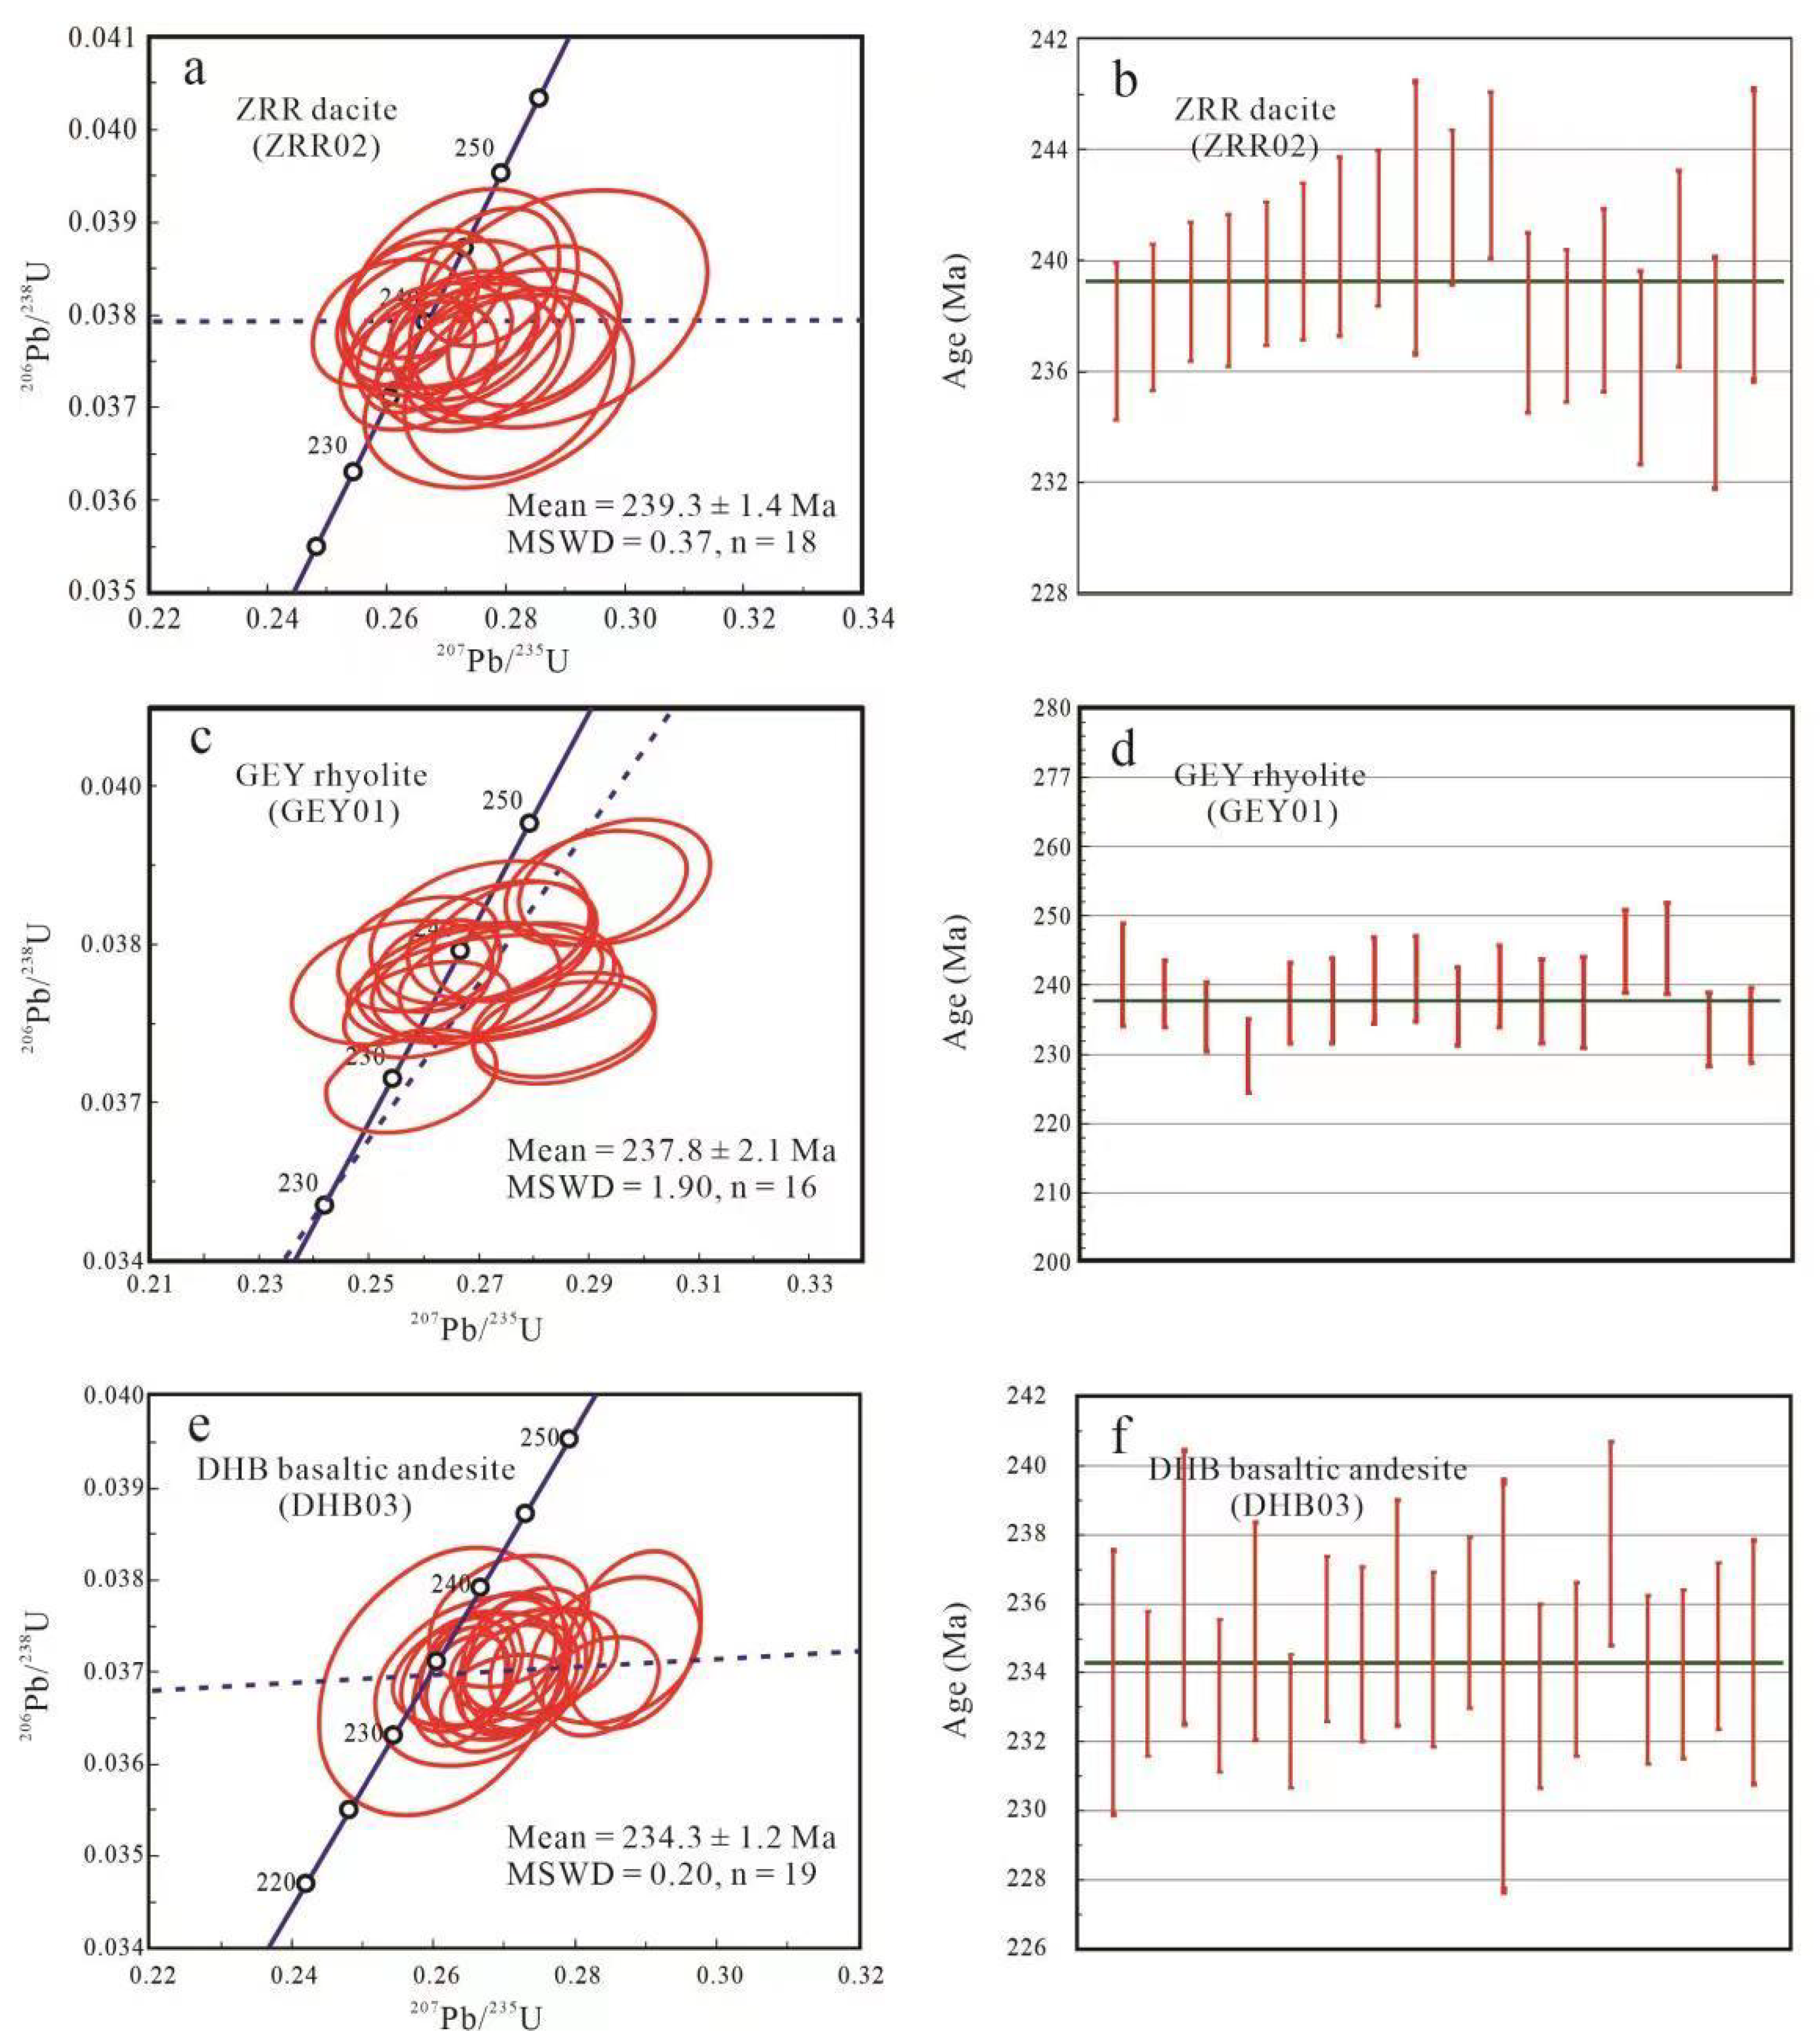
4.1. Ages of Zircon U-Pb Dating

In this contribution, the samples of ZRR dacite (ZRR01), GEY rhyolite (GEY01) and DHB basaltic andesite (DHB03) were selected for LA–ICP–MS zircon U-Pb dating. The representative cathodoluminescence images are shown in Figure 4. The zircons of all of the samples are euhedral crystals to subhedral crystals, with clear oscillatory zoning and high Th/U ratios (0.33–1.41), which are typical magmatic zircons [37].
The zircons of the ZRR dacite samples (ZRR02) were short and columnar, with crystal sizes of 60–100 µm (Figure 4a). Twenty analysis points of the zircon have contents of Th and U of 33.32–187.32 ppm and 58.88–207.35 ppm, respectively, with Th/U values of 0.57–1.22. Except for one older age analysis point and one discordant analysis point, the weighted average age of the eighteen points was 239.3 ± 1.4 Ma (MSWD = 0.37), representing the crystallization age of the dacite (Figure 5a,b).
The zircons of the GEY rhyolite samples (GEY01) were long and columnar, with crystal sizes of 80–120 µm (Figure 4b). Twenty-six analysis points of the zircon have contents of Th and U of 42.24–745.68 ppm and 104.74–530.48 ppm, respectively, with Th/U values of 0.33–1.41. Except for six spots that were discordant and four spots that displayed an older age, the weighted average age of the sixteen points was 239.3 ± 1.4 Ma (MSWD = 0.37), representing the crystallization age of the rhyolite (Figure 5c,d).
The zircons of the DHB basaltic andesite samples (DHB03) were short and columnar, with crystal sizes of 50–80 µm (Figure 4c). Twenty analysis points of the zircon have contents of Th and U of 97.87–1042.23 ppm and 210.24–1209.03 ppm, respectively, with Th/U values of 0.42–0.86. Except for one discordant analysis point, the weighted average age of the nineteen points was 234.3 ± 1.2 Ma (MSWD = 0.2), representing the crystallization age of the basaltic andesite (Figure 5e,f).

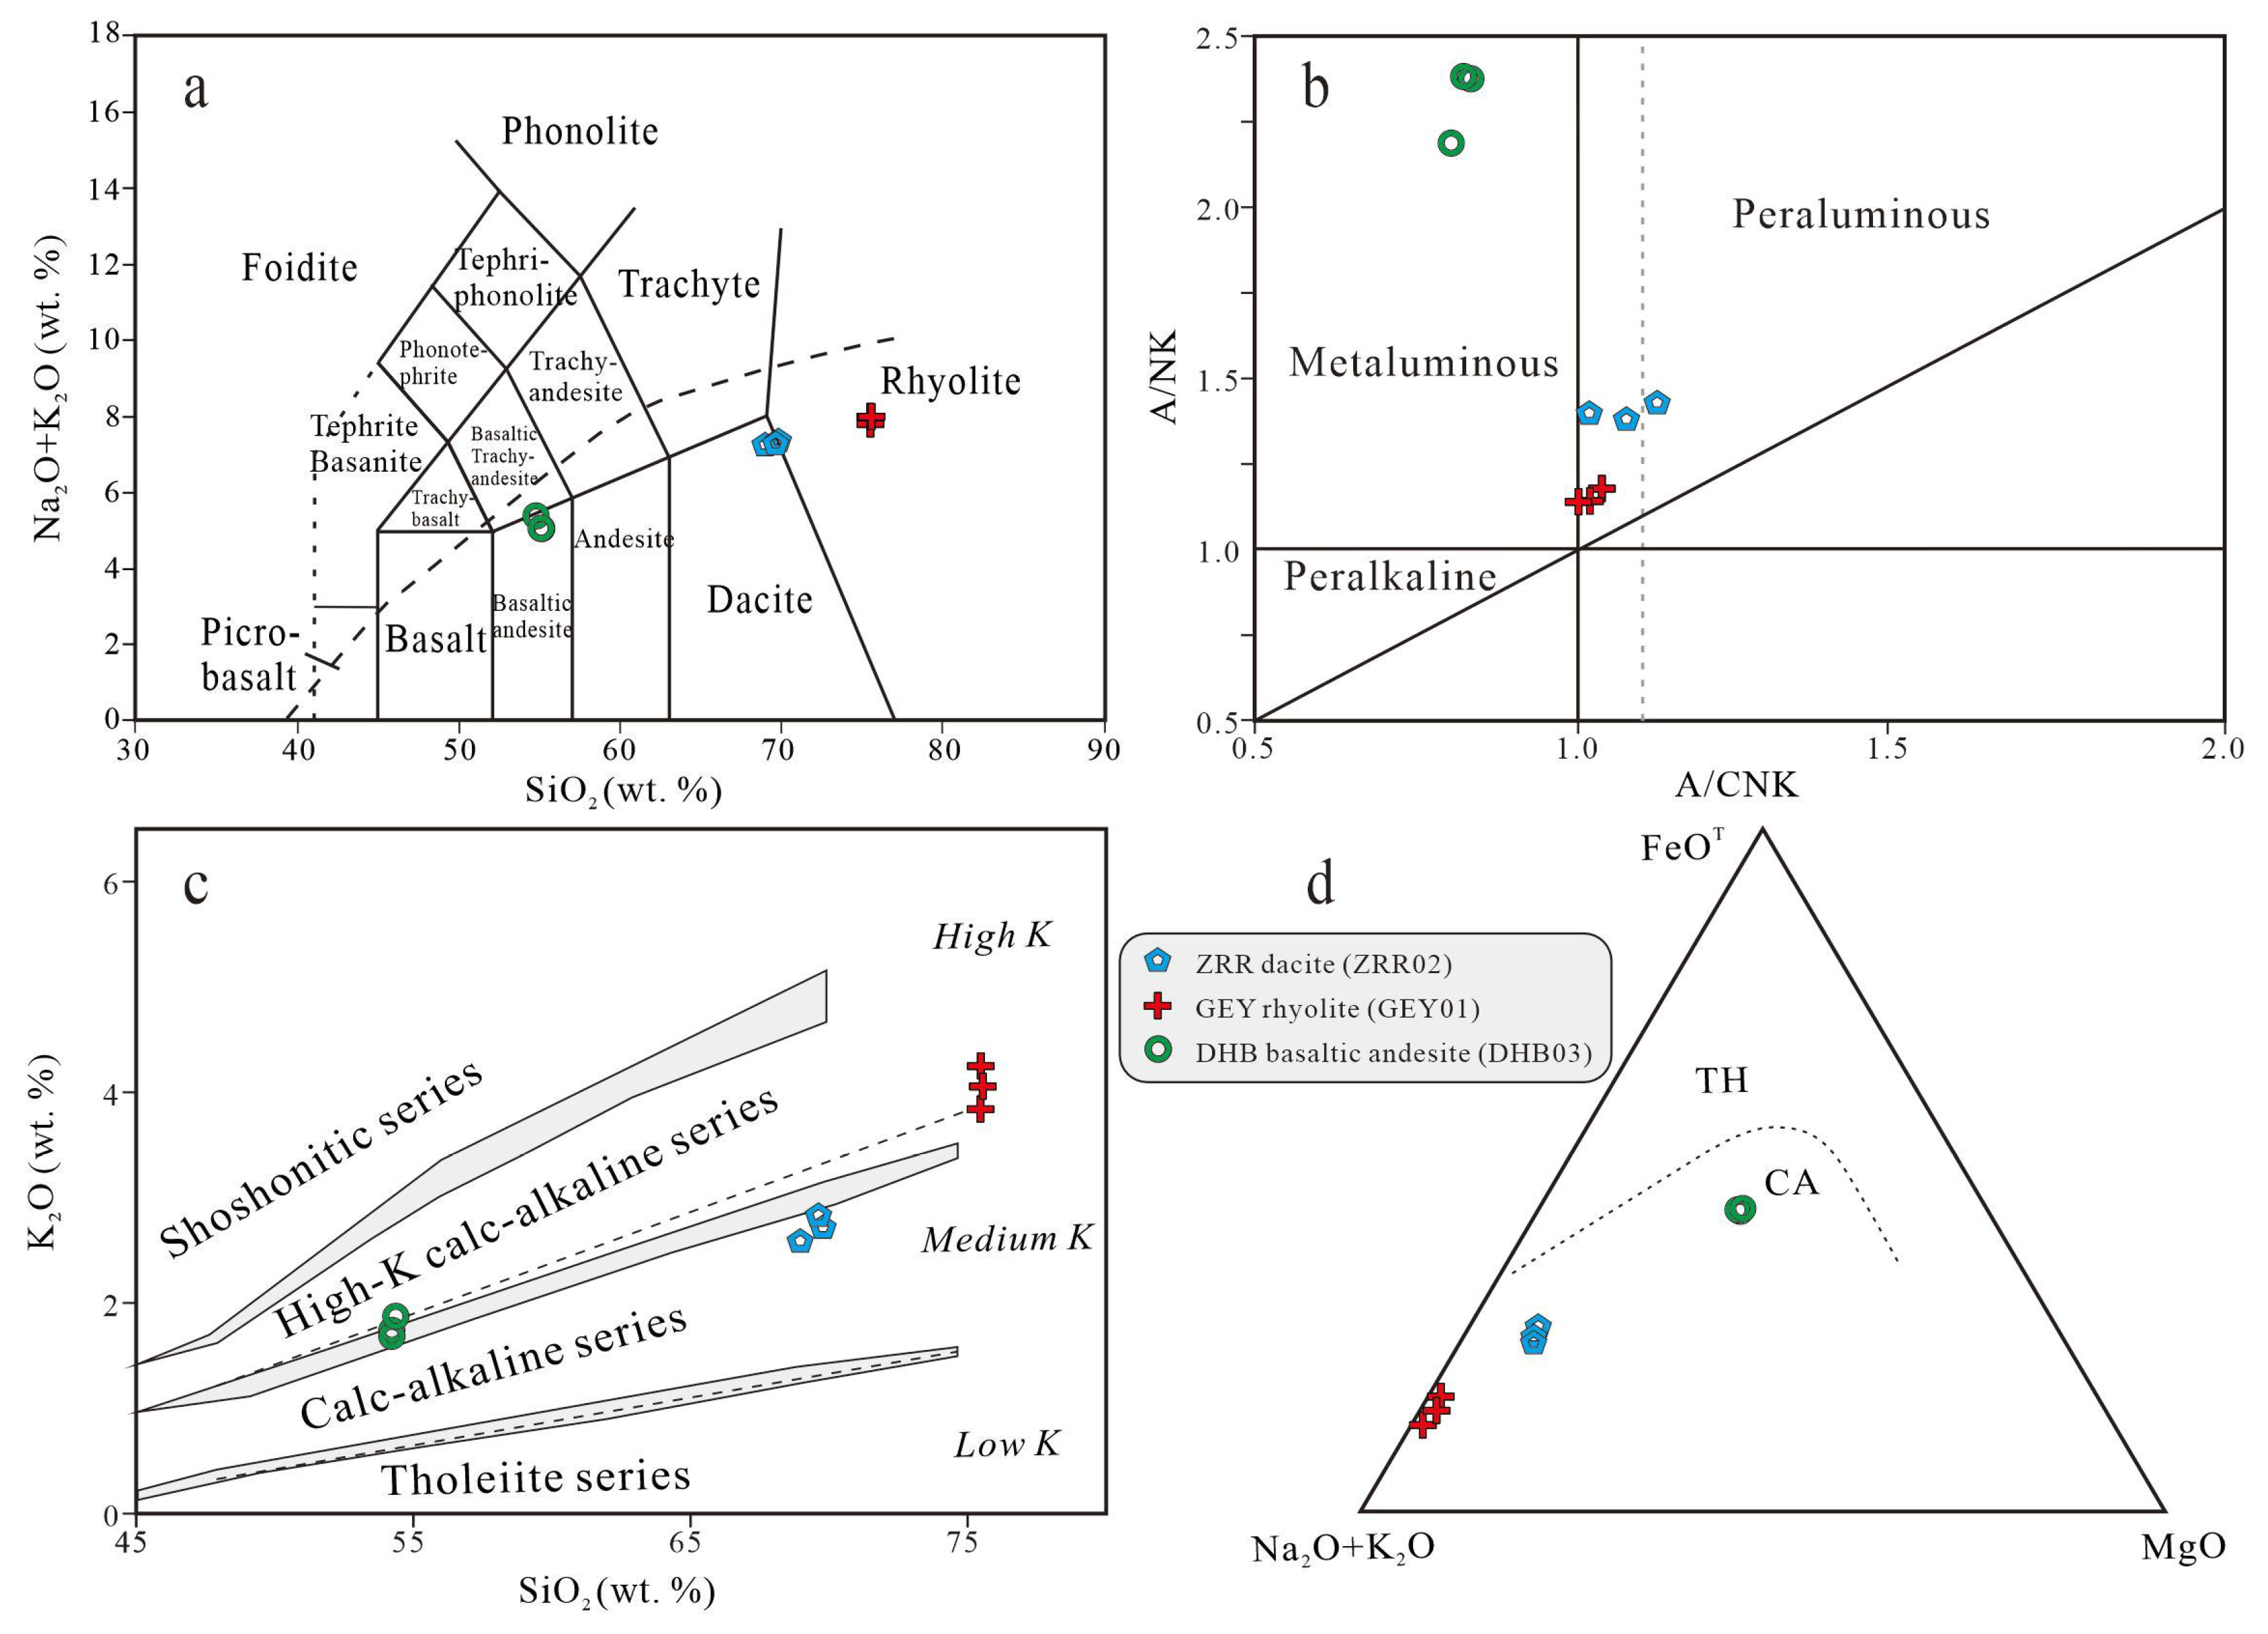
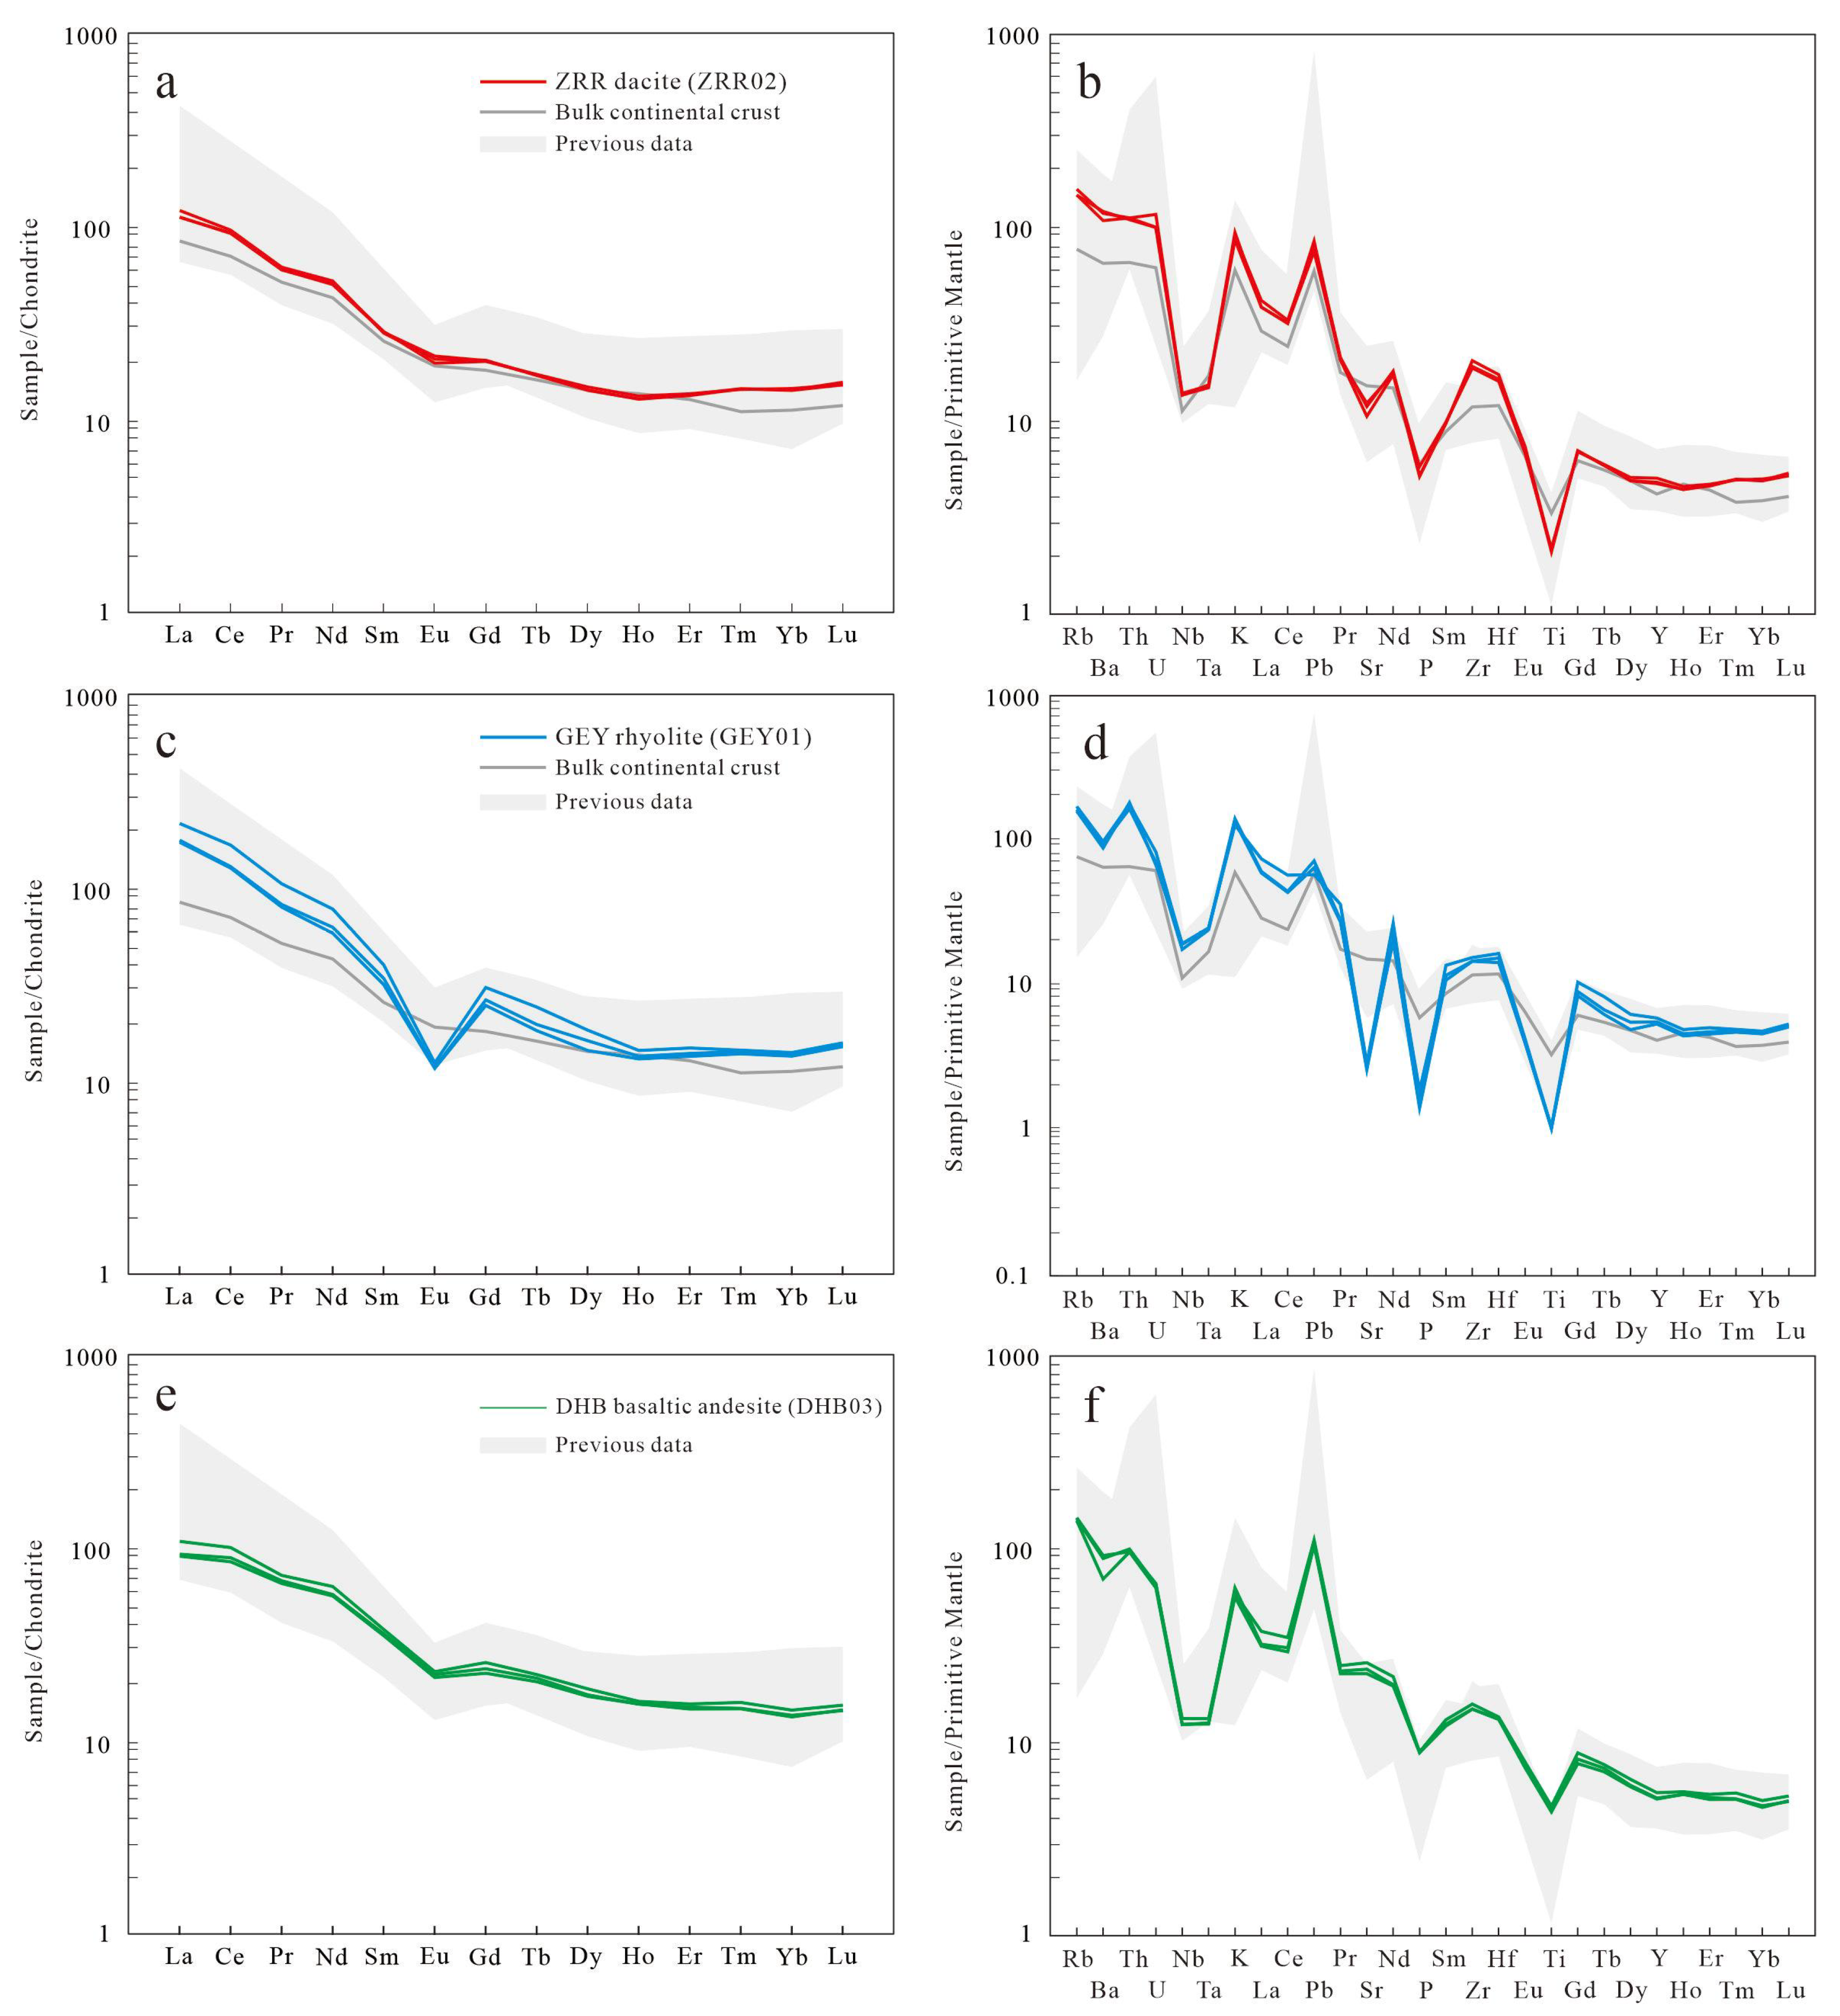
4.2. Major and Trace Element of Whole-Rock Geochemistry

In this study, the whole-rock geochemical analysis was carried out on the dated samples of ZRR dacite (ZRR02), GEY rhyolite (GEY01) and DHB basaltic andesite (DHB03). A total of nine samples (Table 2), including three samples of ZRR dacite (ZRR02-1~ZRR02-3), three samples of GEY rhyolite (GEY01-1~GEY01-3) and three samples of DHB basaltic andesite (DHB03-1~DHB03-3), were analyzed.
The samples of ZRR dacite (ZRR02-1~ZRR02-3) have contents of SiO2 of 68.96–69.78 wt.%, of Na2O of 4.45–4.67 wt.%, and of K2O of 2.59–2.84 wt.%, displaying calc-alkaline characteristics (Figure 6a,c,d). The rocks have a content of Al2O3 of 14.65–14.89 wt.%, with A/CNK ratios (molar Al2O3/(CaO + Na2O + K2O)) of 1.02–1.12, belonging to peraluminous series (Figure 6b). They have a MgO content of 0.96–1.01 wt.%, with a Mg# content of 35.67–39.56. In terms of the composition of rare-earth elements (REEs), the samples of dacite have a weak negative Eu anomaly (Eu/Eu* = 0.81–0.88), characterized by the enrichment of light rare-earth elements (LREEs) and the depletion of heavy rare-earth elements (HREEs, Figure 7a). The total content of REEs is 132.27–137.94 ppm. The LREEs and HREEs have moderate differentiation, (La/Yb)N = 7.74–8.54. In the spider diagram of trace elements, the samples show the significant enrichment of Rb, K, and Pb, the slight depletion of Ba and Sr, and the intensive depletion of Nb, Ta, P, and Ti (Figure 7b).
The samples of GEY rhyolite (GEY01-1~GEY01-3) have high contents of SiO2 (75.46–75.55 wt.%), K2O (3.84–4.25 wt.%) and Na2O (3.54–4.14 wt.%), and all of the samples are plotted into a high-K calc-alkaline series region in a K2O–SiO2 diagram (Figure 6c). They have low contents of CaO of 0.73–0.83 wt.%, of Fe2O3T of 1.31–1.79 wt.%, of P2O5 of 0.03–0.04 wt.%, of TiO2 of 0.18–0.19 wt.%, and of MgO of 0.13–0.20 wt.%, with a Mg# value of 14.24–19.82. The rocks have a content of Al2O3 of 12.29–12.54 wt.%, and display slightly peraluminous characteristics (Figure 6b), with A/CNK ratios of 1.00–1.04. In the chondrite-normalized REE diagram, samples of GEY rhyolite exhibit significant negative Eu anomalies (Eu/Eu* = 0.35–0.41), the marked enrichment of LREEs, and the depletion of HREEs (Figure 7c). The total content of REEs is 174.20–224.70 ppm. The LREEs and HREEs have high differentiation, (La/Yb)N = 12.87–15.45. In the spider diagram of the trace elements, the samples are obviously depleted in Sr, Ba, Nb, Ta, P, and Ti, and relatively enriched in Rb, Th, K, Pb, Zr and Hf (Figure 7d).
The samples of DHB basaltic andesite (DHB03-1~DHB03-3) have low SiO2 (54.79–55.15 wt.%) contents, with a Na2O content of 3.15–3.67 wt.% and a K2O content of 1.70–1.90 wt.%, plotted into calc-alkaline to high-K calc-alkaline series in a SiO2–K2O diagram (Figure 6c). The samples have a TiO2 content of 0.94–0.97 wt.%, an Fe2O3T content of 8.00–8.51 wt.%, and a CaO content of 7.41–7.53 wt.%. They exhibit a moderate MgO content of 4.12–4.30 wt.%, with a Mg# value of 50.03–50.53. The rocks are metaluminous, with A/CNK values of 0.80–0.83 (Figure 6b). In terms of the composition of REEs, the basaltic andesites exhibit slightly negative Eu anomalies (Eu/Eu* = 0.72–0.74), the marked enrichment of LREEs and the depletion of HREEs (Figure 7e). The total content of REEs is 129.02–148.67 ppm. The LREEs and HREEs have slightly differentiation, (La/Yb)N = 6.82–7.51. In the spider diagram of trace elements, the samples are obviously depleted in Nb, Ta, P, and Ti, and relatively enriched in Rb, K, and Pb (Figure 7f).

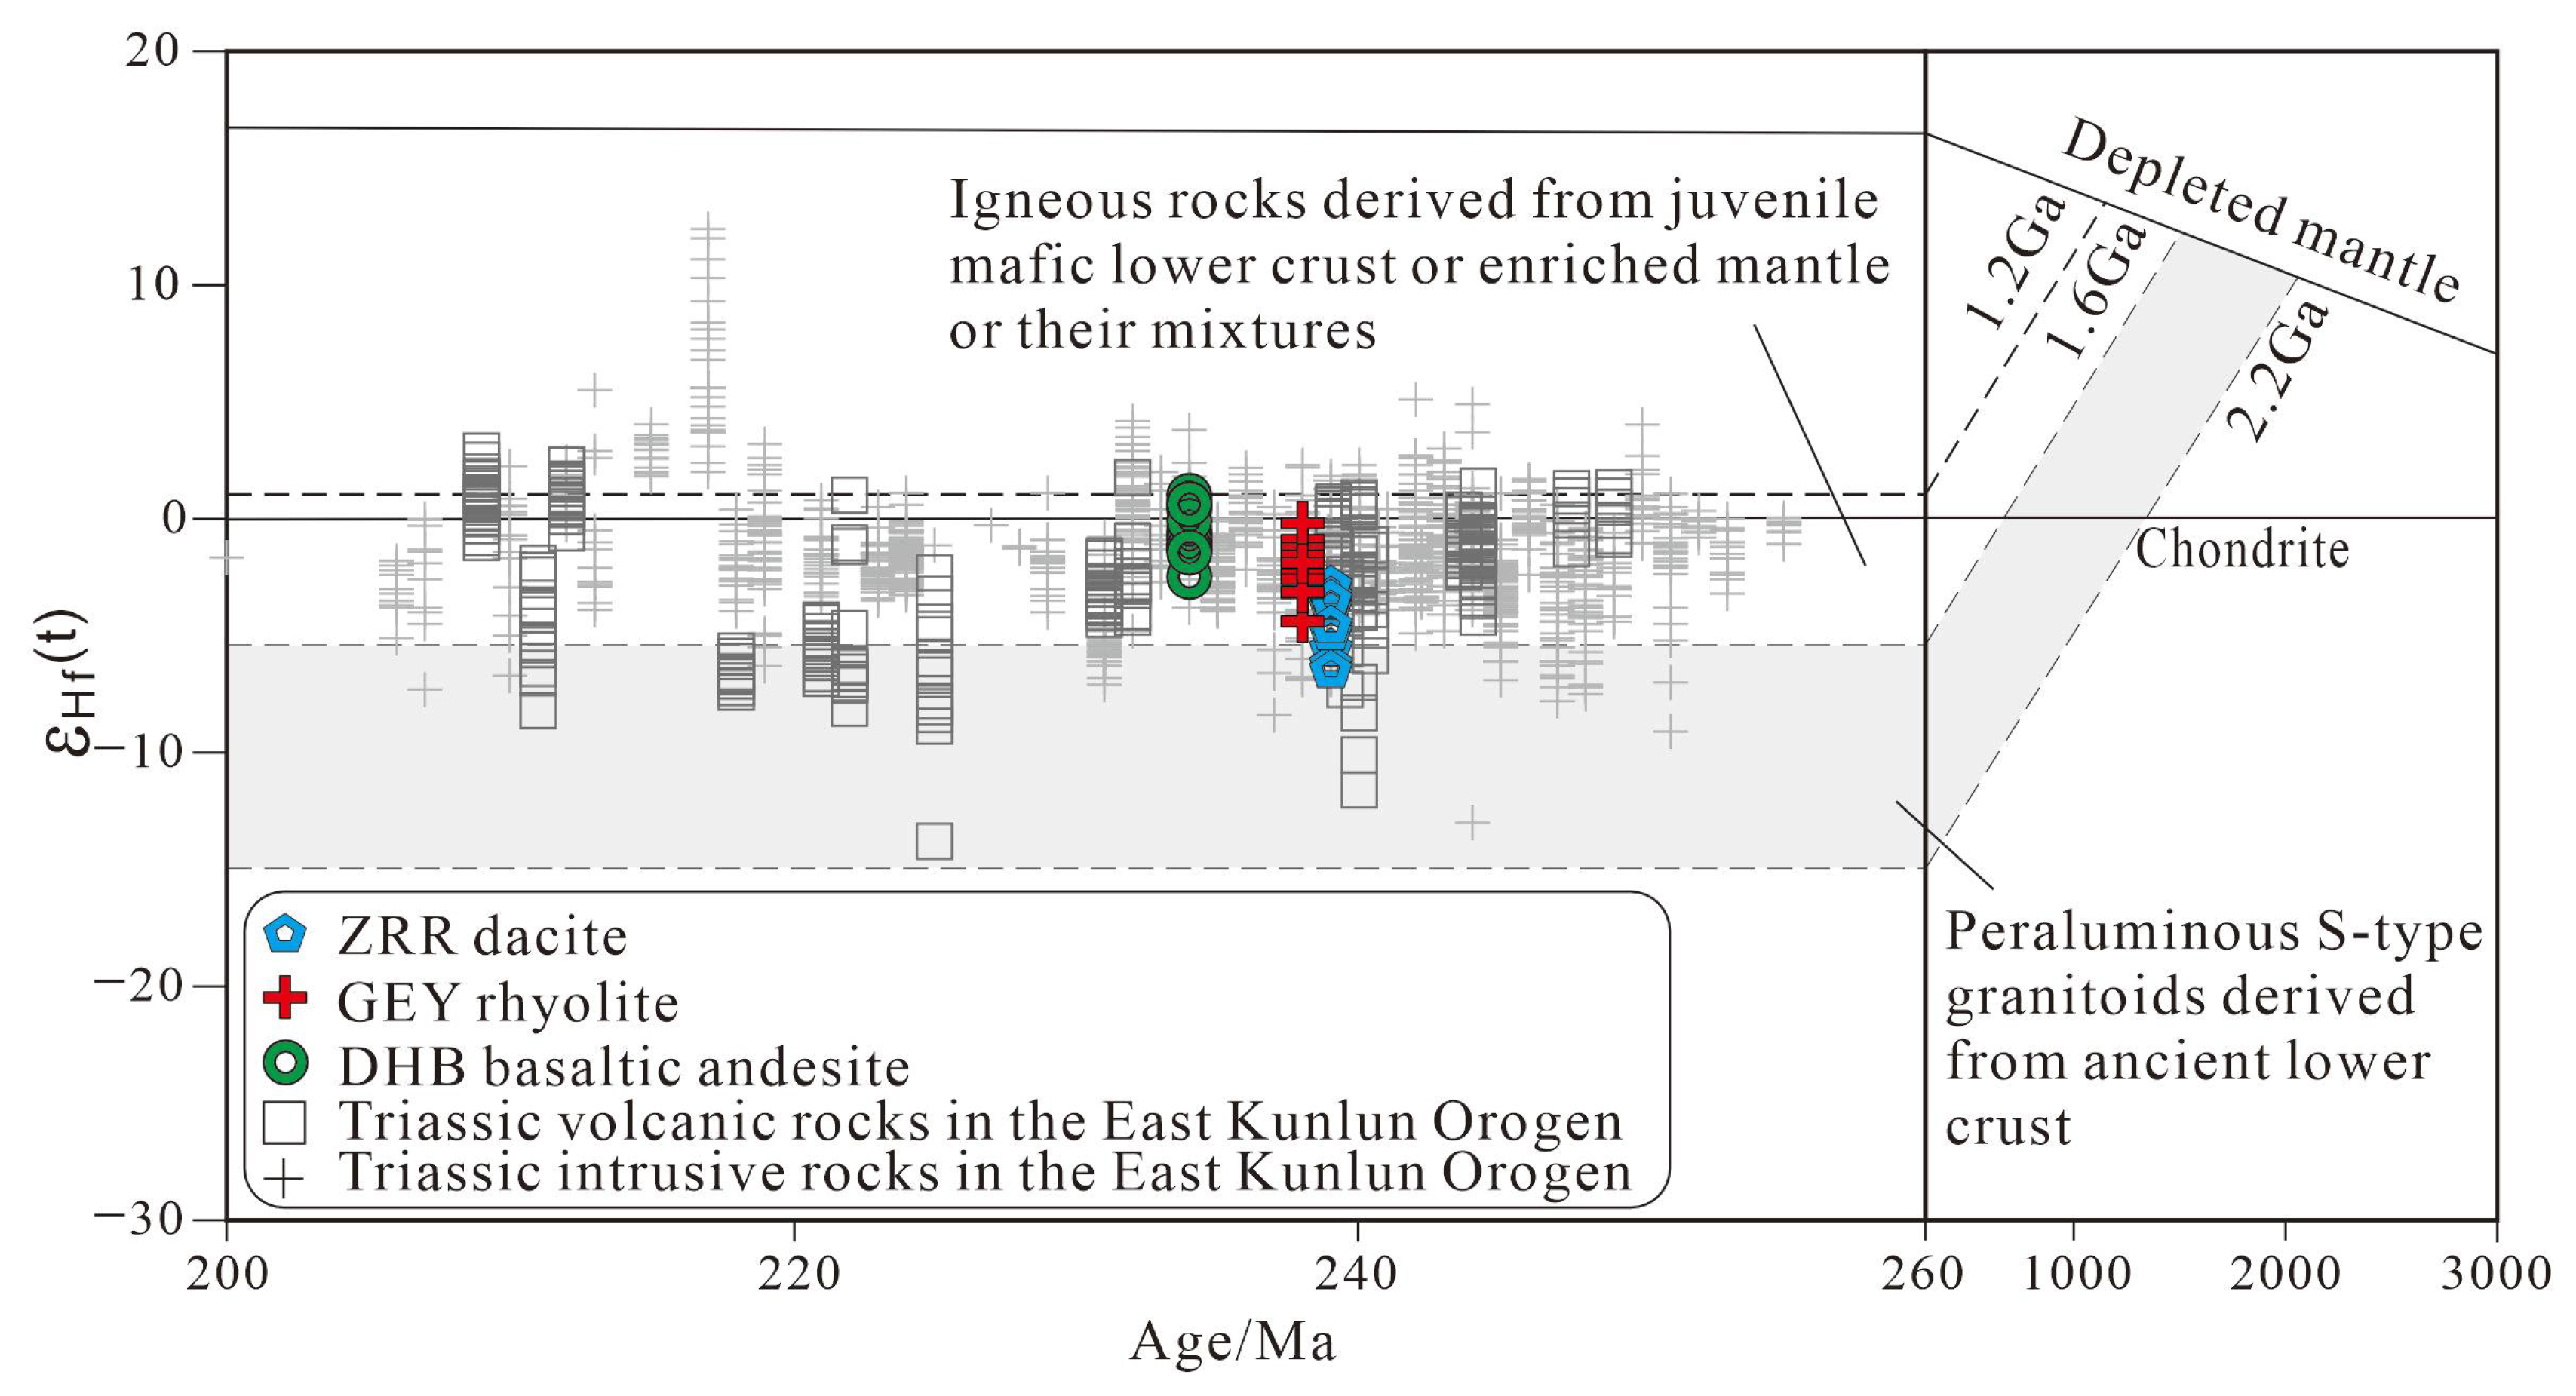
4.3. Zircon Hf Isotopic Compositions

Zircon in situ Lu-Hf isotope analytical data for the samples of ZRR dacite (ZRR02), GEY rhyolite (GEY01), and DHB basaltic andesite (DHB03) are listed in Table 3. The 176Hf/177Hf ratio of dacite zircon is 0.282451–0.282549, the εHf(t) value is from −6.4 to −2.8 (Figure 8), and the two-stage model age (TDM2) is 1673–1445 Ma. The zircons of rhyolite show 176Hf/177Hf ratios of 0.282518–0.282626, with εHf(t) values of −4.4 to −0.2 (Figure 8) and TDM2 of 1544 to 1278 Ma. The zircons of basaltic andesite have 176Hf/177Hf ratios of 0.282561–0.282662, with εHf(t) values of −2.5 to 1.0 (Figure 8) and TDM2 of 1421 to 1201 Ma.

5. Discussion

5.1. Ages and Lu-Hf Isotopic Signatures

The age data of the 239.3–234.3 Ma volcanic rocks in this contribution and previous data show that the East Kunlun Orogen experienced multistage magmatic thermal events in the Triassic. From early to late, three magmatic peaks of volcanic and intrusive rocks were recorded in the Triassic (Figure 9), including P1 (252–244 Ma), P2 (244–232 Ma) and P3 (228–218 Ma). A large number of studies have shown that the igneous rocks of the P1 stage are mainly magmatic rocks with arc characteristics produced under the subduction of the Paleo-Tethys Ocean [5,14]. The igneous rocks of the P3 stage represent the products of post-collisional magmatism [11,47]. The intrusive and volcanic rocks of the P2 stage are widespread in the East Kunlun Orogen, but there is a great controversy about their formation environment, including post-collision [12,13], syn-collision [14,15,16], and subduction [17,18,19]. The volcanic rocks studied in this paper are in the range of the P2 stage; in the rock association of this stage, the intrusive rocks are mainly granodiorite [14,17,44], monzogranite, syenogranite [45,47], and a small amount of mafic–intermediate rocks [14,44,45]. The granodiorites mostly contain mafic microgranular enclaves [12,14,17,44], which have typical crust–mantle mixing characteristics, suggesting intensive crust–mantle interactions during this period. Volcanic rocks are mostly rhyolite, dacite, a small amount of andesite and basaltic andesite, etc. At the same time, intermediate–acid pyroclastic rocks are also widespread in this period [31,37]. Overall, the igneous rocks have the characteristics of various types and are complex in their genesis.
In terms of Lu-Hf isotopic composition, most of the zircon Hf isotopic results of the volcanic rocks in this study are distributed near the Mesoproterozoic mafic lower crust, enriched mantle or their mixtures (Figure 8). Via the analysis of the Hf isotopic composition of the whole Triassic in the East Kunlun Orogen, we find that the P1-stage igneous rocks have a relatively concentrated range of data distribution, which was mainly derived from juvenile mafic lower crust, enriched mantle, or their mixtures. The εHf(t) values of the P2 and P3 stages have a wide range of variations (Figure 8), and the contribution of the ancient crustal material components is significantly increased. The wide range of data show the characteristics of complex sources, suggesting the gradual thickening of the continental crust, resulting in the extensive ancient continental crustal melting.

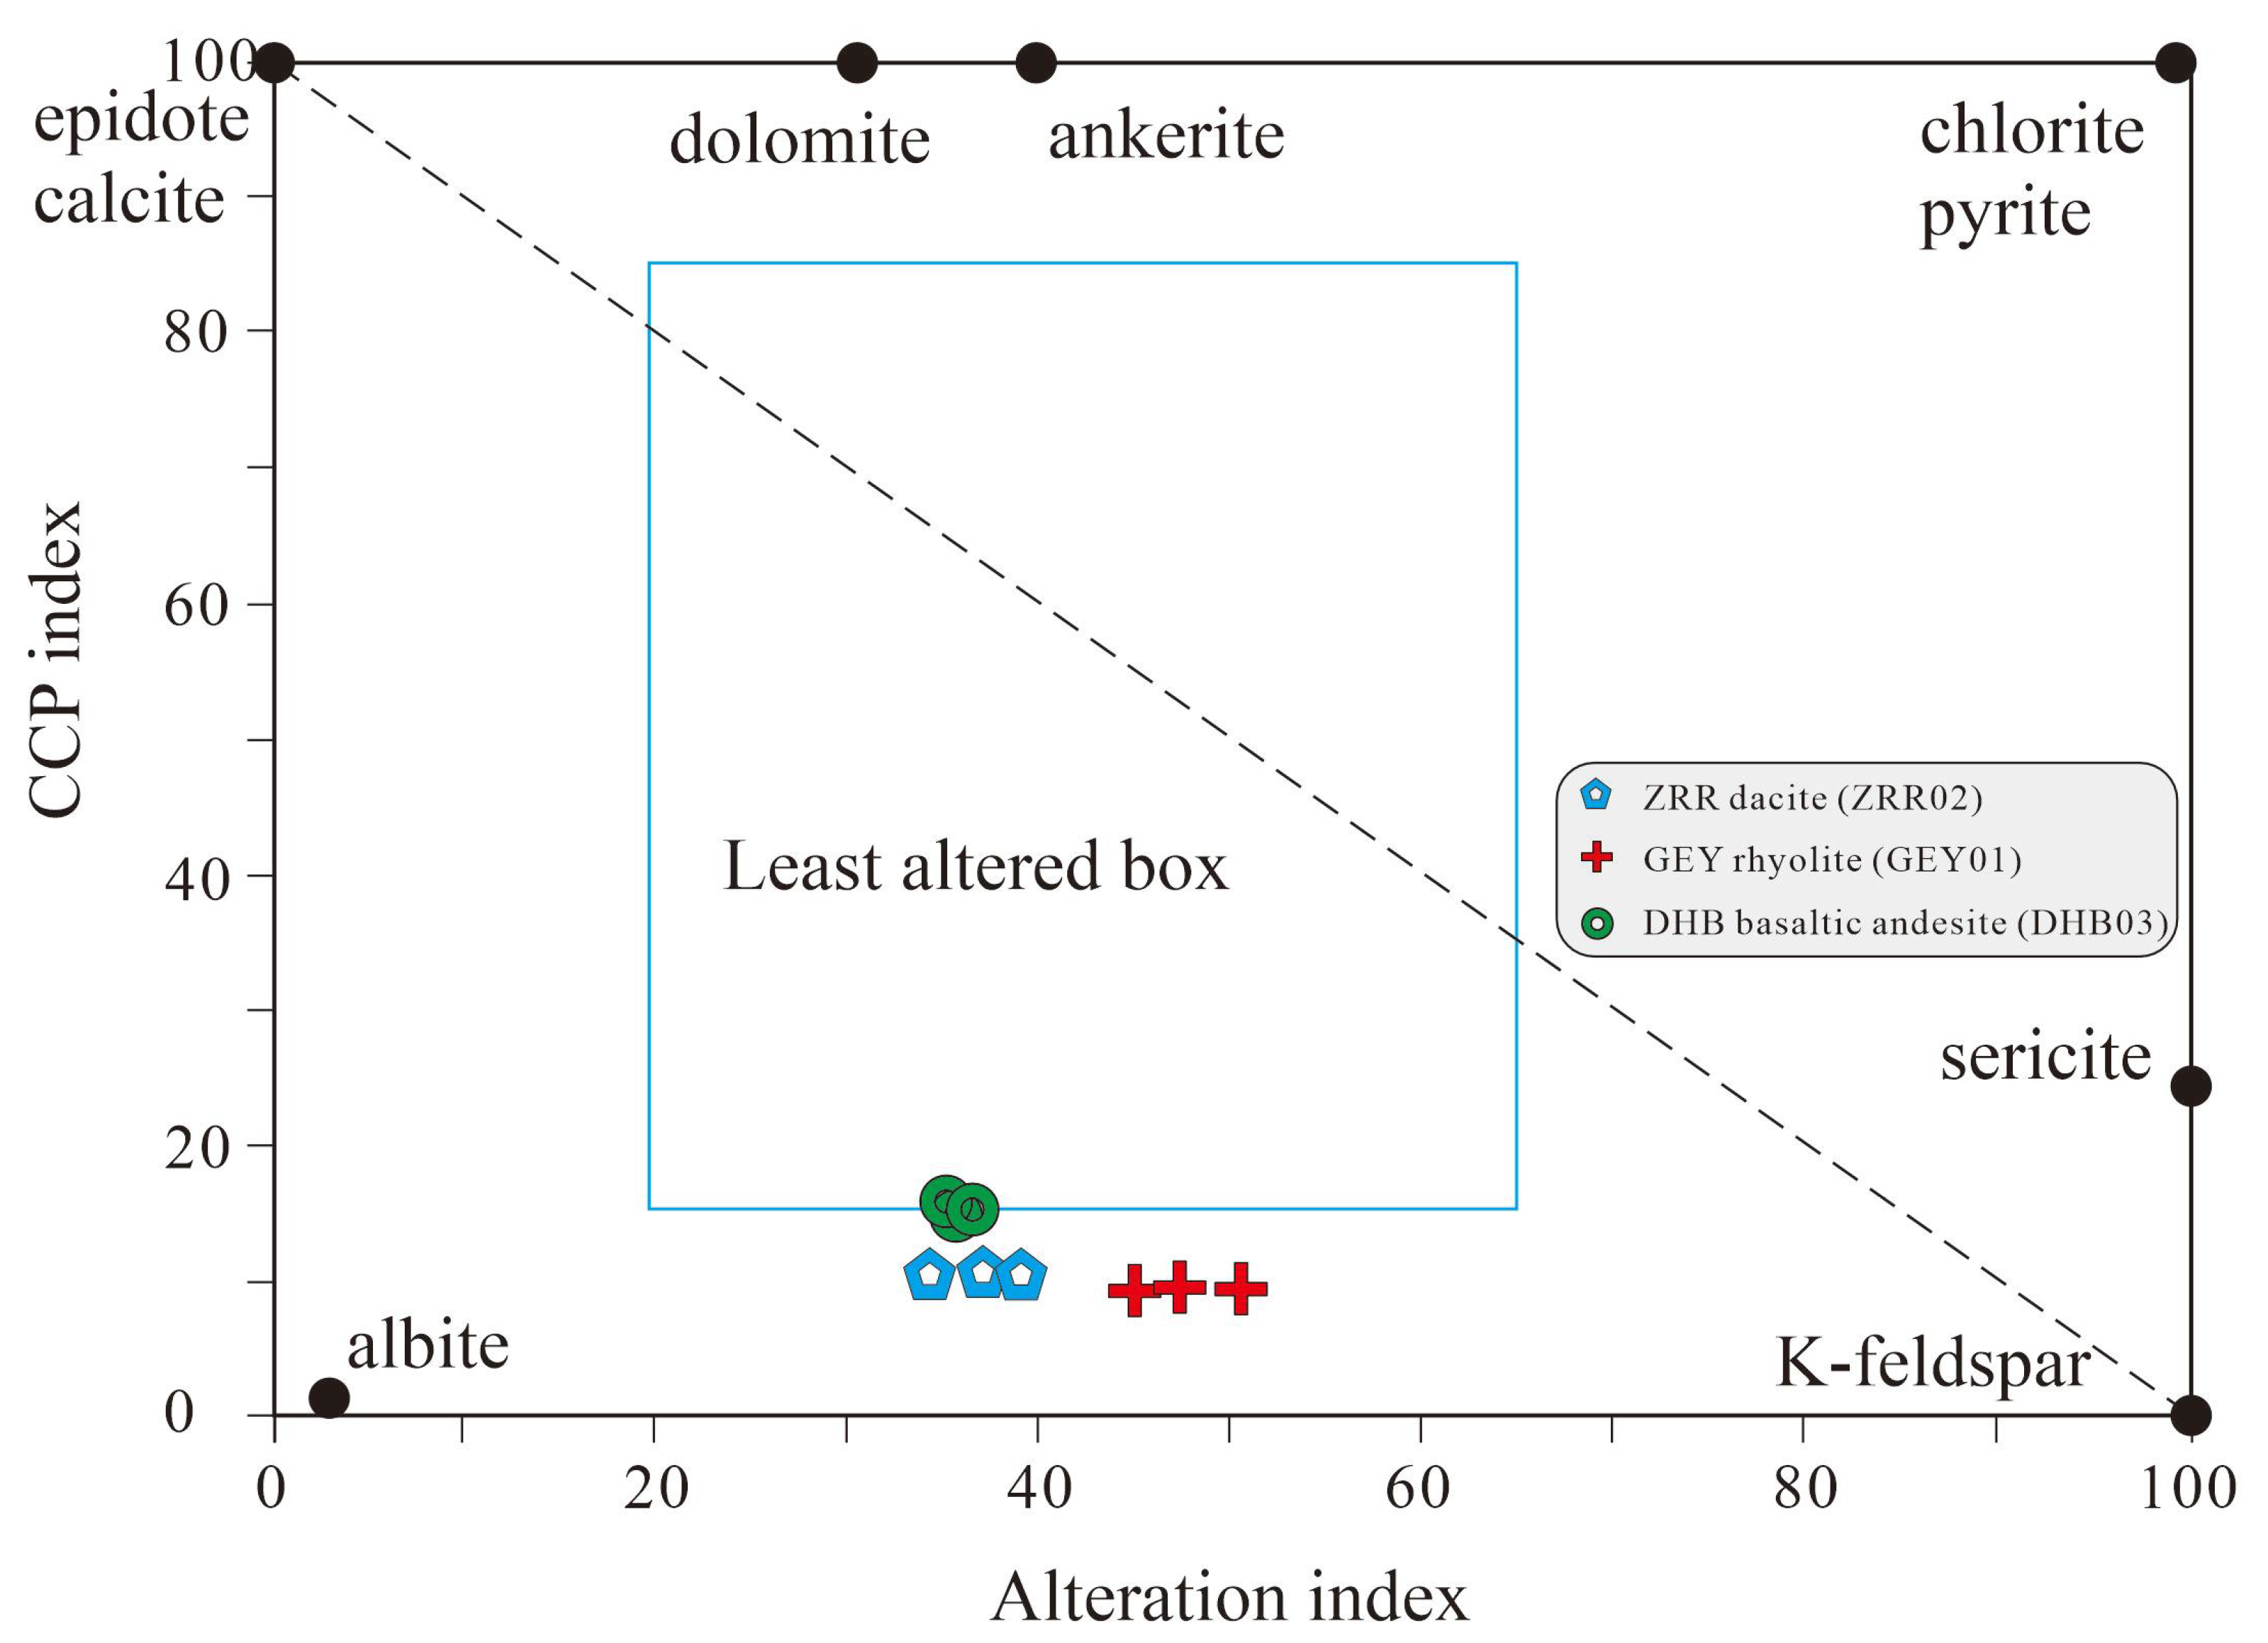
5.2. Evaluation of Alteration

The volcanic rocks used for dating and whole-rock geochemical analyses in this study are all fresh samples from natural outcrops. As the micrographs show, GEY rhyolite (GEY01) and DHB basaltic andesite (DHB03) basically have no secondary altered minerals. Moreover, the ignition loss of rhyolite (0.86–1.00 wt.%) and basaltic andesite (1.00–1.13 wt.%) is relatively low (Table 2). Therefore, major and trace elements can be reliably used to discuss the tectonic environment and petrogenesis of rhyolite and basaltic andesite. However, there are slight epidotized and sericitized alterations in the microscopic observation of the dacite (ZRR02) samples (Figure 3b,c). Before discussing the geochemical characteristics of the dacite samples, it is necessary to evaluate the effect of alterations. The alteration box plot shows all of the samples plotted near the least alteration box (Figure 10). This indicates that the alteration has little effect on the rock chemical compositions of the samples. As shown in Table 2, the ignition loss of dacite samples is generally low (LOI = 1.11–1.28 wt.%), inferring that there is no evidence for any significant alteration or element mobility in the volcanic rocks. Furthermore, the samples of dacite have consistent REE and trace element patterns, without Ce anomalies (Figure 7a,b), demonstrating immobility for REEs and trace elements. In summary, all of the volcanic rock samples in this study have no obvious alterations, and the major as well as trace elements can safely be used to elucidate their tectonic setting and petrogenesis.

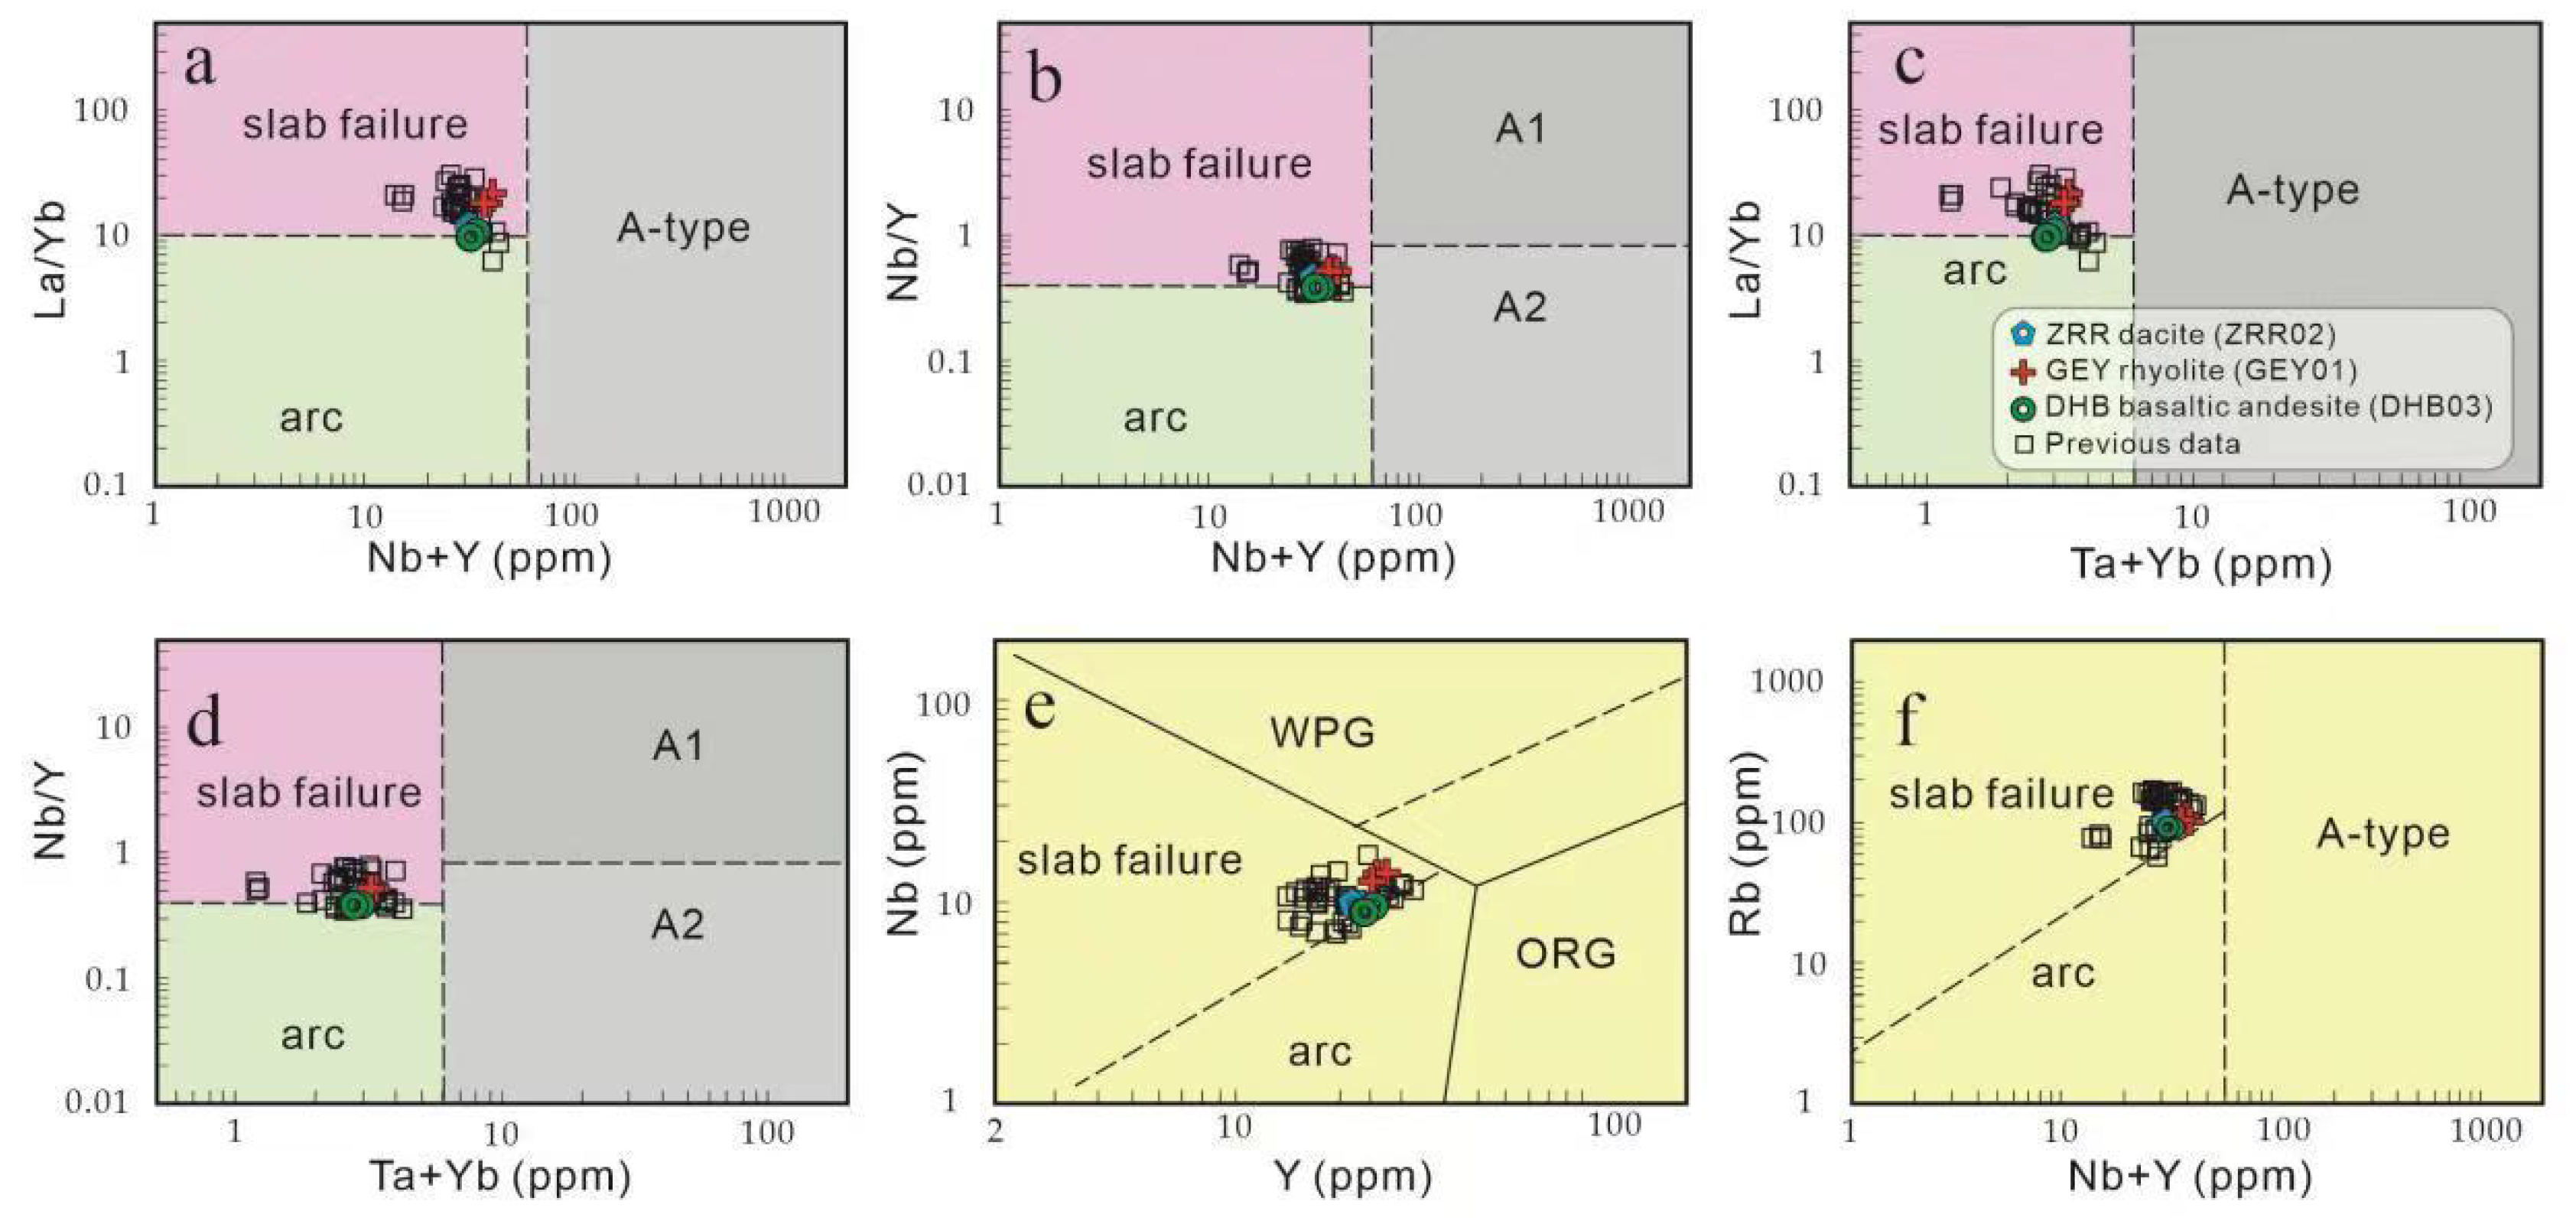
5.3. Tectonic Setting

All of the samples of volcanic rocks in this study have medium-to-high Nb/Y (0.38–0.54) and La/Yb (9.51–21.54) ratios, as well as lower Nb + Y (31.38–40.89 ppm) and Ta + Yb (2.78–3.40 ppm) contents. These geochemical characteristics of volcanic rocks are similar to those of granitic magma related to slab failure in the eastern Canadian Cordilleran region [50]. In the La/Yb vs. Nb + Y, Nb/Y vs. Nb + Y, La/Yb vs. Ta + Yb and Nb/Y vs. Ta + Yb diagrams, the volcanic samples of this study are mostly plotted to the slab failure area (Figure 11a–d). The same results are also shown in the Nb vs. Y and Rb vs. Nb + Y diagrams. These tectonic discrimination diagrams suggest that the volcanic magmatism of this period in the Ela Mountain area of the East Kunlun Orogen is related to the slab failure in the late stage of the syn-collision between the Songpan–Ganzi–Bayanhar Terrane and the East Kunlun Terrane. We also collected evidence of other geological events in the East Kunlun Orogen to constrict the lower limit time for the closure of the Paleo-Tethys Ocean, including the following: ① there was an angular unconformity between the Xilikete Formation of the Middle Triassic and the Naocangjiangou Formation of the Early and Middle Triassic in the region, and at ca. 242–237 Ma, the sedimentary environment of the East Kunlun strata changed from marine facies to fluvial facies [51]. ② The metamorphic records (~246 Ma and ~242 Ma) in the Qingshuiquan amphibolite facies mica schist [52] and the Jinshuikou granitic gneiss [53] proved that there was a middle–high-pressure metamorphism in the Middle Triassic of the East Kunlun Orogen. ③The presence of ~240 Ma Cahantaolegai peraluminous granite [54] and the appearance of S-type granite rocks (e.g., ~240 Ma Kengdenongshe S-type peraluminous rhyolitic tuff [15,16]) imply the crustal thickening and deep crustal melting caused by continental collision. Our research results and these geological events show that the Paleo-Tethys Ocean Basin had closed before the end of the Middle Triassic. Subsequently, the 239.3–234.4 Ma volcanic eruption and the simultaneous intrusive rocks were formed in the slab failure environment, representing the beginning of the initial extension of the late stage of syn-collision.

5.4. Petrogenesis

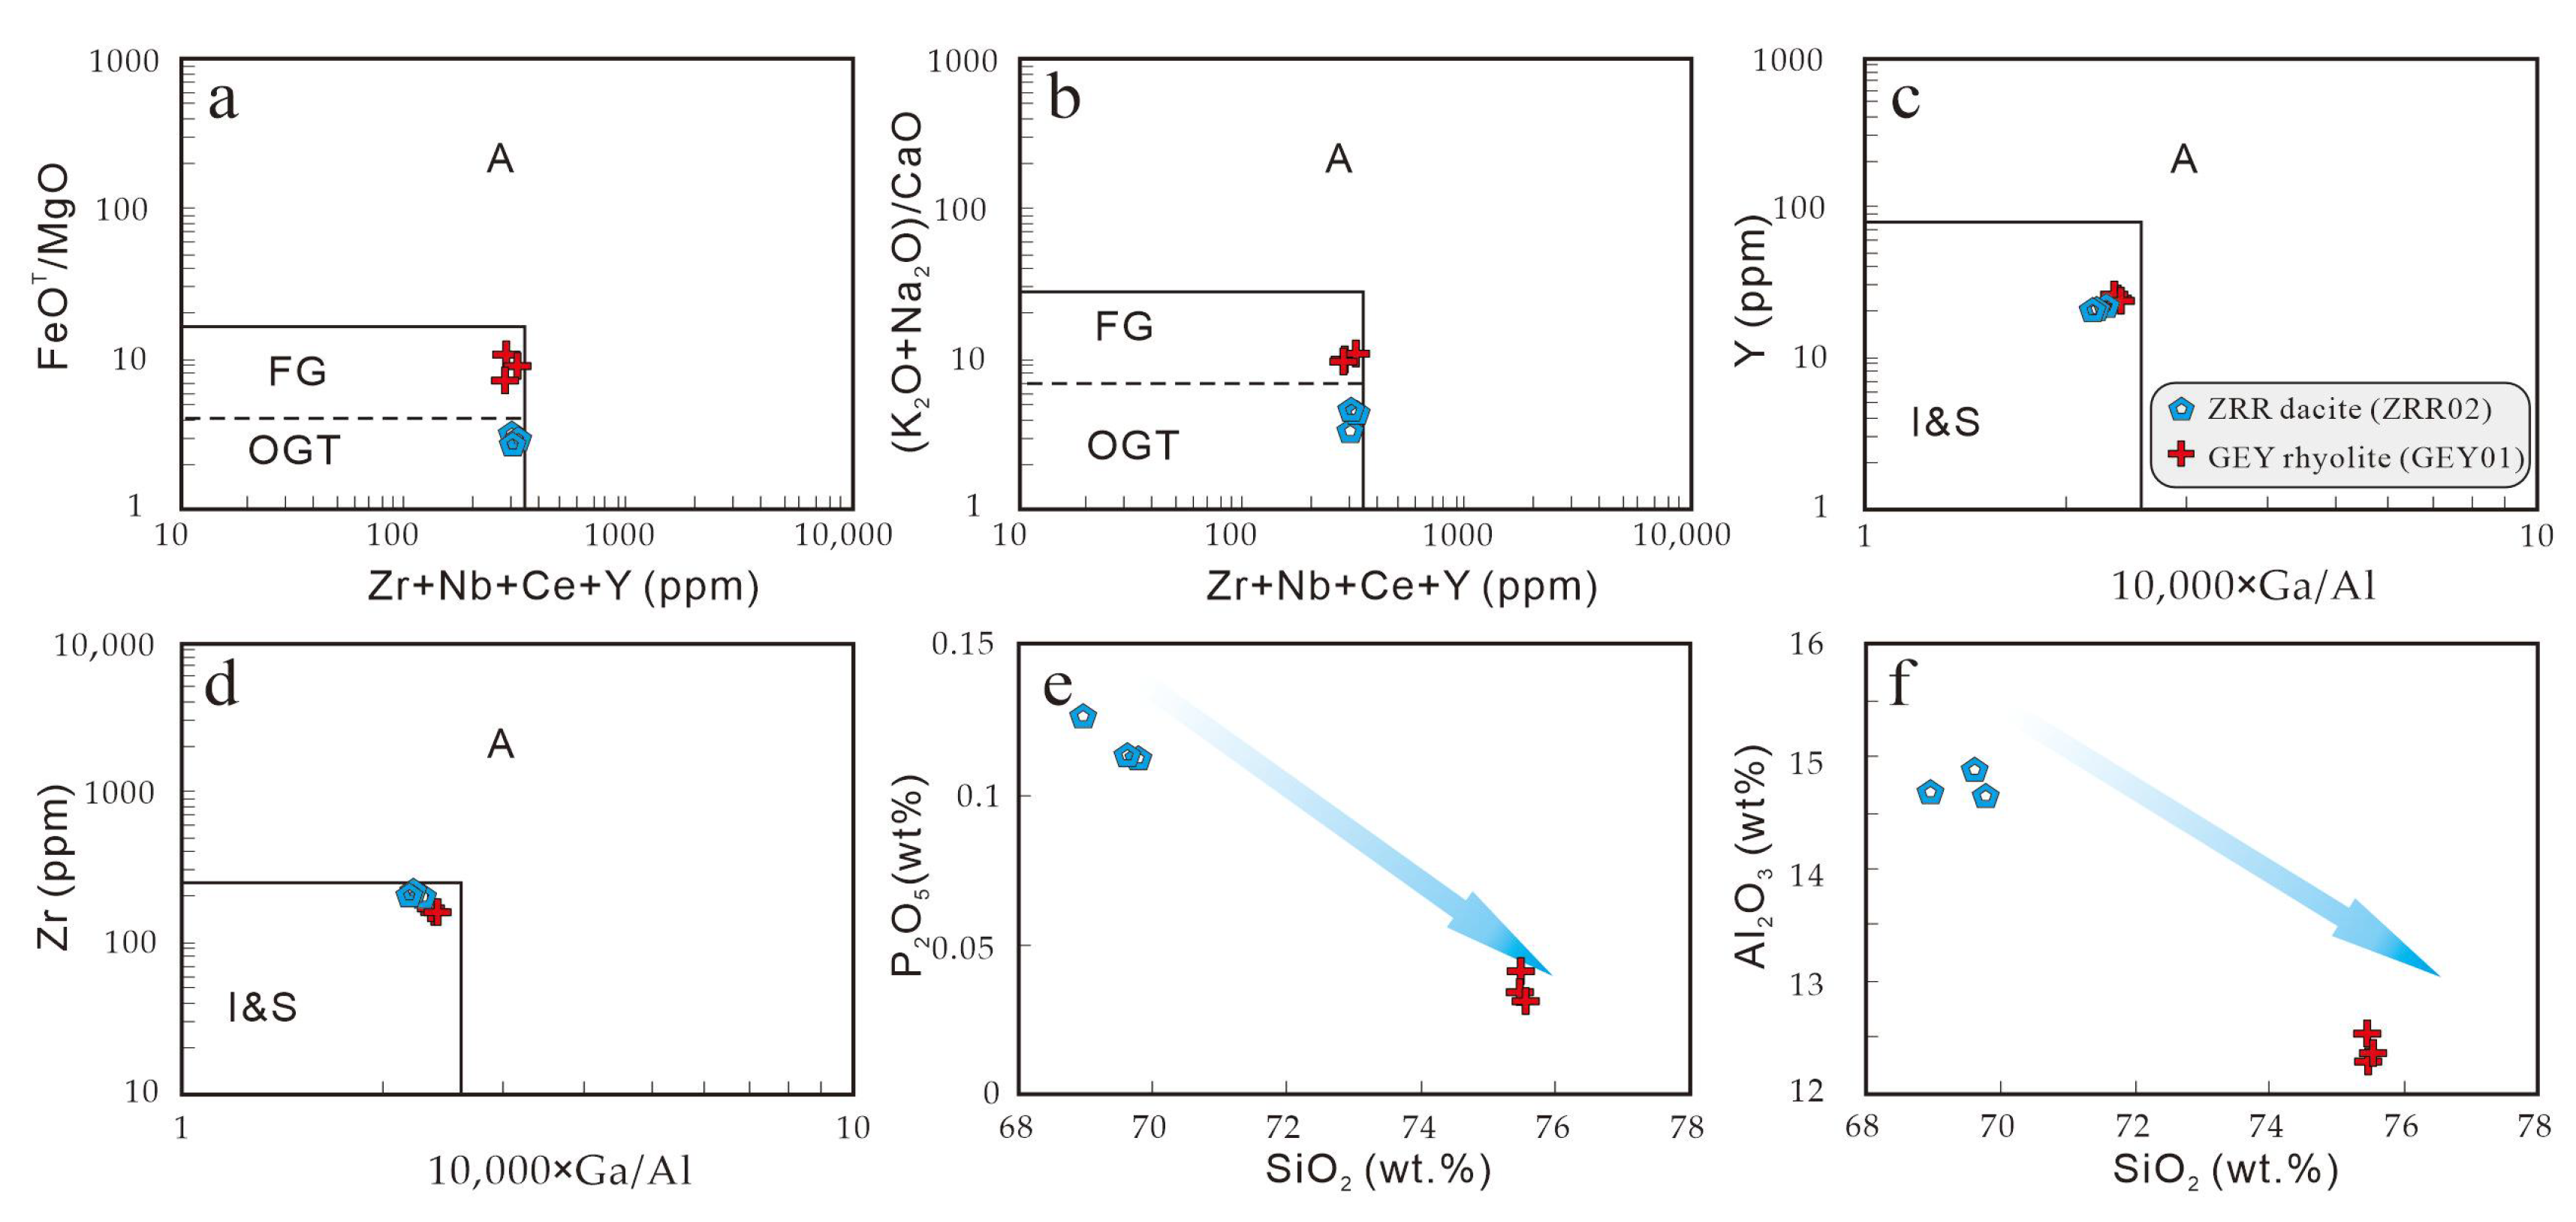
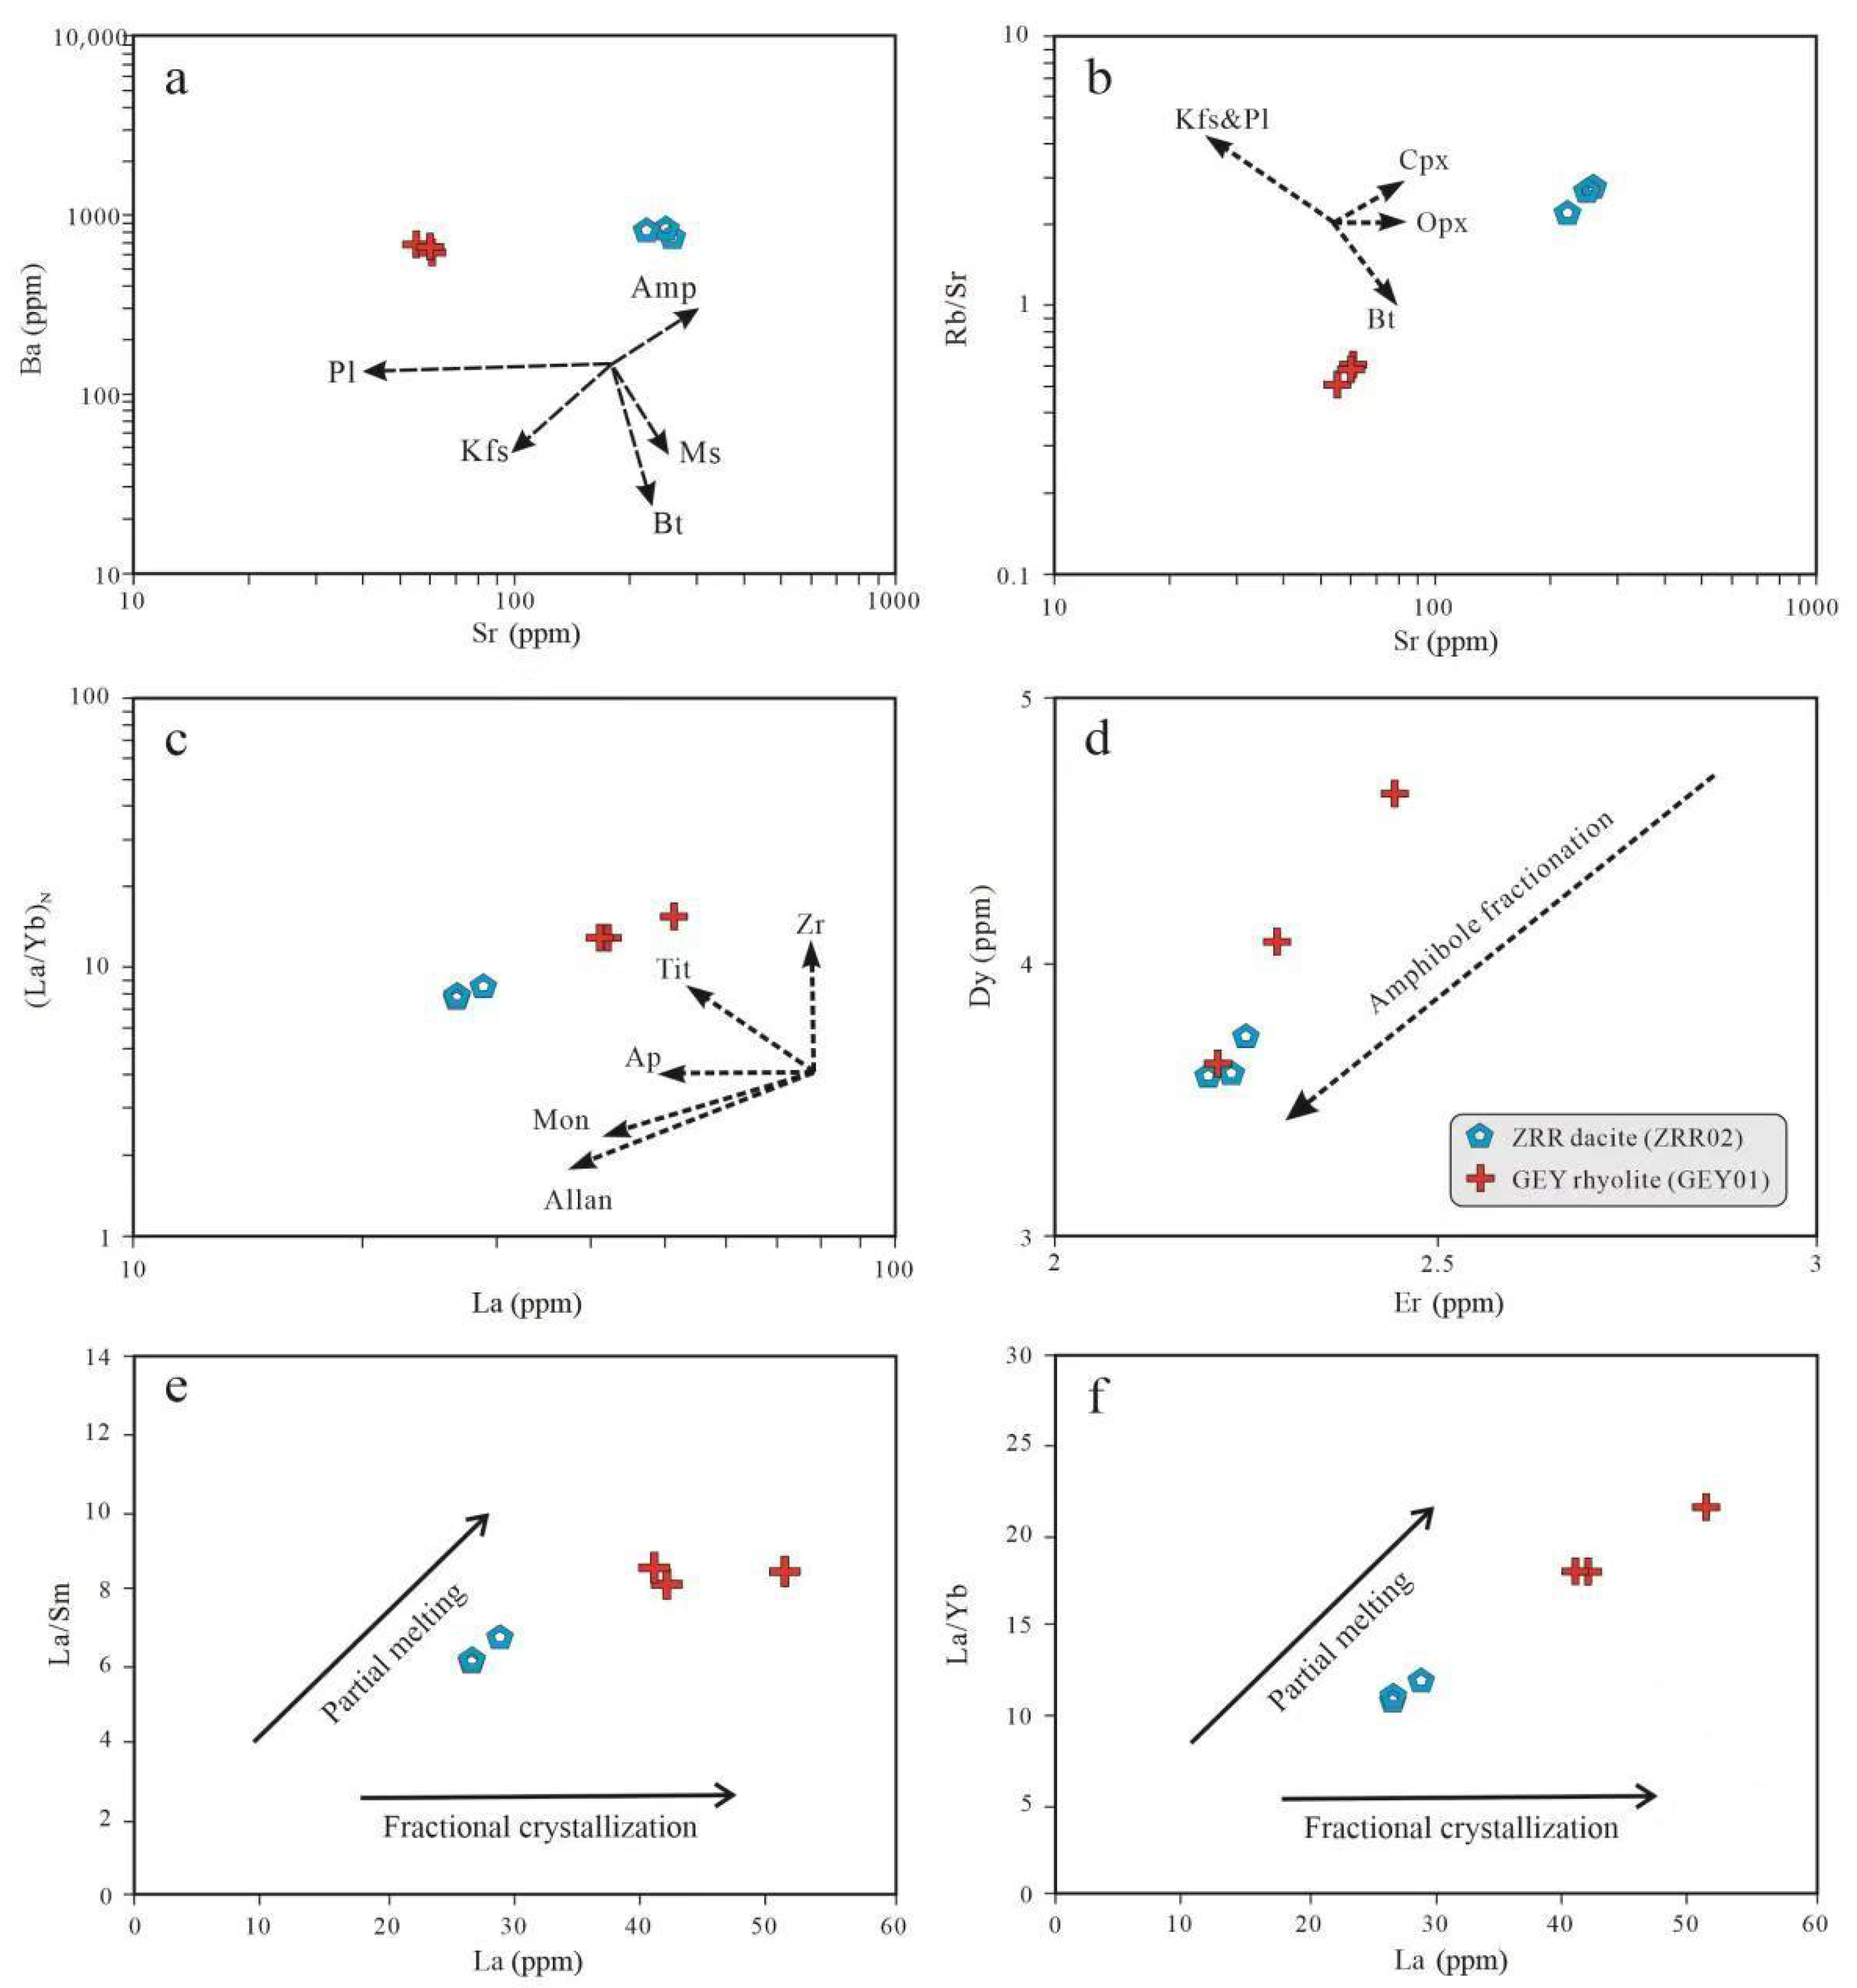
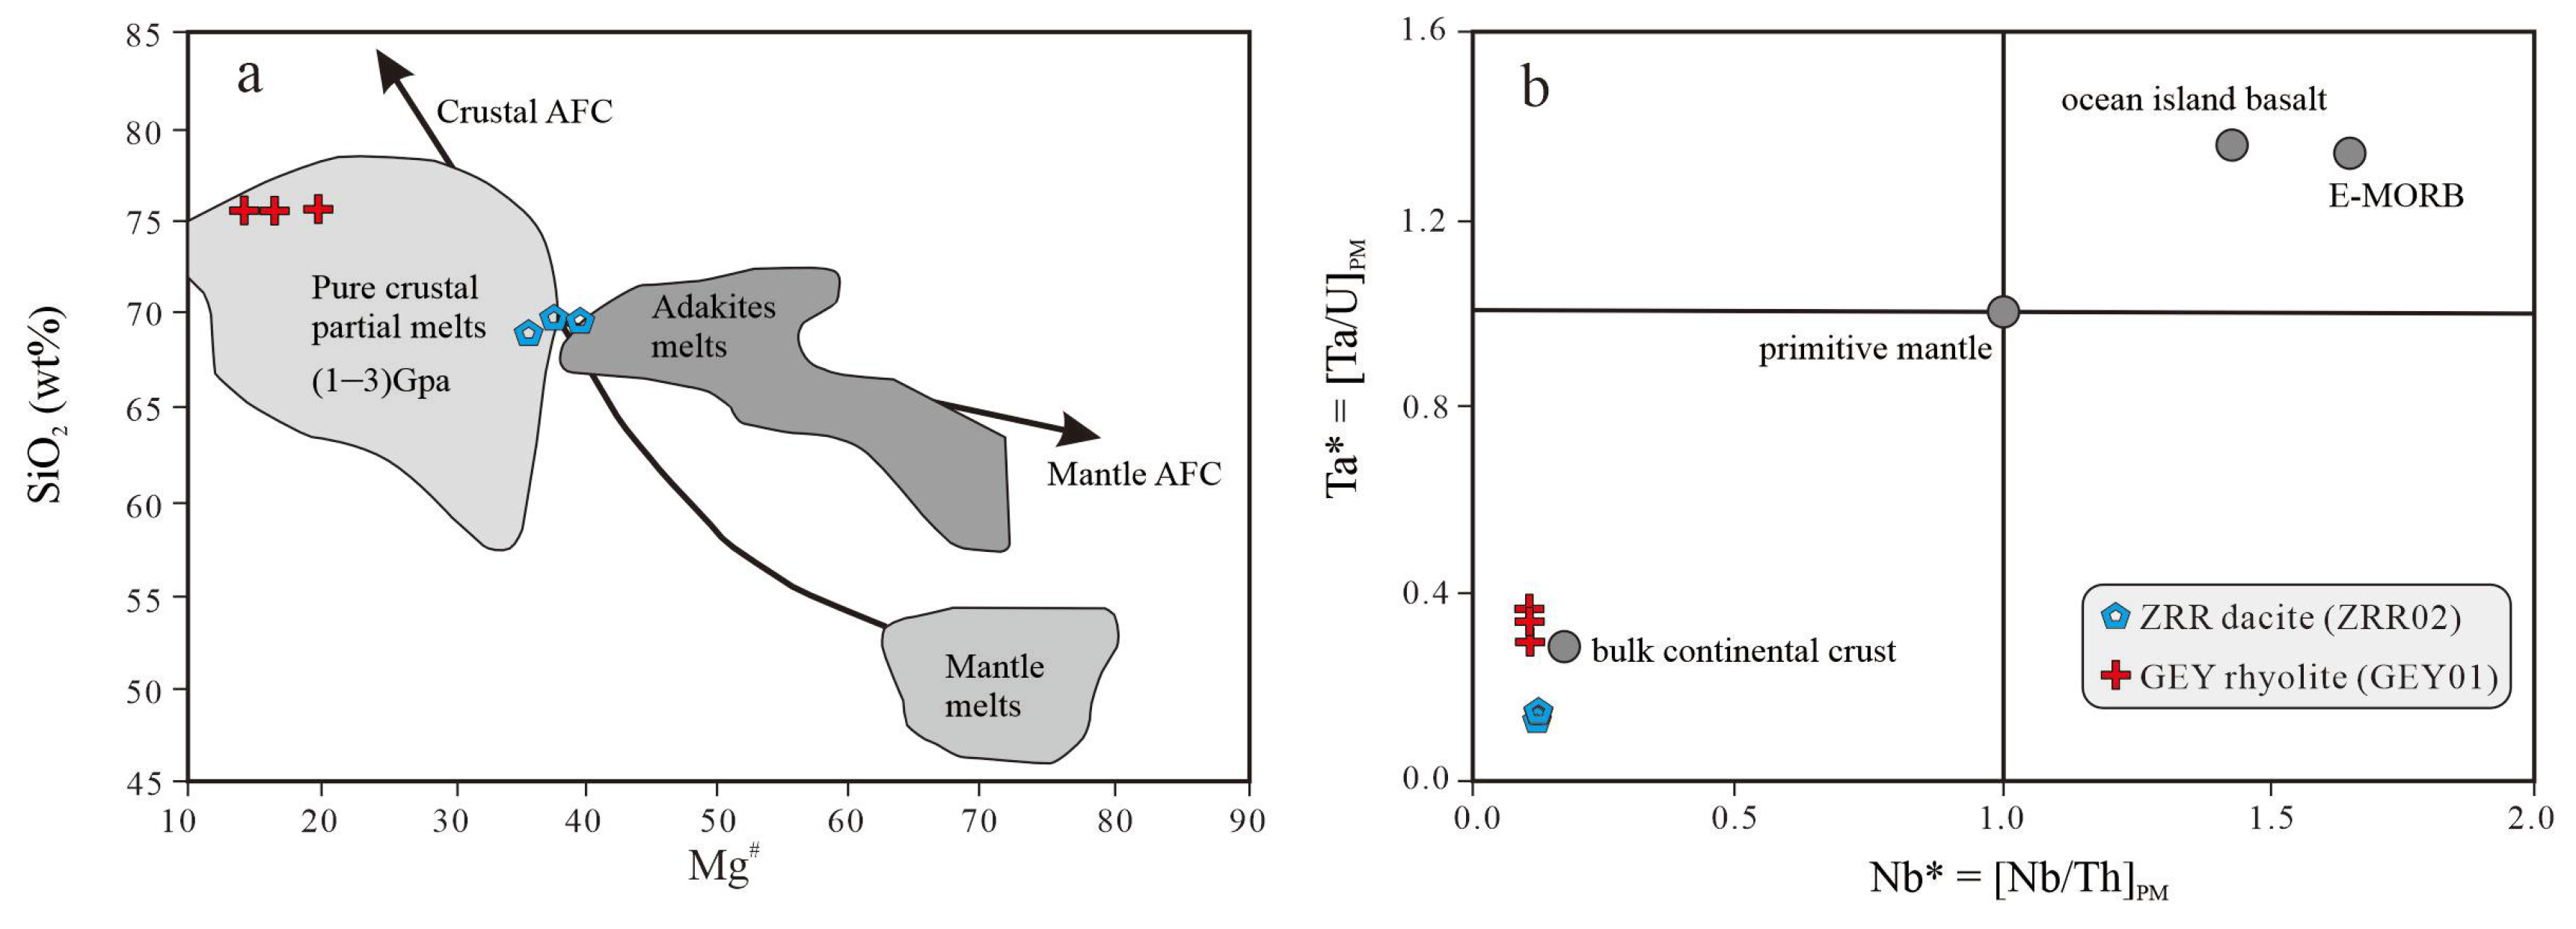
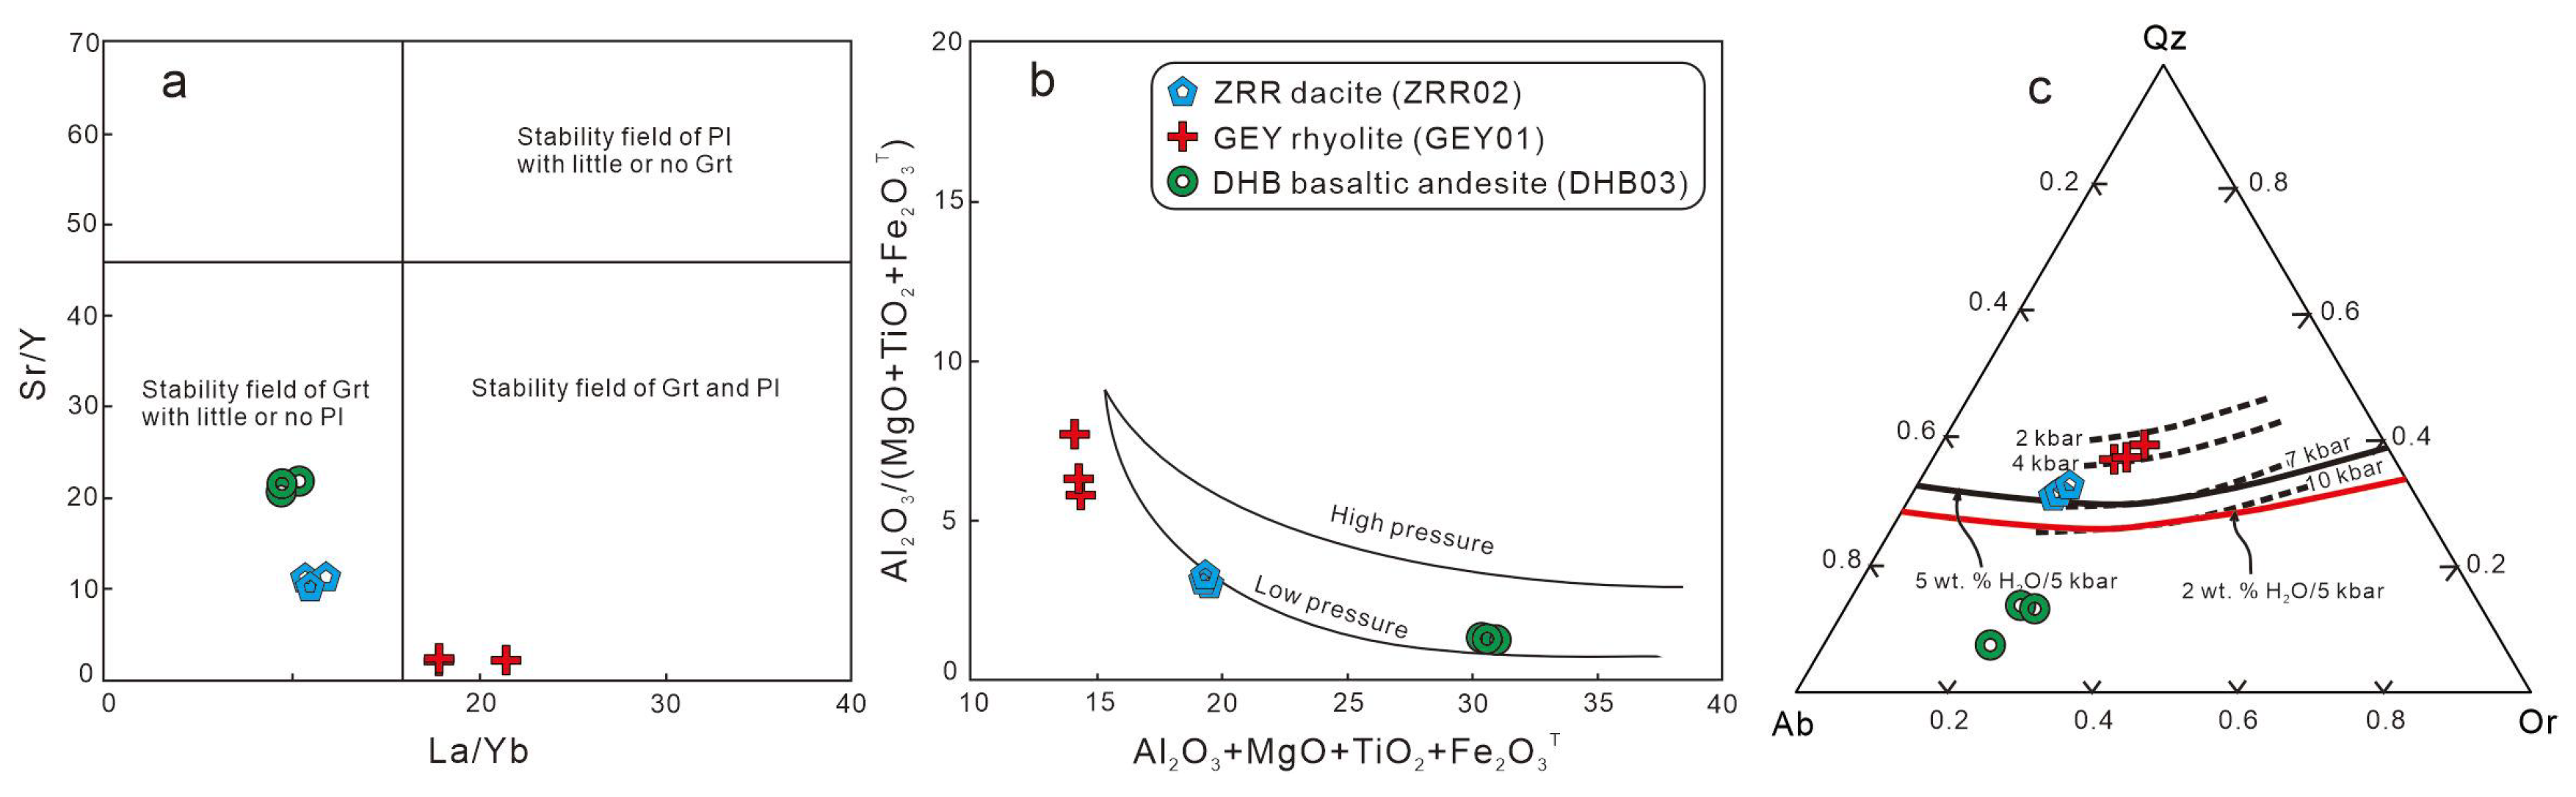
5.4.1. Petrogenesis of ZRR Dacite

Mineralogically, no alkali-rich mafic minerals (e.g., sodic pyroxene or alkali amphiboles) are found in the ZRR dacite. The samples have low FeOT/MgO (2.72–3.21) and (Na2O + K2O)/CaO (3.35–4.64) ratios, which are lower than those of A-type granite (Figure 9a,b). All of the samples of dacite have low Zr, Nb, Ce, Y, and Ga contents, with Zr + Nb + Ce + Y of 299.17–319.43 ppm, less than 350 ppm. The 10,000 Ga/Al ratios (2.18–2.29) are lower than the minimum values of A-type granites. These characteristics indicate that dacite is not an A-type granitic rock (Figure 12a–d). There are no aluminum-rich minerals such as muscovite, garnet or cordierite in dacite, and the content of Na2O (4.45–4.67 wt.%) of the samples is high, with Na2O/K2O ratios of 1.57–1.80, which have the characteristic of being Na-rich and are characteristic of I-type granite [55]. The rocks have low Rb/Sr ratios (0.36–0.45), Rb/Ba ratios (0.11–0.12), and high K/Rb ratios (229.92–242.18), which are consistent with I-type granite and are different from S-type granite [56]. The diagrams of Al2O3–SiO2 and P2O5–SiO2 (Figure 12e,f) also show the evolution trend of I-type granite [56]. In summary, we infer that ZRR dacite belongs to calc-alkaline I-type volcanic rock.
The samples of dacite show the fractional crystallization of plagioclase on an Sr–Ba diagram (Figure 13a), and the slightly depleted Ba, Sr and Eu (Figure 7a,b) also support the existence of the fractional crystallization of plagioclase. The Rb/Sr ratio is positively correlated with Sr (Figure 13b), indicating that there is the separation crystallization of clinopyroxene in the magmatic evolution process. In the (La/Yb)N–La diagram (Figure 13c), the separation crystallization of monazite and allanite is obviously shown. The positive Er and Dy correlations are related to the fractional crystallization of amphibole (Figure 13d). Although the crystallization and separation of the above minerals occurred in the magmatic evolution process, the La–La/Sm and La–La/Yb diagrams (Figure 13e,f) showed that the formation of dacite is mainly controlled by partial melting, such that the nature of the source region has a more important influence on the composition of the magma.
Dacite can be formed by the fractionation crystallization of mafic magma [58], magma mixing between basalt and rhyolite [59], or the partial melting of mafic protolith [60]. Large-scale basaltic rocks of the same period have not been reported in the Ela Mountain area, excluding the possibility that intermediate–acid volcanic rocks are derived from the fractionation crystallization of mafic magma. The low S/Y ratio (10.34–11.44) also excludes the possibility that the dacite is formed by oceanic crust melting. The samples of dacite have relatively high SiO2 contents (68.96–69.78 wt.%) in addition to low MgO (0.96–1.01 wt.%) contents and Mg# values (35.67–39.56). In the Mg#-SiO2 diagram, most of them fall into the partial melting region of crust source (Figure 14a), which excludes the possibility that they originate from the mantle. The major and trace elements in the dacite rocks show relatively uniform contents, and magmatic mixing characteristics such as mafic microgranular enclaves have not been found, effectively excluding the possibility that they are the product of magmatic mixing. Experimental studies have shown that the dehydration melting of mafic lower crust rocks will produce low-Mg# (<44) and high-Na2O (>4.3 wt.%) melts [61,62], and these characteristics are fully consistent with the dacite (Mg# = 35.67–39.56; Na2O = 4.45–4.67 wt.%), indicating a significant contribution of the lower continental crust to the formation of the dacite. The samples are enriched in LREEs and relatively depleted in HREEs, and the primitive mantle-normalized trace element diagram shows that the rocks are enriched in Rb, K, Pb, Zr, and Hf and depleted in Ba, Sr, Nb, Ta, P, and Ti. These rare-earth and trace element characteristics of the samples are similar to those of the bulk continental crust (Figure 7a,b), indicating that the crustal source was melted. Studies have shown that some high-field-strength elements and rare-earth elements are usually stable under altered weathering and low-grade metamorphism conditions, so it is very effective to study the diagenetic process with the content or ratio of these elements [63]. The La/Nb (2.69–2.98) of the dacite samples is close to the crustal value (La/Nb = 2.2 [64]). In the Ta* vs. Nb* diagram, the samples of dacite are plotted near to the bulk continental crust (Figure 14b), showing characteristics of crustal origin. The samples of dacite have low S/Y and La/Yb values (Figure 15a), indicating that they were derived from the partial melting of the source area without garnet residue. These data show that the dacite formed at a relatively low pressure. The Al2O3/(MgO + TiO2 + Fe2O3T) vs. Al2O3 + MgO + TiO2 + Fe2O3T diagram and normative Qz-Ab-Or diagram also show the characteristics of low pressure. Combined with the high zircon saturation temperature (TZr = 793–813 °C) of these samples, it indicates that the dacite formed at a relatively high-temperature and low-pressure environment (Figure 15b,c). The 176Hf/177Hf ratios of the zircons of the dacite are 0.282451–0.282549, with εHf(t) values of −6.3 to −2.7 (Figure 8), and the corresponding two-stage model age is 1673–1445 Ma, which is consistent with the metamorphic crystalline basement of the East Kunlun Orogen [65,66], such that we infer that the ZRR dacite may originate from the partial melting of the Mesoproterozoic lower crust of mafic rocks at a relatively high temperature and low pressure.

5.4.2. Petrogenesis of GEY Rhyolite

No alkali-rich mafic characteristic minerals specific to A-type granite are found in GEY rhyolite. The FeOT/MgO, (Na2O + K2O)/CaO, 10,000 Ga/Al (2.22–2.39) values and HFSE contents (Zr + Nb + Ce + Y < 350) are lower than the minimum values of A-type granites, excluding the possibility of A-type granites (Figure 12a–d). The samples have high SiO2 (75.46–75.55 wt.%) and K2O contents (3.84–4.25 wt.%), with relatively high K2O/Na2O ratios (0.93–1.20), classified in high-K calc-alkaline series, and most samples are plotted in the area of fractionated granite (Figure 12a,b). The samples have a high differentiation index (DI = 92.12–93.35), showing the characteristics of highly fractionated granitic rocks. In the composition of rare-earth and trace elements, the sample has an obvious negative Eu anomaly and is intensively depleted in Ba and Sr (Figure 7c,d), which also indicates that the magma has experienced a high degree of fractionation crystallization [56]. Due to intensive fractionation, the highly fractionated I-type and S-type granitic rocks are similar in many geochemical characteristics. There are no aluminum-rich minerals such as muscovite, garnet, and cordierite in GEY rhyolite, and the content of P2O5 is low (0.03–0.04 wt.%), indicating that they are not S-type granites. The Al2O3–SiO2 and P2O5–SiO2 diagrams (Figure 9e,f) also show the evolution trend of I-type granites [56]. The diagrams of La/Sm vs. La and La/Yb vs. La show the dual effects of partial melting and fractional crystallization (Figure 9e,f). The Sr–Ba diagram shows the obvious separation and crystallization of plagioclase (Figure 13a), which are consistent with the obvious negative Eu anomaly (Eu/Eu* = 0.35–0.41) and intensively depleted in the Ba and Sr of the samples (Figure 7c,d). The Rb/Sr ratio is positively correlated with Sr (Figure 13b), indicating that there may be the separation crystallization of clinopyroxene. The rhyolites also obviously show the separation crystallization of monazite and limonite in the (La/Yb)N–La diagram (Figure 13c). The Er–Dy diagram obviously shows the separation crystallization of amphibole (Figure 13d). Overall, we infer that GEY rhyolite belongs to high-K calc-alkaline highly fractionated I-type granite rock.
Highly fractionated I-type granites can be formed by the fractional crystallization of mantle-derived basaltic magma [71], crust–mantle magma mixing [72], or the partial melting of the lower crust caused by the underplating of mantle-derived magma [73]. As mentioned above, no large-scale basaltic magma was reported in the Ela Mountain area during the Triassic period. The rhyolite has a high SiO2 content (75.46–75.55 wt.%), low MgO (0.13–0.20 wt.%) content, and a Mg# value of 14.24–19.82, and all of them are plotted into the pure crustal partial melts area (Figure 14a) in the Mg#–SiO2 diagram, with no obvious mantle-derived magma mixing. The ratios of Nb/Ta (12.76–13.57), Zr/Hf (33.97–37.02), and La/Nb (3.07–3.70) of the samples are consistent with the average crustal composition (Nb/Ta = 11, Zr/Hf = 33, and La/Nb = 2.2 [64]). In the Ta* vs. Nb* diagram, the samples of rhyolite are plotted near to the bulk continental crust (Figure 14b), indicating the attribute of the crustal source of the rhyolite. The samples are enriched in LREEs and relatively depleted in HREEs, and the primitive mantle-normalized trace element diagram shows that the rocks are enriched in Rb, K, Pb, Zr, and Hf and depleted in Ba, Sr, Nb, Ta, P, and Ti. These characteristics are similar to those of the bulk continental crust (Figure 7a,b), indicating that the primary magma originated from the crust. GEY rhyolites have very low Sr/Y ratios (Figure 15a) and obvious negative Eu anomalies (Figure 7b). These indicate that the magma was formed under a relatively low pressure, and plagioclase may be a residual facie in the source region [74]. The major element pressure diagram also shows a low-pressure environment for the GEY rhyolite (Figure 15b), and the pressure is lower than the earlier ZRR dacite (Figure 15c). The zircon saturation temperature of rhyolite samples varies from 791 °C to 800 °C, indicating that the formation temperature is high. The zircons of ZRR rhyolite have 176Hf/177Hf ratios of 0.282518–0.282626 (Figure 8), with εHf(t) values of −4.4 to −0.2 and TDM2 of 1544 to 1278 Ma, implying a significant contribution of Mesoproterozoic continental crust to the formations of the rocks.

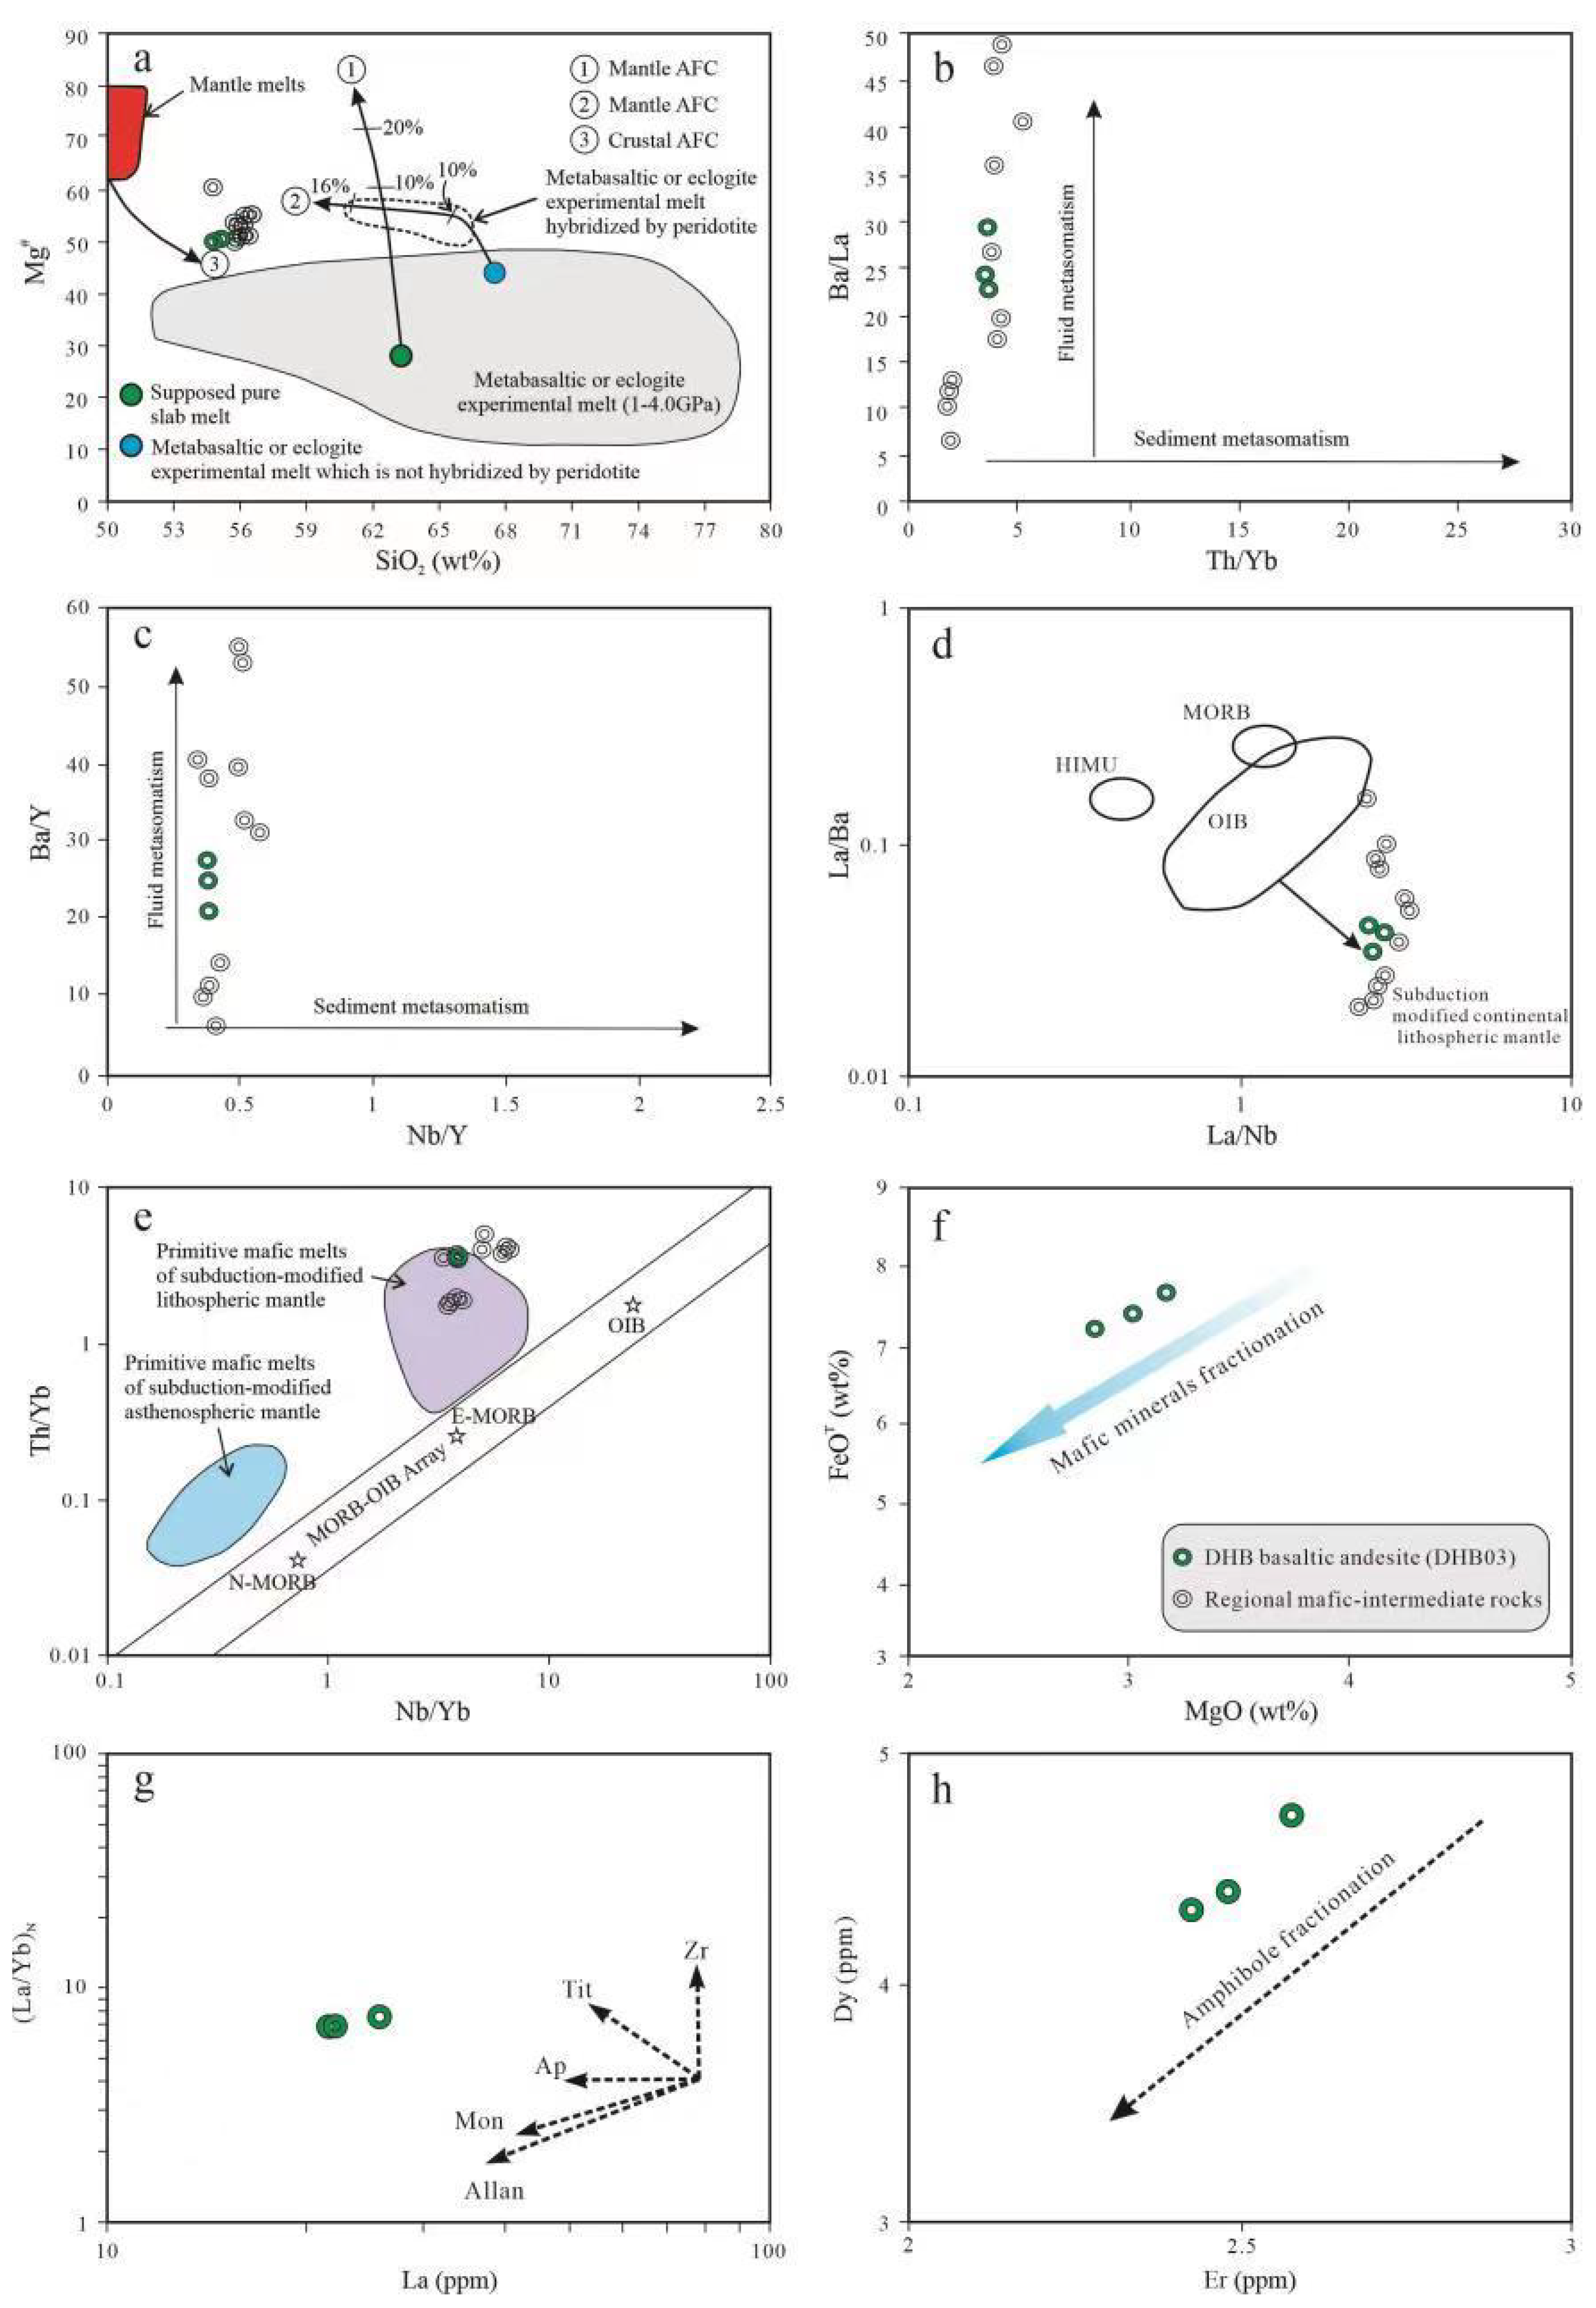
5.4.3. Petrogenesis of DHB Basaltic Andesite

Low-silicon magma may be derived from the large-scale partial melting of metamorphic basalts in the lower crust under high-temperature conditions or directly from the mantle [62,75]. DHB basaltic andesite has a low SiO2 content (54.79–55.15 wt.%) and a high MgO content (4.12–4.30 wt.%), with a Mg# value of 50.03–50.53, which is significantly higher than the experimental melt formed by the partial melting of lower crust metabasalt and eclogite (Figure 16a), indicating that mantle material plays a dominant role in its magma source. The high Nb/Ta ratios (17.02–17.42) and Zr/Hf ratios (40.88–42.25) of basaltic andesite are similar to those of the primitive mantle (Nb/Ta = 17.5; Zr/Hf = 36 [25]), displaying the composition characteristics of mantle-derived rocks. In the primitive mantle-normalized trace element diagram, basaltic andesite shows the characteristics of enrichment in Rb, K, and Pb, and is depleted in Nb, Ta, P and Ti (Figure 7e,f), with the characteristics of magmatic rocks in the subduction zone, which indicates that these basaltic andesite may come from the enriched lithospheric mantle reformed by the subduction fluid or melt, rather than the depleted asthenosphere mantle [76,77]. DHB basaltic andesite is obviously enriched in fluid activity elements (e.g., Rb, Sr, Th, U, K and Pb), suggesting that the magma source is affected by the dehydration fluids of subducted slab. In the diagrams of Th/Yb–Ba/La and Nb/Y–Ba/Y (Figure 16b,c), the trend of fluid metasomatism is clearly shown. In addition, the petrographic observation shows that the amphibole in the rock is abundant (Figure 3h), indicating that the water content in the mantle source is high. In the diagrams of Nb/Yb vs. Th/Yb and La/Nb vs. La/Ba, the samples are plotted into the subduction-modified lithospheric mantle (Figure 16d,e). The contents of MgO (4.12–4.30 wt.%), Mg# (50.03–50.53), Cr (29.88–50.10 ppm) and Ni (9.76–11.16 ppm) in basaltic andesite are lower than the reference values of mantle primary magma (MgO = 10–12%, Mg# = 68–75, [78]; Cr = 250 ppm, Ni = 90–670 ppm, [79]), indicating that the magma was not primitive mantle magma. The Rb/Sr ratios of samples are 0.17–0.19, which are between the average value of continental crust (0.34 [64]) and the upper mantle value (0.034). Additionally, the Nd/Th (3.22–3.48) is slightly larger than the crustal rock value (Nd/Th = 3, [48]) and lower than the mantle source value (>15 [80]). These above characteristics further prove that DHB basaltic andesite is the product of evolved magma. The zircon in situ Hf isotope analysis shows that the basaltic andesite has 176Hf/177Hf ratios of 0.282561–0.282662, with εHf(t) values of −2.5 to 1.0 and TDM2 of 1421 to 1201 Ma, indicating that in addition to the subduction-modified lithospheric mantle, basalt andesite may also be contaminated by a small amount of crust materials. Microphotographs show that quartz xenocrystal occasionally exists in basalt andesite. The quartz xenocrystal is corroded in an oval shape, surrounded by microcrystalline hornblende around the quartz xenocrystal, forming the xenocrystal reverse corona texture (Figure 3i). This shows that the basaltic andesite has experienced crustal contamination before eruption to the surface, which can be used to interpret the high SiO2 content in some of the samples. The contents of FeOT and MgO showed a significant positive correlation, reflecting the existence of the separation crystallization of mafic minerals (Figure 16f). In the (La/Yb)N–La diagram, the separate crystallization of monazite is shown (Figure 16g). The Dy–Er diagram obviously shows the separation crystallization of amphibole (Figure 16h). In summary, we infer that the DHB basaltic andesite is mainly derived from the continental lithospheric mantle metasomatized by subduction fluid, and has experienced obvious fractionated crystallization and a small amount of crustal contamination before magma erupted onto the surface. The trace and major elements of pressure discrimination diagrams for DHB basaltic andesite show low-pressure melting conditions (Figure 15a,b), but higher than those of early dacite and rhyolite (Figure 15c). This also indicates that the basaltic andesite is derived from the partial melting of the mantle source, which is deeper than the lower crust. Overall, DHB basaltic andesite, ZRR dacite and GEY rhyolite are all formed in a relatively low pressure of extension environment.

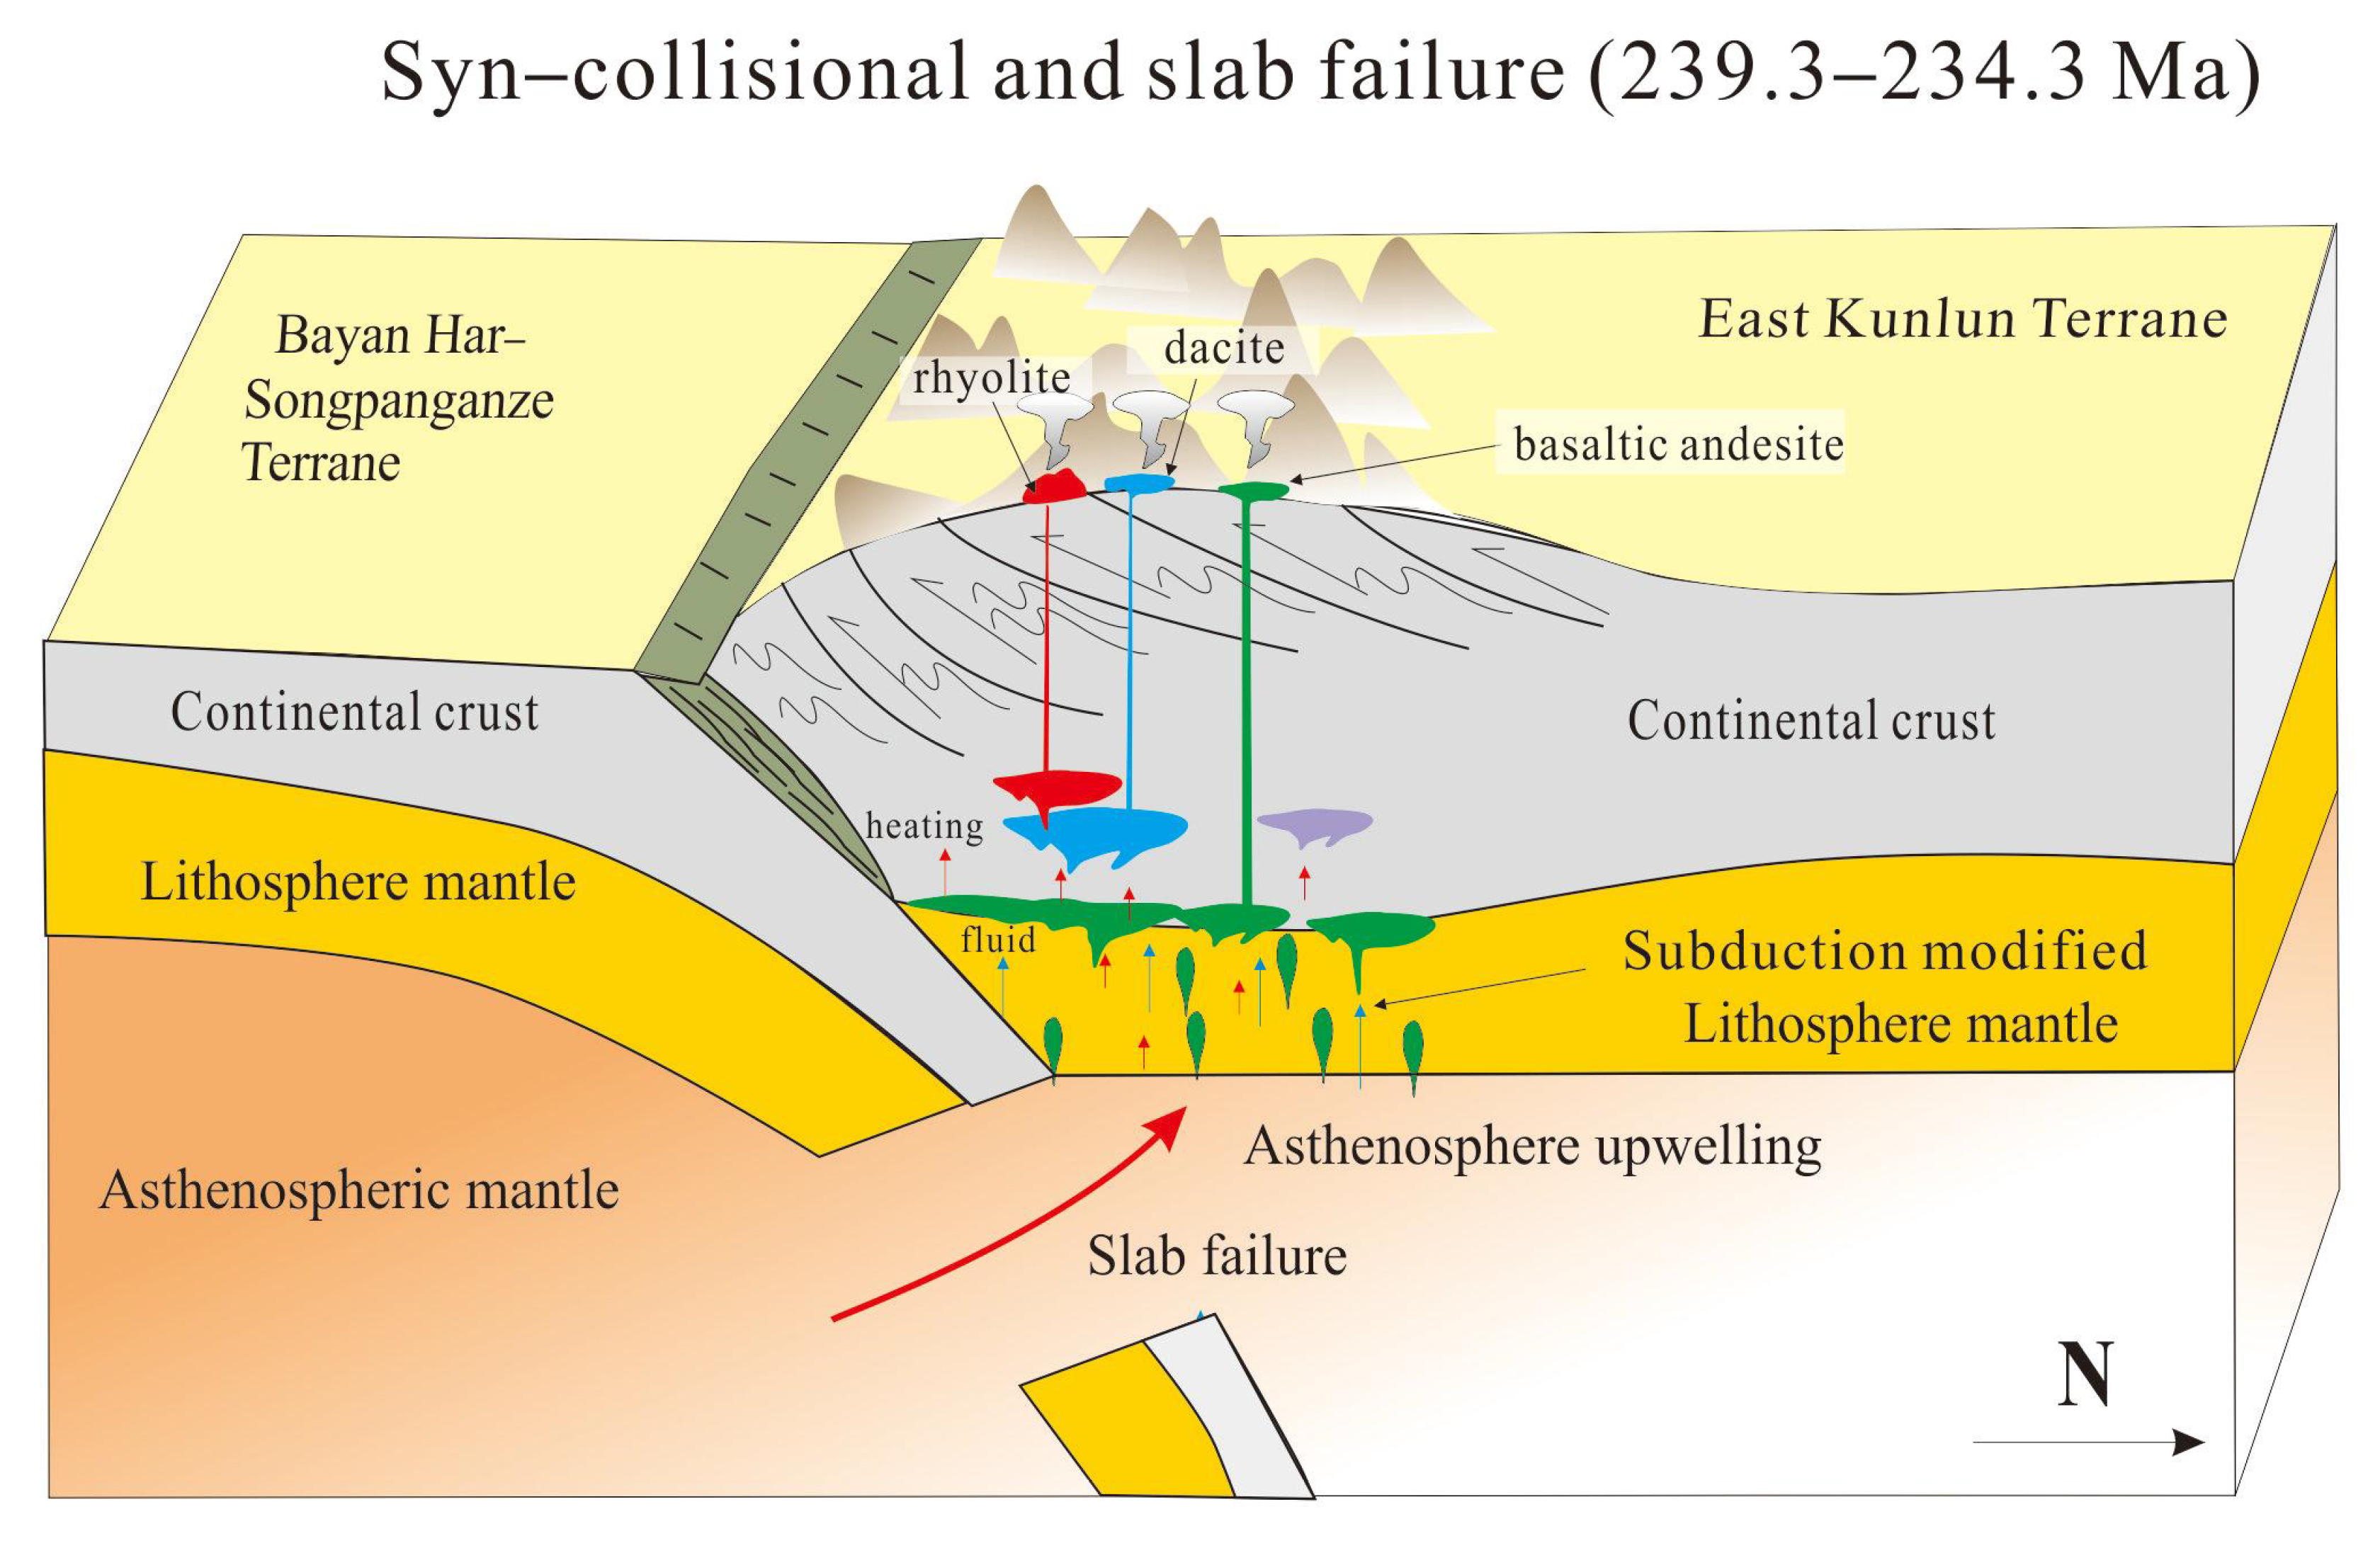
5.5. Geodynamic Model and Geological Implications

The ZRR dacite and GEY rhyolite have similar zircon U-Pb ages (239.3 ± 1.4 Ma and 237.8 ± 2.1 Ma, respectively), and are distributed in adjacent space positions (Figure 2). In the composition of rare-earth and trace elements, ZRR dacite and GEY rhyolite also have similar geochemical characteristics (Figure 7a–d). The petrogenesis shows that both rhyolite and dacite originated from the partial melting of the mafic lower crust of the Mesoproterozoic under an environment of relatively high temperature and low pressure. There is also a good linear correlation in the fractional crystallization diagram between the dacite and rhyolite (Figure 13a–c). The consistence of geochronology, geochemistry, and Hf isotope composition indicates that GEY rhyolite and ZRR dacite belong to the same magmatic pulse. Harker diagrams show that dacite and rhyolite have a certain correlation in the trend of major elements, but there is an obvious SiO2 gap (Figure 12e,f). This may be the result of a high degree of the fractional crystallization of rhyolite. In the FeOT/MgO vs. (Zr + Nb + Ce + Y) diagram and (K2O + Na2O)/CaO vs. (Zr + Nb + Ce + Y) diagram, GEY rhyolite shows the characteristics of highly differentiated rocks (Figure 12a,b), which is further proven by the high differentiation index of rhyolite (DI = 92.12–93.35). In summary, we infer that ZRR dacite and GEY rhyolite should be derived from the same or similar parent magma, and that they are volcanic rocks with different differentiation degrees formed in the same magmatic pulse activity. Differing from the earlier rhyolite and dacite, the basaltic andesite shows a relatively younger age (234 ± 1.2 Ma), characterized by low SiO2 (54.79–55.15 wt.%) and high MgO (4.12–4.30 wt.%) contents, with high Mg# (50.03–50.53) values. In terms of petrogenesis and source, unlike the earlier rhyolite and dacite, the basaltic andesite is mainly originated from the partial melting of the mantle, which was modified by fluid from the previous subducted slab, and the ratio of trace elements also shows the characteristics of the mantle source. Therefore, we infer that, differing from ZRR dacite and GEY rhyolite, DHB basaltic andesite is the product of another magmatic pulse activity. However, they were all formed in the environment of slab failure environments in the late stage of syn-collision, and they are different types of volcanic rocks from different sources under similar tectonic environments.
Based on the above discussion, we propose a geodynamic model to explain the formation and evolution of Middle–Late Triassic volcanic rocks in the Ela Mountain area of the East Kunlun Orogen. At the end of the Middle Triassic, the Paleo-Tethys Ocean in East Kunlun closed, and the collision between the Songpan–Ganzi–Bayanhar Terrane and the East Kunlun Terrane occurred. As the collision proceeded, the continental lithosphere associated with the subduction residual oceanic crust was dragged into the subduction zone by the high-density subduction oceanic crust, but due to the low density of the continental lithosphere, it was difficult to subduct continuously, and the slab failure occurred at the stress concentration of the subduction plate (Figure 17). Slab failure will lead to the formation of slab windows. Asthenosphere mantle upwelling through slab windows caused the partial melting of the lithospheric mantle and continental crust, which led to a large number of magmatic activities [87]. The slab failure and upwelling of the asthenosphere generate a decompression environment and provide a sufficient heat source to promote the partial melting of the mantle wedge and lower crust. In the environment of local low pressure and high temperature, the mantle-derived magma underplated and heated the lower crust, resulting in the partial melting of the Mesoproterozoic mafic lower crust. Some of the magma generated by the melting rose rapidly and formed the ZRR dacite; the rest of the homologous magma experienced a long fractional crystallization process, and the crystallization and separation of minerals such as clinopyroxene, hornblende and feldspar occurred, forming GRY rhyolite with highly fractionated characteristics. With the increase in the degree of slab failure and the intensive upwelling of the asthenosphere, at ca. 234.3 Ma the partial melting of the continental lithosphere mantle modified by subduction fluid occurred, producing the mantle-derived primitive magma with enriched mantle properties. The primitive mantle-derived magma experienced assimilation with a small amount of crustal components and fractional crystallization before it erupted onto the surface, increasing the content of SiO2, reducing the MgO content and Mg# values of the magma, and finally forming the DHB basaltic andesite.
The 239.3–234.3 Ma volcanic rocks in the Ela Mountain area of the eastern part of the East Kunlun Orogen were formed in the tectonic environment of the slab failure in the late stage of syn-collision (Figure 17). The identification of this magmatic process confirms that the Paleo-Tethys Ocean in the East Kunlun Orogen had closed before 239.3 Ma, which constricts the closure time of the Paleo-Tethys Ocean in the East Kunlun Orogen. Additionally, the formation of these volcanic rocks represents the beginning of the initial extension of the late stage of syn-collision. The identification of these volcanic rocks provides important information for regional tectonic evolution history, volcanic emplacement mechanisms, volcanic eruption sequences, and volcanic activity history.

6. Conclusions

  • ZRR dacite (239.3 ± 1.4 Ma) displays calc-alkaline I-type characteristics, and GEY rhyolite (237.8 ± 2.1 Ma) is similar to high-K calc-alkaline highly fractionated I-type volcanic rock. The petrogenesis shows that both rhyolite and dacite originated from the partial melting of the mafic lower crust of the Mesoproterozoic under relatively high temperature and low pressure. ZRR dacite and GEY rhyolite were derived from the same or similar parent magma, and they are volcanic rocks with different differentiation degrees formed in the same magmatic pulse activity.
  • The DHB basaltic andesite shows a relatively younger age (234.3 ± 1.2 Ma). The petrogenesis shows that DHB basaltic andesite mainly originated from the partial melting of the lithospheric mantle modified by subducted slab-derived fluids; the magma was contaminated with a small amount of crustal source components and experienced fractional crystallization before it erupted onto the surface. Different from ZRR dacite and GEY rhyolite, DHB basaltic andesite is the product of another magmatic pulse activity. However, they all formed in the same environment of slab failure in the late stage of syn-collision, and they are different types of volcanic rocks from different sources under similar tectonic environments.
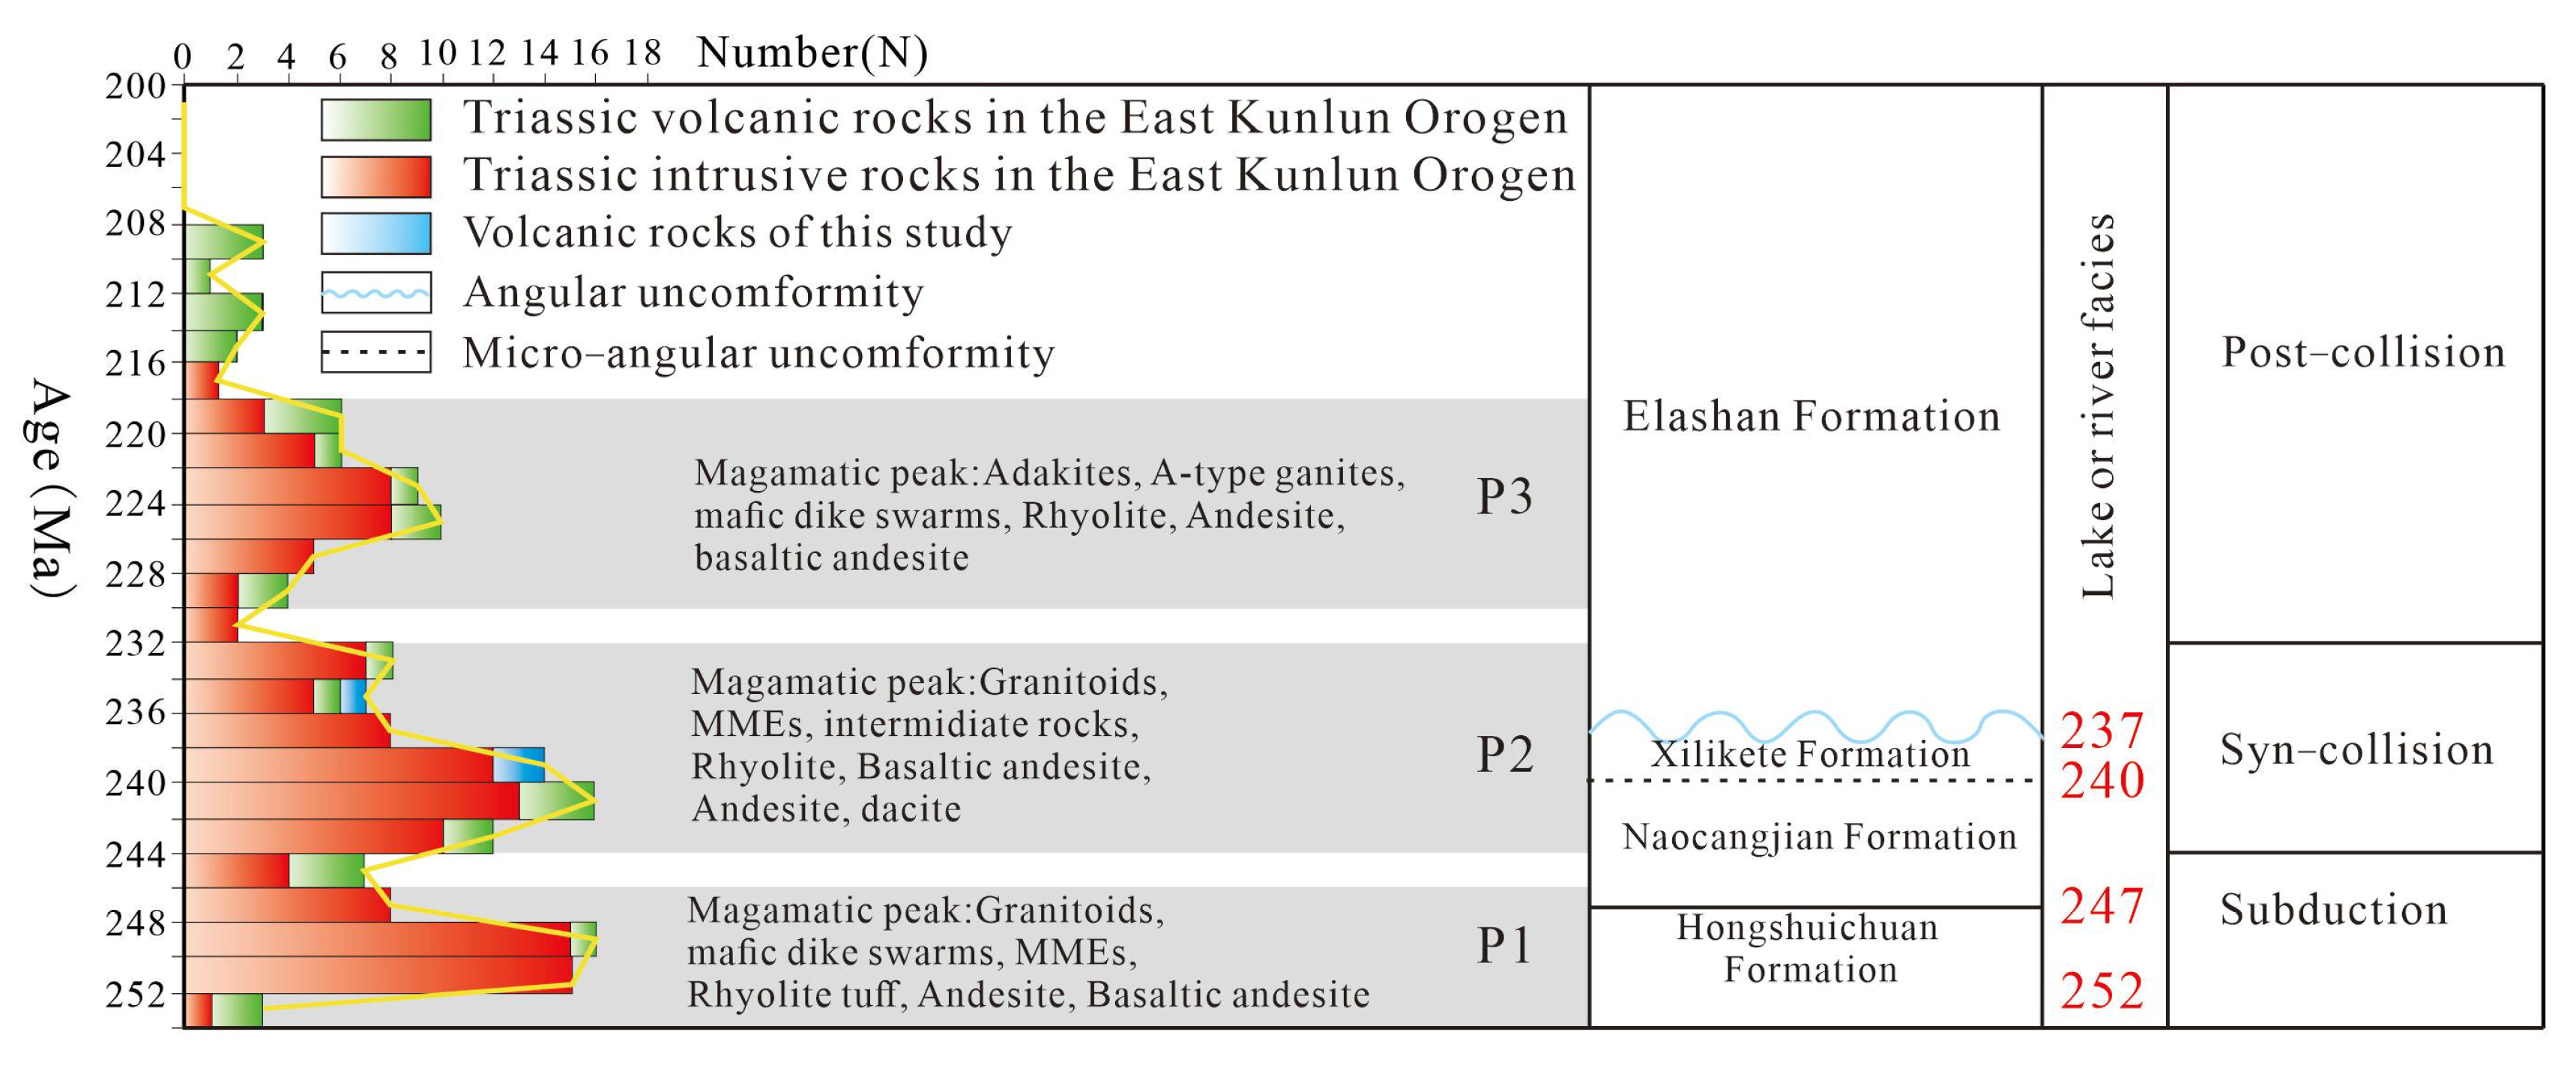
  • The volcanic rocks of the Ela Mountain area in this contribution provide important evidence for magmatism in the slab failure stages. The results of this study confirm that the Paleo-Tethys Ocean in the East Kunlun Orogen had closed before 239.3 Ma, and that the formation of these volcanic rocks represents the beginning of the initial extension of the late stage of syn-collision.

Supplementary Materials

The following supporting information can be downloaded at: https://www.mdpi.com/article/10.3390/min12091085/s1. Table S1: Published zircon Lu-Hf isotopes of the Triassic volcanic and intrusive rocks in the East Kunlun Orogen; Table S2: Published ages of the Triassic volcanic and intrusive rocks in the East Kunlun Orogen.

Author Contributions

Conceptualization, Z.P. and F.S.; Investigation, Z.P. and Z.C.; Funding acquisition, F.S.; Project administration, F.S.; Writing—original draft preparation, Z.P.; Writing—review and editing, Z.P., F.S. and Z.C. All authors have read and agreed to the published version of the manuscript.

Funding

This research was funded by the National Natural Science Foundation of China (No. 41272093) and Geological Investigation Project of Geological Survey of China (No. 1212011085485).

Data Availability Statement

The authors confirm that the data supporting the findings of this study are available within the article [and/or] its Supplementary Materials.

Acknowledgments

We are grateful to the journal editor for her or his patience in dealing with our manuscript. We thank the reviewers for their constructive comments and suggestions, which improved the manuscript.

Conflicts of Interest

The authors declare no conflict of interest.

References

  1. Kamaunji, V.D.; Wang, L.X.; Ma, C.Q.; Liu, J.; Zhu, Y.X. Petrogenesis and tectonic implication of the Permian-Triassic syenogranites from the eastern segment of the East Kunlun Orogen, China. Lithos 2020, 402, 105932. [Google Scholar] [CrossRef]
  2. Luo, F.M.; Mo, X.X.; Yu, X.H.; Li, X.W.; Huang, X.F. Zircon U-Pb geochronology, petrogenesis and implication of the Late Permian granodiorite from the Wulonggou area in East Kunlun, Qinghai Province. Earth Sci. Front. 2015, 22, 14. [Google Scholar]
  3. Ren, H.D.; Wang, T.; Zhang, L.; Wang, X.X.; Huang, H.; Feng, C.Y.; Claudia, T.; Song, P. Ages, Sources and Tectonic Settings of the Triassic Igneous Rocks in the Easternmost Segment of the East Kunlun Orogen, central China. Acta Geol. Sin. Engl. Ed. 2016, 90, 641–668. [Google Scholar] [CrossRef]
  4. Chen, G.C.; Pei, X.Z.; Li, R.B.; Li, Z.C.; Pei, L.; Liu, C.J.; Chen, Y.X.; Li, X.B. Triassic magma mixing and mingling at the eastern section of Eastern Kunlun: A case study from Xiangjiananshan granitic batholith. Acta Petrol. Sin. 2018, 34, 2441–2480. [Google Scholar]
  5. Xiong, F.H.; Ma, C.Q.; Zhang, J.Y.; Liu, B.; Jiang, H.A. Reworking of old continental lithosphere: An important crustal evolution mechanism in orogenic belts, as evidenced by Triassic I-type granitoids in the East Kunlun orogen, Northern Tibetan Plateau. J. Geol. Soc. 2014, 171, 847–863. [Google Scholar] [CrossRef]
  6. Li, R.B.; Pei, X.Z.; Li, Z.C.; Pei, L.; Chen, G.C.; Chen, Y.X.; Liu, C.J.; Wang, S.M. Paleo-Tethys Ocean subduction in eastern section of East Kunlun Orogen: Evidence from the geochronology and geochemistry of the Wutuo pluton. Acta Petrol. Sin. 2018, 34, 3399–3421. [Google Scholar]
  7. Sun, F.Y.; Li, B.L.; Ding, Q.F.; Zhao, J.W.; Pan, T.; Yu, X.F.; Wang, L.; Chen, G.J.; Ding, Z.J. Research on the Key Problems of Ore Prospecting in the Eastern Kunlun Metallogenic Belt; Geological Survey Institute of Jilin University: Changchun, China, 2009. (In Chinese) [Google Scholar]
  8. Xia, R. Paleo-Tethys Orogenic Process and Gold Metallogenesis of the East Kunlun; China University of Geosciences: Beijing, China, 2017; pp. 1–215. [Google Scholar]
  9. Hu, Y.; Niu, Y.L.; Li, J.Y.; Ye, L.; Kong, J.J.; Chen, S.; Zhang, Y.; Zhang, G.R. Petrogenesis and tectonic significance of the late Triassic mafic dikes and felsic volcanic rocks in the East Kunlun Orogenic Belt, Northern Tibet Plateau. Lithos 2016, 245, 205–222. [Google Scholar] [CrossRef]
  10. Ding, S.; Huang, H.; Niu, Y.L.; Zhao, Z.D.; Mo, X.X. Geochemistry, geochronology and petrogenesis of East Kunlun high Nb-Ta rhyolites. Acta Petrol. Sin. 2011, 27, 3603–3614. [Google Scholar]
  11. Fan, X.Z.; Sun, F.Y.; Xu, C.H.; Wu, D.Q.; Yu, L.; Wang, L.; Yan, C.; Bakht, S. Volcanic rocks of the Elashan Formation in the Dulan-Xiangride Basin, East Kunlun Orogenic Belt, NW China: Petrogenesis and implications for Late Triassic geodynamic evolution. Int. Geol. Rev. 2021, 64, 1270–1293. [Google Scholar]
  12. Shao, F.L.; Niu, Y.L.; Liu, Y.; Chen, S.; Kong, J.J.; Duan, M. Petrogenesis of Triassic granitoids in the East Kunlun Orogenic Belt, northern Tibetan Plateau and their tectonic implications. Lithos 2017, 282, 33–44. [Google Scholar] [CrossRef]
  13. Kong, J.J.; Niu, Y.L.; Hu, Y.; Zhang, Y.; Shao, F.L. Petrogenesis of the Triassic granitoids from the East Kunlun Orogenic Belt, NW China: Implications for continental crust growth from syn-collisional to post-collisional setting. Lithos 2020, 364, 105513. [Google Scholar] [CrossRef]
  14. Xin, W.; Sun, F.Y.; Zhang, Y.T.; Fan, X.Z.; Wang, Y.C.; Li, L. Mafic-intermediate igneous rocks in the East Kunlun Orogenic Belt, northwestern China: Petrogenesis and implications for regional geodynamic evolution during the Triassic. Lithos 2019, 346, 105159. [Google Scholar] [CrossRef]
  15. Liang, Y.Y.; Xia, R.; Shan, X.; Ma, Y.; Zhao, E.Q.; Guo, W. Geochronology and Geochemistry of Ore-Hosting Rhyolitic Tuff in the Kengdenongshe Polymetallic Deposit in the Eastern Segment of the East Kunlun Orogen. Minerals 2019, 9, 589. [Google Scholar] [CrossRef]
  16. Zhao, X.; Wei, J.H.; Fu, L.B.; Huizenga, J.M.; Santosh, M.; Chen, J.J.; Wang, D.Z.; Li, A.B. Multi-stage crustal melting from Late Permian back-arc extension through Middle Triassic continental collision to Late Triassic post-collisional extension in the East Kunlun Orogen. Lithos 2020, 360, 105446. [Google Scholar] [CrossRef]
  17. Tian, N.; Sun, F.Y.; Pan, Z.C.; Li, L.; Gu, Y.; Wu, D.Q.; Deng, J.F.; Liu, Z.D.; Wang, L.; Zhang, Y.J. Triassic igneous activities in the east flank of the East Kunlun orogenic belt: The Daheba complex example. Int. Geol. Rev. 2021, 12, 1–28. [Google Scholar] [CrossRef]
  18. Tian, N.; Sun, F.Y.; Pan, Z.C.; Li, L.; Yan, J.M.; Wu, D.Q.; Gu, Y.; Deng, J.F.; Liu, Z.D.; Wang, L.; et al. Petrogenesis and tectonic setting of Mid-Triassic volcanic rocks in the East Kunlun orogenic belt, NW China: Insights from geochemistry, zircon U-Pb dating, and Hf isotopes. Geol. J. 2021, 56, 3257–3274. [Google Scholar] [CrossRef]
  19. Li, X.W.; Huang, X.F.; Luo, M.F.; Dong, G.C.; Mo, X.X. Petrogenesis and geodynamic implications of the Mid-Triassic lavas from East Kunlun, northern Tibetan Plateau. J. Asian Earth Sci. 2015, 105, 32–47. [Google Scholar] [CrossRef]
  20. Yuan, C.; Zhou, M.F.; Sun, M.; Zhao, Y.; Wilde, S.; Long, X.; Yan, D. Triassic granitoids in the eastern Songpan Ganzi Fold Belt, SW China: Magmatic response to geodynamics of the deep lithosphere. Earth Planet. Sci. Lett. 2010, 290, 481–492. [Google Scholar]
  21. Qi, S.S.; Yu, W.J.; Zhang, X.B. 1:250,000 Geological Maps from the Comprehensive Geological Map of Xinghai County, Qinghai Province; Qinghai GeoLogicaL Survey Institute: Xining, China, 2011; p. 1. [Google Scholar]
  22. Wiedenbeck, M.; Allé, P.; Corfu, F.; Griffin, W.L.; Meier, M.; Oberli, F.; von Quadt, A.; Roddick, J.C.; Spiegel, W. Three natural zircon standards for U–Th–Pb, Lu–Hf, trace element and REE analyses. Geostand. Newsl. 1995, 19, 1–23. [Google Scholar]
  23. Andersen, T. Correction of common lead in U–Pb analyses that do not report 204 Pb. Chem. Geol. 2002, 192, 59–79. [Google Scholar]
  24. Ludwig, K.R. ISOPLOT 3.0: A Geochronological Toolkit for Microsoft Excel. Berkeley Geochronol. Cent. Spec. Publ. 2003, 4, 70. [Google Scholar]
  25. McDonough, W.F.; Sun, S.S. The composition of the Earth. Chem. Geol. 1995, 120, 223–253. [Google Scholar] [CrossRef]
  26. Thornton, C.P.; Tuttle, O.F. Chemistry of igneous rocks—[Part] 1, Differentiation index. Am. J. Sci. 1960, 258, 664–684. [Google Scholar]
  27. Watson, E.B.; Harrison, T.M. Zircon saturation revisited: Temperature and composition effects in a variety of crustal magma types. Earth Planet. Sci. Lett. 1983, 64, 295–304. [Google Scholar] [CrossRef]
  28. Boehnke, P.; Watson, E.B.; Trail, D.; Harrison, T.M.; Schmitt, A.K. Zircon saturation re-revisited. Chem. Geol. 2013, 351, 324–334. [Google Scholar]
  29. Hu, Z.C.; Zhang, W.; Liu, Y.S.; Gao, S.; Li, M.; Zong, K.Q.; Chen, H.H.; Hu, S.H. “Wave” Signal-Smoothing and Mercury-Removing Device for Laser Ablation Quadrupole and Multiple Collector ICPMS Analysis: Application to Lead Isotope Analysis. Anal. Chem. 2015, 87, 1152–1157. [Google Scholar]
  30. Hu, Z.C.; Liu, Y.S.; Gao, S.; Liu, W.; Yang, L.; Zhang, W.; Tong, X.; Lin, L.; Zong, K.Q.; Li, M.; et al. Improved In Situ Hf isotope ratio analysis of zircon using newly designed X skimmer cone and Jet sample cone in combination with the addition of nitrogen by laser ablation multiple collector ICP-MS. J. Anal. At. Spectrom. 2012, 27, 1391–1399. [Google Scholar]
  31. Fisher, C.M.; Vervoort, J.D.; Hanchar, J.M. Guidelines for reporting zircon Hf isotopic data by LA-MC-ICPMS and potential pitfalls in the interpretation of these data. Chem. Geol. 2014, 363, 125–133. [Google Scholar] [CrossRef]
  32. Blichert-Toft, J.; Chauvel, C.; Albarède, F. Separation of Hf and Lu for high-precision isotope analysis of rock samples by magnetic sector-multiple collector ICP-MS. Contrib. Mineral. Petrol. 1997, 127, 248–260. [Google Scholar] [CrossRef]
  33. Liu, Y.S.; Gao, S.; Hu, Z.C.; Gao, C.G.; Zong, K.Q.; Wang, D.B. Continental and Oceanic Crust Recycling-induced Melt-Peridotite Interactions in the Trans-North China Orogen: U-Pb Dating, Hf Isotopes and Trace Elements in Zircons from Mantle Xenoliths. J. Petrol. 2010, 51, 537–571. [Google Scholar] [CrossRef]
  34. Zhang, W.; Hu, Z.C. Estimation of Isotopic Reference Values for Pure Materials and Geological Reference Materials. At. Spectrosc. 2020, 41, 93–102. [Google Scholar] [CrossRef]
  35. Blichert-Toft, J.; Albarede, F. The Lu-Hf isotope geochemistry of chondrites and the evolution of the mantle-crust system. Earth Planet. Sci. Lett. 1997, 148, 243–258. [Google Scholar]
  36. Griffin, W.L.; Wang, X.; Jackson, S.E.; Pearson, N.J.; O’Reilly, S.Y.; Xu, X.; Zhou, X. Zircon chemistry and magma mixing, SE China: In-Situ analysis of Hf isotopes, Tonglu and Pingtan igneous complexes. Lithos 2002, 61, 237–269. [Google Scholar]
  37. Hoskin, P.W.O.; Schaltegger, U. The Composition of Zircon and Igneous and Metamorphic Petrogenesis. Rev. Mineral. Geochem. 2003, 53, 27–62. [Google Scholar] [CrossRef]
  38. Middlemost, E.A.K. Naming materials in the magma/igneous rock system. Earth Sci. Rev. 1994, 37, 215–224. [Google Scholar] [CrossRef]
  39. Maniar, P.D.; Piccoli, P.M. Tectonic discrimination of granitoids. Geol. Soc. Am. Bull. 1989, 101, 635–643. [Google Scholar] [CrossRef]
  40. Peccerillo, A.; Taylor, S.R. Geochemistry of eocene calc-alkaline volcanic rocks from the Kastamonu area, Northern Turkey. Contrib. Mineral. Petrol. 1976, 58, 63–81. [Google Scholar]
  41. Ringwood, A.E. Composition and Petrology of the Earth’s Mantle; McGraw-Hill: London, UK; New York, NY, USA; Sydney, Australia, 1975; pp. 1–618. [Google Scholar]
  42. Rudnick, R.L.; Gao, S. Composition of the Continental Crust. Treatise Geochem. 2003, 3, 1–64. [Google Scholar] [CrossRef]
  43. Sun, S.S.; McDonough, W.F. Chemical and isotopic systematics of oceanic basalts: Implications for mantle composition and processes. Geol. Soc. Lond. Spec. Publ. 1989, 42, 313–345. [Google Scholar]
  44. Pan, Z.C.; Sun, F.Y.; Cong, Z.C.; Tian, N.; Xin, W.; Wang, L.; Zhang, Y.J.; Wu, D.Q. Petrogenesis and Tectonic Implications of the Triassic Granitoids in the Ela Mountain Area of the East Kunlun Orogenic Belt. Minerals 2022, 12, 880. [Google Scholar]
  45. Wu, D.Q.; Sun, F.Y.; Pan, Z.C.; Tian, N. Geochronology, geochemistry, and Hf isotopic compositions of Triassic igneous rocks in the easternmost segment of the East Kunlun Orogenic Belt, NW China: Implications for magmatism and tectonic evolution. Int. Geol. Rev. 2021, 63, 1011–1029. [Google Scholar] [CrossRef]
  46. Zhu, Y.X.; Wang, L.X.; Ma, C.Q.; He, Z.X.; Deng, X.; Tian, Y. Petrogenesis and tectonic implication of the Late Triassic A1-type alkaline volcanics from the Xiangride area, eastern segment of the East Kunlun Orogen (China). Lithos 2022, 412, 106595. [Google Scholar]
  47. Zhou, H.; Zhang, D.; Wei, J.; Wang, D.; Santosh, M.; Shi, W.; Chen, J.; Zhao, X. Petrogenesis of Late Triassic mafic enclaves and host granodiorite in the Eastern Kunlun Orogenic Belt, China: Implications for the reworking of juvenile crust by delamination-induced asthenosphere upwelling. Gondwana Res. 2020, 84, 52–70. [Google Scholar] [CrossRef]
  48. Adam, M.M.A.; Lv, X.B.; Fathy, D.; Rahman, A.R.A.A.; Ali, A.A.; Mohammed, A.S.; Farahat, E.S.; Sami, M. Petrogenesis and tectonic implications of Tonian island arc volcanic rocks from the Gabgaba Terrane in the Arabian-Nubian Shield (NE Sudan). J. Asian Earth Sci. 2022, 223, 105006. [Google Scholar] [CrossRef]
  49. Large, R.R.; Gemmell, J.B.; Paulick, H.; Huston, D.L. The alteration box plot: A simple approach to understanding the relationship between alteration mineralogy and lithogeochemistry associated with volcanic-hosted massive sulfide deposits. Econ. Geol. 2001, 96, 957–971. [Google Scholar] [CrossRef]
  50. Whalen, J.B.; Hildebrand, R.S. Trace element discrimination of arc, slab failure, and A-type granitic rocks. Lithos 2019, 348, 105179. [Google Scholar] [CrossRef]
  51. Li, R.B. Research on the Late Paleozoic-Early Mesozoic Orogeny in East Kunlun Orogen; Chang’an University: Xi’an, China, 2012; pp. 1–185. [Google Scholar]
  52. Chen, N.; Sun, M.; Wang, Q.; Zhao, G.; Chen, Q.; Shu, G. EMP chemical ages of monazites from Central Zone of the eastern Kunlun Orogen: Records of multi-tectonometamorphic events. Chin. Sci. Bull. 2007, 52, 2252–2263. [Google Scholar] [CrossRef]
  53. Liu, Y.J.; Genser, J.; Neubauer, F.; Jin, W.; Ge, X.H.; Handler, R.; Takasu, A. 40Ar/39Ar mineral ages from basement rocks in the Eastern Kunlun Mountains, NW China, and their tectonic implications. Tectonophysics 2005, 398, 199–224. [Google Scholar] [CrossRef]
  54. Deng, W.B.; Pei, X.Z.; Liu, C.J.; Li, Z.C.; Li, R.B.; Chen, Y.X.; Chen, G.C.; Yang, S.; Chen, G.; Sang, J.Z.; et al. LA-ICP-MS zircon U-Pb dating of the Chahantaolegai syenogranites in Xiangride area of East Kunlun and its geological significance. Geol. Bull. China 2016, 35, 687–699. [Google Scholar]
  55. Collins, W.; Beams, S.; White, A.; Chappell, B. Nature and origin of A-type granites with particular reference to SE Australia. Contrib. Mineral. Petrol. 1982, 80, 189–200. [Google Scholar] [CrossRef]
  56. Whalen, J.; Currie, K.; Chappell, B. A-type granites: Geochemical characteristics, discrimination and petrogenesis. Contrib. Mineral. Petrol. 1987, 95, 407–419. [Google Scholar] [CrossRef]
  57. Bi, J.H. Late Paleozoic Tectonic-Magmatic Evolution of the Eastern Jiamusi Massif. Ph.D. Thesis, Jilin University, Changchun, China, 2018; pp. 1–220. [Google Scholar]
  58. Macpherson, C.G.; Dreher, S.T.; Thirlwall, M.F. Adakites without slab melting: High pressure differentiation of island arc magma, Mindanao, the Philippines. Earth Planet. Sci. Lett. 2006, 243, 581–593. [Google Scholar] [CrossRef]
  59. Dungan, M.A.; Davidson, J. Partial assimilative recycling of the mafic plutonic roots of arc volcanoes: An example from the Chilean Andes. Geology 2004, 32, 773–776. [Google Scholar] [CrossRef]
  60. Smith, I.E.M.; Stewart, R.B.; Price, R.C. The petrology of a large intra-oceanic silicic eruption: The Sandy Bay Tephra, Kermadec Arc, Southwest Pacific. J. Volcanol. Geotherm. Res. 2003, 124, 173–194. [Google Scholar] [CrossRef]
  61. Rapp, R.P. Amphibole-out phase boundary in partially melted metabasalt, its control over liquid fraction and composition, and source permeability. J. Geophys. Res. Solid Earth 1995, 100, 15601–15610. [Google Scholar] [CrossRef]
  62. Rapp, R.P.; Watson, E.B. Dehydration Melting of Metabasalt at 8–32 kbar: Implications for Continental Growth and Crust-Mantle Recycling. J. Petrol. 1995, 36, 891–931. [Google Scholar] [CrossRef]
  63. Königer, S.; Lorenz, V. Geochemistry, tectonomagmatic origin and chemical correlation of altered Carboniferous-Permian fallout ash tuffs in southwestern Germany. Geol. Mag. 2002, 139, 541–558. [Google Scholar] [CrossRef]
  64. Taylor, S.R.; Mclennan, S.M. The continental crust: Its composition and evolution. J. Geol. 1985, 94, 57–72. [Google Scholar]
  65. Chen, N.S.; Yan, L.X.; Zhang, K.X.; Wang, G.; Zhu, Y.H.; Hou, G.J.; Bai, Y.S. Lithological Characteristics of the Baishahe Formation to the South of Xiangride Town, Eastern Kunlun Mountains and Its Age Constrained from Zircon Pb–Pb Dating. Geol. Sci. Technol. Inf. 2006, 25, 1–7. [Google Scholar]
  66. Chen, W.X.; Fei, X.C.; Li, R.B.; Liu, Z.Q.; Li, Z.C.; Zhang, X.F.; Chen, G.C.; Liu, Z.G.; Ding, S.B.; Guo, D.F. Zircon U-Pb Age of Xiaomiao Formation of Proterozoic in the Eastern & nbsp; Section of the East Kunlun Orogenic Belt. Geoscience 2011, 25, 510–521. [Google Scholar]
  67. Niu, Y.L.; Batiza, R. Trace element evidence from seamounts for recycled oceanic crust in the Eastern Pacific mantle. Earth Planet. Sci. Lett. 1997, 148, 471–483. [Google Scholar] [CrossRef]
  68. Douce, P. Amphibolite to granulite transition in aluminous greywackes from the Sierra de Comechingones, Córdoba, Argentina. J. Metamorph. Geol. 1999, 17, 415–434. [Google Scholar] [CrossRef]
  69. Anderson, J.L.; Bender, E.E. Nature and origin of Proterozoic A-type granitic magmatism in the southwestern United States of America. Lithos 1989, 23, 19–52. [Google Scholar] [CrossRef]
  70. Long, L.E.; Sial, A.N.; Nekvasil, H.; Borba, G.S. Origin of granite at Cabo de santo Agostinho, Northeast Brazil. Contrib. Mineral. Petrol. 1986, 92, 341–350. [Google Scholar] [CrossRef]
  71. Chappell, B.W. Aluminium saturation in I- and S-type granites and the characterization of fractionated haplogranites. Lithos 1999, 46, 535–551. [Google Scholar] [CrossRef]
  72. Champion, D.C.; Chappell, B.W. Petrogenesis of felsic I-type granites: An example from northern Queensland. Trans. R. Soc. Edinb.-Earth Sci. 1992, 83, 115–126. [Google Scholar]
  73. Richards, J.P. Magmatic to hydrothermal metal fluxes in convergent and collided margins. Ore Geol. Rev. 2011, 40, 1–26. [Google Scholar] [CrossRef]
  74. Moyen, J.F. High Sr/Y and La/Yb ratios: The meaning of the “adakitic signature”. Lithos 2009, 112, 556–574. [Google Scholar] [CrossRef]
  75. Douce, A.E.P.; Johnston, A.D. Phase equilibria and melt productivity in the pelitic system: Implications for the origin of peraluminous granitoids and aluminous granulites. Contrib. Mineral. Petrol. 1991, 107, 202–218. [Google Scholar] [CrossRef]
  76. Sklyarov, E.V.; Gladkochub, D.P.; Mazukabzov, A.M.; Menshagin, Y.V.; Watanabe, T.; Pisarevsky, S.A. Neoproterozoic mafic dike swarms of the Sharyzhalgai metamorphic massif, southern Siberian craton. Precambrian Res. 2003, 122, 359–376. [Google Scholar] [CrossRef]
  77. Zhao, J.H.; Zhou, M.F. Geochemistry of Neoproterozoic mafic intrusions in the Panzhihua district (Sichuan Province, SW China): Implications for subduction-related metasomatism in the upper mantle. Precambrian Res. 2007, 152, 27–47. [Google Scholar] [CrossRef]
  78. Frey, F.A.; Green, D.H.; Roy, S.D. Integrated Models of Basalt Petrogenesis: A Study of Quartz Tholeiites to Olivine Melilitites from South Eastern Australia Utilizing Geochemical and Experimental Petrological Data. J. Petrol. 1978, 19, 463–513. [Google Scholar] [CrossRef]
  79. Wendlandt, R.F.; Altherr, R.; Nuemann, E.R.; Baldrige, W.S. Petology, geochemistry, isotopes. In Continental Rifts: Evolution, Structures, Tectonics; Olsen, K.H., Ed.; Elsevier: Amsterdam, The Netherlands, 1995; pp. 47–60. [Google Scholar]
  80. Bea, F.; Arzamastsev, A.; Montero, P.; Arzamastseva, L. Anomalous alkaline rocks of Soustov, Kola: Evidence of mantle-derived metasomatic fluids affecting crustal materials. Contrib. Mineral. Petrol. 2001, 140, 554–566. [Google Scholar] [CrossRef]
  81. Wang, Q.; Xu, J.F.; Jian, P.; Bao, Z.W.; Zhao, Z.H.; Li, C.F.; Xiong, X.L.; Ma, J.L. Petrogenesis of Adakitic Porphyries in an Extensional Tectonic Setting, Dexing, South China: Implications for the Genesis of Porphyry Copper Mineralization. J. Petrol. 2006, 47, 119–144. [Google Scholar] [CrossRef]
  82. Woodhead, J.D.; Hergt, J.M.; Davidson, J.P. Hafnium isotope evidence for ‘Conservative’ element mobility during subduction zone processes. Earth Planet. Sci. Lett. 2001, 192, 331–346. [Google Scholar] [CrossRef]
  83. Hofmann, A.W.; Jochum, K.P. Source characteristics derived fromvery incompatible trace elements in Mauna Loa and Mauna Kea basalts, Hawaii Scientifific Drilling Project. J. Geophys. Res. 1996, 101, 11831–11839. [Google Scholar] [CrossRef]
  84. Saunders, A.D.; Storey, M.; Kent, R.W.; Norry, M.J. Consequences of plume-lithosphere interactions. In Magmatism and the Cause of Continental Breakup; Storey, B.C., Alabaster, T., Pankhurst, R.J., Eds.; Geological Society of Special Publication: London, UK, 1992; Volume 68, pp. 41–60. [Google Scholar]
  85. Pearce, J.A. Geochemical fifingerprinting of oceanic basalts with applications to ophiolite classifification and the search for Archean oceanic crust. Lithos 2008, 100, 14–48. [Google Scholar] [CrossRef]
  86. Chen, X.D.; Li, B.; Sun, C.B.; Zhou, H.B. Protracted Storage for Calc-Alkaline Andesitic Magma in Magma Chambers: Perspective from the Nageng Andesite, East Kunlun Orogen, NW China. Minerals 2021, 11, 198. [Google Scholar] [CrossRef]
  87. Garzanti, E.; Radeff, G.; Malusà, M.G. Slab Breakoff: A Critical Appraisal of a Geological Theory as Applied in Space and Time. Earth Sci. Rev. 2018, 177, 303–319. [Google Scholar] [CrossRef]
Figure 1. (a) Tectonic map of the Central Orogenic Belt in China revised from [20]. ① West Kunlun Orogen; ② East Kunlun Orogen; ③ Altun Mountains; ④ Qaidam block; ⑤ Quanji block; ⑥ Central-South Qilian Orogen; ⑦ North Qianlian Orogen; ⑧ Qinling Orogen; ⑨ Wudang-Suinan continental marginal rift; ⑩ Sulu-Dabie block. (b) Schematic geological map of the eastern part of the East Kunlun Orogen. EKO: East Kunlun Orogen; WQO: West Qingling Orogen; N-KLF: North Kunlun Fault; C-KLF: Center Kunlun Fault; and S-KLF: South Kunlun Fault. Modified from [17].
Minerals 12 01085 g001
Figure 2. Geological map of the Ela Mountain area. Modified from [21].
Minerals 12 01085 g002
Figure 3. Field photographs and photomicrographs of the volcanic rocks. (a) ZRR dacite (field photos). (b) ZRR dacite (plane-polarized light). (c) ZRR dacite (cross-polarized light). (d) GEY rhyolite (field photos). (e) GEY rhyolite (plane-polarized light). (f) GEY rhyolite (cross-polarized light). (g) DHB basaltic andesite (field photos). (h) DHB basaltic andesite (cross-polarized light). (i) DHB basaltic andesite (cross-polarized light). Mineral abbreviations: Pl, plagioclase; Qtz, quartz; Ep, epidote; Kfs, K-feldspar; Amp, amphibole.
Minerals 12 01085 g003
Figure 4. Representative cathodoluminescence images of zircons from the volcanic rocks in the Ela Mountain area. (a) ZRR dacite (ZRR02); (b) GEY rhyolite (GEY01); and (c) DHB basaltic andesite (DHB03).
Minerals 12 01085 g004
Figure 5. The zircon U-Pb concordia diagrams and weighted-mean ages. (a,b) ZRR dacite (ZRR02). (c,d) GEY rhyolite (GEY01). (e,f) DHB basaltic andesite (DHB03).
Minerals 12 01085 g005
Figure 6. (a) Total alkali vs. SiO2 (TAS) diagram [38]; (b) A/NK vs. A/CNK diagram (A/NK = Al2O3/(Na2O + K2O) molar, A/CNK = Al2O3/(CaO + Na2O + K2O) molar) [39]; (c) K2O vs. SiO2 diagram [40]; and (d) AFM diagram [41].
Minerals 12 01085 g006
Figure 7. The chondrite-normalized REE patterns and primitive mantle-normalized spider diagrams of trace elements. (a,b) ZRR dacite; (c,d) GEY rhyolite; and (e,f) DHB basaltic andesite. The bulk continental crust values were from [42]. The chondrite values and primitive mantle values were from [43]. Previous data are from [3,14,16,18,44,45], and they represent igneous rock samples in the East Kunlun Orogen of the same period as the volcanic rocks studied in this paper.
Minerals 12 01085 g007
Figure 8. Zircon εHf(t) vs. age diagram. Base map is from [46]. Published zircon Lu-Hf isotope data and data sources of Triassic volcanic and intrusive rocks in the East Kunlun Orogen are presented in Supplementary Table S1.
Minerals 12 01085 g008
Figure 9. Histogram of the zircon U-Pb ages of the Triassic magmatic rocks in the East Kunlun Orogen from [44]. The yellow line is the line chart of age distribution. The data sources are listed in Supplementary Table S2.
Minerals 12 01085 g009
Figure 10. Alteration box plot from [48,49]; the dashed line separates the hydrothermal (upper right) and diagenetic (lower left) alteration fields. Alteration index = 100 (K2O + MgO)/(K2O + MgO + Na2O + CaO); chlorite carbonate-pyrite index (CCP index) = 100 (MgO + FeO)/(MgO + FeO + Na2O + K2O), where FeO is the total (FeO + Fe2O3) content of the rock.
Minerals 12 01085 g010
Figure 11. Discrimination diagrams of tectonic environments for separating arc, slab failure and A1 as well as A2 compositions from [50]. (a) La/Yb vs. Nb + Y diagram; (b) Nb/Y vs. Nb + Y diagram; (c) La/Yb vs. Ta + Yb diagram; (d) Nb/Y vs. Ta + Yb diagram; (e) Nb vs. Y diagram; (f) Rb vs. Y diagram. The previous data are from [3,14,18,44,45], and they represent igneous rock samples in the East Kunlun Orogen of the same period as the volcanic rocks studied in this paper.
Minerals 12 01085 g011
Figure 12. (a) FeOT/MgO vs. (Zr + Nb + Ce + Y) diagram; (b) (K2O + Na2O)/CaO vs. (Zr + Nb + Ce + Y) diagram; (c) Y vs. 10,000 Ga/Al diagram; (d) Zr vs. 10,000 Ga/Al diagram (ad are from [56]); (e) P2O5 vs. SiO2 diagram; and (f) Al2O3 vs. SiO2 diagram. A: A-type granites; I&S: I- and S-type granites; FG: fractionated granites; and OGT: unfractionated I- and S-type granites. The blue arrow lines in subfigure e and f represent trend line.
Minerals 12 01085 g012
Figure 13. (a) Sr–Ba diagram [18], (b) Sr–(Rb/Sr) diagram [45], (c) La–(La/Yb)N diagram [45], (d) Er–Dy diagram [57], (e) La–(La/Sm) diagram [11], and (f) La–(La/Yb) diagram [11]. Pl = plagioclase; Kfs = K-feldspar; Amp = amphibole; Ms = muscovite; Bt = biotite; Cpx = clinopyroxene; Opx = orthopyroxene; Zr = zircon; Tit = titanite; Ap = apatite; Mon = monazite; and Allan = allanite.
Minerals 12 01085 g013
Figure 14. (a) Mg#–SiO2 diagram. Base map is from [11]. (b) Nb*–Ta*diagram (Ta* = [Ta/U]Sample/[Ta/U]PM, Nb* = [Nb/Th]Sample/[Nb/Th]PM; base map is from [67]). Data for the primitive mantle, ocean island basalts and E-MORB are from [43]; bulk continental crust compositions are from [42].
Minerals 12 01085 g014
Figure 15. Pressure discrimination diagrams for volcanic rocks in the Ela Mountain area. (a) Sr/Y vs. La/Yb diagram from [62]. Grt, garnet; Pl, plagioclase. (b) Al2O3/(MgO + TiO2 + Fe2O3T) vs. Al2O3 + MgO + TiO2 + Fe2O3T diagram. The area between the high-pressure (12–15 kbar) and low-pressure (≤ 5 kbar) curves encompasses the range of depths at which mantle–crust interaction takes place [68]. (c) Normative Qz–Ab–Or diagram. Dashed lines [69]; solid lines [70].
Minerals 12 01085 g015
Figure 16. (a) Mg#–SiO2 diagram [81], (b) Th/Yb vs. Ba/La diagram [82], (c) Nb/Y vs. Ba/Y diagram [83], (d) La/Nb vs. La/Ba [84], (e) Th/Yb vs. Nb/Yb diagram [85], and (f) MgO vs. FeOT Harker diagram. The data for regional mafic–intermediate rocks were from [14,45,86], and they represent the previous mafic–intermediate rocks in the same period of the DHB basaltic andesite in the Ela Mountain area. (g) (La/Yb)N vs. La diagram [45], Zr = zircon; Tit = titanite; Ap = apatite; Mon = monazite; and Allan = allanite. (h) Dy vs. Er diagram [57].
Minerals 12 01085 g016
Figure 17. A schematic model illustrating the mechanisms and tectonic setting of volcanic rocks in the Ela Mountain area [11].
Minerals 12 01085 g017
Table 1. Zircon U-Pb isotopic dating data for volcanic rocks in the Ela Mountain area of the East Kunlun Orogen.
SpotConcentrations (ppm)Isotopic RatiosIsotopic Age (Ma)
ThUTh/U207Pb/206Pb207Pb/235U206Pb/238U208Pb/232Th207Pb/206Pb207Pb/235U206Pb/238U208Pb/232Th
Sample ZRR02 (ZRR dacite)
ZRR02-0146.2472.540.640.0517630.0016720.2674520.0089220.0377480.0004040.0125380.000381275.074.0240.77.1238.92.5251.87.6
ZRR02-0245.2467.530.670.0523810.0024170.2700280.0122070.0380130.0005200.0121450.000463302.1105.2242.79.8240.53.2244.09.2
ZRR02-0350.0582.840.600.0503970.0014040.2636640.0075900.0381150.0004540.0133740.000329213.364.5237.66.1241.12.8268.56.6
ZRR02-0468.3884.920.810.0527880.0014650.2773190.0077110.0384220.0004940.0134330.000378319.763.1248.56.1243.03.1269.77.5
ZRR02-0553.2677.360.690.0554840.0032470.2787970.0148800.0371860.0006870.0134540.000604431.8130.4249.711.8235.44.3270.112.0
ZRR02-0664.97100.510.650.0514900.0016420.2653630.0088020.0374650.0004580.0134370.000440262.873.2239.07.1237.12.8269.88.8
ZRR02-0747.4675.710.630.0545540.0022510.2814600.0116870.0376990.0005340.0130640.000548394.092.5251.89.3238.63.3262.310.9
ZRR02-08184.14207.350.890.0520590.0026770.2723210.0129660.0381760.0007860.0124950.000452288.0117.5244.510.3241.54.9251.09.0
ZRR02-0965.0580.360.810.0544540.0027000.2888990.0165620.0380810.0008470.0152410.000597389.9111.3257.713.0240.95.3305.711.9
ZRR02-1064.3493.780.690.0527810.0015290.2729950.0082430.0377610.0004420.0130280.000391319.465.8245.16.6238.92.7261.67.8
ZRR02-11187.32153.961.220.0444820.0017540.2343610.0091290.0385580.0005110.0125430.0003610.00.0213.87.5243.93.2252.07.2
ZRR02-1260.1372.080.830.0550700.0018330.2848390.0096530.0378860.0005710.0130340.000618415.174.4254.57.6239.73.5261.712.3
ZRR02-1340.0864.810.620.0528400.0016650.2726580.0082830.0378540.0004180.0127730.000411321.971.6244.86.6239.52.6256.58.2
ZRR02-1476.7590.190.850.0535590.0022180.2748170.0109080.0375580.0005330.0130180.000487352.593.5246.58.7237.73.3261.49.7
ZRR02-1533.3258.880.570.0506750.0022440.2694180.0113570.0392700.0007530.0137350.000541226.1102.3242.29.1248.34.7275.710.8
ZRR02-16162.34136.721.190.0513710.0012140.2648330.0065000.0375980.0004220.0132020.000329257.554.3238.65.2237.92.6265.16.6
ZRR02-1750.2170.770.710.0547770.0021690.2805830.0116430.0372760.0006750.0125860.000602403.188.7251.19.2235.94.2252.812.0
ZRR02-1844.6767.520.660.0505960.0015010.2663190.0085460.0382340.0004550.0125190.000376222.568.6239.76.9241.92.8251.57.5
ZRR02-1983.3384.570.990.0499130.0015620.2603630.0085750.0379290.0004580.0127490.000312191.072.8235.06.9240.02.8256.16.2
ZRR02-2062.03105.690.590.0534510.0015640.2759050.0086870.0375450.0004530.0126250.000401348.066.2247.46.9237.62.8253.68.0
Sample GEY01 (GEY rhyolite)
GEY01-01106.70168.110.630.0500230.0028220.3006410.0160690.0438670.0006600.0139560.000440194.5129.6266.912.5276.84.1280.18.8
GEY01-02391.26370.161.060.0510210.0033100.3363910.0223890.0473090.0005160.0160030.000678242.7150.0294.417.0298.03.2320.913.5
GEY01-0379.81126.750.630.0519370.0025890.2702010.0132700.0381640.0005960.0130800.000433283.4114.8242.910.6241.43.7262.78.6
GEY01-04157.94192.680.820.0553180.0036750.3104980.0189300.0418380.0005570.0151550.000356433.4117.6274.614.7264.23.4304.07.1
GEY01-0578.08139.260.560.0517970.0029530.2789800.0152780.0397410.0005540.0117640.000445276.0163.9249.812.1251.23.4236.48.9
GEY01-06745.68530.481.410.0504860.0015090.2626560.0074910.0377360.0003880.0117450.000199216.768.5236.86.0238.82.4236.04.0
GEY01-07120.17183.950.650.0070010.0043000.0323930.0211020.0359570.0005100.0058800.000485errorerror32.420.8227.73.2118.59.7
GEY01-08216.50278.680.780.0607120.0026990.3398150.0172330.0399560.0006230.0148500.000565627.895.2297.013.1252.63.9297.911.2
GEY01-09191.14265.960.720.0513740.0020900.2577640.0102110.0362900.0004310.0112100.000233257.594.4232.98.2229.82.7225.34.7
GEY01-10193.17324.750.590.0511740.0025810.2700260.0145280.0375680.0004940.0119150.000441255.6116.7242.711.6237.73.1239.48.8
GEY01-11164.45237.920.690.0544630.0020920.2912290.0110680.0387190.0004790.0110360.000303390.887.0259.58.7244.93.0221.86.1
GEY01-12258.73352.730.730.0523110.0018590.2763180.0100030.0380460.0005000.0123310.000262298.286.1247.78.0240.73.1247.75.2
GEY01-13133.08232.260.570.0550410.0021550.2948410.0115080.0387830.0005290.0122770.000349413.087.0262.49.0245.33.3246.67.0
GEY01-14104.56319.050.330.0560350.0022400.2854990.0108840.0368960.0004280.0110300.000384453.888.9255.08.6233.62.7221.77.7
GEY01-15284.29337.150.840.0556880.0021930.2854060.0110340.0370020.0004350.0115160.000248438.987.0254.98.7234.22.7231.45.0
GEY01-16372.78370.691.010.0494250.0084070.2890860.0483930.0380540.0004950.0115430.000924168.6355.5257.838.1240.83.1232.018.5
GEY01-17117.99209.660.560.0521170.0021610.2739780.0112020.0380670.0004960.0116720.000315300.194.4245.98.9240.83.1234.66.3
GEY01-18316.47309.721.020.0530730.0033050.2711260.0164720.0374440.0004550.0118950.000273331.5147.2243.613.2237.02.8239.05.4
GEY01-19264.85240.871.100.0530440.0025540.2752590.0129370.0375520.0004830.0115340.000257331.5109.2246.910.3237.63.0231.85.1
GEY01-20277.16312.000.890.0492910.0018440.2591970.0096860.0378920.0004750.0116250.000293161.291.7234.07.8239.83.0233.65.8
GEY01-21352.64348.401.010.0549470.0018630.3079460.0108960.0404210.0005960.0118520.000294409.375.9272.68.5255.43.7238.15.9
GEY01-22162.21232.530.700.0515830.0021900.2677050.0113230.0375210.0004690.0116070.000318333.498.1240.99.1237.42.9233.36.4
GEY01-2342.24104.740.400.0000000.0000000.2282280.1484930.0375870.0013640.0131520.006260errorerror208.7122.8237.98.5264.1124.9
GEY01-24177.45205.440.860.0496910.0024850.2543370.0120440.0375240.0005240.0120210.000320189.0119.4230.19.8237.53.3241.56.4
GEY01-25157.06261.010.600.0508520.0019970.2606350.0100180.0371860.0003990.0111770.000252235.390.7235.28.1235.42.5224.75.0
GEY01-26508.85526.580.970.0234950.0023370.0963510.0091530.0277630.0005810.0076920.000295errorerror93.48.5176.53.6154.95.9
Sample DHB03 (DHB basaltic andesite)
DHB03-1222.47354.790.630.0524150.0020200.2667030.0098440.0369180.0006150.0121630.000412303.687.8240.17.9233.73.8244.48.2
DHB03-21042.231209.030.860.0519930.0007080.2647980.0038770.0369110.0003350.0116030.000154285.131.1238.53.1233.72.1233.23.1
DHB03-3189.49310.740.610.0562560.0014190.2882290.0063790.0373610.0006390.0124130.000379462.555.9257.25.0236.54.0249.37.6
DHB03-4198.73305.860.650.0558780.0010720.2836440.0054460.0368580.0003530.0116180.000211447.542.6253.54.3233.32.2233.54.2
DHB03-5345.56401.850.860.0534670.0010880.2734990.0059960.0371550.0005080.0117250.000293348.746.0245.54.8235.23.2235.65.9
DHB03-6211.85314.310.670.0533300.0011650.2700120.0058670.0367370.0003100.0118100.000224342.849.4242.74.7232.61.9237.34.5
DHB03-7300.56351.050.860.0535710.0014420.2742060.0077660.0371240.0003860.0116450.000295353.160.8246.16.2235.02.4234.05.9
DHB03-8286.29366.070.780.0519540.0006860.2653430.0047710.0370490.0004050.0118720.000172283.430.2239.03.8234.52.5238.63.4
DHB03-9262.20348.730.750.0555940.0014640.2857220.0079490.0372450.0005270.0116990.000365436.258.7255.26.3235.73.3235.17.3
DHB03-10146.12214.650.680.0521360.0014240.2664170.0079800.0370250.0004080.0119000.000307291.462.4239.86.4234.42.5239.16.1
DHB03-11201.11314.920.640.0576880.0015980.2602970.0076730.0327100.0004240.0111070.000209517.960.8234.96.2207.52.6223.34.2
DHB03-12203.37321.690.630.0529230.0008520.2706060.0044200.0371990.0003990.0116460.000211325.536.5243.23.5235.42.5234.04.2
DHB03-1397.87235.710.420.0519370.0024730.2611400.0114730.0369060.0009610.0119010.000588282.6108.9235.69.2233.66.0239.111.7
DHB03-14253.77331.740.760.0521480.0007190.2637460.0043290.0368530.0004240.0117740.000142291.931.5237.73.5233.32.6236.62.8
DHB03-15196.17286.410.680.0518530.0010580.2634900.0052980.0369800.0004070.0119800.000278278.946.7237.54.3234.12.5240.75.5
DHB03-16107.90210.240.510.0522420.0014830.2707080.0074380.0375670.0004760.0128880.000458296.064.8243.35.9237.73.0258.89.1
DHB03-17206.45300.410.690.0533780.0008630.2711250.0049000.0369280.0003920.0119090.000209344.936.6243.63.9233.82.4239.34.2
DHB03-18155.64233.470.670.0532540.0009060.2718630.0057040.0369570.0003920.0116380.000202339.638.5244.24.6233.92.4233.94.0
DHB03-19155.42256.220.610.0541180.0010840.2758490.0052110.0370860.0003900.0122690.000224376.045.1247.44.1234.72.4246.54.5
DHB03-20266.49318.780.840.0527050.0011000.2692400.0067260.0370120.0005700.0122900.000211316.147.5242.15.4234.33.5246.94.2
Table 2. Whole-rock major (wt%) and trace element (ppm) data for volcanic rocks in the Ela Mountain area of the East Kunlun Orogen.
Rock TypeZRR Dacite (ZRR02)GEY Rhyolite (GEY01)DHB Basaltic Andesite (DHB03)
SampleZRR02-1ZRR02-2ZRR02-3GEY01-1GEY01-2GEY01-3DHB03-1DHB03-2DHB03-3
SiO269.6269.7868.9675.5575.4675.4855.1054.7955.15
TiO20.450.460.480.190.190.180.970.940.95
Al2O314.8914.6514.6912.3712.5412.2917.2217.2317.33
Fe2O3T3.043.213.421.581.311.798.218.518.00
FeO2.172.312.271.311.121.435.966.155.60
MnO0.120.130.140.100.090.090.170.170.15
MgO1.010.980.960.200.130.154.224.304.12
CaO1.571.672.170.830.730.787.537.457.41
Na2O4.454.654.673.924.143.543.153.673.27
K2O2.842.732.594.063.844.251.901.701.77
P2O50.110.110.130.030.030.040.190.190.19
LOI1.281.111.160.860.961.001.131.001.02
Total99.3799.4899.3599.6799.4299.6099.8099.9699.34
Mg#39.5637.5935.6719.8216.5314.2450.4350.0350.53
Li17.8017.2715.8710.419.6213.5022.4922.9523.54
Be1.641.651.621.461.471.441.381.381.49
Sc8.458.268.935.395.495.5024.9324.4525.63
Cr33.617.5424.0819.4033.8424.2950.1041.5929.88
Co3.424.944.962.061.832.1921.4422.0622.31
V40.3040.4341.007.376.777.82202.36201.58197.27
Tl0.810.690.650.520.490.510.640.620.64
Cu8.347.538.678.718.179.089.969.2013.22
Cs6.554.766.062.472.512.6512.0211.4010.83
Zn53.0157.4172.1332.7425.3338.99115.43125.89123.64
Ni6.7311.777.409.327.825.5511.169.7610.28
Ga17.1917.1617.7715.7315.5915.4620.9321.5322.24
Rb100.3193.4193.66103.93101.11108.9692.3789.0390.99
Sr222.28249.84259.7860.1060.8455.29503.85477.66544.36
Y21.4921.8422.9424.6027.0425.4323.3923.1224.93
Nb9.899.689.6612.6113.8513.678.798.839.45
Ta0.620.610.630.991.021.010.520.510.54
Ba827.33846.17758.69664.91618.94685.52646.70488.47624.16
Zr213.93229.12209.68164.11174.01164.41166.43166.16176.46
Hf5.075.354.944.435.124.774.064.064.18
Pb15.7515.1313.8911.9710.7413.3519.8919.3520.60
Th9.539.339.5214.0515.4915.108.238.218.50
U2.112.102.451.491.421.751.391.321.38
La26.6028.8026.5640.9551.2441.9422.0921.5825.76
Ce56.5258.7956.9077.67102.1378.9754.6952.1261.76
Pr5.695.865.677.569.997.806.456.246.87
Nd23.4124.4523.8027.2036.3129.2126.9026.4329.59
Sm4.344.304.374.826.105.205.515.395.80
Eu1.241.191.140.670.720.681.291.241.33
Gd4.154.174.115.056.265.404.874.625.25
Tb0.640.630.640.680.900.730.790.760.83
Dy3.603.613.743.644.644.094.414.334.74
Ho0.720.720.750.730.810.760.880.880.91
Er2.202.232.252.212.452.292.482.432.58
Tm0.370.370.370.350.370.360.380.370.40
Yb2.412.422.462.282.382.342.312.272.46
Lu0.380.400.380.380.400.390.370.370.39
(La/Yb)N7.938.547.7412.8815.4512.876.856.827.51
ΣREE132.27137.94133.15174.20224.70180.16133.41129.02148.67
Eu/Eu*0.880.850.810.410.350.390.740.740.72
DI83.0082.9681.0692.5193.3592.1244.2845.0845.25
TZr812.38813.05792.82791.53799.91795.68773.42663.13675.11
LOI = loss on ignition; Mg# = molecular MgO/(MgO + Fe2O3T); (La/Yb)N is the chondrite-normalized value [25]; Fe2O3T is the total iron; Eu/Eu* = EuN/[(SmN) × (GdN)]; DI = [Qz + Or + Ab + Ne] by normative percent [26]; TZr = 12,900/(2.95 + 0.85 M + lnDZr, zircon/melt) [27], where DZr, zircon/melt is the ratio of Zr concentrations (~496,000 ppm) in zircon to that in the saturated melt; and M = cation ratio (Na + K + 2 × Ca)/(Al × Si) [28].
Table 3. Zircon Lu-Hf isotopic data of the volcanic rocks for volcanic rocks in the Ela Mountain area of the East Kunlun Orogen.
Spott (Ma)176Yb/177Hf176Lu/177Hf176Hf/177HfεHf (0)εHf (t)2sTDM1(Hf)TDM2(Hf)fLu/Hf
Sample ZRR02 (ZRR dacite)
ZRR02-012390.0613050.0004820.0018360.0000290.2825050.000026−9.4−4.50.910811552−0.94
ZRR02-032390.0325140.0003720.0009980.0000060.2825320.000024−8.5−3.40.910181483−0.97
ZRR02-042390.0323500.0005800.0010120.0000140.2825300.000023−8.6−3.50.810221488−0.97
ZRR02-102390.0643140.0035530.0018520.0001100.2824510.000027−11.4−6.40.911581673−0.94
ZRR02-122390.0658630.0003140.0019220.0000170.2824970.000026−9.7−4.80.910951571−0.94
ZRR02-132390.0824480.0040550.0024590.0001350.2824610.000027−11.0−6.10.911631657−0.93
ZRR02-142390.0303880.0003690.0009470.0000060.2825490.000025−7.9−2.80.99941445−0.97
ZRR02-162390.0586470.0002470.0018400.0000140.2824770.000026−10.4−5.50.911211615−0.94
ZRR02-172390.0352090.0004520.0010990.0000100.2825370.000025−8.3−3.20.910141473−0.97
ZRR02-202390.0364140.0009610.0011380.0000250.2825230.000023−8.8−3.70.810351504−0.97
Sample GEY01 (GEY rhyolite)
GEY01-032380.0465160.0007470.0015310.0000240.2826260.000026−5.2−0.20.98991278−0.95
GEY01-062380.0967190.0021020.0029570.0000390.2825850.000027−6.6−1.91.09961385−0.91
GEY01-102380.0695890.0024820.0018690.0000460.2825450.000026−8.0−3.10.910241464−0.94
GEY01-112380.0561700.0020200.0017340.0000530.2825880.000025−6.5−1.60.99581365−0.95
GEY01-122380.0825250.0015960.0025880.0000510.2825630.000024−7.4−2.60.810181430−0.92
GEY01-172380.0490220.0006730.0014950.0000180.2825960.000027−6.2−1.20.99411345−0.95
GEY01-182380.1409060.0085200.0038560.0001790.2825180.000029−9.0−4.41.011241544−0.88
GEY01-192380.0745410.0007850.0023370.0000300.2825450.000028−8.0−3.21.010371467−0.93
GEY01-222380.0760300.0018820.0023210.0000440.2825680.000027−7.2−2.41.010031417−0.93
GEY01-242380.0537730.0041870.0016920.0001150.2826060.000027−5.9−0.91.09311323−0.95
Sample DHB03 (DHB basaltic andesite)
DHB03-012340.0274010.0003430.0010540.0000120.2826490.000019−4.40.60.78551224−0.97
DHB03-022340.0434350.0008400.0017230.0000280.2826530.000019−4.20.70.78651222−0.95
DHB03-052340.0356940.0001110.0014310.0000060.2825920.000015−6.4−1.40.59451355−0.96
DHB03-062340.0199810.0004450.0007810.0000160.2826270.000017−5.1−0.10.68791270−0.98
DHB03-072340.0301280.0003540.0011640.0000100.2825970.000017−6.2−1.20.69311342−0.96
DHB03-082340.0473820.0004440.0017650.0000110.2826620.000014−3.91.00.58531201−0.95
DHB03-092340.0299520.0008980.0011790.0000370.2826060.000017−5.9−0.90.69181321−0.96
DHB03-102340.0243950.0007310.0009950.0000290.2825960.000019−6.2−1.20.79281342−0.97
DHB03-122340.0279780.0005810.0010690.0000210.2825610.000016−7.5−2.50.69791421−0.97
DHB03-162340.0277110.0006730.0010540.0000240.2826420.000018−4.60.40.68641239−0.97
DHB03-172340.0343610.0007630.0013060.0000250.2825990.000016−6.1−1.20.69311338−0.96
DHB03-182340.0193790.0001730.0008010.0000040.2826100.000018−5.7−0.70.69031308−0.98
DHB03-202340.0334190.0001180.0012580.0000040.2826180.000018−5.4−0.50.69041295−0.96
For the initial 176Hf/177Hf ratios, εHf (t) was calculated with reference to the chondritic reservoir (CHUR) of [35] at the time of zircon growth from the magma. The single-stage Hf model ages (TDM1) were calculated relative to the depleted mantle with present-day 176Hf/177Hf = 0.28325 and 176Lu/177Hf = 0.0384 [36]. The two-stage Hf model ages (TDM2) were calculated assuming a mean 176Lu/177Hf value of 0.015 for the average continental crust [36].
Publisher’s Note: MDPI stays neutral with regard to jurisdictional claims in published maps and institutional affiliations.

