
Molecular Dynamics Study on the Effect of SiO2/Al2O3 Mass Ratio on the Structural Properties and Viscosity of Molten Fused Red Mud

Abstract
:1. Introduction
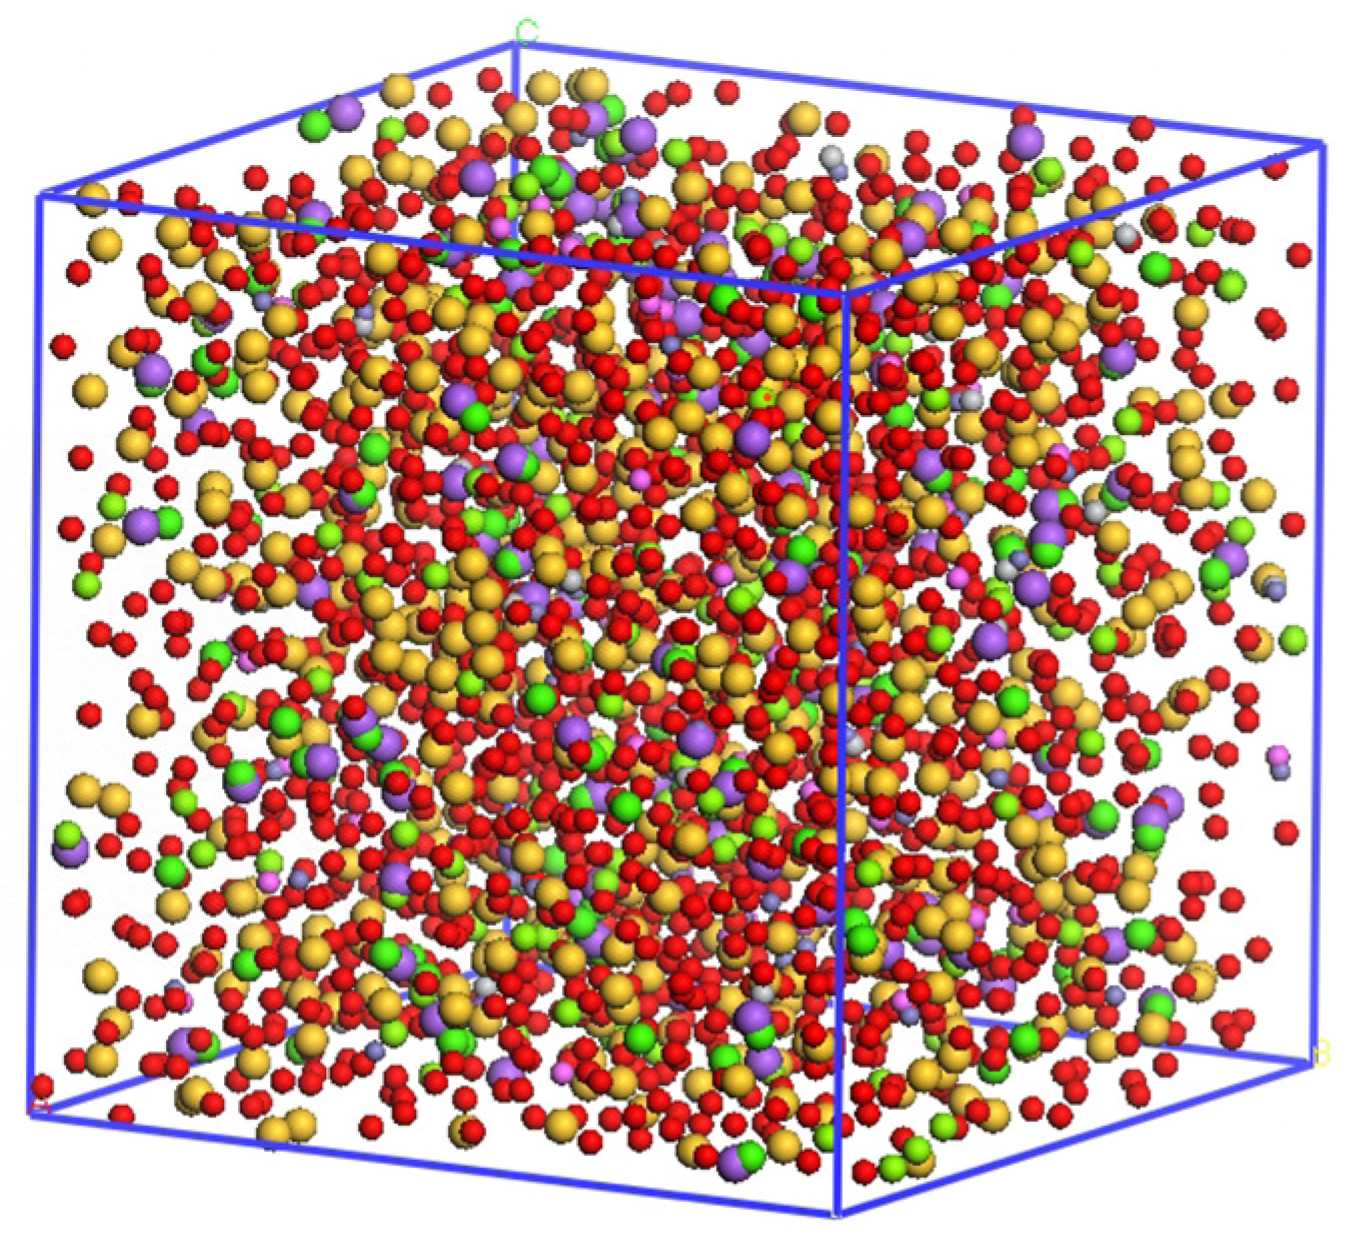
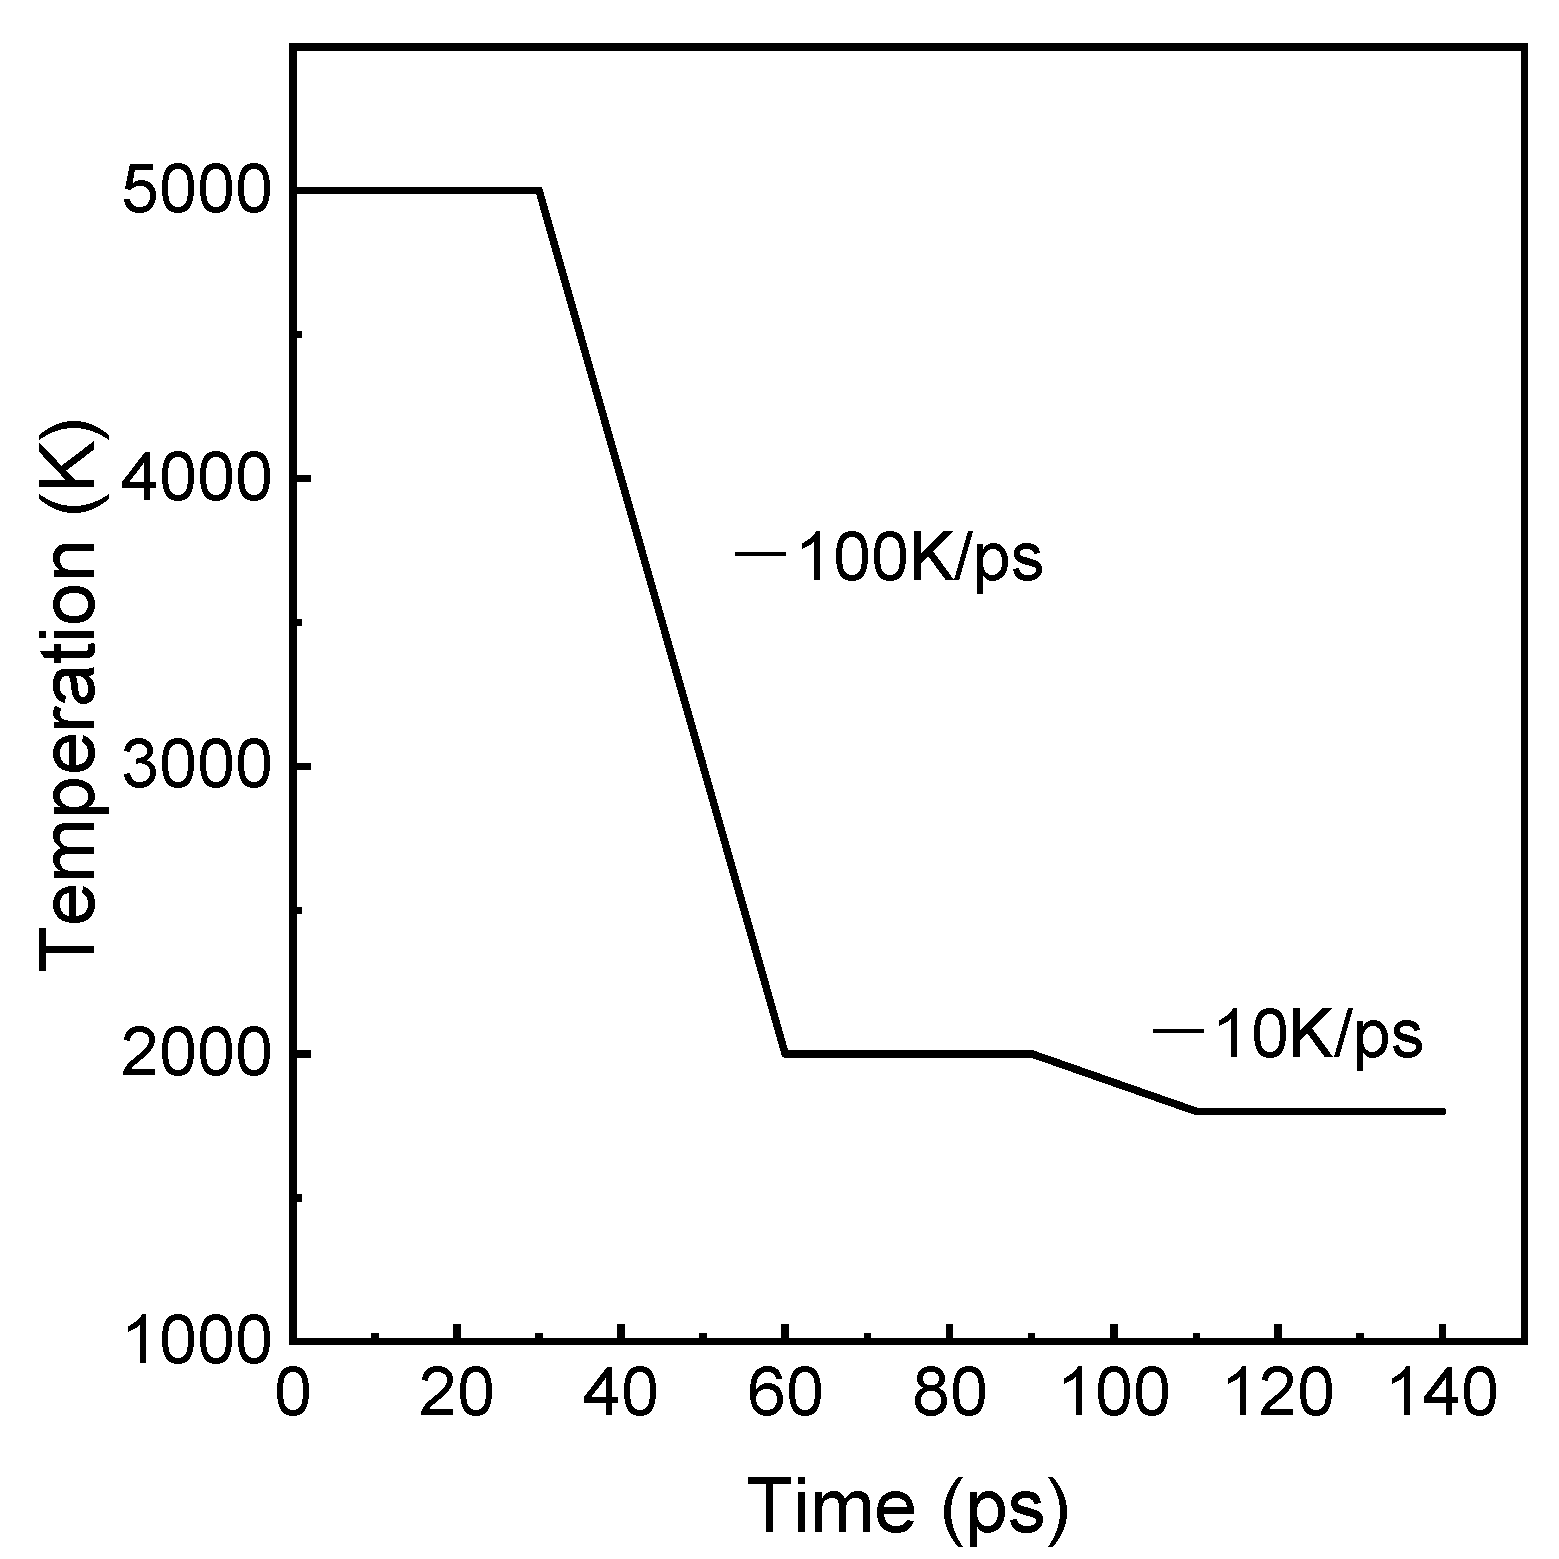
2. Simulation Method
3. Results and Discussion
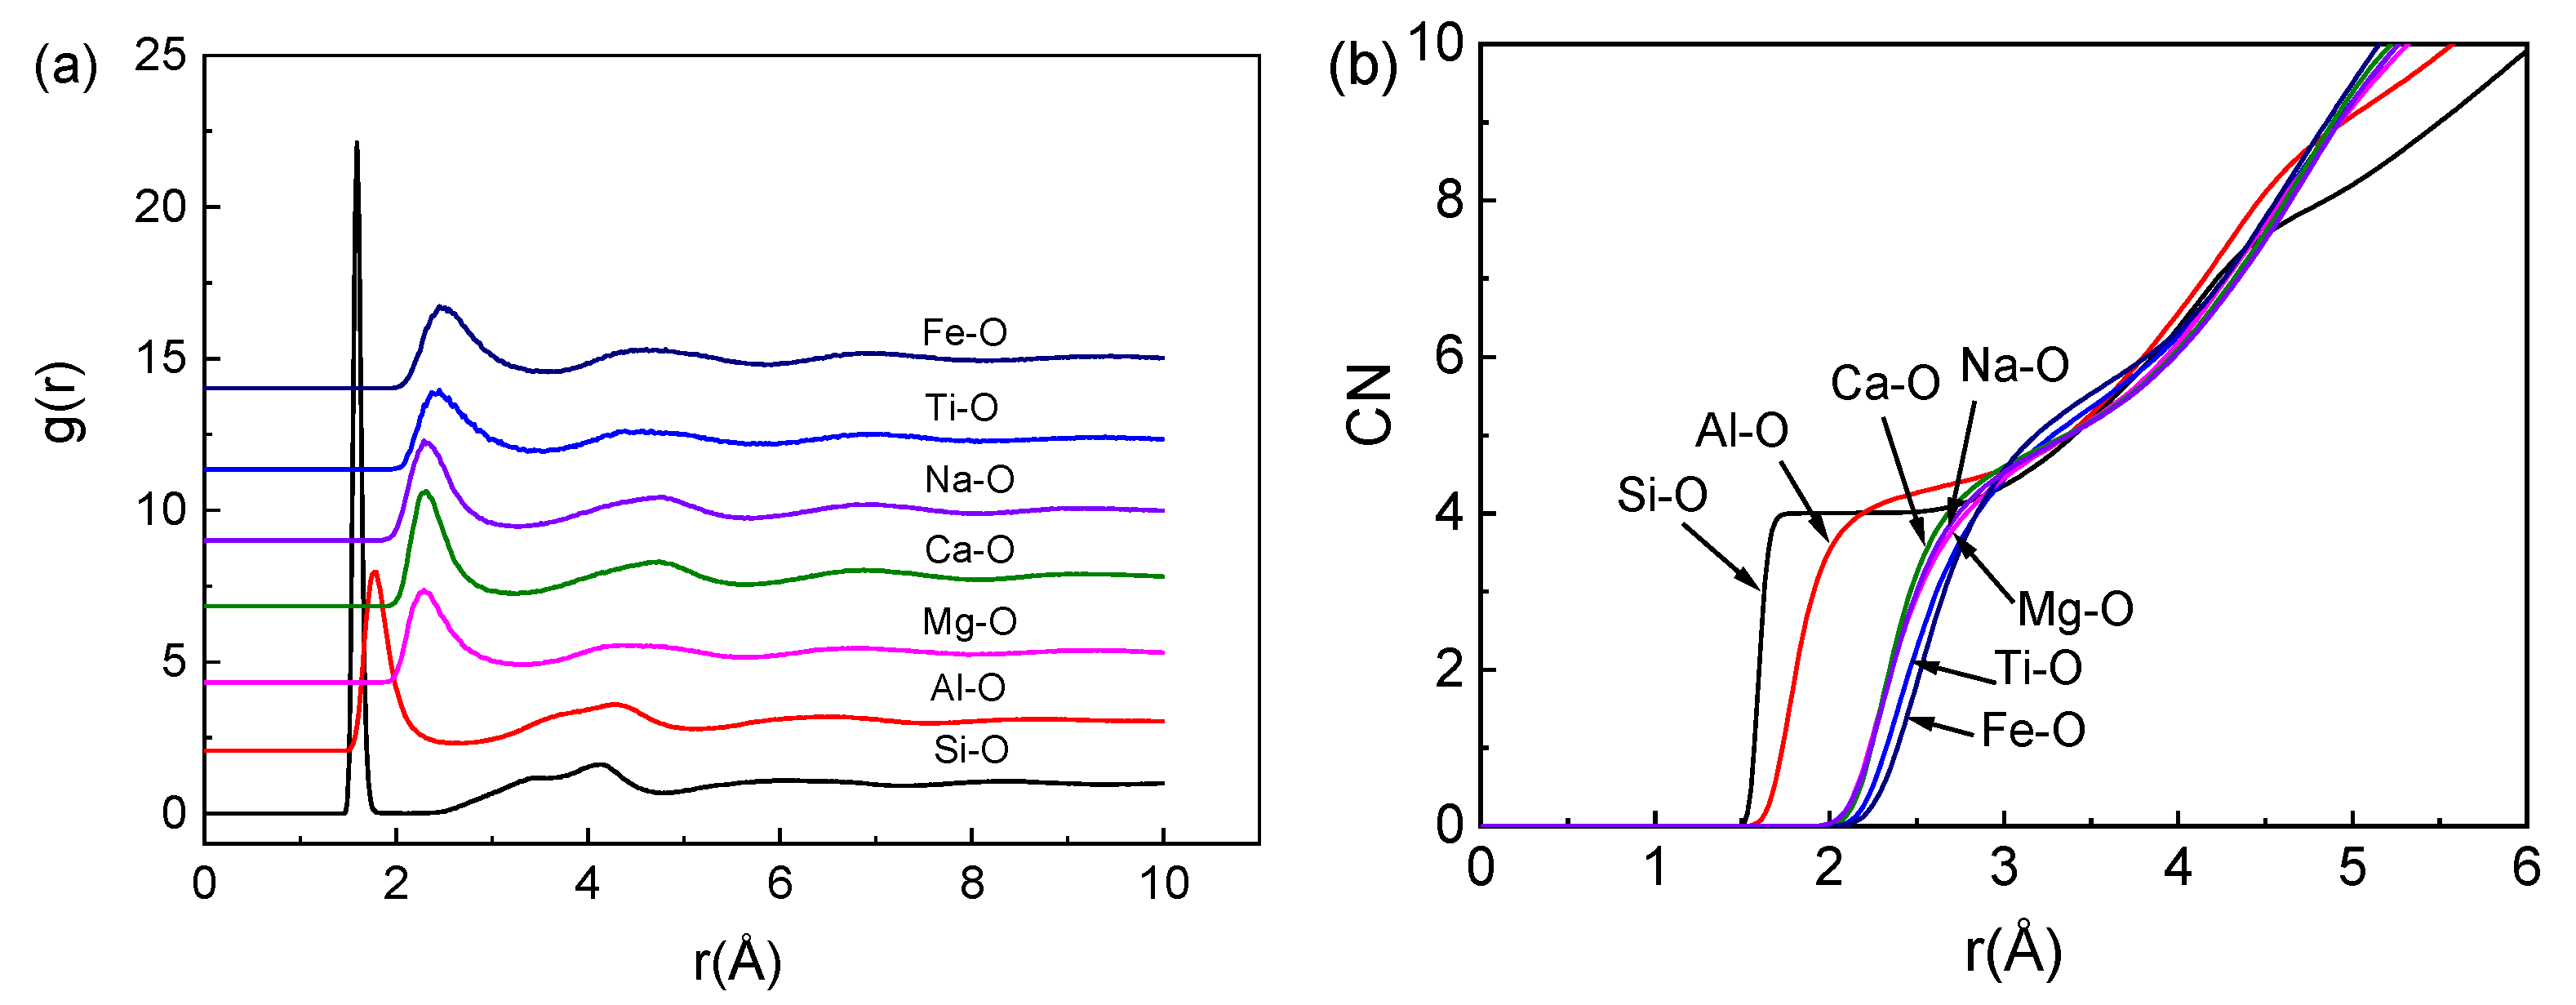
3.1. Partial Radial Distribution Function (PDF) and Coordination Number (CN)
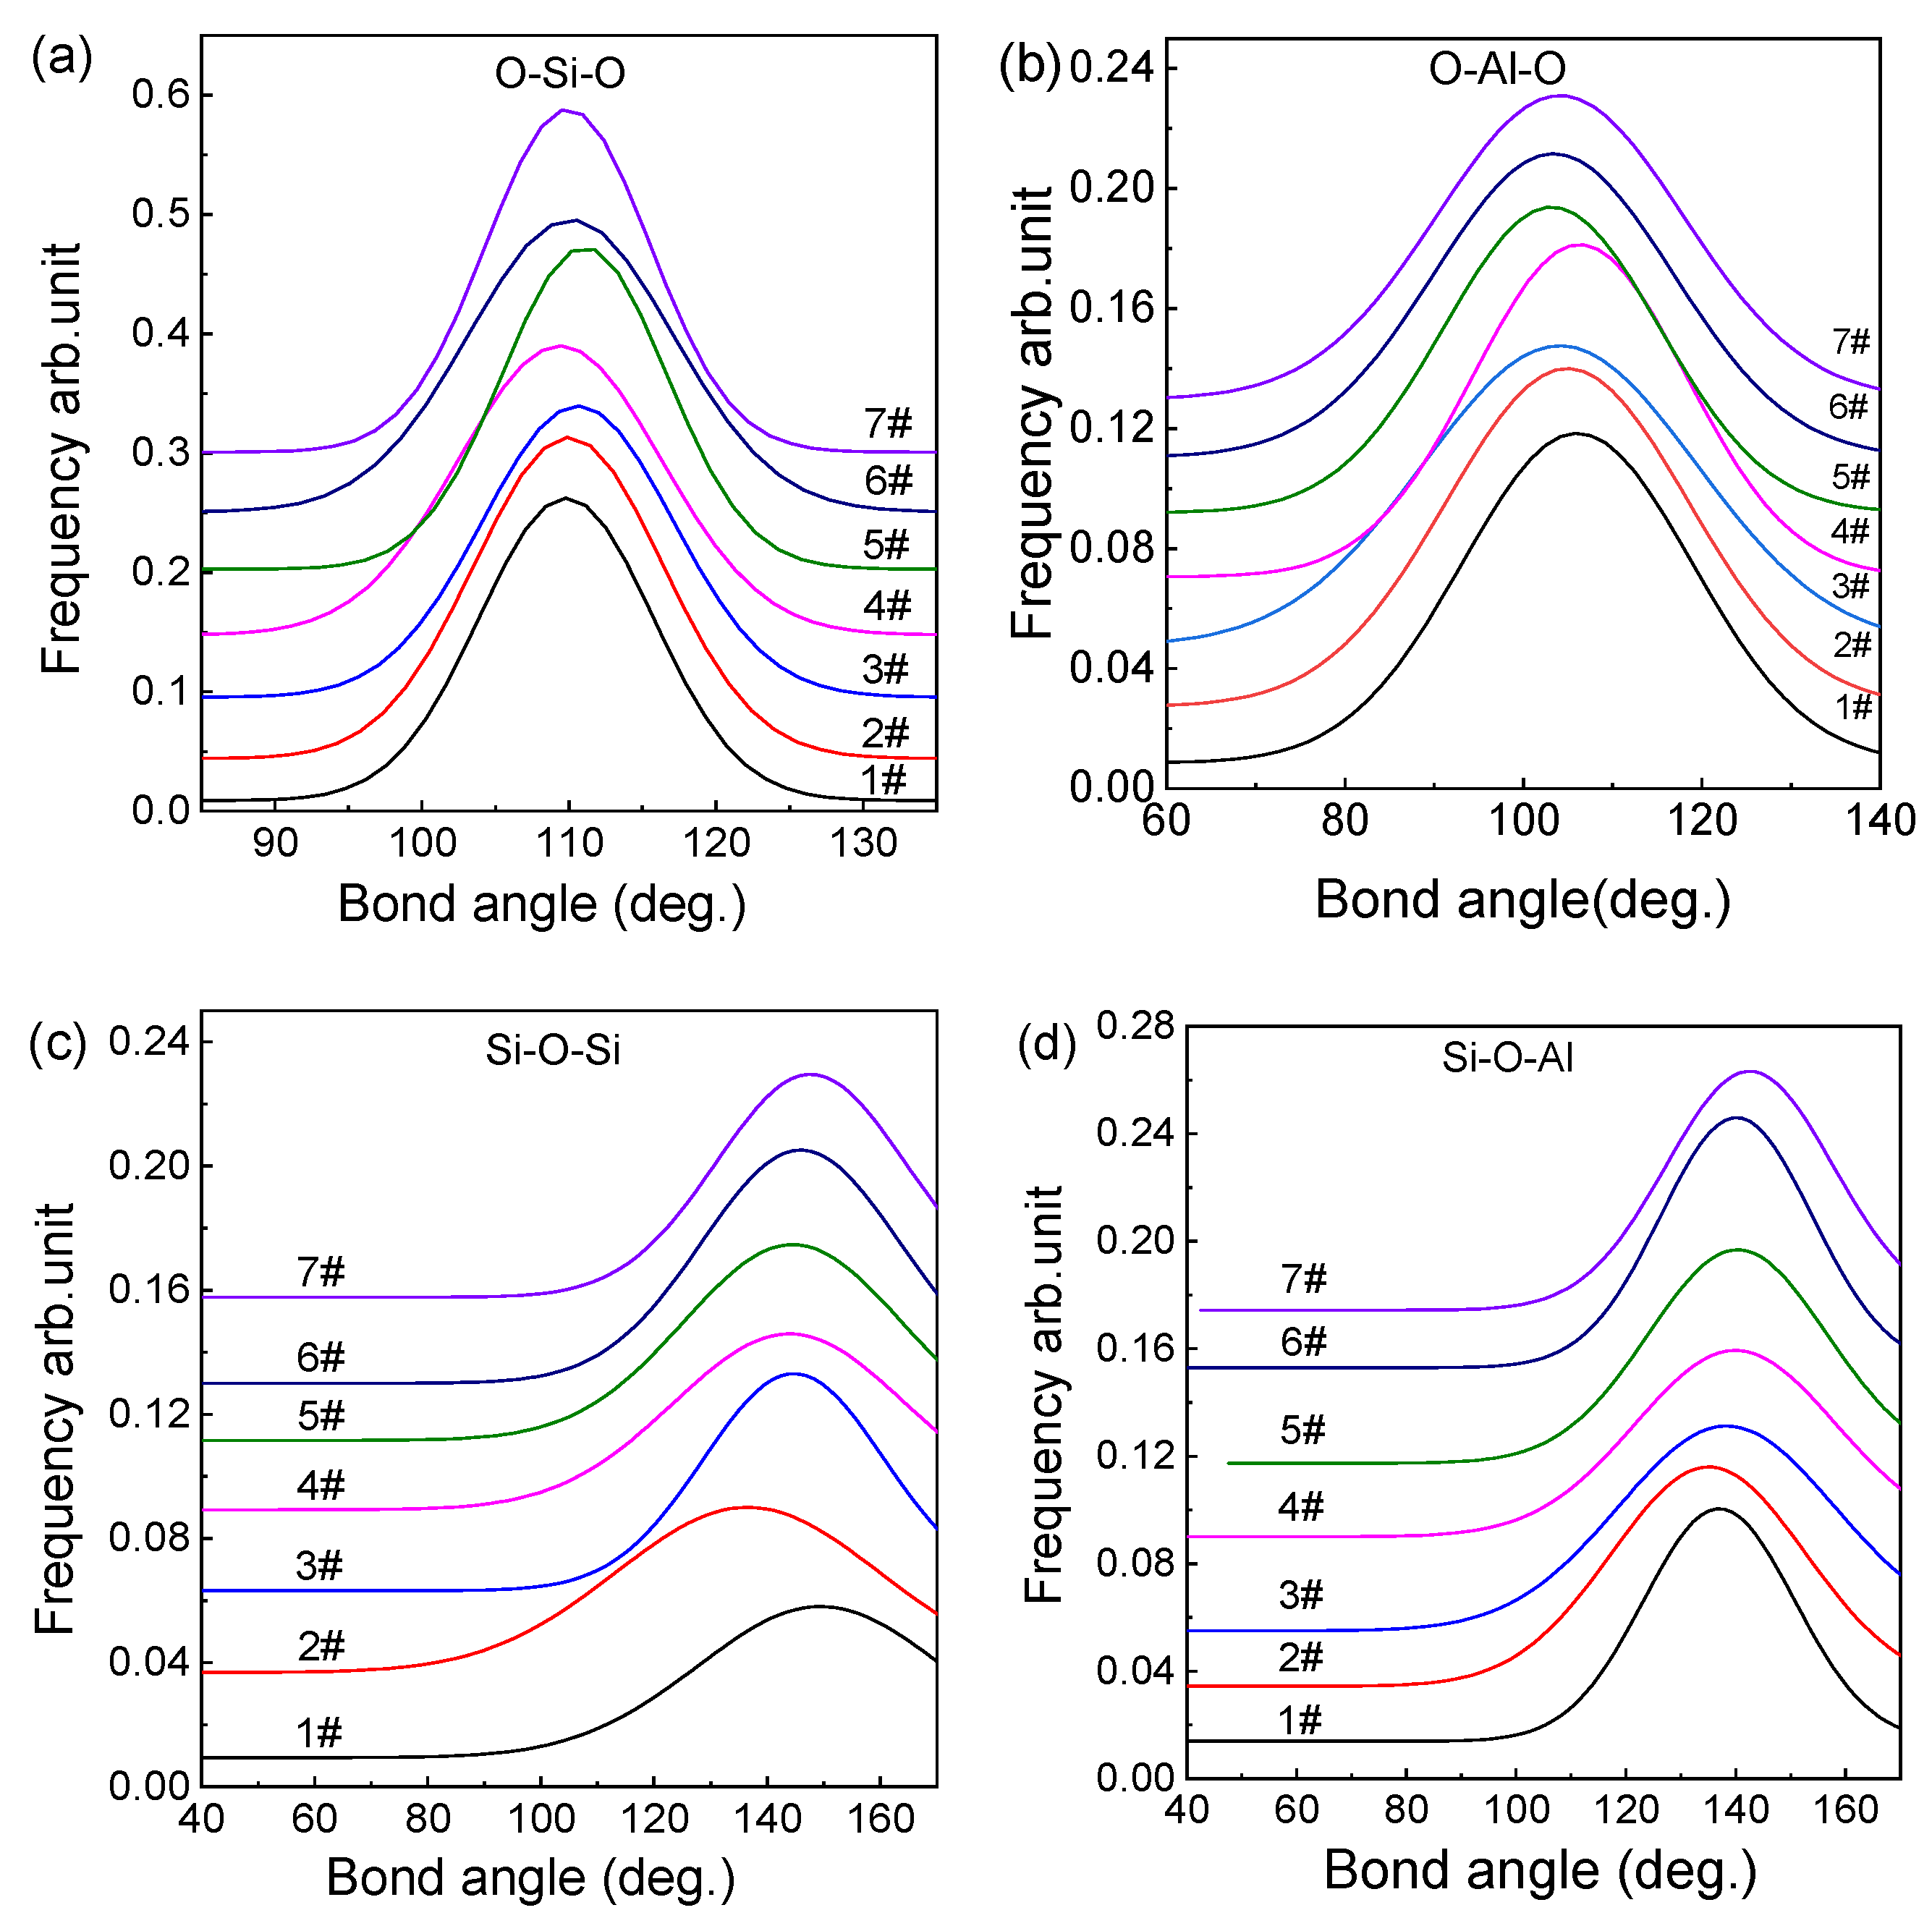
3.2. Distribution of Bond Angles
3.3. Distribution of Oxygen and Qn
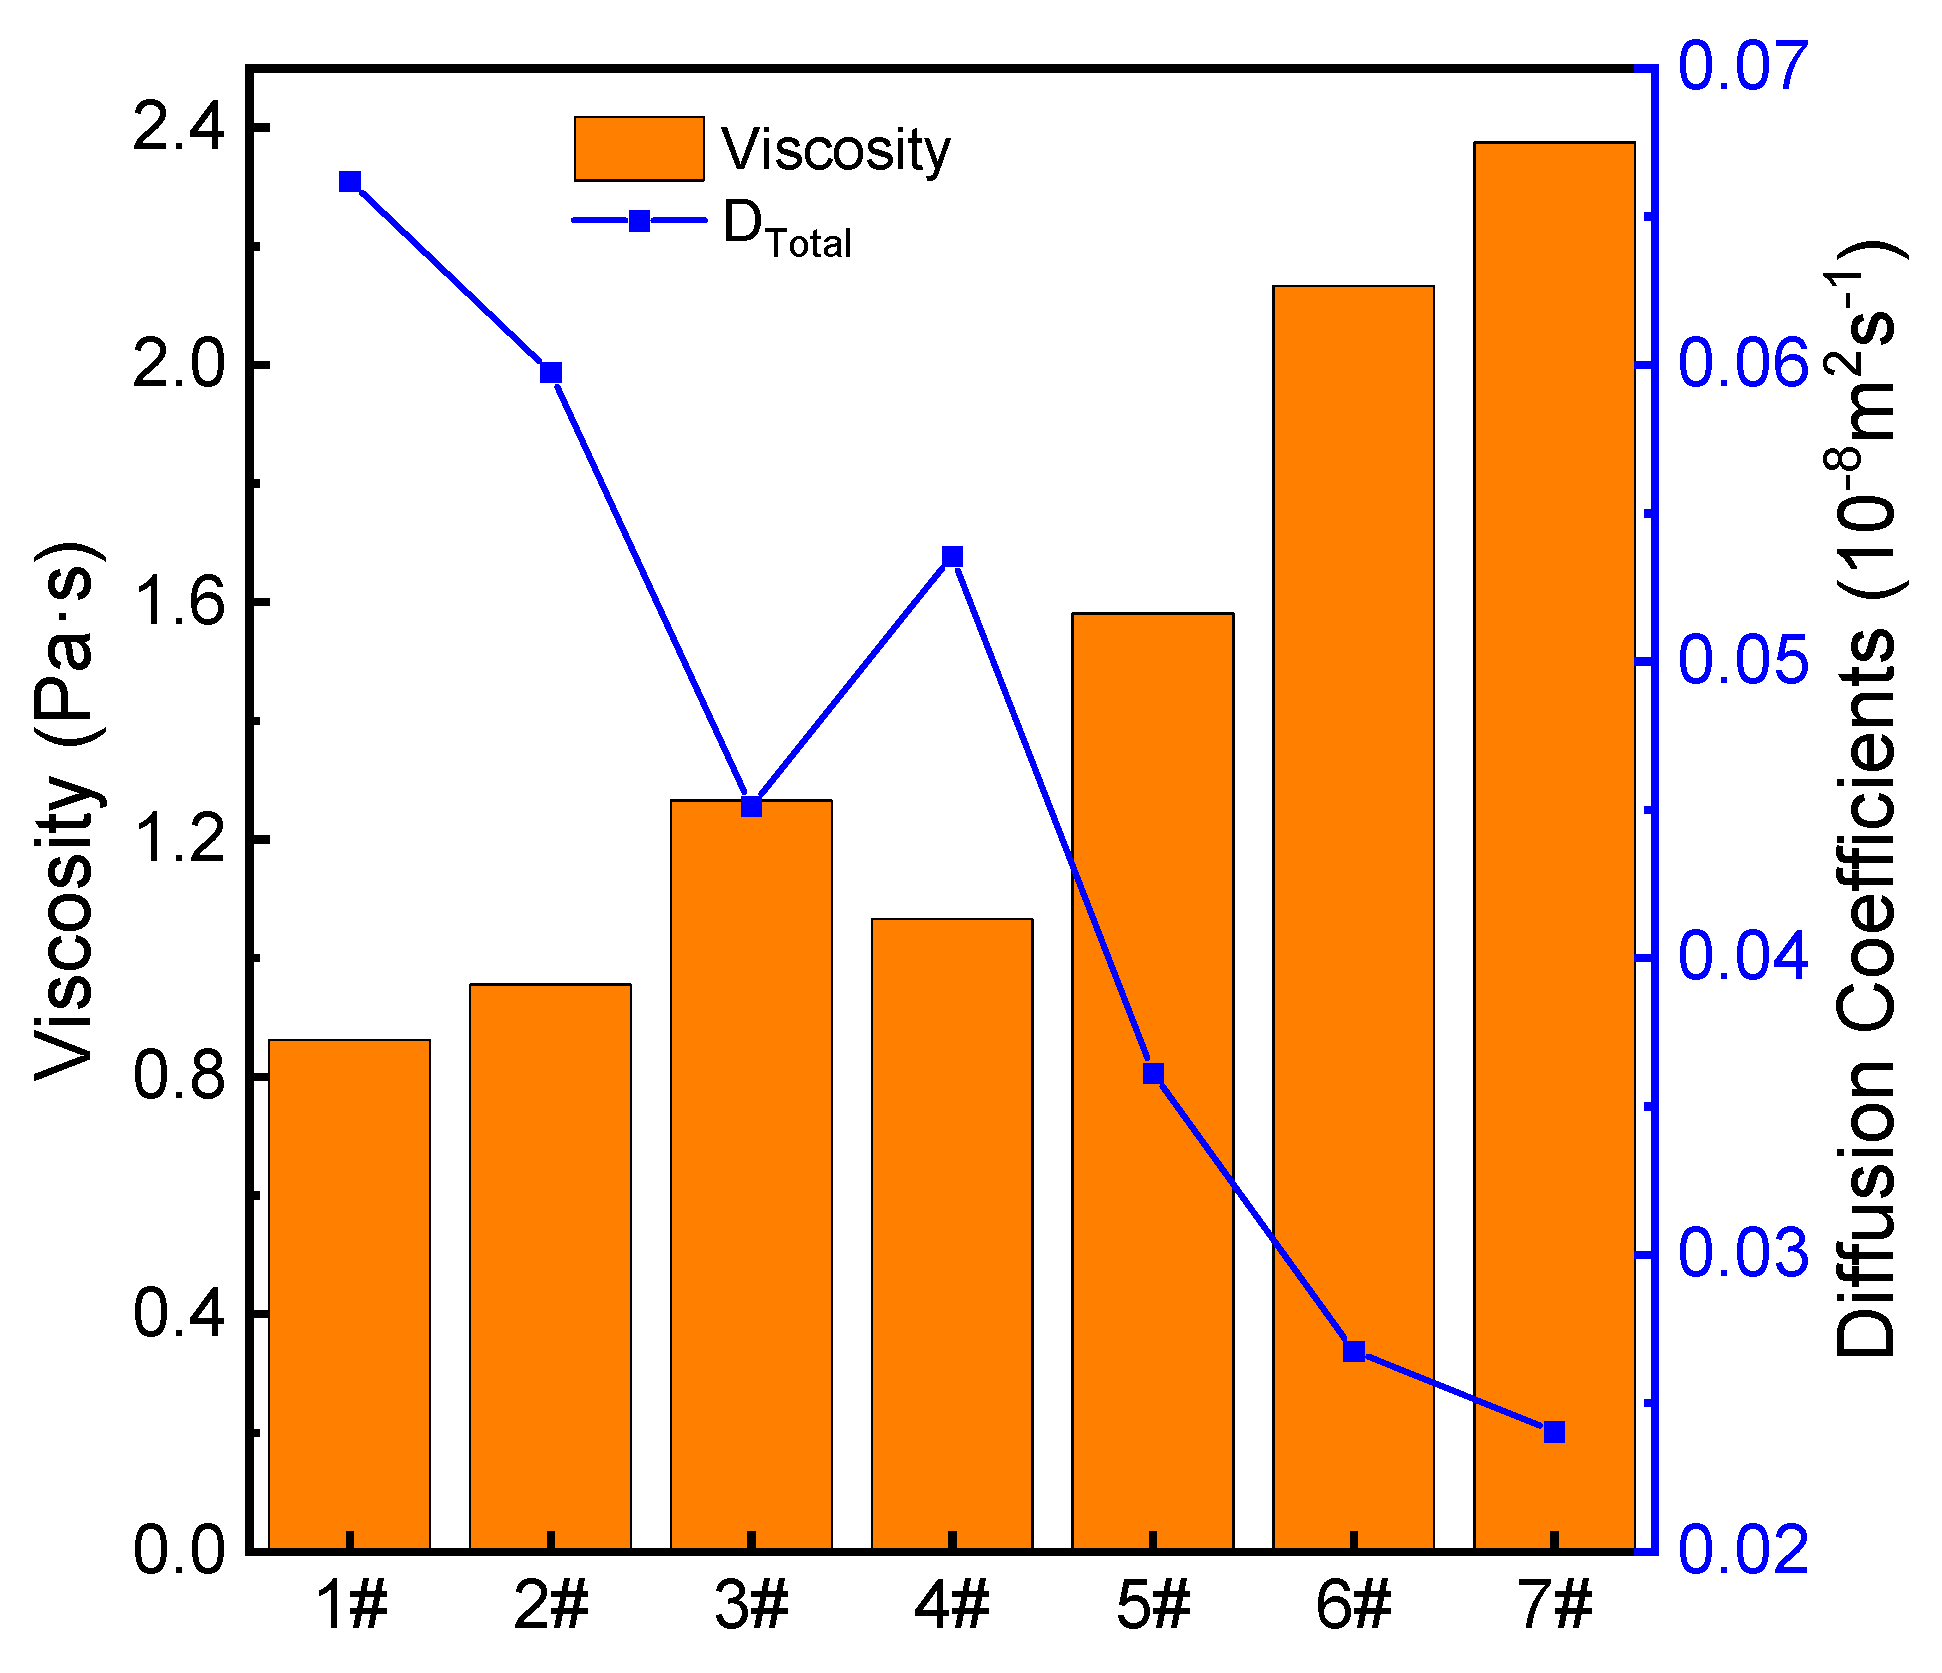
3.4. Self-Diffusion Coefficient and Viscosity
4. Conclusions
- The average bond lengths of Si–O, Al–O, Ca–O, Mg–O, Na–O, Ti–O, and Fe–O are 1.59 Å, 1.79 Å, 2.31 Å, 2.29 Å, 2.33 Å, 2.45 Å, and 2.51 Å, respectively. The network formers of the fused red mud are [SiO4] and [AlO4] tetrahedra.
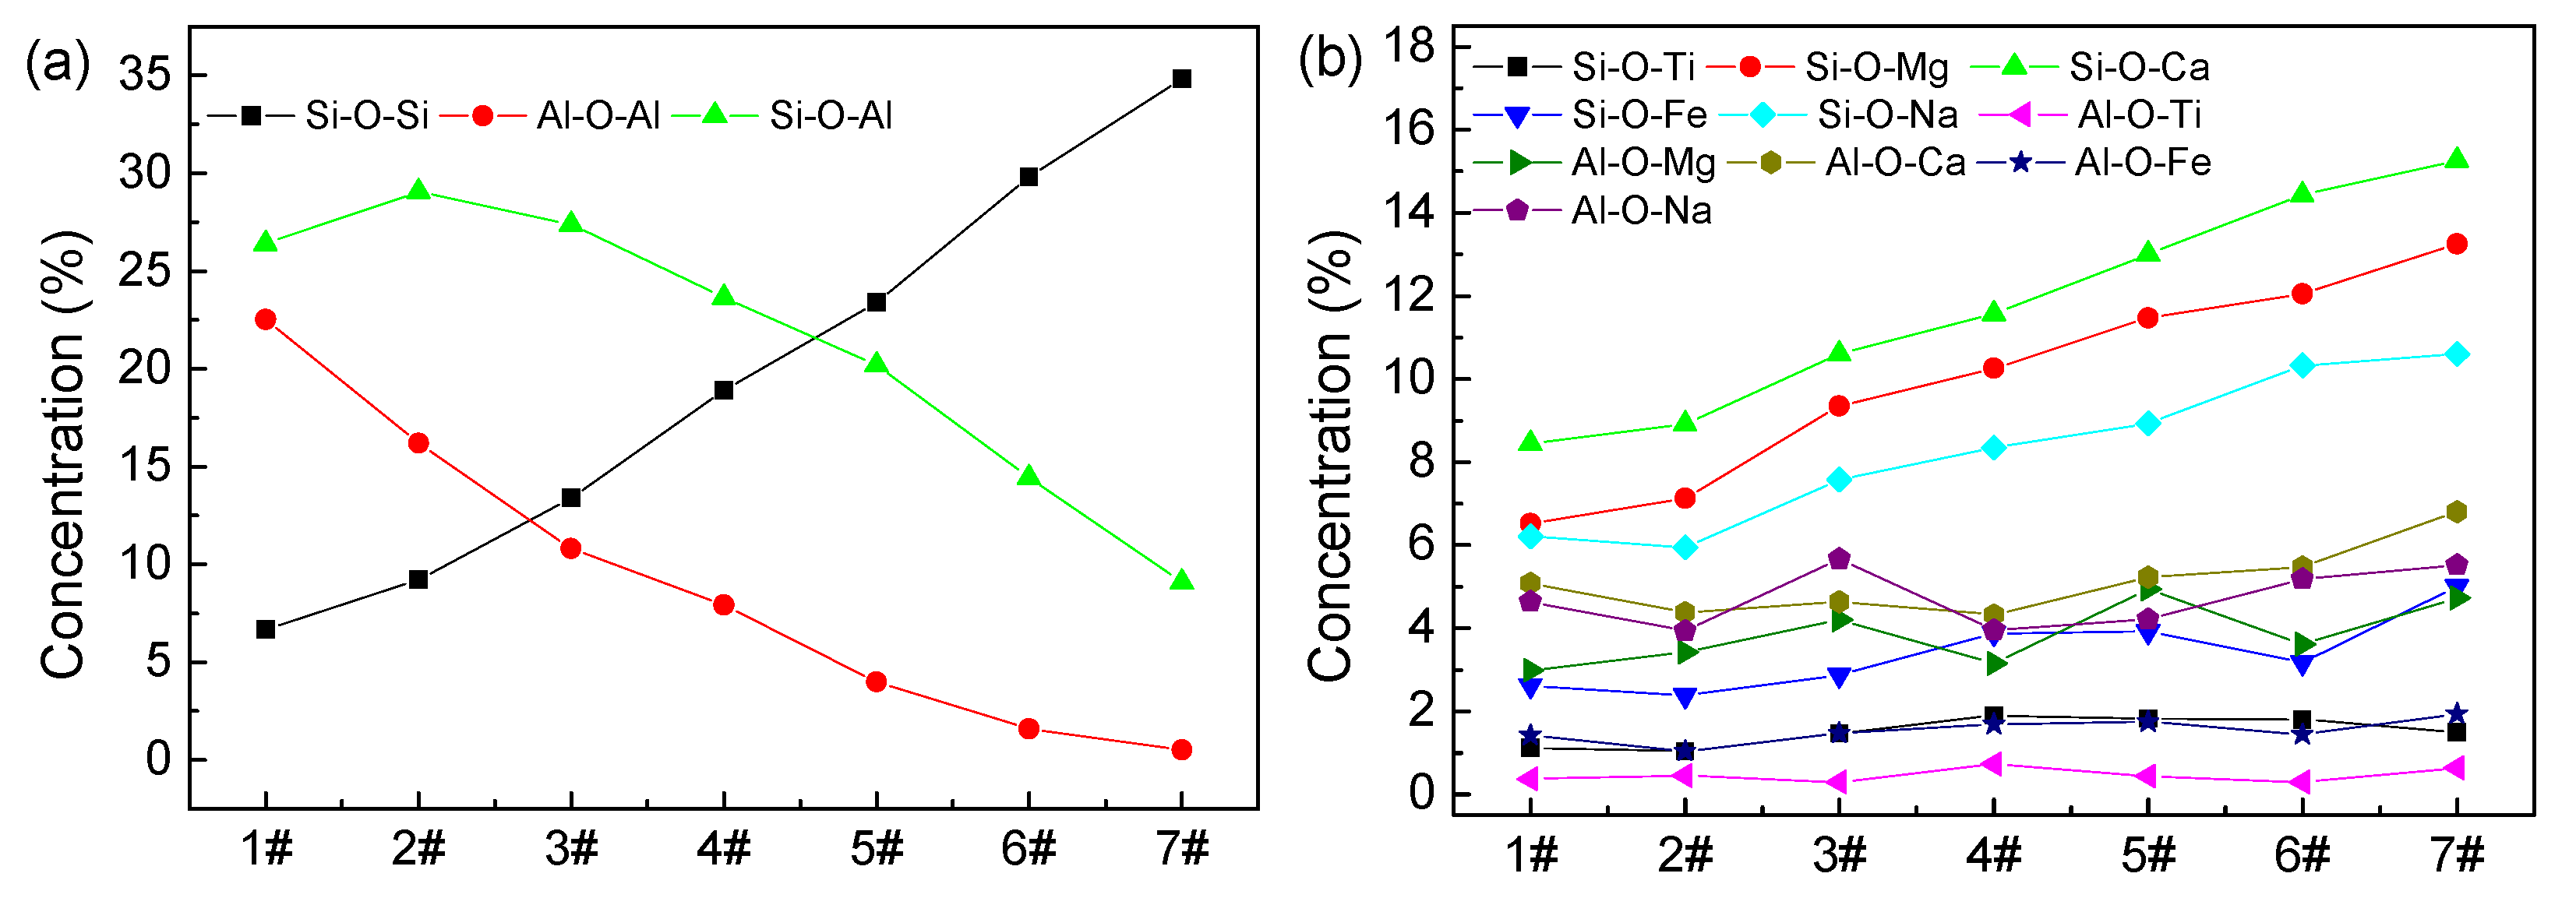
- With increasing ratio, the concentration of Si–O–Si BO in the molten red mud increases, the concentration of Al–O–Al BO decreases, and the concentration of Si–O–Al BO first increases and then decreases; the concentrations of Si–O–Ca NBO, Si–O–Mg NBO, and Si–O–Na NBO increase, and the remaining NBOs do not change significantly.
- The average bond angles of O–Si–O, O–Al–O, Si–O–Si, and Al–O–Si in the fused red mud are 110.2°, 106.5°, 144.5°, and 138.9°, respectively. With increasing ratio, the peaks of O–Si–O and Si–O–Si bond angle distributions become narrower, while the peaks of O–Al–O and Al–O–Si become wider. The results indicate that the degree of polymerization of [SiO4] tetrahedral network increases and that the degree of polymerization of [AlO4] tetrahedra decreases, leading to a more compact melt structure.
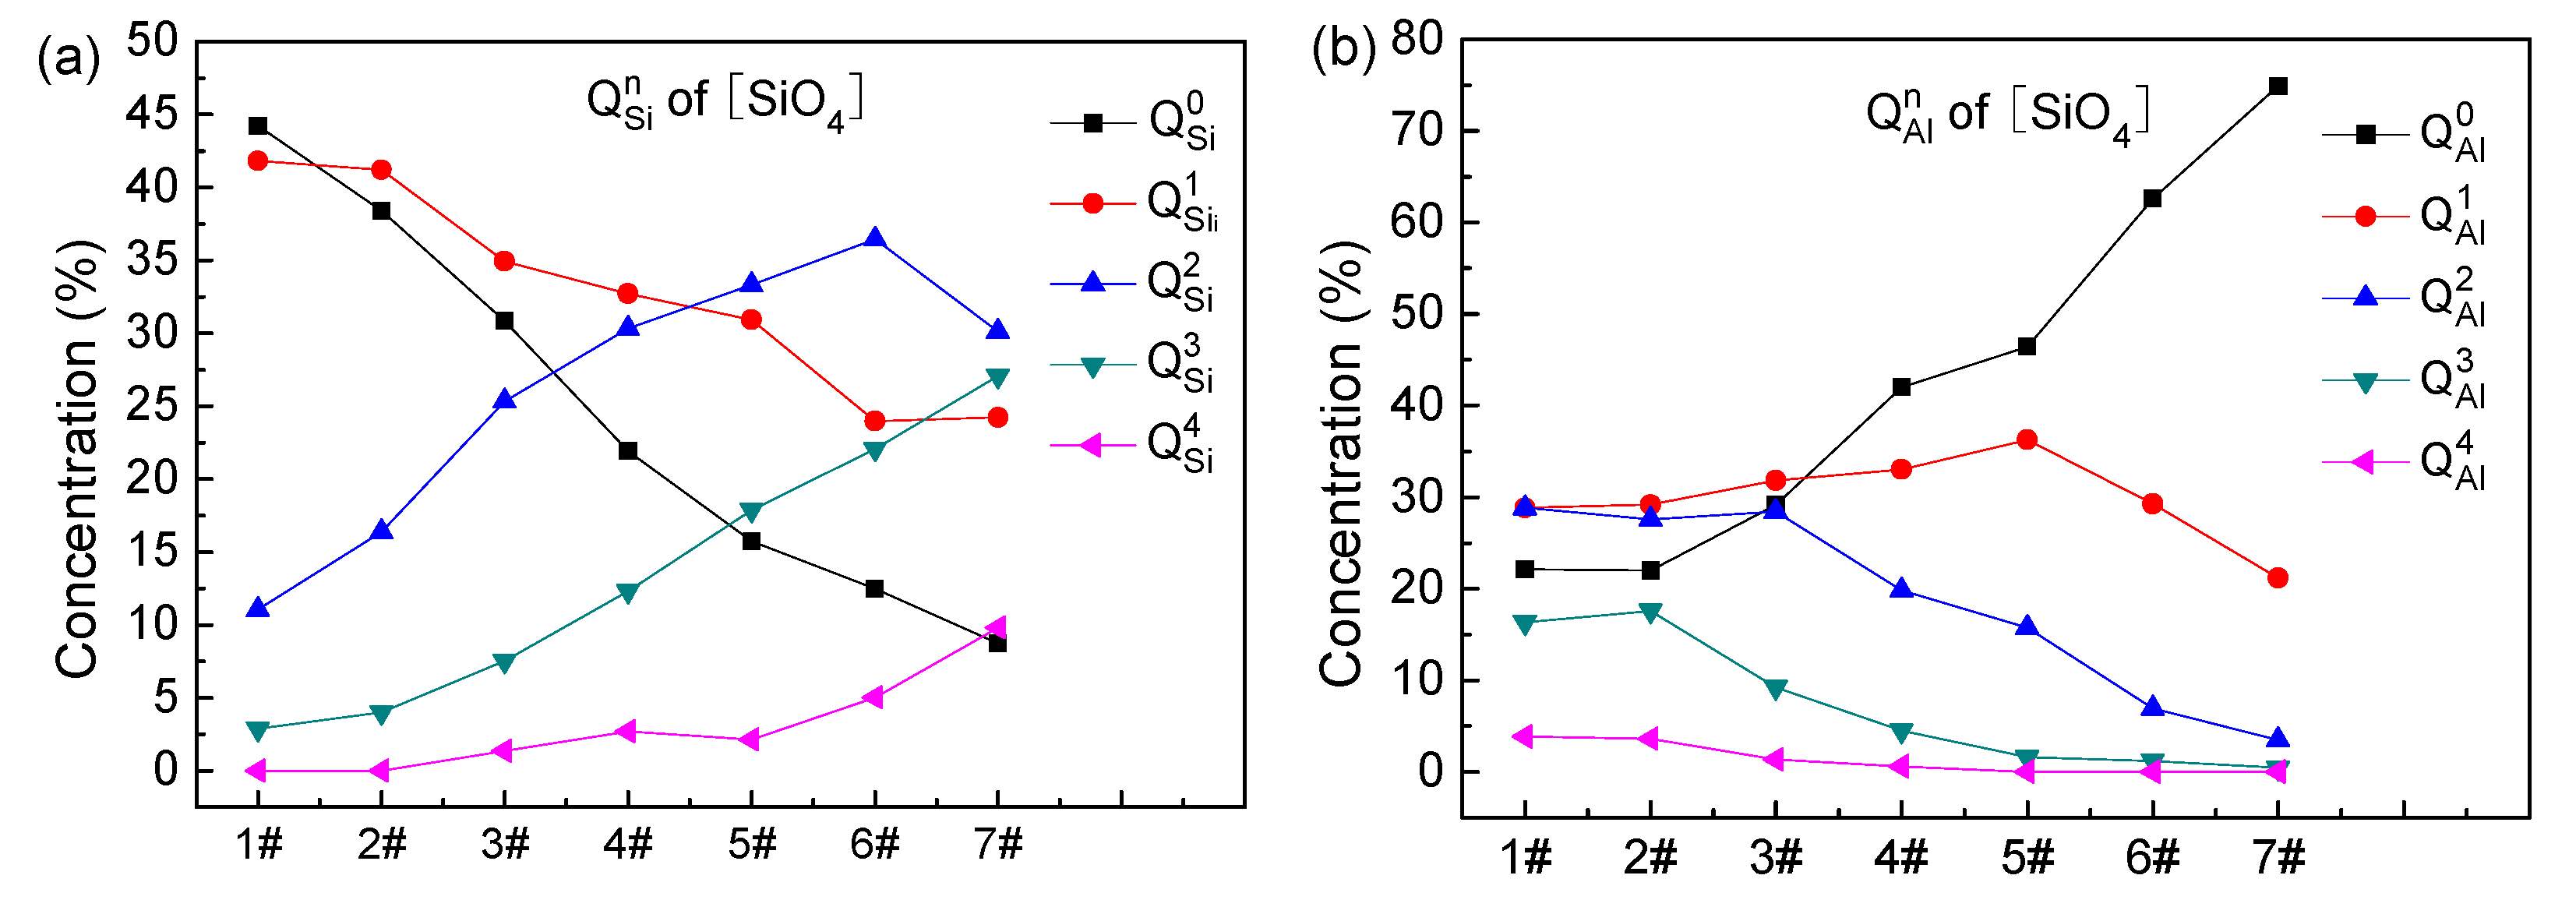
- With increasing ratio, (1) in the distribution of of [SiO4], and decrease, and first increases and then decreases; (2) in the distribution of of [SiO4], increases, first increases and then decreases, and first change slowly and then decrease, and the content of is very small and goes to zero when the ratio of is greater than 3; (3) the concentration of in the [AlO4] tetrahedra increases rapidly from the initial 17.44% to 76%, and first increase and then decrease, the content of remains very small and goes to zero when the ratio of is greater than 3; and (4) the concentration of in the [AlO4] tetrahedra decreases from 83.1% to 68%, while the concentration of increases from 15.1% to 30%, and the concentrations of , , and remain very small and are minimally influenced by the ratio.
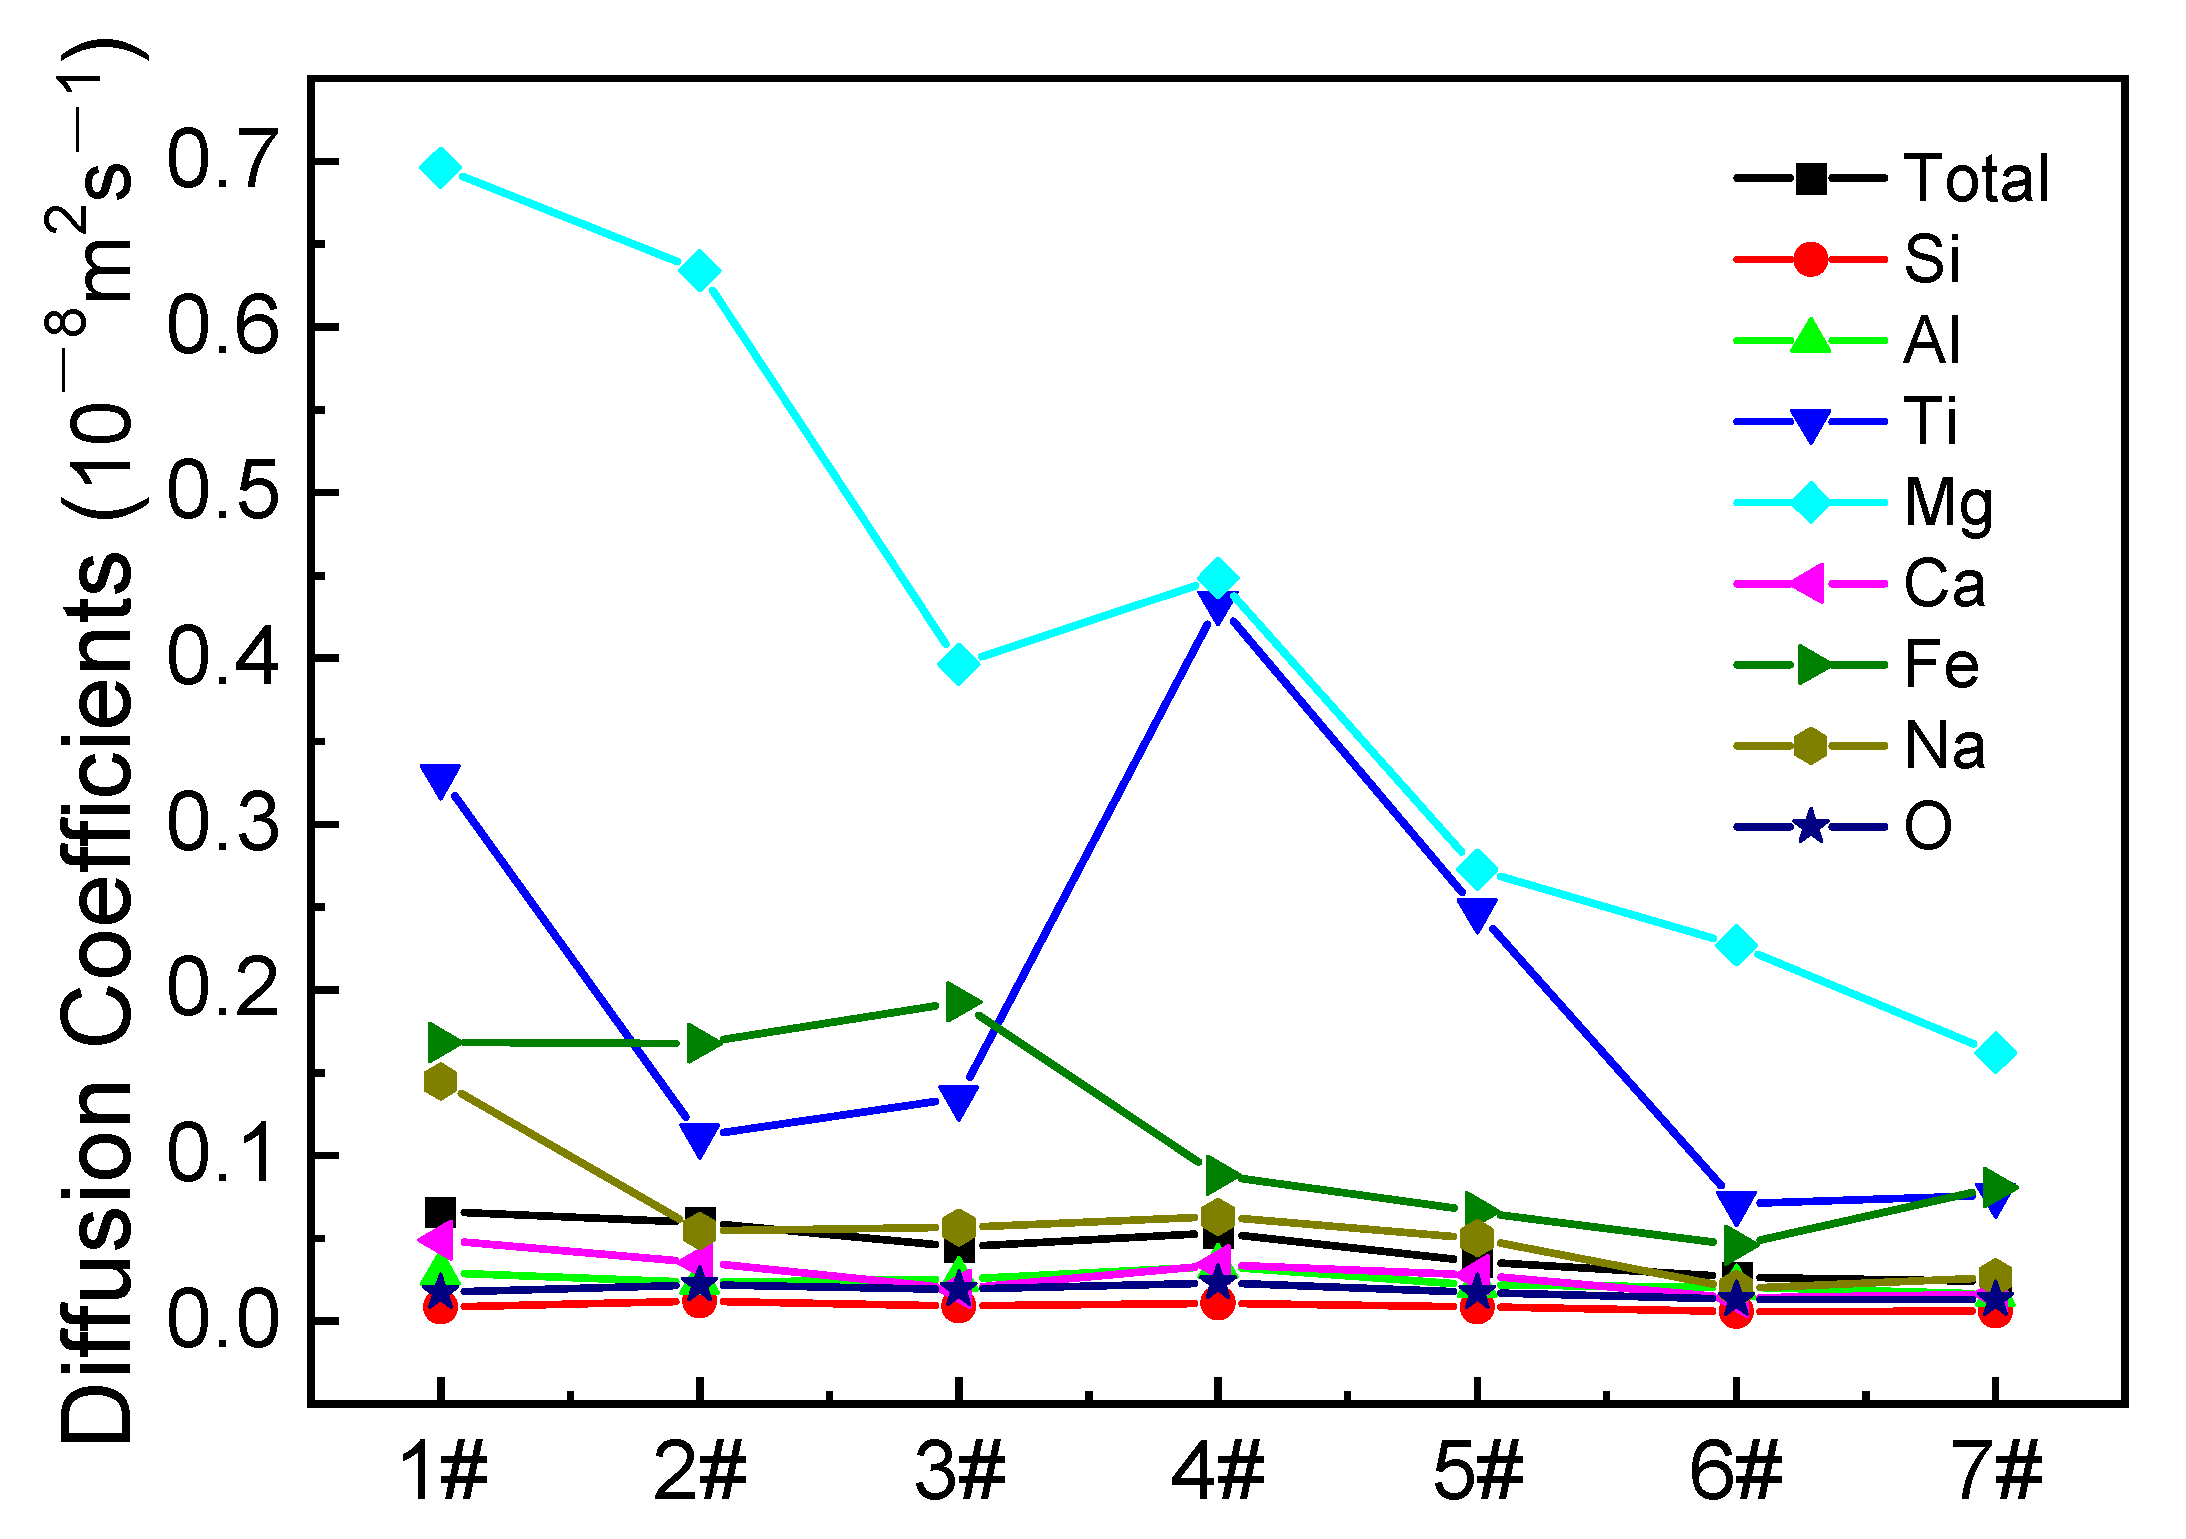
- With increasing ratio, the viscosity of the fused red mud first increases, then decreases, and finally increases because Ti4 and Fe3+ combine with O2− to form [TiO4] octahedron and [FeO4] tetrahedra, which increase the degree of polymerization of the melt.
Author Contributions
Funding
Data Availability Statement
Conflicts of Interest
References
- Lima, M.S.; Thives, L.P. Evaluation of red mud as filler in Brazilian dense graded asphalt mixtures. Constr. Build. Mater. 2020, 260, 119894. [Google Scholar] [CrossRef]
- Lu, G.-Z.; Zhang, T.-A.; Ma, L.-N.; Wang, Y.-X.; Zhang, W.-G.; Zhang, Z.-M.; Wang, L. Utilization of Bayer red mud by a calcification–carbonation method using calcium aluminate hydrate as a calcium source. Hydrometallurgy 2018, 188, 248–255. [Google Scholar] [CrossRef]
- Mukiza, E.; Zhang, L.; Liu, X.; Zhang, N. Utilization of red mud in road base and subgrade materials: A review. Resour. Conserv. Recycl. 2018, 141, 187–199. [Google Scholar] [CrossRef]
- Ma, J.; Wang, M.; You, J.; Tang, K.; Lu, L.; Wan, S.; Wang, J.; Gong, X.; Wang, Y. Quantitative studies on the structure of xCaO⋅(1 − x)SiO2 glasses and melts by in-situ Raman spectroscopy, 29Si MAS NMR and quantum chemistry ab initio calculation. J. Non-Cryst. Solids 2020, 546, 1–9. [Google Scholar] [CrossRef]
- Wang, C.; Li, Z.; Zhou, Z.; Gao, Y.; Zhang, J. Compatibility of different fibres with red mud-based geopolymer grouts. Constr. Build. Mater. 2022, 315, 125742. [Google Scholar] [CrossRef]
- Ding, C.; Zhang, Y.; Zhang, N.; Di, X.; Li, Y.; Zhang, Y. A new insight into utilization of red mud in poly(vinyl chloride) composites via surface modification and toughening modulation to attain performance optimization. Constr. Build. Mater. 2022, 333, 127340. [Google Scholar] [CrossRef]
- Hou, D.; Wu, D.; Wang, X.; Gao, S.; Yu, R.; Li, M.; Wang, P.; Wang, Y. Sustainable use of red mud in ultra-high performance concrete (UHPC): Design and performance evaluation. Cem. Concr. Compos. 2020, 115, 103862. [Google Scholar] [CrossRef]
- Zhang, J.; Yao, Z.; Wang, K.; Wang, F.; Jiang, H.; Liang, M.; Wei, J.; Airey, G. Sustainable utilization of bauxite residue (Red Mud) as a road material in pavements: A critical review. Constr. Build. Mater. 2020, 270, 121419. [Google Scholar] [CrossRef]
- Kan, L.; Wang, F. Mechanical properties of high ductile alkali-activated fiber reinforced composites incorporating red mud under different curing conditions. Ceram. Int. 2022, 48, 1999–2011. [Google Scholar] [CrossRef]
- Vigneshwaran, S.; Uthayakumar, M.; Arumugaprabu, V. Development and sustainability of industrial waste-based red mud hybrid composites. J. Clean. Prod. 2019, 230, 862–868. [Google Scholar] [CrossRef]
- Kim, Y.; Kim, M.; Sohn, J.; Park, H. Applicability of gold tailings, waste limestone, red mud, and ferronickel slag for producing glass fibers. J. Clean. Prod. 2018, 203, 957–965. [Google Scholar] [CrossRef]
- Qiu, G.; Miao, D.; Wei, X.; Bai, C.; Li, X. Effect of MgO/Al2O3 and CaO/SiO2 on the Metallurgical Properties of CaO-SiO2-Al2O3-MgO-TiO2 Slag. J. Non-Cryst. Solids 2022, 585, 1–10. [Google Scholar] [CrossRef]
- Ma, H.; Jiao, K.; Zhang, J.; Zong, Y.; Zhang, J.; Meng, S. Viscosity of CaO-MgO-Al2O3-SiO2-TiO2-FeO slag with varying TiO2 content: The Effect of Crystallization on Viscosity Abrupt Behavior. Ceram. Int. 2021, 47, 17445–17454. [Google Scholar] [CrossRef]
- Liu, W.; Zuo, H. Effect of MnO and CaO substitution for BaO on the viscosity and structure of CaO-SiO2-MgO-Al2O3-BaO-MnO slag. J. Non-Cryst. Solids 2021, 567, 1–8. [Google Scholar] [CrossRef]
- Liu, W.; Qin, J.; Xing, X.; Wang, J.; Zuo, H. Viscosity and structure evolution of CaO–SiO2-MgO-Al2O3-BaO slag with the CaO/SiO2 mass ratio of 0.9. Ceram. Int. 2021, 47, 33483–33489. [Google Scholar] [CrossRef]
- Feng, C.; Gao, L.-H.; Tang, J.; Liu, Z.-G.; Chu, M.-S. Effects of MgO/Al2O3 ratio on viscous behaviors and structures of MgO-Al2O3-TiO2-CaO-SiO2 slag systems with high TiO2 content and low CaO/SiO2 ratio. Trans. Nonferr. Metal. Soc. 2020, 30, 800–811. [Google Scholar] [CrossRef]
- Sun, Y.; Chen, M.; Zhao, B. Modification of the microstructures of CaO-SiO2-Al2O3-MgO slags using various minor elements. J. Non-Cryst. Solids 2019, 515, 50–57. [Google Scholar] [CrossRef]
- Deng, L.; Zhang, X.; Zhang, M.; Jia, X. Effect of CaF2 on viscosity, structure and properties of CaO-Al2O3-MgO-SiO2 slag glass ceramics. J. Non-Cryst. Solids 2018, 500, 310–316. [Google Scholar] [CrossRef]
- Zhang, S.; Zhang, X.; Liu, W.; Lv, X.; Bai, C.; Wang, L. Relationship between structure and viscosity of CaO-SiO2-Al2O3-MgO-TiO2 slag. J. Non-Cryst. Solids 2014, 402, 214–222. [Google Scholar] [CrossRef]
- Mongalo, L.; Lopis, A.S.; Venter, G.A. Molecular dynamics simulations of the structural properties and electrical conductivities of CaO-MgO-Al2O3-SiO2 melts. J. Non-Cryst. Solids 2016, 452, 194–202. [Google Scholar] [CrossRef]
- Zhao, H.; Li, J.; Yang, S.; Liu, J.; Liu, W. Molecular Dynamics Study of Structural Properties of Refining Slag with Various CaO/Al2O3 Ratios. Minerals 2021, 11, 398. [Google Scholar] [CrossRef]
- Jiang, C.; Li, K.; Zhang, J.; Liu, Z.; Niu, L.; Liang, W.; Sun, M.; Ma, H.; Wang, Z. The effect of CaO and MgO on the structure and properties of coal ash in the blast furnace: A molecular dynamics simulation and thermodynamic calculation. Chem. Eng. Sci. 2019, 210, 115226. [Google Scholar] [CrossRef]
- Gao, L.; Liu, X.; Bai, J.; Kong, L.; Bai, Z.; Li, W. Structure and flow properties of coal ash slag using ring statistics and molecular dynamics simulation: Role of CaO/Na2O in SiO2–Al2O3–CaO–Na2O. Chem. Eng. Sci. 2021, 231, 116285. [Google Scholar] [CrossRef]
- Dai, X.; Bai, J.; Huang, Q.; Liu, Z.; Bai, X.; Lin, C.-T.; Li, W.; Guo, W.; Wen, X.; Du, S. Coal ash fusion properties from molecular dynamics simulation: The role of calcium oxide. Fuel 2018, 216, 760–767. [Google Scholar] [CrossRef]
- Atila, A.; Ghardi, E.M.; Hasnaoui, A.; Ouaskit, S. Alumina effect on the structure and properties of calcium aluminosilicate in the percalcic region: A molecular dynamics investigation. J. Non-Cryst. Solids 2019, 525, 1–14. [Google Scholar] [CrossRef]
- Chen, Y.; Pan, W.; Jia, B.; Wang, Q.; Zhang, X.; Wang, Q.; He, S. Effects of the amphoteric behavior of Al2O3 on the structure and properties of CaO-SiO2-Al2O3 melts by molecular dynamics. J. Non-Cryst. Solids 2021, 552, 120435. [Google Scholar] [CrossRef]
- Jabraoui, H.; Badawi, M.; Lebègue, S.; Vaills, Y. Elastic and structural properties of low silica calcium aluminosilicate glasses from molecular dynamics simulations. J. Non-Cryst. Solids 2018, 499, 142–152. [Google Scholar] [CrossRef]
- Kim, T.S.; Park, J.H. Thermodynamics of iron redox equilibria and viscosity-structure relationship of CaO Al2O3FetO melts. J. Non-Cryst. Solids 2020, 542, 1–9. [Google Scholar] [CrossRef]
- Zhao, Y.; Du, J.; Qiao, X.; Cao, X.; Zhang, C.; Xu, G.; Liu, Y.; Peng, S.; Han, G. Ionic self-diffusion of Na2O–Al2O3–SiO2 glasses from molecular dynamics simulations. J. Non-Cryst. Solids 2020, 527, 1–9. [Google Scholar] [CrossRef]
- Jiang, C.; Li, K.; Zhang, J.; Qin, Q.; Liu, Z.; Sun, M.; Wang, Z.; Liang, W. Effect of MgO/Al2O3 ratio on the structure and properties of blast furnace slags: A molecular dynamics simulation. J. Non-Cryst. Solids 2018, 502, 76–82. [Google Scholar] [CrossRef]
- Wu, T.; Wang, Q.; Yu, C.; He, S. Structural and viscosity properties of CaO-SiO2-Al2O3-FeO slags based on molecular dynamic simulation. J. Non-Cryst. Solids 2016, 450, 23–31. [Google Scholar] [CrossRef]
- Wu, T.; He, S.; Liang, Y.; Wang, Q. Molecular dynamics simulation of the structure and properties for the CaO-SiO2 and CaO-Al2O3 systems. J. Non-Cryst. Solids 2015, 411, 145–151. [Google Scholar] [CrossRef]
- Zhang, S.; Zhang, X.; Bai, C.; Wen, L.; Lv, X. Effect of TiO2 Content on the Structure of CaO–SiO2–TiO2 System by Molecular Dynamics Simulation. ISIJ Int. 2013, 53, 1131–1137. [Google Scholar] [CrossRef] [Green Version]
- Shimoda, K.; Saito, K. Detailed Structure Elucidation of the Blast Furnace Slag by Molecular Dynamics Simulation. ISIJ Int. 2007, 47, 1275–1279. [Google Scholar] [CrossRef] [Green Version]
- Okuno, M.; Kawamura, K. Molecular dynamics calculations for Mg3Al2Si3O12 (pyrope) and Ca3Al2Si3O12 (grossular) glass structures. J. Non-Cryst. Solids 1995, 191, 249–259. [Google Scholar] [CrossRef]
- Goj, P.; Stoch, P. Molecular dynamics simulations of P2O5-Fe2O3-FeO-Na2O glasses. J. Non-Cryst. Solids 2018, 500, 70–77. [Google Scholar] [CrossRef]
- Wu, T.; Wang, Q.; Yao, T.; He, S. Molecular dynamics simulations of the structural properties of Al2O3-based binary systems. J. Non-Cryst. Solids 2016, 435, 17–26. [Google Scholar] [CrossRef]
- Lee, S.K.; Stebbins, J.F. Al-O-Al and Si-O-Si sites in framework aluminosilicate glasses with Si/Al = 1: Quantification of framework disorder. J. Non-Cryst. Solids 2000, 270, 260–264. [Google Scholar] [CrossRef]
- Nevins, D.; Spera, F.J.; Ghiorso, M.S. Shear viscosity and diffusion in liquid MgSiO3: Transport properties and implications for terrestrial planet magma oceans. Am. Miner. 2009, 94, 975–980. [Google Scholar] [CrossRef]
- Avid, T.; Charles, E.L.; Gregory, M.B.; Takeyuki, U.; Wang, Y. High-pressure viscometry of polymerized silicate melts and limitations of the Eyring equation. Am. Miner. 2004, 89, 1701–1708. [Google Scholar]


| i | j | Aij (eV) | Bij (1/Å) | Cij (eV·Å6) |
|---|---|---|---|---|
| O | O | 1.18 × 10⁵ | 7.31 | 0 |
| Si | Si | 8.32 × 10⁵ | 8.77 | 2.75 × 101 |
| Ca | Ca | 2.55 × 10⁵ | 4.68 | 0 |
| Fe | Fe | 8.49 × 10⁵ | 6.89 | 0 |
| Mg | Mg | 4.16 × 10⁵ | 6.75 | 6.91 × 101 |
| O | Si | 1.98 × 10⁵ | 5.77 | 0 |
| O | Ca | 1.52 × 10⁵ | 4.93 | 0 |
| O | Fe | 2.74 × 10⁵ | 6.08 | 0 |
| O | Mg | 1.06 × 10⁵ | 4.95 | 0 |
| Si | Ca | 2.43 × 10⁵ | 5.52 | 7.65 × 100 |
| Si | Fe | 5.79 × 10⁵ | 6.64 | 6.56 × 101 |
| Si | Mg | 5.86 × 10⁵ | 7.64 | 4.65 × 101 |
| Ca | Fe | 4.19 × 10⁵ | 5.68 | 0 |
| Ca | Mg | 1.82 × 10⁵ | 5.08 | 0 |
| Fe | Mg | 2.52 × 10⁵ | 5.59 | 0 |
| Al | Al | 2.44 × 10³ | 3.65 | 0 |
| Ti | Ti | 3.52 × 10⁴ | 6.25 | 0 |
| Na | Na | 1.35 × 10³ | 6.25 | 0 |
| Al | O | 1.95 × 10³ | 3.55 | 0 |
| Ti | O | 2.40 × 10⁵ | 6.06 | 0 |
| Na | O | 1.99 × 10³ | 6.25 | 0 |
| Na | Si | 1.25 × 10³ | 6.25 | 0 |
| Sample No. | Weight Percentage | |||||||
|---|---|---|---|---|---|---|---|---|
| SiO2 | Al2O3 | CaO | MgO | Na2O | Fe2O3 | TiO2 | ||
| 1# | 25 | 35 | 12 | 10 | 6 | 8 | 4 | 0.71 |
| 2# | 30 | 30 | 12 | 10 | 6 | 8 | 4 | 1 |
| 3# | 35 | 25 | 12 | 10 | 6 | 8 | 4 | 1.4 |
| 4# | 40 | 20 | 12 | 10 | 6 | 8 | 4 | 2 |
| 5# | 45 | 15 | 12 | 10 | 6 | 8 | 4 | 3 |
| 6# | 50 | 10 | 12 | 10 | 6 | 8 | 4 | 5 |
| 7# | 55 | 5 | 12 | 10 | 6 | 8 | 4 | 11 |
| Sample No. | Number of Atoms | ||||||||
|---|---|---|---|---|---|---|---|---|---|
| Ca | Si | Al | Ti | Mg | Fe | Na | O | Total | |
| 1# | 107 | 208 | 344 | 25 | 125 | 38 | 96 | 1319 | 2262 |
| 2# | 107 | 250 | 294 | 25 | 125 | 38 | 96 | 1328 | 2263 |
| 3# | 107 | 292 | 246 | 25 | 125 | 38 | 96 | 1340 | 2269 |
| 4# | 107 | 338 | 196 | 25 | 125 | 38 | 96 | 1347 | 2272 |
| 5# | 107 | 375 | 148 | 25 | 125 | 38 | 96 | 1359 | 2273 |
| 6# | 107 | 417 | 98 | 25 | 125 | 38 | 96 | 1368 | 2274 |
| 7# | 107 | 458 | 50 | 25 | 125 | 38 | 96 | 1378 | 2277 |
Publisher’s Note: MDPI stays neutral with regard to jurisdictional claims in published maps and institutional affiliations. |
© 2022 by the authors. Licensee MDPI, Basel, Switzerland. This article is an open access article distributed under the terms and conditions of the Creative Commons Attribution (CC BY) license (https://creativecommons.org/licenses/by/4.0/).
Share and Cite
Xu, B.; Cao, Y.; Wang, Z.; Du, P.; Long, Y. Molecular Dynamics Study on the Effect of SiO2/Al2O3 Mass Ratio on the Structural Properties and Viscosity of Molten Fused Red Mud. Minerals 2022, 12, 925. https://doi.org/10.3390/min12080925
Xu B, Cao Y, Wang Z, Du P, Long Y. Molecular Dynamics Study on the Effect of SiO2/Al2O3 Mass Ratio on the Structural Properties and Viscosity of Molten Fused Red Mud. Minerals. 2022; 12(8):925. https://doi.org/10.3390/min12080925
Chicago/Turabian StyleXu, Bo, Yaran Cao, Zhengzheng Wang, Peipei Du, and Yue Long. 2022. "Molecular Dynamics Study on the Effect of SiO2/Al2O3 Mass Ratio on the Structural Properties and Viscosity of Molten Fused Red Mud" Minerals 12, no. 8: 925. https://doi.org/10.3390/min12080925