
Effect of the Particle Size Composition and Dry Density on the Water Retention Characteristics of Remolded Loess

Abstract
:1. Introduction
2. Materials and Methods
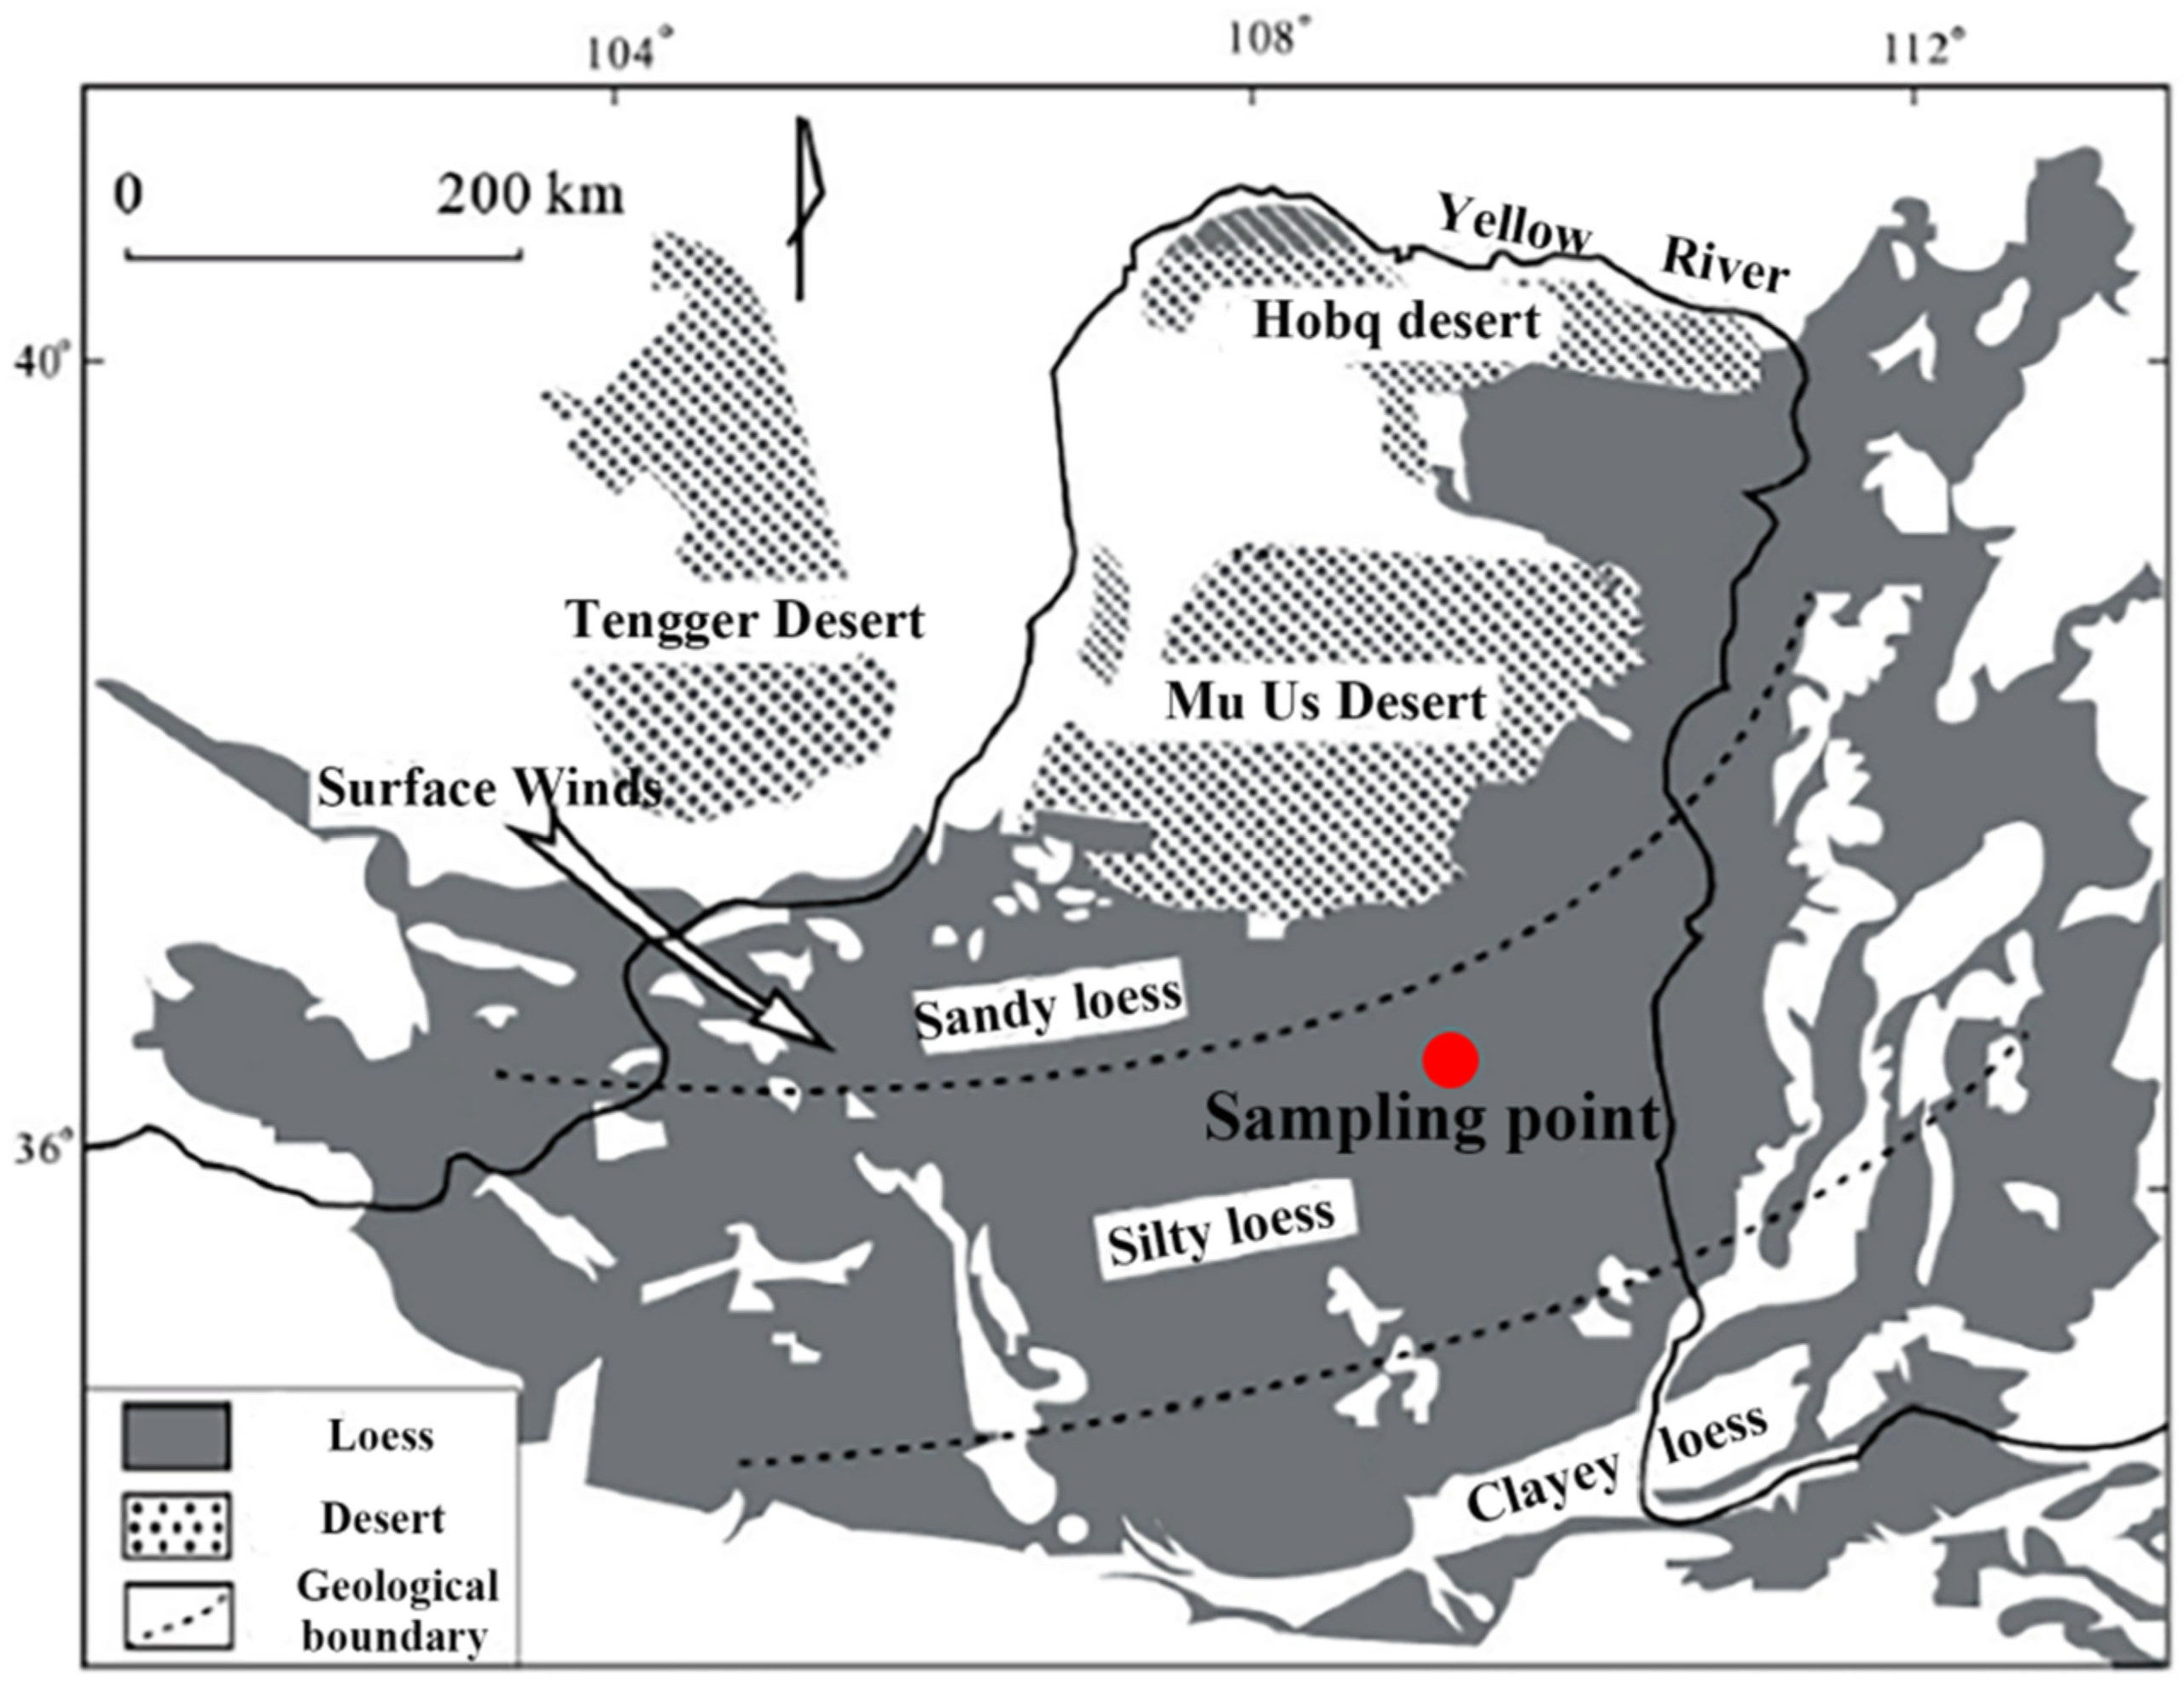
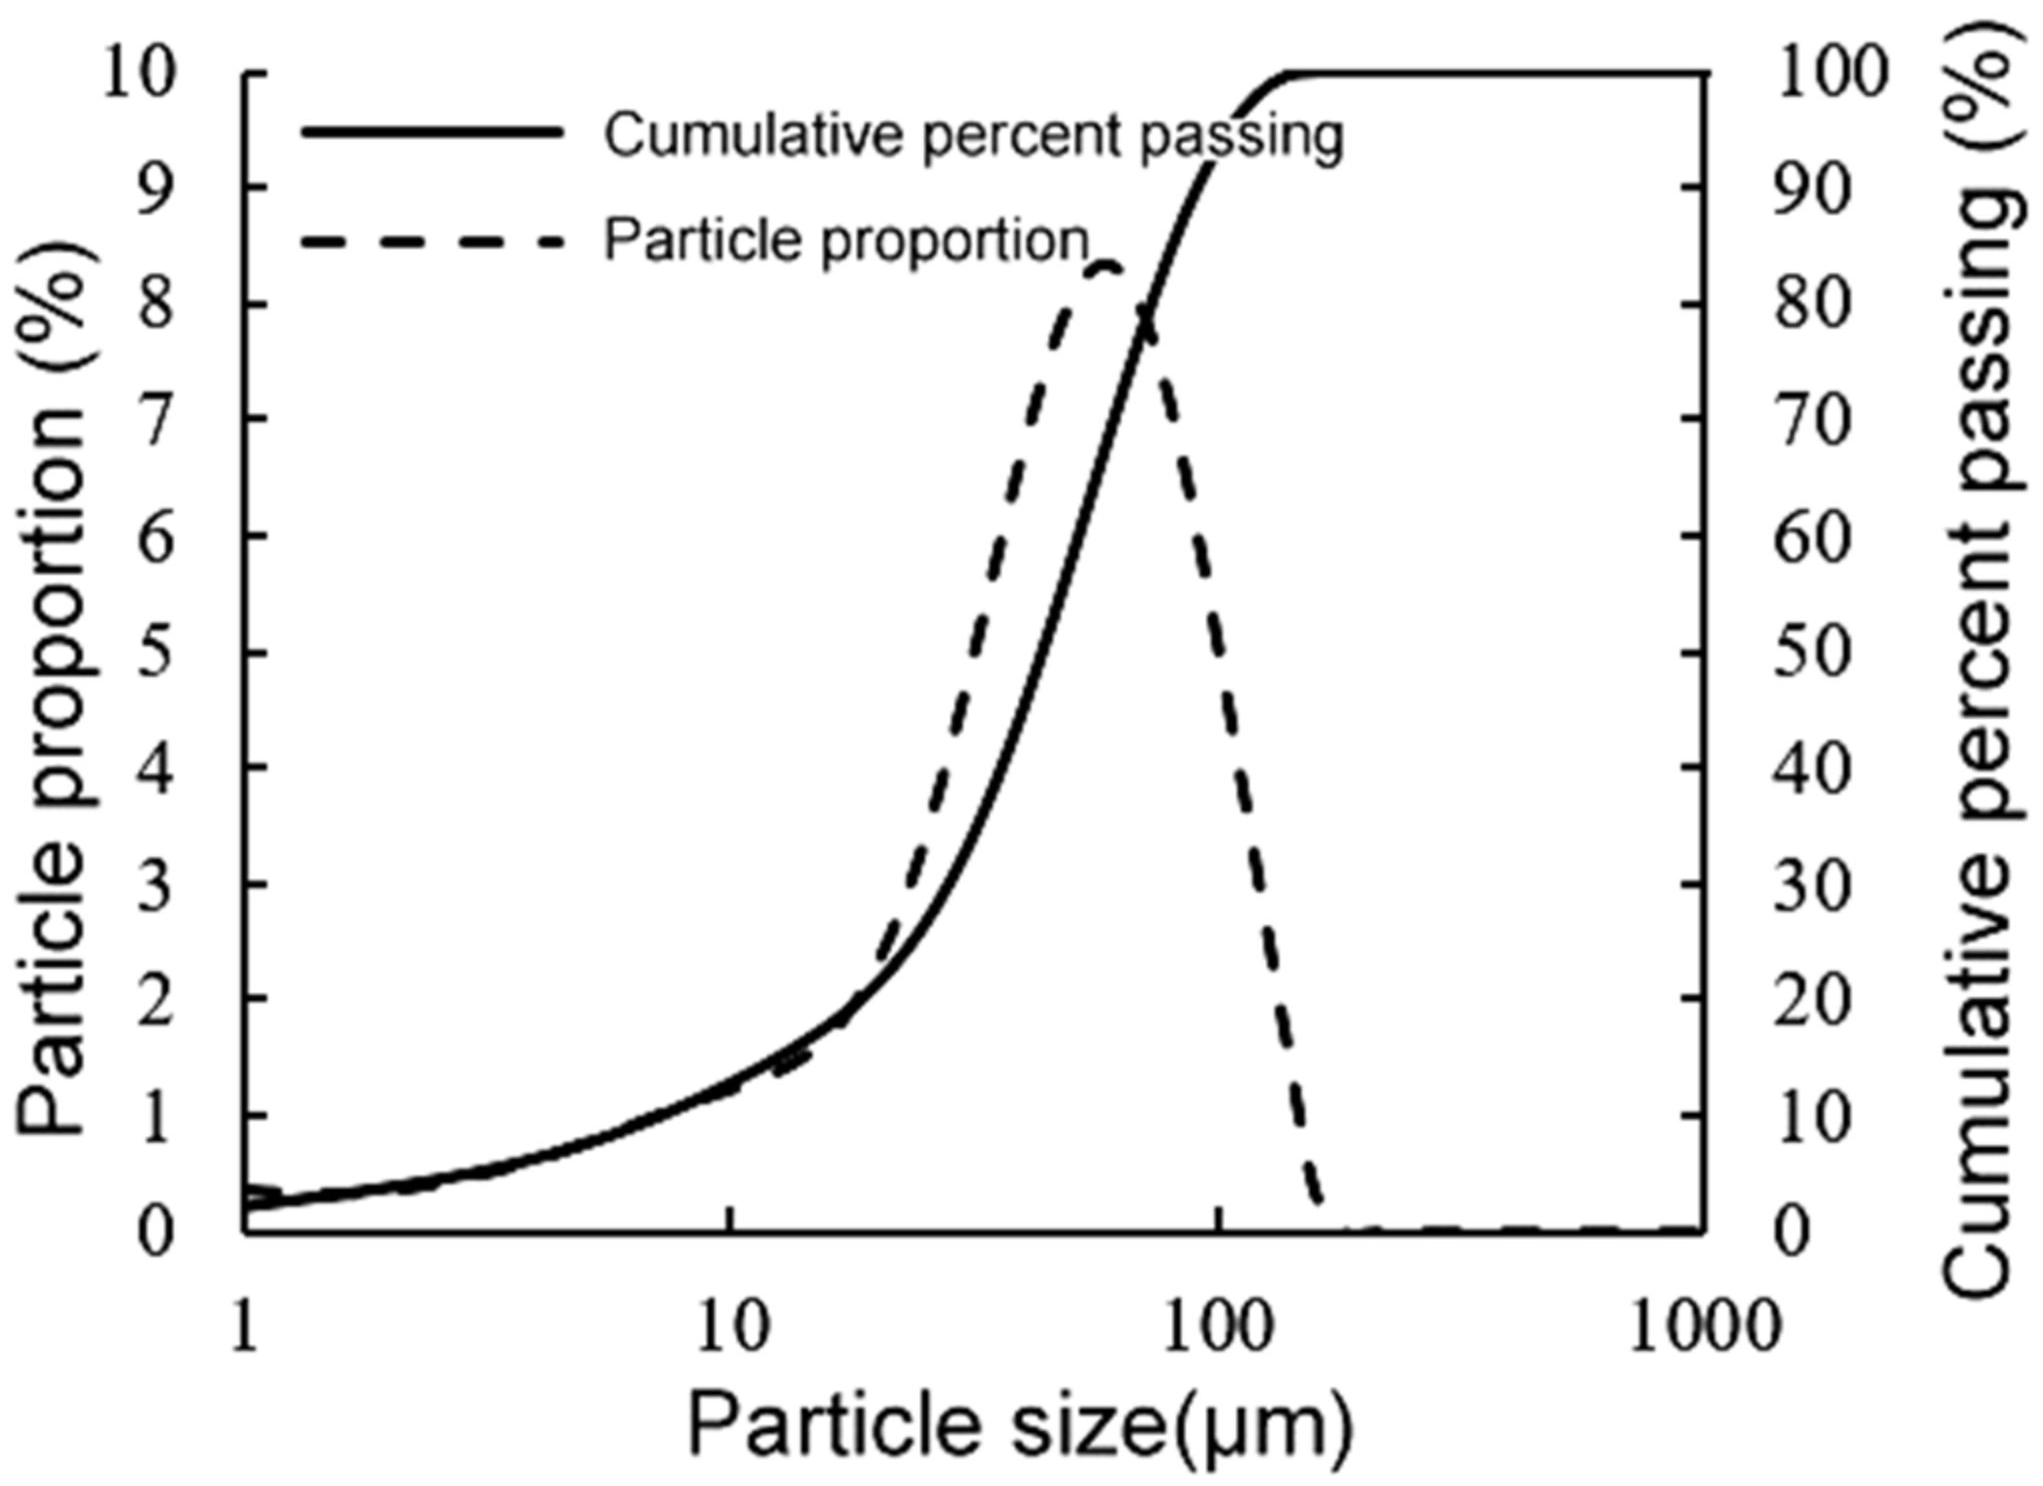
2.1. Soil Samples
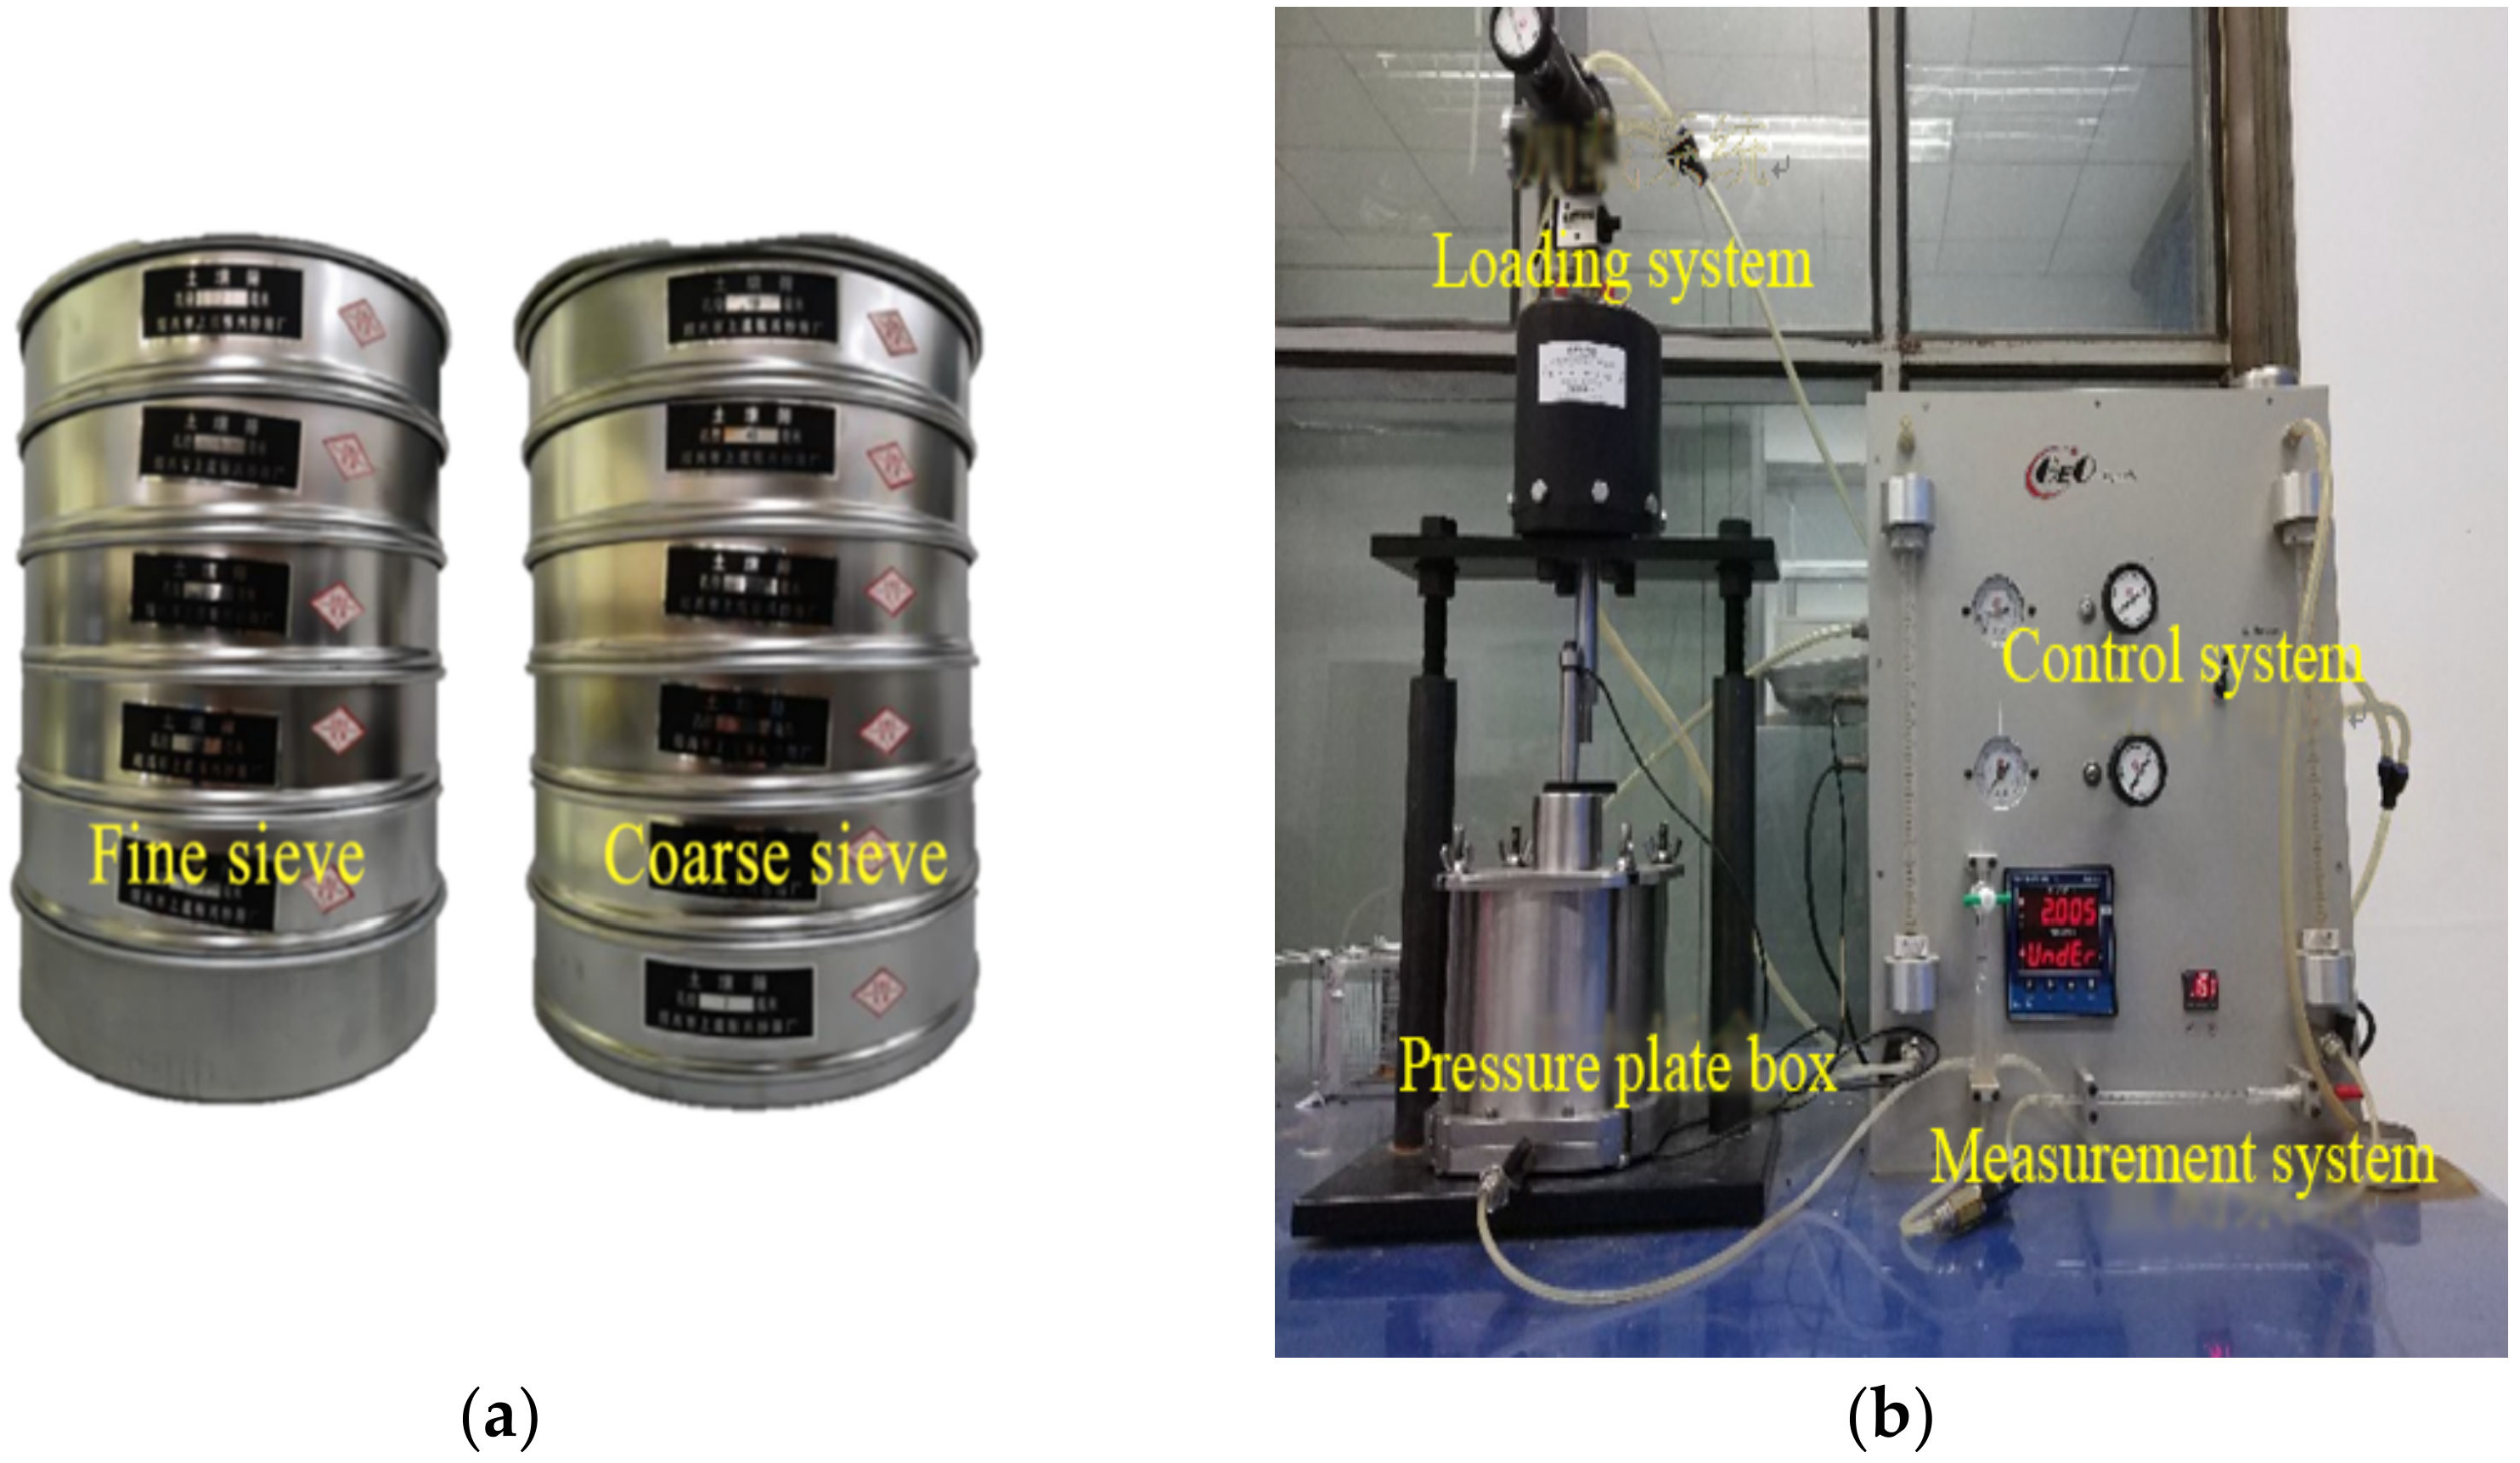
2.2. Test Equipment
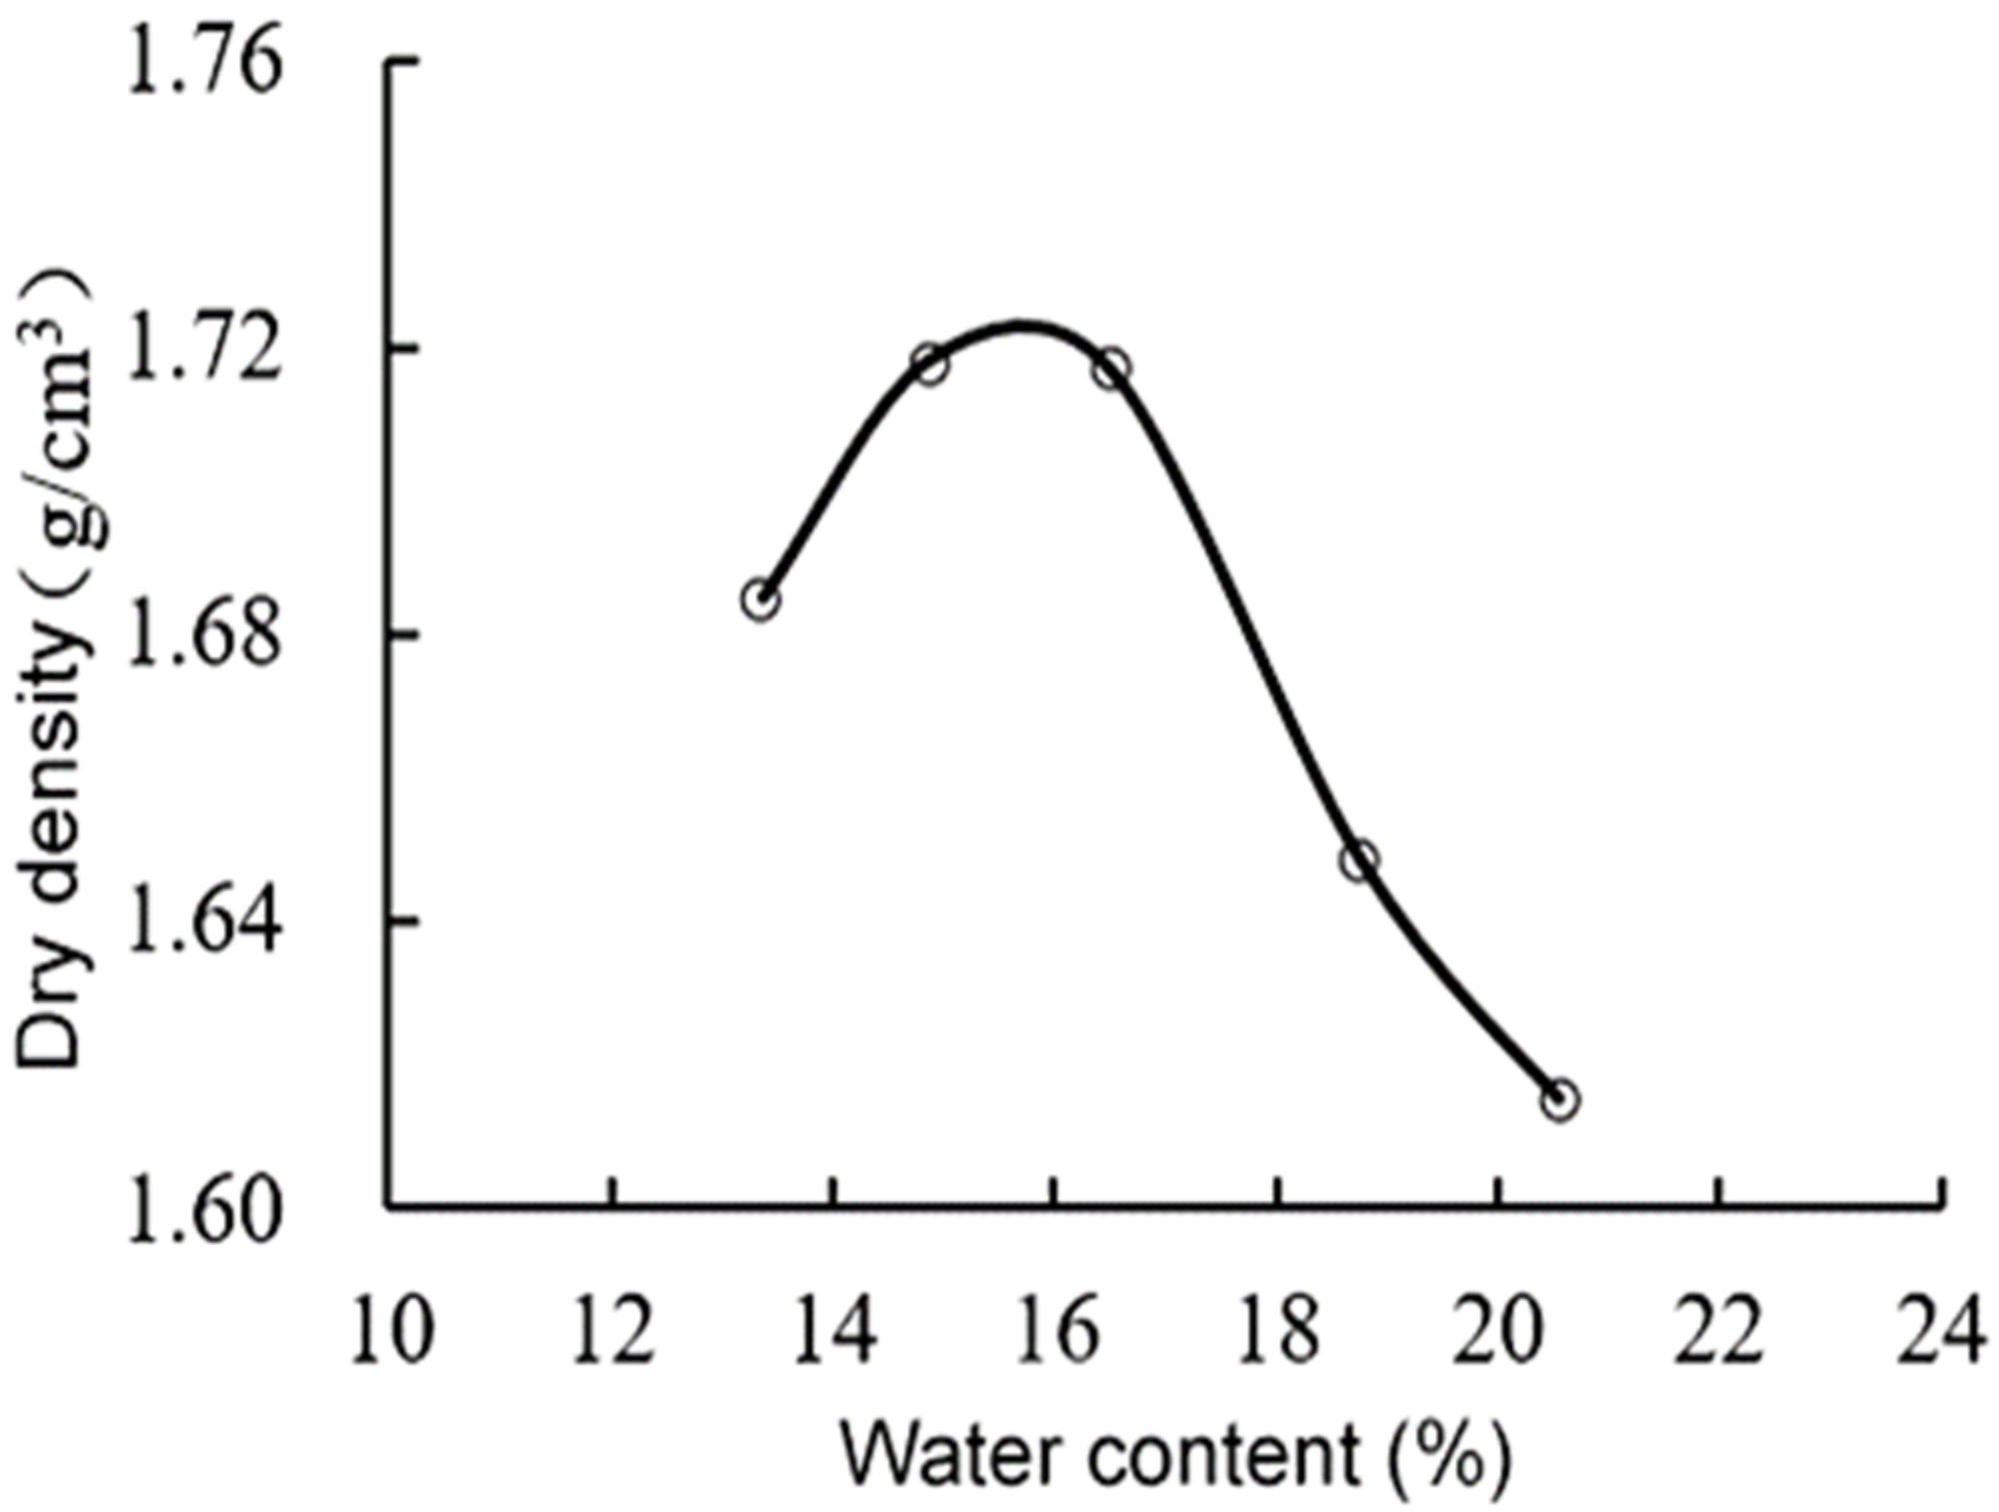
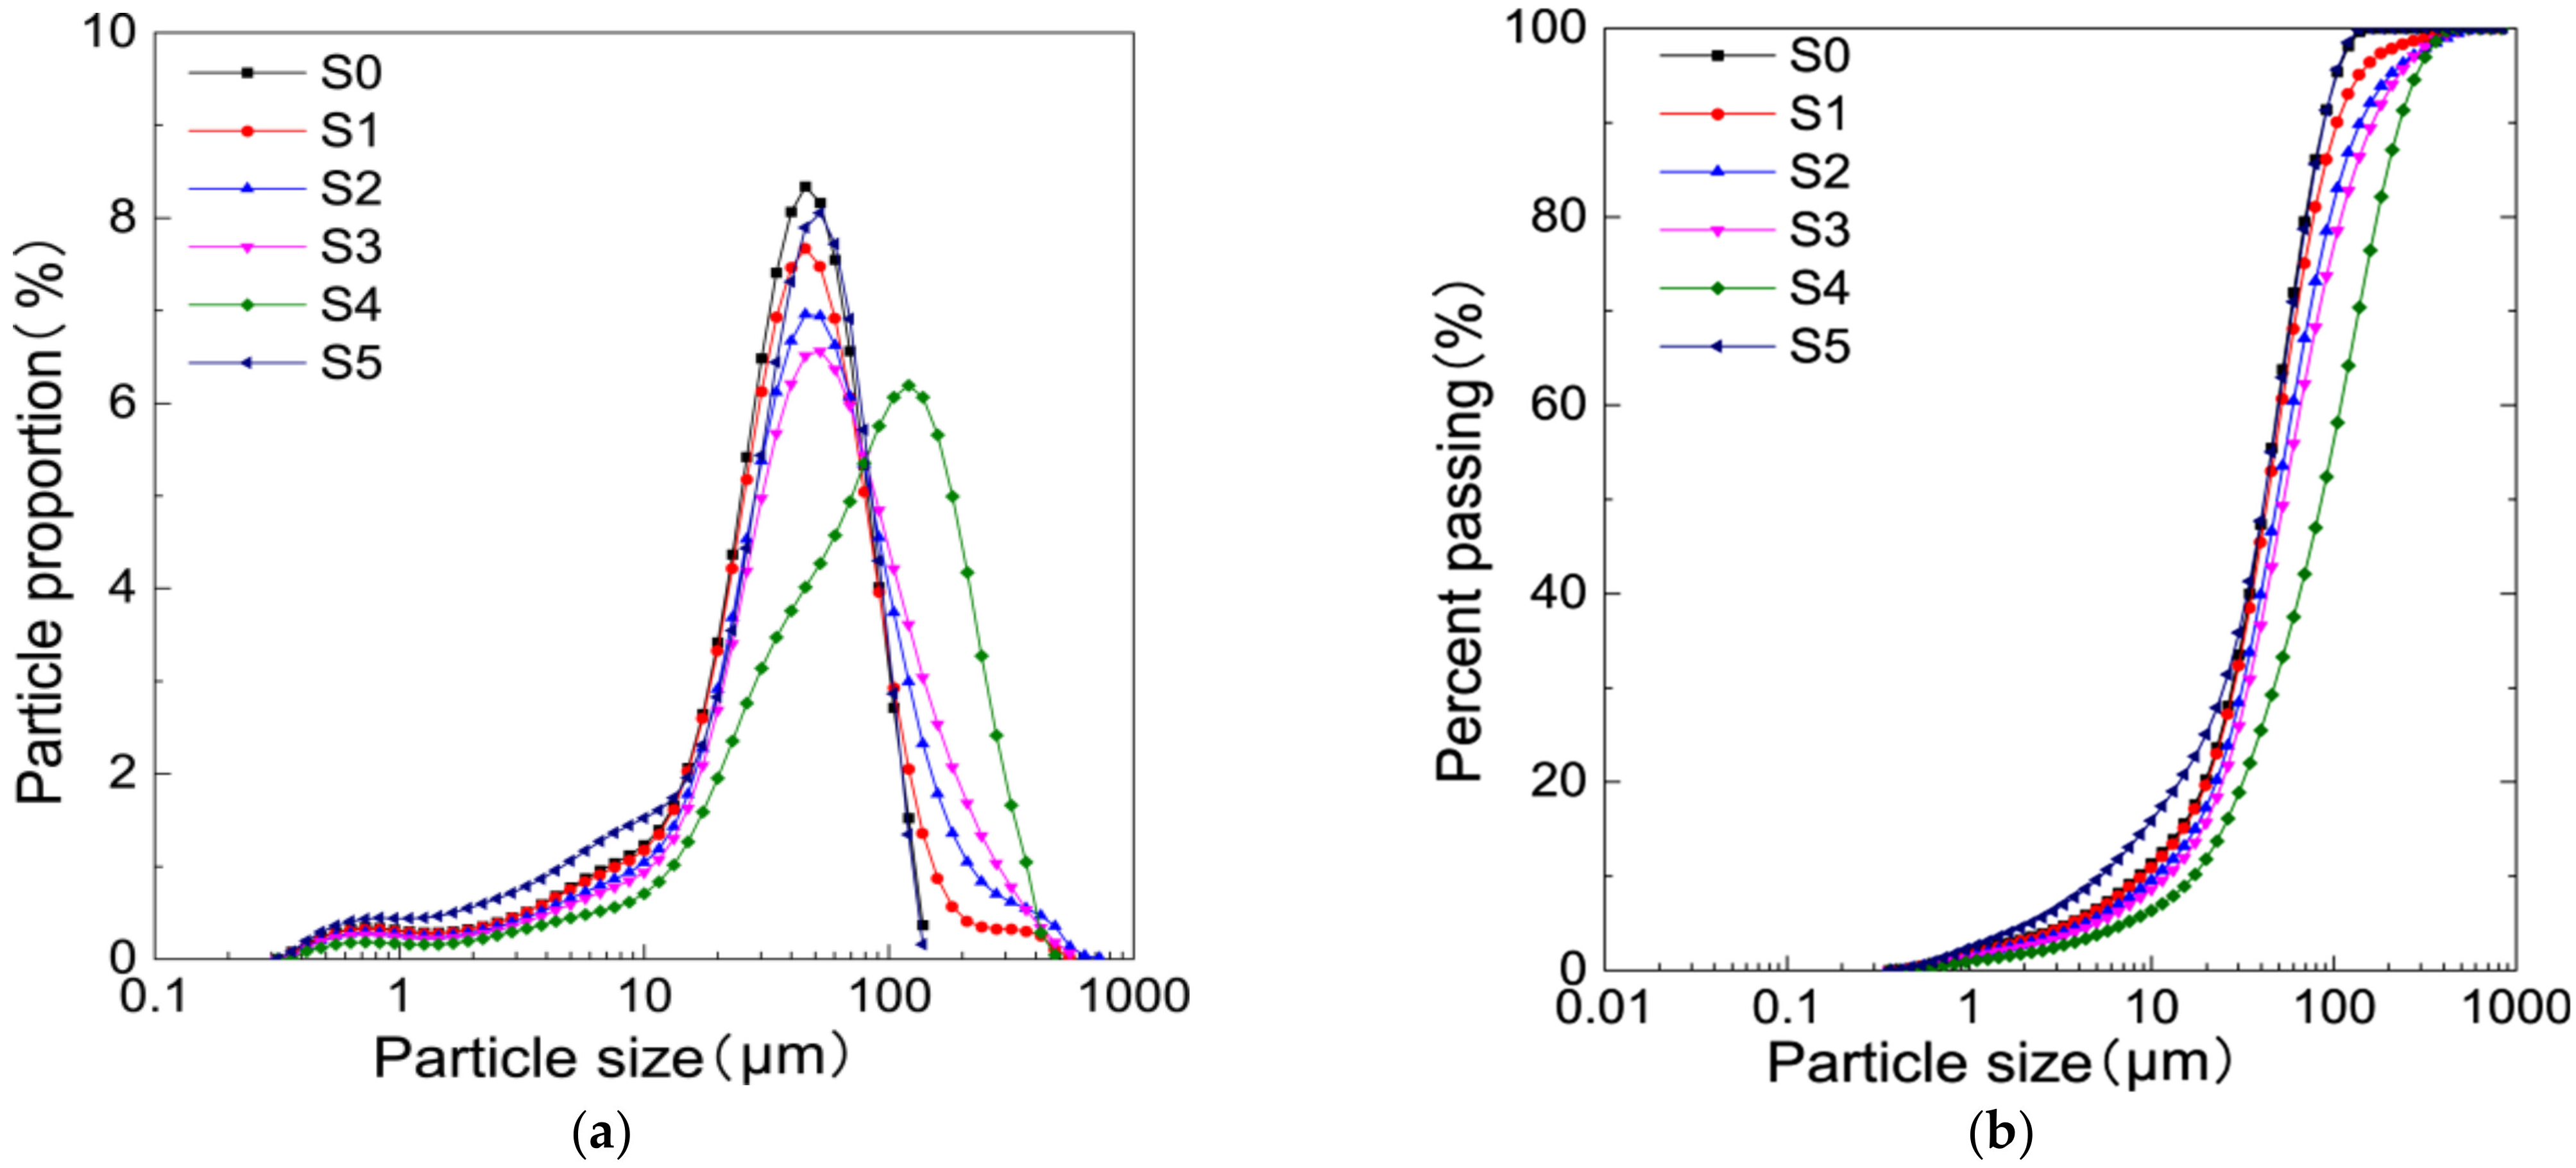
2.3. Sample Preparation
3. Test Results and Analysis
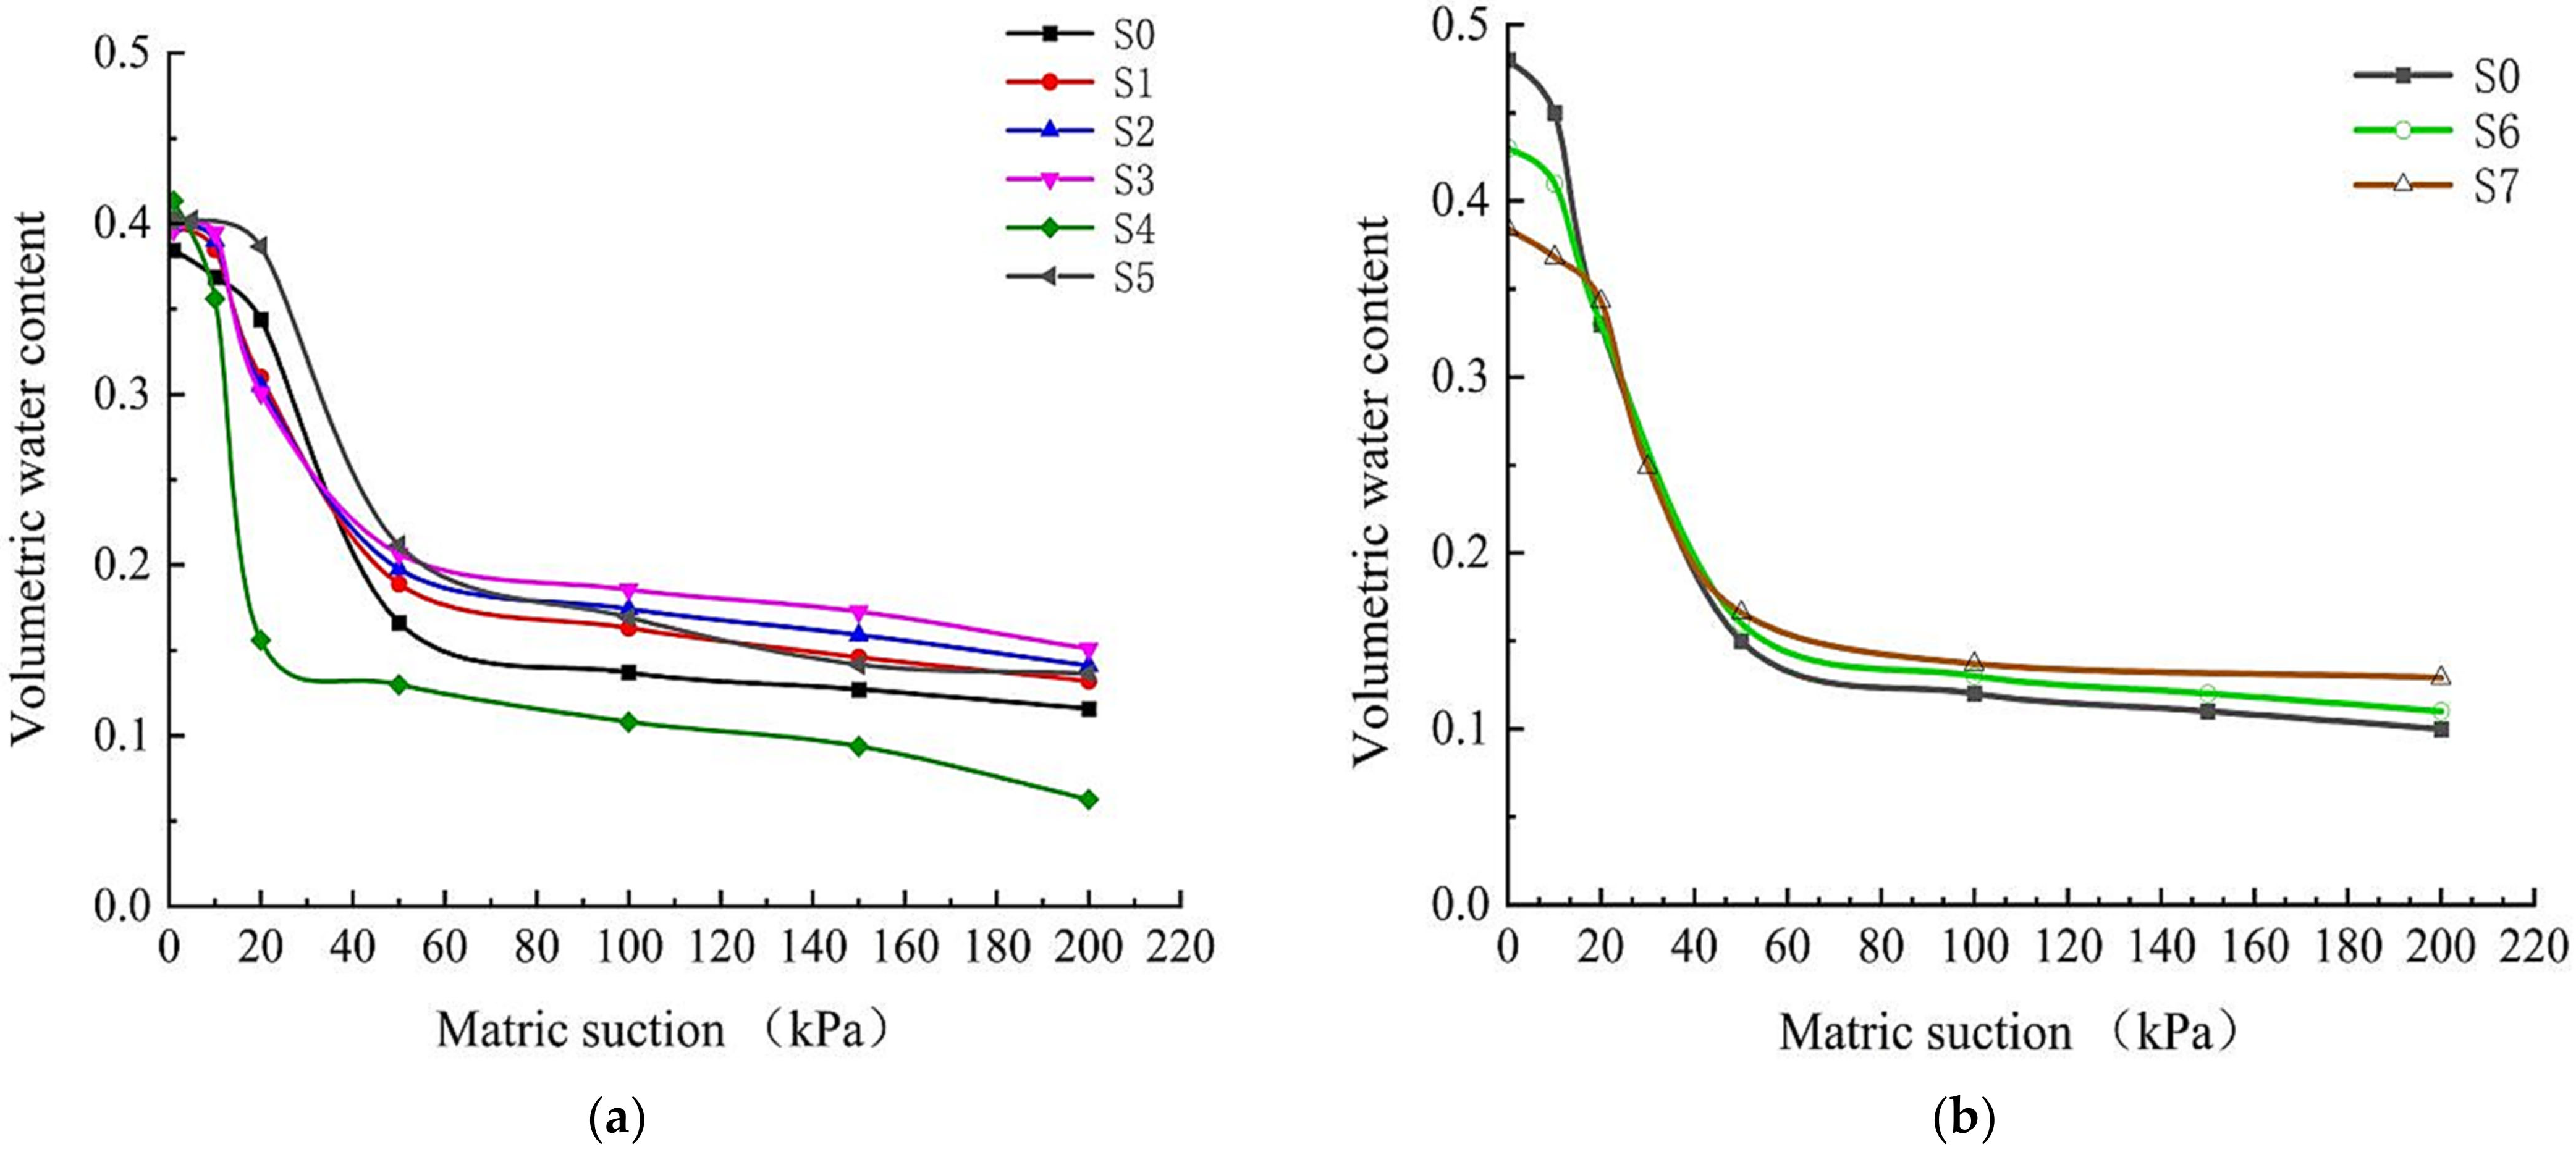
3.1. Test Results
3.2. Analysis
4. Discussion
4.1. Influence of Particle Size Composition on the Characteristic Values of the SWCC
4.2. Influence of Dry Density on the Characteristic Values of the SWCC
4.3. Simulation of SWCC
5. Conclusions
- (1)
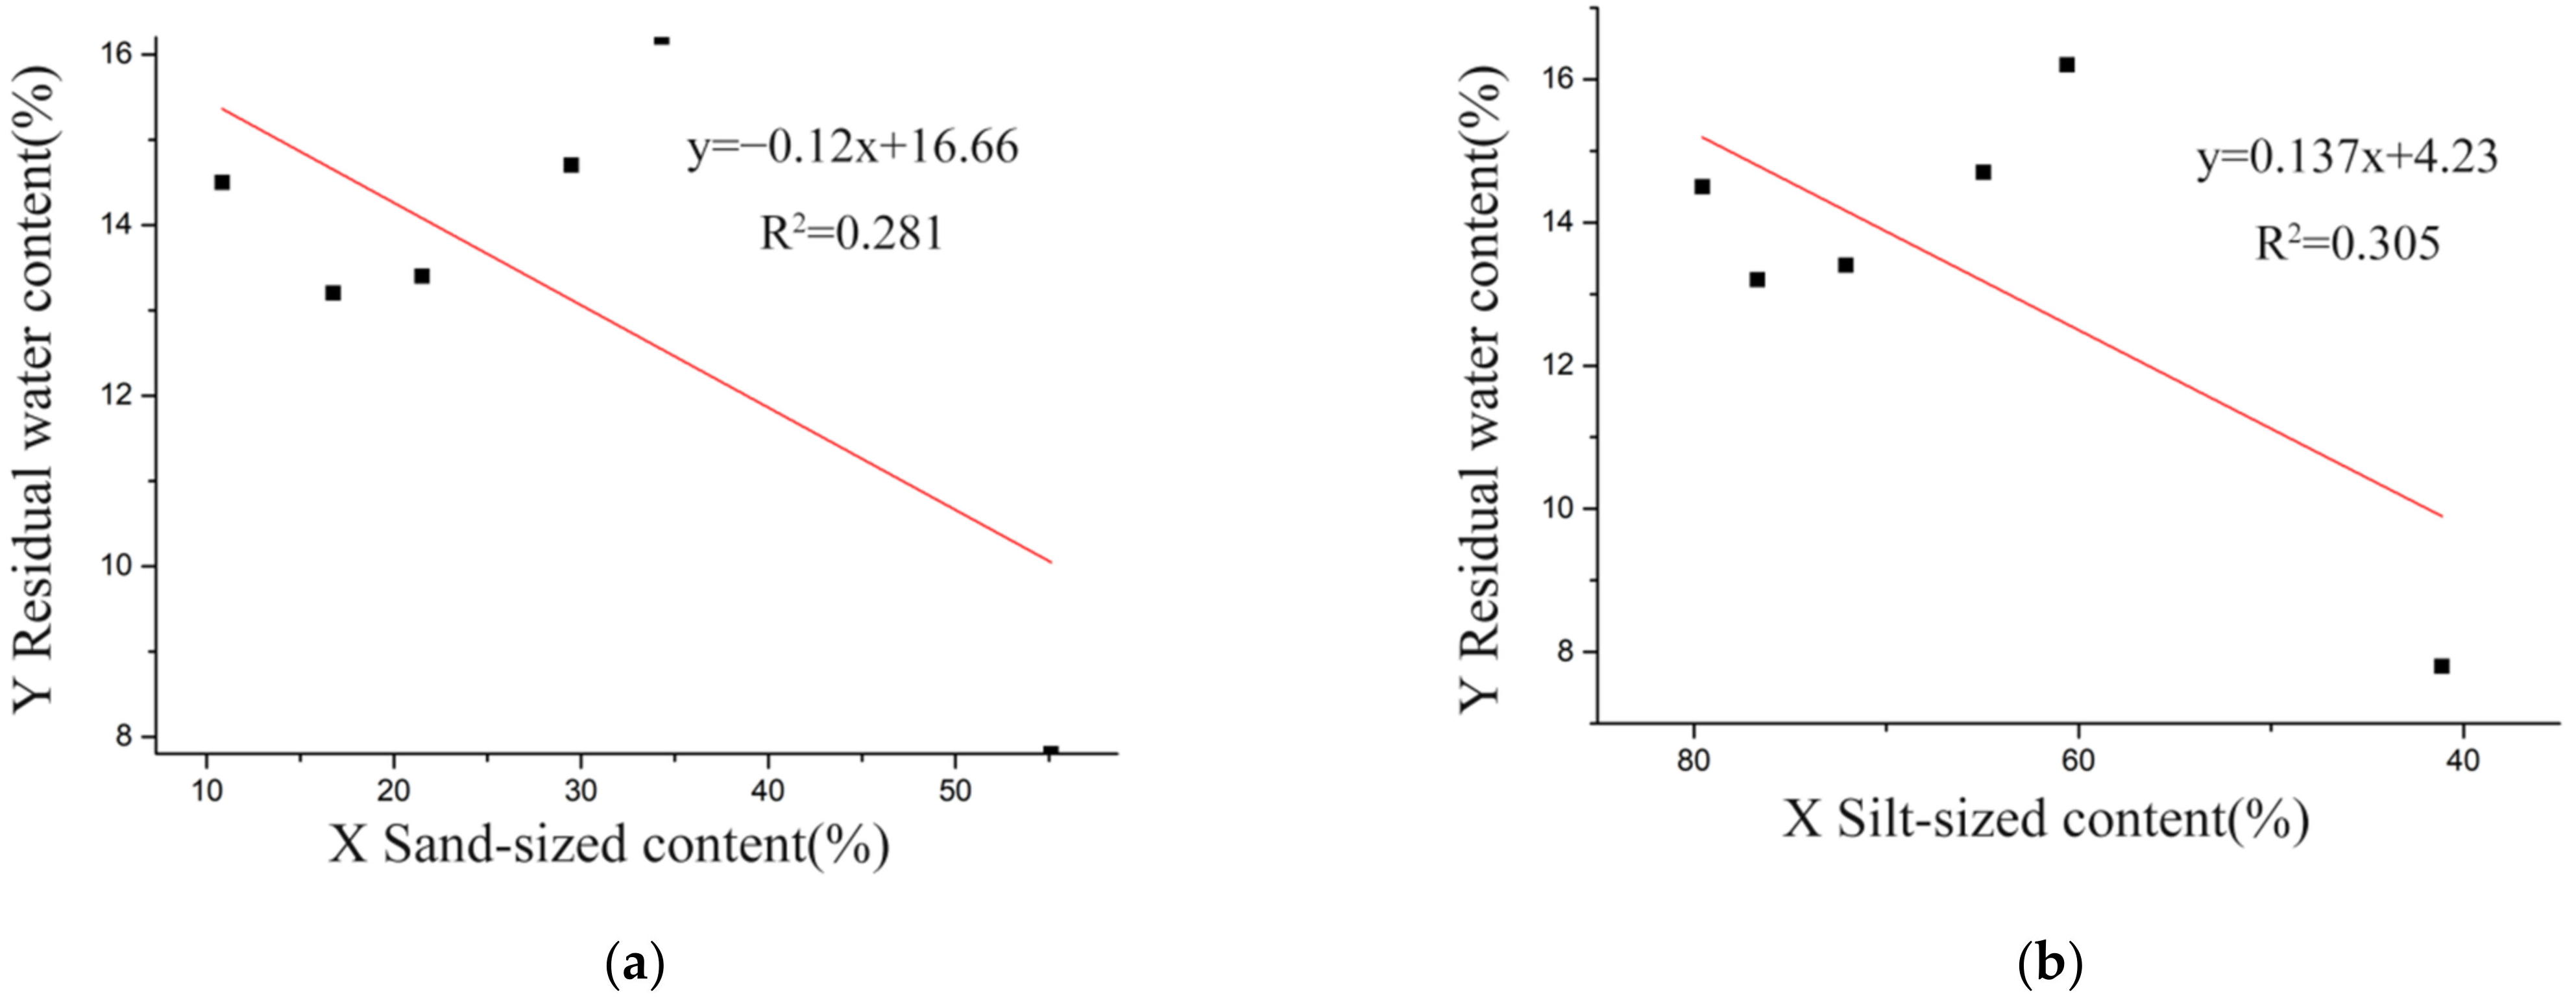
- The air-entry value is sensitive to particle size composition and dry density change. The effect of particle size composition on residual water content is weak. With the increase in matric suction, the influence of dry density on the soil–water characteristic curve gradually weakened. In particular, dry density no longer affects indigenous water characteristic curves when the matric suction increases to more than 100 Kpa.
- (2)
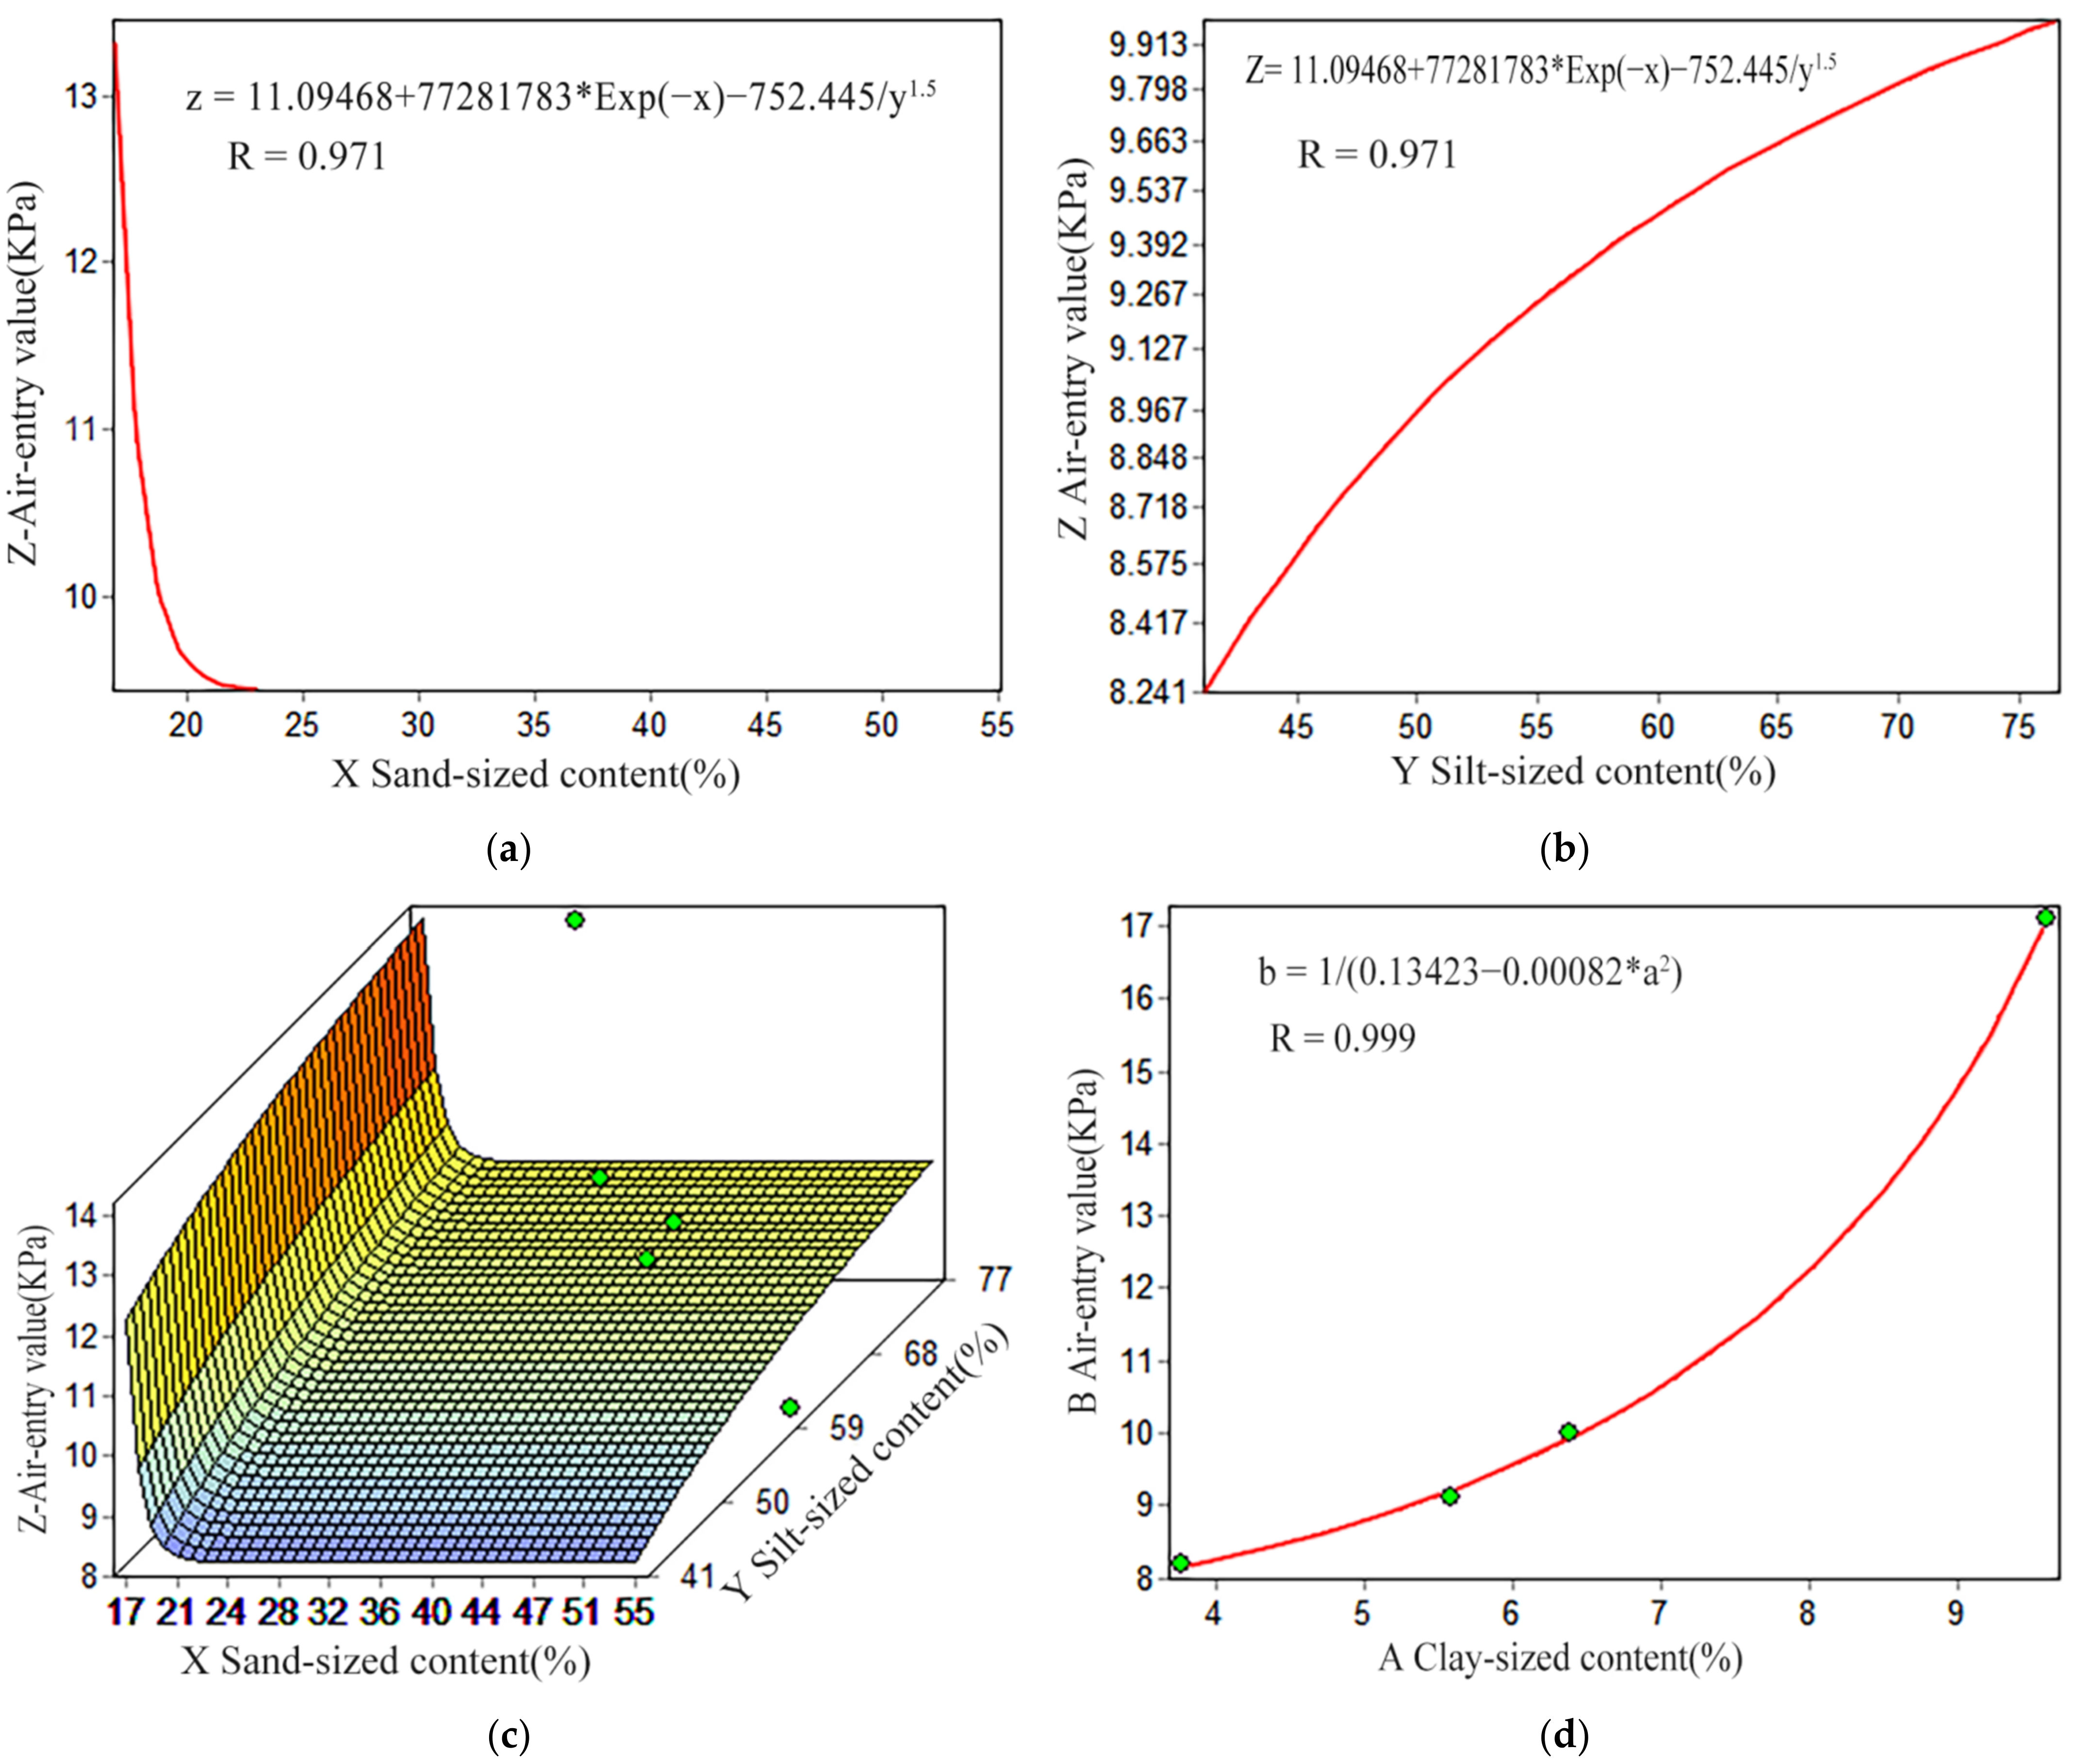
- When the dry density remains constant, the unsaturated air-entry value is positively correlated with clay-sized content and silt-sized content, while it is negatively correlated with sand-sized content. In the particles, when the air-entry valve is in the range of 9–10 kPa, the powder content greatly influences the intake valve. When the intake value is higher than 10 kPa, the content of sand significantly influences the intake value.
- (3)
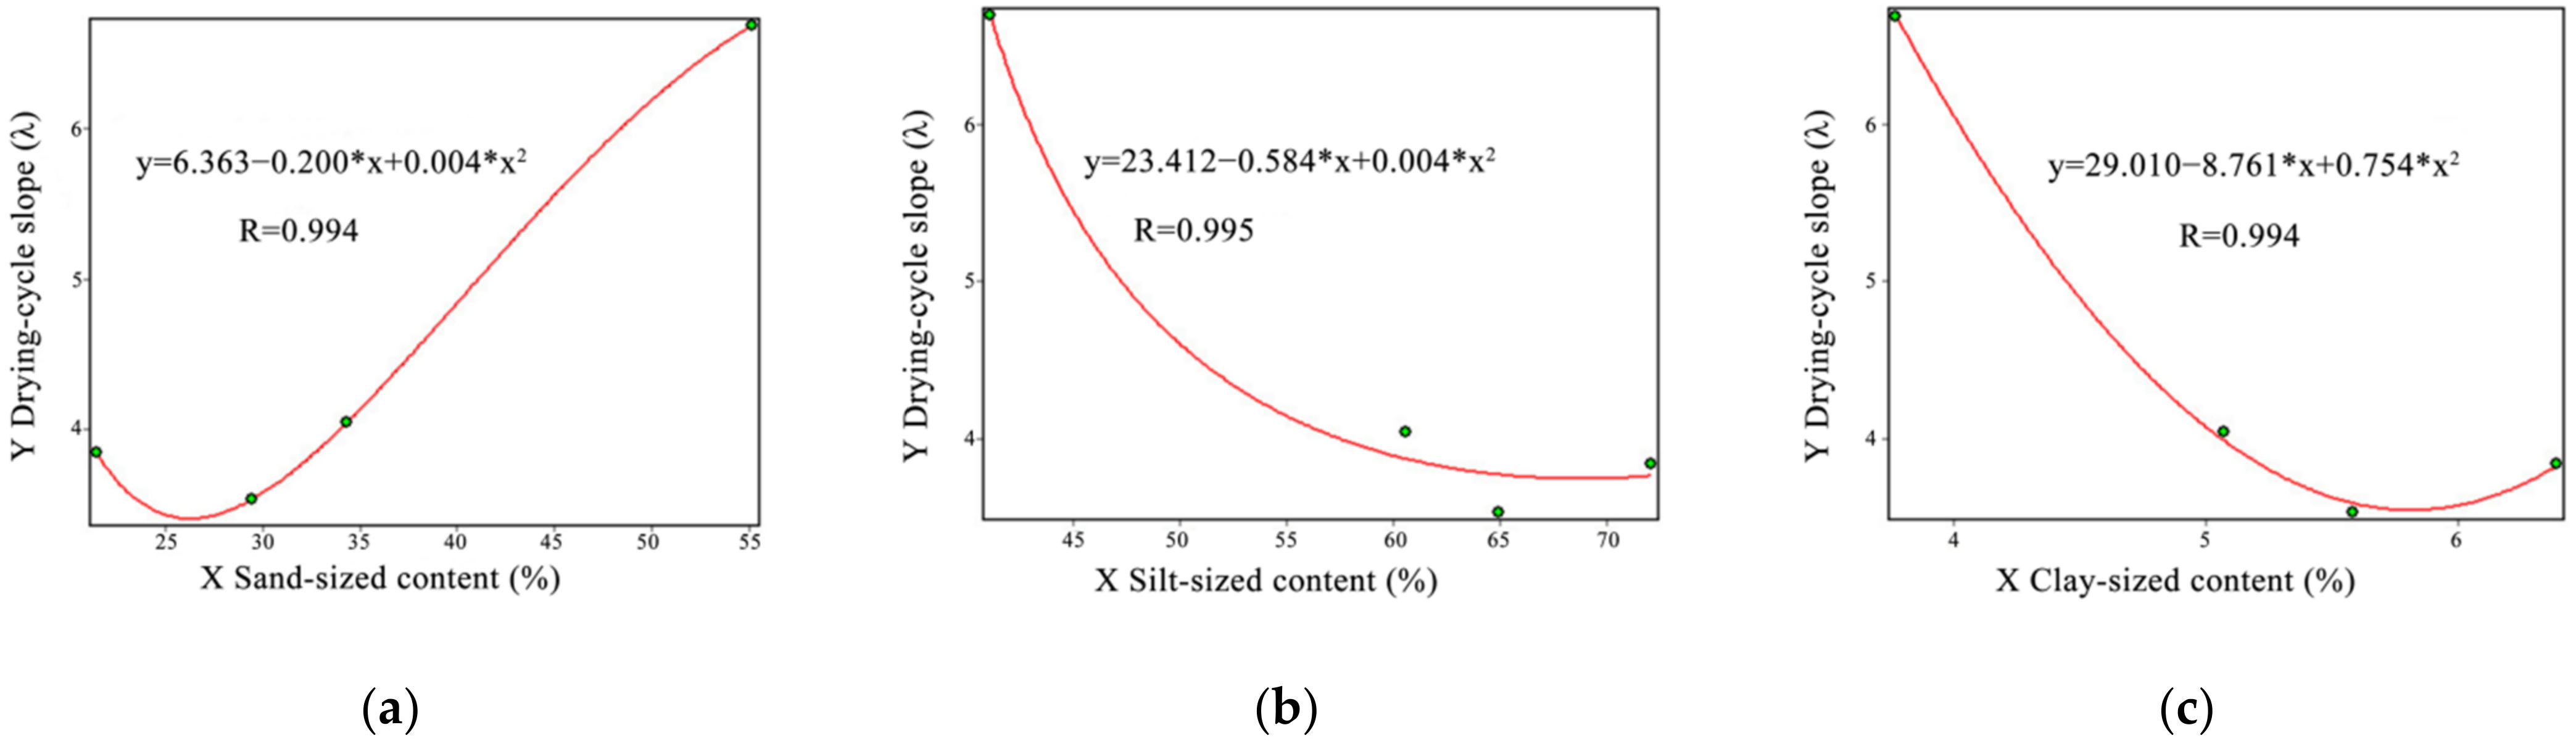
- When the dry density remains constant, the correlation between the content of sand-sized, silt-sized, clay-sized, and the drying period slope (λ) is non-linear and satisfies the following formula: Y = P1 + P2 *X + P3 *X^2. When the residual water content is near the optimum, λ reaches the limit value.
- (4)
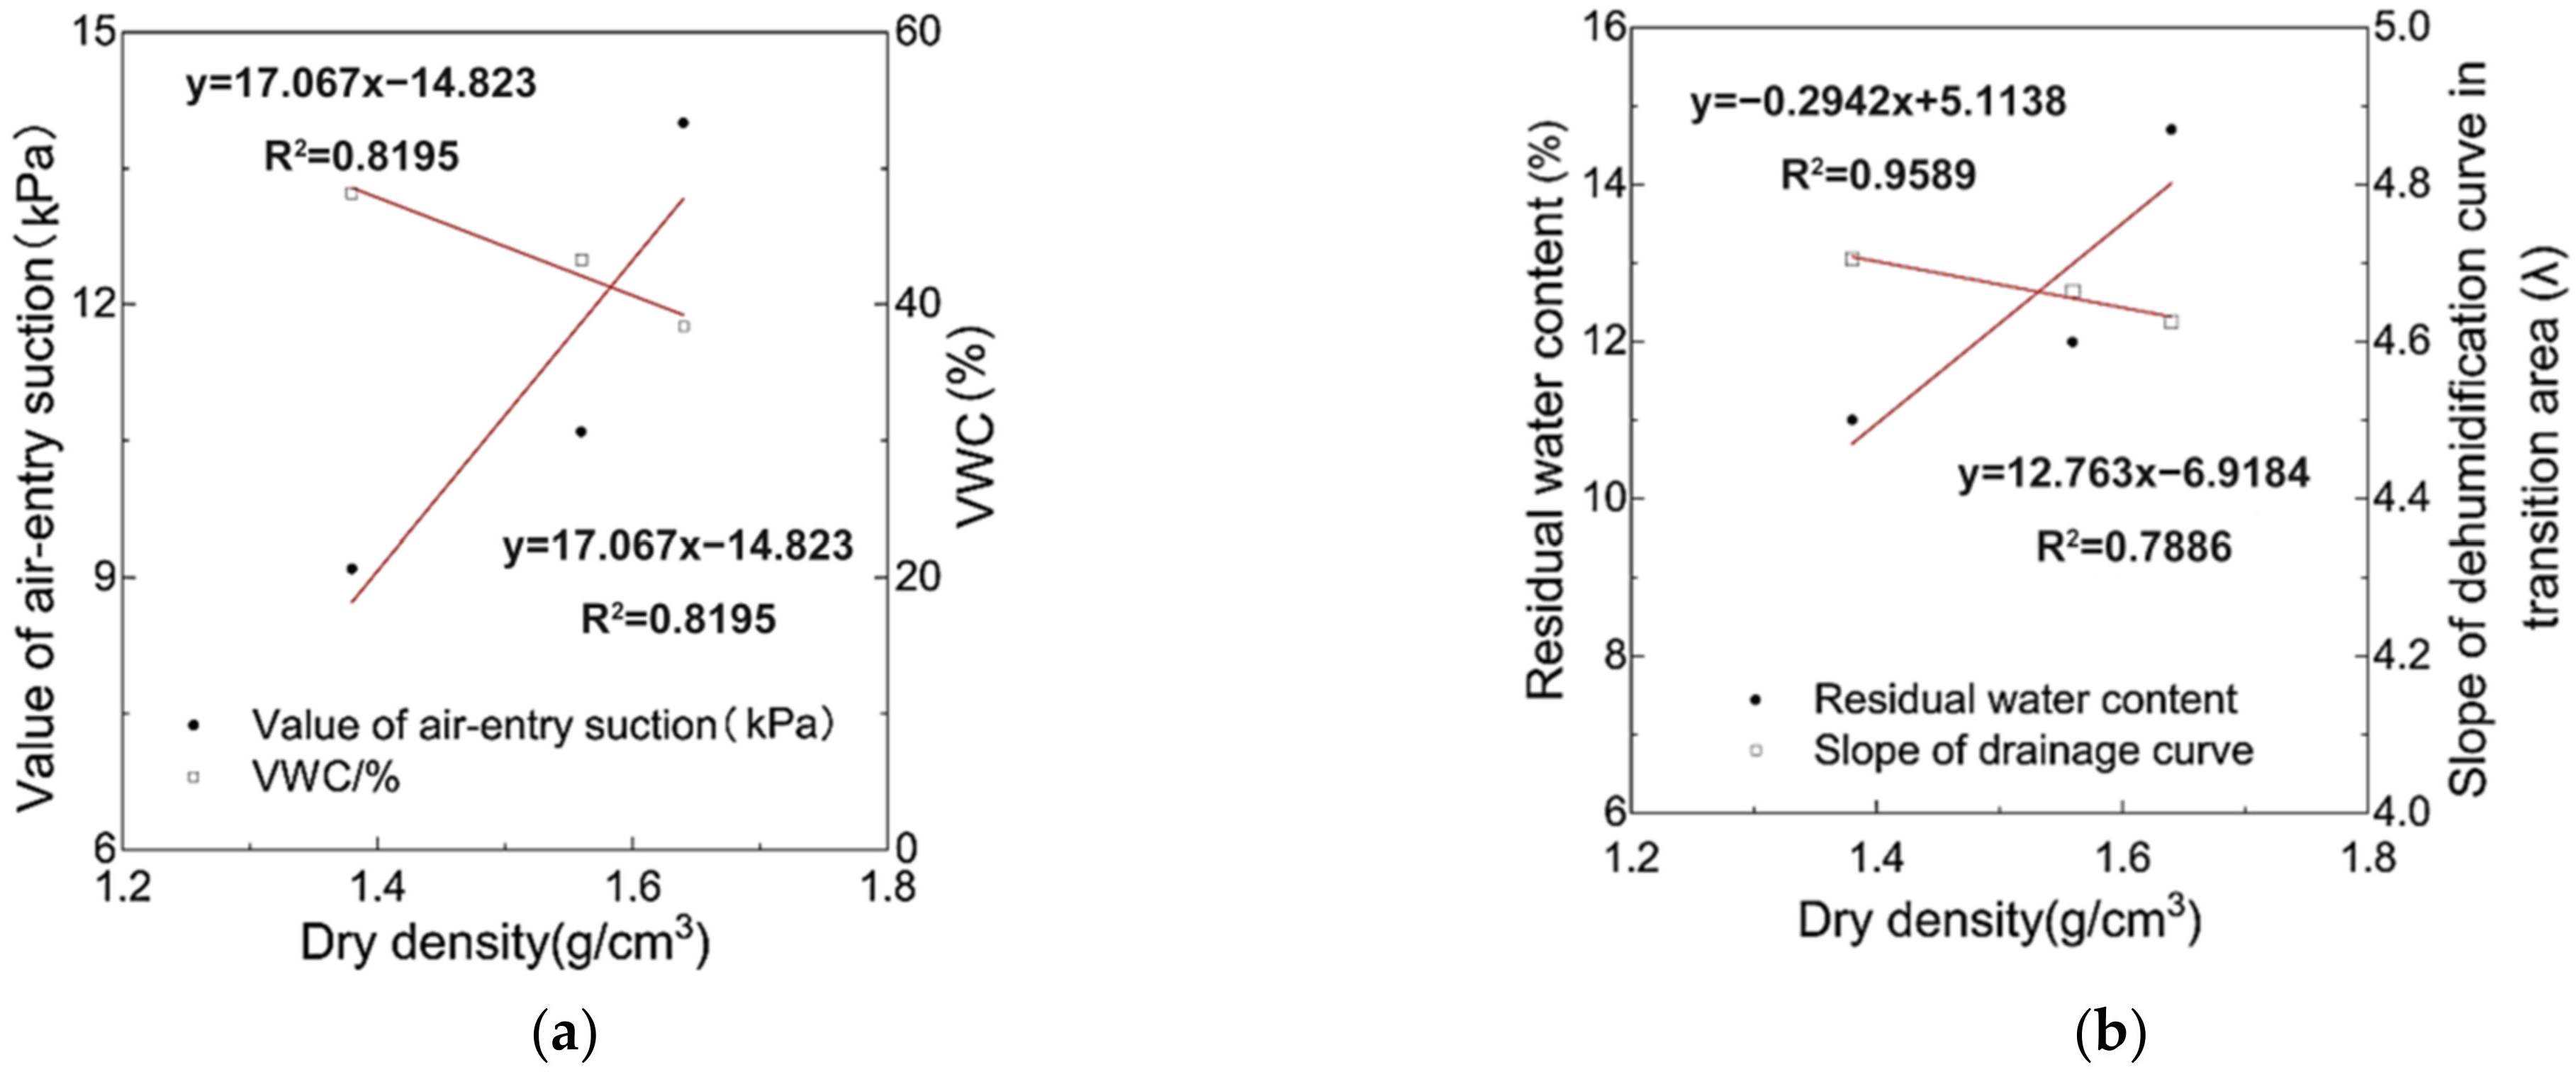
- The experimental data obtained using different dry density samples show that air-entry value and residual water content are positively correlated with dry density. On the contrary, saturated volume water content and drying cycle slope were negatively correlated with dry density.
- (5)
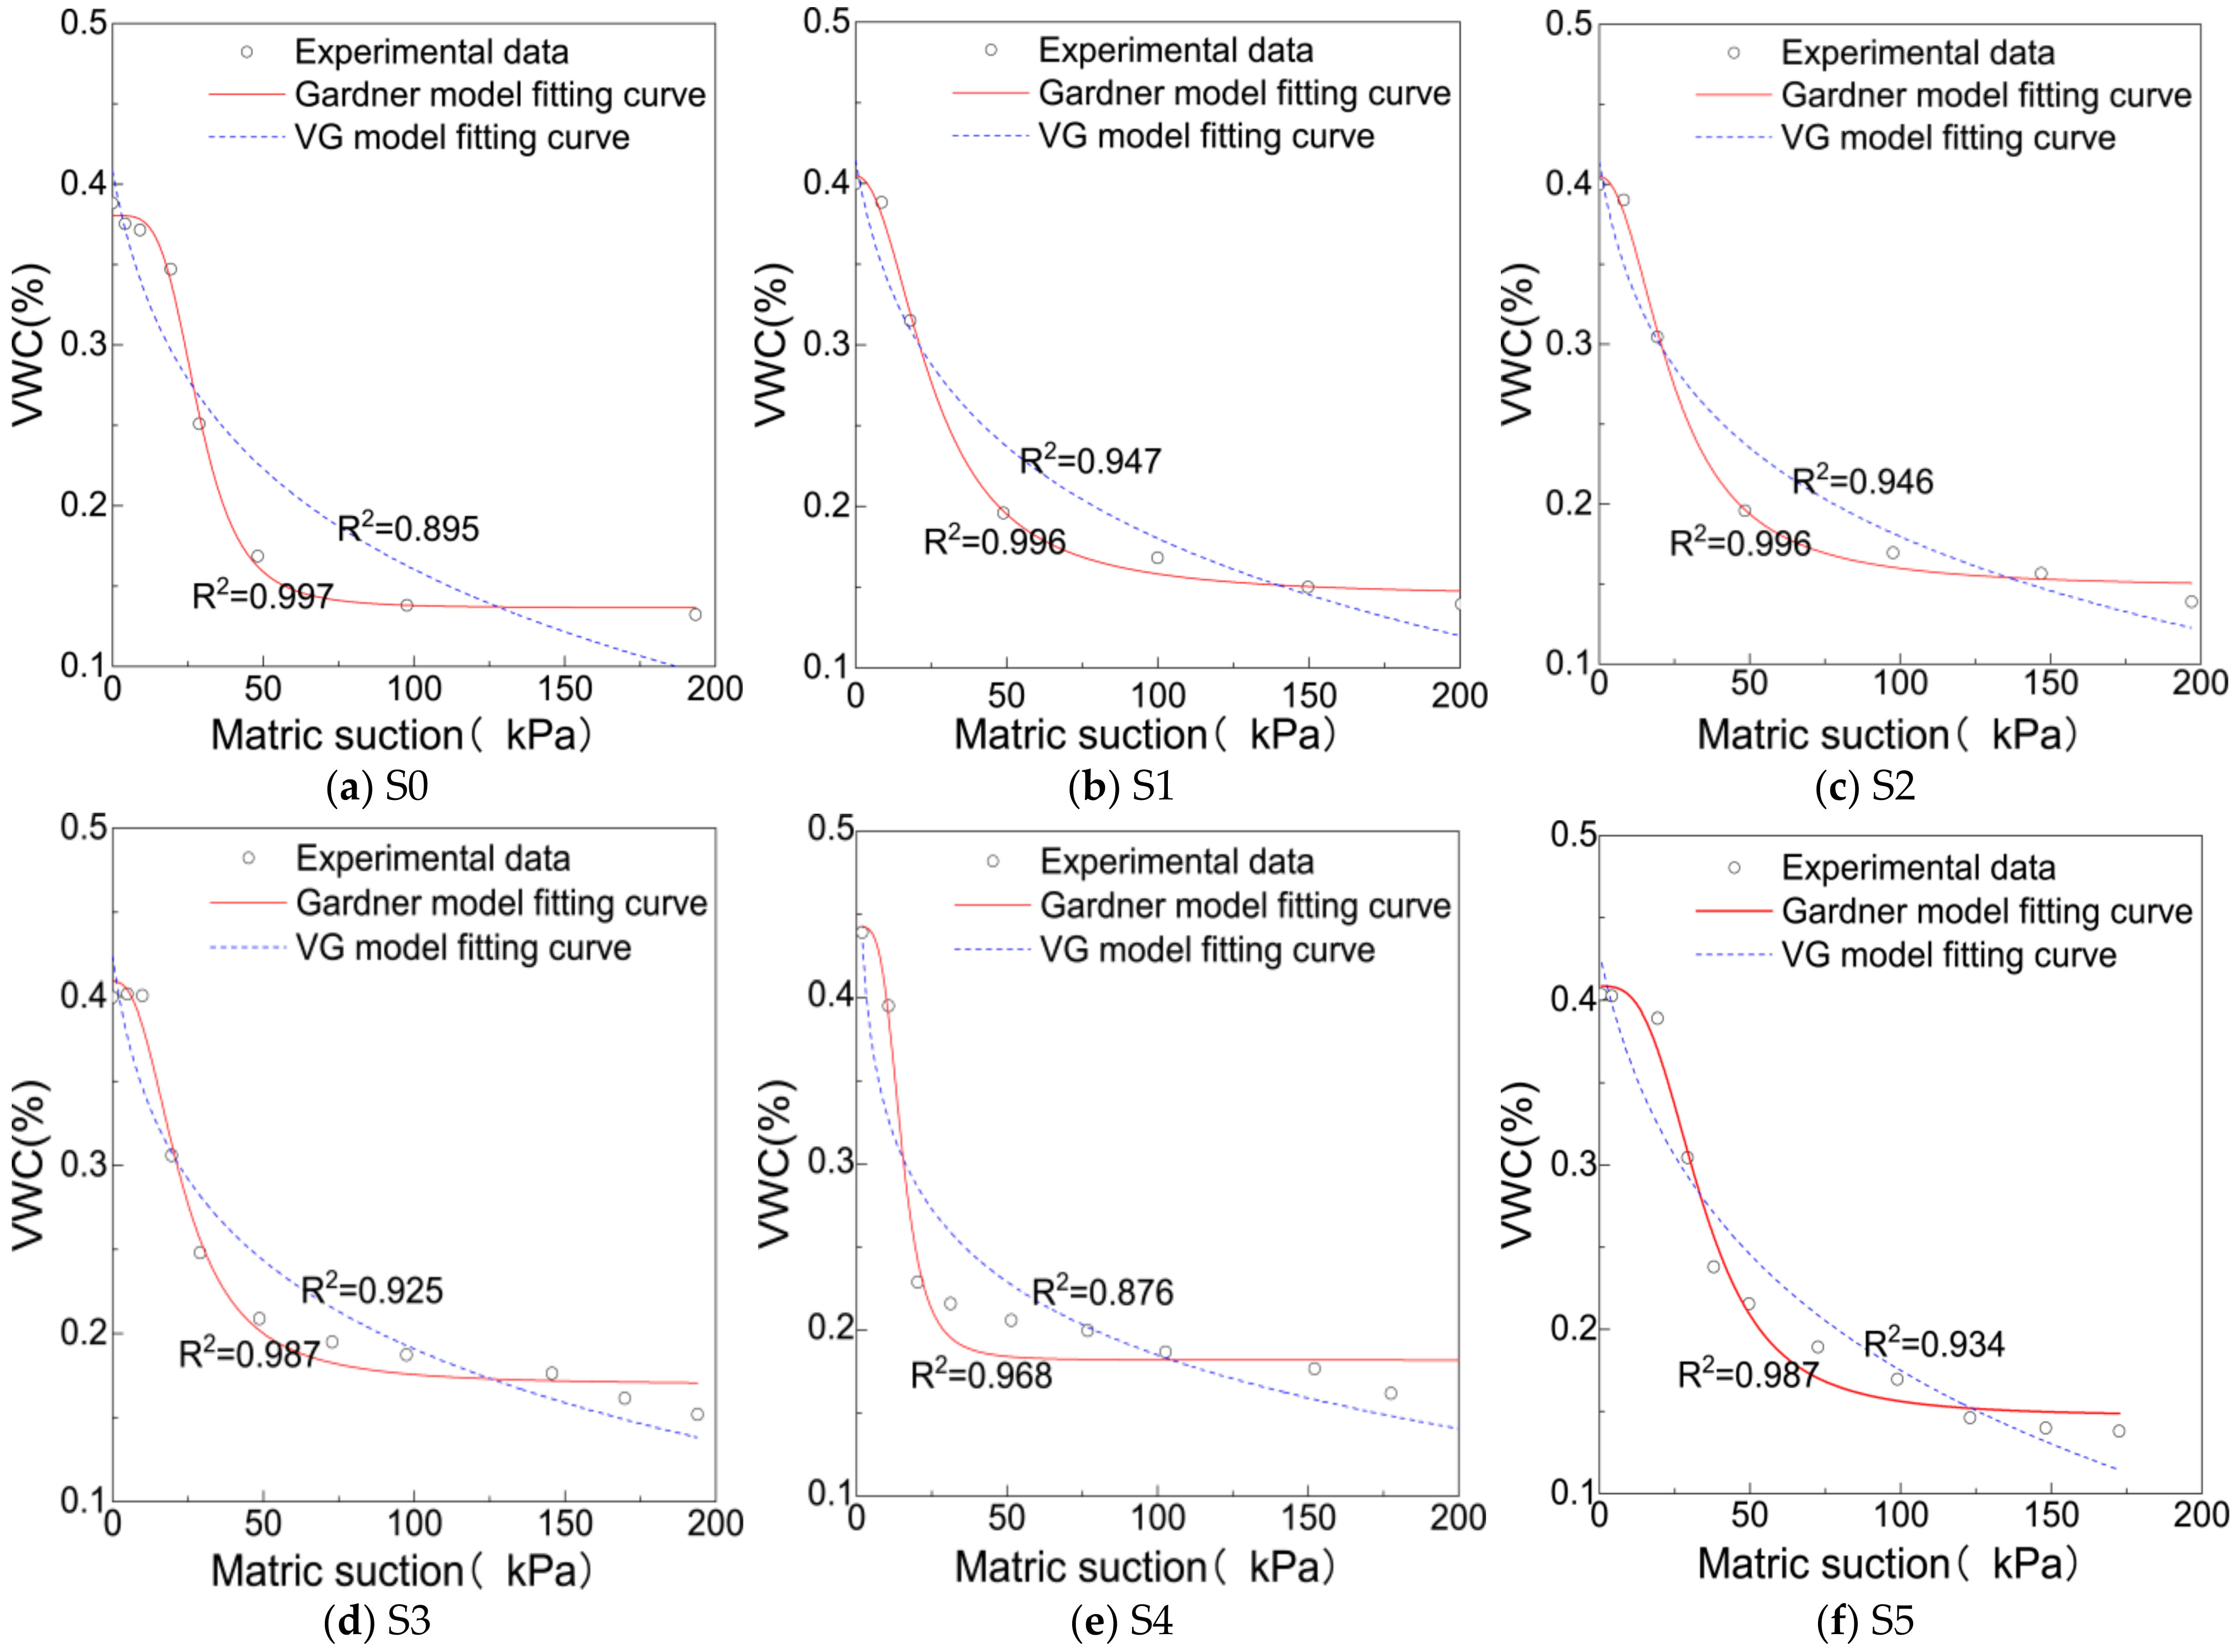
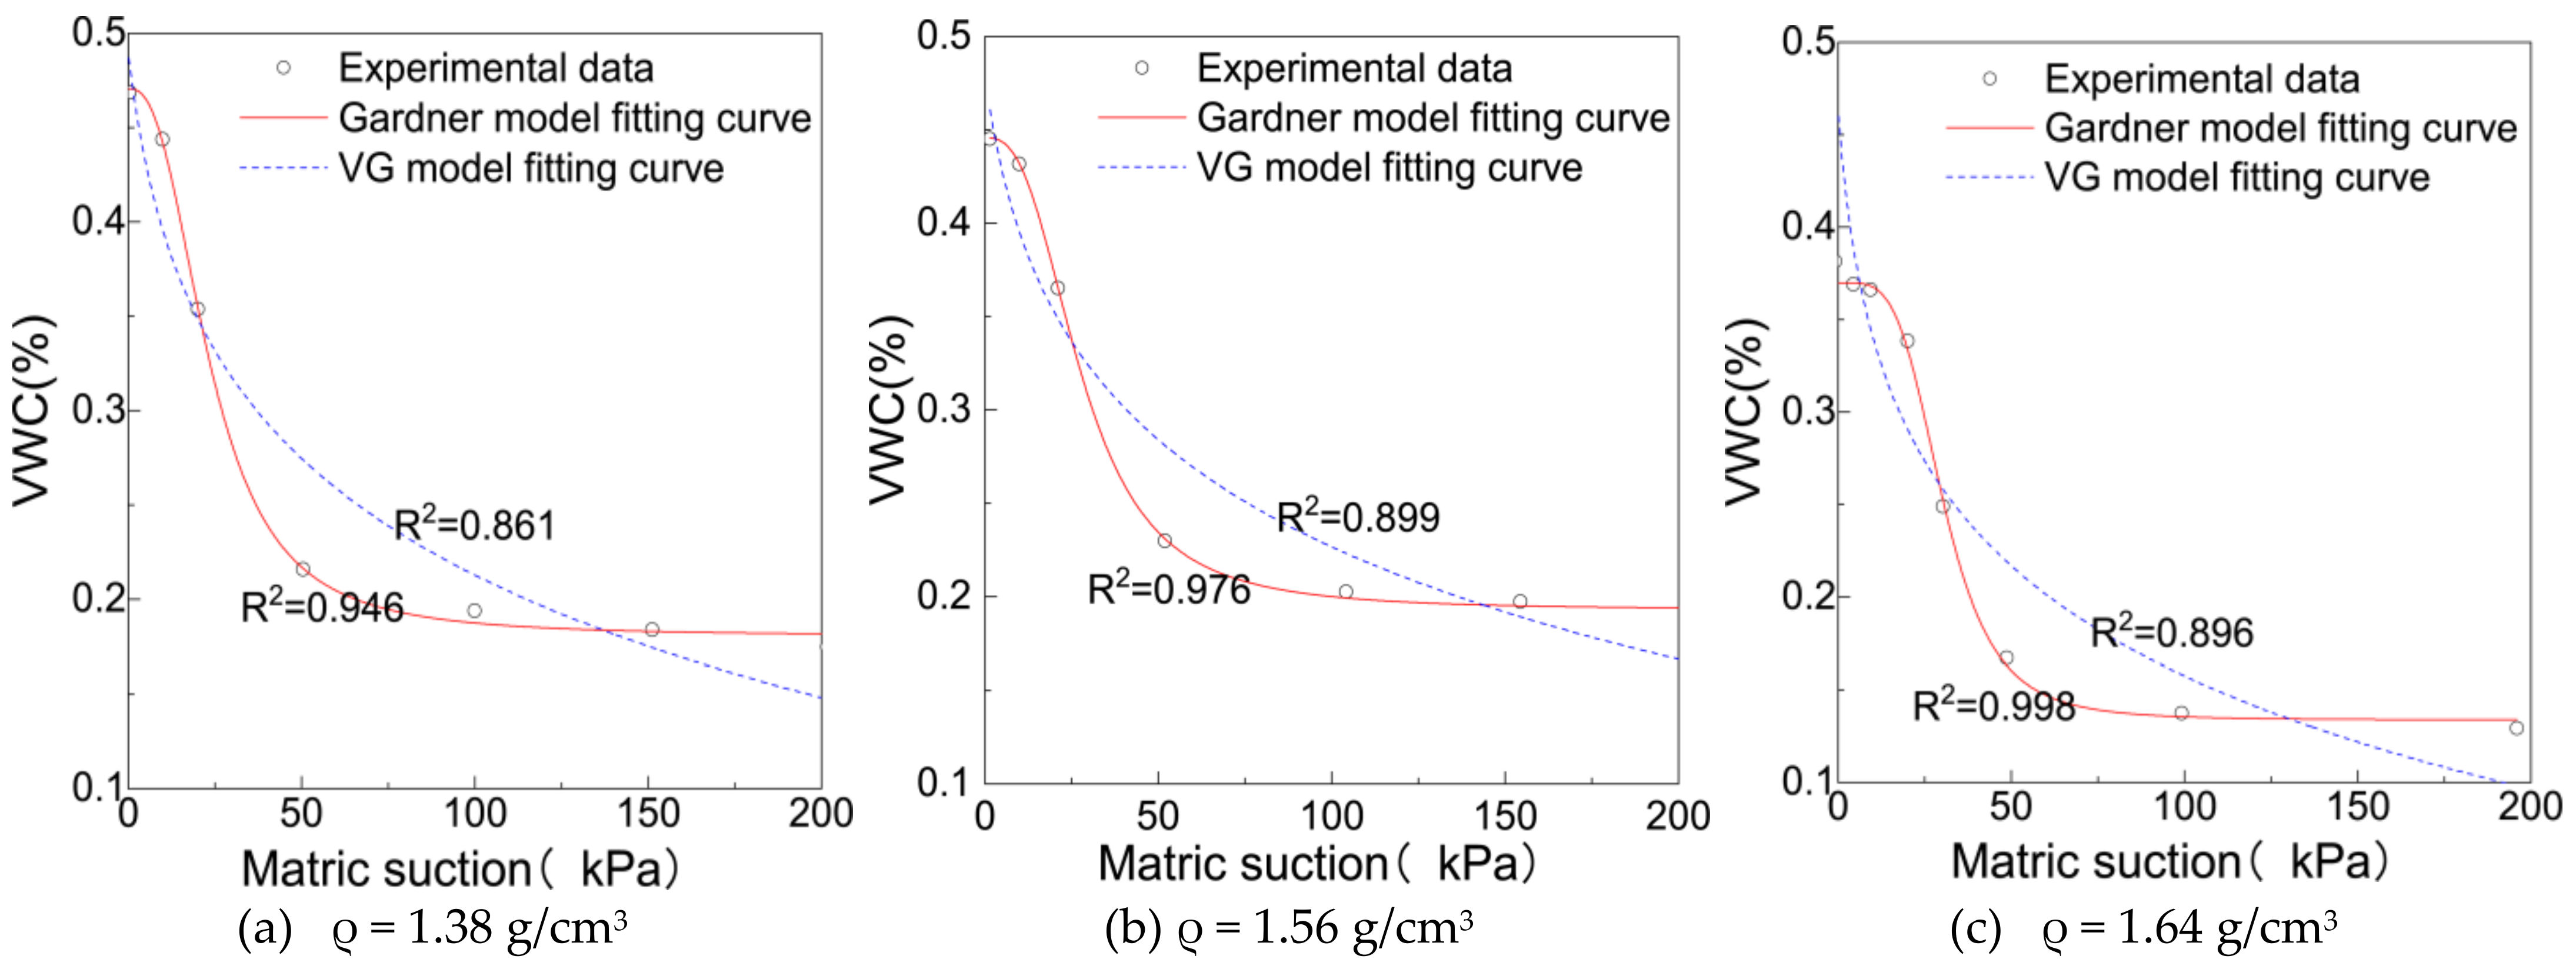
- The Gardner and Van Genuchten models are selected as they are both power functions containing three variables, fitted to the measured data, and the VG model was found to be more accurate in fitting the model to the reshaped loess water–soil characteristic curve.
Author Contributions
Funding
Data Availability Statement
Acknowledgments
Conflicts of Interest
References
- Liu, D. Loess and Environment; Science Press: Shanghai, China, 1985. [Google Scholar]
- Hu, Z.; Lu, Z.; Yao, H.L. The water retention characteristics of an unsaturated compacted loess material. Key Eng. Mater. 2016, 703, 396–399. [Google Scholar] [CrossRef]
- D5298-10; Standard Test Method for Measurement of Soil Potential (Suction) Using Filter Paper. ASTM International: West Conshohocken, PA, USA, 2013.
- Zhang, X.; Zhong, Y.; Pei, X.; Duan, Y. A Cross-Linked Polymer Soil Stafor Hillslope Conservation on the Loess Plateau. Front. Earth Sci. 2021, 955, 771316. [Google Scholar] [CrossRef]
- Chen, Y.; Uchimura, T. Influence of particle size on water retention of soils. Chin. J. Rock Mech. Eng. 2016, 35, 1474–1482. [Google Scholar]
- Li, M.; Zhang, X.; Yang, Z.; Yang, T.; Pei, X. The rainfall erosion mechanism of high and steep slopes in loesstablelands based on experimental methods and optimized control measures. Bull. Eng. Geol. Environ. 2020, 79, 4671–4681. [Google Scholar] [CrossRef]
- Fan, S.; Zhang, X.; Pei, X. Experimental study on soil-water characteristic curve of undisturbed loess in different regions and its application to slope stability evaluation. Water Resour. Hydropower Eng. 2019, 50, 154–161. [Google Scholar]
- Gallage, C.; Kodikara, J.; Uchimura, T. Laboratory measurement of hydraulic conductivity functions of Two unsaturated sandy soils during drying and wetting processes. Soils Found. 2013, 53, 417–430. [Google Scholar] [CrossRef] [Green Version]
- Pei, X.; Zhang, X.; Guo, B.; Wang, G.; Zhang, F. Experimental case study of seismically induced loess liquefaction and landslide. Eng. Geol. 2017, 223, 23–30. [Google Scholar] [CrossRef]
- Hu, R.; Chen, Y.; Zhou, C. A water retention curve model for deformable soils based on pore size distribution. Chin. J. Geotech. Eng. 2013, 35, 1451–1462. [Google Scholar]
- Kong, L.; Sayem, H.; Tian, H. Influence of drying-wetting cycles on soil-water characteristic curve of undisturbed granite residual soils and microstructure mechanism by nuclear magnetic resonance (NMR) spin-spin relaxation time (T2) relaxometry. Can. Geotech. J. 2018, 55, 208–216. [Google Scholar] [CrossRef] [Green Version]
- Zhang, S.; Zhang, X.; Pei, X.; Wang, S.; Huang, R.; Xu, Q.; Wang, Z. Model test study on the hydrological mechanisms and early warning thresholds for loess fill slope failure induced by rainfall. Eng. Geol. 2019, 258, 105135. [Google Scholar] [CrossRef]
- Li, P.; Li, T.L.; Wang, H.; Liang, Y. Predicting the soil-water characteristic curve and permeability coefficient of unsaturated loess using the Childs & Collis-Geroge model. Rock Soil Mech. 2013, 34, 184–189. [Google Scholar]
- Zhang, X.; Pei, X.; Zhang, Z.; Song, L. Study on pore pressure and fluidization evaluation method of unsaturated loess in vibration process. Bull. Eng. Geol. Environ. 2021, 80, 5575–5587. [Google Scholar] [CrossRef]
- Li, X.; Li, J.H.; Zhang, L.M. Predicting bimodal soil-water characteristic curves and permeability functions using physically-based parameters. Comput. Geotech. 2014, 57, 85–96. [Google Scholar] [CrossRef]
- Li, Z.; Feng, H.; Wu, P.T.; Zhao, X.N.; Guo, Z. Simulated experiment on effects of soil clay particle content on soil water holding capacity. J. Soil Water Conserv. 2009, 23, 204–208. [Google Scholar]
- Malaya, C.; Sreedeep, S. Critical review on the parameters influencing soil-water characteristic curve. J. Irrig. Drain. 2012, 138, 55–62. [Google Scholar] [CrossRef]
- Nam, S.; Gutierrez, M.; Diplas, P.; Petrie, J.; Wayllace, A.; Lu, N.; Muñoz, J.J. Comparison of testing techniques and models for establishing the SWCC of riverbank soils. Eng. Geol. 2009, 110, 1–10. [Google Scholar] [CrossRef]
- Zhang, X.; Zhao, C.; Cai, G. Influence of soil density on soil-water characteristic curve. Rock Soil Mech. 2010, 31, 1463–1468. [Google Scholar]
- Wang, X.; Zou, W.; Luo, Y. Influence of degree of compaction and gradation on soil-water characteristic curve of remolded clay in subgrade. Geomechanics 2011, 32, 181–184. [Google Scholar]
- Vereecken, H.; Maes, J.; Feyen, J.; Darius, P. Estimating the soil moisture retention characteristic from texture, bulk density, and carbon content. Soil Sci. 1989, 148, 389–403. [Google Scholar] [CrossRef]
- Wen, B.; Hu, Y. Effect of particle size distribution on the matric suction of unsaturated clayey soils. Hydrogeol. Eng. Geol. 2008, 35, 50–55. [Google Scholar]
- Tian, H.; Kong, L. Experimental study on the effect of fine particles on the water retention capacity of sandy soil. Rock Soil Mech. 2010, 31, 56–60. [Google Scholar]
- Zhao, Y.; Wang, Z.; Wang, W.; Chen, L.; Zhang, Z. Determination and simulation modelling of the soil-water characteristic curve at different particle sizes. China Sci. Pap. 2015, 10, 287–290. [Google Scholar]
- Fan, J. The Study on Soil Water Characteristic Curve and Permeability Curve of Unsaturated Remolded Loess under Different Dry Density. 2020. Available online: https://kns.cnki.net/kcms/detail/detail.aspx?dbcode=CMFD&dbname=CMFD202101&filename=1021567776.nh&uniplatform=NZKPT&v=I83fcRXH9NmI3pWEhrLGgw_bCyirgtZfanAlmLbAK9wpR67m5hmblR5Csywe7hbJ (accessed on 2 May 2022).
- Qi, G.; Huang, R. Study on general mathematical model of soil-water characteristic curve. J. Eng. Geol. 2004, 12, 182–186. [Google Scholar]
- JTG 3430-2020; Test Methods of Soils for Highway Engineering. Ministry of Transport: Beijing, China, 2020.
- Xiong, C.; Liu, B.; Zhang, J. Relation of matric suction with moisture state density state of remolded cohesive soil. Chin. J. Rock Mech. Eng. 2005, 24, 321–327. [Google Scholar]
- Yan, Y.; Wen, B. Relationship between Matric Suction Characteristics and Physical Properties of Unsaturated Remolded Loess. Hydrogeol. Eng. Geol. 2011, 38, 49–56. [Google Scholar]
- Fredlund, D.G.; Xing, A. Equations for the soil-water characteristic curve. Can. Geotech. J. 1994, 31, 521–532. [Google Scholar] [CrossRef]
- Niu, G.; Sun, D.A.; Shao, L.; Zeng, L. Water retention curve of complete-intense weathering mudstone and its estimation from pore-size distribution. Rock Soil Mech. 2018, 39, 1337–1345. [Google Scholar]


| Soil Description | Specific Gravity | Sand-Sized Particles | Silt-Size Particles | Clay-Sized Particles | Liquid Limit (wl) | Plastic Limit (wp) | Plastic Index (Ip) | Void Ratio | Saturated Permeability Coefficient (Ks) or (m/s) |
|---|---|---|---|---|---|---|---|---|---|
| 0.075–2 mm | 0.005–0.075 mm | <0.005 mm | |||||||
| Yan’an loess | 2.70 | 16.77% | 76.68% | 6.55% | 30.6 | 21.4 | 9.2 | 0.56 | 1.26 × 10⁻⁶ |
| Id of the Samples | Dry Density (g/cm3) | Clay-Sized Content (%) | Silt-Sized Content (%) | Sand-Sized Content (%) | Cc | Cu | D10 |
|---|---|---|---|---|---|---|---|
| S0 | 1.64 | 6.55 | 76.68 | 16.77 | 1.82 | 5.80 | 8.51 |
| S1 | 1.64 | 6.39 | 72.1 | 21.51 | 1.75 | 5.86 | 8.86 |
| S2 | 1.64 | 5.58 | 64.95 | 29.47 | 1.57 | 5.62 | 10.63 |
| S3 | 1.64 | 5.07 | 60.61 | 34.32 | 1.44 | 5.45 | 12.11 |
| S4 | 1.64 | 3.77 | 41.12 | 55.11 | 1.19 | 6.43 | 17.02 |
| S5 | 1.64 | 9.6 | 79.56 | 10.84 | 2.35 | 9.44 | 5.29 |
| S6 | 1.56 | 6.55 | 76.68 | 16.77 | 1.82 | 5.80 | 8.51 |
| S7 | 1.38 | 6.55 | 76.68 | 16.77 | 1.82 | 5.80 | 8.51 |
| Parameters | S0 | S1 | S2 | S3 | S4 | S5 | S6 | S7 |
|---|---|---|---|---|---|---|---|---|
| Saturated volumetric water content (%) | 38.4 | 39.8 | 39.9 | 39.6 | 41.3 | 40.2 | 43.3 | 48.2 |
| Air-entry value (kPa) | 14.0 | 10 | 9.1 | 10 | 8.2 | 17.1 | 10.6 | 9.1 |
| Drying-cycle slope (λ) | 4.63 | 3.84 | 3.53 | 4.04 | 6.69 | 5.05 | 4.66 | 4.71 |
| Residual water content (%) | 13.2 | 13.4 | 14.7 | 16.2 | 7.8 | 14.5 | 12 | 11 |
| Residual matric suction (kPa) | 54 | 79 | 78 | 55 | 24 | 61 | 56 | 60 |
| Magnitude of water content variation (%) | 25.2 | 26.4 | 25.2 | 23.4 | 33.5 | 25.7 | 31.3 | 37.2 |
| Variable Category | Presented by | Expression Equation | Note Description |
|---|---|---|---|
| Dual variables | Farrel and Larson (1972) | is the fitting variable | |
| Williams J. (1983) | p, q are unknown fitting variables | ||
| Chen Z. (1993) | b and c are the fitted variables related to the dry density or porosity of the soil | ||
| Three variables | Gardner (1958) | a is the variable related to the inlet value, n is the variable related to the slope of the curve when | |
| Brooks and Corey (1964) | is the aperture parameter | ||
| Van Genuchten and Burdine (1980) | |||
| Van Genuchten and M ualem (1980) | is the soil variable that controls the SWCC | ||
| Fredlund and Xing (1994) | m is the variable related to the residual moisture content | ||
| Four variables | Fredlund and Xing (1994) | ||
| Van Genuchten (1980) |
| Id of Samples | Simulation Model | a | n | θs | θr | Sum of Squares of Residues (SSR) |
|---|---|---|---|---|---|---|
| S0 | Van Genuchten | 0.036 | 4.408 | 0.376 | 0.132 | 1.876 × 10⁻⁴ |
| Gardner | 0.033 | 4.010 | 0.377 | 0.133 | 2.289 × 10⁻⁴ | |
| S1 | Van Genuchten | 0.049 | 2.661 | 0.402 | 0.134 | 2.185 × 10⁻⁴ |
| Gardner | 0.037 | 2.295 | 0.402 | 0.140 | 3.178 × 10⁻⁴ | |
| S2 | Van Genuchten | 0.051 | 2.664 | 0.405 | 0.147 | 3.957 × 10⁻⁴ |
| Gardner | 0.039 | 2.287 | 0.406 | 0.152 | 5.461 × 10⁻⁴ | |
| S3 | Van Genuchten | 0.054 | 2.764 | 0.403 | 0.162 | 9.254 × 10⁻⁴ |
| Gardner | 0.043 | 2.415 | 0.404 | 0.167 | 1.195 × 10⁻³ | |
| S4 | Van Genuchten | 0.079 | 3.847 | 0.417 | 0.097 | 3.542 × 10⁻³ |
| Gardner | 0.070 | 3.608 | 0.417 | 0.099 | 3.804 × 10⁻³ | |
| S5 | Van Genuchten | 0.033 | 3.598 | 0.406 | 0.145 | 1.054 × 10⁻³ |
| Gardner | 0.029 | 3.269 | 0.407 | 0.148 | 1.283 × 10⁻³ | |
| S6 | VG | 0.046 | 3.180 | 0.429 | 0.113 | 8.271 × 10⁻³ |
| Gardner | 0.038 | 2.7408 | 0.430 | 0.116 | 9.544 × 10⁻³ | |
| S7 | VG | 0.052 | 3.100 | 0.480 | 0.103 | 6.874 × 10⁻³ |
| Gardner | 0.043 | 2.668 | 0.482 | 0.106 | 1.160 × 10⁻⁴ |
Publisher’s Note: MDPI stays neutral with regard to jurisdictional claims in published maps and institutional affiliations. |
© 2022 by the authors. Licensee MDPI, Basel, Switzerland. This article is an open access article distributed under the terms and conditions of the Creative Commons Attribution (CC BY) license (https://creativecommons.org/licenses/by/4.0/).
Share and Cite
Wang, X.-Q.; Zhang, X.-C.; Pei, X.-J.; Ren, G.-F. Effect of the Particle Size Composition and Dry Density on the Water Retention Characteristics of Remolded Loess. Minerals 2022, 12, 698. https://doi.org/10.3390/min12060698
Wang X-Q, Zhang X-C, Pei X-J, Ren G-F. Effect of the Particle Size Composition and Dry Density on the Water Retention Characteristics of Remolded Loess. Minerals. 2022; 12(6):698. https://doi.org/10.3390/min12060698
Chicago/Turabian StyleWang, Xin-Qing, Xiao-Chao Zhang, Xiang-Jun Pei, and Guo-Feng Ren. 2022. "Effect of the Particle Size Composition and Dry Density on the Water Retention Characteristics of Remolded Loess" Minerals 12, no. 6: 698. https://doi.org/10.3390/min12060698