
Construction of Conceptual Prospecting Model Based on Geological Big Data: A Case Study in Songtao-Huayuan Area, Hunan Province

Abstract
:1. Introduction
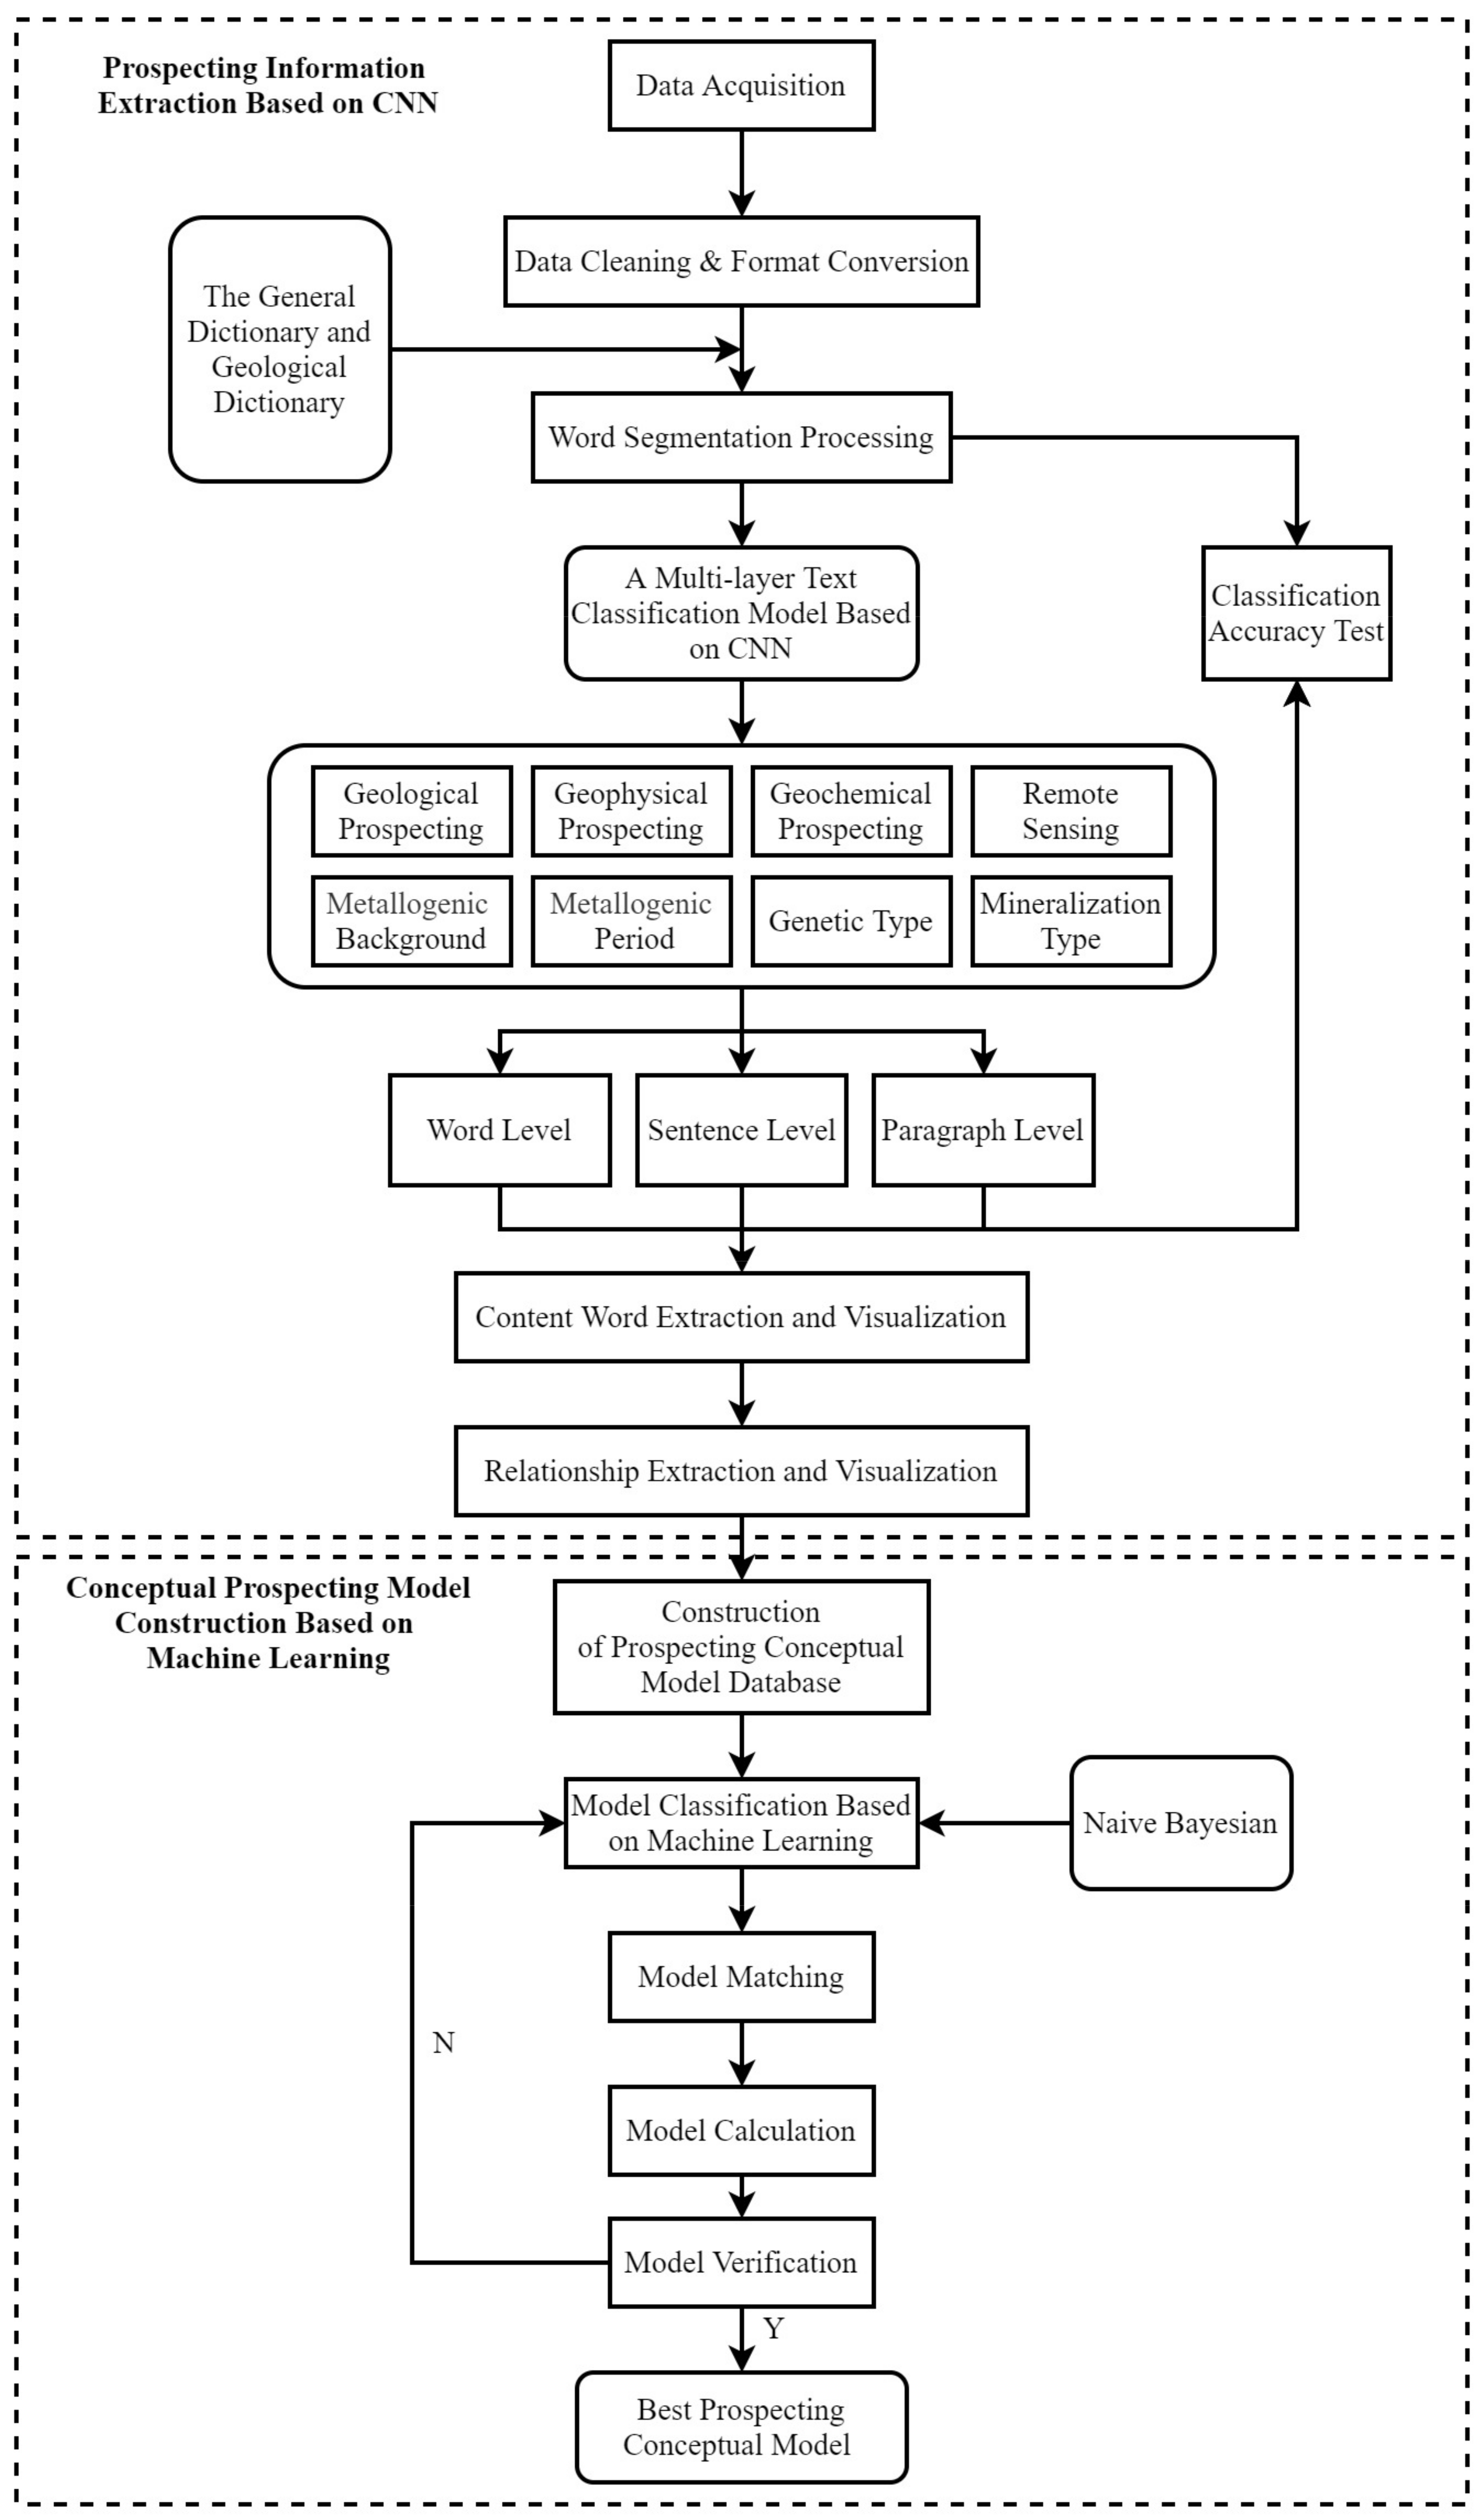
2. Workflow
3. Methods
3.1. Prospecting Information Extraction Based on CNN
3.1.1. Data Acquisition and Pre-Processing
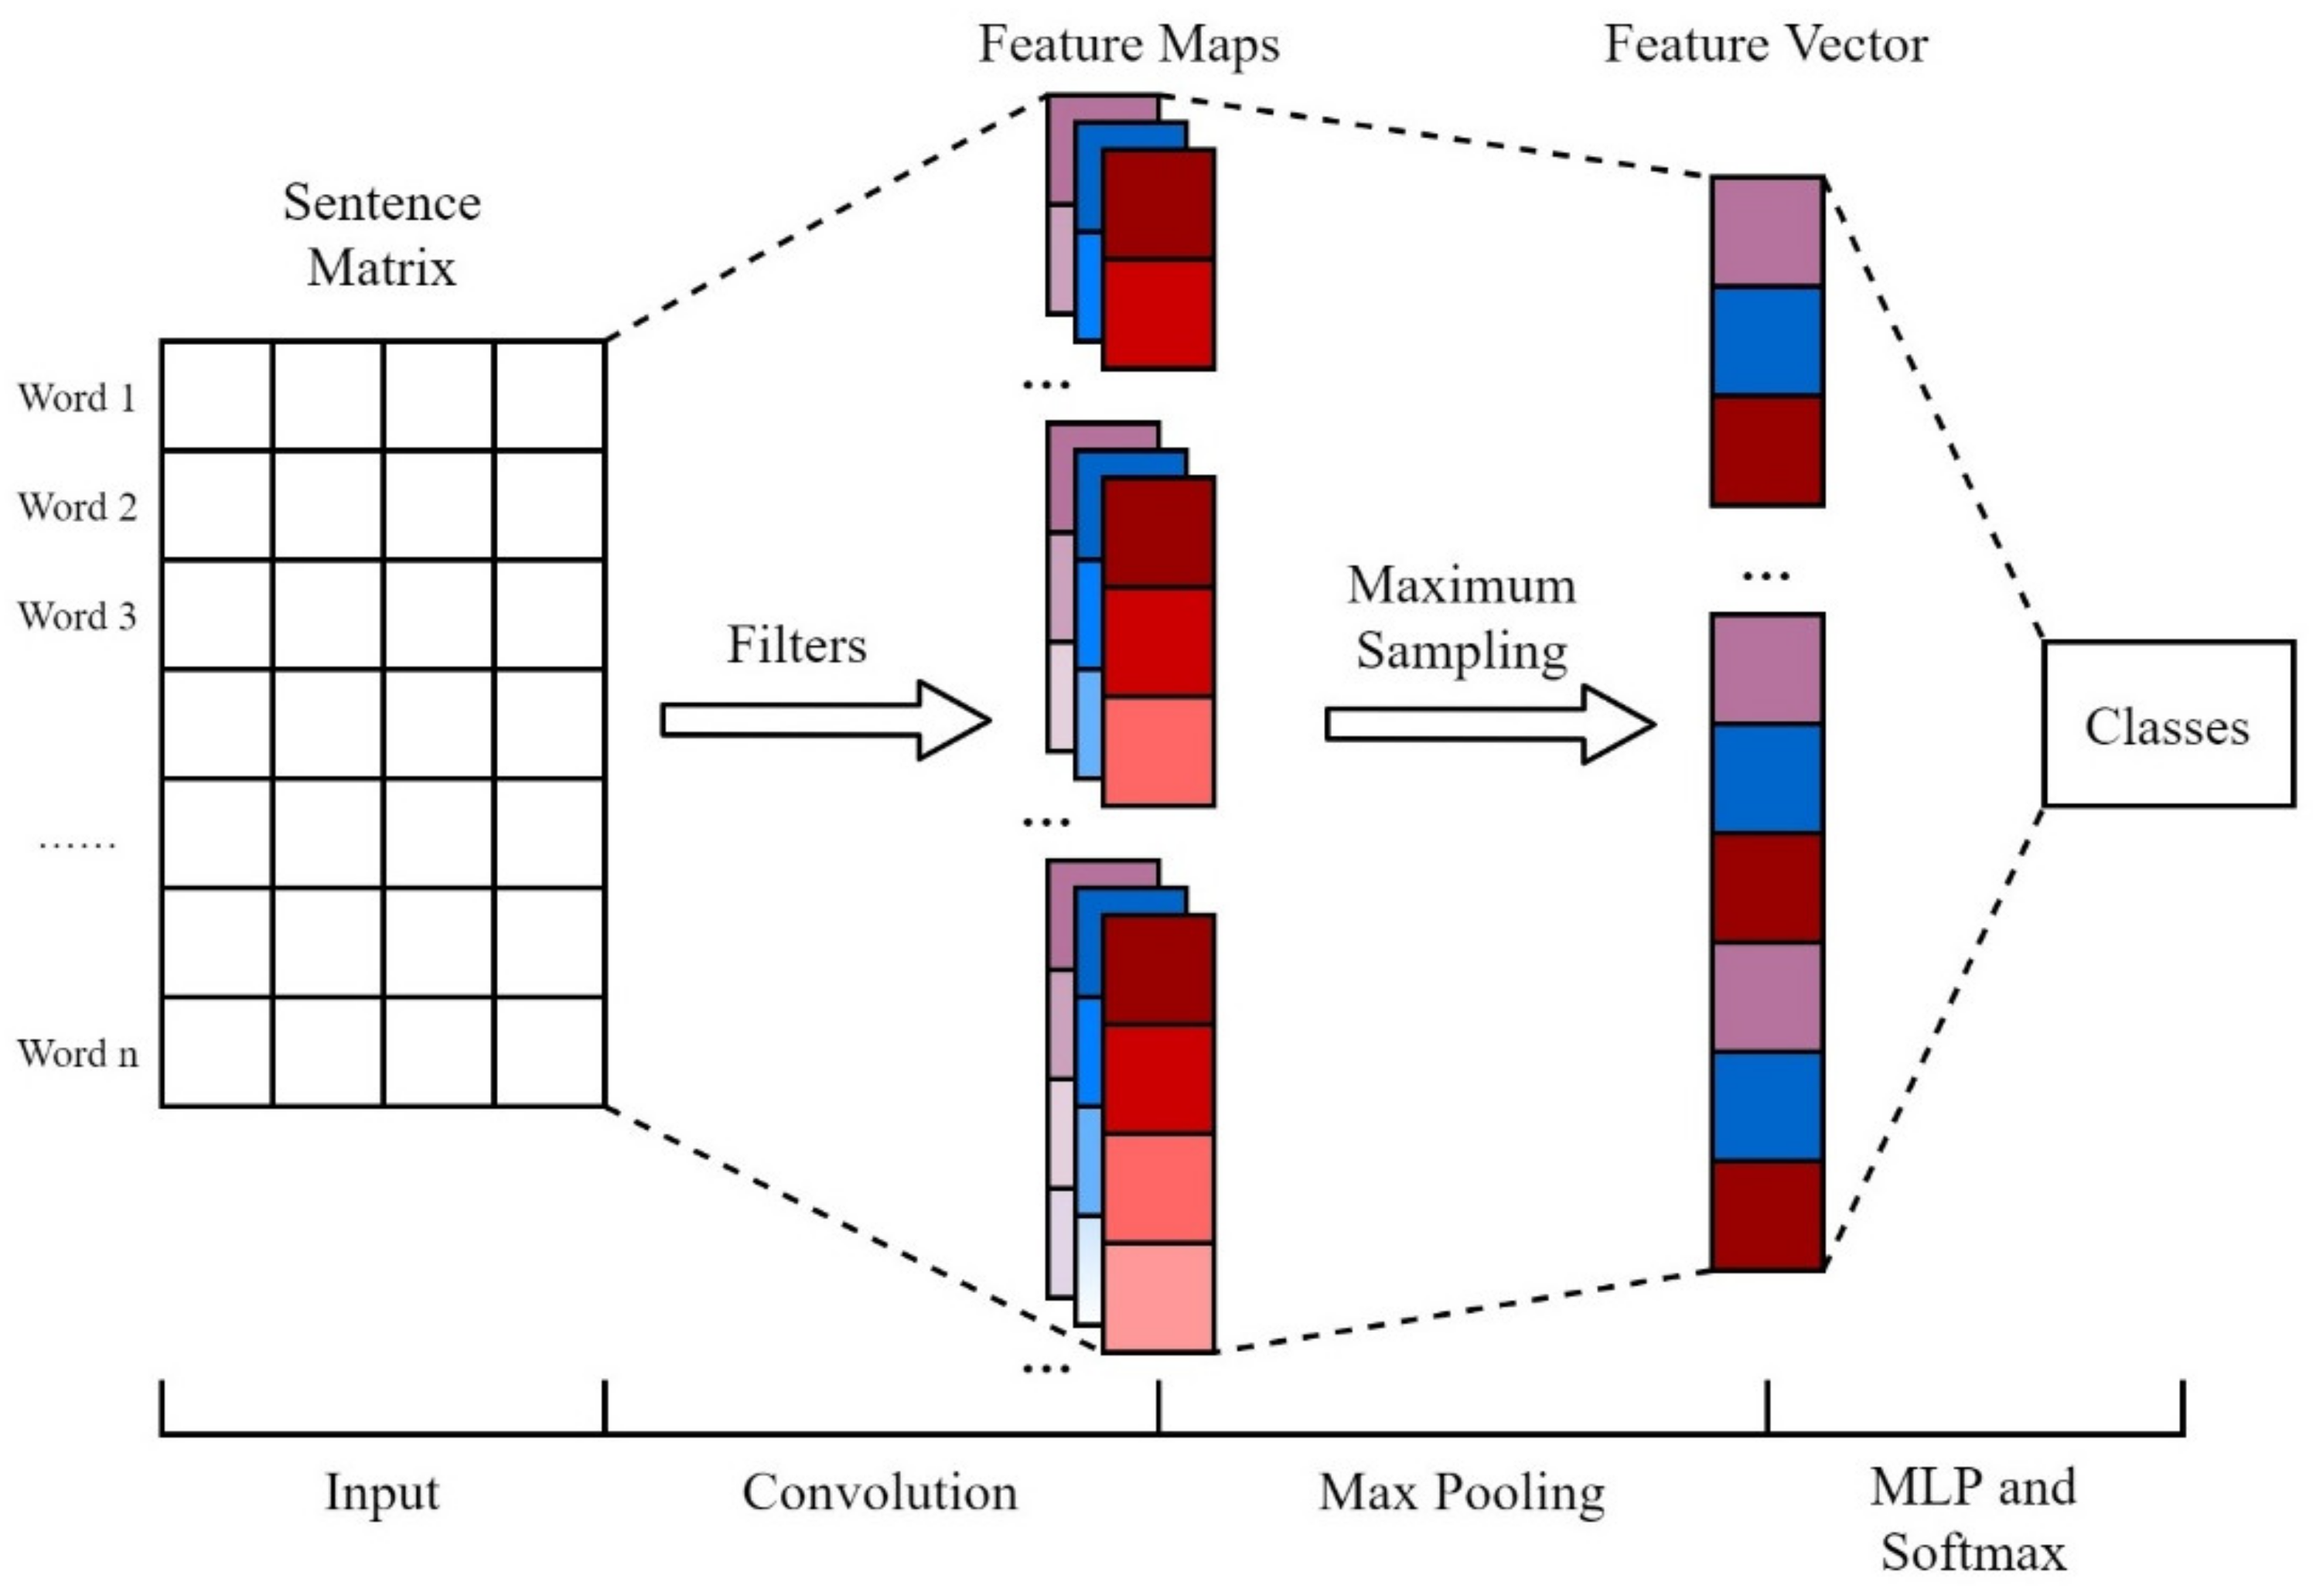
3.1.2. Text Classification Based on CNN
3.1.3. Statistics Analysis and Visualization
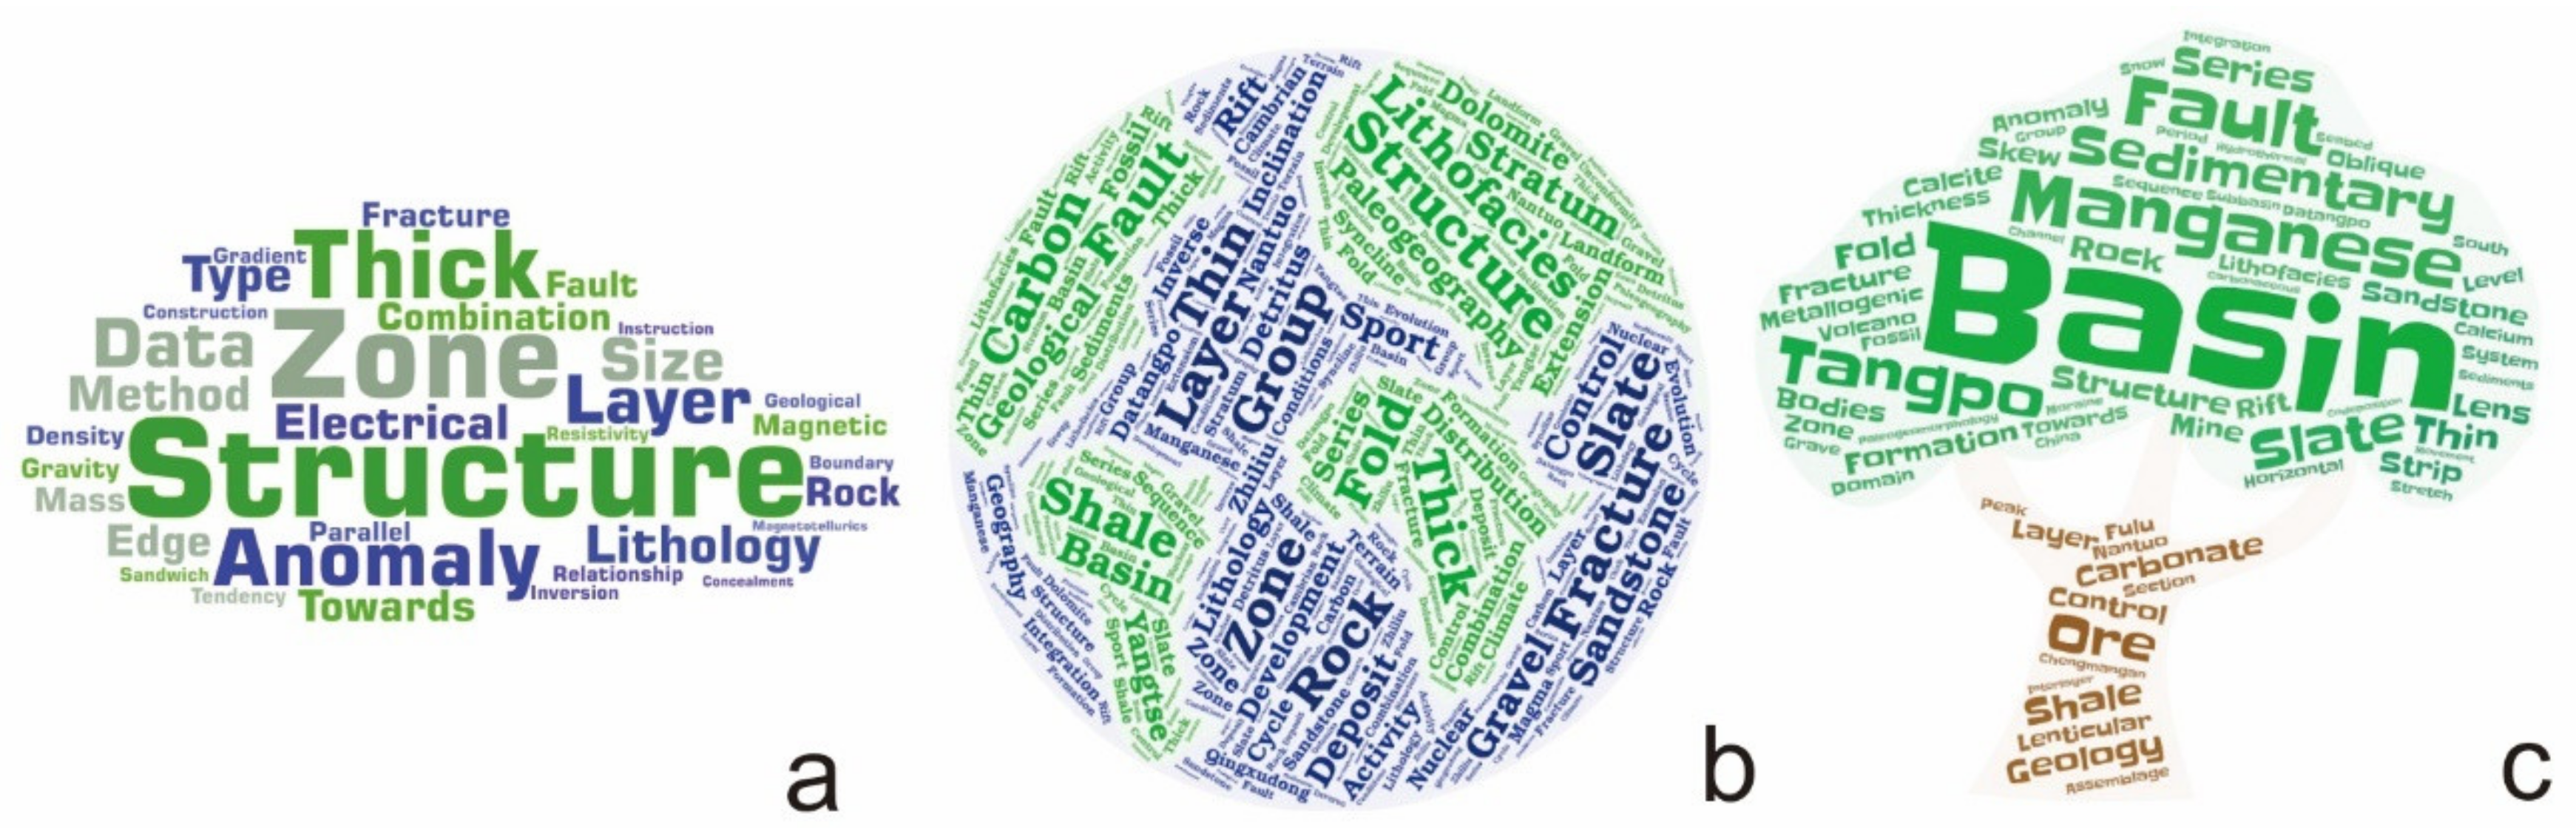
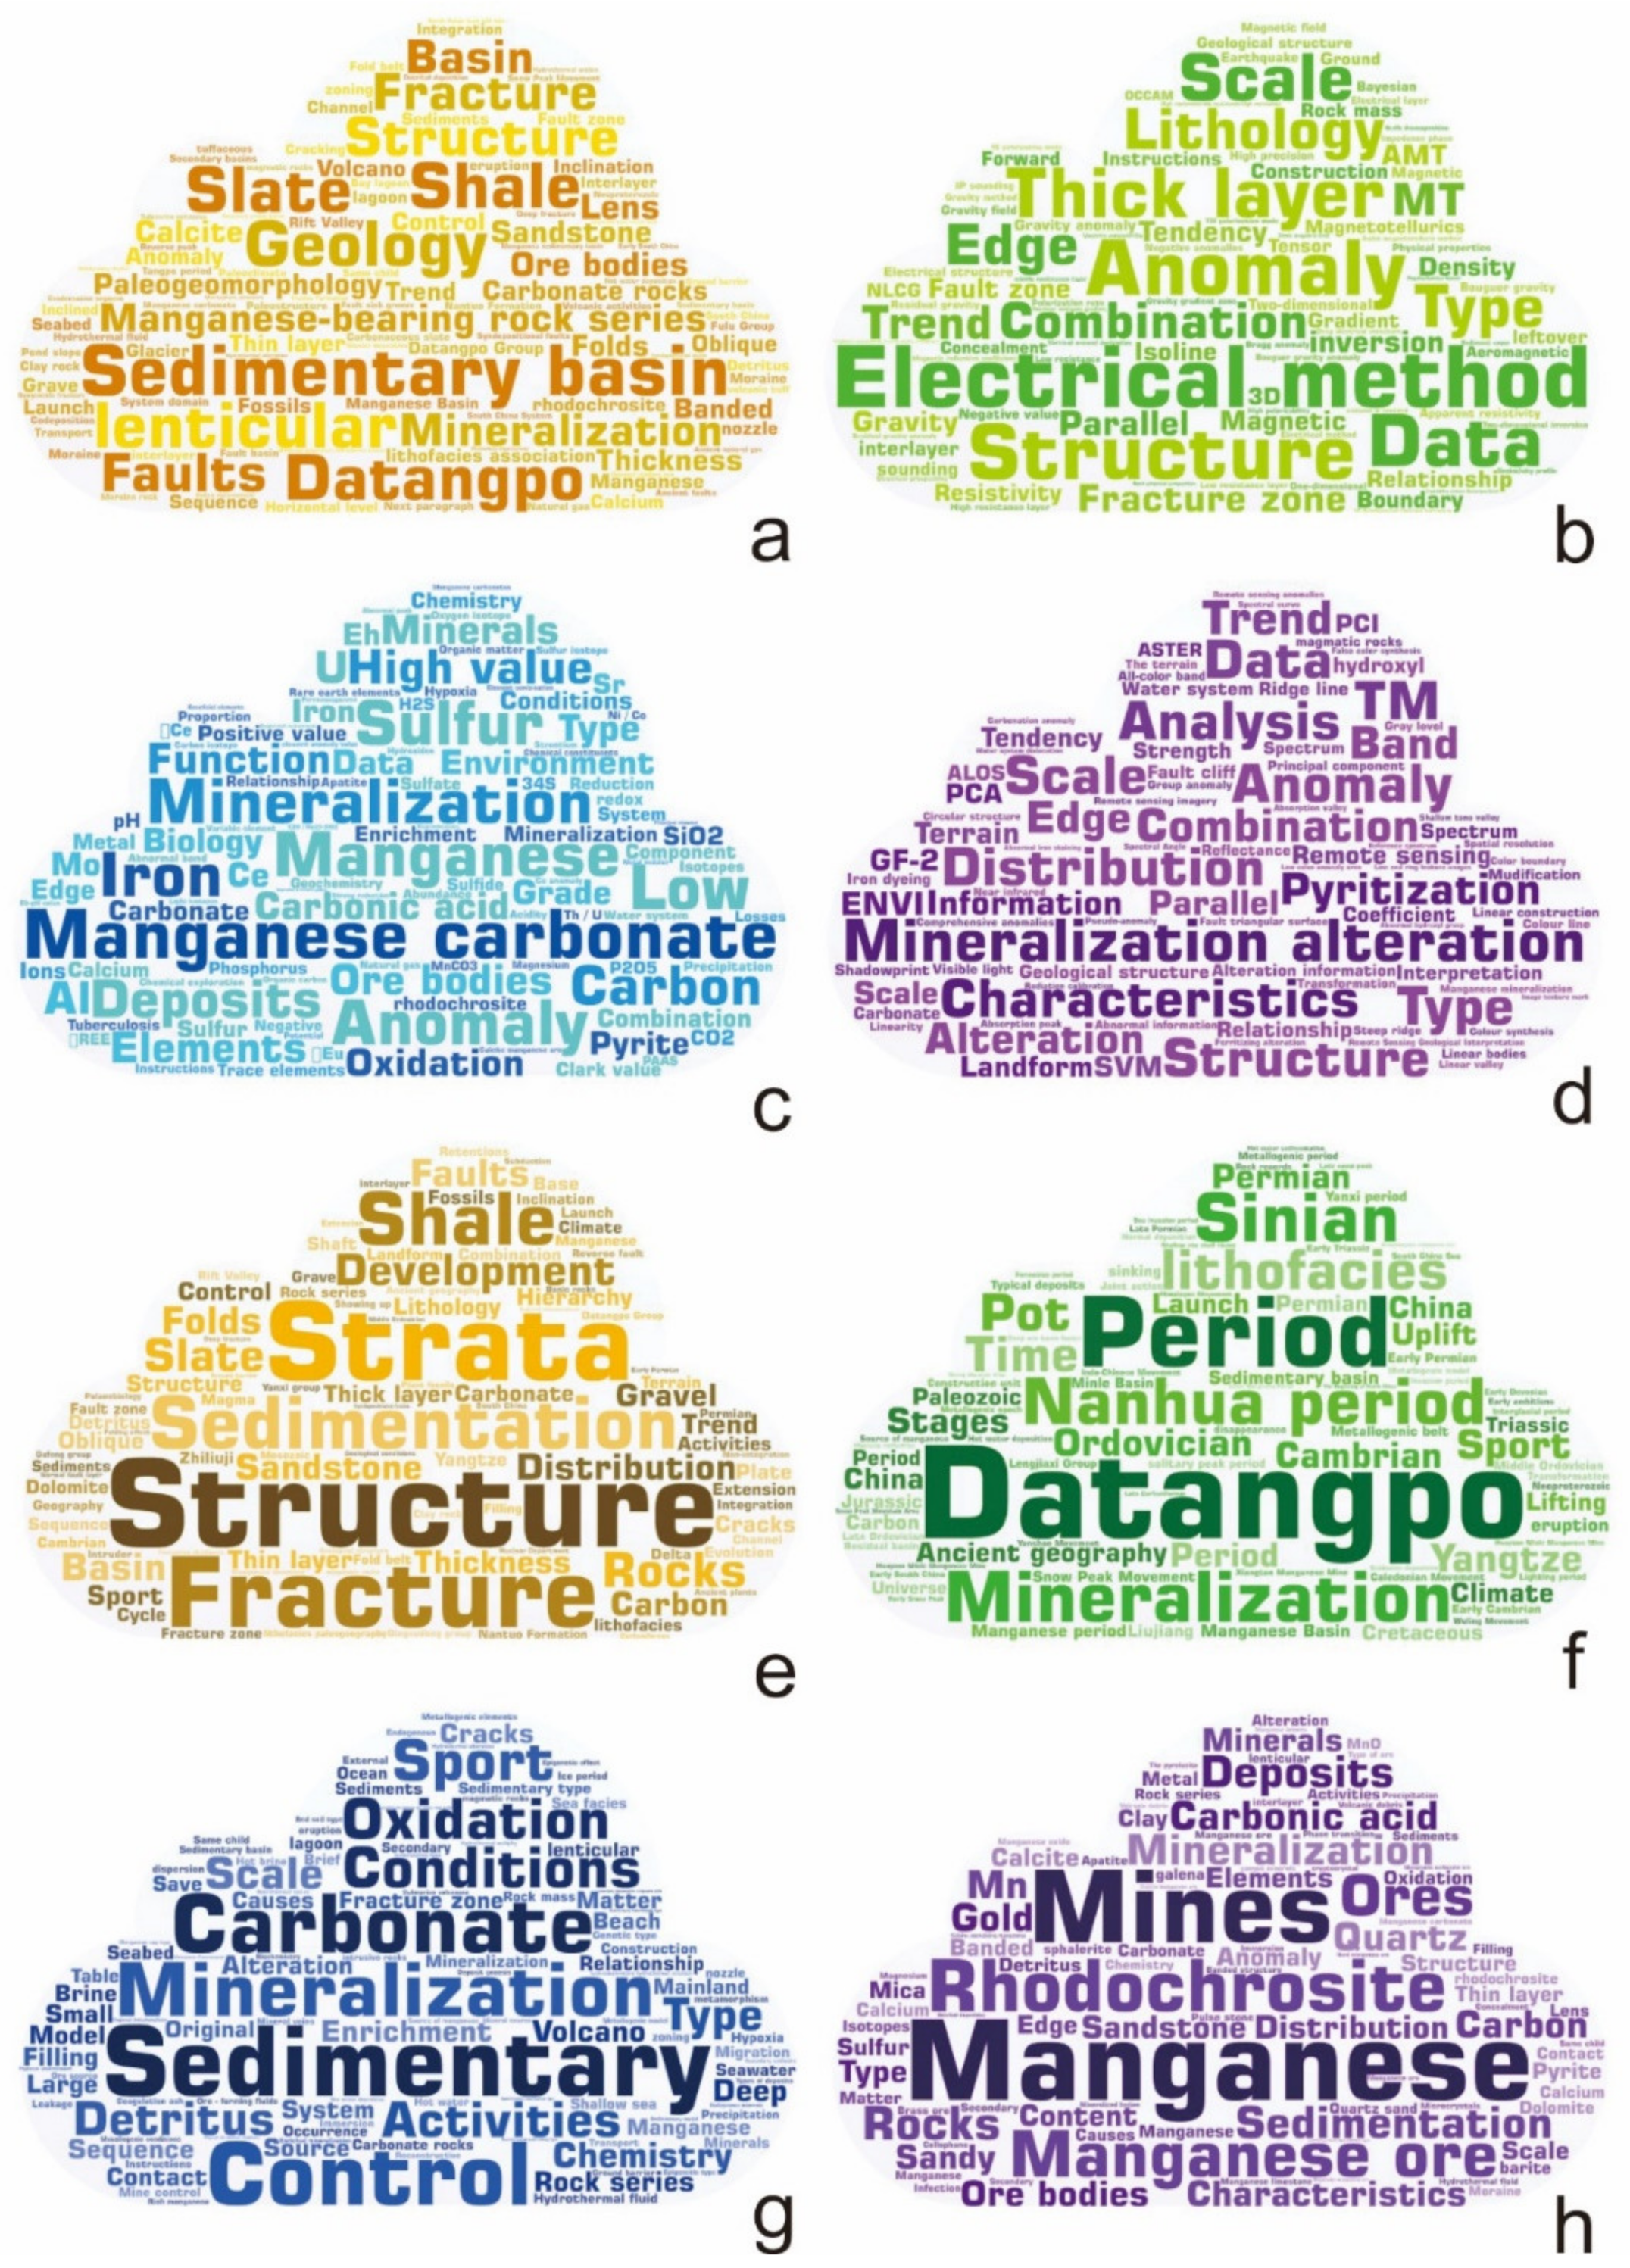
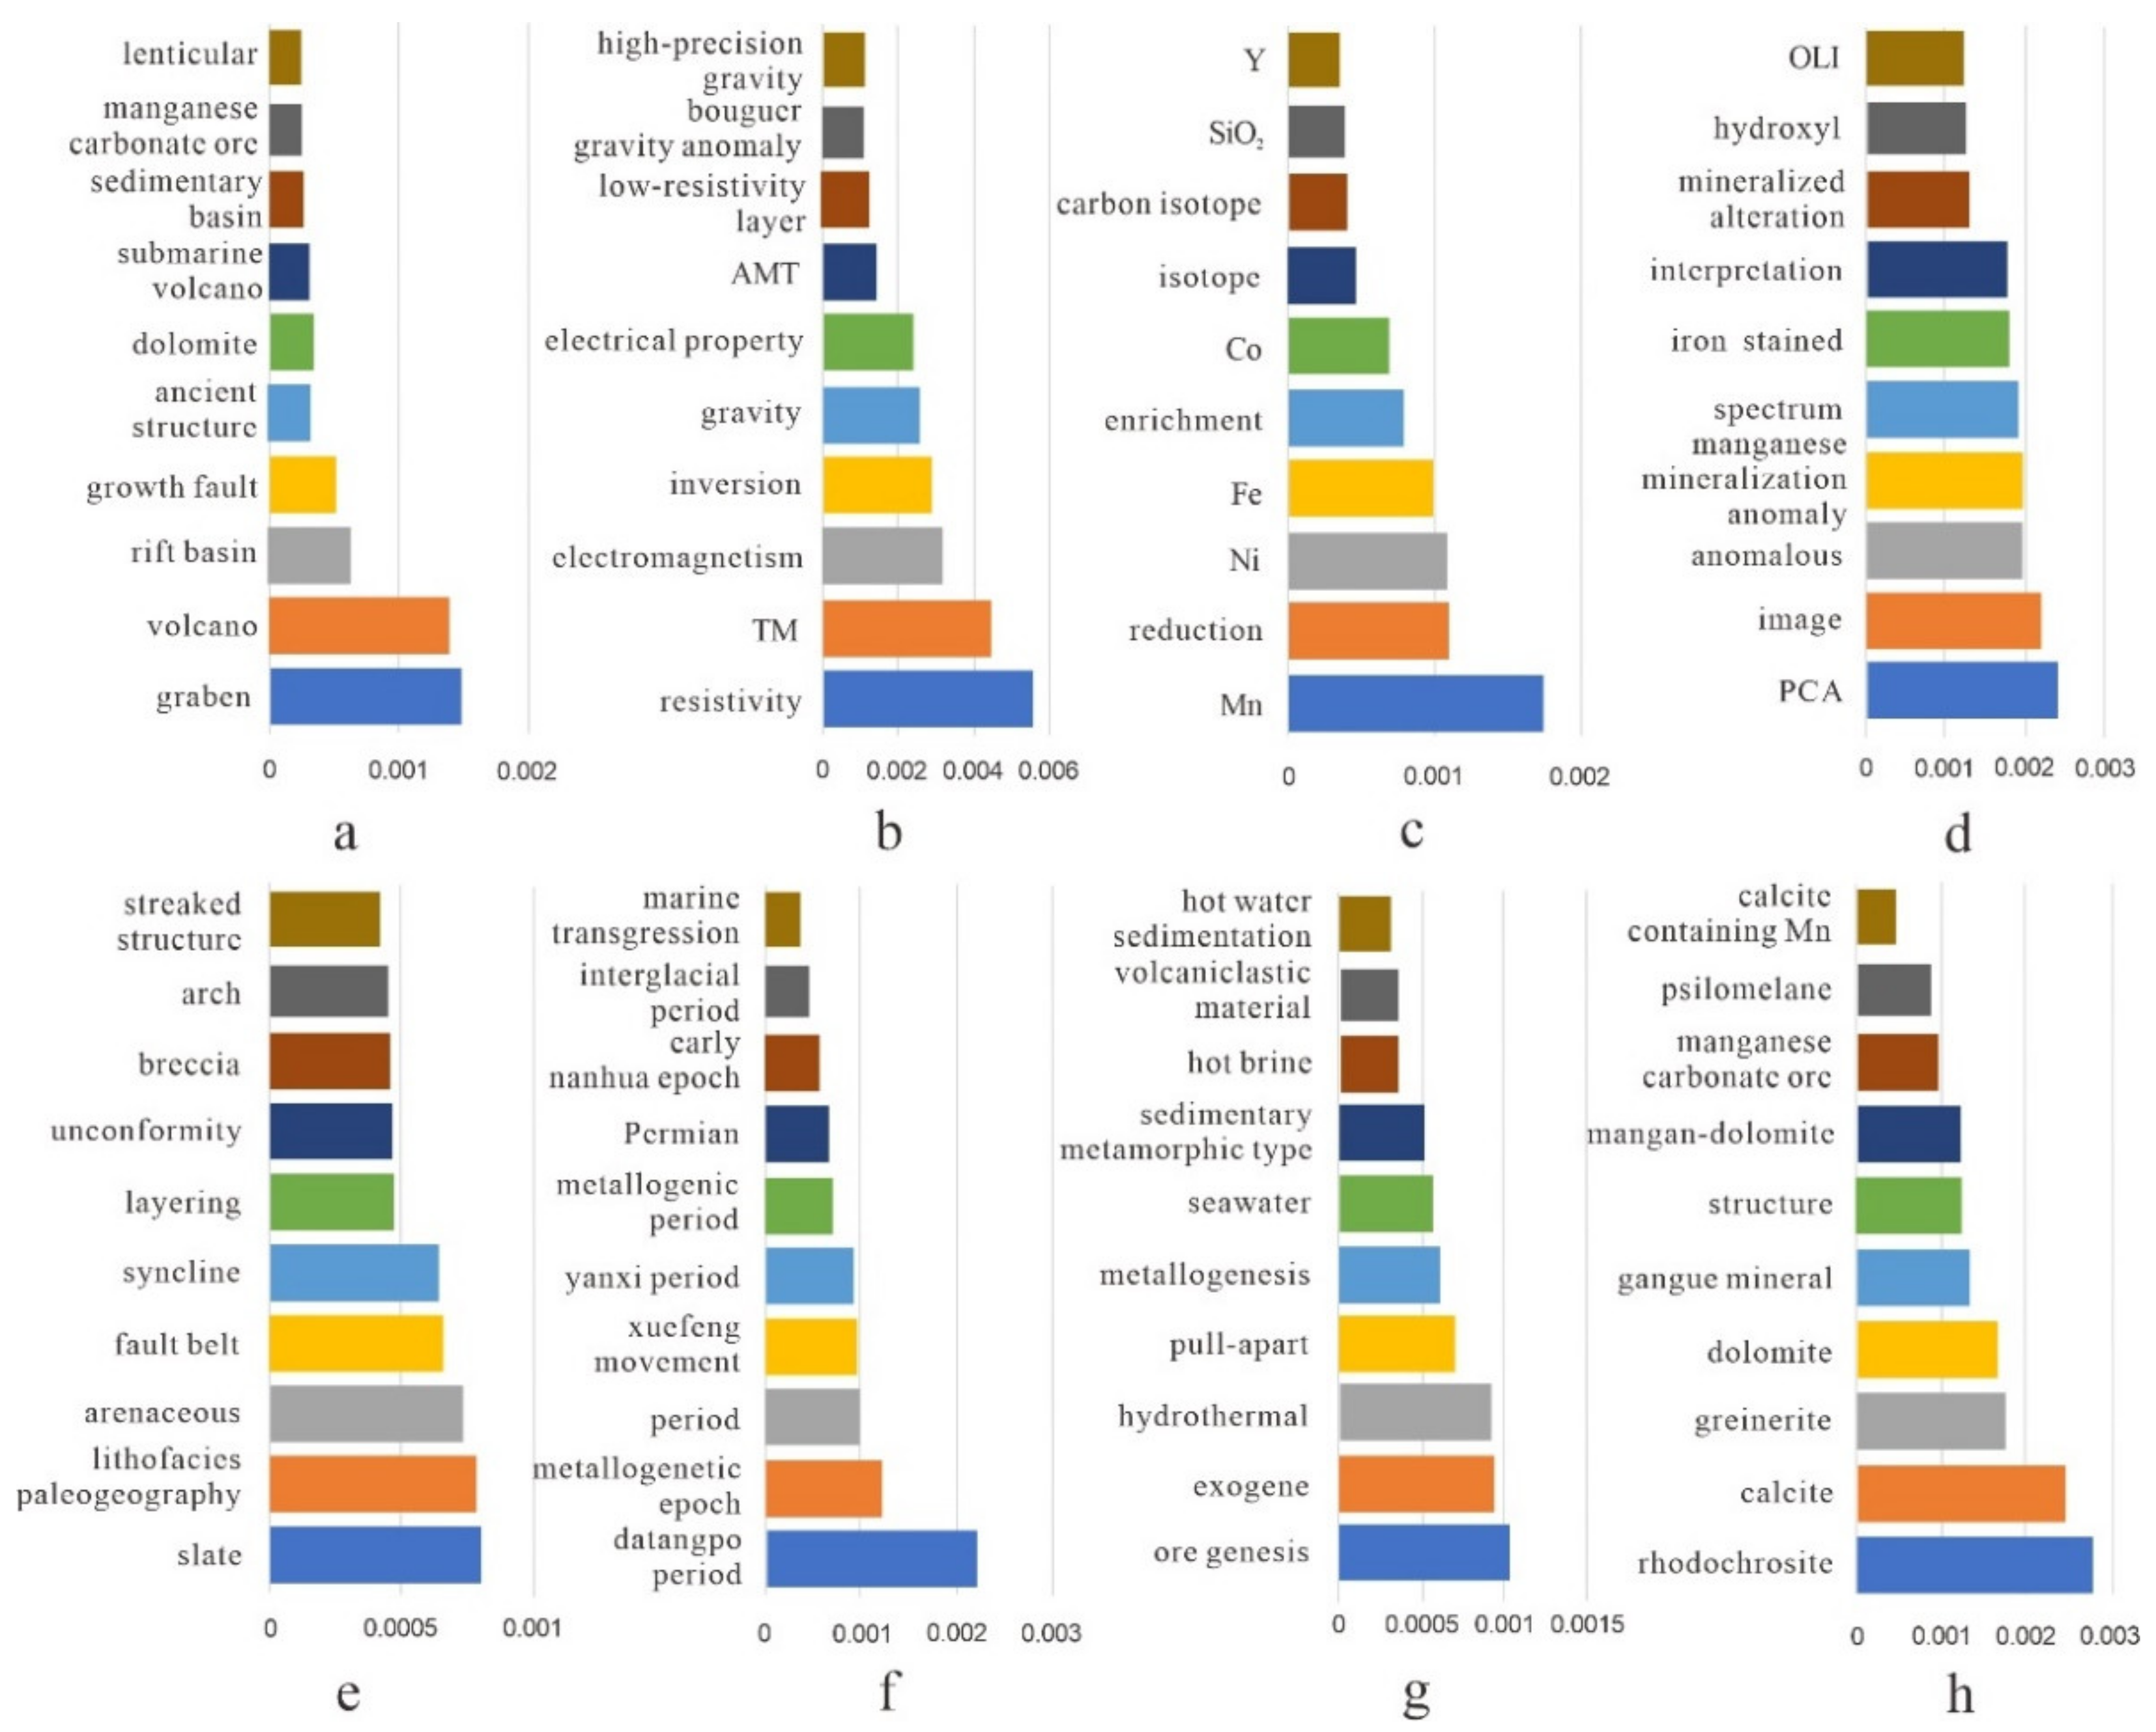
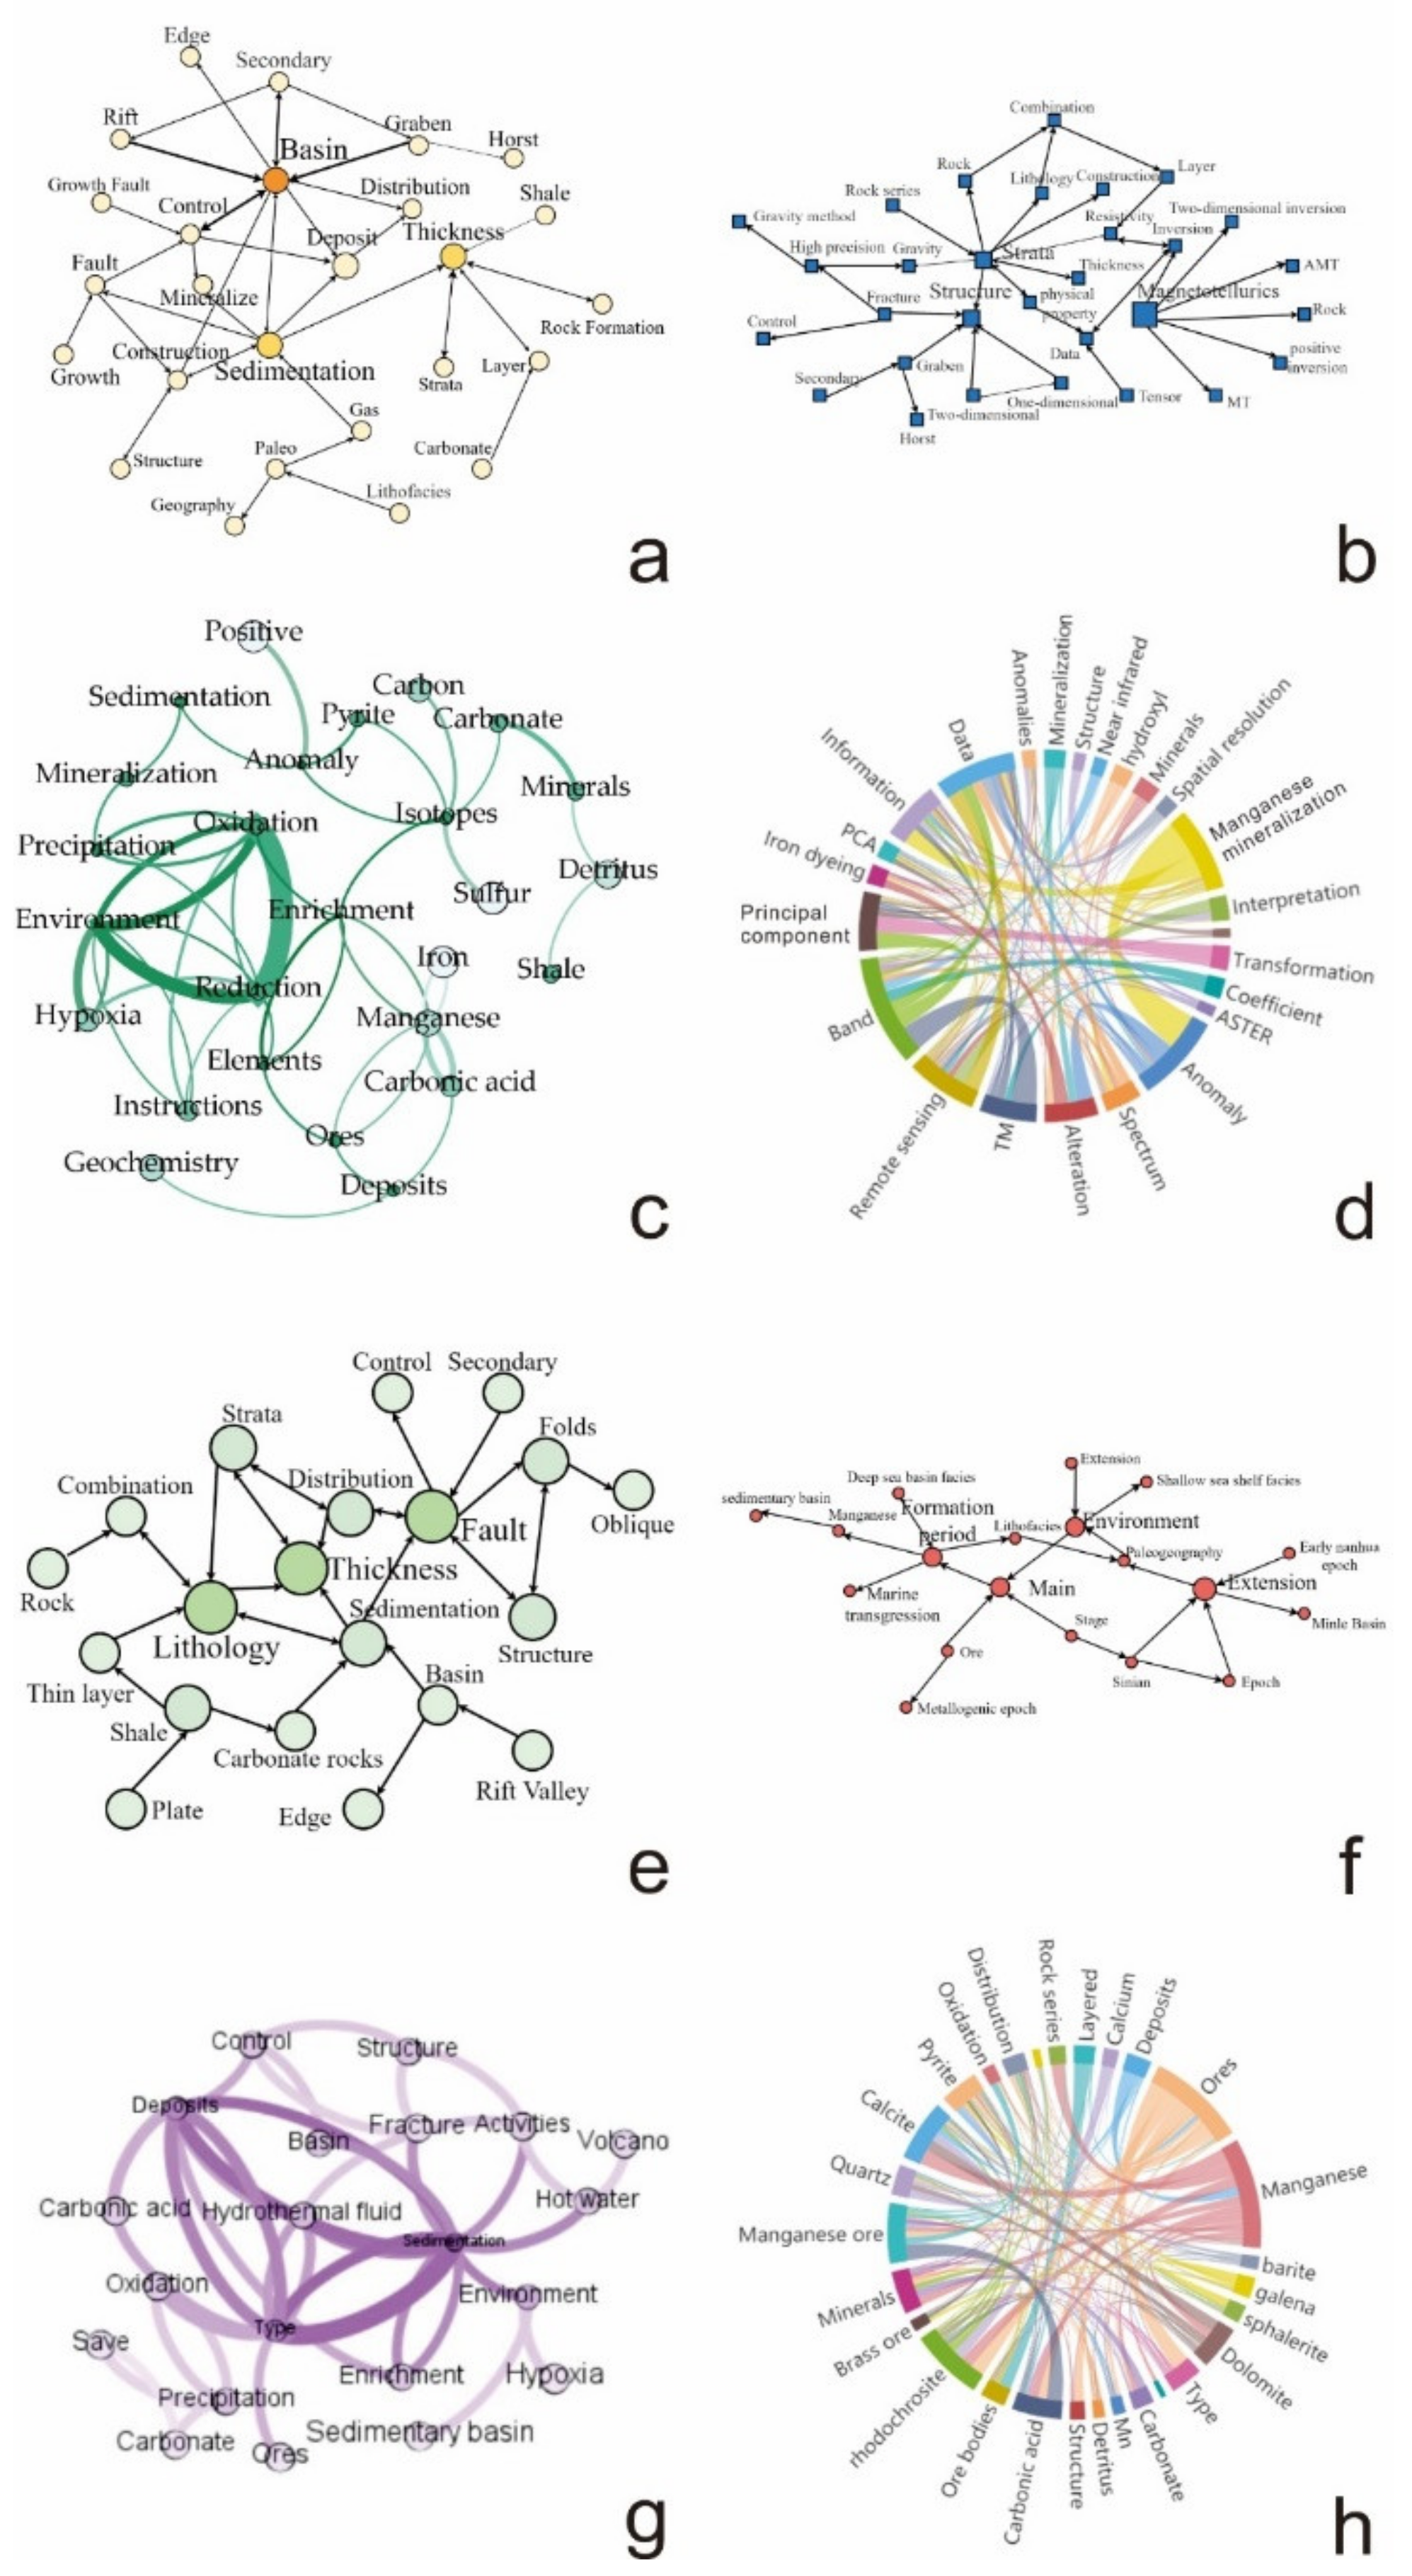
Content Word Extraction and Visualization
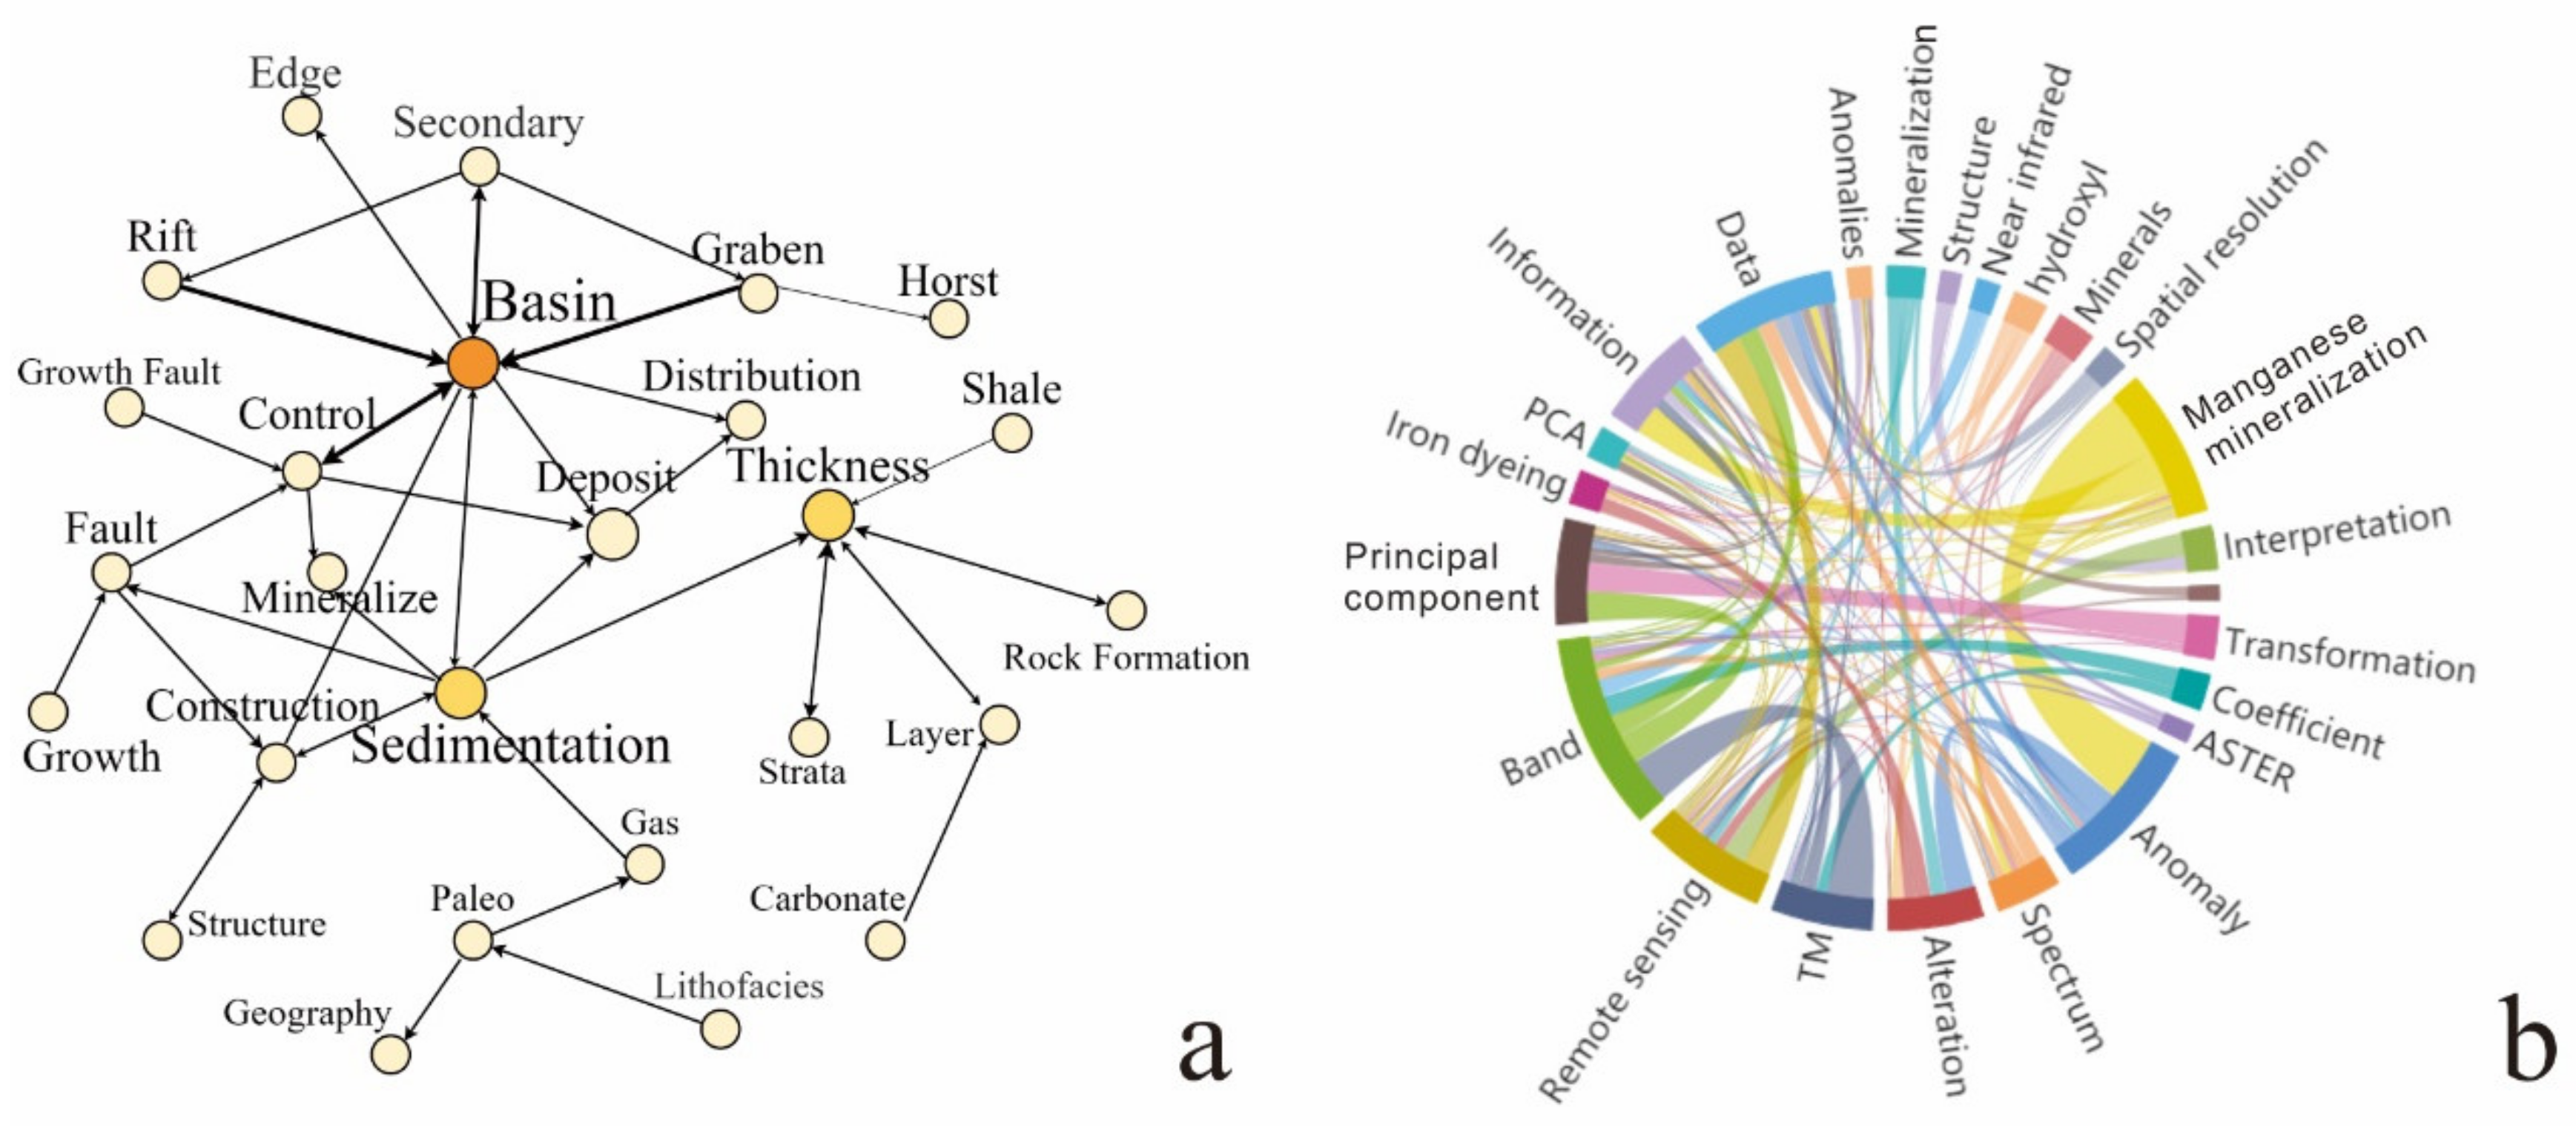
Relationship Extraction and Visualization
3.2. Conceptual Prospecting Model Construction Based on Machine Learning
3.2.1. Construction of Conceptual Prospecting Model Database
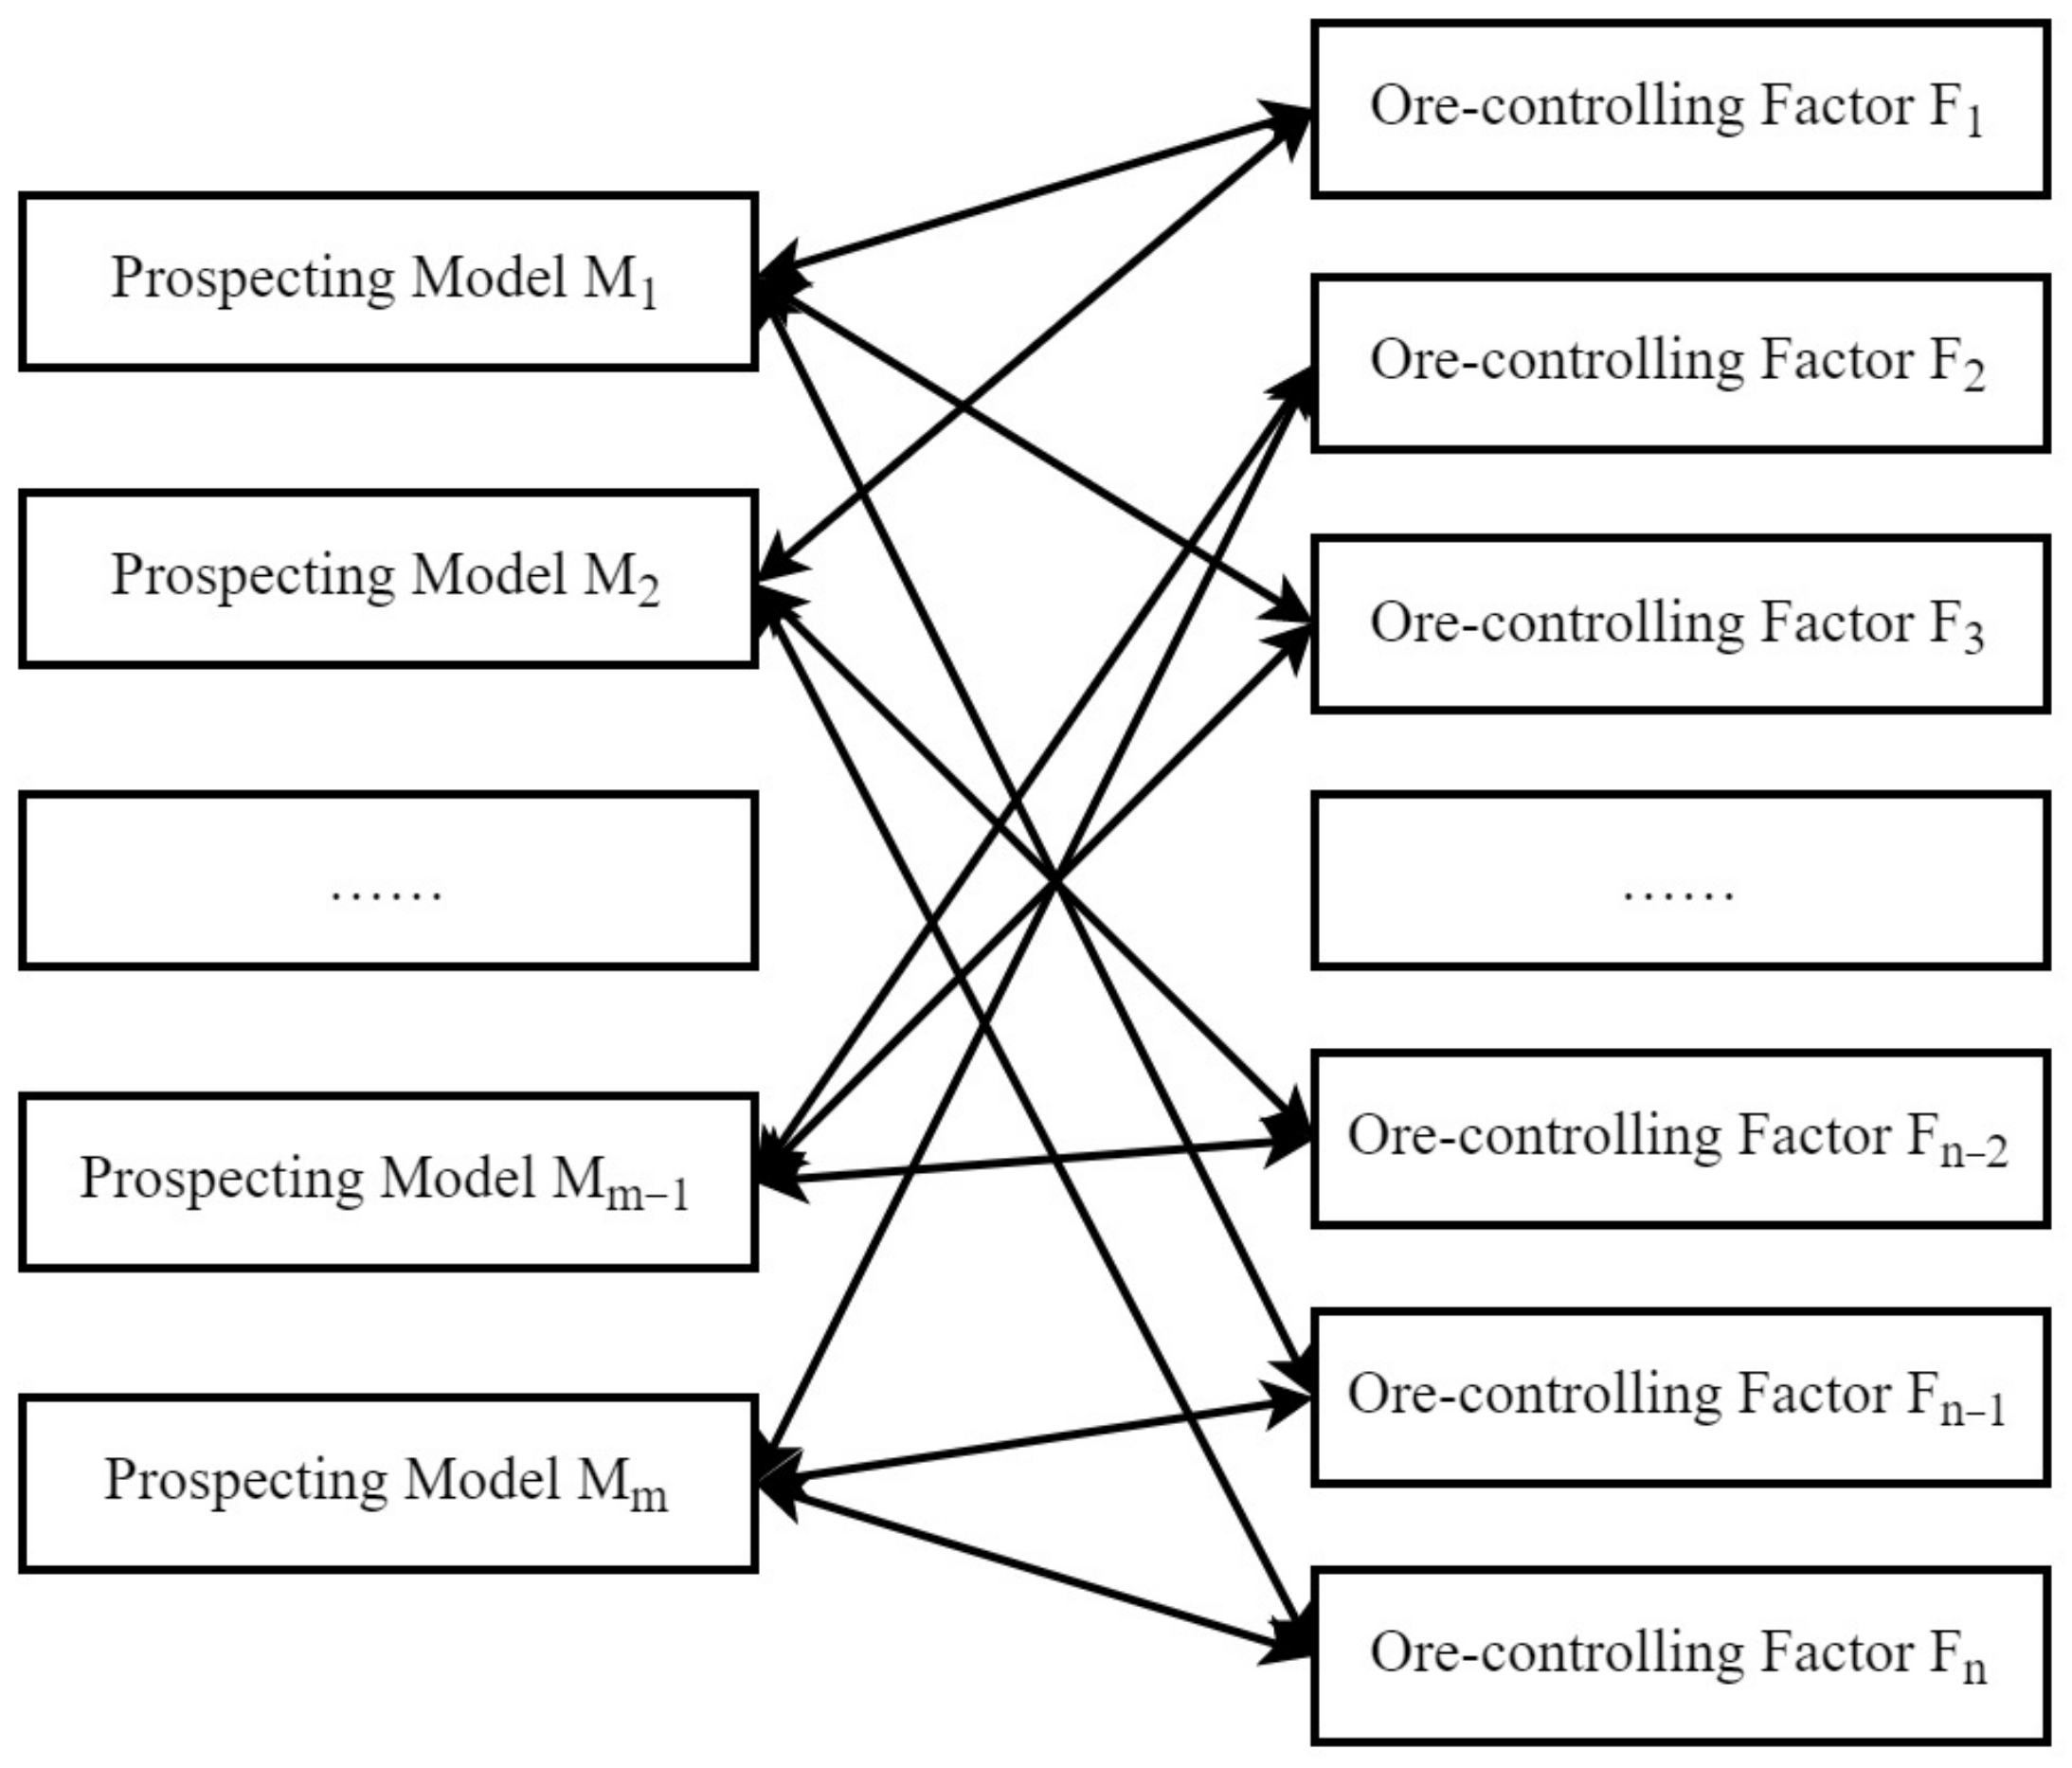
3.2.2. Determination of Prospecting Model
4. Experiment
4.1. Prospecting Information Extraction Based on CNN
4.1.1. Data Acquisition and Pre-Processing
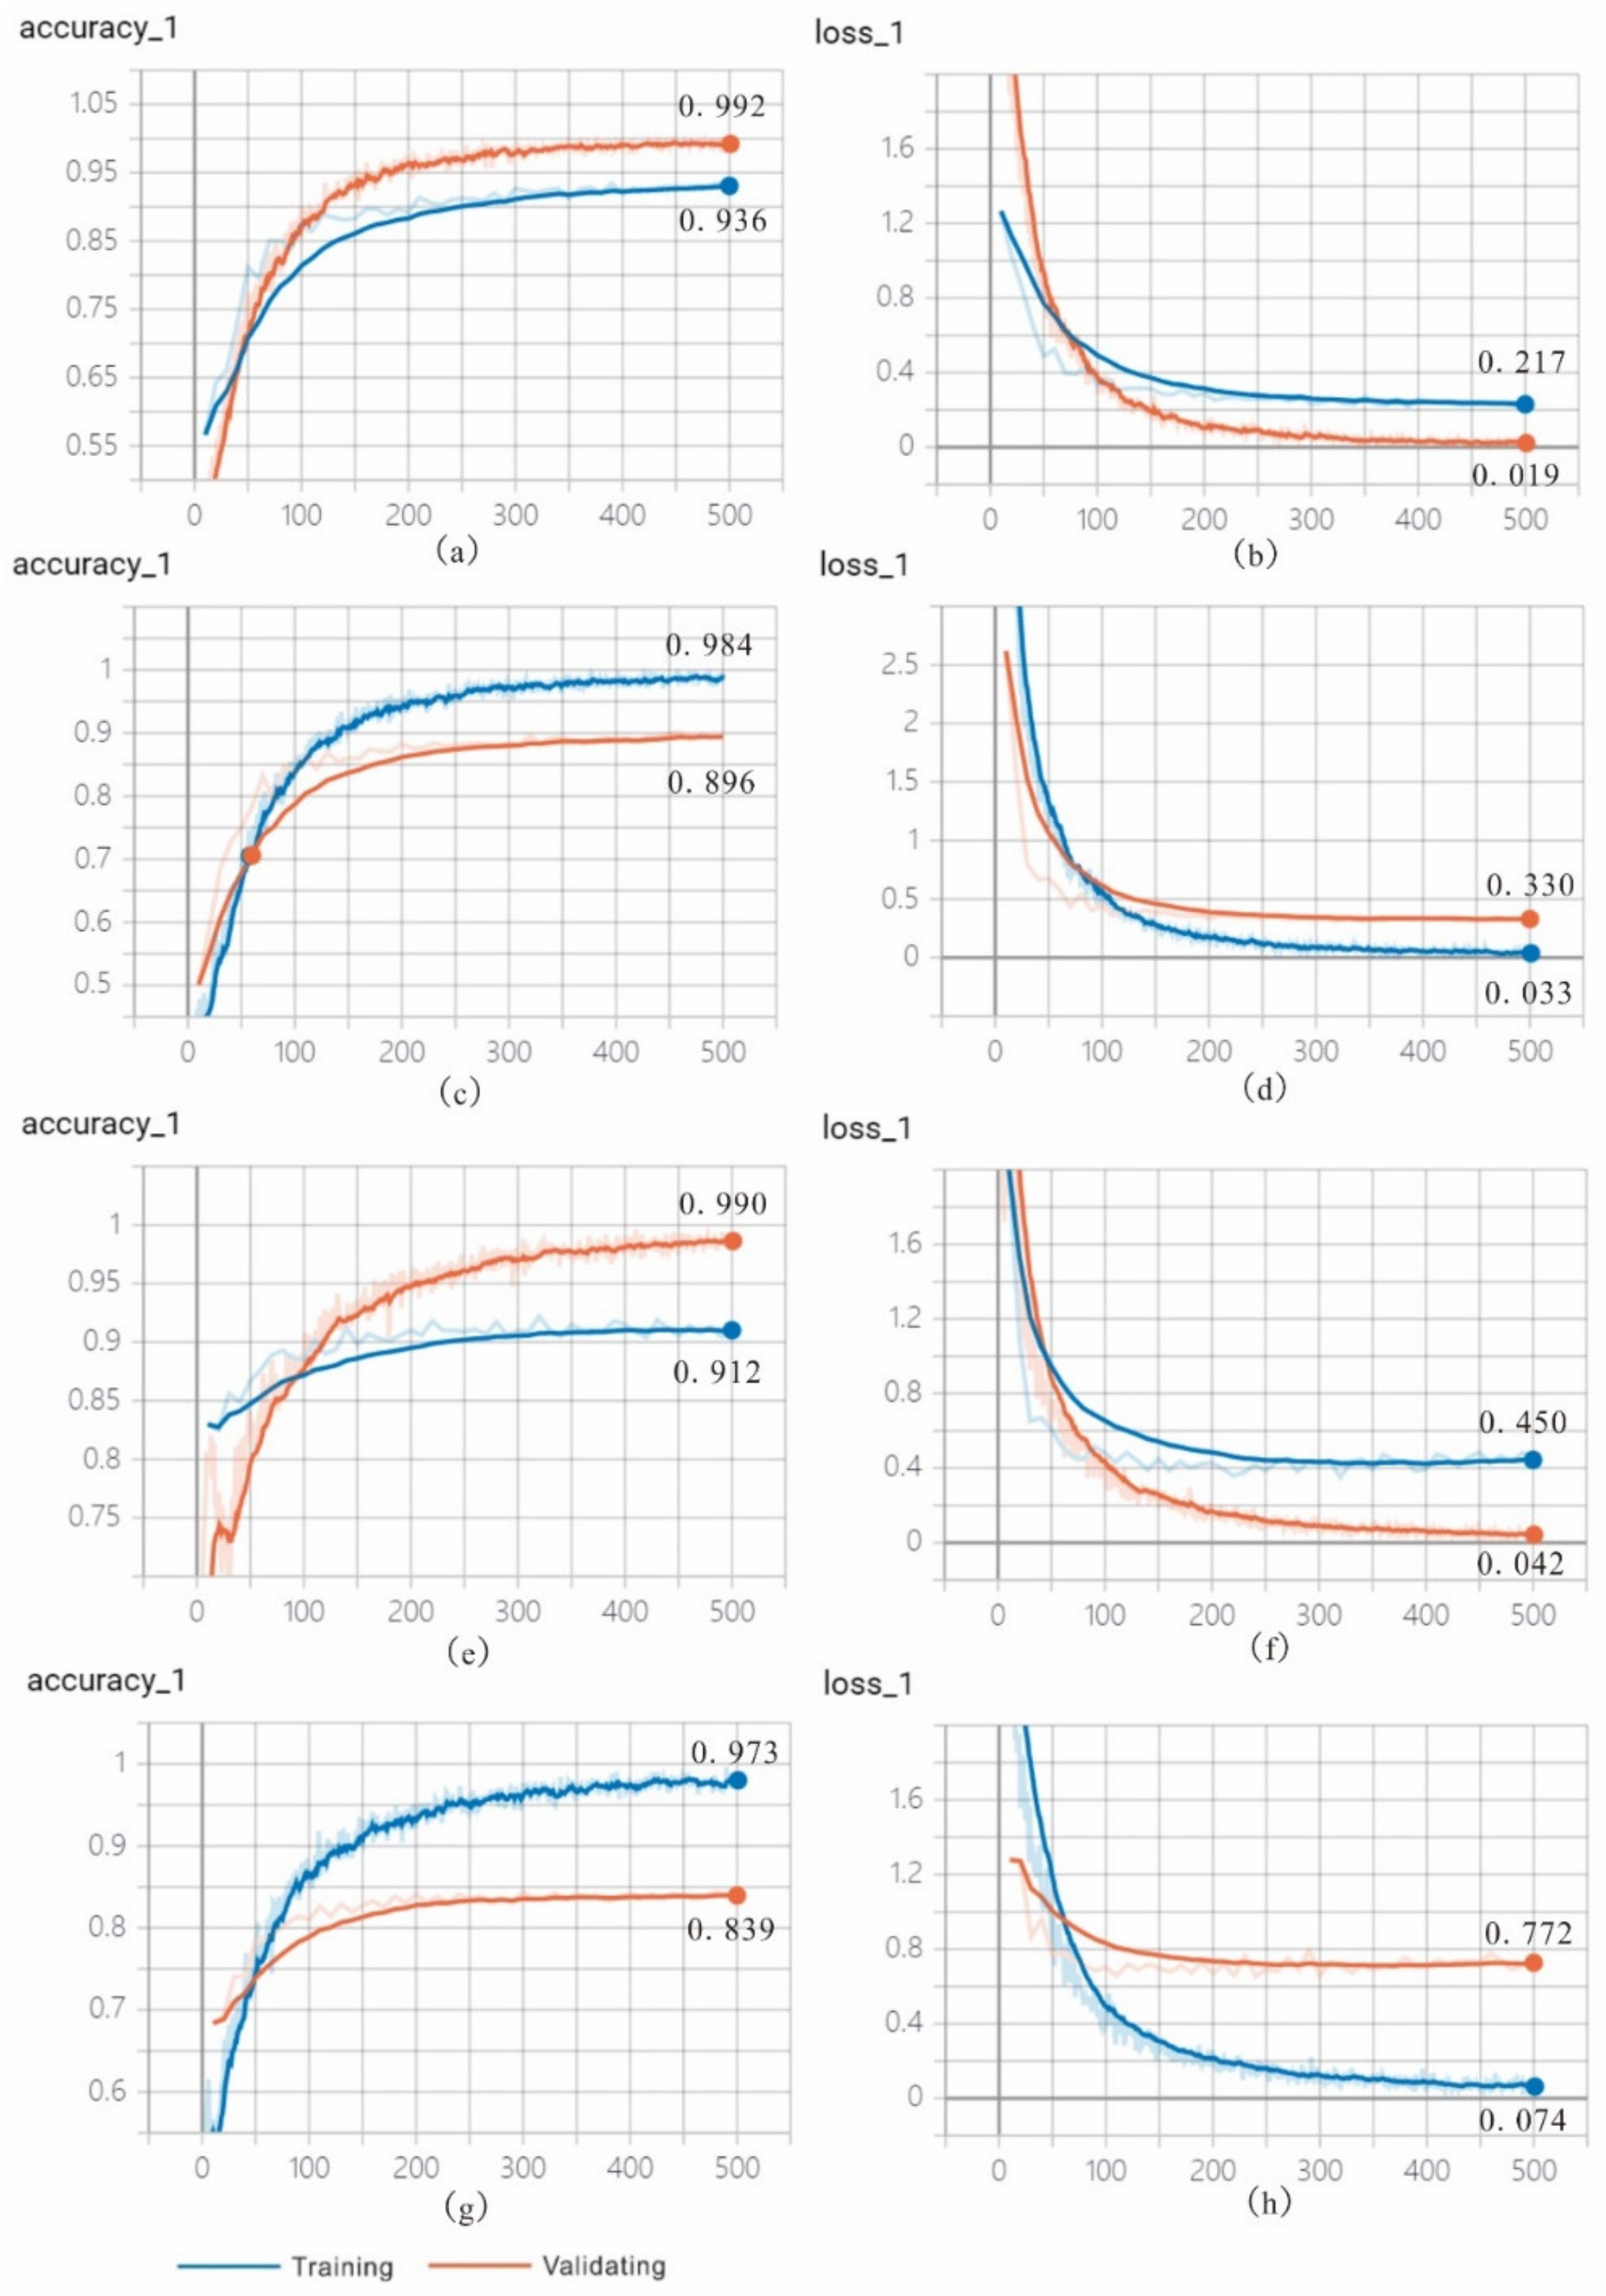
4.1.2. Text Classification Based on CNN
4.1.3. Statistics Analysis and Visualization
4.1.4. Generalized Conceptual Prospecting Model Construction
Ore-Caused Anomalies
Ore-Causing Anomalies
4.2. Conceptual Prospecting Model Construction Based on Machine Learning
5. Conclusions
Author Contributions
Funding
Institutional Review Board Statement
Informed Consent Statement
Data Availability Statement
Acknowledgments
Conflicts of Interest
References
- Bonham-Carter, G.F. Geographic information systems for geoscientists−modeling with GIS. Comput. Methods Geosci. 1994, 13, 398. [Google Scholar]
- Carranza, E.J.M.; Hale, M. Logistic regression for geologically constrained mapping of gold potential, Baguio district, Philippines. Explor. Min. Geol. 2001, 10, 165–175. [Google Scholar] [CrossRef]
- Zhao, P.D. Quantitative mineral prediction and deep mineral exploration. Earth Sci. Front. 2007, 14, 1–10. [Google Scholar]
- Agterberg, F. Geomathematics: Theoretical Foundations, Applications and Future Developments; Springer International Publishing: Berlin, Germany, 2014. [Google Scholar]
- Zhao, P.D. Digital mineral exploration and quantitative evaluation in the big data age. Geol. Bull. China 2015, 34, 1255–1259. [Google Scholar]
- Feldman, R.; Dagan, I.; Hirsh, H. Mining text using keyword distributions. J. Intell. Inf. Syst. 1998, 10, 281–300. [Google Scholar] [CrossRef]
- Wang, C.; Ma, X.; Chen, J.; Chen, J. Information extraction and knowledge graph construction from geoscience literature. Comput. Geosci. 2018, 112, 112–120. [Google Scholar] [CrossRef]
- Hinton, G.E.; Osindero, S.; Teh, Y.W. A fast learning algorithm for deep belief nets. Neural Comput. 2006, 18, 1527–1554. [Google Scholar] [CrossRef] [PubMed]
- LeCun, Y.; Bottou, L.; Bengio, Y.; Haffner, P. Gradient-based learning applied to document recognition. Proc. IEEE 1998, 86, 2278–2324. [Google Scholar] [CrossRef] [Green Version]
- Lei, T.; Barzilay, R.; Jaakkola, T. Molding CNNs for text: Non-linear, non-consecutive convolutions. Indiana Univ. Math. J. 2015, 58, 1151–1186. [Google Scholar]
- Bengio, Y.; Ducharme, R.; Vincent, P. A neural probabilistic language model. J. Mach. Learn. Res. 2003, 3, 1137–1155. [Google Scholar]
- Kim, Y. Convolutional neural networks for sentence classification. arXiv 2014, arXiv:10.3115/v1/D14–1181. [Google Scholar]
- Liang, J.; Chai, Y.; Yuan, H.; Zan, H.; Liu, M. Deep learning for Chinese micro-blog sentiment analysis. J. Chin. Inf. Process. 2014, 28, 155–161. [Google Scholar]
- Sun, S.; He, Y. Multi-label emotion classification for microblog based on CNN feature space. J. Sichuan Univ. 2017, 49, 162–169. [Google Scholar] [CrossRef]
- Feng, S.; Wang, Y.; Song, K.; Wang, D.; Yu, G. Detecting multiple coexisting emotions in microblogs with convolutional neural networks. Cogn. Comput. 2018, 10, 136–155. [Google Scholar] [CrossRef]
- Schuhmacher, M.; Ponzetto, S.P. Knowledge-Based Graph Document Modeling. In Proceedings of the WSDM 14: 7th ACM International Conference on Web Search and Data Mining, New York, NY, USA, 24–28 February 2014; pp. 543–552. [Google Scholar] [CrossRef] [Green Version]
- Ji, S.; Pan, S.; Cambria, E.; Marttinen, P.; Philip, S.Y. A survey on knowledge graphs: Representation, acquisition, and applications. IEEE Trans. Neural Netw. Learn. Syst. 2022, 33, 494–514. [Google Scholar] [CrossRef] [PubMed]
- Lu, F.; Yu, L.; Qiu, P. On geographic knowledge graph. J. Geo.–Inf. Sci. 2017, 19, 723–734. [Google Scholar]
- Hou, Z.W.; Zhu, Y.Q.; Gao, Y.; Song, J.; Qin, C. Geologic time scale ontology and its applications in semantic retrieval. J. Geo-Inf. Sci. 2018, 20, 17–27. [Google Scholar]
- Xu, J.; Pei, T.; Yao, Y. Conceptual framework and representation of geographic knowledge map. J. Geo-Inf. Sci. 2010, 12, 496–502. [Google Scholar] [CrossRef]
- Wu, Y.L.; Jia, Z.J.; Chen, J.P.; Zhu, Y.Q. Construction and prediction of prospecting model based on big data intelligence. China Min. Mag. 2017, 26, 79–84. [Google Scholar]
- Shi, L.; Jianping, C.; Jie, X. Prospecting information extraction by text mining based on convolutional neural networks—A case study of the lala copper deposit, China. IEEE Access 2018, 6, 52286–52297. [Google Scholar] [CrossRef]
- Hovy, E.; Lin, C.-Y. Automated text summarization and the SUMMARIST system. In Proceedings of the TIPSTER 98: A Workshop, Baltimore, MD, USA, 13–15 October 1998; pp. 197–214. [Google Scholar] [CrossRef] [Green Version]
- Piantadosi, S.T. Zipf’s word frequency law in natural language: A critical review and future directions. Psychon. Bull. Rev. 2014, 21, 1112–1130. [Google Scholar] [CrossRef] [PubMed] [Green Version]
- Fries, C.C. The Structure of English: An Introduction to the Construction of English Sentences; Harcourt, Brace & World: New York, NY, USA, 1952. [Google Scholar]
- Yu, P.; Chen, J.; Chai, F.; Zheng, X.; Yu, M.; Xu, B. Research on model-driven quantitative prediction and evaluation of mineral resources based on geological big data concept. Geol. Bull. China 2015, 34, 1333–1343. [Google Scholar]
- Gao, L.; Xu, S.; Hu, X.; Liu, S.; Zhou, Q.; Yang, B. Sedimentary setting and ore-forming model in the songtao manganese deposit, Southwestern China: Evidence from audio-frequency magnetotelluric and gravity data. Minerals 2021, 11, 1273. [Google Scholar] [CrossRef]
- Zhou, Q.; Du, Y.S.; Yuan, L.J.; Zhang, S.; Yu, W.C.; Yang, S.T.; Liu, Y. The structure of the Wuling Rift Basin and its control on the manganese deposit during the Nanhua period in Guizhou-Hunan-Chongqing Border Area, South China. Earth Sci. 2016, 41, 177–188. [Google Scholar]
- Du, Y.S.; Zhou, Q.; Yu, W.C.; Wang, P.; Yuan, L.; Qi, L.; Xu, Y. Linking the Cryogenian manganese metallogenic process in the southeast margin of Yangtze block to break-up of rodinia supercontinent and sturtian glaciation. Geol. Sci. Techol. Inf. 2015, 34, 1–7. [Google Scholar]
- Zhou, Q.; Du, Y.; Qin, Y. Ancient natural gas seepage sedimentary type manganese metal logenic system and ore-forming model: A case study of “Datangpo type” manganese deposits formed in rift basin of Nanhua Period along Guizhou-Hunan-Chongqing border area. Miner. Depos. 2013, 32, 457–466. [Google Scholar]


| Num | Entity | Description |
|---|---|---|
| 1 | Prospecting model | Model number, name, reference, typical deposit, description information, creation time, modification time |
| 2 | Ore-controlling factors | Factor number, name, factor category, factor type, creation time, modification time |
| 3 | Intermediate table | Model number, factor number |
| Type of Text | Domestic | Foreign | Study Area | Total |
|---|---|---|---|---|
| Related News | 54,308 | 33,238 | 74 | 87,620 |
| Related Literature | 9327 | 4876 | 111 | 14,314 |
| Regional Reports | 57 | 0 | 8 | 65 |
| Total | 63,692 | 38,114 | 193 | 101,999 |
| Levels | Geological Prospecting | Geophysical Prospecting | Geochemical Prospecting | Remote Sensing | Metallogenic Background | Metallogenic Period | Genetic Type | Mineralization Type | Total | |
|---|---|---|---|---|---|---|---|---|---|---|
| Training Set | Sentence | 1659 | 506 | 522 | 331 | 3873 | 171 | 262 | 442 | 7766 |
| Paragraph | 1128 | 450 | 452 | 267 | 1652 | 196 | 288 | 338 | 4771 | |
| Testing Set | Word | 100 | 100 | 100 | 100 | 100 | 100 | 100 | 100 | 800 |
| Sentence | 100 | 100 | 100 | 100 | 100 | 100 | 100 | 100 | 800 | |
| Paragraph | 100 | 100 | 100 | 100 | 100 | 100 | 100 | 100 | 800 |
| Ore-Caused Anomaly Sentence Classification Model | Ore-Caused Anomaly Paragraph Classification Model | Ore-Causing Anomaly Sentence Classification Model | Ore-Causing Anomaly Paragraph Classification Model | |||||||||
|---|---|---|---|---|---|---|---|---|---|---|---|---|
| Word | Sentence | Paragraph | Word | Sentence | Paragraph | Word | Sentence | Paragraph | Word | Sentence | Paragraph | |
| Test Accuracy | 0.860 | 0.939 | 0.879 | 0.895 | 0.919 | 0.912 | 0.569 | 0.795 | 0.627 | 0.594 | 0.785 | 0.810 |
| Recall | 0.860 | 0.938 | 0.877 | 0.895 | 0.919 | 0.911 | 0.569 | 0.795 | 0.628 | 0.594 | 0.785 | 0.810 |
| F1 | 0.860 | 0.9385 | 0.878 | 0.895 | 0.919 | 0.9115 | 0.569 | 0.795 | 0.6275 | 0.594 | 0.785 | 0.810 |
| Ore-Caused Anomaly Classification Model | Ore-Causing Anomaly Classification Model | |||||
|---|---|---|---|---|---|---|
| Word | Sentence | Paragraph | Word | Sentence | Paragraph | |
| Average Test Accuracy | 87.8% | 92.9% | 89.6% | 58.2% | 79% | 71.9% |
| Average Recall | 87.8% | 92.9% | 89.4% | 58.2% | 79% | 71.9% |
| Average F1 | 87.8% | 92.9% | 89.5% | 58.2% | 79% | 71.9% |
| Rank | Model ID | Bayesian Probability | Model Name |
|---|---|---|---|
| 1 | ba0be2863b874b4086a7a359f423b6e4 | 0.077754 | Shallow marine sedimentary manganese deposit in Dounan, Yunnan |
| 2 | f1007cc260d442c084ddd69ef09a47da | 0.013668 | Sedimentary manganese deposit |
| 3 | 7eff184b0ee24d34aa2ae4ed0fc25d02 | 0.010934 | Sedimentary iron deposit |
| 4 | fe0efa84176e4ea78a5b6eb5c4bb2aed | 0.010934 | Sedimentary manganese deposit in Xialei, Guangxi |
| 5 | e827a69faf85494bad054d0d8aed6bb2 | 0.008639 | Layered carbonate lead-zinc-silver ore |
| 6 | b7416ae01c3f4bf9a6758af889ec32ab | 0.008639 | Sedimentary natural pyrite ore |
| 7 | 33593590864c4a87adff8482d9016b25 | 0.008639 | Sedimentary pyrite ore |
| 8 | 6b760cc451ae4f4e87dadddfc6ab3cd5 | 0.004999 | Carbonate type potash deposits |
| 9 | 149c98869b704bf0942c6cab67f4e0d4 | 0.004999 | Marine volcanic eruption sedimentary iron-copper-sulfur deposit |
| 10 | 81a2d91389e34f258658dbb63bb56fee | 0.004665 | Weathered crust type manganese ore |
| 11 | 4a1887ad25ad45c49c98062aa87521bf | 0.004116 | Hydrothermal antimony polymetallic deposit in clastic rock strata |
| 12 | 32cf88ba33e844a8abdd0a36136e3daa | 0.003888 | Layered or hydrothermal veined layer-controlled barite ore |
| 13 | 2e874ed4a60f41949cc1455d1d5eda1c | 0.003499 | Marine or volcanic sedimentary rock type copper-silver-gold deposits |
| 14 | 545b0ff20d904d3183ed1dd4ec0e89bb | 0.003499 | Hydrothermal antimony deposits in carbonate rocks |
| 15 | 7bb1b395c8a54c179e97c463bdacf050 | 0.003499 | Continental volcanic type pyrite ore |
| Deposit Name | Factor Type | Factor Name | Utilization Rate | Importance | Bayesian Probability | W |
|---|---|---|---|---|---|---|
| Shallow marine sedimentary manganese deposit in Dounan, Yunnan | Stratigraphic Signatures | Middle Triassic Ladinian stage | 3 | 3 | 0.077754 | 0.699786 |
| Deyoujiang fold belt of South China fold system | 2 | 2 | 0.077754 | 0.311016 | ||
| Speculated distribution of manganese-bearing rock series | 2 | 0.67 | 0.077754 | 0.10419 | ||
| Calcareous siltstone | 2 | 0.67 | 0.077754 | 0.10419 | ||
| Manganese-bearing outcrops | 32 | 16.03 | 0.077754 | 39.88469 | ||
| Bioclastic limestone intercalated with mudstone | 2 | 0.67 | 0.077754 | 0.10419 | ||
| Geochemistry Signatures | Mn anomaly | 2 | 2 | 0.077754 | 0.311016 | |
| Geophysical Signatures | Aeromagnetic anomaly | 9 | 9 | 0.077754 | 6.298074 | |
| Gravity anomaly | 3 | 3 | 0.077754 | 0.699786 | ||
| Tectonic Signatures | Fault | 19 | 18 | 0.077754 | 26.59187 | |
| Ore Body Morphology | Lenticular | 21 | 8.53 | 0.077754 | 13.92807 | |
| Interbedded | 41 | 19.53 | 0.077754 | 62.25996 |
| Deposit Name | Factor Type | Factor Name |
|---|---|---|
| Sedimentary manganese ore of “Datangpo style” | Rock conditions | Interglacial period, thick moraine conglomerate |
| Ore body morphology | Lenticular, interbedded | |
| Stratigraphic signatures | Nanhua epoch Datangpo period | |
| Manganes-bearing outcrops | ||
| Speculated distribution of manganese-bearing rock series | ||
| Tectonic signatures | Manganese forming basin | |
| Synsedimentary fault | ||
| Petrographic paleogeography | ||
| Geophysical signatures | Gravity anomaly | |
| Gravity Anomaly Transformation Zone | ||
| Geochemistry signatures | Mn anomaly | |
| P anomaly | ||
| Y anomaly |
Publisher’s Note: MDPI stays neutral with regard to jurisdictional claims in published maps and institutional affiliations. |
© 2022 by the authors. Licensee MDPI, Basel, Switzerland. This article is an open access article distributed under the terms and conditions of the Creative Commons Attribution (CC BY) license (https://creativecommons.org/licenses/by/4.0/).
Share and Cite
Liu, C.; Chen, J.; Li, S.; Qin, T. Construction of Conceptual Prospecting Model Based on Geological Big Data: A Case Study in Songtao-Huayuan Area, Hunan Province. Minerals 2022, 12, 669. https://doi.org/10.3390/min12060669
Liu C, Chen J, Li S, Qin T. Construction of Conceptual Prospecting Model Based on Geological Big Data: A Case Study in Songtao-Huayuan Area, Hunan Province. Minerals. 2022; 12(6):669. https://doi.org/10.3390/min12060669
Chicago/Turabian StyleLiu, Chang, Jianping Chen, Shi Li, and Tao Qin. 2022. "Construction of Conceptual Prospecting Model Based on Geological Big Data: A Case Study in Songtao-Huayuan Area, Hunan Province" Minerals 12, no. 6: 669. https://doi.org/10.3390/min12060669