1. Introduction
Nonrenewable natural resources, such as fossil fuels, are consumed faster today than in the past decades, and will reach very soon total discharge. Due to the rapid advancement of nano, green, and biotechnologies, demand for rare-earth elements (REEs), mainly precious and platinum group metals, is drastically increased but, unfortunately, in the coming future there will be not enough resources on our planet to satisfy these requests. China owns approximately 97% of world REEs which geopolitically challenges US Mountain Pass Mine, who was leading in global REE markets, kicking out other mondial countries from the user chain, and keeping REEs only for national purposes which, in the end, is against World Trade Organization (WHO) regulations (Hurst [
1]). This is one of the reasons why space mining has been deemed as a logical step for searching for new places off-world where resources can be exploited.
Moving to the Moon or beyond demands chasing the resources (mainly volatiles, water, and metals) which will be used to sustain the missions, to move deeper in space or to bring materials back to Earth (Crawford [
2]).
Theoretically, technological and operational experiences gained through terrestrial mining will be applicable partially due to different environmental space conditions. In addition to excavation techniques which will be adaptable to the type of a space mission, it should not be forgotten that positioning in mines plays a significant role. Indoor positioning and navigation is a challenging part of overall operation due to connection between external and in-mine (underground) control networks.
Underground navigation in mining is used to estimate the ongoing work and to control the moving direction of operational vehicles with penetrating radar and to track miners. In some cases, a mine’s size can be greater than 10
and deeper than 1 km (Maus et al. [
3]). In general, this type of mine consists of many interconnected tunnels referred to as rooms and, for that reason, that site can be facing navigation issues. The movement of a penetrating radar is important to be tracked and recorded for the reason of possible collapse of tunnels due to their long distances.
The Velenje Coal Mine (VCM) in Slovenia opens a visional spirit of active mining, showing the importance of navigation and positioning, which are involved in excavation of mines. Additionally, VCM owns a patent named the Velenje Mining Method (VMM) reserved for extraction of thick coal steams. Likewise, VCM has established a micro-seismic monitoring system to observe seismic activity and behavior of the surface subsidence due to mining excavation (Vižintin et al. [
4], Stupar et al. [
5], Rošer et al. [
6]). This methodology could be an excellent exemplar to apply onto Lunar settlement observation system specifically in the cases of Lunar mining and lava tube positioning.
This study is looking for innovative solution for developing mining control networks for current terrestrial mines. Velenje Coal Mine (Premogovnik Velenje), Slovenia, was used as a case study, where collected experimental data were based on three distinct tunnel lengths. The expanded version of this model could be used as a potential application in space mining. As a second spin-off, this methodology will be a setup for future robotic and human missions in Lunar lava tubes. Currently, the Lunar lava tubes are one of the most attractive places on the Moon where nested community will be naturally protected against meteorite bombardments, seismic activities, Solar wind, and radiation. Nevertheless, the nature of the lava tubes requires, also, an indoor (underground) positioning and co-action with an external network.
Evidence of lava tubes were reordered by several spacecrafts’ cameras from the Gravity Recovery And Interior Laboratory (GRAIL), the SELenological and ENgineering Explorer (SELENE), and Lunar Reconnaissance Orbiter (LRO) missions.
GRAIL analysis shown that the width of lava tubes are between 1–2 km, while the shape and lava tube’s configuration are not well-defined (Theinat et al. [
7]). From SELENE images, the size of Lunar tubes is estimated to 300 m with a theoretical maximum of 4000 m (Kaku et al. [
8], Blair et al. [
9]).
Drilling the Lunar lava tubes offers expansion of the tunnel connection and excavation of underground resources (Theinat et al. [
7], Foster [
10]). The sizes of sublunarean voids or Lunar lava vary from region to region with widths from 10 m to few km, lengths from few to hundred km, reaching depths to few hundreds m. Without precise dimensions, Lunar lava pits are formed from a few meters wide with various depths, depending on lying down lava tubes. Lava tubes widths of 100, 300, and 1000 m are common, according to a numerical simulation performed by Theinat et al. [
7].
However, there are many challenging factors of Lunar mining comparing to the Earth. Some of them come from different environmental conditions: absence of an atmosphere, 1/6 of Earth’s gravity, high radiation, extreme variations of temperature, extreme wear on seals and bearings, and geological definition. Additionally, managing the excavation works is harder due to remote environments, resource transport, resource stability, and energy availability (Ralston and Hargrave [
11]).
This paper presents a modified solution for designing underground control networks in Velenje Coal Mine. Improvements analyzed here treat a specific network configuration, which reduces total measuring time, but still achieving cm-level accuracy along the network.
A classic approach in tunneling surveys is designing underground traverses connected from both sides to surface networks. A study Chrzanowski [
12] simulated such an environment, with a breakthrough error of 137 mm for a 10 km long tunnel. It was shown that using gyro-theodolites could significantly decrease the overall error. The same approach, zig-zag traverses, is applied to the control network of a high-speed railway (Velasco et al. [
13]). Here, two parallel tunnels were drilled, with cross-passages at each 400 m. Maximum discrepancies between two tunnels, checked along their cross-passages, was 50 mm, with the error exponentially increasing from the starting point. This methodology was, also, applied to the Superconducting Super Collider. The tunnel half-sector breakthrough errors between two shafts 4.3 km apart from each other, were between 12 and 23 mm for lateral, and between 1 and 14 mm for the longitudinal error (Robinson et al. [
14]. A common point of mentioned studies is usage of a gyro-theodolite for a purpose of decreasing tunnel lateral refraction. It is not necessary for shorter tunnels, but it should be performed for corridors longer than 15 km (Velasco-Gómez et al. [
15]). A detailed analysis of gyro-theodolites usage, expected accuracy, and impact to the network design, in underground tunnels is given in (Lewén [
16]). Instead of using traverses or double traverses, a network designed as so-called duo-linear joint chain yields about 30 mm lateral accuracy, which meets the lateral breakthrough precision requirements (Li and Huang [
17]). An optimization based on distances between the network and the border of the area of interest can improve the quality of observations and reduce transportation costs between the points (AbdAllah and Wang [
18]). Such optimization could be performed on wide tunnels only, where there is enough space for adapting the network design.
2. Materials and Methods
2.1. Control Networks in Mining Tunnels
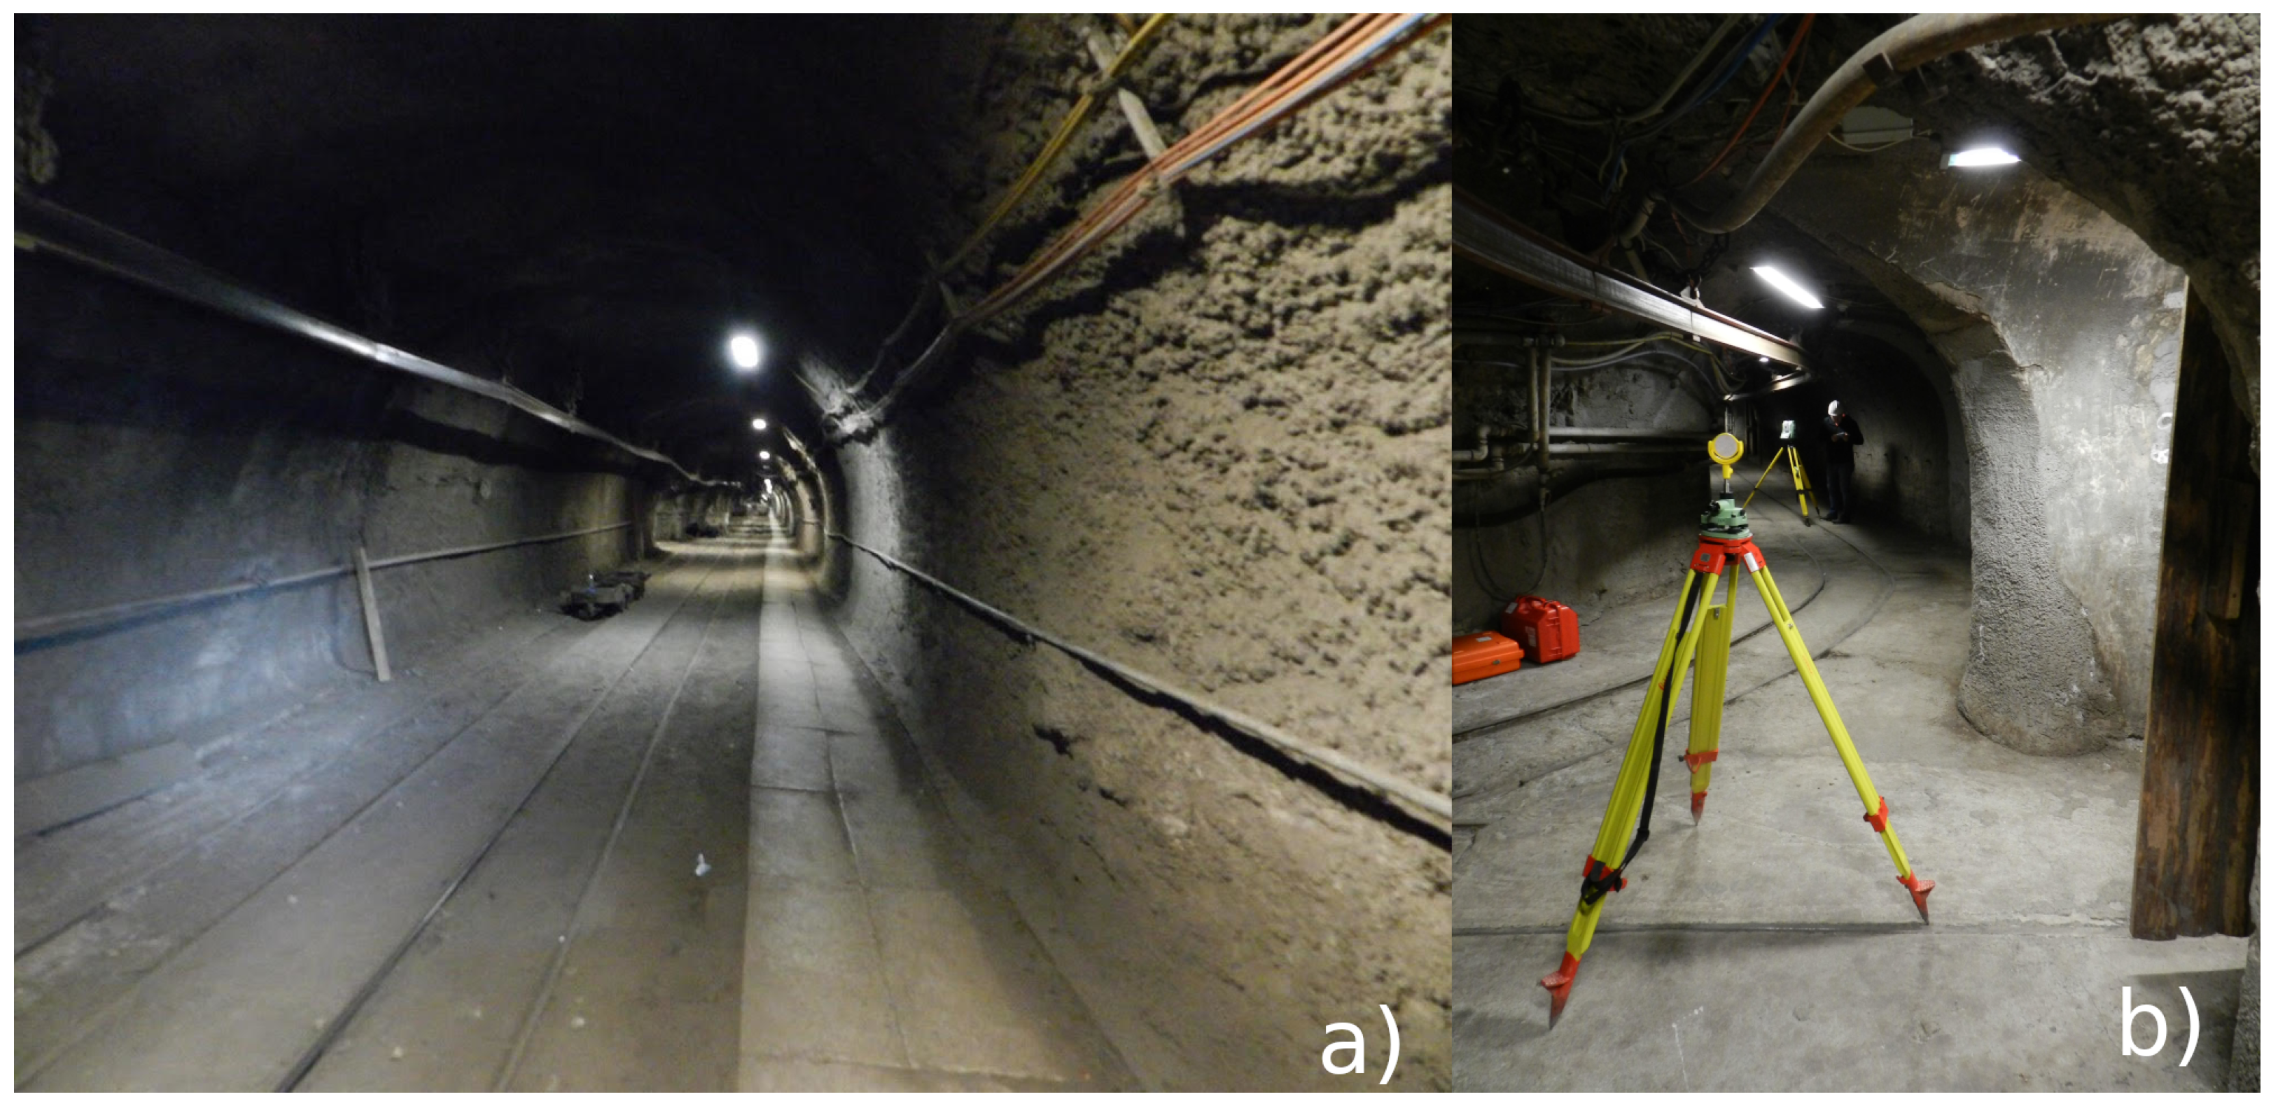
Precise positioning in underground mines is limited due to tunnel configurations, yielding to irregularly shaped control networks, with mixed long and short baselines. Accuracy features are, therefore, affected in a way that network reliability is not consistent throughout the network. A traditional approach is based on traverses developed along the tunnels, as applied in Velenje Coal Mine (
Figure 1).
Each mine site has to develop a unique local navigation system based on a specific combination of different sensors. Those local, underground navigation systems are keen to integrate augmented reality user interface to quickly react in case of emerging situations. One of the interesting examples is the potash mine of Saskatchewan in Canada. In this particular mine, the positioning system is based on a working combination between divers’ sensor systems and a particle filter for performing navigation, positioning, and tracking in a case of total absence of a GNSS signal (Hawkins et al. [
19]). The system includes the following instrumental subsystems:
Two micro electro mechanical systems (MEMS) accelerometers to measure acceleration in downward and forward direction determining pitch from a horizontal xy plane.
An MEMS gyroscope to determine the rate of change in the x–z plane.
A speed sensor to provide positive direction of vehicles moving.
Two ultra-sonic sensors for measuring distances to walls, with initial position and orientation transducers working on short radio frequency beacon.
An integrated digital map of a site.
The particle filter is based on sequential Monte Carlo methods applied in nonlinear systems or in systems where non-Gaussian noise is corrupted. In some cases, the particle filter is named a recursive Bayesian estimation algorithm. Generally speaking, to make the algorithm work, it is necessary to estimate conditional probability density of the user position measured at each time instantly. This can be established through generation of particles (samples), computation and normalization of importance weight, and, finally, to improve estimation again to resample particles using several methods, such as residual resampling or systematic resampling algorithm. The authors reported an overall positioning error less than one meter, resulting from simulation.
Another approach to integration or combination with a navigation system can be found in (Thrybom et al. [
20]). It is based on the following premises:
Real-time radio frequency identification (RFID) is used for real-time localization at the sub-meter positioning level.
WLAN is suggested as a good indoor positioning system with accuracy from 2 m and upwards with few seconds update rate.
Ultra-wideband (UWB) technology based on a triangulation technique performs better than WLAN due to shorter duration of the signal pulse (less than 1 ns).
Inertial navigation system (INS) is based on the principle of integration of acceleration and angular velocity in tracking a mobile unit using the known starting position and starting orientation.
Compared to previous systems, INS can eliminate the shadow areas while mine autonomous loaders using inertial measurement unit (IMU), laser scanner, and odometry may estimate its position (Kim and Choi [
21]).
To increase the accuracy of positioning in the underground mines, it is important to notice that the challenges of these solutions have a high impact on final results. The RFID sensors could be affected by narrow band interference and have internal low security.
For WLAN solution, it is required at least three synchronized receivers based on separate points to efficiently determine the location using the same signal.
WLAN is suffering from multipath effects and non-line of sight (NLOS) conditions, especially in moving trajectories.
INS can be a drawback in its sensitivity to integration drift made by unexpected acceleration or by angular velocity which can quickly increase an error in positioning or orientation.
For three in-field experiments, three sensors were combined: IMU, LiDAR, and encoder. Combined solutions ((IMU + LiDAR + encoder), (IMU + encoder), and (LiDAR + encoder)), have given the average errors estimations of 0.11, 0.17, and 0.70 m, respectively.
The 3D positions and accuracy of points within a borehole use a cord of the circular arc based on the combination of mining measurements and geodesy. Obviously, it could be useful to also take into consideration the continuous monitoring system such as in tunnels where geotechnical and geolocated sensors could be used as well in positioning in tunnels (Željko Vukelić and Vulić [
22], Medved and Vulić [
23]). This model can be expanded and be a part of surveying, not only terrestrial, but also Lunar networks, depending on their final utilization.
2.2. Positioning through a Vertical Mine Shaft
In addition to providing a solution for implementing a positioning network in the underground mine, each underground control network should contain one or more (horizontal, slant, or vertical) mine shafts for connections to a ground coordinate system, if such connection is needed. During the transfer of coordinates of reference ground points into the underground system, certain errors can occur due to long vertical shaft distances. Elements which impact the accuracy of the control points are shaft pluming, realization of first working direction, and measuring the shaft’s depth.
To eliminate the above-mentioned source of errors, different methods are used. A traditional solution utilizes a laser gyro-theodolite, combining it with additional instruments such as total stations and laser plummets, which is explained in (Farkas et al. [
24]).
Another approach suggests using steel tapes and 3 m code invar leveling rods. Here, weather factors, such as temperature and circuity of partial air flow in downcast and upcast shaft, influence measurement accuracy, and therefore these corrections have to be integrated in final results (Mučková et al. [
25]). For an electro-optical distance meter (EDM), corrective terms for atmospheric and air pressure values must be entered manually, to allow the EDM’s firmware to automatically correct the final outputs.
Materialization of a local vertical, in the case of the vertical mine shafts, is mostly performed by zenith/nadir plummets. Nowadays, it is possible to find different types of zenith/nadir instruments on the market and the majority of them provide high plumb precision
(zenith) and
(nadir) (SOKKIA [
26]).
Analyzing SELENE data, a depth of 80–88 m of lava tube holes (or skylights, as they are called, too) is estimated (Haruyama et al. [
27]). The skylights were observed at divers’ Solar illumination conditions. It was concluded that the lava tube holes are not typical craters, because the depth/diameter ratio is larger for the skylight than in a case of classical craters. Around the lava holes, existence of lava sheets with 20 to 25 m thickness were noticed, which represent natural protection of the lava tube from meteorite bombardment and its potential collapse. Currently, there is not enough information on the exact number of the holes over the lava tubes. What hypothetically can be evocated is that the lava tubes are intertwined and potentially can be connected among themselves, creating a large network of underground tunnels.
2.3. Indoor Navigation in Future Lunar Missions
Whether underground or on-the-surface applications are considered, most Lunar navigation and positioning proposals are based on a camera vision system and calculation taken from pictures. Kalita et al. [
28] proposed a navigation system in off-world lava tubes and caves using spherical robots called SphereX. Those robots will simultaneously hop, fly, and roll, collecting the images, compiling them into a 3D point cloud, and creating maps and navigation algorithm. Small-size simulation (no longer than 50 m and no wider than 8 m) was carried out for lava tubes. Two scenarios were proposed. In the first, robots keep a communication link with the base robot and continuously provide data. The second one is based on free fly of the robots, collection of data, and bringing them back to the base robot. Due to low light conditions and moving robots by hopping, their localization will be complicated if only encoder measurements would be applied. For that reason, the graph simultaneous localization and mapping (SLAM) solution was required. The outcome from this simulation shows that, in any of these scenarios, lack of light, power, and unstable communication between robots will make this principle unsustainable for deeper lava tube exploration. It was recommended to establish a “mirrors network” along the cave/lava tube to allow beaming of sunlight which will provide at the same time power and light to work with (Kalita et al. [
28], Kalita and Thangavelautham [
29]).
2.4. Methodology Basics
All applications described above are dependent on a reference system and its implementation on or beneath the ground. When precise positioning is requested, a network of control points is needed, to provide consistent localization of objects within the area of interest. This is, especially, a challenging activity in mining applications. Inconvenient configuration of underground mining tunnels implies rather specific control network points distribution. Due to combination of short and long baselines, accuracy requirements for measurands vary along the network. This paper deals with two improvements in the control networks design:
Involving short fixed-length baselines in network polygons, thus reducing total measurements number, while increasing network reliability features (internal and external) and reducing total time spent for measuring.
Connecting the underground network with the external one through vertical mine shafts using zenith plummets.
The first issue assumes utilization of standard surveying equipment, total stations, with the addition of fixed-length bars. Involving such short baselines in the control network design implies less measurements within the network while, at the same time, keeps network features (errors of network points, in the first place) homogeneous.
Another issue is connecting the underground control networks to external reference systems. Connections on mine entrances are relatively easy to implement, due to availability of regular or special control networks near the mines. During mine exploitation, the tunnels grow, and the surveying points are set deeper and deeper in the mine. The tunnel points are connected with the external network just from one side, which introduces systematic positioning errors along the mine tunnels, caused by instrument imperfection, environmental conditions, operator observation errors, and other influences coming from a measurement process.
Therefore, it is required to perform (as much as possible) further connections of internal control networks with external points. It is often hard to implement due to depth of mines. Connections using vertical shafts represent one way of resolving this issue. Methodologies for performing that task are numerous, but most of them assume measurements from the ground downward to the shaft, using special plumb bobs, laser measurements, or nadir plummets. Here, we are presenting one novel way of network interconnection through the vertical shaft, inside-out approach, using zenith plummets.
Numerical analysis of simulated mine networks is performed exclusively in local coordinates. No connections with the external networks are treated, due to diversity of possible environments.
2.5. Control Network Configuration
The control network shape is limited by environmental conditions, especially the shape of the mine tunnel. Long and narrow tunnels negatively affect performance of the network, due to throughout combination of long and short baselines. Additionally, visibility between consequent network points along the tunnel can differ a lot.
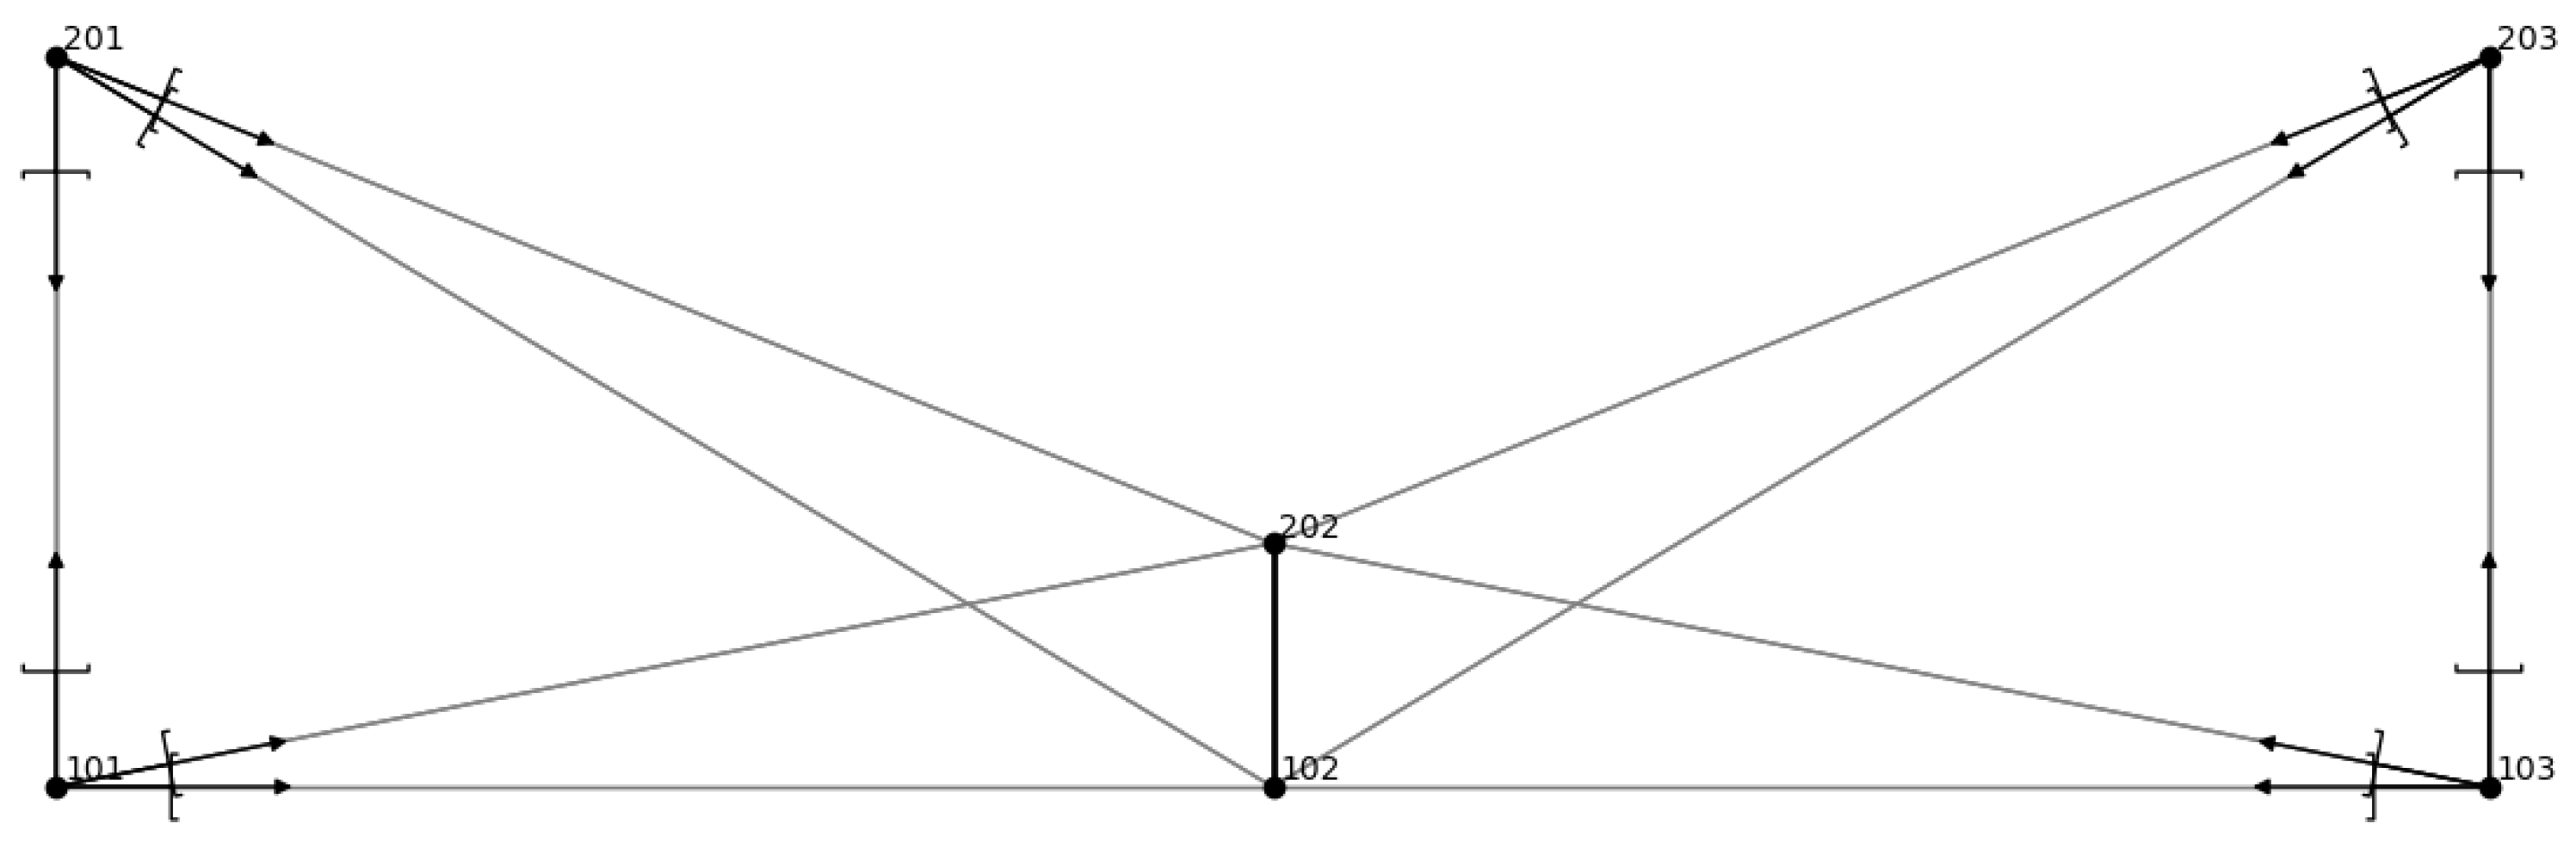
Having that in mind, the network concept proposed here is based on a variable number of six-points segments (101, 201, 102, 202, 103, 203 in
Figure 2), depending on the tunnel length. Each segment consists of five points fixed near the left and right sides of the tunnel (101, 201, 202, 103, and 203 in
Figure 2). The sixth point (202 in
Figure 2) is not permanent. Instead of installing one more station (and, therefore, introducing more time-consuming measurements), the baseline 102–202 is represented by a fixed-length bar mounted at one of its edges in the same manner as other points (101, 201, 103, 203 in
Figure 2).
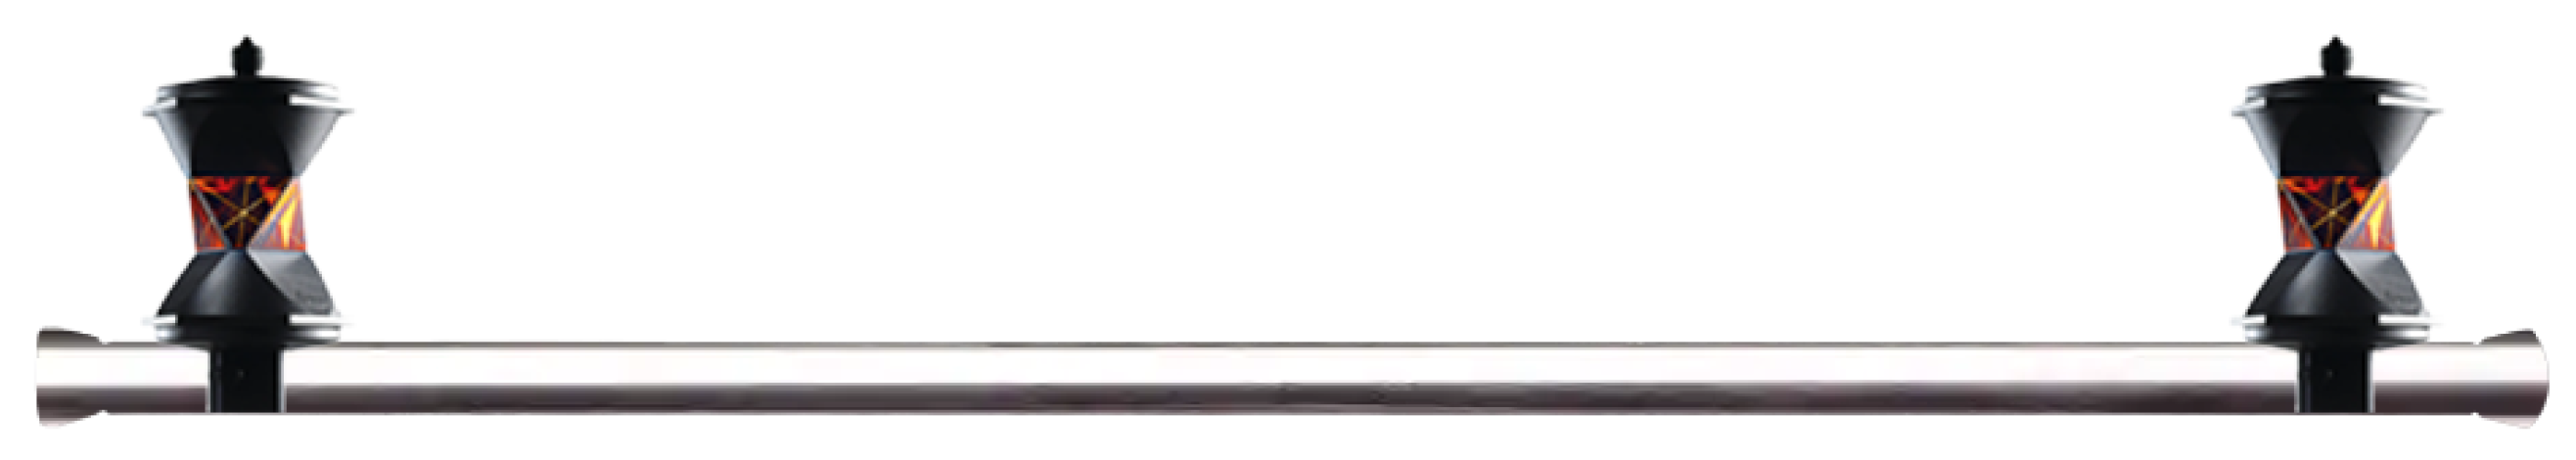
The benefits of the presented configuration are gained in the fact that total station measurements will be performed, in a six-points network, from only four, instead of six points. Statistical analysis proving feasibility of such configuration will be elaborated later in the article. The bar 102–202 holds two
prisms, serving as regular markers. A model of the bar is depicted in
Figure 3. The length of the bar is calibrated before a measuring session and this value is included in network adjustment, together with its measuring uncertainty, calculated during the calibration procedure.
Figure 2, also, depicts what actual measurements are presumed within the segment. Square brackets represent measured distances, arrows correspond to observed horizontal directions, while the bold 102–202 line stands for a calibrated bar length. In total, one segment consists of 25 (6 electro-distance meter (EDM) measured distances, 6 horizontal directions, and 1 bar length) measurements, with 16 unknowns (6 × 2 coordinates + 4 orientations), which gives 9 redundant measurements for the segment. Each subsequent 6-point block involves a further 21 measurements and 10 unknowns. In general numbers, the control network designed in the presented manner contains
measurements (
directions,
distances, and
bar lengths), and
unknown parameters (
orientations and
coordinates), where
l is a number of network lines (for example,
in
Figure 2). Application of the least squares method (LSM) requires a redundant system of equations, i.e.,
. A border condition for applying this network configuration is obtained by solving the inequality
. After expressing
n and
u in the function of
l, it follows that
. Since the number of the network lines is always an odd number (because the network segments assume bar lines between two regular lines, the realistic minimum number for the network lines is five.
2.6. Numerical Stability of the Network
Because of specific requirements regarding network design and uncommon measurements involved (fixed bar lengths), a special attention is paid to numerical stability of the network. If the cofactor matrix of distorted residuals is expressed as
with
then the redundancy number of a measurement
i is given by
where the subscript
i indicates corresponding diagonal elements of the matrices
and
P. If
, the total redundancy number, is the sum of all redundancy numbers, then the network average redundancy number is calculated as
For longer network chains used in this case study, the limit of
as the number of the network lines
l approaches infinity is
Such high redundancy factor assures a good and reliable system of equations, strong enough for tracing potential outliers. Even for the smallest network (
)
, characterizing a geometrically strong network (Ogundare [
30] (11.17). Therefore, relevant statistical conclusions regarding network quality can be drawn.
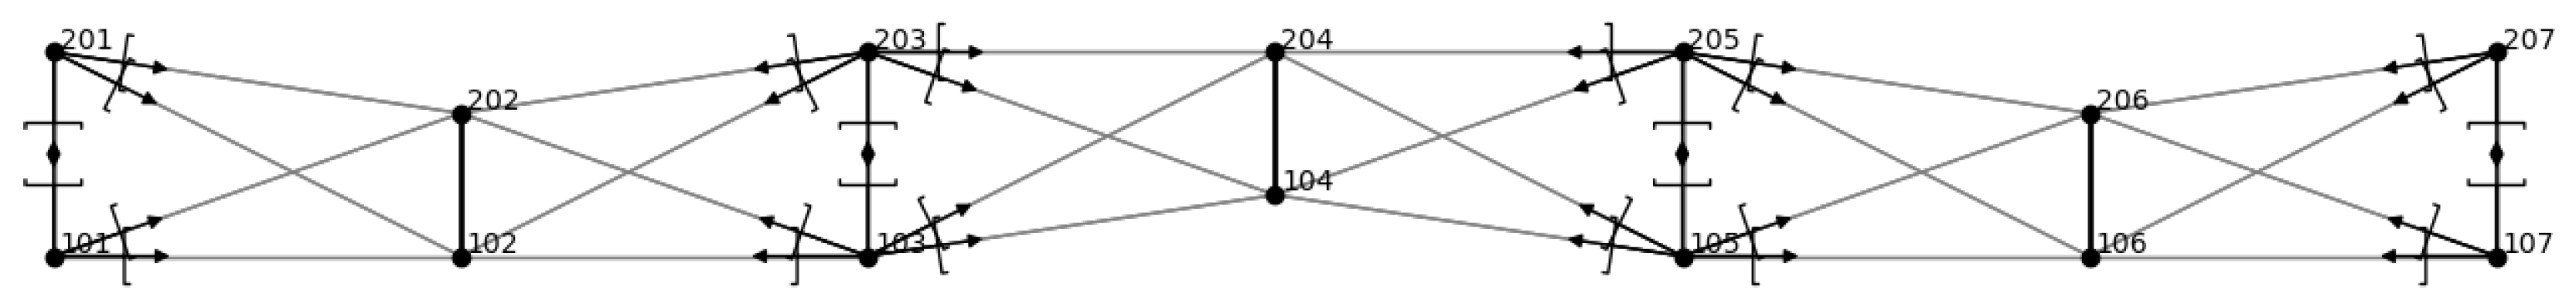
A final note about network configuration treats a position of the bar. One of its edges is mounted permanently, in the same manner as other control points. The other edge is, as said before, available only during development of the network. It provides additional measurements with no extra cost in time and measuring. Since the bar itself is, generally, shorter than the tunnel width, it can be mounted on the left or the right side of the tunnel. In our simulation, the location of the bar is swapped in every other line, changing its location from left to right, as is shown in
Figure 4. In that way, some systematic influences on transversal error distribution are reduced.
2.7. Functional and Stochastic Models
Having in mind an indoor-measurements-based network, assuming no navigation systems availability, the measurements between the control points are limited to angles (or horizontal directions) and distances. Therefore, two types of equations exist in the adjustment functional model, horizontal distances and angles (or horizontal directions). Development of a mathematical model is based on widely known and used (in surveying and mining geodesy) models (for example, Krakiwsky and Thomson [
31] (pp. 6–15, 19–24) or Ogundare [
30] (pp. 163–169)). Unknown quantities are coordinates of the points involved in the particular measurement. Accordingly, if the distance
is measured between the points
and
, then the equation connecting the measured distance
and corresponding points
and
will be
An oriented direction (or an azimuth)
from the point
to
is expressed as a function of two points coordinates as
If the horizontal directions are observed, then the measured direction is obtained as
where
, so called an orientation angle, is the starting direction with the value
. The horizontal directions are supposed to be measured in both faces (I and II) in order to eliminate collimation and inclination errors. Each distance should be measured with at least three registrations, to avoid possible outliers coming from unusual environmental conditions. Additionally, distances between two points
i and
j are measured in both directions (
and
), to minimize error sources related to the operator or instrumentation.
In an LSM matrix interpretation of the network adjustment, the design matrix
A is a Jacobian, with rows corresponding to the measurands and columns to the unknowns. Therefore, two types of the rows are contained in
A:
where
and
are design matrix
A row segments containing, respectively, partial derivatives (
5) and (
7) over the unknowns. In this case study, horizontal directions are used, instead of horizontal angles.
The measurements are assumed to be mutually independent, so covariation is expressed as a plain weight matrix P with the elements , where is a standard deviation of the measurand.
The network is configured and tested as a free one. No external frame is used for a datum definition. The reason for such treatment is a purpose of the test, which means testing only the innovative methodology. We applied a free adjustment model without any constraints to fixed points, which implies a singular normal equation matrix. Therefore, a Moore–Penrose pseudo-inversion is applied. The a posteriori standard error of the i-th unknown coordinate is calculated as , where is the a priori dispersion factor. Applying this approach allowed us to concentrate on distribution of points’ positional errors, whereas no influences coming from external references are involved. We tested 27 different network models. Each of them is treated independently from the others. No third party software is used for calculation. Creation of simulated measurements and matrices, data I/O functions, matrix calculations, and numerical and statistical analysis are programmed in Python, using sympy, numpy, and matplotlib libraries.
2.8. Vertical Shaft Connection
Transferring surface network’s coordinates to the tunnel network assumes existence of a point included in the surface control network, which is situated at the platform over the vertical shaft. Projecting the surface point to the underground mine tunnel can be performed in many ways. The common point of most of the methods is observation from the surface downwards. Often, nadir plummets are used. Their characteristics, whether optical or digital, are limited in range and accuracy, which degrades the congruence of the underground control network with the surface one (Robinson et al. [
32], Koželj et al. [
33]).
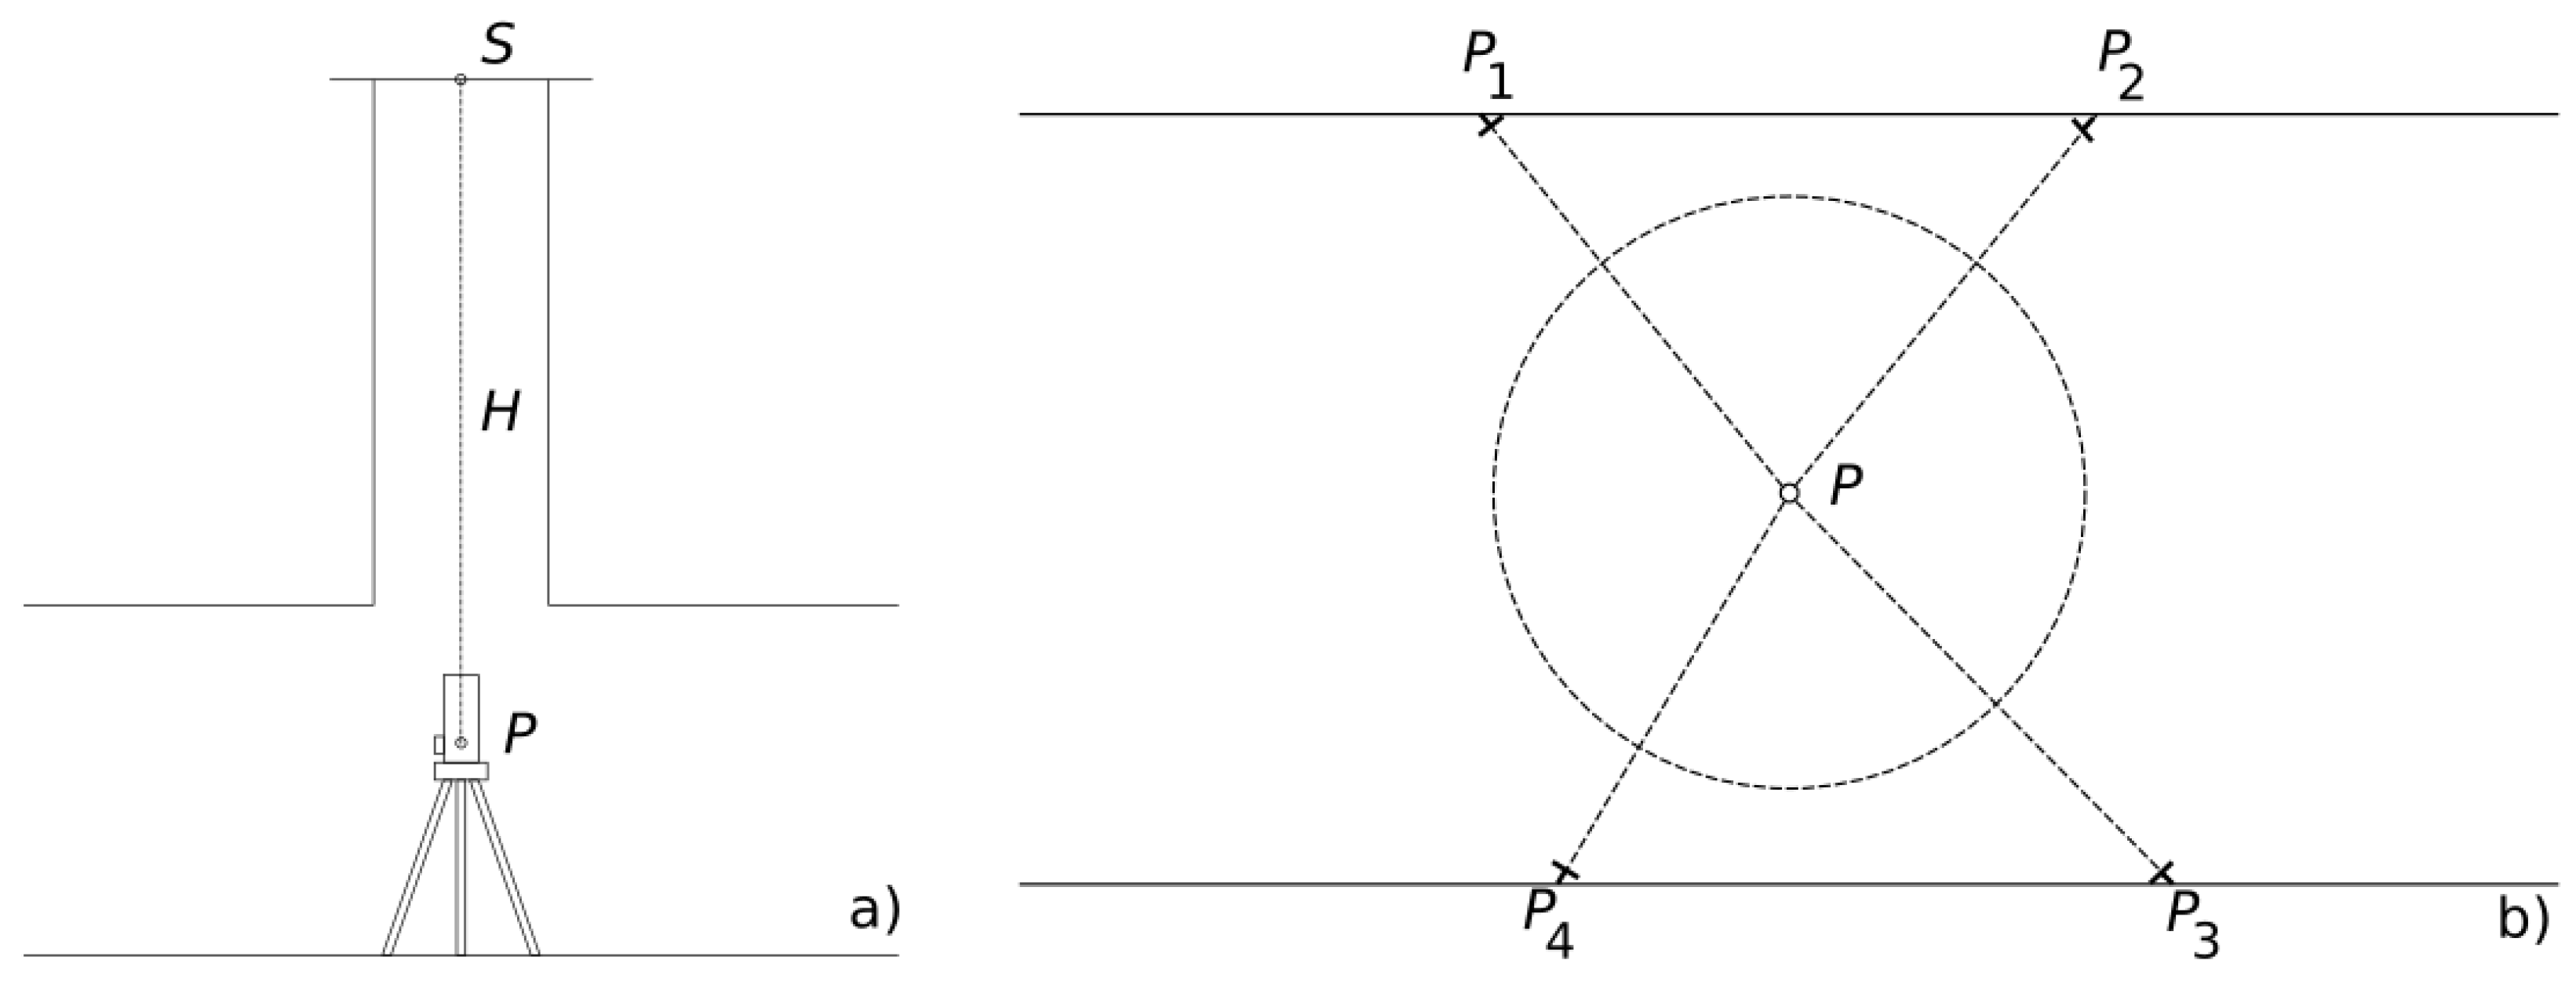
Here, we suggest a different approach (in–out). Instead of materializing a local vertical from its top to bottom, a zenith plummet is used, meaning the vertical is observed from the mine, upwards the vertical shaft (bottom to top). Such approach assures both long-range observation and accuracy compatible with the surface network, due to optical characteristics of the zenith plummets. A core of the method is placing the instrument on a tripod in the underground tunnel, at the bottom of the vertical shaft (
Figure 5 left). The position of the zenith plummet
P is determined by pointing it to the surface point at the platform
S, which is marked in a way visible from the bottom of the shaft. Depth of the vertical shaft is marked as
H.
Considering the characteristics of the tunnel floor,
P cannot be fixed in a classical surveying way, by placing a mark on the floor. Instead of that,
P is temporary mounted on a tribrach, and distance and angle measurements are performed from
P to all nearby points (
Figure 5 right) and vice versa, incorporating, in that way,
P to the network as a fixed point with the known coordinates. Now,
P is a part of the network datum, because it is directly connected to the outside network. Particular location of
P is chosen according to the tunnel configuration, as well as distribution and availability of the vertical shafts. Therefore, the network itself can include more such connections to the external network, while applying the measurement and adjustment model suggested in this research. Since the free adjustment model is applied, all points coordinates will obtain some increments after adjustment. After fixing the necessary number of the network points to the external reference, the final coordinates are obtained by S-transformation (Ogundare [
30] (p. 559)).
How many vertical ties will be made depends on the configuration and availability of such connections. The underground network, as presented in this research, holds consistent accuracy throughout its area. Connections with external frames are needed in the case when the absolute position and orientation of the external network is necessary to be transferred inside the tunnel. That, also, applies to possible Lunar applications. If such connections are needed, they can be performed, according to availability of convenient vertical shafts. Their number and distribution depend on the terrain configuration, depth of the mine, and possibility of drilling the shaft.
3. Results
For the purpose of proving a concept, different simulating environments are created, combining various values of the following input parameters (
Table 1):
Tunnel dimensions (length l and width w).
Maximal distance between two network rows s.
Length of the bar b, and
measurement uncertainties of distances , angles , including precision of the bar length .
Three distinct tunnel lengths are simulated, each with nine models. Numeration of the models is defined with two digits: the first one (0, 1, 2), which labels the three distinct lengths (200, 500, and 1000 m, respectively), and the second one (1–9), for the model ordinal number within the particular tunnel length. The shapes of the networks are the same, following the scheme from
Figure 2. Combining the parameters from
Table 1, the total number of the measurements and the network points from
Table 2 is calculated.
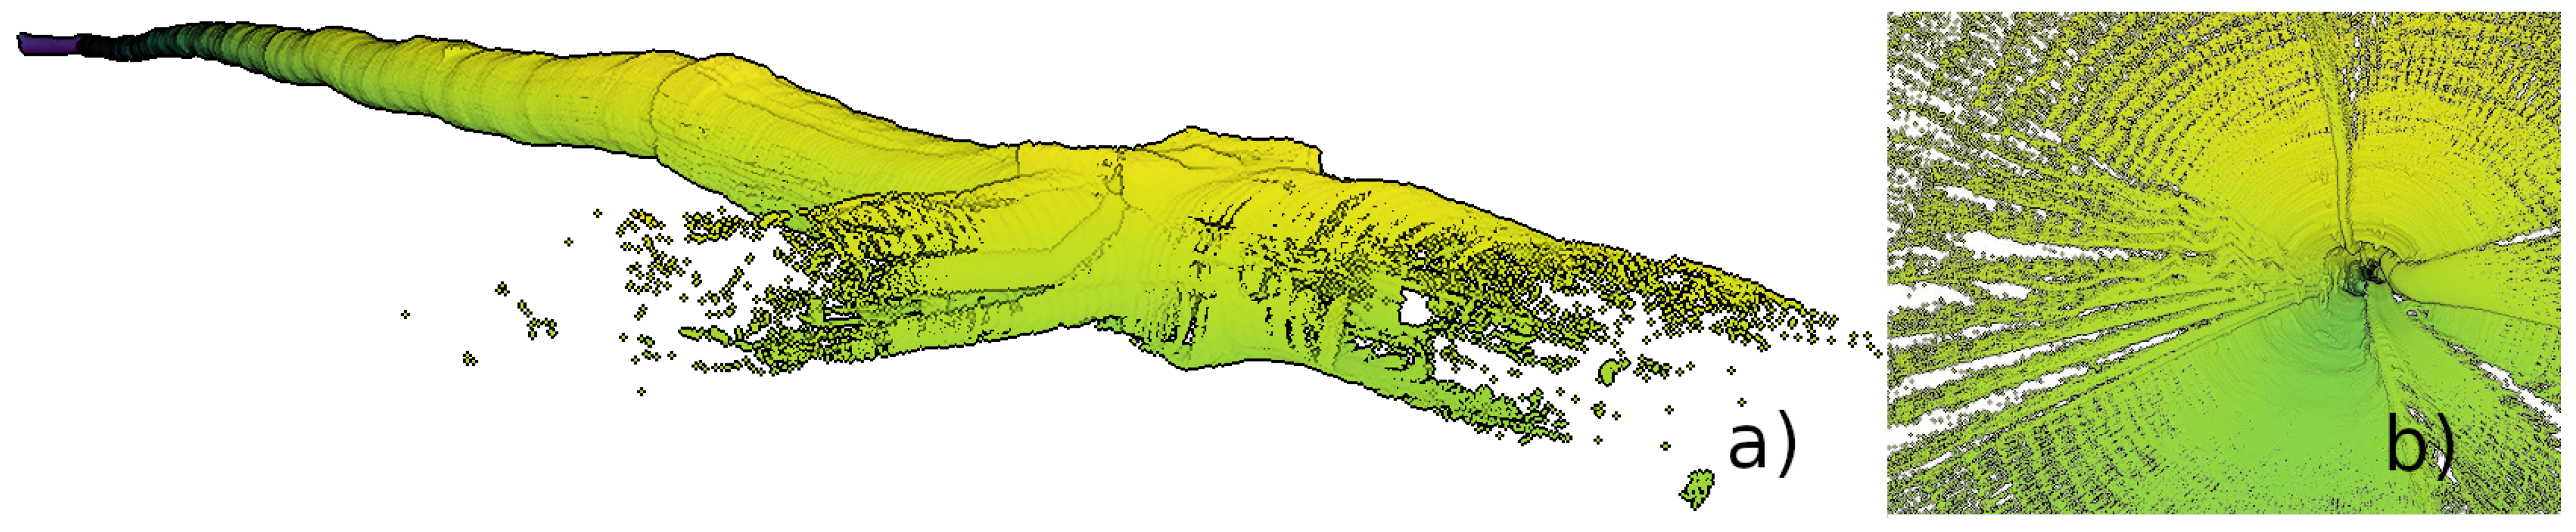
Figure 6 depicts a tunnel segment of the mine Velenje, where SLAM measurements were performed for the purpose of mapping the mine. The left portion of the picture is an overview of the whole segment, while the right side shows a view from inside. The segment is ca. 800 m long, with more than 4 million points in the point cloud. Its approximate proportions are used as starting values for simulated control network setups.
After inspection of the example from
Figure 6, as well as using experiences from other available references, the tested models in this research are chosen to be based on three distinct tunnel lengths: 200, 500, and 1000 m. Maximal distance between two network rows is limited due to tunnel spatial shape (horizontal and vertical curvatures) and internal environmental conditions which influence visibility along the tunnel, i.e., line of sight. Other parameters are varied between few empirically chosen values, making total of 27 different combinations of the parameters. All network models are constrained with the tunnel dimensions. One of the parameters that limits the accuracy of the model is
s/
w, a ratio given by the distance between two consecutive network lines and the width of the tunnel. On one hand, longer distances between the lines decrease the total number of measurements, making such networks more economic. On the other hand, higher ratios may yield to increased dispersion factors, which degrades the overall accuracy of the network. In our simulations, the highest ratio is 10 (models 1 and 21). Further analysis (
Figure 7 and
Figure 8) shows that those two models give poor figures.
The goal was to simulate different indoor environments and conditions that could degrade accuracy of the control network points’ coordinates and, consequently, to make all further surveying during mine exploitation less accurate and reliable. Following the algorithm from
Figure 4 and values from
Table 1, approximate point positions are calculated and, according to the calculated coordinates and predefined measurement uncertainties, all measurements are simulated.
Table 2 reviews quantity of input data for the adjustment models. The model numbers are given in the first column
, the total number of measurements is marked with
n, the total number of unknowns
u, while
p represents a number of points involved in each particular model. The last column
pn depicts the total points number per model.
4. Discussion
All 27 models are adjusted as free networks, using the mathematical model described in
Section 2.7. The stochastic model, statistical tests, and adjustment results are based on 95% confidence level.
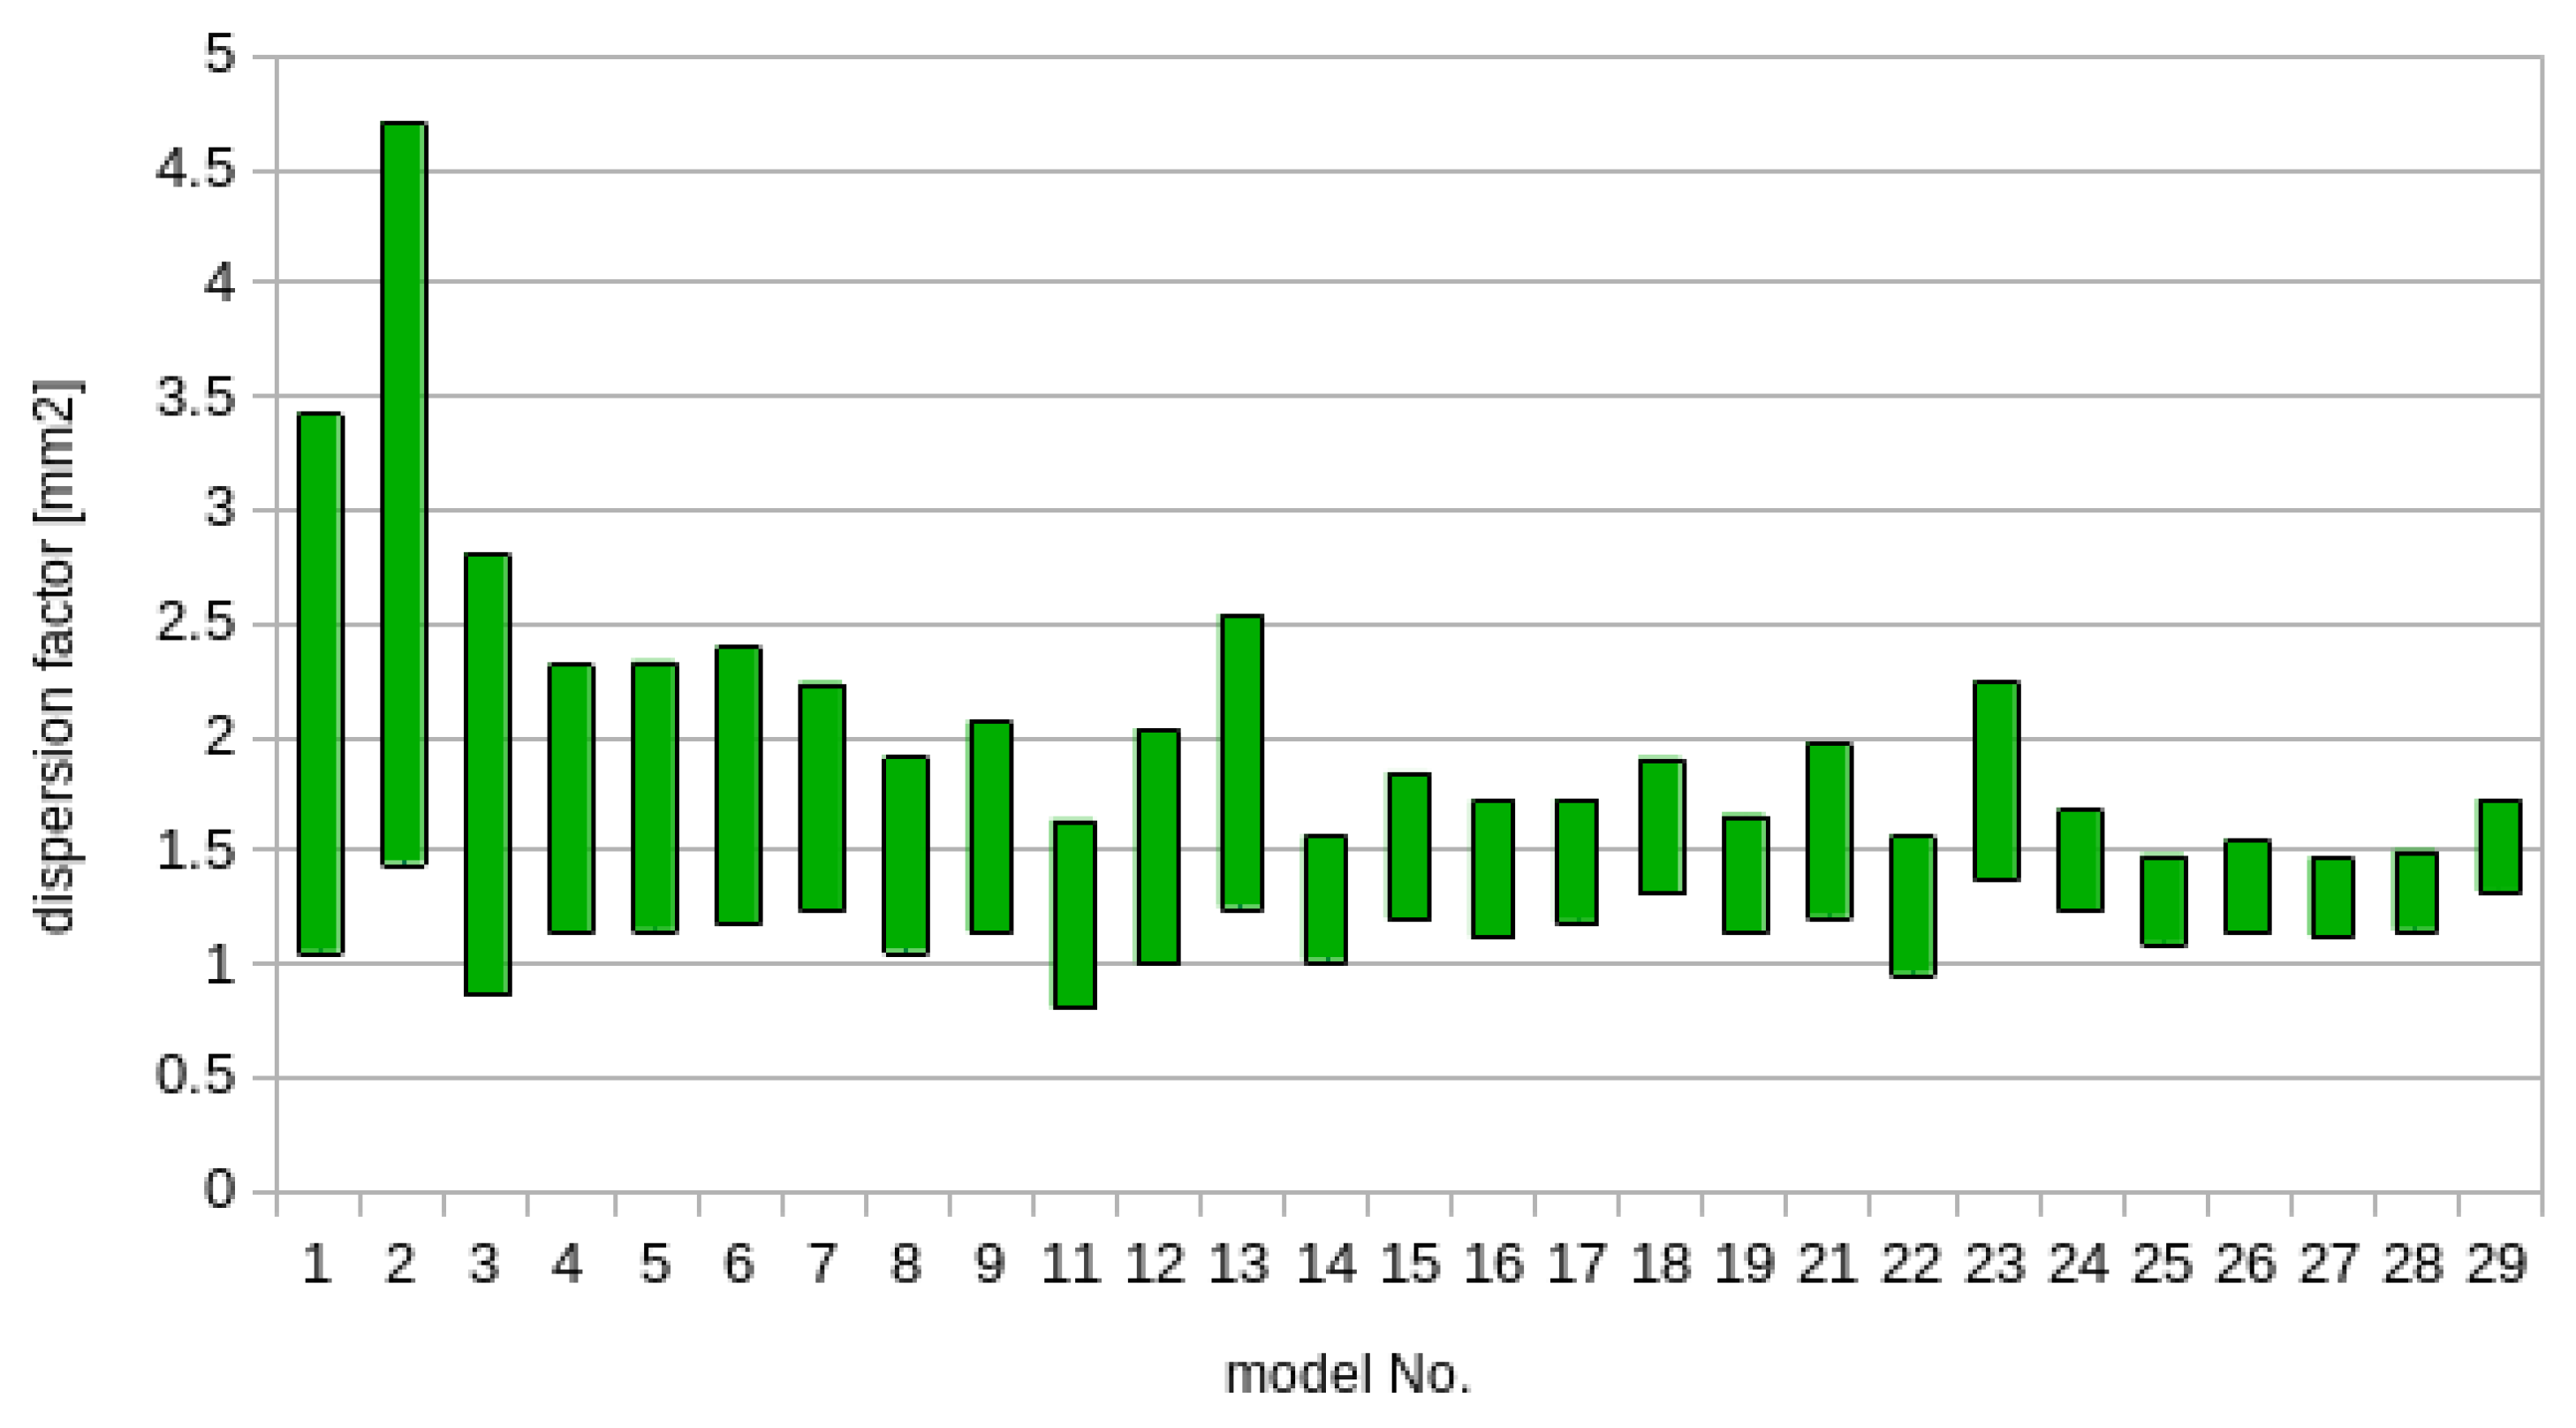
Figure 9 depicts confidence intervals of dispersion factors for all the network models (Kavouras [
34] (5.1)). It should be noticed that the models with more measurements (and points) have narrower confidence intervals.
Adjustment quality is estimated by standard error of the point position, which is, for the point
i, calculated as
where
and
represent standard errors of
x and
y coordinate of a point
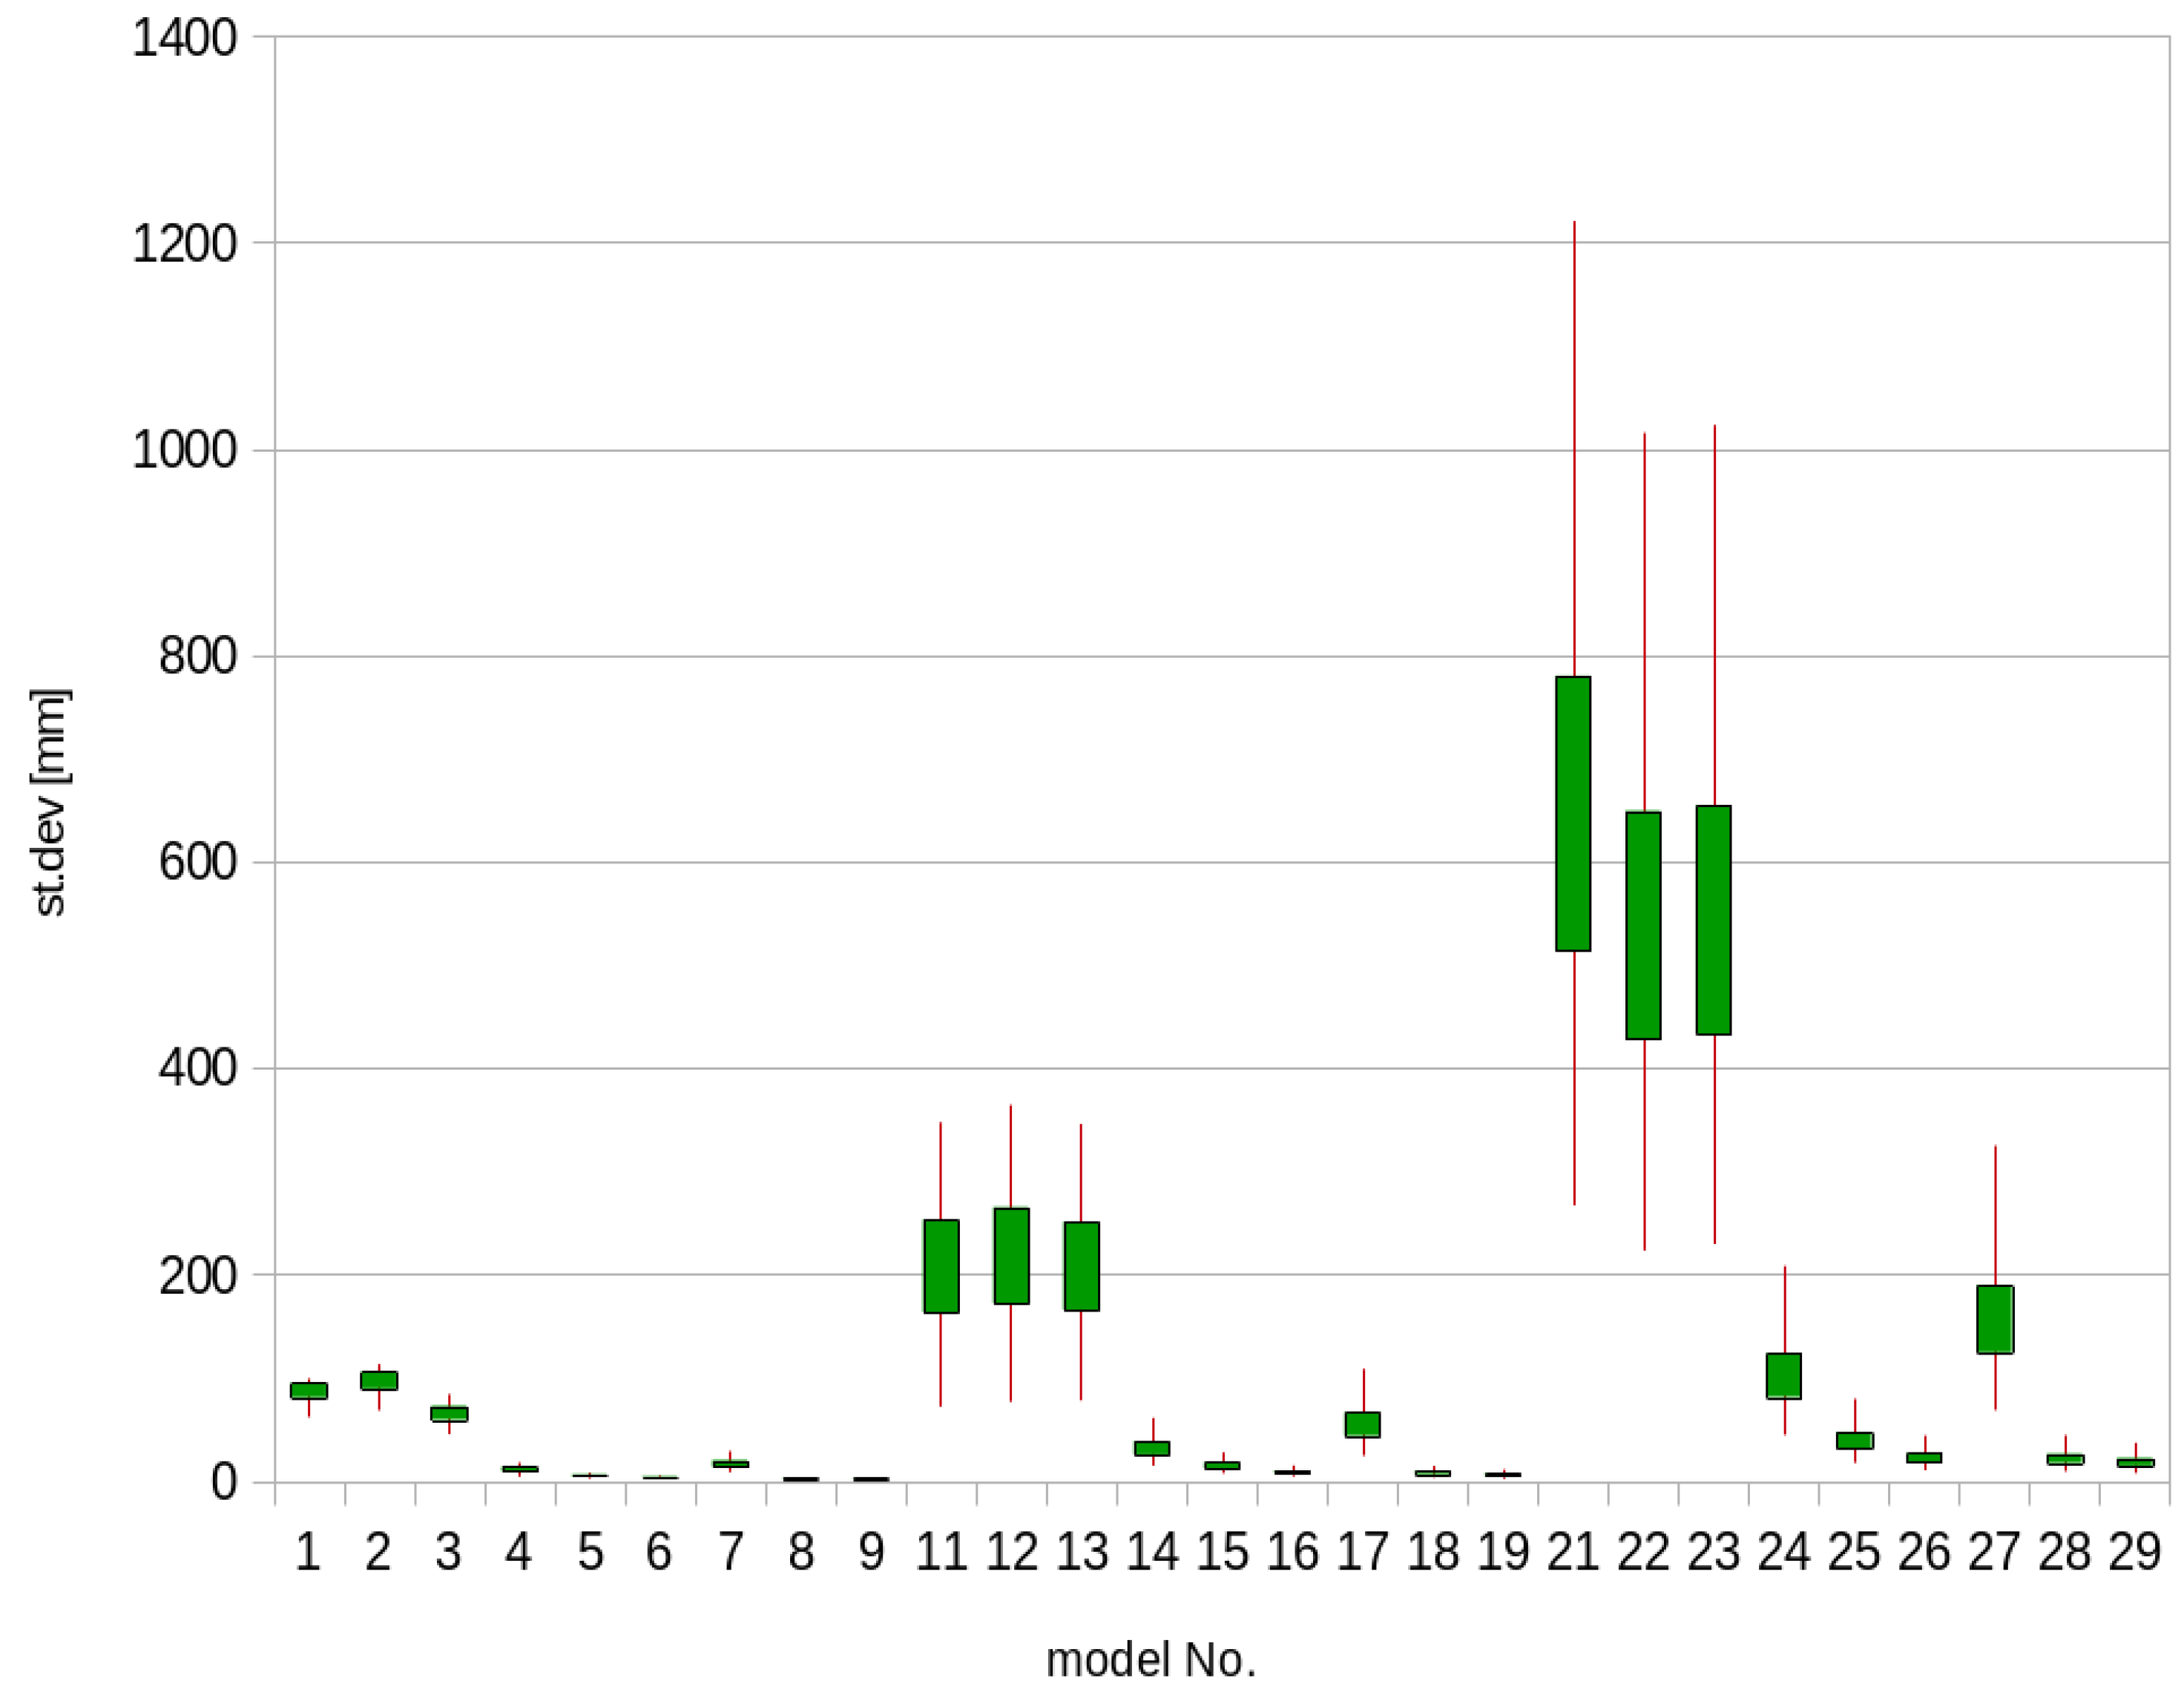
i, respectively. Summary of the reached accuracy for each of the models is shown in
Figure 7. Vertical red lines represent maximal and minimal standard errors of point
s horizontal position (
10) within a model, while green boxes are vertically centered over mean standard errors. Lengths of the green boxes are proportional to variations of
. Longer boxes indicate higher variations of points’ positional errors within the model. The number of the points per model included in the summary presented in
Figure 7 varies from 13 to 68, depending on the model (
Table 2).
Inspection of
Figure 7 suggests that models 11–13 and 21–23 result in unacceptable values, together with the models 17, 24, and 27. Additionally, the models 1–3 give high standard errors, which marks them as bad.
If one recalls
Table 1, the common factor influencing final results of the mentioned models are shapes of six-point segments from
Figure 2. The optimal network shape is based on two contradictory conditions: (1) to have longer distances between network lines, in order to minimize the number of measurements in the control network, and (2) to make the polygons from
Figure 2 as regular as possible, meaning to create vertices with similar lengths. An additional parameter that adds uncertainty to the model is total length of the tunnel, which is the factor that cannot be changed.
Measurement uncertainties are, also, tested against various values, for the purpose of finding the right accuracy class of measuring equipment. For distance measurements, throughout tested configurations, measurement uncertainties of 1, 2, and 5 mm are tested, while angular measurements are simulated for 1 and 5 uncertainties. Length of the bar can be calibrated in a calibration laboratory with precision reaching 0.01 mm. However, this case study shows that such high accuracy is not necessary here. We tested two distinct standard errors for bar lengths: 1 mm and 0.1 mm, and no significant differences arose between the two values. This means that no high-precision invar bars are required for realization of this network concept, but, rather, any steel bar is adequate for this purpose.
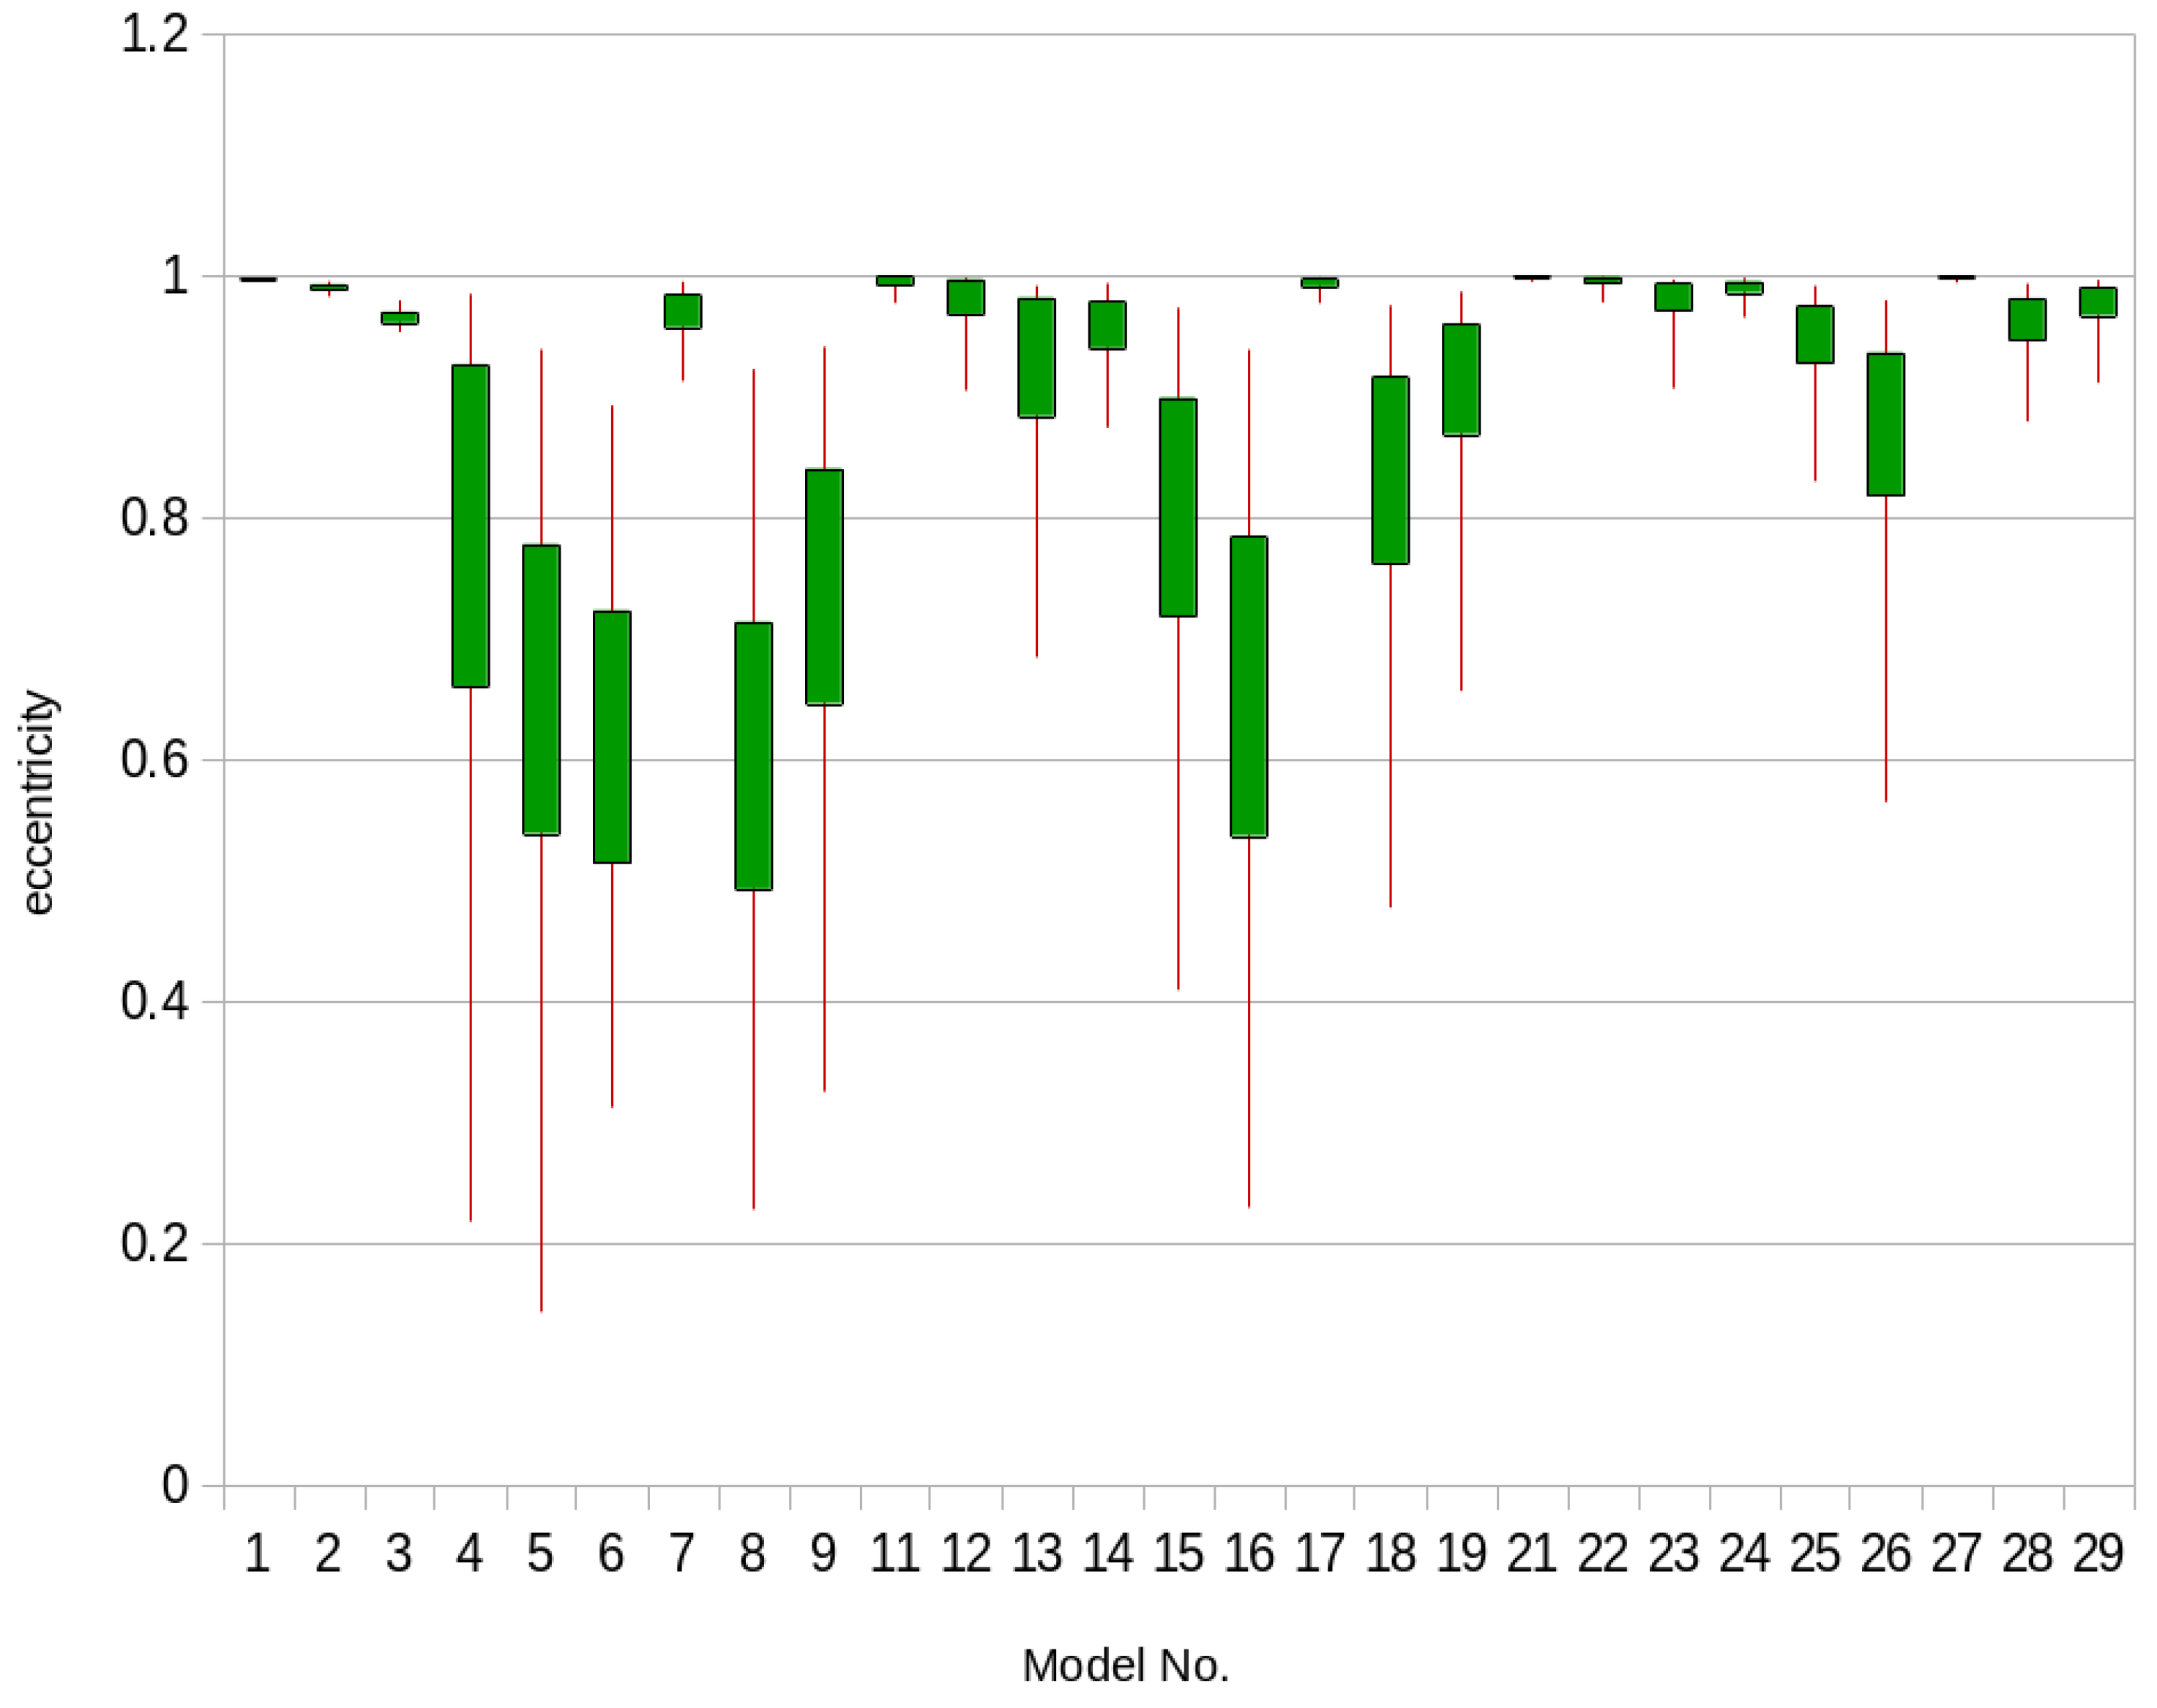
Another quality parameter of the control network is shapes of error ellipses, which should (1) be as possible as closer to circle, i.e., with low eccentricity, and (2) have diversified orientations. Again, the network configuration influences these two conditions. For this particular example, where the network shape is highly determined by geometry of the tunnel, this factor is significant. Analysis of error ellipses is performed by calculating eccentricities for all points in all models. A graphical summary of the results is presented in
Figure 8. Explanation of the shapes of the candlesticks is analog to those in
Figure 7. Smaller values, converging to 0, represent the values with lower eccentricity, while those closer to 1 indicate more elliptical shapes. Longer red lines and higher green boxes mean more diversified shapes of error ellipses, which is a characteristic of a well-shaped network. It is visible from
Figure 8 that some models, for example, 4, 5, 8, and 16, have good error ellipses indicators. Combining that conclusion with visual inspection of
Figure 7, those models could be treated as optimal. However, correlation between numerical figures expressed in
Figure 7 and
Figure 8 is −0.44, meaning that the shape of the network is negatively correlated to error ellipses shapes. Direction of the maximum error axis is, in the case of the most eccentric ones, always directed to the
y axis.
After detailed discussion on the underground control network accuracy indicators, the following conclusions and recommendations can be specified:
For long and narrow underground corridors, standard error of 2–5 cm for point position is achievable. Wider tunnels allow better network configurations, leading to better position performances.
The ratio: “distance between two network rows”/“width of the corridor” should be closer to 1.
The length of the bar should be as long as possible, while not necessarily made of invar alloy.
The results from 27 simulated environments show that a consistent network accuracy is achieved. The points position errors are much better that those reported in some studies (2–5 cm compared to more than 13 cm). Modifications of standard methods, involving gyro-theodolites, decreases the error to the level of a few cm, but introducing more measuring time. This research suggests usage of standard equipment, with benefit arising from adapted methodology in the sense of the network shape and involving fixed-length bars. This approach decreases the total number of manually performed measurements while, at the same time, keeps the network shape stable and makes the whole measurement campaign more economic in the sense of time spent in measuring. Analytical and numerical simulation presented in this paper concludes the first stage of the research on an improved concept for cm-level positioning in the underground tunnels. Continuation on this subject is related to establishment of a test field which simulates real conditions with highly controlled parameters, settings, and results. Confirmation of the mathematical model performance can be tested outdoors by performing control measurements with an independent method (GNSS preferably), but taking into account different environmental conditions, which implies, also, changes in the stochastic model coming from different error sources. The final stage, testing in real conditions, is highly dependent on the underground corridor itself due to its configuration, including its connections with the external network, especially distribution of the vertical shafts. The period and scope of the real conditions test will be determined after validation of the outdoors test.
The methodology elaborated in this paper is consistent and, therefore, applicable to extraterrestrial bodies. The reason for research on precise positioning in underground facilities comes, in the sense of space applications, from the fact that the rich property of Lunar materials attracts institutions interested in planetary mining. Their interest is to investigate finds in technologies, methodologies, and equipment adapted to Lunar mining and in the short term to start with utilization of the mines, either directly in space, or to bring back to Earth.
The Moon is envisaged as a first stepping-stone in the space exploration road map, and it will be the first celestial body where new mining and in situ manufacturing methodologies will be exercised firstly before new space missions will move ahead. From terrestrial mining experiences, there are doubts between the type of an instrument choice (mobile or static rovers) and access to ore by drilling or by sub-surface penetrating. Artificial intelligence and robotics will be a key to determine the operational mining methodology applied in a microgravity environment as well. Experience from automated terrestrial mining is a good asset to apply in the space sector. These methodologies are developed to increase human safety in mines and to improve efficiency, but human resources are still needed in a sense to control the whole mining procedure. Additionally, navigation and positioning are important links in the chain of exploration and settlement of the Moon.
The search for a new source of REEs outside of our planet is a main reason why space mining is becoming very popular today. Current navigation of rovers and landers on the Moon and Mars is based on inertial navigation utilizing camera vision systems and calculation from taken pictures. The control network development technology presented here allows for positional accuracy up to 5 cm, for the tunnels wider than 5 m. This model can ideally fit in Lunar lava tube configuration, especially if previously the interiors of sublunarean voids are mapped by spherical robots SphereX or any other. Finally, this methodology for underground control networks development is independent of any further navigation and positioning methods. Furthermore, it can be tied to any external reference, despite its nature, if such connection is needed. Such situation may occur, for example, in the case that a long underground facility should be connected with two or more on-the-ground locations, which share the same coordinate system. In that way, the methodology elaborated within this research is a solid background for all future underground applications, terrestrial or extraterrestrial.


