Article

Determining the Paleostress Regime during the Mineralization Period in the Dayingezhuang Orogenic Gold Deposit, Jiaodong Peninsula, Eastern China: Insights from 3D Numerical Modeling

1
Key Laboratory of Metallogenic Prediction of Nonferrous Metals and Geological Environment Monitoring, Ministry of Education, School of Geosciences and Info-Physics, Central South University, Changsha 410083, China
2
College of Forestry, Central South University of Forestry and Technology, Changsha 410004, China
3
MLR Key Laboratory of Metallogeny and Mineral Resource Assessment, Institute of Mineral Resources, Chinese Academy of Geological Sciences, Beijing 100037, China
*
Authors to whom correspondence should be addressed.
Minerals 2022, 12(5), 505; https://doi.org/10.3390/min12050505
Submission received: 17 February 2022 / Revised: 18 March 2022 / Accepted: 15 April 2022 / Published: 19 April 2022
(This article belongs to the Special Issue GIS, AI, and Modelling of Mineralization Process and Prospectivity)

Abstract

:
The Dayingezhuang orogenic gold deposit, located in the northwestern Jiaodong Peninsula, is hosted by the Zhaoping detachment fault, but the paleostress regime during the mineralization period remains poorly understood. In this study, a series of numerical modeling experiments with variable stress conditions were carried out using FLAC3D software to determine the orientation of paleostress and the fluid migration processes during the ore-forming period. The results show that the simple compression or tension stress model led to fluid downward or upward flow along the fault, respectively, accompanying the expansion deformation near the hanging wall or footwall of the Zhaoping fault, which is inconsistent with the known NE oblique mineralization distribution at Dayingezhuang. The reverse and strike-slip model shows that the shear stress was distributed in the gentle dip sites of the fault, and the expansion space occurred in the geometric depression sites of the fault, which is also inconsistent with the known mineralization distribution. The normal and strike-slip model shows that shear stress was distributed in the sites where the fault geometry transforms from steep to gentle. In addition, the expansion deformation zones appeared at sites with dip angles of 35~60° in the footwall and extended along with the NE-trending distribution from shallow to deep levels. The numerical results are quite consistent with the known mineralization, suggesting that the fault movement during the mineralization stage is a combination of the local strike-slip and the NW–SE extension in the Dayingezhuang deposit. Under this stress regime (σ1 NE–SW, σ2 vertical, σ3 NW–SE), the NE dilation zones associated with fault deformation served as channels for the ore-forming fluid migration. Based on the numerical modeling results, the deeper NE levels of the No. 2 orebody in the Dayingezhuang deposit have good prospecting potential. Thus, our study not only highlights that gold mineralization at Dayingezhuang is essentially controlled by the detachment fault geometry associated with certain stress directions but also demonstrates that numerical modeling is a robust tool for identifying potential mineralization.

1. Introduction

The Jiaodong Peninsula is the largest gold production area in China, with >4500 t of known gold resources [1]. Most of the gold deposits in the Jiaodong Peninsula are characterized by similar mineralization occurrences. For example, orebodies are usually situated in the footwall of regional fault zones [1,2,3]; the fertile ore zone displays stepped vertical geometry and is associated with fault dip changes [4,5]; orebodies and their controlling faults have specific dip angles [3,6]; and they have the identical phyllic–silicification–potassic alteration halos around the ore-controlling fault [3,5,7]. Therefore, the gold deposits in the Jiaodong region were formed by the coupling of structure deformation and fluid flow.
The Dayingezhuang gold deposit is located in the middle section of the Zhaoping fault, northwestern Jiaodong Peninsula, and shares similar geological characteristics with other Jiaodong gold deposits. Previous studies have always debated the activity of regional detachment faults and paleostress regimes and have proposed NW–SE compression [8] and NW–SE extension [9,10,11], the coupling of normal slip and strike-slip tectonic activities [12], the transformation from a NW–SE extensional to a NW–SE compressional tectonic system [13], NNW compression NE–SW extension E–W compression NE–SW extension [14,15], and multi-transformation from NW–SE compression to shear compression, shear tension, and extension [16,17]. While it has been well documented that the orebodies are tectonically controlled, which stress background has influenced the mineralization and how fluids migrated from the source to trap are still poorly understood.
Structural controls on hydrothermal mineralization are attributed to the structure’s influence on the fluid flow [18,19,20]. Coupled deformation and fluid flow numerical models have been widely used to find favorable locations of ore-forming pooling zones in many hydrothermal deposits [21,22,23,24,25,26,27,28]. Numerical simulation can simulate the interaction of structure, rock deformation, and fluid flow and reproduce a large number of tectonic evolution scenarios in a short time [24,28,29]. For example, Zhang et al. [30] presented the results of 3D case-study models (with deformation and fluid flow coupling) on the Hodgkinson Province and were able to generate some potential gold mineralization targets. Cui et al. [24] investigated the fluid flow in Proterozoic basins that host unconformity-related uranium deposits and focused on the development of specific fluid flow patterns, which are determined by the relative roles of strain rates and a variety of hydraulic properties. Li et al. [28] presented a 2D dynamic modeling of fluid flow coupled with mechanical compression and heat transport in the hydrothermal uranium-bearing Athabasca basin. Liu et al. [31] used numerical modeling to reproduce the deformation process of the Baiyun gold deposit during the mineralization period, suggesting gold mineralization is influenced by the dip angle and dip direction of the lithological interface. Hu et al. [32] used a coupled numerical model for discussing the genesis of the Chating porphyry copper-gold deposit and calculating the time duration of the mineralizing hydrothermal system. Liu et al. [33] simulated the intrusions’ cooling and related fluid flow processes in the Dawangding deposit and demonstrated that the high dilational zones were produced by coupled mechano-thermo-hydrological processes and that these controlled the gold orebodies. These studies indicate both the feasibility and usability of numerical simulation modeling for understanding the influence of tectonic fluid coupling on mineralization. Hence, if given the physical parameters of the rocks and assuming a variety of paleostress conditions, we can determine the paleostress backgrounds and fluid migration patterns of the metallogenic period based on the comparison of the simulation results and known mineralization distributions.
In this study, we selected the large-scale (Au > 150 t) Dayingezhuang gold deposit as a case study of the gold deposits in the Jiaodong Peninsula to discuss the various possible paleostress states, the related deformation processes, and the structurally influenced fluid flow. Various stress orientation models were tested to explore the hydrodynamic relationships more fully and to systematically investigate the effects of deformation on fluid flow patterns. The effect of tectonic stress on ore-forming fluid flow is discussed in light of the numerical modeling results and was further used to identify prospective areas at greater depth in the Dayingezhuang system. The results of the present study may have important implications for the origin and exploration of gold deposits in the Jiaodong Peninsula.

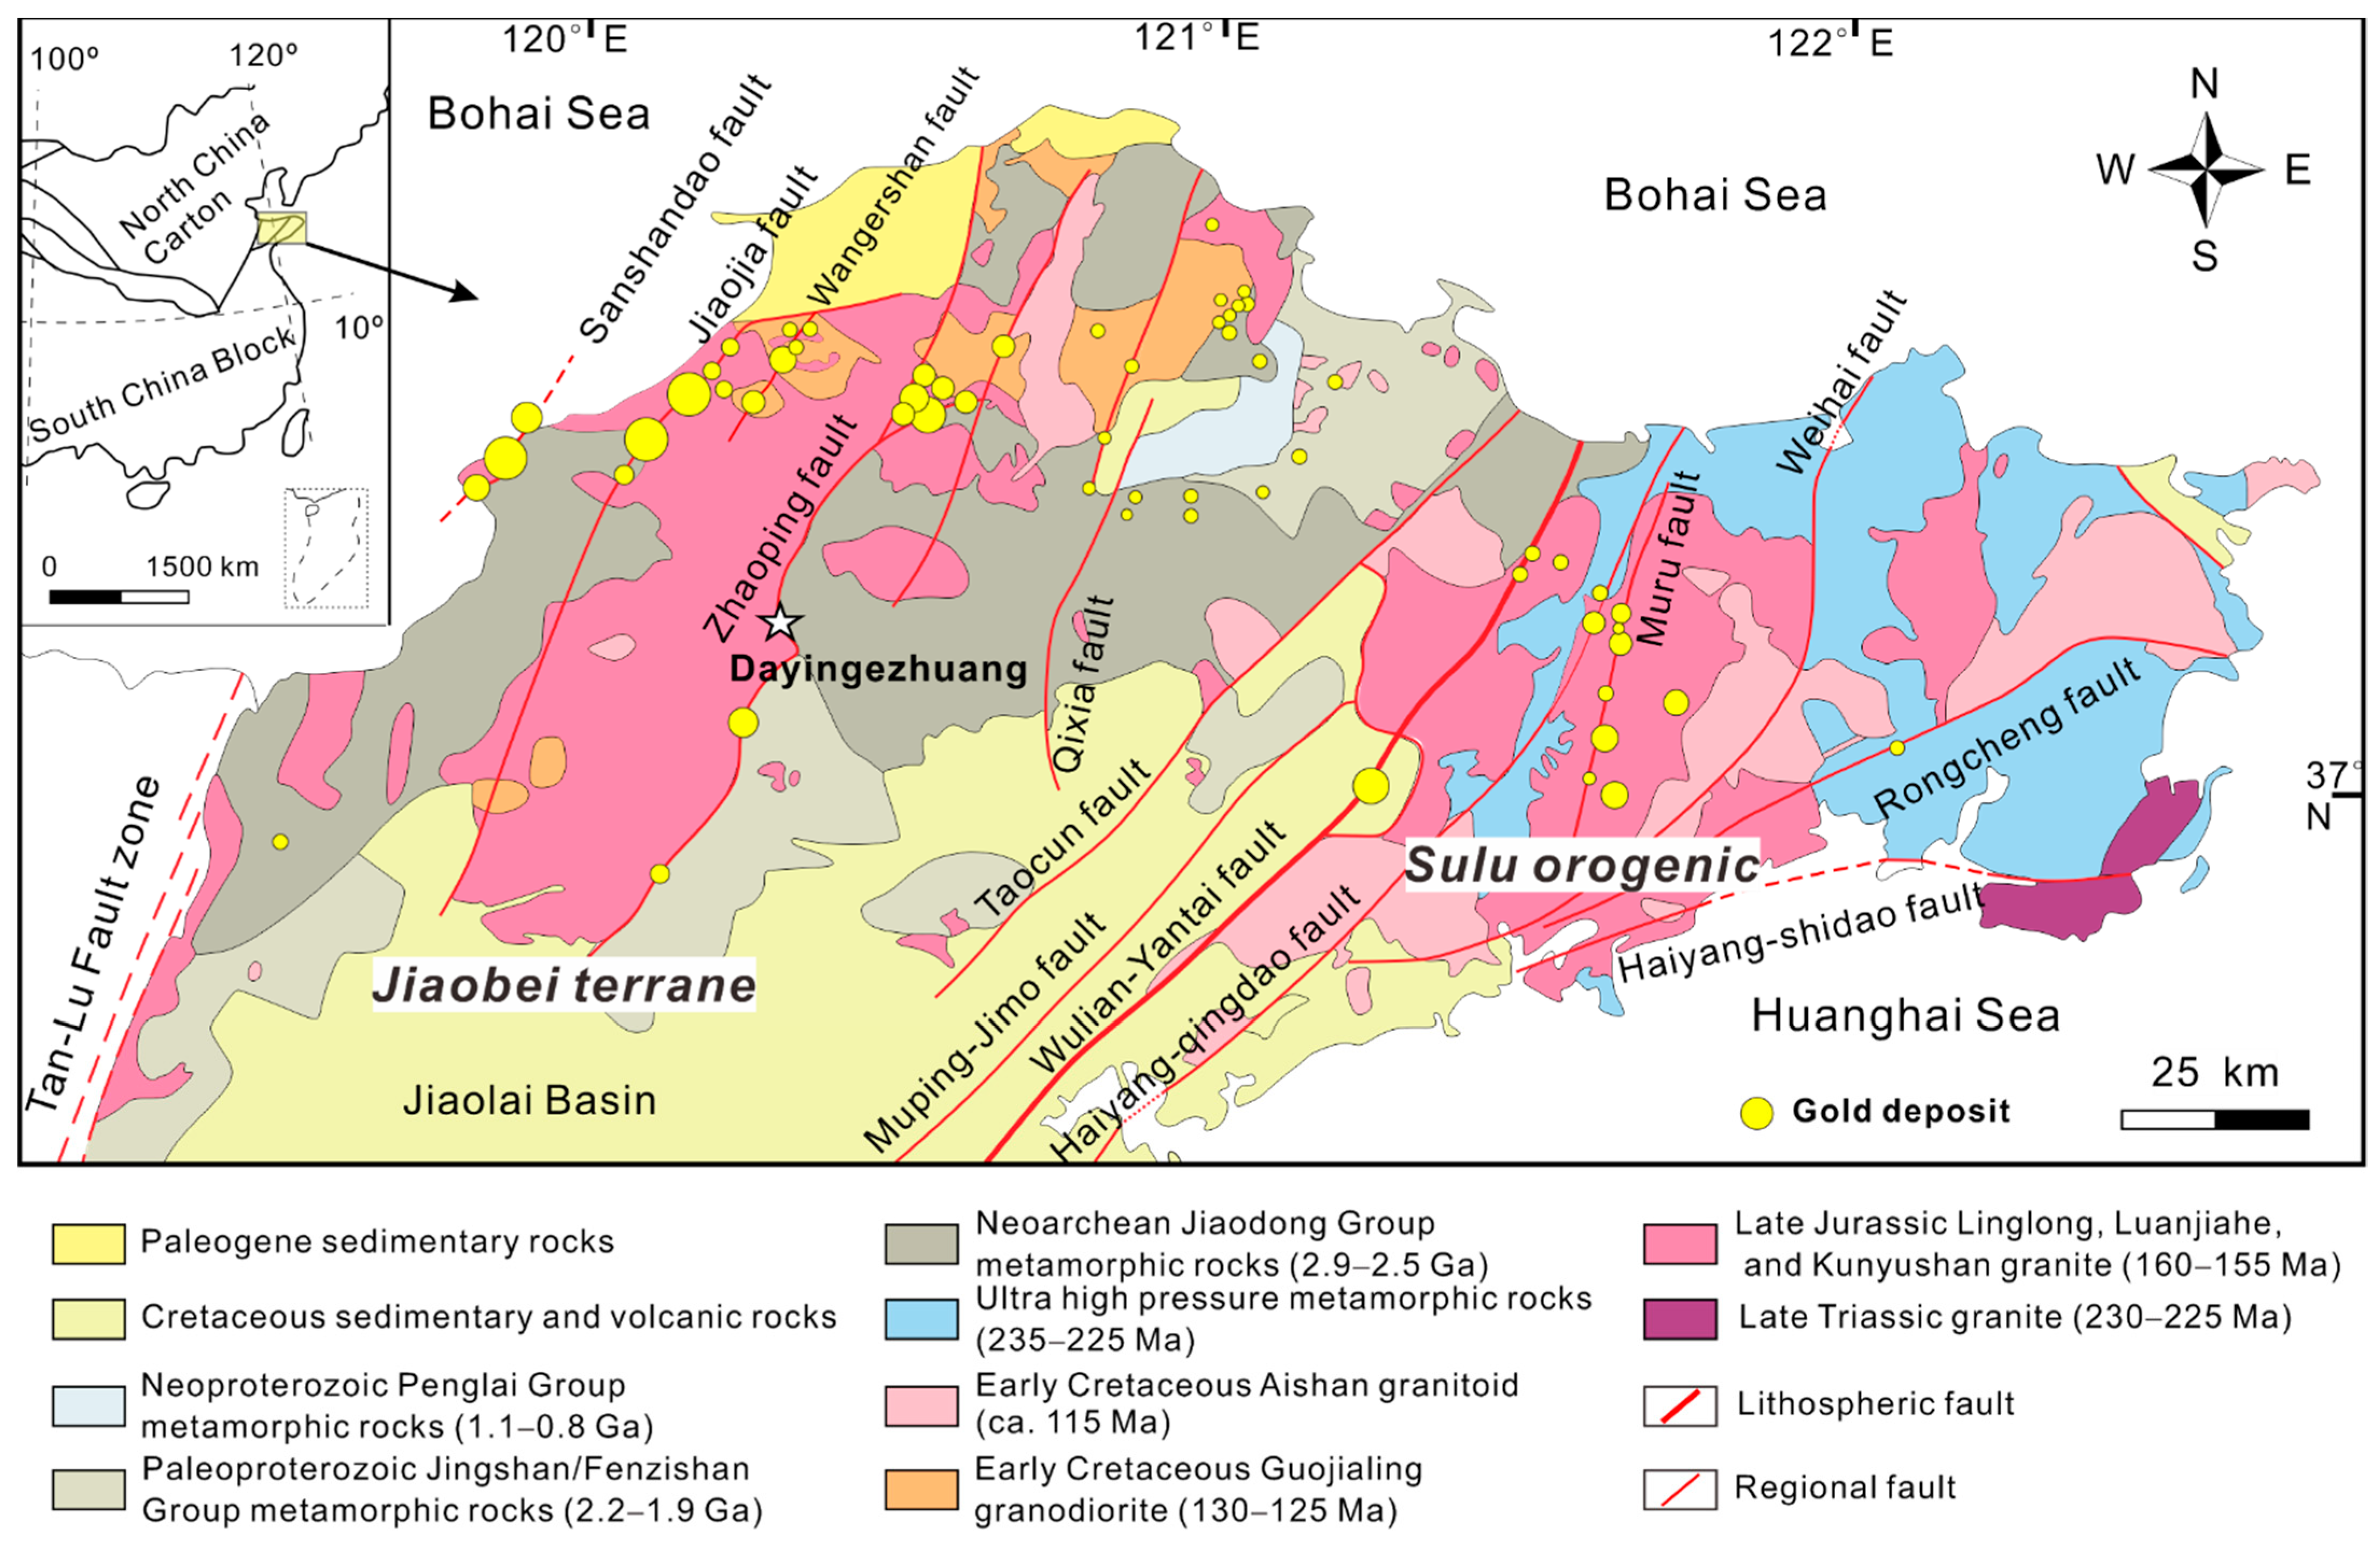
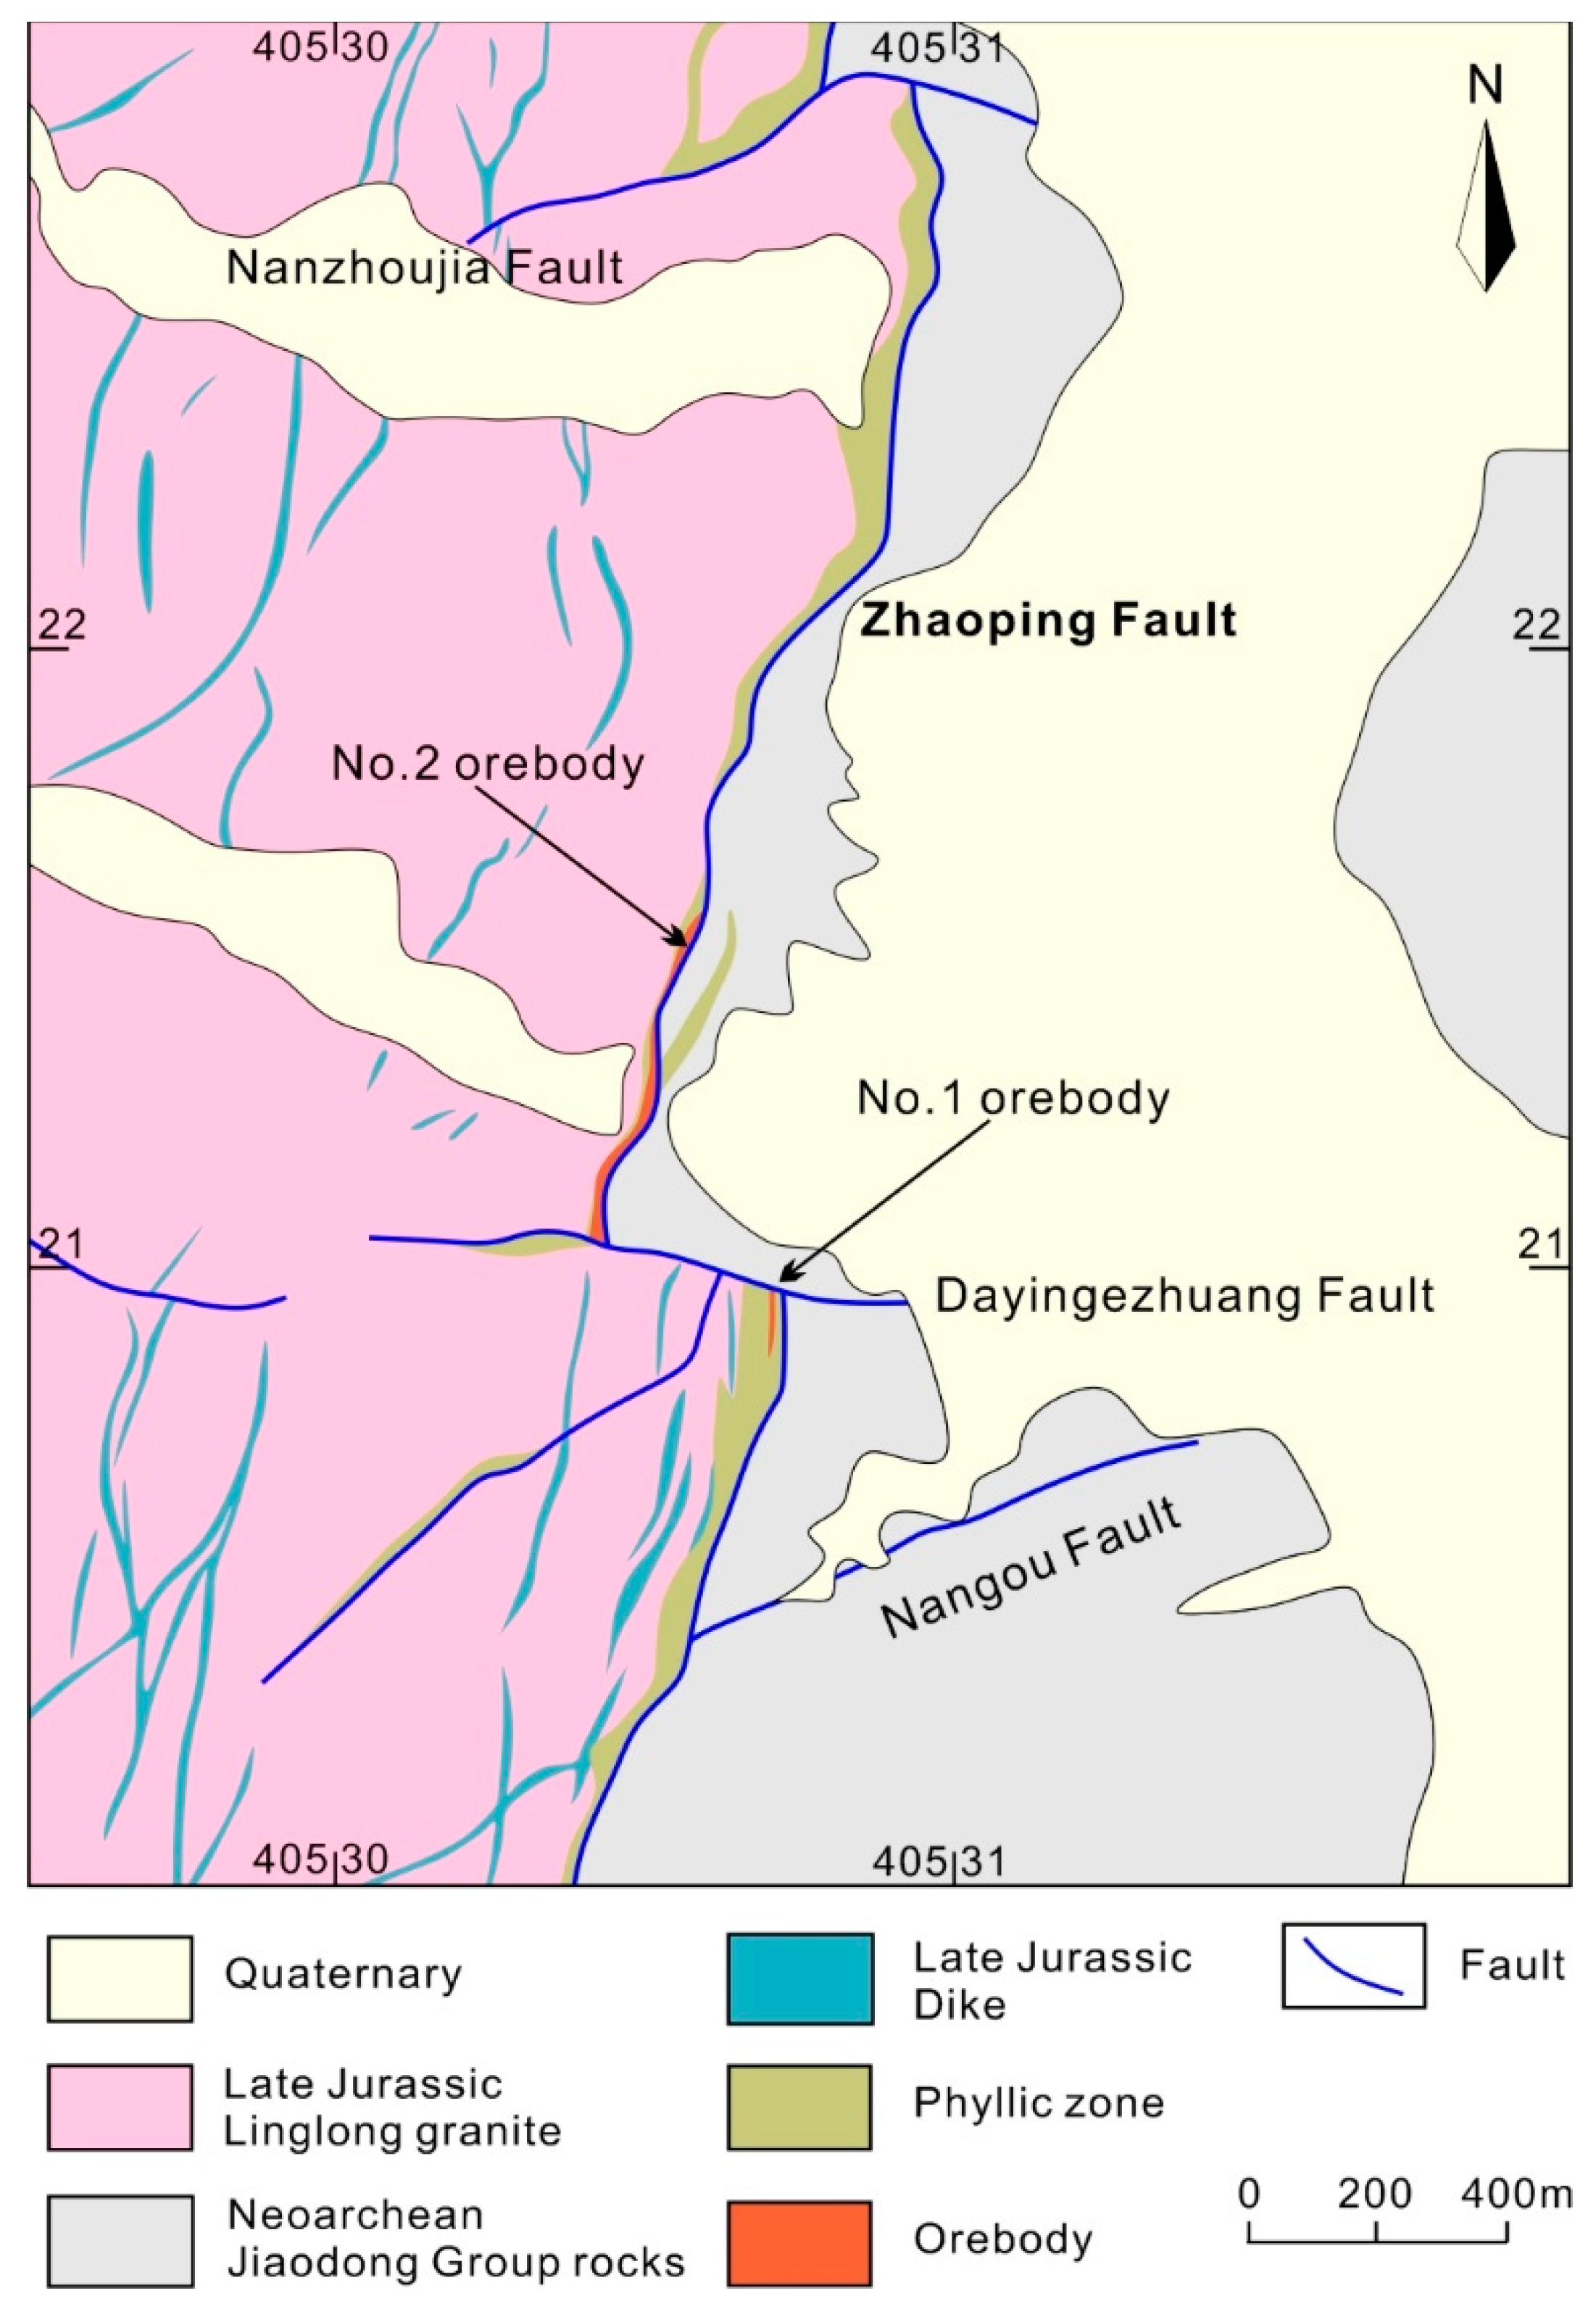
2. Geological Background
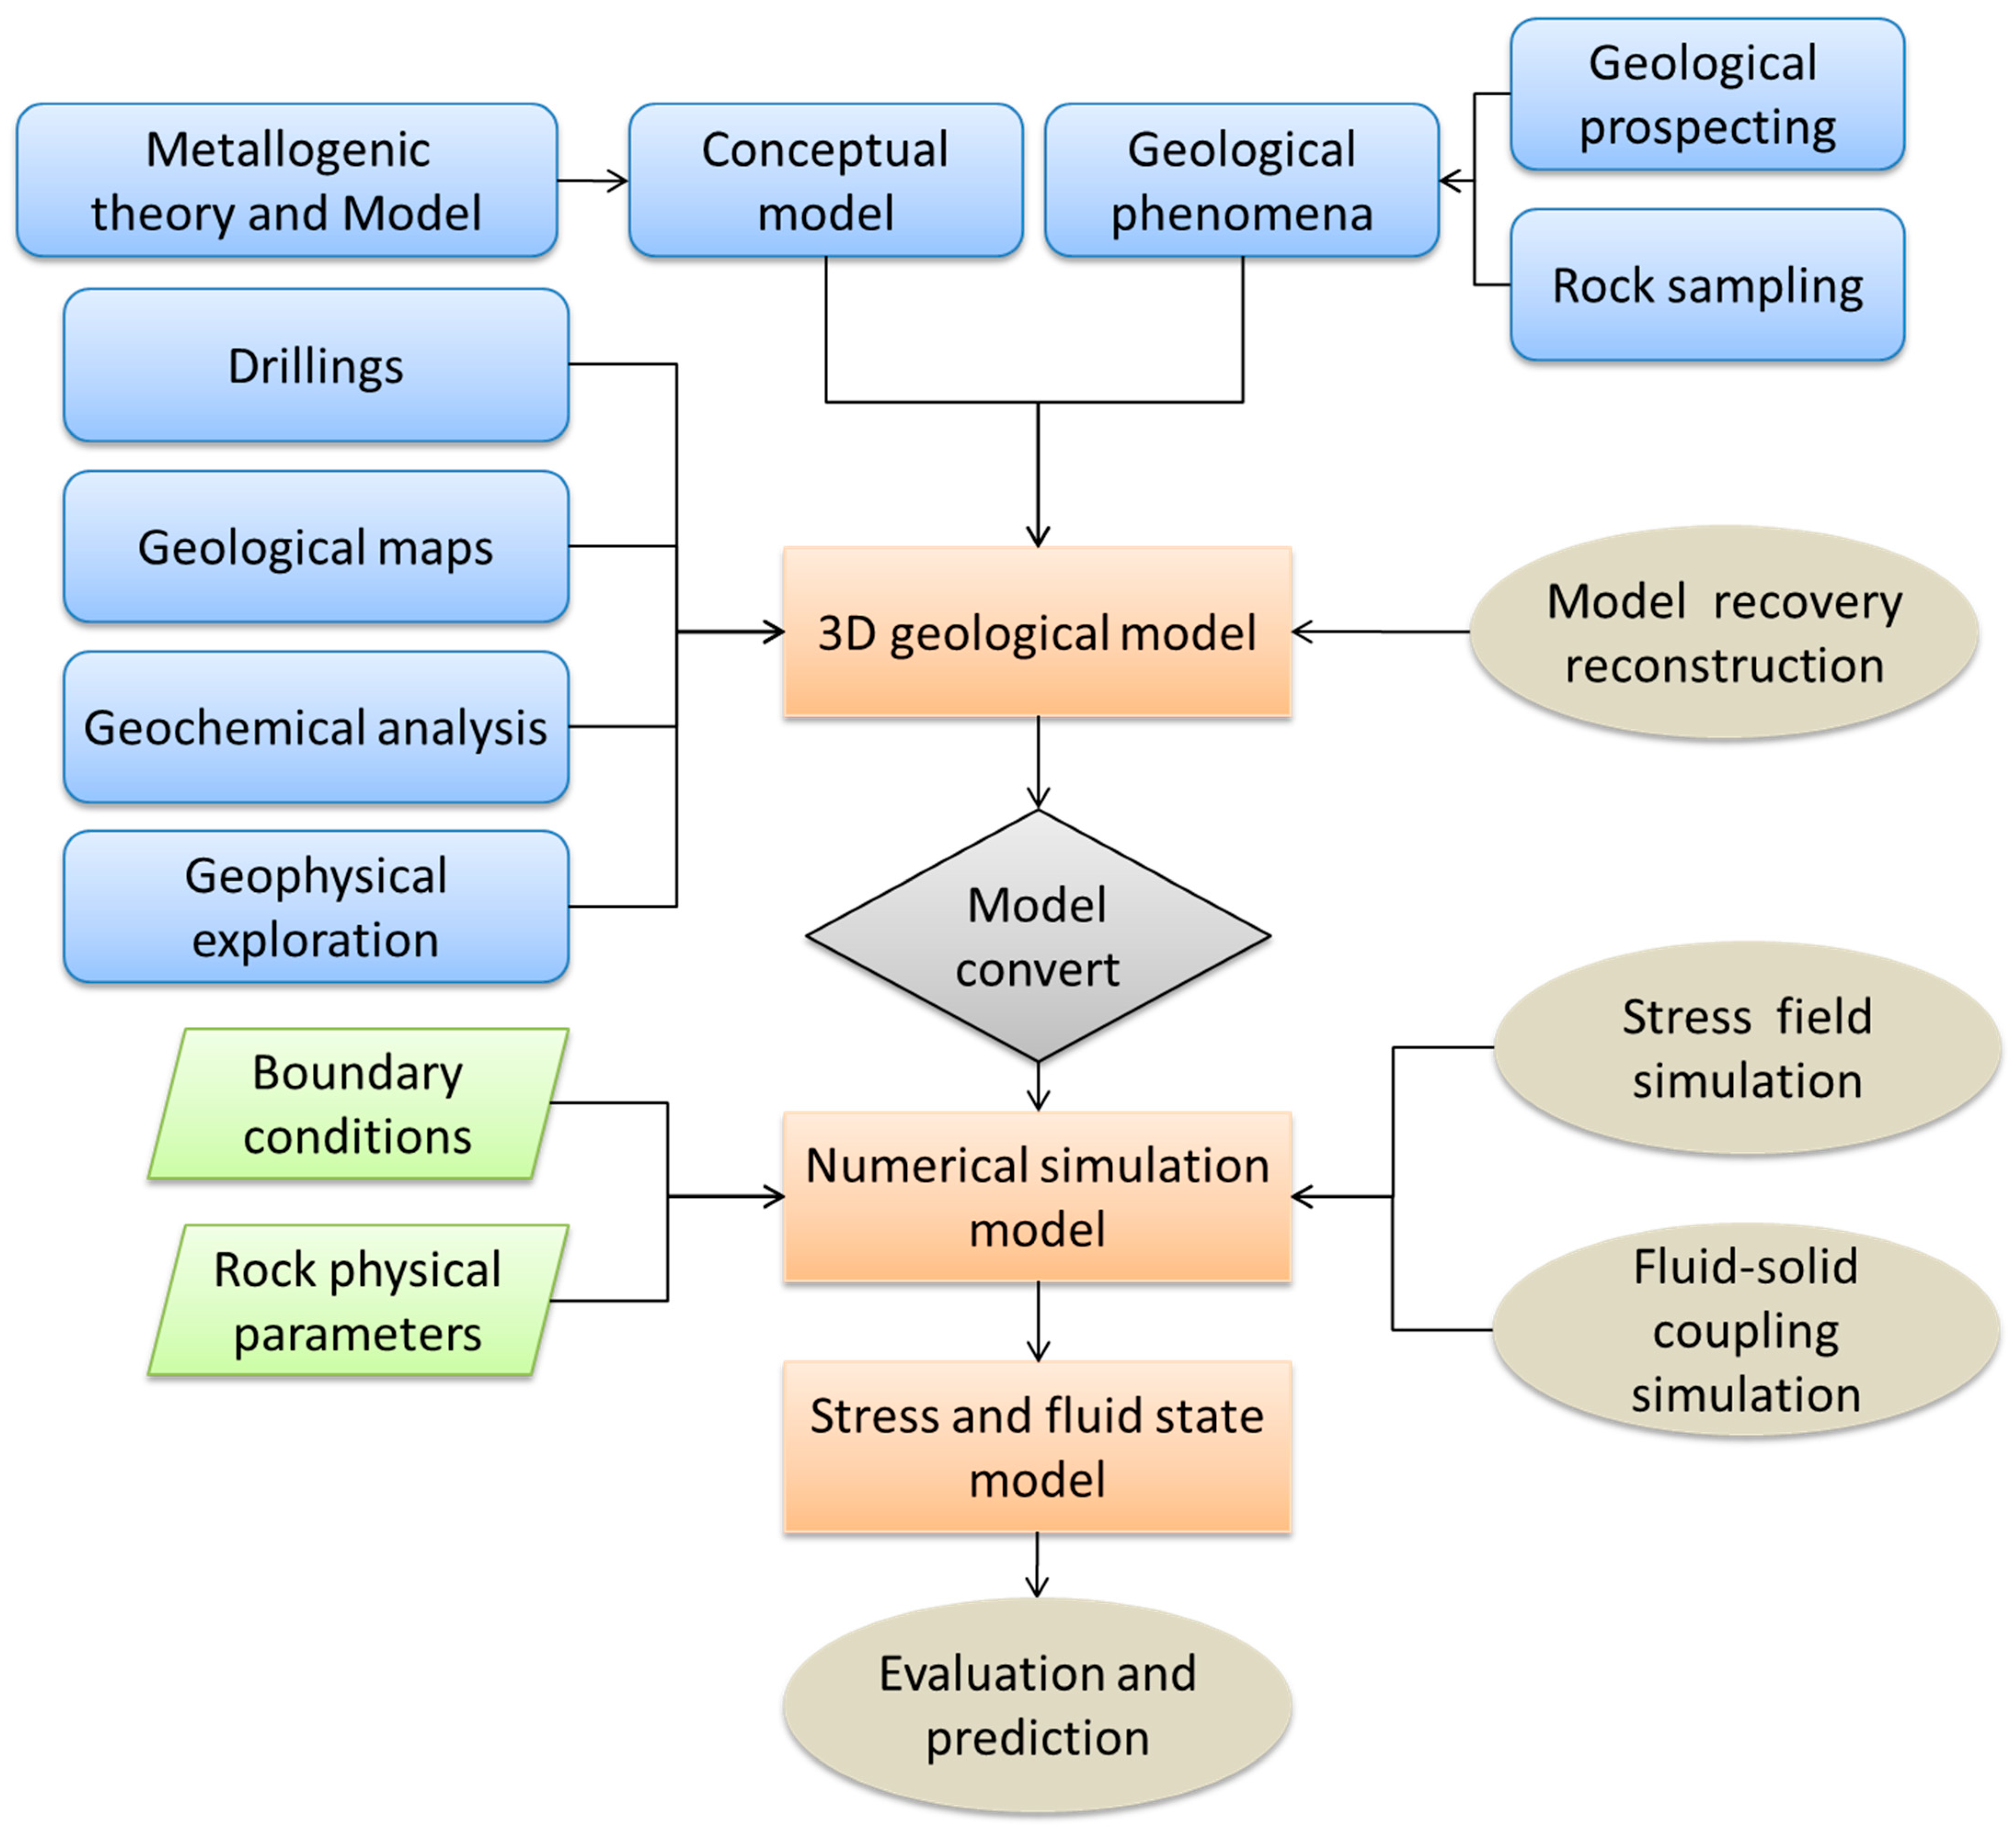
The Jiaodong Peninsula is situated in the southeastern margin of the North China Craton and is bounded by the Wulian–Rongcheng fault to the east and the NNE-trending Tan–Lu Fault Zone to the west [2]. Supracrustal rocks in the northwestern Jiaodong Peninsula are metamorphosed Precambrian sequences and Mesozoic intrusions [34]. The main structures are three regional detachment faults trending NNE and NE [35] from west to east: Sanshandao, Jiaojia, and Zhaoping (Figure 1).
The Dayingezhuang gold deposit is located in the northwest Jiaodong Peninsula [13,35]. The ore-controlling Zhaoping fault zone in Dayingezhuang strikes SW–NE with a dip ranging from 30° to 60° (Figure 2). The Zhaoping fault is offset by about 260–300 m at the surface by the E–W trending Dayingezhuang sinistral-slip fault. The formations at Dayingezhuang are dominated by Archean Jiaodong group metamorphic rocks and Quaternary rocks distributed in the east. The Jurassic Linglong granite and minor NE–NNE-striking dikes occur in the west of the Zhaoping fault. The Dayingezhuang gold deposit displays successive alteration zonation patterns from the center (orebody) outward (Figure 3) [11]. Gold mineralization mainly occurs in the cataclastic rocks with intense microfractures in the footwall of the Zhaoping fault [35]. The gold mineralization zone extends 700–900 m along the dip direction, with varying thicknesses ranging from 2 to 30 m. Two major orebodies (No. 1 and No. 2) are located in the south and north of the Dayingezhuang fault, respectively (Figure 2).
Two types of ore (disseminated and quartz vein) have been distinguished in the Dayingezhuang gold deposit [11]. Disseminated ore occurs in the footwall of the Zhaoping fault with relatively large reserves (90%) and low grades (<5 g/t), and it is linked to brecciation and intense quartz–pyrite–sericite alteration. Vein-type ores have smaller reserves but higher grades (typically >8 g/t), and mainly occur in secondary faults and fractures in the phyllic alteration footwall zone or with weak quartz–pyrite–sericite alteration, which occurs at varying distances from the Zhaoping fault [37,38,39,40,41]. The timing of the Dayingezhuang gold mineralization was reported to be ca. 133 to 127 Ma, which is slightly earlier than other gold deposits in the Jiaodong Peninsula [13]. The trapping temperatures of the fluid inclusions (CO2–H2O, aqueous fluid, and CO2–H2O±CH4) in Au-bearing quartz veins at Dayingezhuang are between 360 and 280 °C [42,43].

3. Method

3.1. Numerical Simulation Methods

Typically, in structural geology, stress inversion is mostly based on the Wallace–Bott hypothesis [44,45], which stipulates that the shear stress resolved onto the fault plane is parallel to the slip vector when the fault occurred and can be used to determine the stress tensor. Dupin et al. [46] and Pollard et al. [47] pioneered the numerical method (3D distinct element method) to check the validity of the Wallace–Bott hypothesis. Pascal applied the Sortan analytical method [48] and 3D distinct element method [49] to investigate fault slip movement to validate the Wallace–Bott hypothesis for tested geometries and boundary conditions. Since the geometric complexity of fault surfaces and fault networks may induce heterogeneity in fault slip directions. Maerten et al. [50,51] have explored the consequences of the varying geometry of intersecting faults in slip directions and used elastic modeling to invert fracture data. Lejri et al. [52] used the 3D boundary element method to conduct research on geomechanical multi-parameters and to understand the effect of each parameter on the misfit angle between geomechanical slip vectors and the resolved shear stresses. The paleostress analysis method based on the superposition principle can recover the distal stress state of multiple tectonic events effectively [53]. The iteratively coupled double system can estimate the paleostress by measuring displacement discontinuity on some parts of the faults. Many algorithms have been developed for stress inversion and have been successfully applied in many studies [53,54,55,56,57].
For the coupled interaction between fluid flow and tectonic deformation in most hydrothermal mineral systems, the numerical model should include a dynamic evolution process. Fast Lagrangian analysis of continua three-dimensional (FLAC3D), which uses an iterative process and defines models as isotropic elastic–plastic Mohr–Coulomb material, is suitable for simulating fluid flow and heat transport in porous media caused by rock deformation [18,58]. It has been successfully applied to various hydrothermal ore-forming systems [18,19,20,22]. Concerning the hydrothermal–structural coupling ore-forming system, we used FLAC3D to conduct the paleostress inversion and investigate the favorable position of mineralization in the Dayingezhuang deposit model. The fault and the surrounding wall rocks in the model are treated as continua and divided into blocks. The equation of the coupling process is described as follows [58]:
q W = k ( P ρ w   g · x )
q T = k T T
ζ t = q i , i + q v W
C T T t + q T + ρ 0 c w   q W · T q v T = 0
ρ dv i dt = σ ij , j + ρ g i
ε ij t = α t T t δ ij
y x = M ( ζ t α ε t + β T t )
The model is controlled by a series of partial differential equations, including Darcy’s Law (Equation (1)) to describe fluid flow in porous media, Fourier’s Law (Equation (2)) to describe heat conduction, the conservation law (Equations (3)–(5)) to describe the conservation of mass, energy, and momentum, and the equation of state (Equations (6) and (7)) to describe the coupled constitutive relations of heat, force, and flow [59]. The mathematical symbols and scientific significance of the formula are described in Table 1.
Three-dimensional geological modeling approaches reported in [37,60] were used in this study for model construction. Most geoscientific numerical simulations include conceptual, mathematical, and simulation modeling [31,33,61,62,63]. This study improved the workflow, and the detailed workflow of the numerical simulation is shown in Figure 4. Firstly, the data of geological exploration were collected and digitized based on summarizing the existing metallogenic regularities of the study area. Because the Zhaoping main fault zone was offset by the Dayingezhuang fault, the Zhaoping fault zone was reconstructed before numerical modeling. The thickness of the fault zone was 50 m, and the Zhaoping fault interface was joined together by the way of node displacement to restore the geometric structure of the fault in the ore-forming period. The solid model of the geological unit was built up based on the closed surface model. Finally, the solid model data format was converted into a tetrahedral grid model data format and imported into FLAC3D software for numerical simulation. The detailed workflow of numerical simulation is shown in Figure 4.

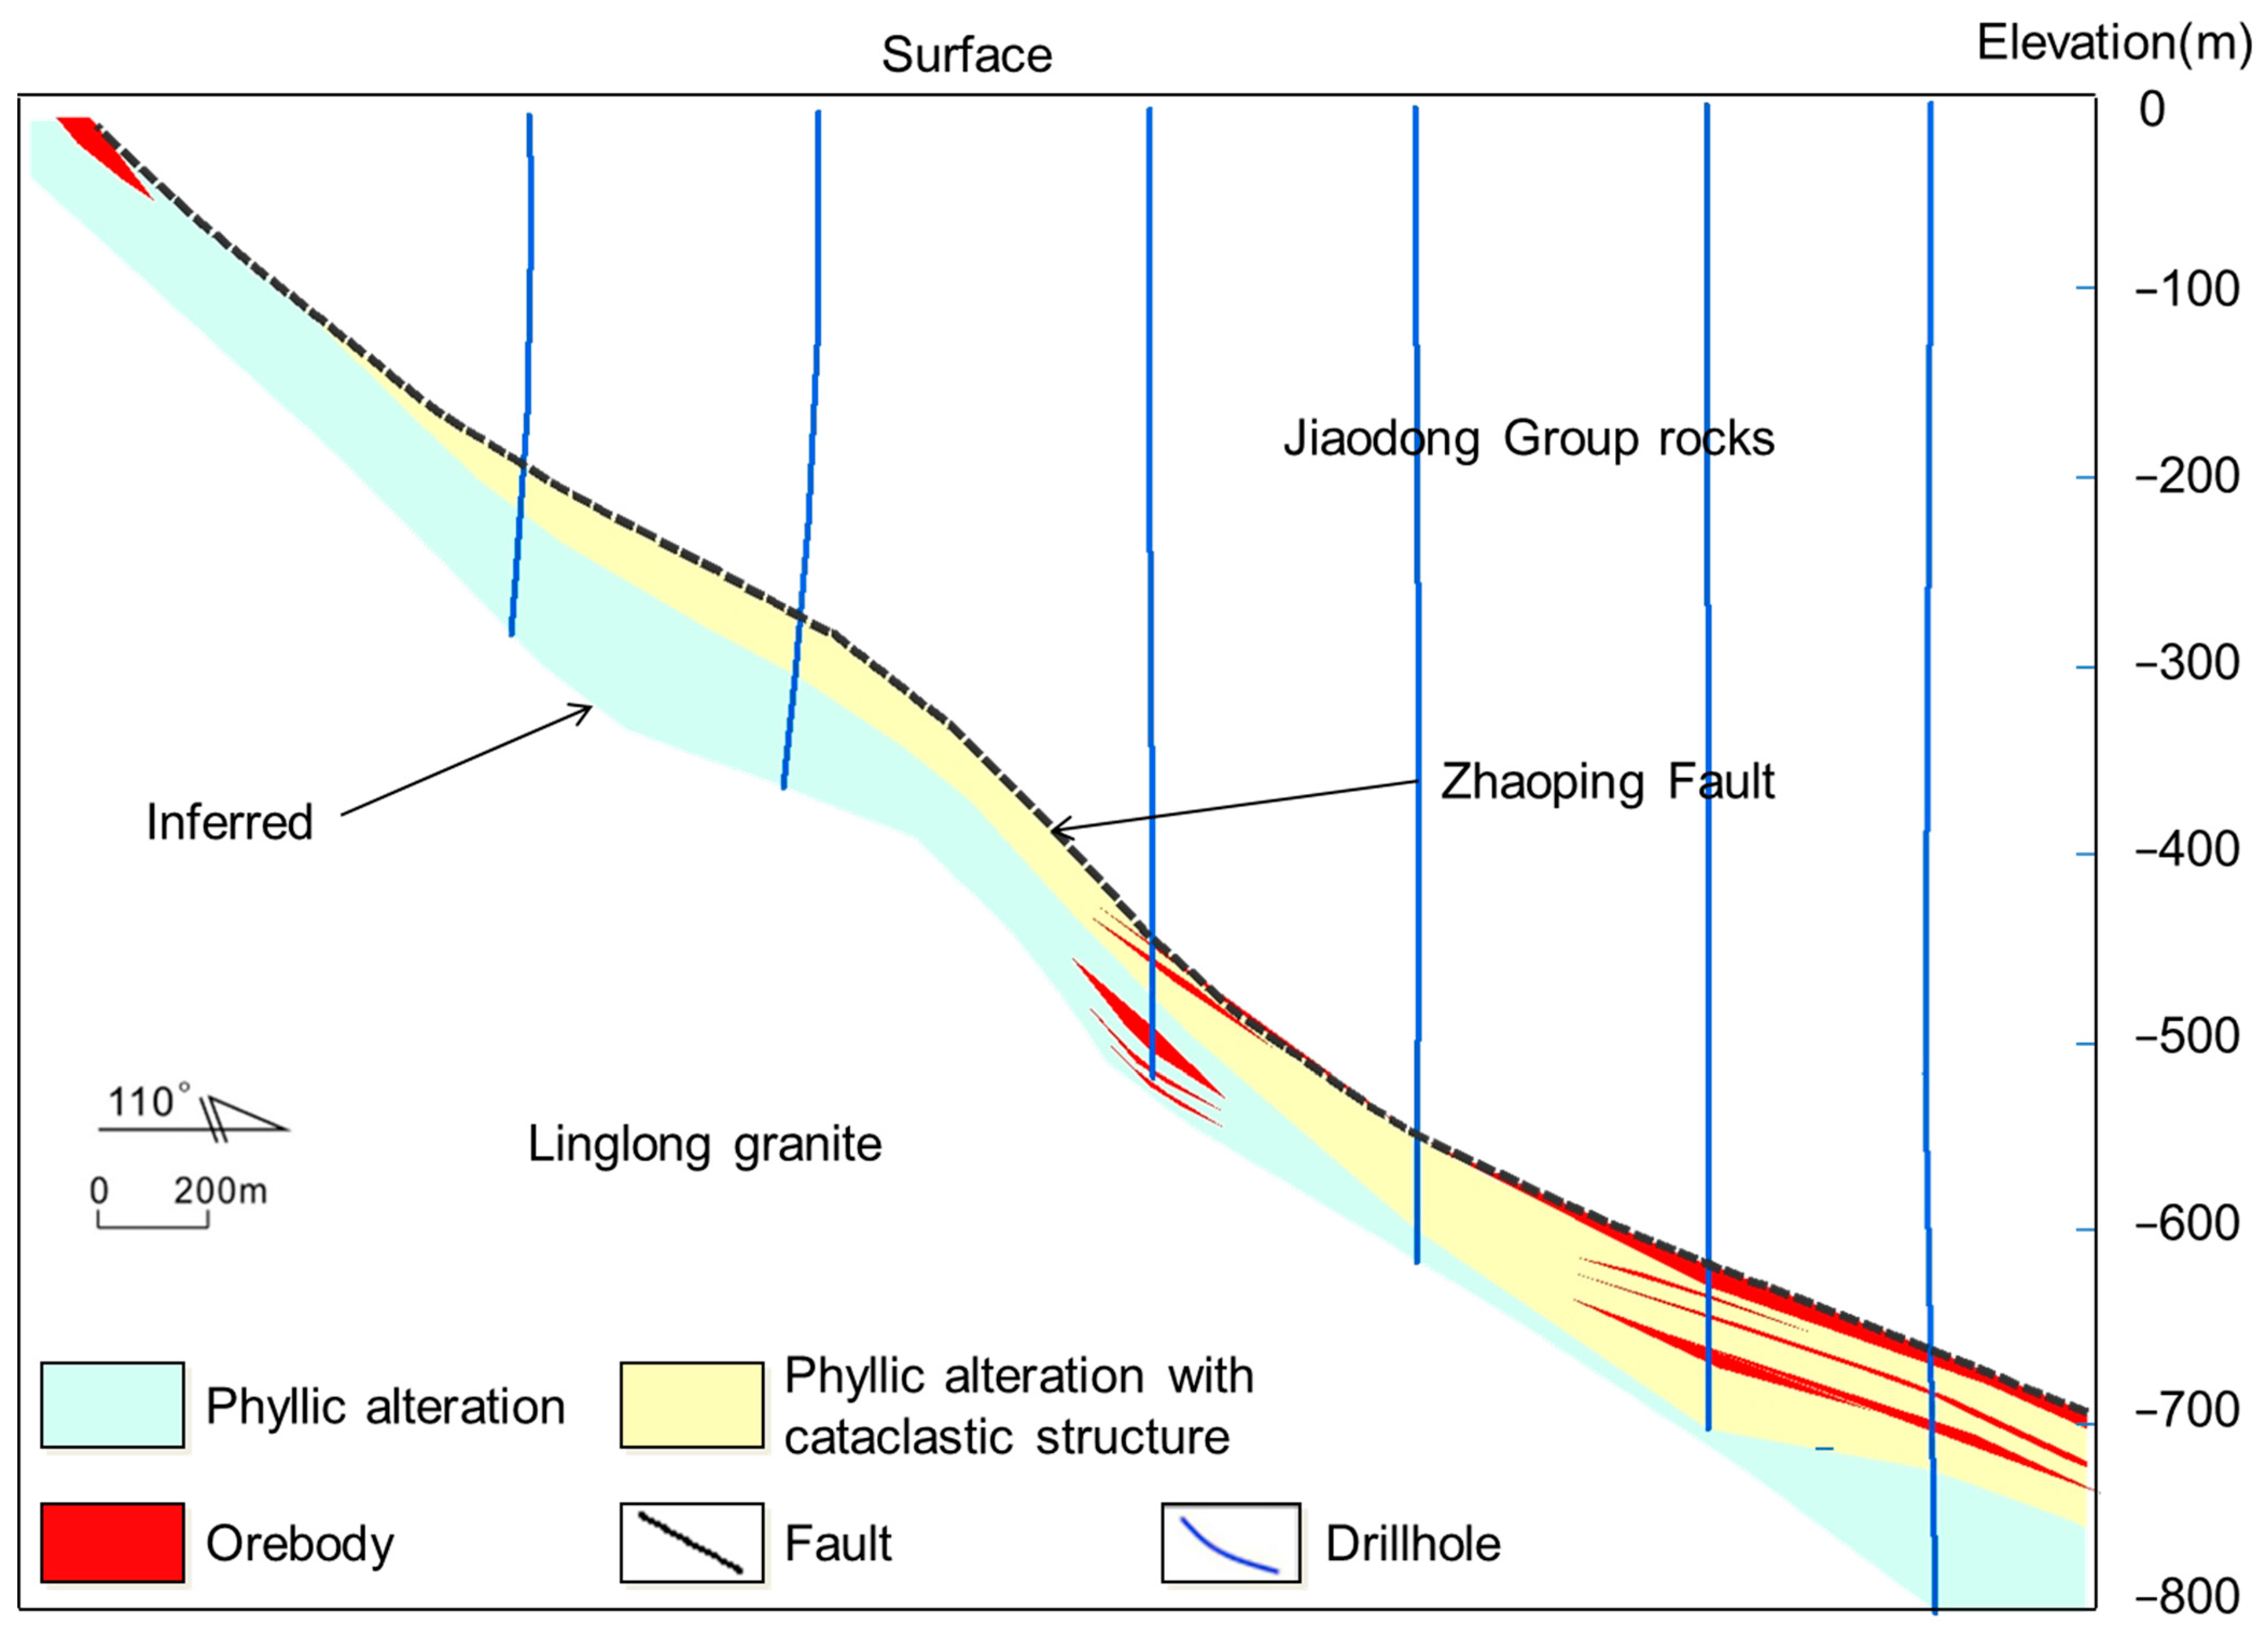
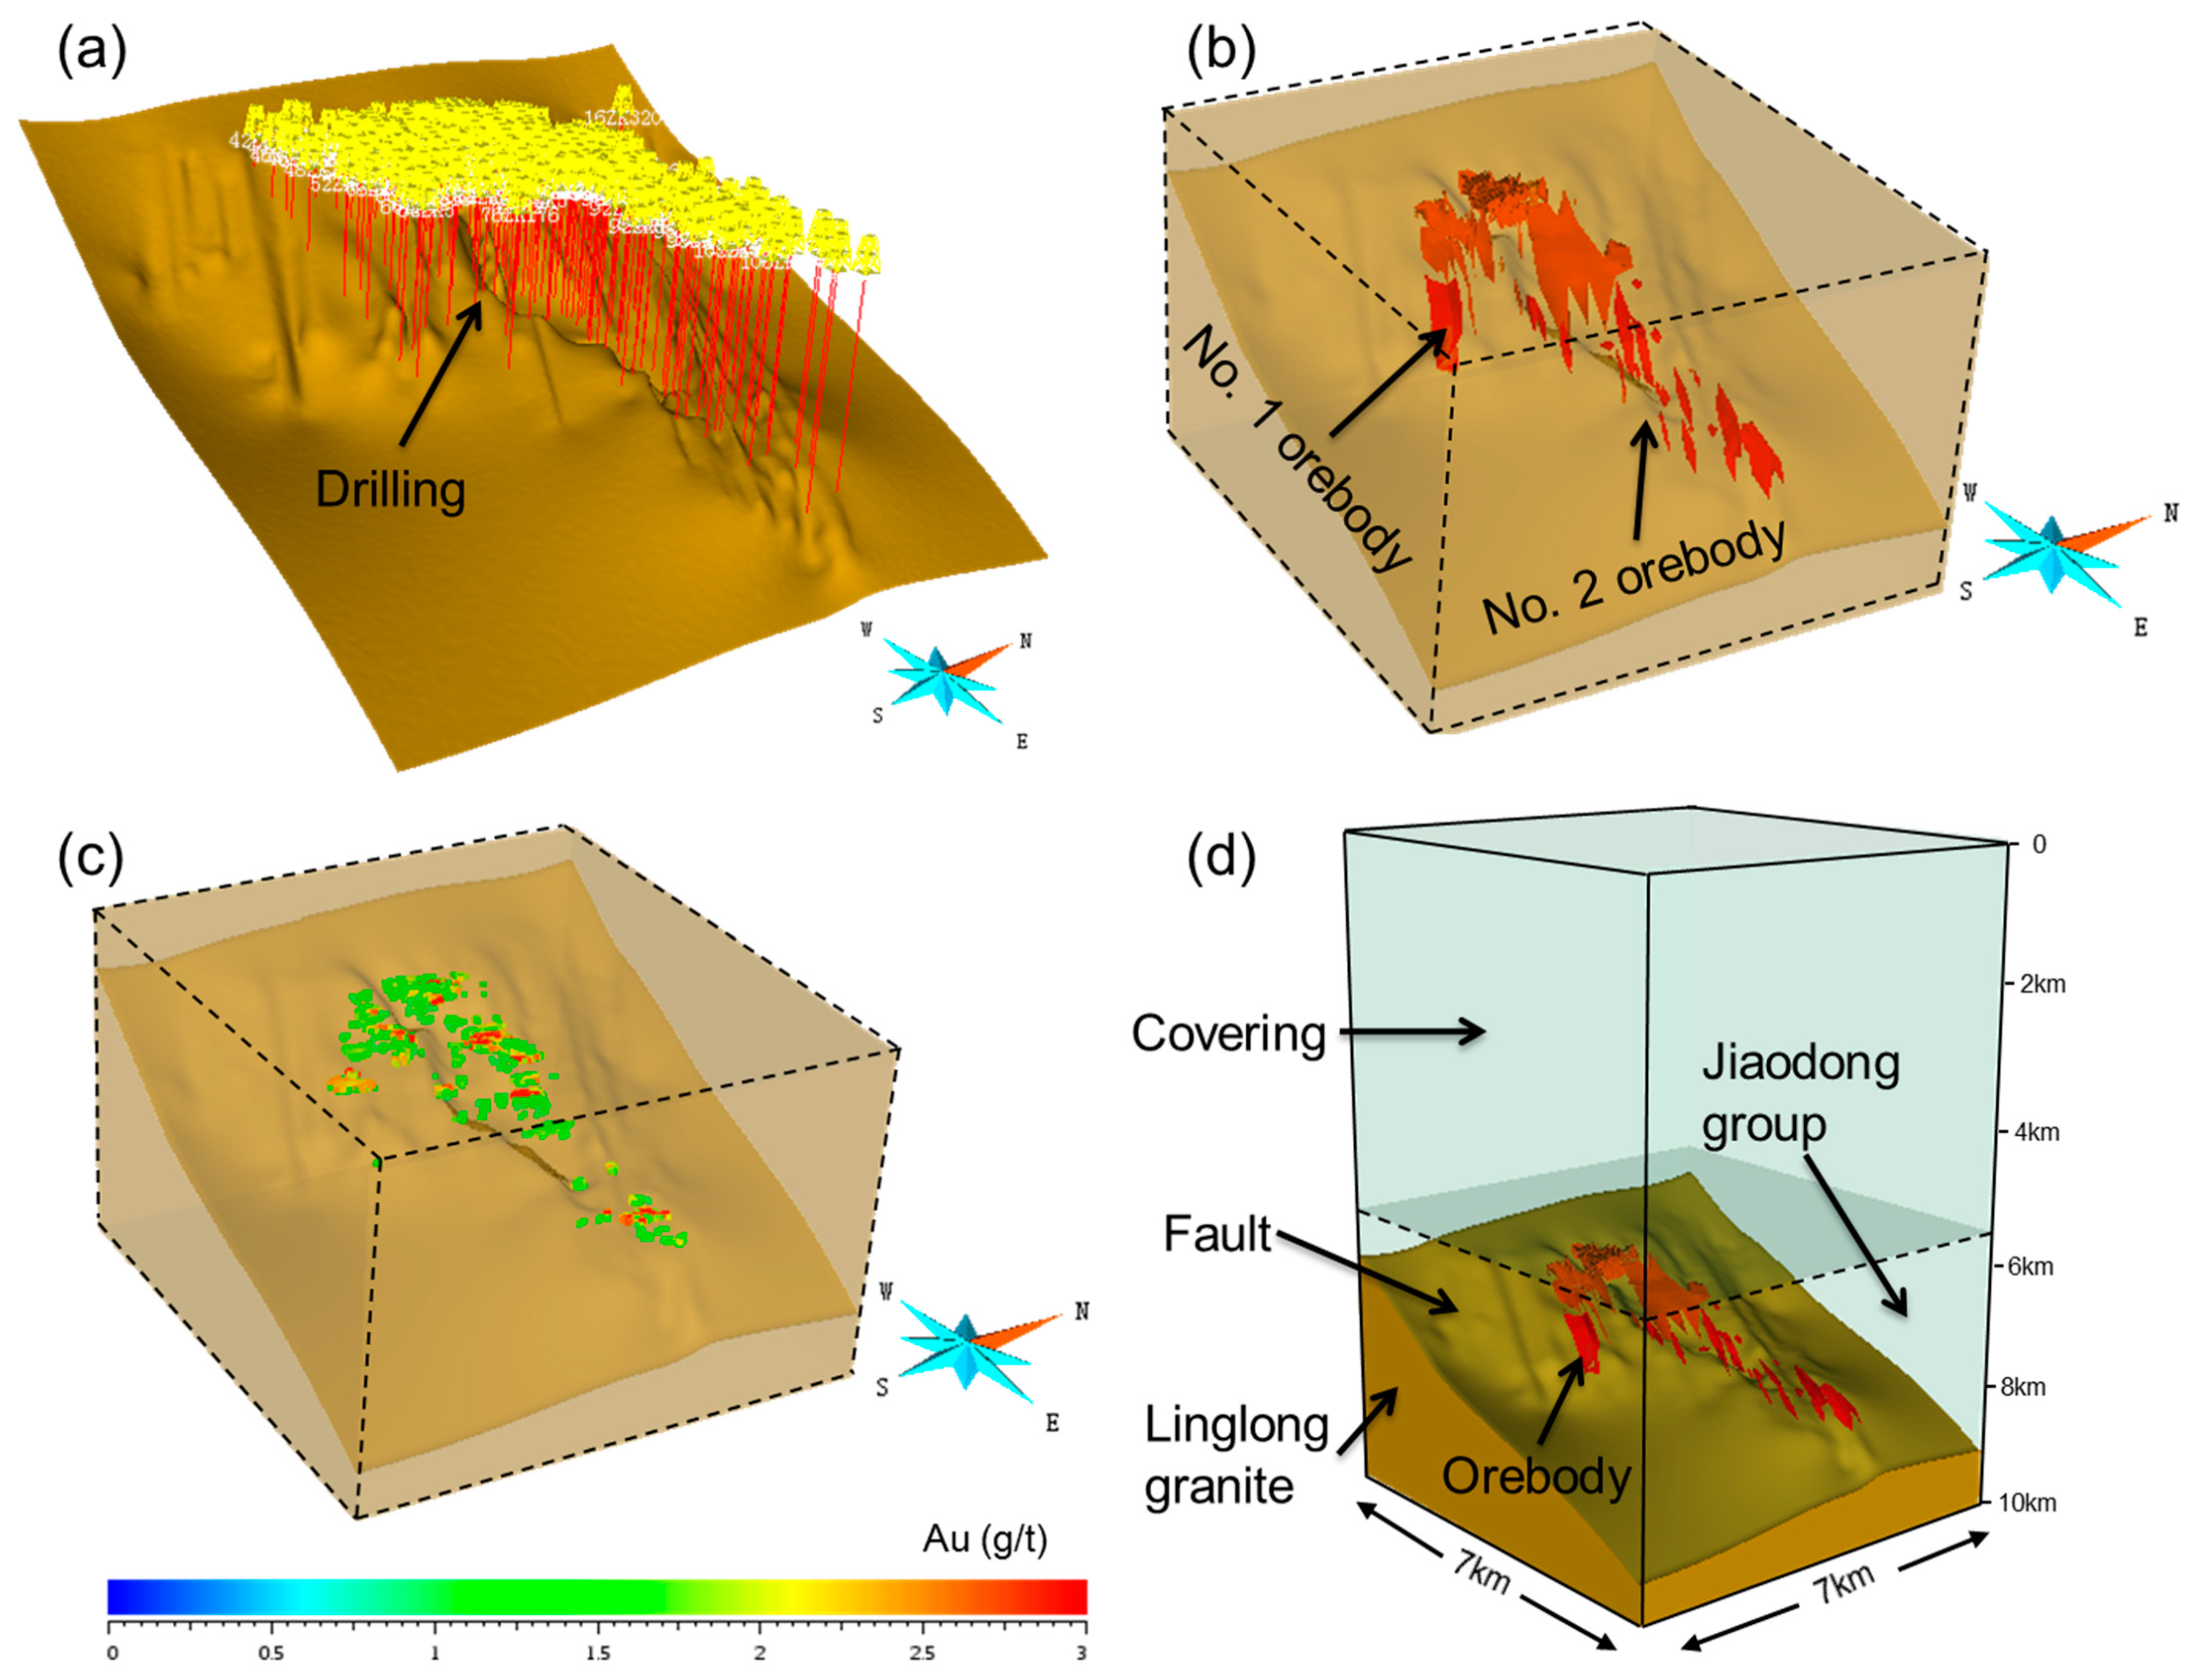
3.2. The Model Setup

It was necessary to create a simplified conceptual model, including the fault zones, Jiaodong group (hanging wall), and Linglong granite (footwall), to build the numerical model of the Dayingezhuang gold deposit. Concerning the post-ore erosion, we added a cover of the Jiaodong Group with a thickness of 7~8 km, which has been suggested by previous studies [40,64,65], and assumed the geothermal gradient was 30 °C/km [66]. The size of the model was 7 km in the north–south and west–east horizontal direction, and 10 km in the vertical. An idealized model was constructed to reflect the geologic features of the Dayingezhuang gold deposit according to the geological cross-section and data (Figure 5a–c). In the model, we combined rocks with similar physical properties or small volumes. The heterogeneity and anisotropy concerning permeability were ignored. The simplified Jiaodong Group, Zhaoping fault, and Linglong granite are the main geologic units at Dayingezhuang (Figure 5d), fundamentally replicating the main geological features of the deposit. Despite the simplified nature of the deposit model, it helps us well understand fluid flow in and around the fault during tectonic deformation and the influence of fault geometry on fluid flow.

3.3. Experiment Settings and Modeling Parameters

The physical properties of rocks in the Dayingezhuang deposit were determined (Table 2) based on similar numerical modeling and published compilations [15,18,24,29,67]. During the deformation and fluid flow simulation, the parameters describing the properties were kept constant. Some simplification was performed so that rock units with similar mechanical characteristics were assigned the same properties and all geological units were treated as homogeneous. The fault zone was considered a weak zone with lower mechanical properties and higher permeability relative to the surrounding rock [68].
The boundary conditions of the model were set as follows:
(1)
The base of the model was fixed vertically but moved freely horizontally. The top deformed freely in both the vertical and horizontal directions during the tectonic deformation. Most geological strain rates ranged from 10−11 to 10−17 s−1 [69]; thus, the strain rate range from 1 × 10⁻¹³ s−1 to 3 × 10⁻¹³ s−1 was assigned at the boundaries in our model [15]. To avoid geometric errors caused by the distortion of the meshes, all models in our study were compressed to a maximum strain of 1%.
(2)
The initial temperature distribution in the model was determined purely by heat conduction, with the temperature at the top parts of the model kept at 20 °C, while the temperature at the bottom of the model was assigned and fixed according to the geothermal gradient of 30 °C/km [65,70]. The side boundaries were treated as insulated from heat transport.
(3)
The initial pore pressure gradient was set as hydrostatic. The eroded part of the hanging wall was treated as fixed pore pressure and stress surfaces [24,29]. Fluid flowed out of the model freely at the top boundary, while the bottom and vertical boundaries were assumed to be impermeable.
Simple mechanical compression (Figure 6a) and tension states (Figure 6b) were used to test the relation of compression or tension stress on the flow of the fluid. Model 3 (Figure 6c) and Model 4 (Figure 6d), based on mechanical compression (Model 1) and tensile states (Model 2), respectively, were used to test the favorable sites of expansion deformation and fluid flow patterns of the Dayingezhuang deposit and to determine the orientation of paleostress during the mineralization period [49,50].

4. Results

The top of the model was interpreted as compressed by 7 km of overlying cover, and the initial mechanical equilibrium was calculated. After equilibrium was reached, a constant convergence velocity was applied to the model boundary to simulate compression, tension, and strike-slip. All models in our study were compressed or stretched to a maximum strain of 1%. Here, a series of experiments in which compressive and tensile stresses were applied was used to evaluate whether the fluid flow patterns and volumetric strain were consistent with the distribution of known orebodies at Dayingezhuang.

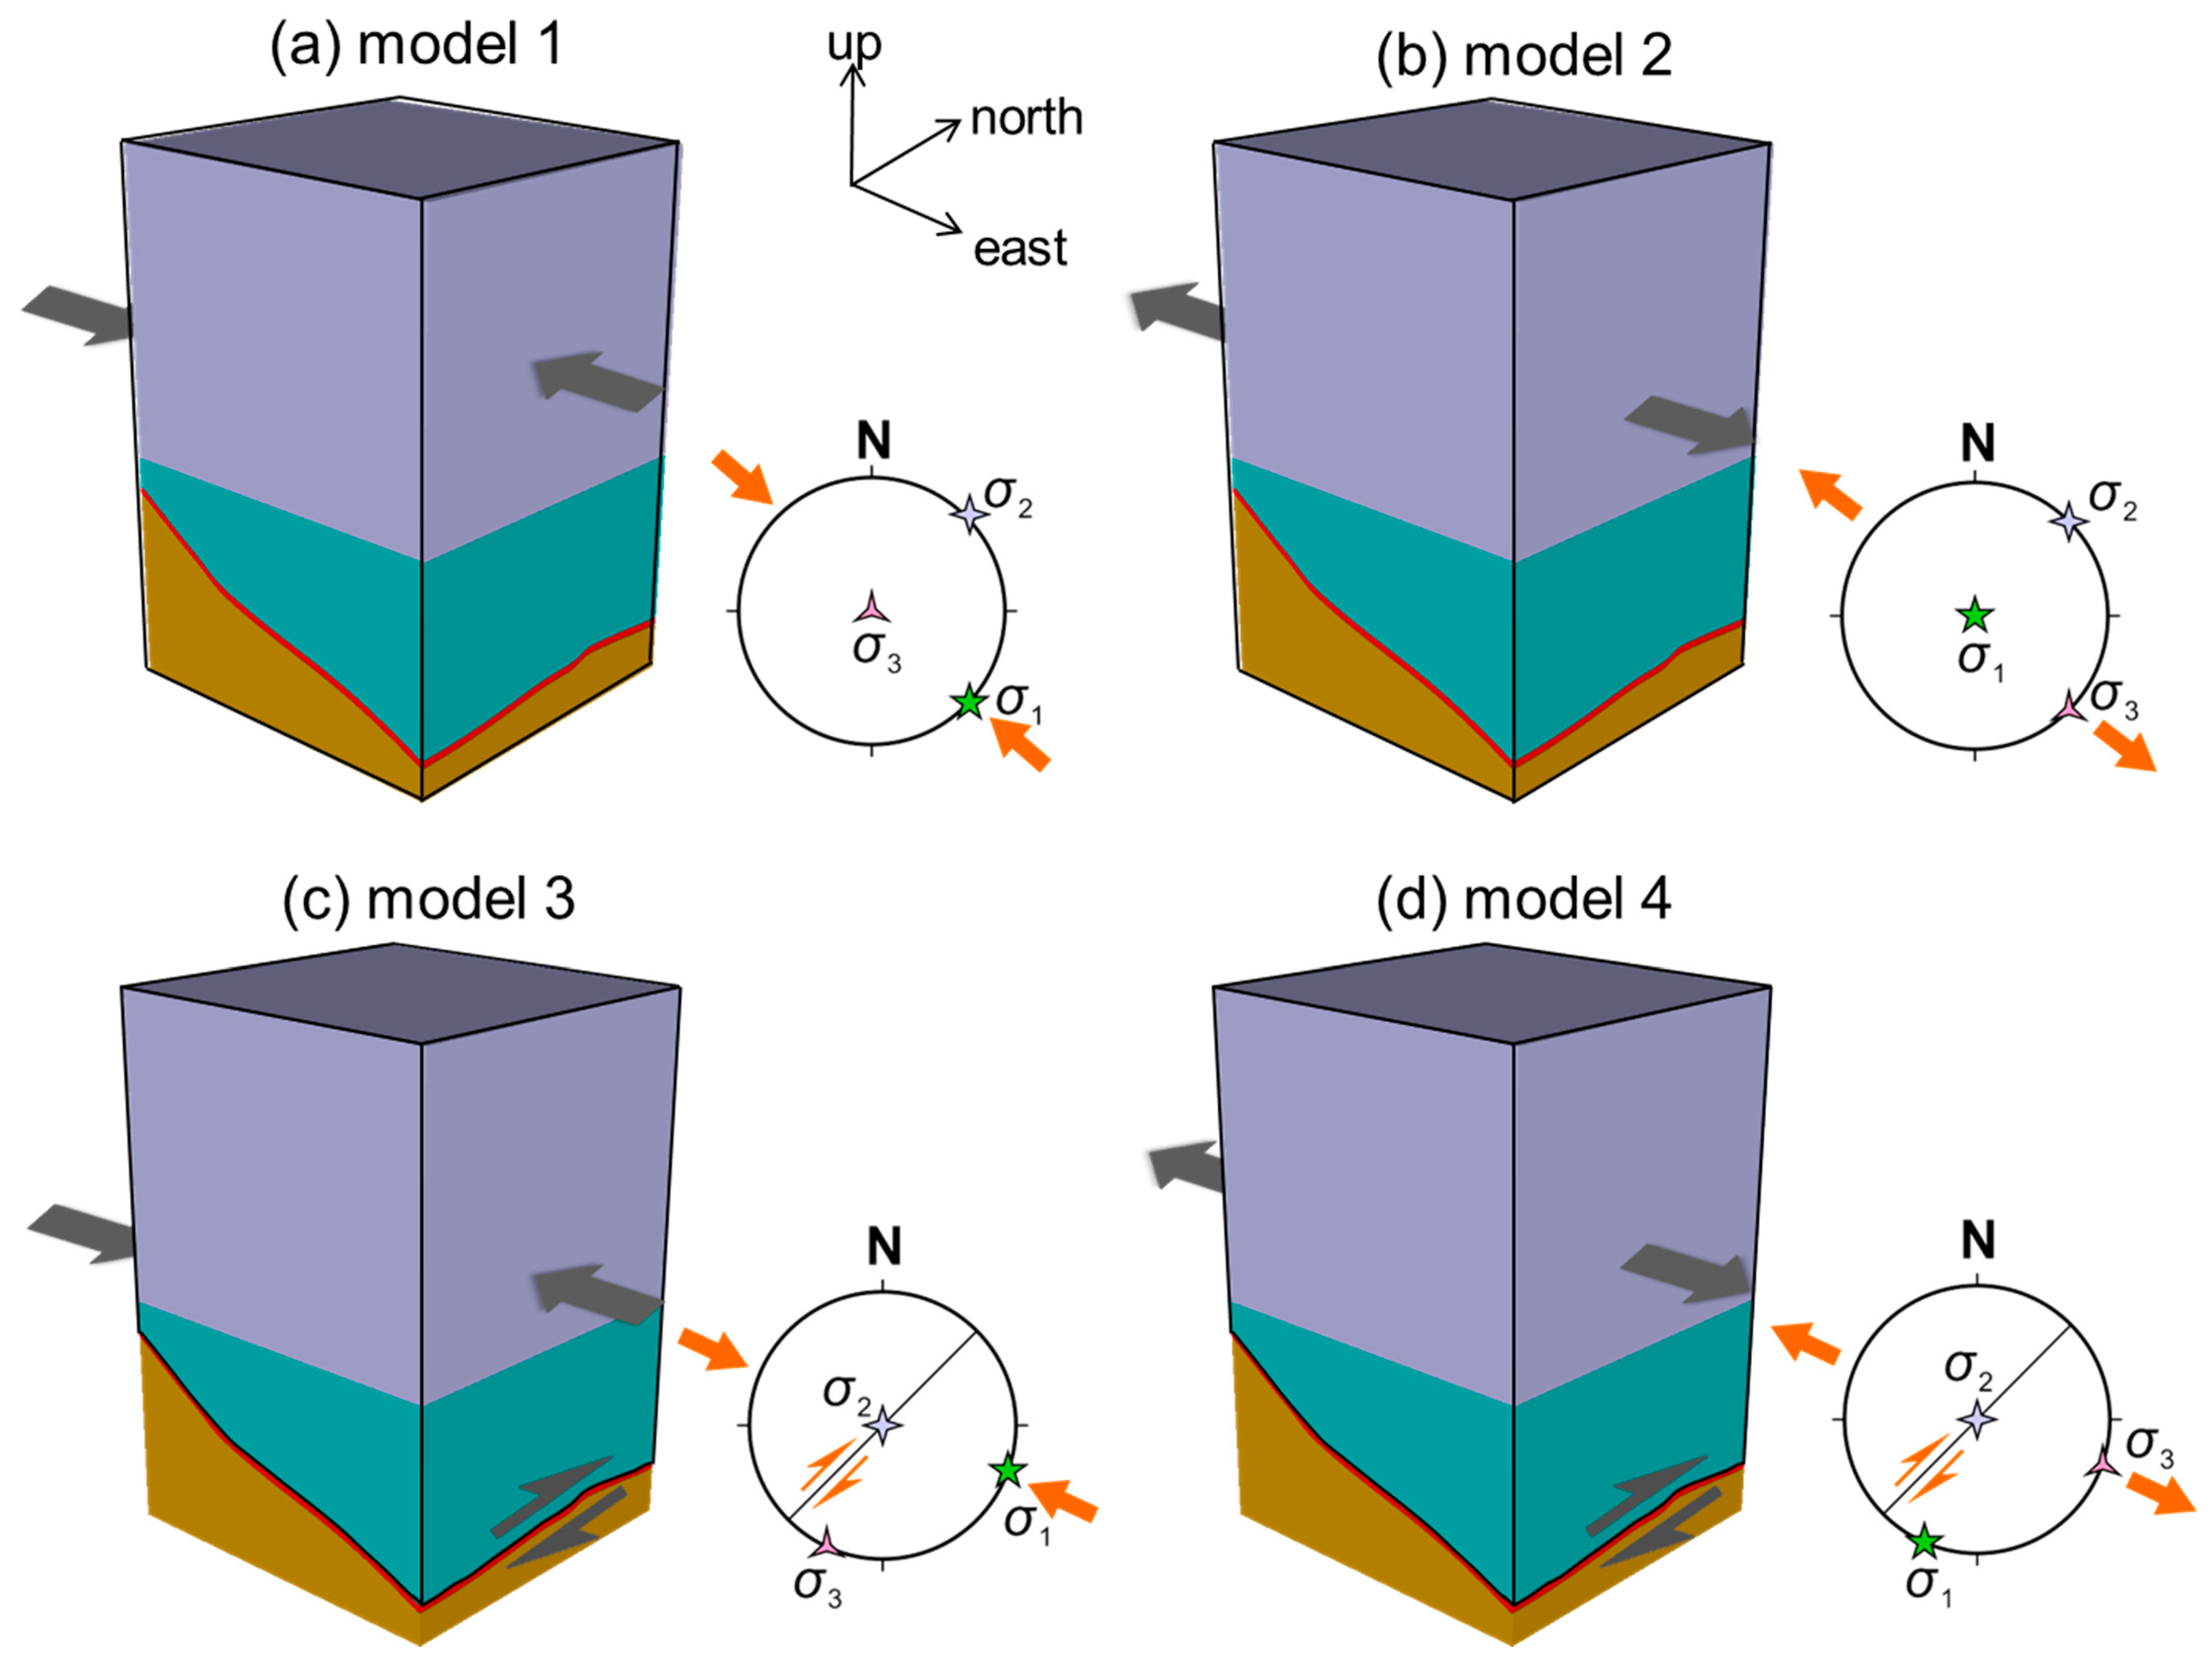
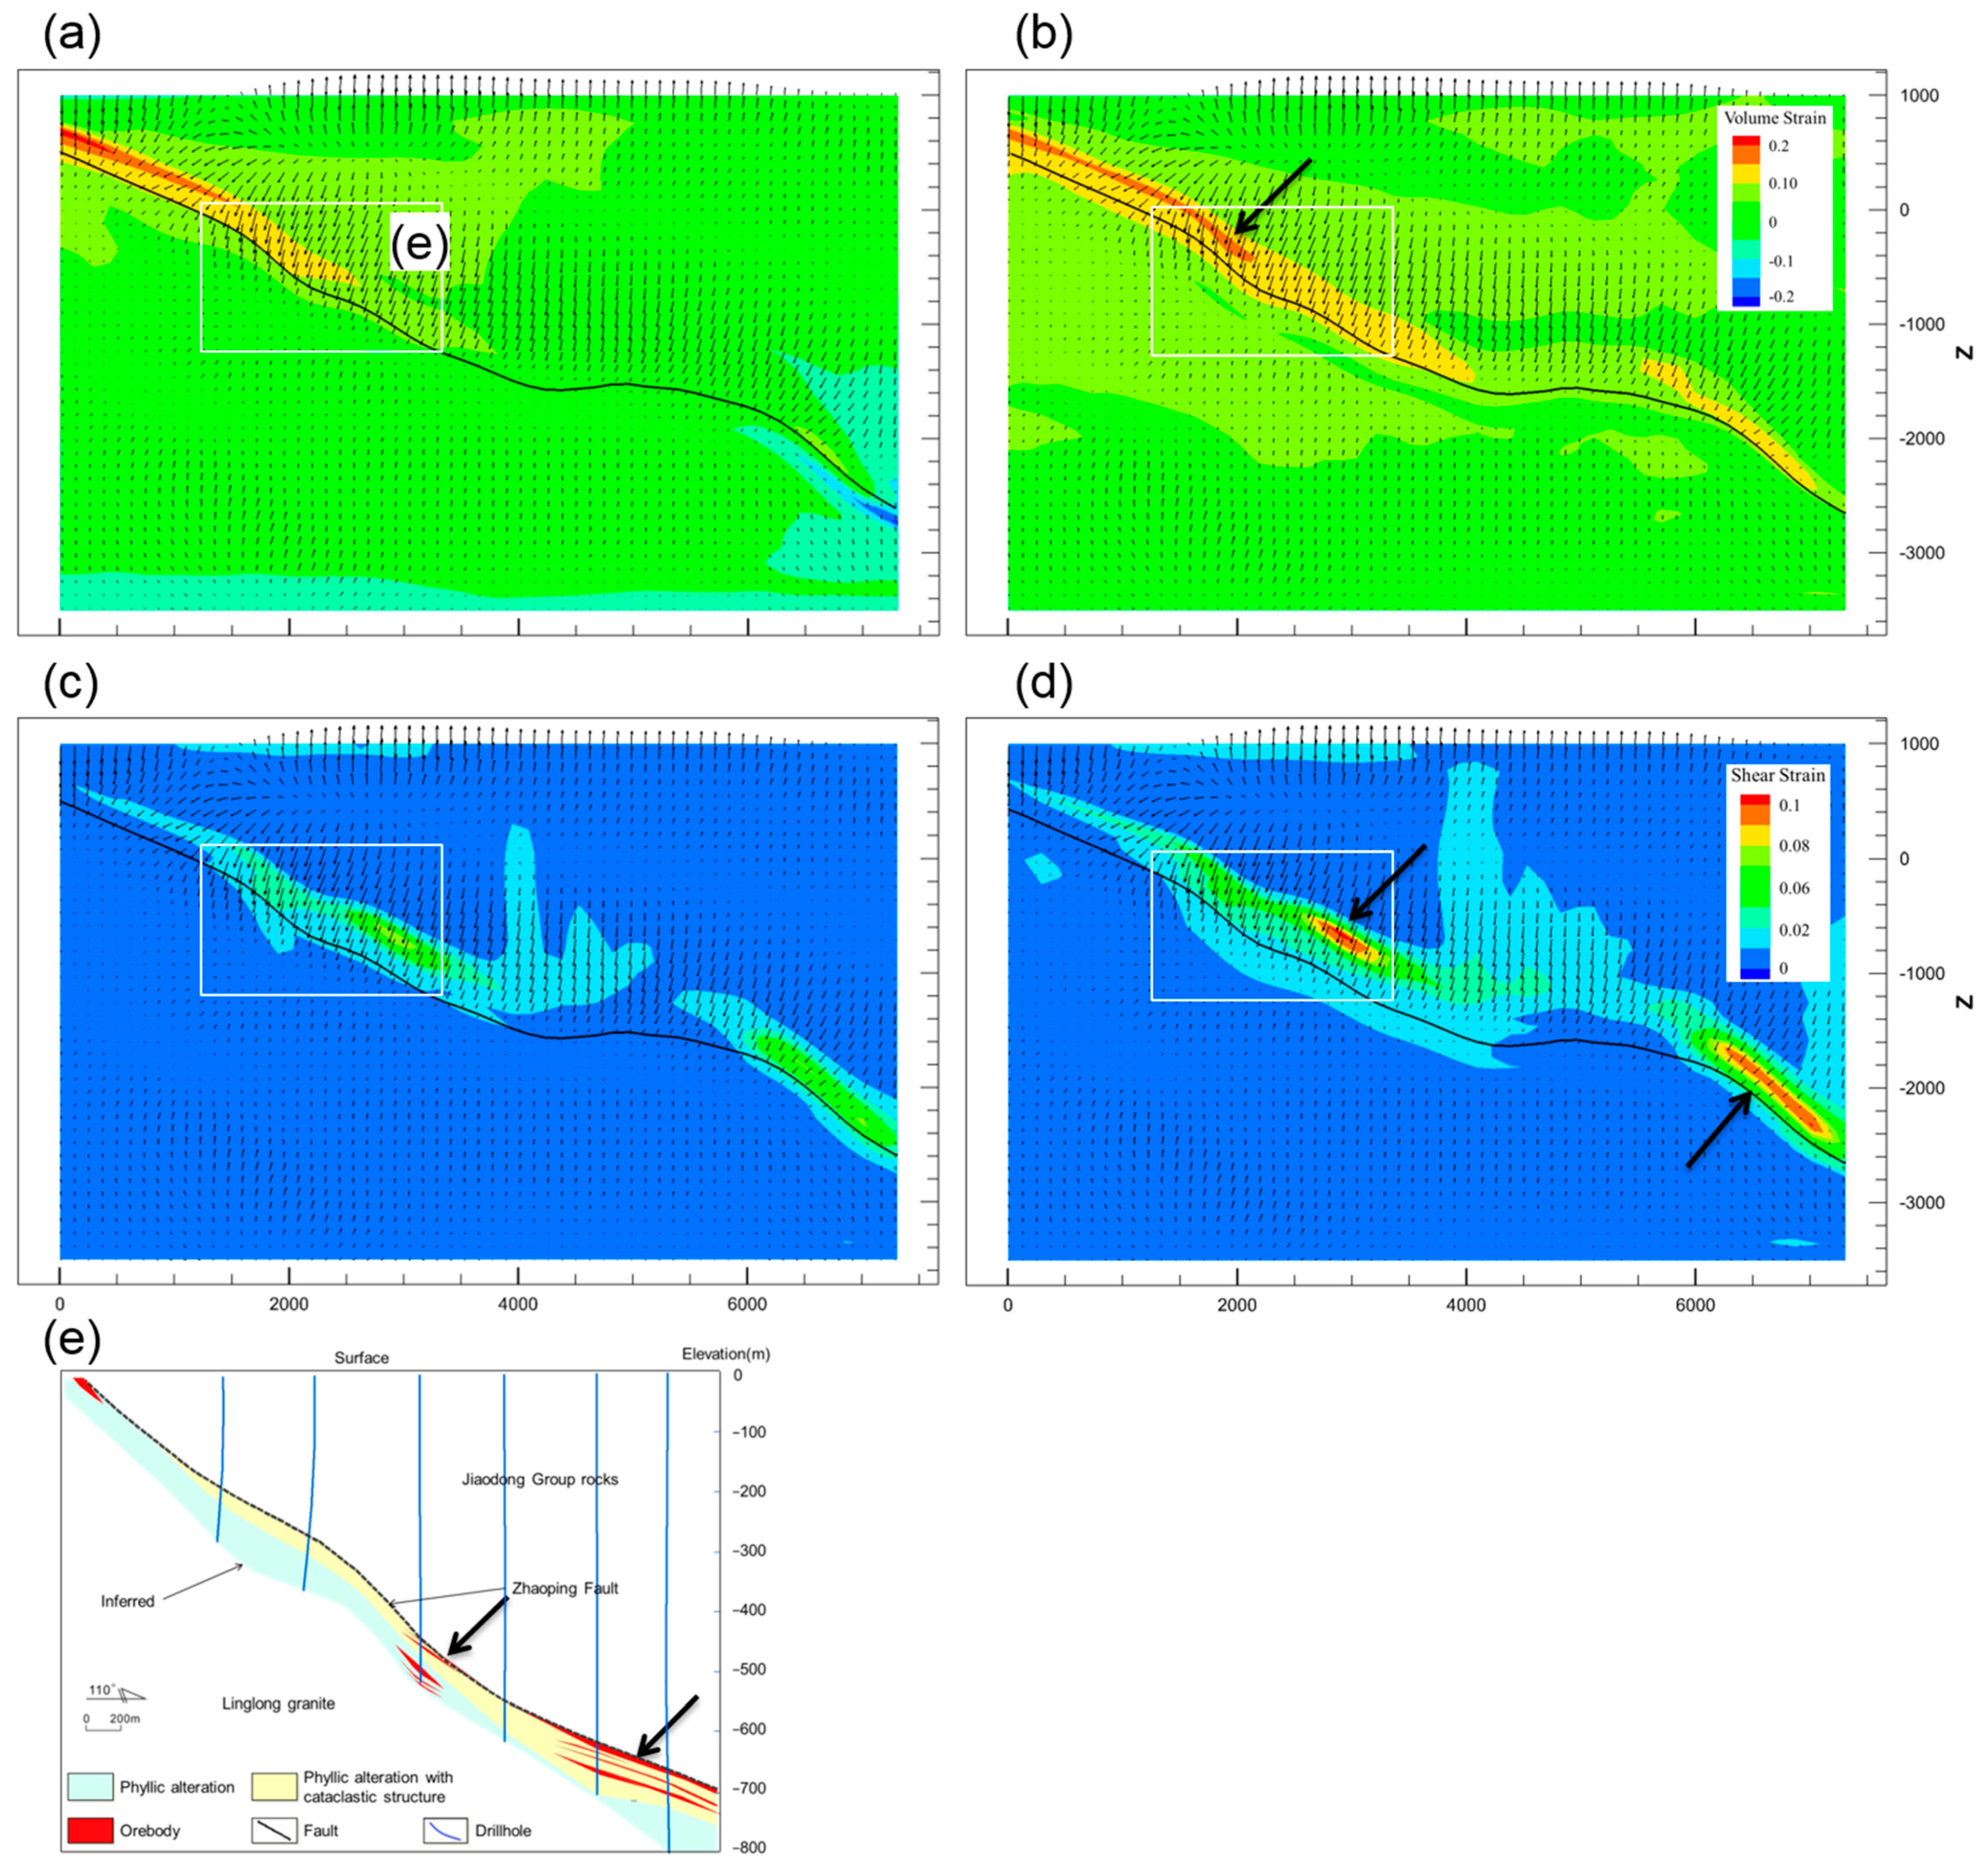
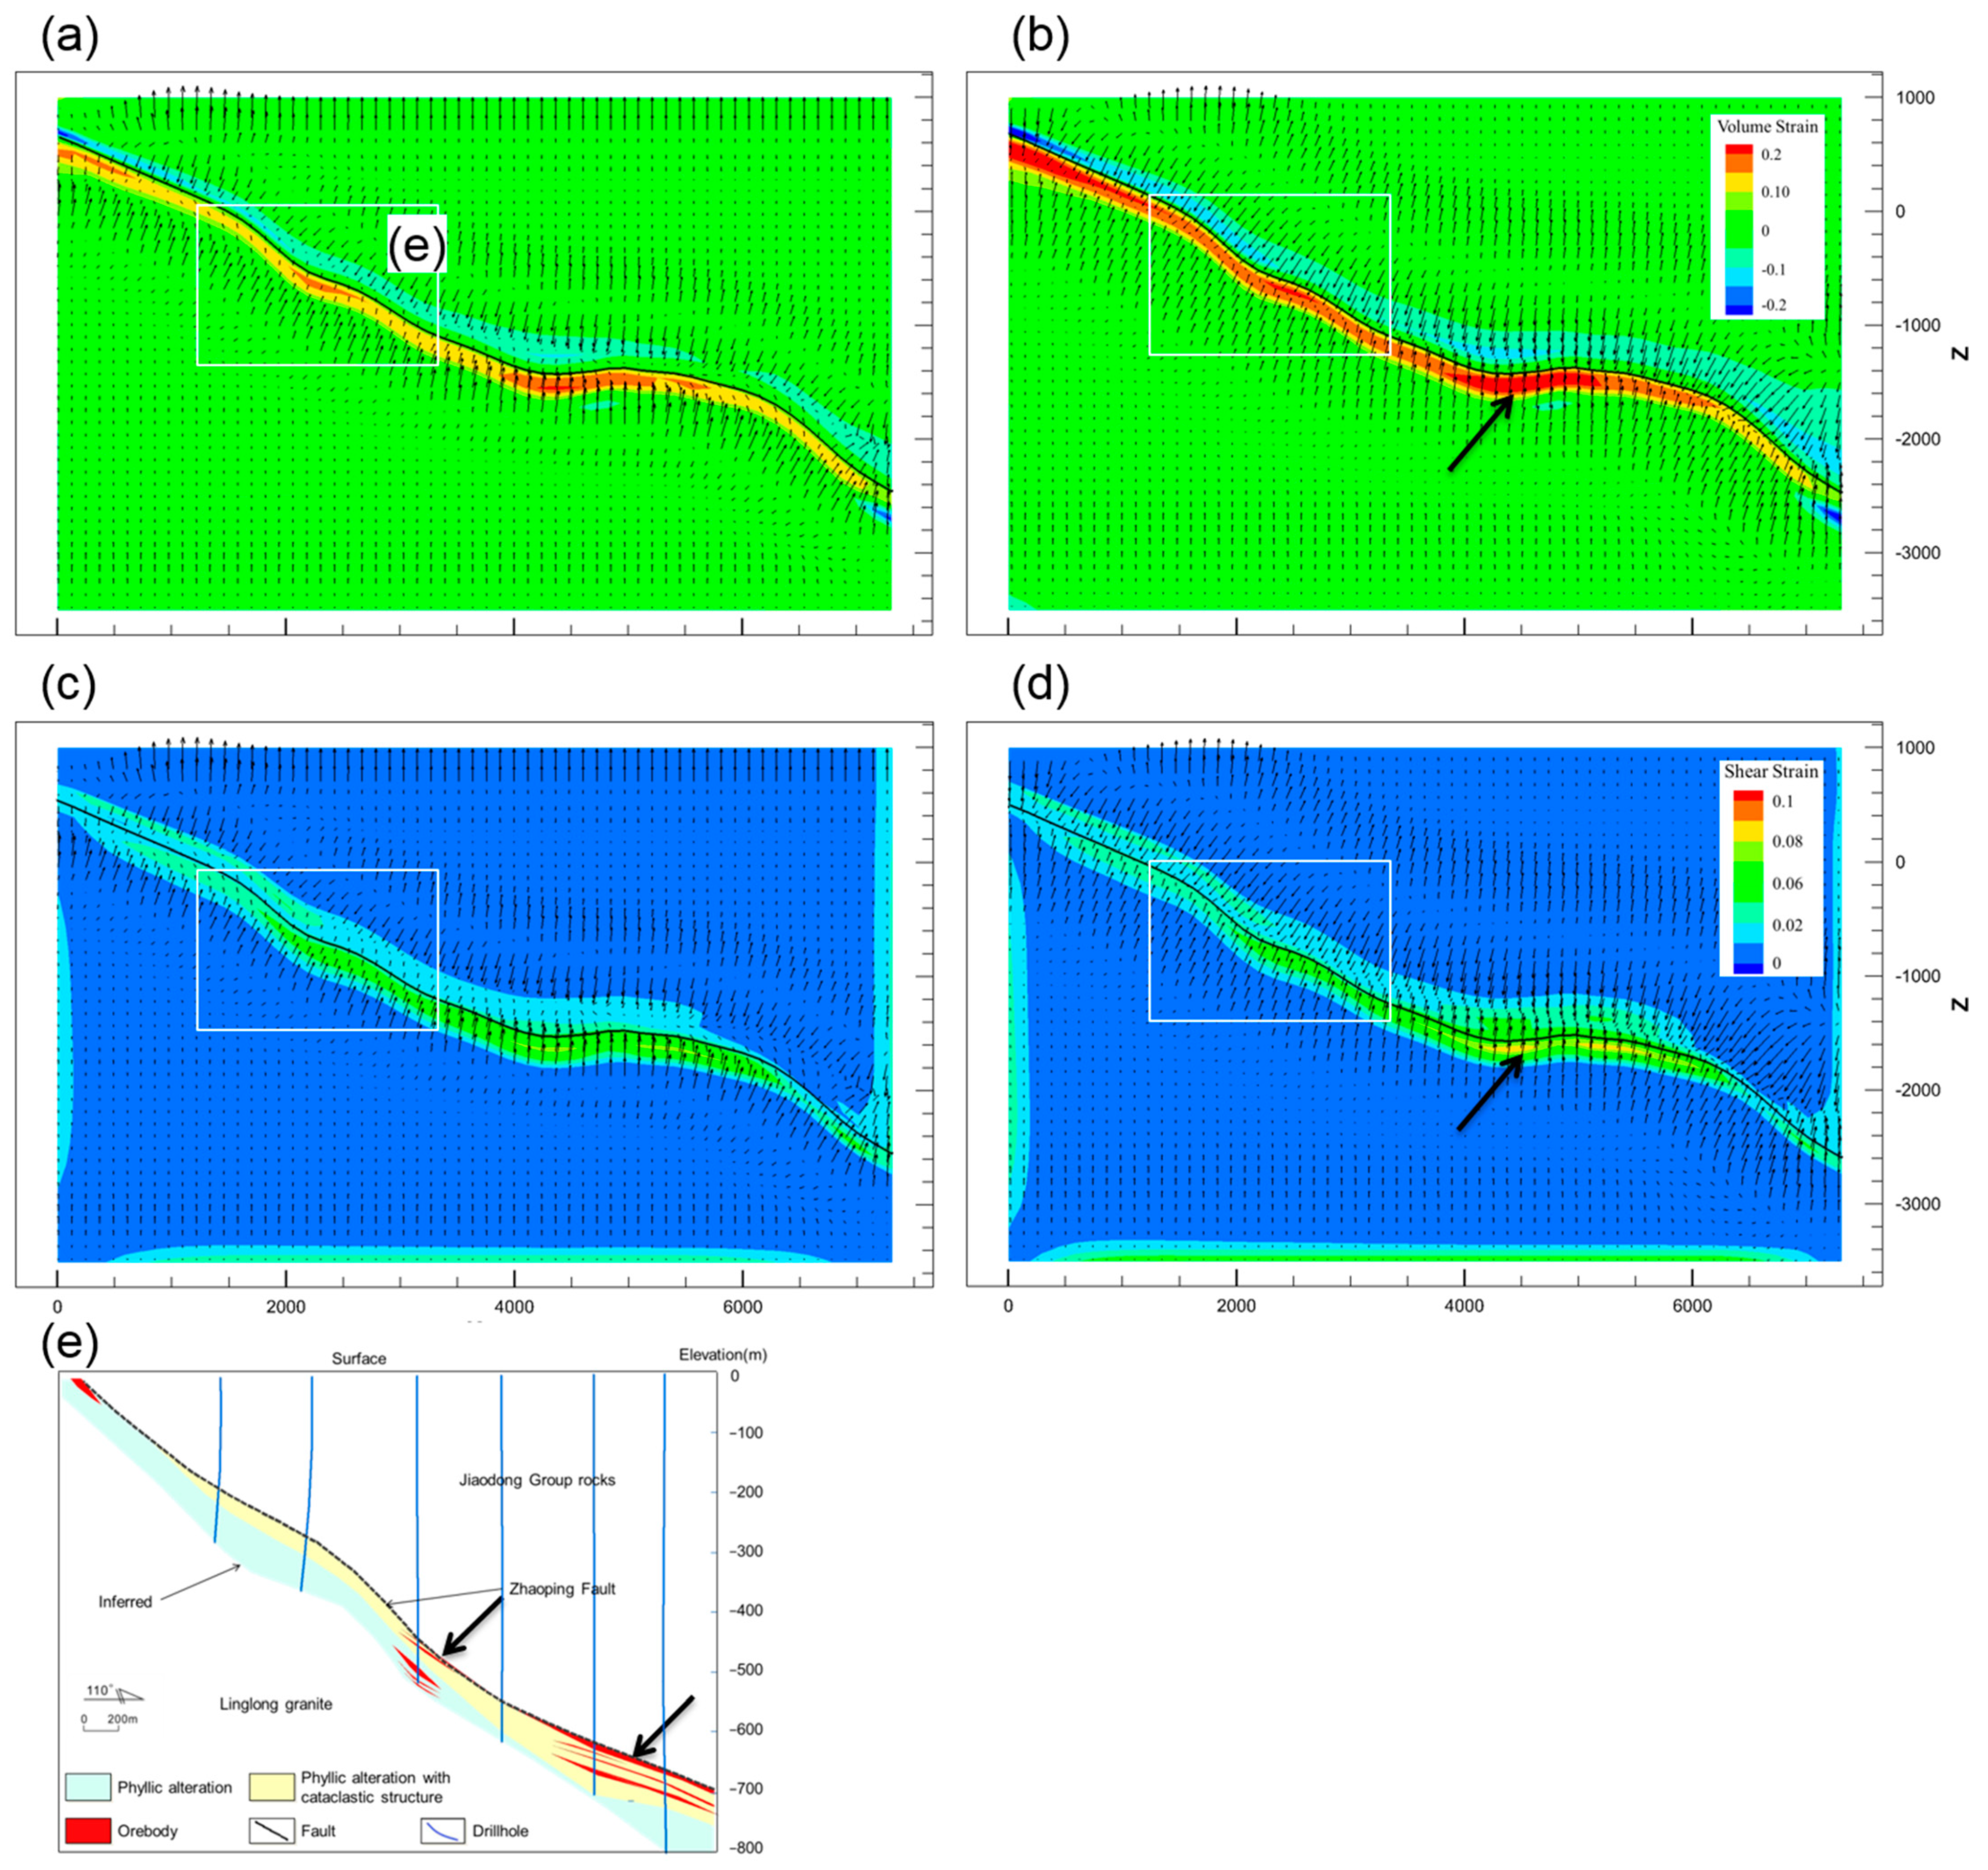
4.1. Model 1: Compression in NW–SE Direction

The model was subjected to a constant compression using the parameters in Table 2. A constant compressive velocity of 1.0 × 10⁻¹⁰ m/s was applied to the left and right boundaries of the model to induce a bulk strain rate. The results show the volumetric strain distribution, shear strain distribution, and fluid flow patterns at the 0.5% and 1% bulk shortening stage (Figure 7). The model was in a compression state, and the deformation was distributed on the interface between the hanging wall and the fault, ranging from 1000 to −1000 m. The inhomogeneity of the rock properties resulted in inhomogeneous bulk strain, and the maximum expansion volume strain of the fault zone was 8.0 × 10⁻³. The fluids migrated upward to the fault because of the increase in the pore pressure in the footwall granite during deformation. The fault zone acted as the conduit for fluid migration and transported fluids from depths into the Jiaodong Group units. When the volume strain was 0.5%, the fluid migration was mainly upward, and when the volume strain was 1%, the fluid migrated into the dilated sites. The average fluid velocity of the surrounding rock was about 2.4 × 10⁻⁵ m/yr, and the maximum fluid velocity of the fault zone was 6.5 × 10⁻⁵ m/yr.

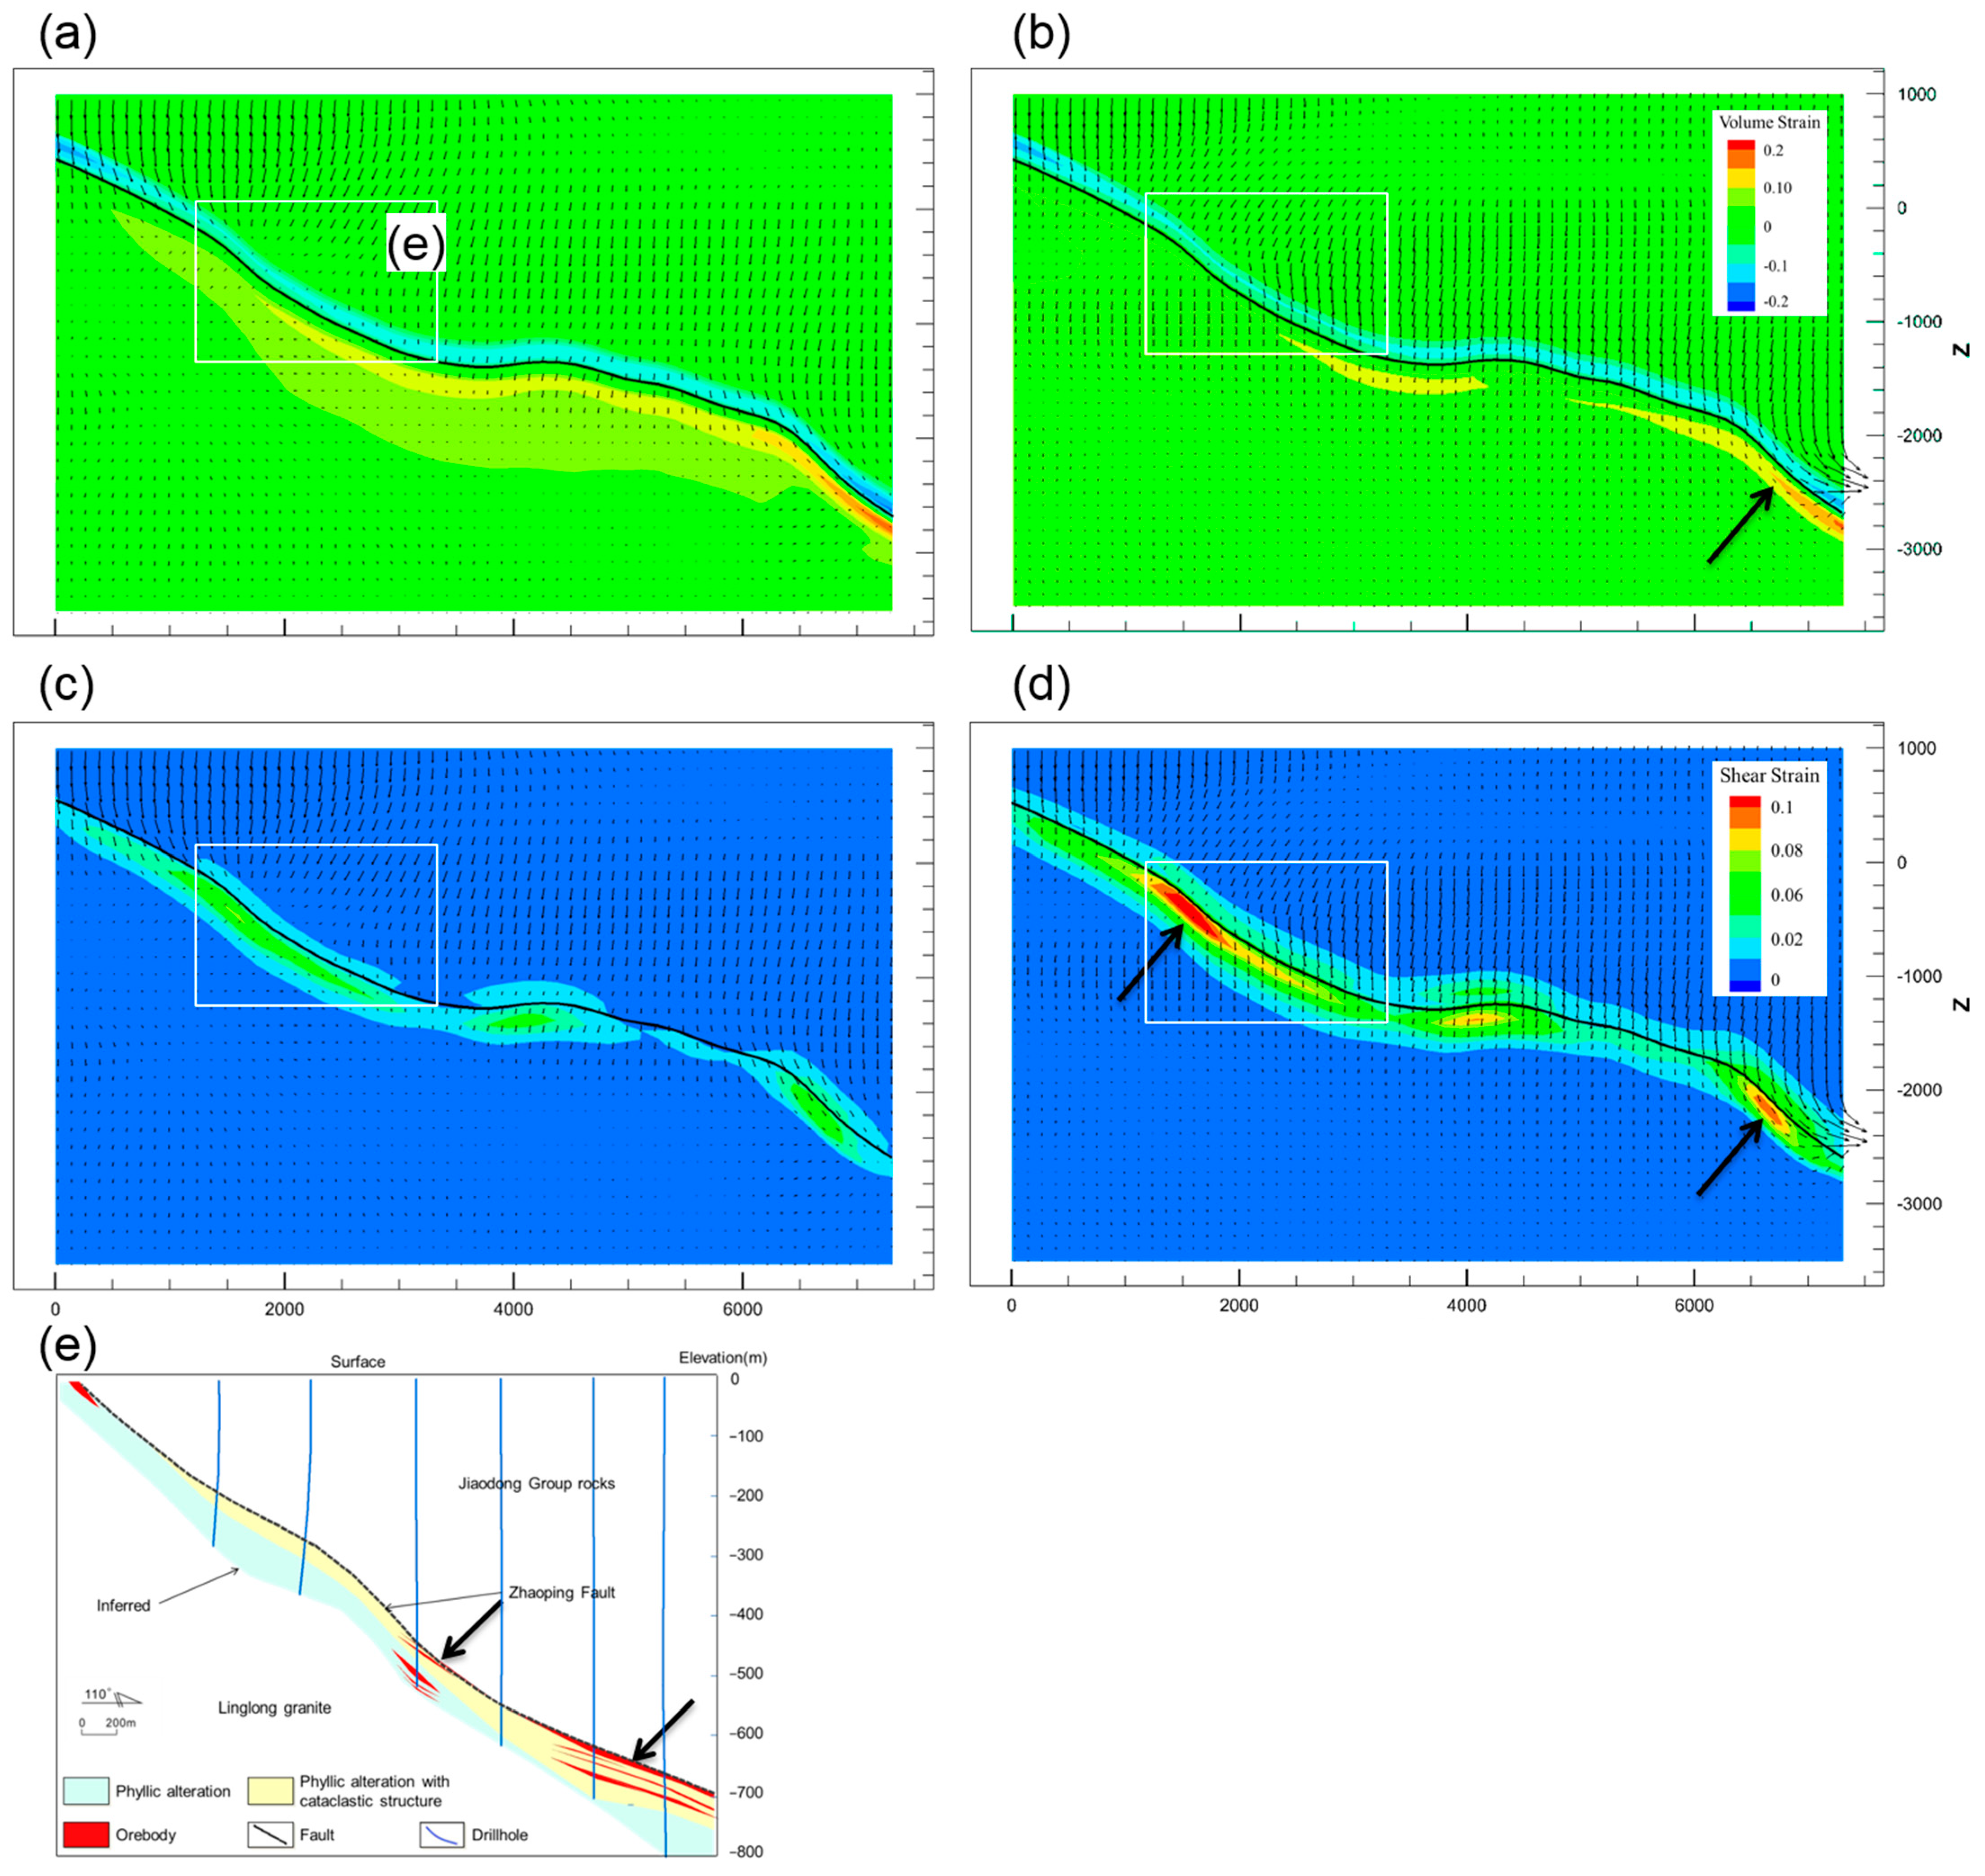
4.2. Model 2: Extension in NW–SE Direction

The second model was tested to evaluate whether the volumetric strain and fluid flow patterns were due to the tensile tectonic stress. Tensile stresses were applied in this model and other parameters were the same as in the first model. A constant tensile velocity of 1.0 × 10⁻¹⁰ m/s was applied to the left and right boundaries of the model to induce bulk strain rates.
After 0.5% bulk shortening (Figure 8a,c), intensive dilation occurred in the wedge area of the fault zone under the influence of tension movement. Fluid flowed slowly towards the fault with fluid flow rates of about 2.1 × 10⁻⁵ m/yr. After 1.0% tension strain (Figure 8b,d), the fault zone was the site of intensive shear strain accumulation, and the shear strain in the wedge area was further enhanced. The difference in shear stress caused by topography began to affect the hydrothermal system and there was a differential dilation deformation on the fault footwall below −1500 m. The maximum positive volumetric strain inside the fault zone was 2.4 × 10⁻², and the fluid flow rate was about 6.2 × 10⁻⁵. It is interesting to note that tectonic stresses gave rise to local expansive deformation to drive downward flow in the model (Figure 8b).

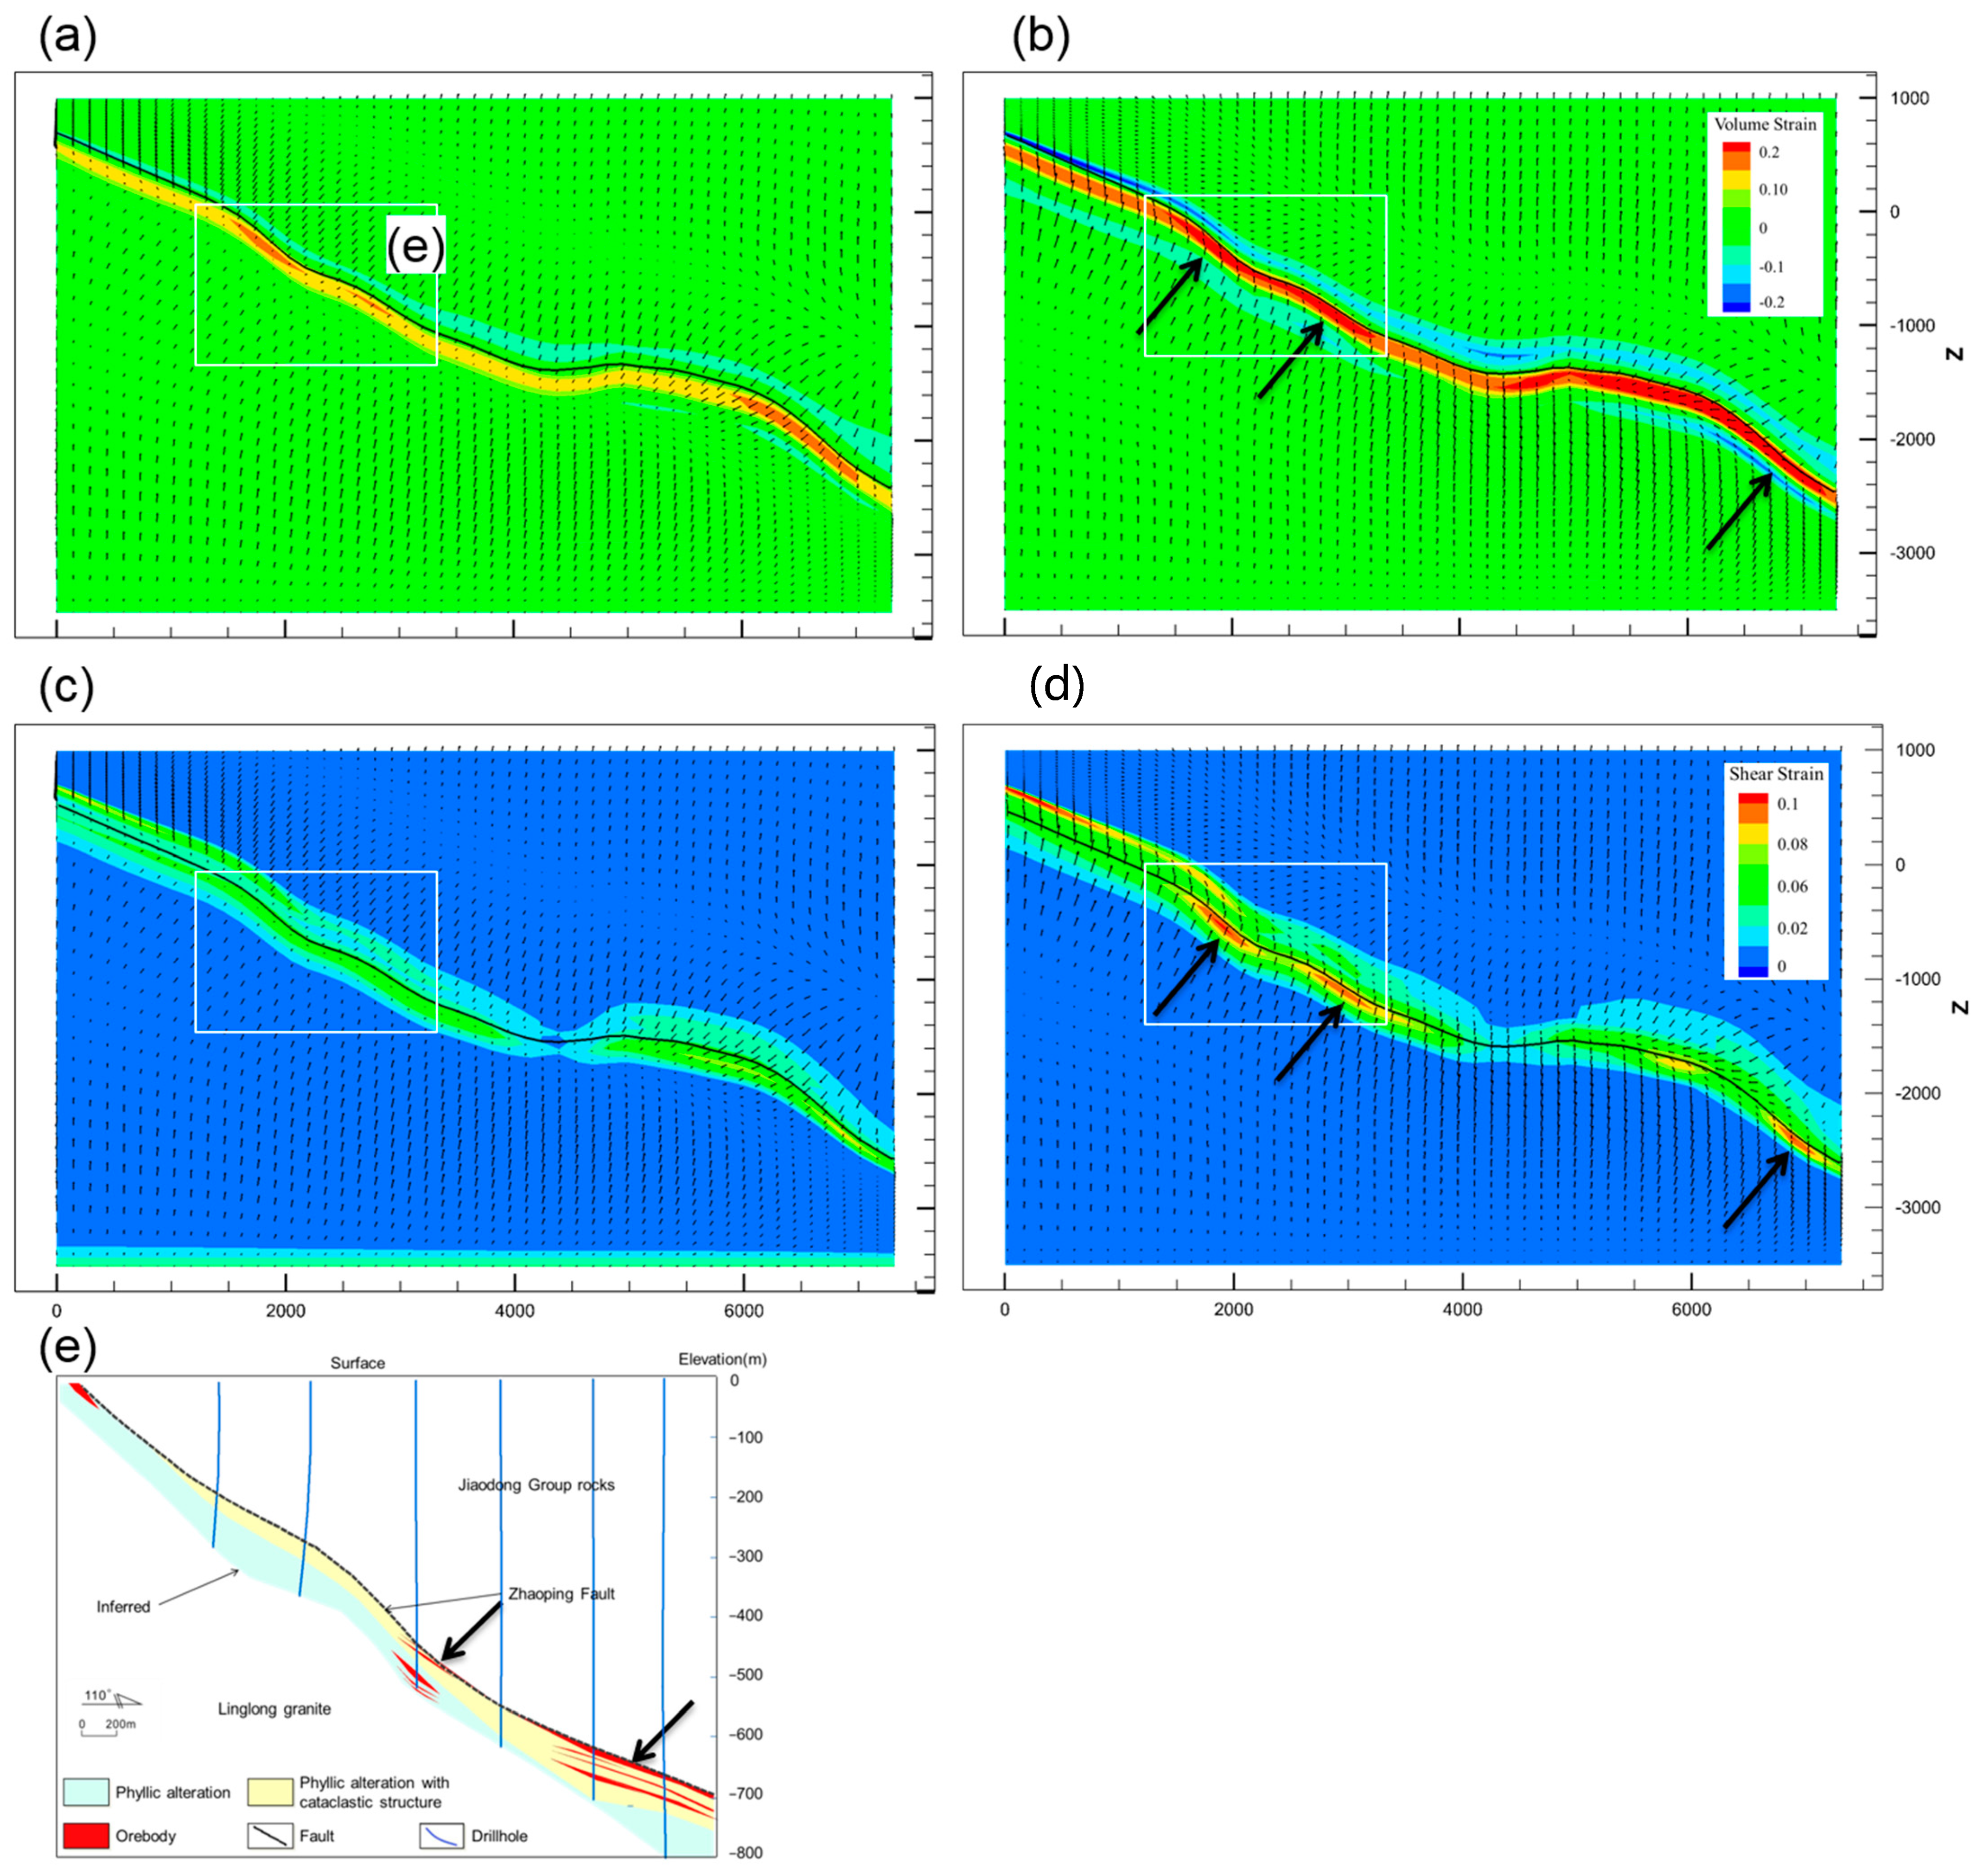
4.3. Model 3: Compression in NW–SE Direction with Dextral Strike-Slip

The scenario with compression and strike-slip was tested to evaluate the influence of reverse strike-slip. The velocity applied was the same as in the previous two models (i.e., 10−11 s−1), and the strike-slip shear stress was applied to the hanging wall and footwall, respectively. At the initial stage, the fluid flow of the whole model was similar to that of Models 1 and 2 (Figure 7a and Figure 8a), and the maximum fluid velocity of the fault zone was 2.4 × 10⁻⁵ m/yr. The fault zone still maintained the most significant volumetric strain localization, with a maximum of 3.6 × 10⁻².
After 1% bulk shortening, the overall distribution patterns of shear and volume strain and related fluids changed (Figure 9b,d) when compared to Models 1 and 2. The volume strain was distributed in the gentle region of the fault and located at depths from −1000 to −1500 m. The fluid tended to flow into the fault zones and migrated upward into the shallow regions along the fault zone; the maximum fluid velocity of the fault zone was 2.7 × 10⁻⁵ m/yr.

4.4. Model 4: Extension in NW–SE Direction with Dextral Strike-Slip

Compared to Model 3, we applied tensile stress instead of compressive stress in Model 4. The volumetric strain, shear strain, and fluid migration distribution are shown in Figure 10. The modeling results suggest that the structural morphological differences of the fault significantly enhanced the control of strain after 0.5% bulk shortening (Figure 10a,b). Due to the inhomogeneous action of tectonic stress, the dilation deformation in the fault zone was discontinuous and the deformation distribution ranged from the surface to −2500 m in the narrow dip angle of the fault. The maximum volumetric strain and fluid velocity of the fault zone were 1.6 × 10⁻² and 2.8 × 10⁻⁵ m/yr, respectively.
As extension progressed (1% of bulk shortening), the strains were more regularly distributed on relatively narrow and thick faults (Figure 10c,d). The distribution of the dilation deformation and fluid flow patterns in the model were consistent with the mineralization pattern (Figure 10b,d). The fault zone was a high-speed channel for conveying fluid from depths toward the surface; the maximum velocity was 5.7 × 10⁻⁵ m/yr, and the velocity decreased to 2.7 × 10⁻⁵ m/yr in locations with gentle dip.
According to the cross-sections (Figure 11), the expansion deformation zone appeared at the sites with dip angles of 35°~60° in the footwall. The expansion deformation zones of section Nos. 82, 86, and 90 extended along with the NE-trending distribution from shallow to deep levels and were consistent with the distribution of the known orebodies. The fluid inflow was significant in zones with a steep fault dip angle.

5. Discussion

5.1. Paleostress Regimes in the Dayingezhuang District

Rock deformation provides channels and facilitates ore-forming fluid flows to form various hydrothermal deposits [71,72,73]. In hydrothermal systems, the sites of shear strain and the related local dilation tend to increase the fluid flux, often resulting in favorable locations for mineral precipitation [18,24,27,29,74]. Based on the Mohr–Coulomb plasticity criterion, shear induces dilatancy, which increases the pore volume of the rock [18,75], and thus, we carried out several experiments to determine the deformation with tectonic stress in various directions (Figure 7, Figure 8, Figure 9 and Figure 10) to better understand the relationship of fluid flow and shear strain, as well as related dilation. A series of numerical simulation experiments, described above, show that in our models, the obvious dilation zones occur in the fault zone (Figure 7, Figure 8, Figure 9 and Figure 10) and vary according to the stress regime.
The fluid flow is related to compression or tension stress in the context of simple mechanical compression and tension, and compressive and extensional deformation leads to fluid flow upward or downward along the fault (Figure 7 and Figure 8). The compression in Model 1 resulted in an overpressure state of the whole system [22,24,27,29]. The compression deformation occurred at the shallow interface between the hanging wall and the fault and extended to deeper levels. Compared to the Jiaodong Group, the low permeability granites were subject to a faster pressure increase (Figure 7), and therefore, the hydraulic head gradient was formed between the granite and Jiaodong Group. The difference between the pore pressure and hydrostatic pressure increased with the increase in strain. In contrast, the extension deformation in Model 2 occurred in the granite at depth on the fault, and the low permeability of the granite [76] experienced a faster pressure decrease than the Jiaodong Group (Figure 8). Fluids migrated downward from the high-permeability fault zone into the underpressure granite. With the increase in the strain rate, the underpressure became more and more significant. Thus, the fluid migration pattern and expansion deformation locations indicate that the stress conditions of Models 1 and 2 are inconsistent with the known distribution of mineralization for the Dayingezhuang gold deposit.
The tensile stress and strike-slip activity of the stratum seem to be crucial factors controlling the expansion deformation at specific parts of the fault in the Dayingezhuang deposit based on our results. In Model 3, the shear stress was distributed in the gentle dip sites of the fault, and the expansion deformation occurred in the geometric depression sites of the fault within the range of −400~−1000 m (Figure 9b), where fluid migrated towards the fault slowly. However, the expansion deformation caused by the compressed state is inconsistent with the known distribution of mineralization. In Model 4, the shear stress was distributed in the sites where the fault is steeply–gently transformed. The continuous expansion zone appears at the position of a 35°~60° dip angle in the contact between the hanging wall and footwall (Figure 10b), which extends deep along the NE direction, where the fluid slowly migrates towards the footwall of the fault. The dilational zones in our modeling, in this case, are consistent with the distribution of known orebodies in the Dayingezhuang deposit. The location of the high-grade mineralization of orebody Nos. 1 and 2 in the Dayingezhuang deposit is closely related to dilation under the fault (Figure 10).

5.2. Metallogenic and Exploration Implications

The sites of tectonic deformation can effectively be used to locate the mineralization sites in the fault and indicate the directions and locations of fluid migration. The Zhaoping fault zone has developed along the NE direction, and the tensile and strike-slip activities have led to the increase in shear stress and rock deformation along the fault strike. Deformation increases the permeability of the rock and facilitates hydrothermal fluid flow [77,78] into the highly permeable fault zone [5]. In Model 4 (Figure 10), the variation of the fault dip angle shows a great influence on the strain distribution and fluid flow patterns. Most of the orebodies in the Dayingezhuang deposit and their controlling faults share similar specific dip angles [79]. The steep dip segments of the fault are open, with lower pressure at the top, resulting in the ore-bearing fluid rapidly migrating along the fault. On the contrary, the gentle segments of the fault are relatively closed, with higher pressure at the top areas, so the ore-bearing fluids diffuse slowly in the lateral direction and are prone to deposition [4]. The sections of the model show (Figure 12) that ore-forming fluids tend to flow to the site of dilation deformation during the migration and pooling processes. Mineralization is highly focused on the footwall of the regional detachment fault zones (Figure 10b) and displays a staircase geometry [4,5] with inhomogeneous spatial distribution.
Structural controls of fluid flow and infiltration are closely related to fault morphology. Tectonic stress is a crucial factor in the fluid migration mechanism, promoting the rapid fluid migration from deep to shallow levels [1,4]. Therefore, when the fluid rises to the dilation sites of the fault, which are the pooling centers for fluids [74,80], the flow of the fluid slows down significantly, and gold may be precipitated during this process (Figure 13). Structural controls in the Dayingezhuang deposit are represented by strain localization and the formation of shear zones and fractures, which eventually influence fluid activity and mineral precipitation [30]. The Zhaoping fault is the only known conduit for the deep auriferous fluid to migrate to the shallow crust [37]. The deformation caused by tectonic stress drives the migration of high-pressure fluid from deep to shallow levels, resulting in fluid accumulation and mineralization in the expansion area (Figure 12). The results of Model 4 show that the most favorable locations for mineralization have a slope range from 15° to 45° and dip angle changes of −10° (Figure 10 and Figure 11). Inhomogeneous tensile tectonic stress leads to discontinuous expansion space, strong and weak variation in mineralization, variation in the orebody grade, and the tendency of gold deposits to pinch out and reappear, as well as to branch and recombine [81]. All of these features indicate the importance of dilation deformation and related fluid activity in the formation of the Dayingezhuang gold deposit.
Our simulation results show the close correlation between the dilational zones and sites of known mineralization in the Dayingezhuang deposit and suggest that the dilational zones may be an effective tool for identifying exploration targets. The No. 2 orebody of the Dayingezhuang deposit extends to deeper levels, which may have contained pooling areas for ore-forming fluids and, thus, has good prospecting potential (Figure 13). The simulation results not only provide reasonable explanations for the formation of the Dayingezhuang deposit in northwest Jiaodong but also highlight the effective utility of numerical simulation for the exploration of tectonic-controlled hydrothermal gold deposits.

6. Conclusions

We present the coupled deformation–fluid flow model of the Dayingezhuang deposit, demonstrate how numerical modeling can be used to determine paleostress background, identify favorable structures for gold mineralization, provide further insight into the mineralizing processes, and highlight areas for future exploration. The numerical modeling results demonstrate that the paleostress orientation of the Zhaoping fault that hosts the Dayingezhuang deposit was NE–SW tensile stress (σ1 NE–SW, σ2 vertical, σ3 NW–SE) with strike-slip deformation during the ore-forming stage. The expansion deformation at specific parts of the fault can effectively locate the mineralization sites and indicate the directions and locations of fluid migration. The direction of fault movement controls the scale and scope of fluid migration. Inhomogeneous extensional tectonic stress leads to discontinuous expansion space, and the NE dilation zone serves as a channel for the migration of gold-bearing fluids. Ore-forming fluids tend to flow to sites of dilation deformation during migration. There is the potential for fluid pooling at a NE depth of the No. 2 orebody, and we suggest this as a future prospecting area. The computational method used in this research is limited with respect to chemical reactions, large-scale deformation, and the phase change method. We suggest that future simulation experiments might improve the numerical simulation results by incorporating these components as well as large-scale deformation simulation experiments for the northwestern Jiaodong Peninsula, which may provide new constraints for the paleostress and help us better clarify the stress background.

Author Contributions

Conceptualization, X.M. and Z.L.; experiments, S.X. and Z.L.; field investigation, Z.L.; writing—original draft preparation, S.X.; writing—review and editing, X.M., Z.L., H.D., J.C. and K.X. All authors have read and agreed to the published version of the manuscript.

Funding

This research was funded by the National Natural Science Foundation of China (grant numbers 42030809, 41972309, 42072325, and 42172328) and the National Key R&D Program of China (grant number 2017YFC0601503).

Acknowledgments

Three anonymous reviewers are greatly thanked for their constructive comments on this paper. Richard C. Bayless, who provided linguistic assistance, is appreciated. We thank Lei Tang, Qifa Shi, and Yongchao Guo of Zhaojin Mining Industry Co., Ltd. for their assistance during the field investigation at the Dayingezhuang gold mine.

Conflicts of Interest

The authors declare no conflict of interest.

References

  1. Goldfarb, R.J.; Santosh, M. The dilemma of the Jiaodong gold deposits: Are they unique? Geosci. Front. 2014, 5, 139–153. [Google Scholar] [CrossRef] [Green Version]
  2. Deng, J.; Wang, Q.F.; Wan, L.; Yang, L.Q.; Gong, Q.J.; Zhao, J.; Liu, H. Self-similar fractal analysis of gold mineralization of Dayingezhuang disseminated-veinlet deposit in Jiaodong gold province, China. J. Geochem. Explor. 2009, 102, 95–102. [Google Scholar] [CrossRef]
  3. Li, L.; Santosh, M.; Li, S.R. The ‘Jiaodong type’ gold deposits: Characteristics, origin and prospecting. Ore Geol. Rev. 2015, 65, 589–611. [Google Scholar] [CrossRef]
  4. Song, M.C.; Li, S.Z.; Santosh, M.; Zhao, S.J.; Yu, S.; Yi, P.H.; Cui, S.X.; Lv, G.X.; Xu, J.X.; Song, Y.X.; et al. Types, characteristics and metallogenesis of gold deposits in the Jiaodong Peninsula, Eastern North China Craton. Ore Geol. Rev. 2015, 65, 612–625. [Google Scholar] [CrossRef]
  5. Yang, L.; Zhao, R.; Wang, Q.F.; Liu, X.F.; Carranza, E.J.M. Fault geometry and fluid-rock reaction: Combined controls on mineralization in the Xinli gold deposit, Jiaodong Peninsula, China. J. Struct. Geol. 2018, 111, 14–26. [Google Scholar] [CrossRef]
  6. Fan, H.R.; Feng, K.; Li, X.H.; Hu, F.F.; Yang, K.F. Mesozoic gold mineralization in the Jiaodong and Korean peninsulas. Acta Petrol. Sin. 2016, 32, 3225–3238. [Google Scholar]
  7. Liu, Z.; Mao, X.; Jedemann, A.; Bayless, R.C.; Deng, H.; Chen, J.; Xiao, K. Evolution of Pyrite Compositions at the Sizhuang Gold Deposit, Jiaodong Peninsula, Eastern China: Implications for the Genesis of Jiaodong-Type Orogenic Gold Mineralization. Minerals 2021, 11, 344. [Google Scholar] [CrossRef]
  8. Liu, S. On the model of space location of ore bodies and its mechanism of LingLong-type gold ore deposit. Earth Sci. J. Wuhan Coll. Geol. 1984, 27, 47–56. [Google Scholar]
  9. Hu, S.; Ye, Y.; Liu, H. The significance of terrane tectonics related to metallogeny of gold deposits. Gold Geol. 2001, 7, 1–8. [Google Scholar]
  10. Song, M.; Yi, P.; Cui, S.; Xu, J.; Zhou, M.; Jiang, H.; Huang, T. Thermal Uplifting-Extension Ore-forming Theory and Its Prospecting Significance in Jiaodong Gold Deposit. Shandong Land Resour. 2013, 29, 1–12. [Google Scholar]
  11. Liu, Z.-K.; Mao, X.-C.; Wang, F.-Y.; Tang, L.; Chen, G.-H.; Chen, J.; Deng, H. Deciphering anomalous Ag enrichment recorded by galena in Dayingezhuang Au(-Ag) deposit, Jiaodong Peninsula, Eastern China. Trans. Nonferrous Met. Soc. China 2021, 31, 3831–3846. [Google Scholar] [CrossRef]
  12. Wang, J.; Wang, G.; Tang, J. New realization on metallotectonic reging of the gold deposits in Linglong-Jiaojia district of Shandong. J. Guilin Univ. Technol. 2002, 22, 1–4. [Google Scholar]
  13. Yang, L.; Deng, J.; Goldfarb, R.J.; Zhang, J.; Gao, B.; Wang, Z. Ar-40/Ar-39 geochronological constraints on the formation of the Dayingezhuang gold deposit: New implications for timing and duration of hydrothermal activity in the Jiaodong gold province, China. Gondwana Res. 2014, 25, 1469–1483. [Google Scholar] [CrossRef] [Green Version]
  14. Li, H.; Zhou, C.; Geng, K. Intra-continental extensional tectonics of the Tan-Lu fault zone: An example from the appearance characteristics of the Yishu fault zone. Earth Sci. Front. 2017, 24, 073–084. [Google Scholar] [CrossRef]
  15. Li, Y.; Li, H.; Chen, G. On the Compression-extensional Tectonic Environment and Gold Mineralization in the Jiaodong Area, Shandong Province. Geotecton. Metallog. 2019, 43, 1117–1132. [Google Scholar] [CrossRef]
  16. Deng, J.; Yang, L.Q.; Li, R.H.; Groves, D.I.; Santosh, M.; Wang, Z.L.; Sai, S.X.; Wang, S.R. Regional structural control on the distribution of world-class gold deposits: An overview from the Giant Jiaodong Gold Province, China. Geol. J. 2019, 54, 378–391. [Google Scholar] [CrossRef] [Green Version]
  17. Yang, L.; Li, R.; Gao, X.; Qiu, K.; Zhang, L. A preliminary study of extreme enrichment of critical elements in the Jiaodong gold deposits, China. Acta Petrol. Sin. 2020, 36, 1285–1314. [Google Scholar] [CrossRef]
  18. Oliver, N.H.S.; McLellan, J.G.; Hobbs, B.E.; Cleverley, J.S.; Ord, A.; Feltrin, L. Numerical models of extensional deformation, heat transfer, and fluid flow across basement-cover interfaces during basin-related mineralization. Econ. Geol. 2006, 101, 1–31. [Google Scholar] [CrossRef]
  19. Hobbs, B.E.; Zhang, Y.; Ord, A.; Zhao, C. Application of coupled deformation, fluid flow, thermal and chemical modelling to predictive mineral exploration. J. Geochem. Explor. 2000, 69–70, 505–509. [Google Scholar] [CrossRef]
  20. Zhao, C.; Hobbs, B.; Ord, A. Fundamentals of Computational Geoscience: Numerical Methods and Algorithms; Lecture Notes in Earth Sciences; Springer; Berlin/Heidelberg, Germany, 2009; Volume 122, pp. 1–257. [Google Scholar] [CrossRef]
  21. Liu, L.; Wan, C.; Zhao, C.; Zhao, Y. Geodynamic constraints on orebody localization in the Anqing orefield, China: Computational modeling and facilitating predictive exploration of deep deposits. Ore Geol. Rev. 2011, 43, 249–263. [Google Scholar] [CrossRef]
  22. Liu, L.; Zhao, Y.; Sun, T. 3D computational shape- and cooling process-modeling of magmatic intrusion and its implication for genesis and exploration of intrusion-related ore deposits: An example from the Yueshan intrusion in Anqing, China. Tectonophysics 2012, 526, 110–123. [Google Scholar] [CrossRef]
  23. Beniest, A.; Koptev, A.; Burov, E. Numerical models for continental break-up: Implications for the South Atlantic. Earth Planet. Sci. Lett. 2017, 461, 176–189. [Google Scholar] [CrossRef] [Green Version]
  24. Cui, T.; Yang, J.; Samson, I.M. Tectonic Deformation and Fluid Flow: Implications for the Formation of Unconformity-Related Uranium Deposits. Econ. Geol. 2012, 107, 147–163. [Google Scholar] [CrossRef]
  25. Chi, G.; Bosman, S.; Card, C. Numerical modeling of fluid pressure regime in the Athabasca baSin. and implications for fluid flow models related to the unconformity-type uranium mineralization. J. Geochem. Explor. 2013, 125, 8–19. [Google Scholar] [CrossRef]
  26. Freeburn, R.; Bouilhol, P.; Maunder, B.; Magni, V.; van Hunen, J. Numerical models of the magmatic processes induced by slab breakoff. Earth Planet. Sci. Lett. 2017, 478, 203–213. [Google Scholar] [CrossRef] [Green Version]
  27. Sun, T.; Liu, L. Delineating the complexity of Cu–Mo mineralization in a porphyry intrusion by computational and fractal modeling: A case study of the Chehugou deposit in the Chifeng district, Inner Mongolia, China. J. Geochem. Explor. 2014, 144, 128–143. [Google Scholar] [CrossRef]
  28. Li, Z.; Chi, G.; Bethune, K.M.; Eldursi, K.; Thomas, D.; Quirt, D.; Ledru, P. Synchronous egress and ingress fluid flow related to compressional reactivation of basement faults: The Phoenix and Gryphon uranium deposits, southeastern Athabasca Basin, Saskatchewan, Canada. Miner. Depos. 2017, 53, 277–292. [Google Scholar] [CrossRef]
  29. Li, Z.; Chi, G.; Bethune, K.M.; Thomas, D.; Zaluski, G. Structural Controls on Fluid Flow During Compressional Reactivation of Basement Faults: Insights from Numerical Modeling for the Formation of Unconformity-Related Uranium Deposits in the Athabasca Basin, Canada. Econ. Geol. 2017, 112, 451–466. [Google Scholar] [CrossRef]
  30. Zhang, Y.; Robinson, J.; Schaubs, P. Numerical modelling of structural controls on fluid flow and mineralization. Geosci. Front. 2011, 2, 449–461. [Google Scholar] [CrossRef] [Green Version]
  31. Liu, X.; Xiao, C.; Zhang, S.; Chen, B. Numerical Modeling of Deformation at the Baiyun Gold Deposit, Northeastern China: Insights into the Structural Controls on Mineralization. J. Earth Sci.-China 2021, 32, 174–184. [Google Scholar] [CrossRef]
  32. Hu, X.; Li, X.; Yuan, F.; Ord, A.; Jowitt, S.M.; Li, Y.; Dai, W.; Zhou, T. Numerical modeling of ore-forming processes within the Chating Cu-Au porphyry-type deposit, China: Implications for the longevity of hydrothermal systems and potential uses in mineral exploration. Ore Geol. Rev. 2020, 116, 103230. [Google Scholar] [CrossRef]
  33. Liu, L.; Li, J.; Zhou, R.; Sun, T. 3D modeling of the porphyry-related Dawangding gold deposit in south China: Implications for ore genesis and resources evaluation. J. Geochem. Explor. 2016, 164, 164–185. [Google Scholar] [CrossRef]
  34. Zhou, T.; Lü, G. Tectonics, granitoids and mesozoic gold deposits in East Shandong, China. Ore Geol. Rev. 2000, 16, 71–90. [Google Scholar] [CrossRef]
  35. Deng, J.; Wang, Q.F.; Wan, L.; Liu, H.; Yang, L.Q.; Zhang, J. A multifractal analysis of mineralization characteristics of the Dayingezhuang disseminated-veinlet gold deposit in the Jiaodong gold province of China. Ore Geol. Rev. 2011, 40, 54–64. [Google Scholar] [CrossRef]
  36. Liu, Z.; Chen, J.; Mao, X.; Tang, L.; Shuyan, Y.; Deng, H.; Wang, J.; Liu, Y.; Li, S.; Bayless, R. Spatial Association Between Orogenic Gold Mineralization and Structures Revealed by 3D Prospectivity Modeling: A Case Study of the Xiadian Gold Deposit, Jiaodong Peninsula, China. Nat. Resour. Res. 2021, 30, 3987–4007. [Google Scholar] [CrossRef]
  37. Mao, X.; Ren, J.; Liu, Z.; Chen, J.; Tang, L.; Deng, H.; Bayless, R.C.; Yang, B.; Wang, M.; Liu, C. Three-dimensional prospectivity modeling of the Jiaojia-type gold deposit, Jiaodong Peninsula, Eastern China: A case study of the Dayingezhuang deposit. J. Geochem. Explor. 2019, 203, 27–44. [Google Scholar] [CrossRef]
  38. Zhang, R.Z.; Gao, B.F.; Guo, C.Y.; Song, J.J.; Fu, J.L. Orebody locating and mineral prospecting in Dayingezhuang gold deposit, Shandong province. Gold 2008, 29, 9–13. [Google Scholar]
  39. Qiu, Y.; Groves, D.I.; McNaughton, N.J.; Wang, L.-g.; Zhou, T. Nature, age, and tectonic setting of granitoid-hosted, orogenic gold deposits of the Jiaodong Peninsula, eastern North China craton, China. Miner. Depos. 2002, 37, 283–305. [Google Scholar] [CrossRef]
  40. Yang, L.; Deng, J.; Wang, Q.; Zhou, Y. Coupling Effects on Gold Mineralization of Deep and Shallow Structures in the Northwestern Jiaodong Peninsula, Eastern China. Acta Geol. Sin. Engl. Ed. 2006, 80, 400–411. [Google Scholar] [CrossRef]
  41. Yang, L.Q.; Deng, J.; Guo, R.P.; Guo, L.N.; Wang, Z.L.; Chen, B.H.; Wang, X.D. World-class Xincheng gold deposit: An example from the giant Jiaodong gold province. Geosci. Front. 2016, 7, 419–430. [Google Scholar] [CrossRef] [Green Version]
  42. Shen, K.; Hu, S.X.; Sun, J.G.; Ling, H.F.; Zhao, Y.Y.; Sun, M.Z. Characteristics of ore-forming fluids of the Dayingezhuang gold deposit in Eastern Shandong, China. Acta Petrol. Sin. 2000, 16, 542–550. [Google Scholar]
  43. Fan, H.; Zhai, M.; Xie, Y.; Yang, J.-H. Ore-forming fluids associated with granite-hosted gold mineralization at the Sanshandao deposit, Jiaodong gold province, China. Miner. Depos. 2003, 38, 739–750. [Google Scholar] [CrossRef]
  44. Wallace, R.E. Geometry of Shearing Stress and Relation to Faulting. J. Geol. 1951, 59, 118–130. [Google Scholar] [CrossRef]
  45. Bott, M.H.P. The Mechanics of Oblique Slip Faulting. Geol. Mag. 1959, 96, 109. [Google Scholar] [CrossRef]
  46. Dupin, J.M.; Sassi, W.; Angelier, J. Homogeneous stress hypothesis and actual fault slip: A distinct element analysis. J. Struct. Geol. 1993, 15, 1033–1043. [Google Scholar] [CrossRef]
  47. Pollard, D.D.; Saltzer, S.D.; Rubin, A.M. Stress inversion methods: Are they based on faulty assumptions? J. Struct. Geol. 1993, 15, 1045–1054. [Google Scholar] [CrossRef]
  48. Pascal, C.; Angelier, J.; Seland, R.; Lepvrier, C. A simplified model of stress-slip relationships: Application to the Frøy field, northern North Sea. Tectonophysics 2002, 357, 103–118. [Google Scholar] [CrossRef]
  49. Pascal, C. Interaction of faults and perturbation of slip: Influence of anisotropic stress states in the presence of fault friction and comparison between Wallace–Bott and 3D Distinct Element models. Tectonophysics 2002, 356, 307–322. [Google Scholar] [CrossRef]
  50. Maerten, L. Variation in slip on intersecting normal faults: Implications for paleostress inversion. J. Geophys. Res. 2000, 105, 197–206. [Google Scholar] [CrossRef] [Green Version]
  51. Maerten, L.; Maerten, F.; Mostfa, L.; Gillespie, P. Geomechanical paleostress inversion using fracture data. J. Struct. Geol. 2016, 89, 197–213. [Google Scholar] [CrossRef]
  52. Lejri, M.; Maerten, F.; Maerten, L.; Soliva, R. Paleostress inversion: A multi-parametric geomechanical evaluation of the Wallace–Bott assumptions. Tectonophysics 2015, 657, 129–143. [Google Scholar] [CrossRef]
  53. Maerten, F.; Maerten, L.; Pollard, D.D. iBem3D, a three-dimensional iterative boundary element method using angular dislocations for modeling geologic structures. Comput. Geosci.-UK 2014, 72, 1–17. [Google Scholar] [CrossRef]
  54. Maerten, F. Geomechanics to Solve Geological Structure Issues: Forward, Inverse and Restoration Modeling. Ph.D. Thesis, Universite Montpellier II Sciences et Techniques du Languedoc, Montpellier, France, 2010. [Google Scholar]
  55. Faleide, J.I.; Pascal, C.; Gabrielsen, R.; Miraj, M. Numerical Modeling of Cenozoic BaSin Inversion of the Western Barents Shelf. In Proceedings of the AAPG 2018 Annual Convention & Exhibition, Salt Lake City, UT, USA, 20–23 May 2018. [Google Scholar] [CrossRef]
  56. Xu, X.; Tang, S.; Lin, S. Paleostress inversion of fault-slip data from the Jurassic to Cretaceous Huangshan BaSin. and implications for the tectonic evolution of southeastern China. J. Geodyn. 2016, 98, 31–52. [Google Scholar] [CrossRef]
  57. Pascal, C. Paleostress Inversion Techniques: Methods and Applications for Tectonics; Elsevier: Amsterdam, the Netherlands, 2021. [Google Scholar]
  58. Itasca. FLAC3D User’s Guide; Group Inc.: Minneapolis, MN, USA, 2012. [Google Scholar]
  59. Garven, G.; Freeze, R.A. Theoretical analysis of the role of groundwater flow in the genesis of stratabound ore deposits; 1, Mathematical and numerical model. Am. J. Sci. 1984, 284, 1085–1124. [Google Scholar] [CrossRef]
  60. Mao, X.; Zhao, Y.; Deng, H.; Zhang, B.; Liu, Z.; Chen, J.; Zou, Y.; Lai, J. Quantitative analysis of intrusive body morphology and its relationship with skarn mineralization—A case study of Fenghuangshan copper deposit, Tongling, Anhui, China. Trans. Nonferrous Met. Soc. 2018, 28, 151–162. [Google Scholar] [CrossRef]
  61. Li, X.; Yuan, F.; Zhang, M.; Jowitt, S.M.; Ord, A.; Zhou, T.; Dai, W. 3D computational simulation-based mineral prospectivity modeling for exploration for concealed Fe–Cu skarn-type mineralization within the Yueshan orefield, Anqing district, Anhui Province, China. Ore Geol. Rev. 2019, 105, 1–17. [Google Scholar] [CrossRef]
  62. Hu, X.; Jowitt, S.; Yuan, F.; Liu, G.; Luo, J.; Chen, Y.; Yang, H.; Ren, K.; Yang, Y. Numerical modeling of mineralizing processes during the formation of the Yangzhuang Kiruna-type iron deposit, Middle and Lower Yangtze River Metallogenic Belt, China: Implications for the genesis and longevity of Kiruna-type iron oxide-apatite systems. Solid Earth Sci. 2022, 7, 23–37. [Google Scholar] [CrossRef]
  63. Hu, X.; Chen, Y.; Liu, G.; Yang, H.; Luo, J.; Ren, K.; Yang, Y. Numerical modeling of formation of the Maoping Pb-Zn deposit within the Sichuan-Yunnan-Guizhou Metallogenic Province, Southwestern China: Implications for the spatial distribution of concealed Pb mineralization and its controlling factors. Ore Geol. Rev. 2022, 140, 104573. [Google Scholar] [CrossRef]
  64. Ding, Z.J.; Sun, F.Y.; Liu, F.L.; Liu, J.H.; Peng, Q.M.; Ji, P.; Li, B.L.; Zhang, P.J. Mesozoic geodynamic evolution and metallogenic series of major metal deposits in Jiaodong Peninsula, China. Acta Petrol. Sin. 2015, 31, 3045–3080. [Google Scholar]
  65. Yang, L.Q.; Deng, J.; Guo, C.Y.; Zhang, J.; Jiang, S.Q.; Gao, B.F.; Gong, Q.J.; Wang, Q.F. Ore-Forming Fluid Characteristics of the Dayingezhuang Gold Deposit, Jiaodong Gold Province, China. Resour. Geol. 2009, 59, 181–193. [Google Scholar] [CrossRef]
  66. Fridleifsson, I.; Bertani, R.; Huenges, E.; Lund, J.; Ragnarsson, Á.; Rybach, L. The possible role and contribution of geothermal energy to the mitigation of climate change. In Proceedings of the IPCC Scoping Meeting on Renewable Energy Sources, Lübeck, Germany, 20–25 January 2008; pp. 59–80. [Google Scholar]
  67. Yang, L.Q.; Deng, J.; Wang, Q.F.; Gao, B.F.; Wang, L.; Guo, C. Numerical modeling of coupling metallogenic dynamics of fluid flow and thermal transporta-tion in jiaodong gold ore cluster area, China. In Proceedings of the Iamg ’07: Geomathematics and Gis Analysis of Resources, Environment and Hazards, Beijing, China, 26–31 August 2007; pp. 39–43. [Google Scholar]
  68. Caine, J.; Evans, J.; Forster, C. Fault zone architecture and permeability structure. Geology 1996, 24, 1025–1028. [Google Scholar] [CrossRef]
  69. Pfiffner, O.A.; Ramsay, J.G. Constraints on geological strain rates: Arguments from finite strain states of naturally deformed rocks. J. Geophys. Res. Solid Earth 1982, 87, 311–321. [Google Scholar] [CrossRef] [Green Version]
  70. Tang, J. Study on palaeogeothermal gradient and hydrocarbon generation in north China. Henan Pet. 1998, 12, 1–3. [Google Scholar]
  71. Oliver, N.H.S.; Pearson, P.J.; Holcombe, R.J.; Ord, A. Mary Kathleen metamorphic-hydrothermal uranium—Rare-earth element deposit: Ore genesis and numerical model of coupled deformation and fluid flow. Aust. J. Earth Sci. 1999, 46, 467–483. [Google Scholar] [CrossRef]
  72. Li, Z.; Chi, G.; Bethune, K.M.; Eldursi, K.; Quirt, D.; Ledru, P.; Gudmundson, G. Numerical simulation of strain localization and its relationship to formation of the Sue unconformity-related uranium deposits, eastern Athabasca Basin, Canada. Ore Geol. Rev. 2018, 101, 17–31. [Google Scholar] [CrossRef]
  73. Hronsky, J.M.A. Deposit-scale structural controls on orogenic gold deposits: An integrated, physical process–based hypothesis and practical targeting implications. Miner. Depos. 2020, 55, 197–216. [Google Scholar] [CrossRef]
  74. Wilson, C.J.L.; Osborne, D.J.; Robinson, J.A.; Miller, J.M. Structural Constraints and Localization of Gold Mineralization in Leather Jacket Lodes, Ballarat, Victoria, Australia. Econ. Geol. 2016, 111, 1073–1098. [Google Scholar] [CrossRef] [Green Version]
  75. Vermeer, P.A.; De Borst, R. Non-Associated Plasticity for Soils, Concrete and Rock. Mater. Sci. 1984, 29, 163–196. [Google Scholar]
  76. Bongiolo, E.; Bongiolo, D.; Sardini, P.; Mexias, A.; Siitari-Kauppi, M.; Boscato Gomes, M.; Formoso, M. Quantification of porosity evolution from unaltered to propylitic-altered granites: The14C-PMMA method applied on the hydrothermal system of Lavras do Sul, Brazil. An. Acad. Bras. Cienc. 2007, 79, 503–517. [Google Scholar] [CrossRef]
  77. Cox, S.F. Coupling between Deformation, Fluid Pressures, and Fluid Flow in Ore-Producing Hydrothermal Systems at Depth in the Crust; Society of Economic Geologists, Inc.: Littleton, CO, USA, 2005; pp. 39–75. [Google Scholar]
  78. Sibson, R. Controls on maximum fluid overpressure defining conditions for mesozonal mineralisation. J. Struct. Geol. 2004, 26, 1127–1136. [Google Scholar] [CrossRef]
  79. Li, X.; Yuan, F.; Zhang, M.; Jia, C.; Jowitt, S.; Ord, A.; Zheng, T.; Hu, X.; Li, Y. Three-dimensional mineral prospectivity modeling for targeting of concealed mineralization within the Zhonggu iron orefield, Ningwu Basin, China. Ore Geol. Rev. 2015, 71, 633–654. [Google Scholar] [CrossRef]
  80. Henry, A.D.; McInnes, P.; Tosdal, R.M. Structural Evolution of Auriferous Veins at the Endeavour 42 Gold Deposit, Cowal Mining District, NSW, Australia. Econ. Geol. 2014, 109, 1051–1077. [Google Scholar] [CrossRef]
  81. Song, M.; Song, Y.; Ding, Z. The Discovery of The Jiaojia and the Sanshandao Giant Gold Deposits in Jiaodong Peninsula and Discussion on the Relevant Issues. Geotecton. Metallog. 2019, 43, 092–110. [Google Scholar] [CrossRef]
Figure 1. Geological map of the Jiaodong gold province showing the distribution of major fault zones, formations, intrusions, and gold deposits (modified from [36]).
Minerals 12 00505 g001
Figure 2. A simplified geological map of the Dayingezhuang gold deposit [37].
Minerals 12 00505 g002
Figure 3. Geological section of the Dayingezhuang gold deposit. The cross-sections illustrate that orebodies mainly occur near the fault interface in the footwall.
Minerals 12 00505 g003
Figure 4. Numerical simulation workflow.
Minerals 12 00505 g004
Figure 5. (a) 3D models of the fault and drill holes; (b) 3D models of fault and orebody; (c) gold grade distribution; (d) numerical simulation model.
Minerals 12 00505 g005
Figure 6. The setting of boundary conditions in the experiment and the kinematic states of models showing (a) compression in the NW–SE direction; (b) extension in the NW–SE direction; (c) extension in the NW–SE direction with dextral strike-slip; (d) extension in the NW–SE direction with dextral strike-slip. The paleostress directions for several models are also shown.
Minerals 12 00505 g006
Figure 7. The volumetric strain, shear strain distribution, and detailed fluid flow vectors at a strain rate of 10−11 s−1. In the figure, the rectangular box is the scope of the cross-sections; thick arrows indicate areas of intense strain or mineralization; the vector arrows represent the Darcy flux and are used to indicate the direction of flow. (a) 0.5% volumetric strain, (b) 1.0% volumetric strain, (c) 0.5% shear strain, (d) 1.0% shear strain, and (e) corresponding geological section.
Minerals 12 00505 g007
Figure 8. The volumetric strain, shear strain distribution, and detailed fluid flow vectors at a strain rate of 10−11 s−1. In the figure, the rectangular box is the scope of the cross-sections; thick arrows indicate areas of intense strain or mineralization; the vector arrows represent the Darcy flux and are used to indicate the direction of flow. (a) 0.5% volumetric strain, (b) 1.0% volumetric strain, (c) 0.5% shear strain, (d) 1.0% shear strain, and (e) corresponding geological section.
Minerals 12 00505 g008
Figure 9. The volumetric strain, shear strain distribution, and detailed fluid flow vectors at a strain rate of 10−an s−s. In the figure, the rectangular box is the scope of the cross-sections; thick arrows indicate areas of intense strain or mineralization; the vector arrows represent the Darcy flux and are used to indicate the direction of flow. (a) 0.5% volumetric strain, (b) 1.0% volumetric strain, (c) 0.5% shear strain, (d) 1.0% shear strain, and (e) corresponding geological section.
Minerals 12 00505 g009
Figure 10. The volumetric strain, shear strain distribution, and detailed fluid flow vectors at a strain rate of 10−11 s−1. In the figure, the rectangular box is the scope of the cross-sections; thick arrows indicate areas of intense strain or mineralization; the vector arrows represent the Darcy flux and are used to indicate the direction of flow. (a) 0.5% volumetric strain, (b) 1.0% volumetric strain, (c) 0.5% shear strain, (d) 1.0% shear strain, and (e) corresponding geological section.
Minerals 12 00505 g010
Figure 11. Cross-section of volume strain corresponding to exploration line with 1% bulk shortening. The rectangular box is the scope of the cross-sections. (a) Nos. 70~94 geological cross-sections; (b) cross-section of 1% bulk shortening in Model 4.
Minerals 12 00505 g011
Figure 12. Spatial distribution of dilation deformation on horizontal planes. (a) after 0.5% and (b) 1% of bulk shortening.
Minerals 12 00505 g012
Figure 13. (a) Fluid migration model and (b) deep potential prospecting area at Dayingezhuang.
Minerals 12 00505 g013
Table 1. Mathematical symbols and scientific meanings in equations.
SymbolMeaning
q W fluid-specific discharge
k coefficient of fluid mobility
Ppressure of the pore fluid
ρ w fluid density
g gravitational acceleration
q T heat flux
k T effective thermal conductivity
Ttemperature
ζvariation of fluid content
q v W volumetric fluid source
q i vector of fluid-specific discharge in the x i direction
C T effective specific heat
q T heat flux
ρ 0 reference density of the fluid
c w specific heat of the fluid
q v T thermal fluid source
ρ bulk density of the porous medium
σ ij stress tensor of the solid
v i velocity component in the xi direction
g i component of gravitational acceleration in the x i direction
ε ij thermal strain tensor
α t coefficient of linear thermal expansion
δ ij Kronecker delta
ζ variation in fluid content
MBiot modulus
α Biot coefficient
ε volumetric strain
β volumetric thermal expansion of the porous matrix
Table 2. The parameters of the numerical simulation model for the Dayingezhuang gold deposit.
Density of Rock Unit and LithologyDenudation LayerJiaodong GroupFaultLinglong Granite
Density (kg m−3)2.103.802.502.67
Bulk modulus (1010 Pa)5.702.948.604.16
Shear modulus (1010 Pa)4.102.207.203.38
Cohesive strength (106 Pa)2.6 3.84.04.2
Tensile strength (106 Pa)1.31.82.22.3
Friction angle16301532
Dilatancy angle4343
Permeability (10−12 m2)1.61.63.01.5
Porosity0.300.300.400.25
Thermal conductivity(W·m−1·K−1) 2.32.34.02.4
Publisher’s Note: MDPI stays neutral with regard to jurisdictional claims in published maps and institutional affiliations.

