
Strain Energy Release and Deep Rock Failure Due to Excavation in Pre-Stressed Rock


Abstract
:1. Introduction
2. Calculation of Strain Energy Release by Excavation in Pre-Stressed Rock
2.1. Methodology
2.2. Strain Energy Release by Excavation in Laboratory Test
2.3. Strain Energy Release by Excavation in Numerical Analysis
3. Effect of Excavation Height and Width on Strain Energy Release
3.1. Effect of Excavation Height
3.2. Effect of Excavation Width
3.3. Equation for Released Strain Energy Caused by Excavation
4. Effect of Lateral Pressure on Strain Energy Release
4.1. Model Construction and Results
4.2. Effect of Lateral Pressure
5. Rock Failure Caused by Excavation
5.1. Numerical Method and Model
5.2. Rock Failure Caused by Excavation
6. Conclusions
- (1)
- Excavation in pre-stressed rock leads to a change in the original stress field, which is manifested in the release of normal stress on the free surface and the concentration of tangential stress. In this research, a method is proposed to calculate the strain energy release caused by the excavation by loading an intact specimen and a specimen with holes. The energy change in the intact specimen from loading to excavation, and then to stability (stress balance) causes a gradual increase in strain energy during loading, a reduction in strain energy after excavation, and strain energy release after excavation. Both the excavation and normal stress release after excavation lead to a reduction in strain energy in the rock specimen.
- (2)
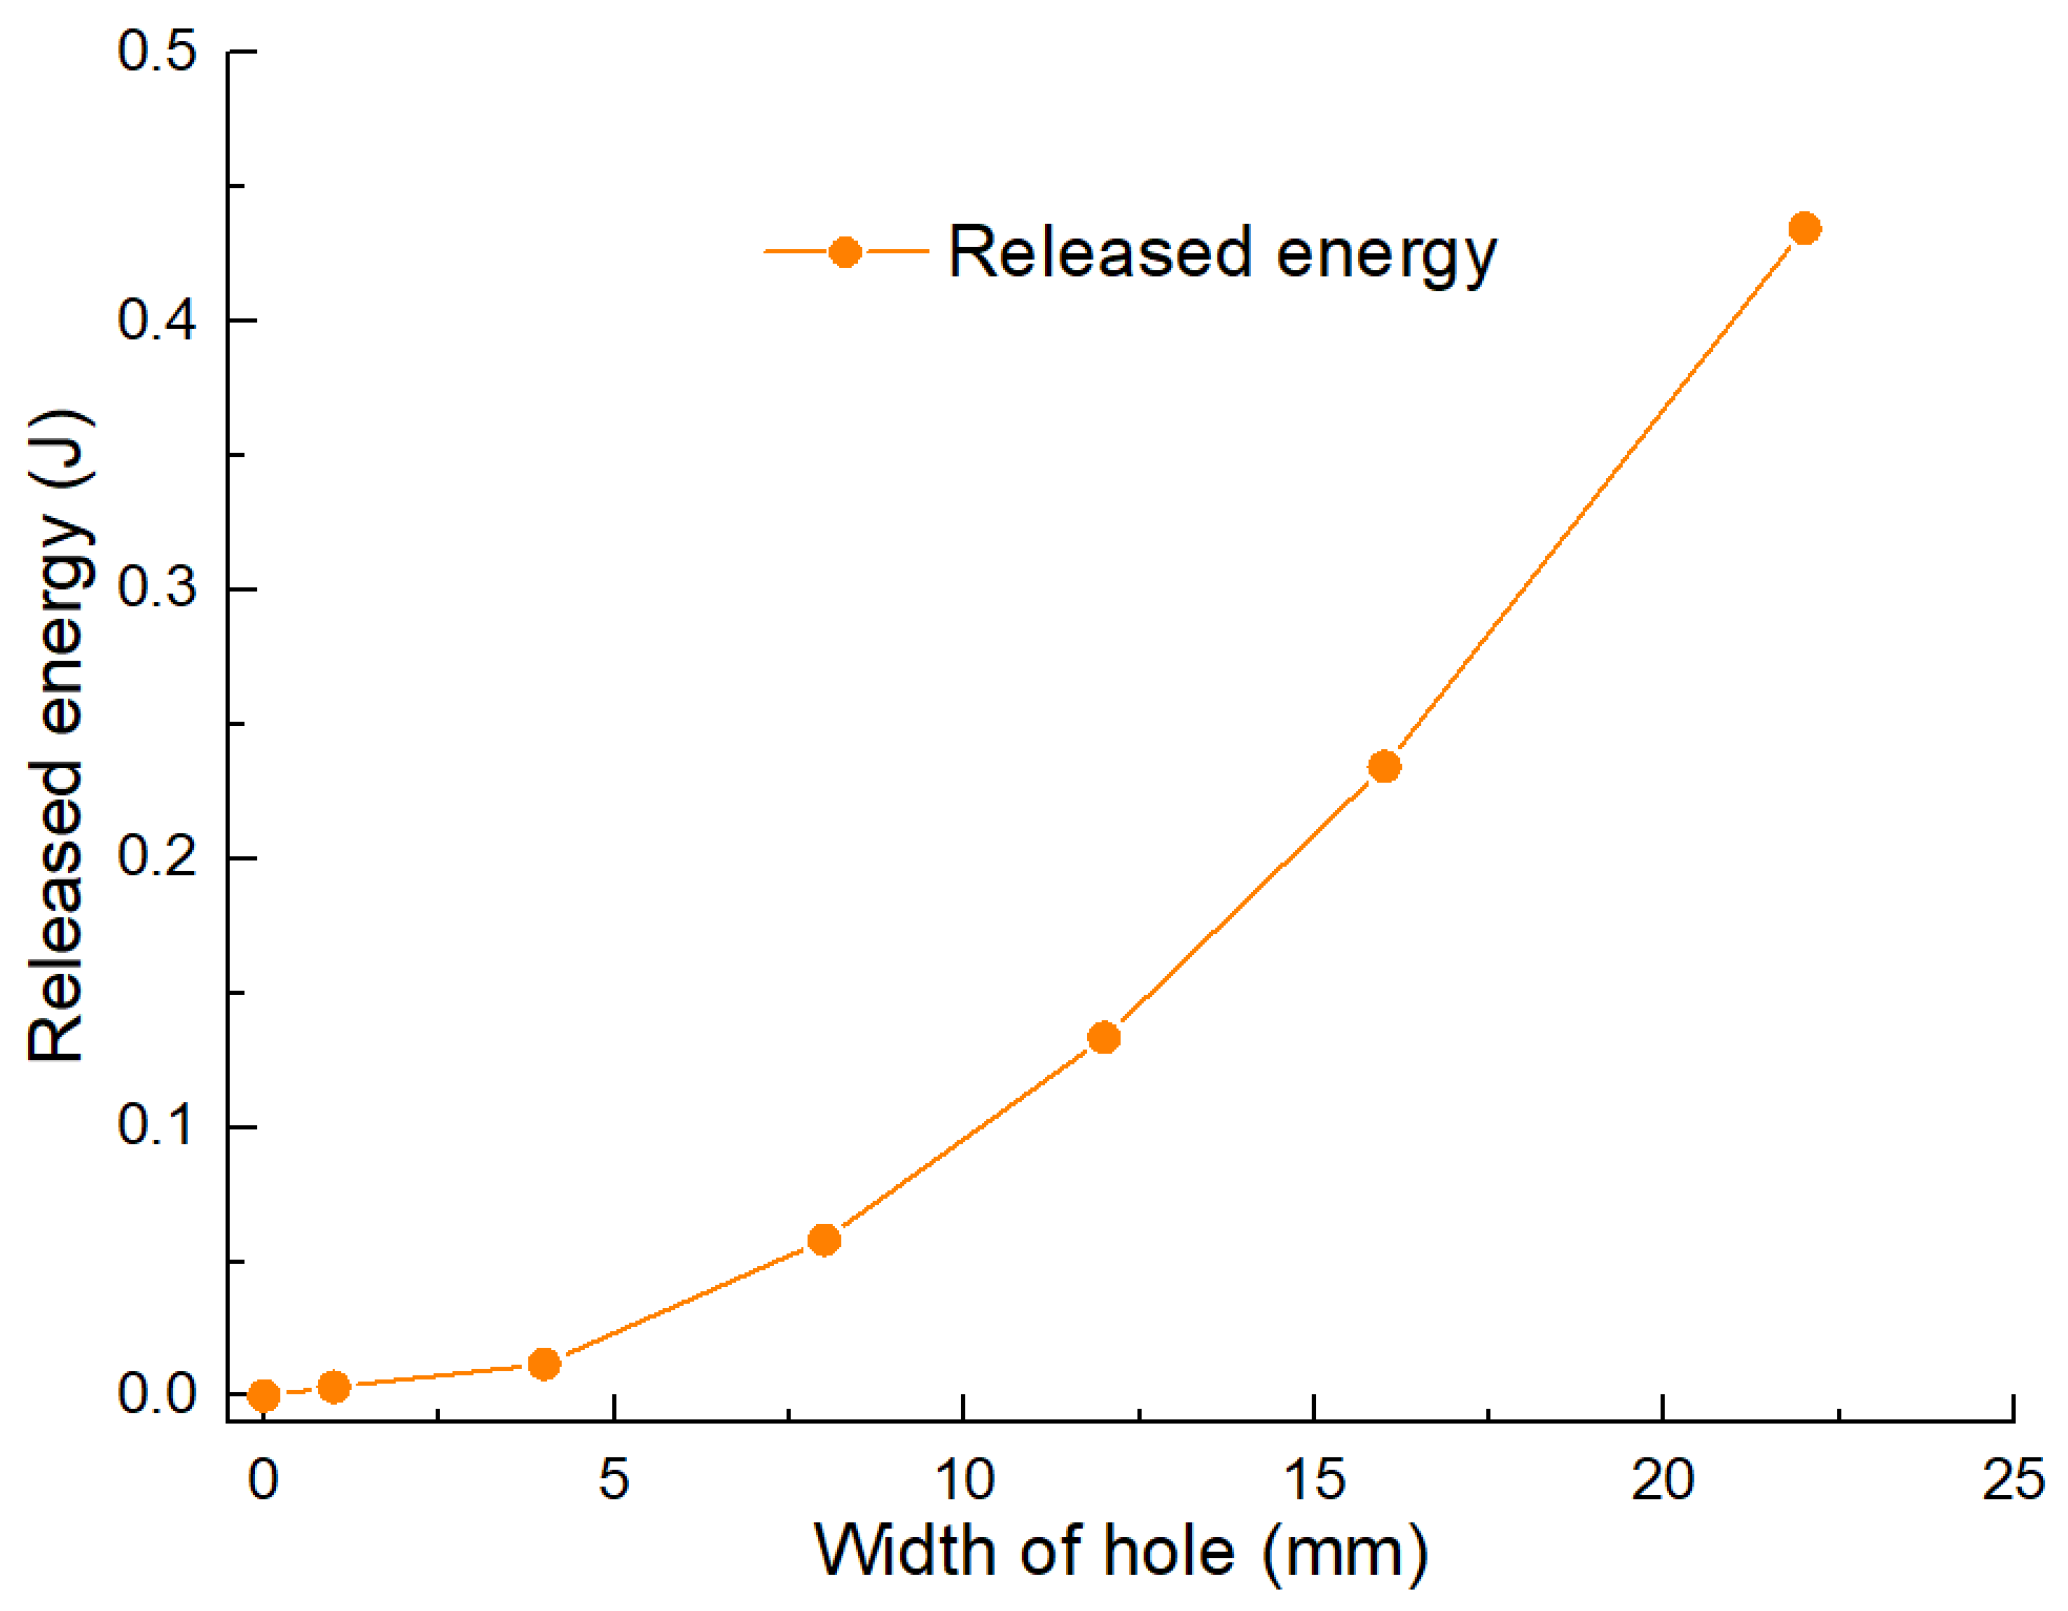
- The influence of excavation height and width on strain energy release is inconsistent under vertical loading. When the height of hole is 1 mm, the strain energy release is large, and the increase in the height of the hole will lead to a slow increase in strain energy release. When the width of hole is 1 mm, the strain energy release is very small, and the increase in width of hole will lead to an exponential release of strain energy. Through equation fitting, the theoretical Equation (9) of strain energy release caused by holes with different height and width is obtained, and the fitting accuracy is high.
- (3)
- The strain energy release increases exponentially with the increase in the lateral pressure coefficient, showing a trend of the second power of lateral pressure coefficient. This shows that the vertical stress remains unchanged, and the increase in horizontal stress will lead to the increase in strain energy release.
- (4)
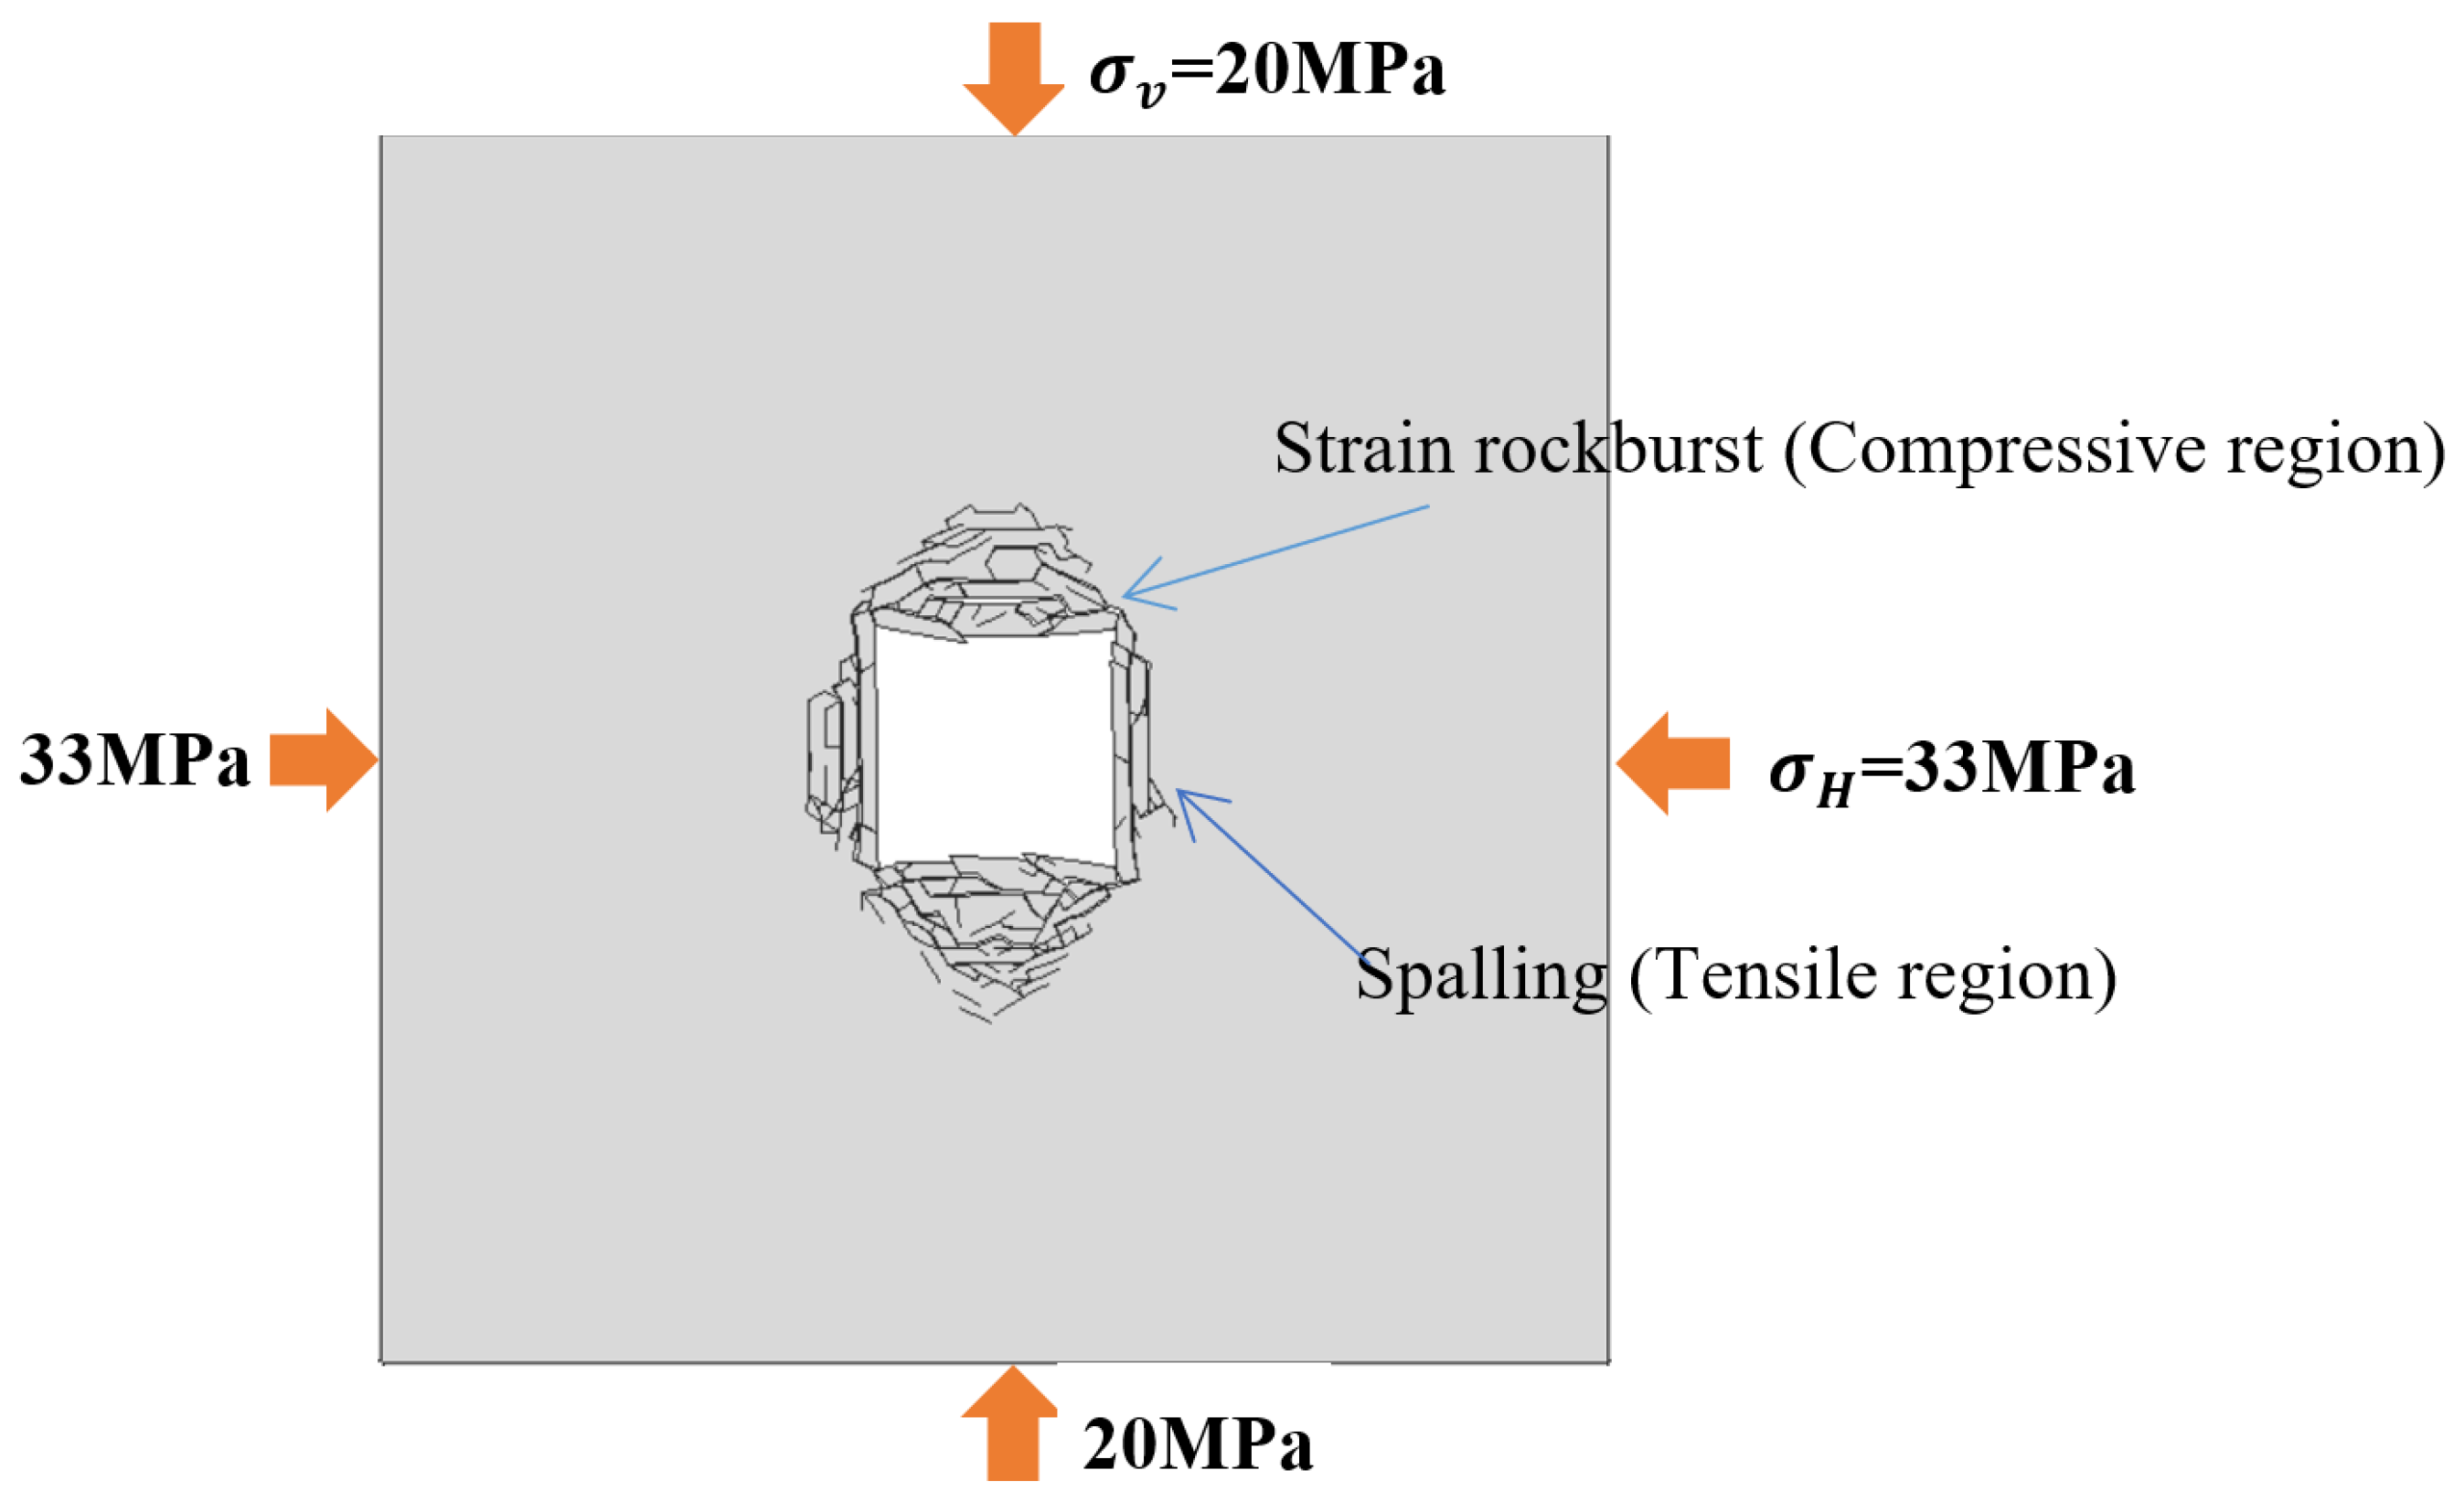
- The tunnel failure mode caused by excavation under high stress is obtained by numerical calculation. The failure modes of the tunnel are strain rockbursts caused by tangential stress concentration and spalling caused by normal stress release, which are also observed in the failure mode of the actual tunnel. For an underground mine exposed to high horizontal stresses, the single excavation height should be reduced to reduce the rate of horizontal strain energy release. In addition, it is recommended that energy-absorbing materials are used to absorb the strain energy release caused by excavation. The support design can be based on the strain energy release of surrounding rock and the amount of energy absorption by the support structure.
Author Contributions
Funding
Institutional Review Board Statement
Informed Consent Statement
Data Availability Statement
Conflicts of Interest
References
- Li, X.; Zhou, J.; Wang, S.; Liu, B. Review and practice of deep mining for solid mineral resources. Chin. J. Nonferrous Met. 2017, 27, 1236–1262. [Google Scholar]
- Shi, Q.; Pan, J.; Wang, S.; Liu, S.; Mishra, B.; Seitz, S. Field Monitoring of Delayed Coal Burst in an Advancing Entry of a Deep Coal Mine. Min. Metall. Explor. 2021, 38, 2417–2431. [Google Scholar] [CrossRef]
- Feng, G.-L.; Feng, X.-T.; Xiao, Y.-X.; Yao, Z.-B.; Hu, L.; Niu, W.-J.; Li, T. Characteristic microseismicity during the development process of intermittent rockburst in a deep railway tunnel. Int. J. Rock Mech. Min. Sci. 2019, 124, 104135. [Google Scholar] [CrossRef]
- Lu, M.; Grov, E.; Dahle, H.; Qiao, H.; Wen, B.; Chen, Z.; Zhao, Q. Rock Support Design For Special Lighting Caverns In High In-Situ Stress Rock Mass. Chin. J. Rock Mech. Eng. 2008, 27, 35–41. [Google Scholar]
- Shan, Z.-G.; Yan, P. Management of rock bursts during excavation of the deep tunnels in Jinping II Hydropower Station. Bull. Eng. Geol. Environ. 2010, 69, 353–363. [Google Scholar] [CrossRef]
- Liang, Z.; Xue, R.; Xu, N.; Li, W. Characterizing rockbursts and analysis on frequency-spectrum evolutionary law of rockburst precursor based on microseismic monitoring. Tunn. Undergr. Space Technol. 2020, 105, 103564. [Google Scholar] [CrossRef]
- Li, X.; Gong, F.; Tao, M.; Dong, L.; Du, K.; Ma, C.; Zhou, Z.; Yin, T. Failure mechanism and coupled static-dynamic loading theory in deep hard rock mining: A review. J. Rock Mech. Geotech. Eng. 2017, 9, 767–782. [Google Scholar] [CrossRef]
- Li, C.C.; Mikula, P.; Simser, B.; Hebblewhite, B.; Joughin, W.; Feng, X.; Xu, N. Discussions on rockburst and dynamic ground support in deep mines. J. Rock Mech. Geotech. Eng. 2019, 11, 1110–1118. [Google Scholar] [CrossRef]
- Lu, C.-P.; Liu, Y.; Zhang, N.; Zhao, T.-B.; Wang, H.-Y. In-situ and experimental investigations of rockburst precursor and prevention induced by fault slip. Int. J. Rock Mech. Min. Sci. 2018, 108, 86–95. [Google Scholar] [CrossRef]
- Zhou, J.; Li, X.; Mitri, H.S. Evaluation method of rockburst: State-of-the-art literature review. Tunn. Undergr. Space Technol. 2018, 81, 632–659. [Google Scholar] [CrossRef]
- He, M.; Sousa, R.L.; Müller, A.L.; Vargas, E., Jr.; Sousa, L.R.; Chen, X. Analysis of excessive deformations in tunnels for safety evaluation. Tunn. Undergr. Space Technol. 2015, 45, 190–202. [Google Scholar] [CrossRef]
- Wu, Z.; Wu, S.; Cheng, Z. Discussion and application of a risk assessment method for spalling damage in a deep hard-rock tunnel. Comput. Geotech. 2020, 124, 103632. [Google Scholar] [CrossRef]
- Li, C.C. Principles and methods of rock support for rockburst control. J. Rock Mech. Geotech. Eng. 2021, 13, 46–59. [Google Scholar] [CrossRef]
- Miao, S.; Cai, M.; Guo, Q.; Huang, Z. Rock burst prediction based on in-situ stress and energy accumulation theory. Int. J. Rock Mech. Min. Sci. 2016, 83, 86–94. [Google Scholar] [CrossRef]
- Li, P.; Cai, M.; Guo, Q.; Miao, S. In Situ Stress State of the Northwest Region of the Jiaodong Peninsula, China from Overcoring Stress Measurements in Three Gold Mines. Rock Mech. Rock Eng. 2019, 52, 4497–4507. [Google Scholar] [CrossRef]
- Feng, F.; Li, X.; Rostami, J.; Peng, D.; Li, D.; Du, K. Numerical Investigation of Hard Rock Strength and Fracturing under Polyaxial Compression Based on Mogi-Coulomb Failure Criterion. Int. J. Geomech. 2019, 19, 04019005. [Google Scholar] [CrossRef]
- Zhou, Z.; Li, Z.; Gao, C.; Zhang, D.; Wang, M.; Wei, C.; Bai, S. Peridynamic micro-elastoplastic constitutive model and its application in the failure analysis of rock masses. Comput. Geotech. 2021, 132, 104037. [Google Scholar] [CrossRef]
- Xiao, P.; Li, D.; Zhao, G.; Liu, H. New criterion for the spalling failure of deep rock engineering based on energy release. Int. J. Rock Mech. Min. Sci. 2021, 148, 104943. [Google Scholar] [CrossRef]
- Feng, F.; Li, X.; Rostami, J.; Li, D. Modeling hard rock failure induced by structural planes around deep circular tunnels. Eng. Fract. Mech. 2019, 205, 152–174. [Google Scholar] [CrossRef]
- Wei, C.; Zhang, C.; Canbulat, I.; Huang, W. Numerical investigation into impacts of major fault on coal burst in longwall mining—A case study. Int. J. Rock Mech. Min. Sci. 2021, 147, 104907. [Google Scholar] [CrossRef]
- Gong, F.; Yan, J.; Li, X.; Luo, S. A peak-strength strain energy storage index for rock burst proneness of rock materials. Int. J. Rock Mech. Min. Sci. 2019, 117, 76–89. [Google Scholar] [CrossRef]
- Jiang, Q.; Feng, X.-T.; Xiang, T.-B.; Su, G.-S. Rockburst characteristics and numerical simulation based on a new energy index: A case study of a tunnel at 2500 m depth. Bull. Eng. Geol. Environ. 2010, 69, 381–388. [Google Scholar] [CrossRef]
- Qiu, S.; Feng, X.; Zhang, C.; Xiang, T. Estimation of rockburst wall-rock velocity invoked by slab flexure sources in deep tunnels. Can. Geotech. J. 2014, 51, 520–539. [Google Scholar] [CrossRef]
- He, B.-G.; Zelig, R.; Hatzor, Y.H.; Feng, X.-T. Rockburst Generation in Discontinuous Rock Masses. Rock Mech. Rock Eng. 2016, 49, 4103–4124. [Google Scholar] [CrossRef]
- Xiao, P.; Li, D.; Zhao, G.; Zhu, Q.; Liu, H.; Zhang, C. Mechanical properties and failure behavior of rock with different flaw inclinations under coupled static and dynamic loads. J. Cent. South Univ. 2020, 27, 2945–2958. [Google Scholar] [CrossRef]
- Qiu, J.; Li, X.; Li, D.; Zhao, Y.; Hu, C.; Liang, L. Physical Model Test on the Deformation Behavior of an Underground Tunnel Under Blasting Disturbance. Rock Mech. Rock Eng. 2021, 54, 91–108. [Google Scholar] [CrossRef]
- Zhou, Z.; Cai, X.; Li, X.; Cao, W.; Du, X. Dynamic Response and Energy Evolution of Sandstone Under Coupled Static-Dynamic Compression: Insights from Experimental Study into Deep Rock Engineering Applications. Rock Mech. Rock Eng. 2020, 53, 1305–1331. [Google Scholar] [CrossRef]
- Han, Z.; Li, D.; Zhou, T.; Zhu, Q.; Ranjith, P.G. Experimental study of stress wave propagation and energy characteristics across rock specimens containing cemented mortar joint with various thicknesses. Int. J. Rock Mech. Min. Sci. 2020, 131, 104352. [Google Scholar] [CrossRef]
- Skrzypkowski, K. Case Studies of Rock Bolt Support Loads and Rock Mass Monitoring for the Room and Pillar Method in the Legnica-Gogow Copper District in Poland. Energies 2020, 13, 2998. [Google Scholar] [CrossRef]
- Jiang, J.; Su, G.; Zhang, X.; Feng, X.-T. Effect of initial damage on remotely triggered rockburst in granite: An experimental study. Bull. Eng. Geol. Environ. 2020, 79, 3175–3194. [Google Scholar] [CrossRef]
- Chen, G.; He, M.; Fan, F. Rock Burst Analysis Using DDA Numerical Simulation. Int. J. Geomech. 2018, 18, 04018001. [Google Scholar] [CrossRef]
- Lin, M.-Q.; Zhang, L.; Liu, X.-Q.; Xia, Y.-Y.; Zhang, D.-J.; Peng, Y.-L. Microscopic analysis of rockburst failure on specimens under gradient stress. Rock Soil Mech. 2020, 41, 2984–2992. [Google Scholar]
- Rui, Y.; Zhou, Z.; Lu, J. A novel AE source localization method using clustering detection to eliminate abnormal arrivals. Int. J. Min. Sci. Technol. 2022, 32, 51–62. [Google Scholar] [CrossRef]
- Xiao, P.; Li, D.; Zhao, G.; Liu, M. Experimental and Numerical Analysis of Mode I Fracture Process of Rock by Semi-Circular Bend Specimen. Mathematics 2021, 9, 1769. [Google Scholar] [CrossRef]
- Read, R. 20 years of excavation response studies at AECL’s Underground Research Laboratory. Int. J. Rock Mech. Min. Sci. 2004, 41, 1251–1275. [Google Scholar] [CrossRef]
- Kang, S.S.; Ishiguro, Y.; Obara, Y. Evaluation of core disking rock stress and tensile strength via the compact conical-ended borehole overcoring technique. Int. J. Rock Mech. Min. Sci. 2006, 43, 1226–1240. [Google Scholar] [CrossRef]
- Hu, X.; Su, G.; Chen, G.; Mei, S.; Feng, X.; Mei, G.; Huang, X. Experiment on Rockburst Process of Borehole and Its Acoustic Emission Characteristics. Rock Mech. Rock Eng. 2019, 52, 783–802. [Google Scholar] [CrossRef]
- Gong, F.; Wu, W.; Li, T.; Si, X. Experimental simulation and investigation of spalling failure of rectangular tunnel under different three-dimensional stress states. Int. J. Rock Mech. Min. Sci. 2019, 122, 104081. [Google Scholar] [CrossRef]
- Qiu, P.-Q.; Ning, J.-G.; Wang, J.; Hu, S.-C.; Li, Z. Mitigating rock burst hazard in deep coal mines insight from dredging concentrated stress: A case study. Tunn. Undergr. Space Technol. 2021, 115, 104060. [Google Scholar] [CrossRef]
- Tao, M.; Li, X.; Li, D. Rock failure induced by dynamic unloading under 3D stress state. Theor. Appl. Fract. Mech. 2013, 65, 47–54. [Google Scholar] [CrossRef]
- Feng, F.; Li, X.; Luo, L.; Zhao, X.; Chen, S.; Jiang, N.; Huang, W.; Wang, Y. Rockburst response in hard rock owing to excavation unloading of twin tunnels at great depth. Bull. Eng. Geol. Environ. 2021, 80, 7613–7631. [Google Scholar] [CrossRef]
- Ren, F.; Chang, Y.; He, M. A systematic analysis method for rock failure mechanism under stress unloading conditions: A case of rock burst. Environ. Earth Sci. 2020, 79, 370. [Google Scholar] [CrossRef]
- Huang, R.Q.; Wang, X.N.; Chan, L.S. Triaxial unloading test of rocks and its implication for rock burst. Bull. Eng. Geol. Environ. 2001, 60, 37–41. [Google Scholar] [CrossRef]
- Su, G.; Hu, L.; Feng, X.; Wang, J.; Zhang, X. True triaxial experimental study of rockburst process under low frequency cyclic disturbance load combined with static load. Chin. J. Rock Mech. Eng. 2016, 35, 1309–1322. [Google Scholar]


| Specimens | High/mm | Width/mm | Thick/mm | Hole Size/mm |
|---|---|---|---|---|
| S-Intact | 149.7 | 119.1 | 21.0 | 0 |
| S-Hole | 149.3 | 119.2 | 21.6 | 22 × 22 |
| Specimen | UInt/J | UHole/J | UAft-ex/J | USpe-ho/J | URele/J |
|---|---|---|---|---|---|
| S-Intact | 6.848 | 0.184 | 6.664 | --- | 0.703 |
| S-Hole | --- | --- | --- | 5.961 |
| Mechanical Parameters | Specimen | Loading Platen |
|---|---|---|
| Young’s modulus (E, GPa) | 5.01 | 211 |
| Poisson’s ratio (ν) | 0.33 | 0.29 |
| Density (ρ, kg/m3) | 2700 | 7840 |
| Normal penalty (Pn, N/mm2) | 5010 | 211,000 |
| Tangential penalty (Pt, N/mm2) | 501 | 21,100 |
| Friction (γ) | 0 | 0 |
| Mesh element size (mm) | 2 | 2 |
| Contact type | Node edge | Node edge |
| Specimen | Displacement/mm | Load/kN | UInt/J | UHole/J | UAft-ex/J | USpe-ho/J | URele/J |
|---|---|---|---|---|---|---|---|
| S-Intact | 0.453 | 40.56 | 9.186 | 0.247 | 8.939 | --- | 0.434 |
| S-Hole | 37.55 | --- | --- | --- | 8.505 |
| h/mm | Displacement/mm | Load/kN | UInt/J | UHole/J | UAft-ex/J | USpe-ho/J | URele/J |
|---|---|---|---|---|---|---|---|
| 0 | 0.453 | 40.56 | 9.186 | --- | --- | --- | 0 |
| 1 | 39.10 | 0.011 | 9.175 | 8.856 | 0.319 | ||
| 4 | 38.81 | 0.045 | 9.141 | 8.791 | 0.350 | ||
| 8 | 38.46 | 0.090 | 9.096 | 8.712 | 0.384 | ||
| 12 | 38.18 | 0.135 | 9.051 | 8.648 | 0.403 | ||
| 16 | 37.92 | 0.180 | 9.007 | 8.590 | 0.417 | ||
| 22 | 37.55 | 0.247 | 8.939 | 8.504 | 0.435 |
| w/mm | Displacement/mm | Load/kN | UInt/J | UHole/J | UAft-ex/J | USpe-ho/J | URele/J |
|---|---|---|---|---|---|---|---|
| 0 | 0.453 | 40.56 | 9.186 | --- | --- | --- | 0 |
| 1 | 40.49 | 0.011 | 9.175 | 9.172 | 0.003 | ||
| 4 | 40.31 | 0.045 | 9.141 | 9.129 | 0.012 | ||
| 8 | 39.90 | 0.090 | 9.096 | 9.038 | 0.058 | ||
| 12 | 39.37 | 0.135 | 9.051 | 8.918 | 0.133 | ||
| 16 | 38.73 | 0.180 | 9.007 | 8.772 | 0.234 | ||
| 22 | 37.55 | 0.247 | 8.939 | 8.504 | 0.435 |
| Displacment/mm | Intact Specimen | Specimen with Hole | ||||||
|---|---|---|---|---|---|---|---|---|
| Dy | Dx | Fy/kN | Fx/kN | Fy/kN | Fx/kN | |||
| 0.10 | 0.431 | −0.142 | 40.56 | 5.07 | 16.90 | 1.69 | 37.06 | 3.27 |
| 0.25 | 0.398 | −0.088 | 12.67 | 4.22 | 36.93 | 10.26 | ||
| 0.40 | 0.365 | −0.033 | 20.28 | 6.76 | 36.80 | 17.26 | ||
| 0.60 | 0.322 | 0.039 | 30.42 | 10.14 | 36.66 | 26.44 | ||
| 0.80 | 0.277 | 0.112 | 40.56 | 13.52 | 36.42 | 35.84 | ||
| 1.00 | 0.232 | 0.186 | 50.70 | 16.90 | 36.19 | 45.24 | ||
| 1.20 | 0.189 | 0.257 | 60.84 | 20.28 | 36.05 | 54.43 | ||
| 1.35 | 0.156 | 0.312 | 68.44 | 22.82 | 35.97 | 61.52 | ||
| UInt/J | UHole/J | UAft-ex/J | USpe-ho/J | URele/J | |
|---|---|---|---|---|---|
| 0.10 | 8.38 | 0.23 | 8.15 | 7.76 | 0.40 |
| 0.25 | 7.51 | 0.20 | 7.31 | 6.90 | 0.41 |
| 0.40 | 7.07 | 0.19 | 6.88 | 6.43 | 0.45 |
| 0.60 | 7.12 | 0.19 | 6.93 | 6.42 | 0.51 |
| 0.80 | 7.89 | 0.21 | 7.68 | 7.05 | 0.63 |
| 1.00 | 9.42 | 0.25 | 9.17 | 8.41 | 0.76 |
| 1.20 | 11.65 | 0.31 | 11.34 | 10.40 | 0.94 |
| 1.35 | 13.84 | 0.37 | 13.47 | 12.40 | 1.07 |
| Mechanical Parameters | Model |
|---|---|
| Young’s modulus (E, GPa) | 20.7 |
| Poisson’s ratio (ν) | 0.23 |
| Density (ρ, kg/m3) | 2790 |
| Friction angle (φ) | 30° |
| Cohesion (c, MPa) | 10 |
| Tensile strength (σt, MPa) | 2 |
| Fracture energy (Gf, N/m) | 4 |
Publisher’s Note: MDPI stays neutral with regard to jurisdictional claims in published maps and institutional affiliations. |
© 2022 by the authors. Licensee MDPI, Basel, Switzerland. This article is an open access article distributed under the terms and conditions of the Creative Commons Attribution (CC BY) license (https://creativecommons.org/licenses/by/4.0/).
Share and Cite
Xiao, P.; Li, D.; Zhu, Q. Strain Energy Release and Deep Rock Failure Due to Excavation in Pre-Stressed Rock. Minerals 2022, 12, 488. https://doi.org/10.3390/min12040488
Xiao P, Li D, Zhu Q. Strain Energy Release and Deep Rock Failure Due to Excavation in Pre-Stressed Rock. Minerals. 2022; 12(4):488. https://doi.org/10.3390/min12040488
Chicago/Turabian StyleXiao, Peng, Diyuan Li, and Quanqi Zhu. 2022. "Strain Energy Release and Deep Rock Failure Due to Excavation in Pre-Stressed Rock" Minerals 12, no. 4: 488. https://doi.org/10.3390/min12040488