Article

Abiotic Depletion of Boron: An Update Characterization Factors for CML 2002 and ReCiPe

1
Department of Environmental Engineering, Ondokuz Mayis University, Samsun 55139, Turkey
2
Department of Industrial Engineering, Ondokuz Mayıs University, Samsun 55139, Turkey
3
Arts et Métiers Institute of Technology, University of Bordeaux, CNRS, Bordeaux INP, INRAE, I2M Bordeaux, F-33400 Talence, France
4
French Institute of Anatolian Studies, CNRS USR 3131, Beyoğlu, Istanbul 34433, Turkey
*
Author to whom correspondence should be addressed.
Minerals 2022, 12(4), 435; https://doi.org/10.3390/min12040435
Submission received: 24 February 2022 / Revised: 23 March 2022 / Accepted: 25 March 2022 / Published: 31 March 2022

Abstract

:
The risk of resource depletion for future generations of humanity is often cited as an important issue. The choice of impact categories and characterization models for resource extraction in LCA is no more precise than other impact categories and models. This means that more discussion is needed on the use of resources. In this article, the potential depletion of Boron and Boron minerals (Colemanite, Ulexite, Tincal) are studied. These minerals have a big role for the world and for Turkey; however, this resource is limited. Using the life cycle assessment methodology, one can estimate the resource depletion through the indicator “abiotic resource depletion”. Several models can evaluate this indicator, but the most used models are ReCiPe and CML (that is the previous attempt of ReCiPe) methods. Here, we estimated the damage that is done to natural resource scarcity. The values that are calculated by these two methods were compared to identify the potential evolution of the model and to observe the gap between these two models. The ReCiPe method refers to the average amount of extra ore that is produced in the future to extract 1 kg of boron ore or boron minerals resource. On the other hand, The CML method depends on the final reserve amount in terms of depletion. The results show no depletion shortly for boron ore and boron minerals. Correlation coefficients were calculated in the ReCiPe method, and ‘high uncertainty’ was estimated since R2 < 0.8. This research highlights the fact that there is the necessity to propose different impact factors for the various minerals and not only for boron (that is done today).

1. Introduction

Boron is a rare element in nature, belonging to group 3A, that is represented by the symbol B in the periodic table. This element, which has a semiconductor between metal and nonmetal, isn’t in nature alone in free form. It is usually found in combination with other elements in salts. Especially since it has a high affinity for oxygen, there is a lot of boron-oxygen composition (B2O3). This compound is called ‘borate or boric oxide’. There are more than 280 boron-containing minerals. The most common borates are salts of sodium, calcium, and magnesium. The most important boron compounds that are produced in limited numbers in the world and with high commercial value are colemanite (Ca4B6O11·5H2O), tincal (Na2B4O7·10H2O), ulexite (NaCaB5O9·8H2O), and boric acid (H3BO3) [1,2].
In addition to having the world’s largest boron reserves (about 73.6%), Turkey has the most important boron minerals with high commercial value and ore quality, namely colemanite (71.8%), ulexite (2.6%), and tincal (25.6%). For this reason, all countries of the world are dependent on Turkey’s high commercial value boron mineral reserves [3].
The rapid increase in living standards and the developments in technology have increased the demand for boron minerals and created a wide area of usage of boron minerals. It is used in many fields, from space technologies, the information sector, nuclear technologies, to the war industry. Approximately 56% of the demand in the boron sector is met by Turkey and 28% by the USA; countries such as Russia, China, Chile, and Argentina also get a share from the boron market. On the other hand, Eti mine works (Turkey) maintained its leadership in the world boron industry in 2019. Therefore, boron production is vital for national/regional economic development and human well-being [3].
Boron has a wide range of uses but is limited to its production in Turkey and the United States. In this case, the depletion of the resources of strategically important mines such as boron will cause serious problems such as possible environmental effects and an increase in their economic value, energy, and material shortages. Boron has been among the eight most critical materials since 2017, and its widespread use in the industry makes it possible to quantify the loss of life on Earth to assess the severity of the condition, such as a resource depletion criterion [3].
Although boron production is vital for industry, agriculture, and human health, almost no studies on its potential environmental effects have been conducted in the literature. Studies have been carried out to obtain results that are related to process mining for the boron mine. These studies don’t discuss boron minerals and boron ADP [4]. There are also many articles about ADP. However, these studies aren’t studies on the ADP of boron minerals. It is essential to explore the possible ecological consequences of boron on sustainable development and the possibility of depletion of resources for future generations of humanity [3].
Currently, life cycle assessment (LCA) is used to assess the environmental impacts of a product and systems, with a panel of indicators. One of the most well-known indicators is the “abiotic depletion potential” (ADP) [5]. In that way, this article will propose an update of the characterization factor that is used to calculate the ADP in LCA. ReCiPe and CML 2002 methods, which are generally used in mining activities, will be used, and the limitations and possible effects of the models will be criticized [3]. Even if ReCiPe is an update of CML, it seems relevant to highlight both models as CML has been widely used and the necessity to compare our current results is crucial.
We identified that in the current inventories (e.g., from Eco invent), one can see the different minerals as an input, however, ReCiPe and CML propose only a characterization factor for boron, omitting the other minerals. This lack could generate wrong results for ADP by underestimating or overestimating the impact depending on the industrial sector (e.g., glass industry uses lots of ulexite).
Based on the international data and regional data, our proposition is to propose characterization factors for the world and at the Turkish scale. The characterization factor of abiotic depletion potential will be calculated using Eti mine works annual reports, World Resource Institute, and the United States Geological Survey (USGS) data.

2. Methods for Life Cycle Assessment (LCA)

2.1. Life Cycle Assessment (LCA)

Life cycle assessment (LCA) is the standard method that is used by scientists and engineers to evaluate the potential environmental impacts and resources that are used throughout a product’s entire life cycle, from raw material purchase to production and use ISO 14040/44 [5].
Therefore, according to the EPA, LCA is viewed as a tool for assessing the environmental impacts of products and processes throughout their life cycle, including extraction, production, use, final disposal, and all transfer stages in between. LCA assesses the environmental impact of emissions to air, water, and soil, including energy from raw material extraction to product formation [6,7].
There are many environmental impact categories in LCA. Among these categories, climate change, human health, ecosystem quality (water and land use), and resource depletion (non-renewable primary energy sources) are emphasized [8,9].
Even if LCA is a widespread method of assessing environmental impacts on air, water and soil, ecology, and human health to achieve a sustainable future, LCA has some limitations as well as strengths. The evaluation is based on data availability. LCA’s weakness is that it can’t determine which process, product, or technology is cost-effective [10,11] as the regional and temporal evaluation [12,13].
The LCA method offers the opportunity to evaluate results differently, rather than deriving a line result. LCA is a transparent procedure. It doesn’t only provide the results but can also provide intermediate results at the request of the user. The LCA method was applied according to the ISO standard [14]. There are four phases that should be implemented in any life cycle assessment study. The first step includes the definition of the purpose and scope, the reasons for performing the study, and the target audience to which the study results will be communicated. In the second step, life cycle inventory analysis, all relevant data are collected and organized. In the third phase, information is collected about the impact assessment, the life cycle step, and all environmental impacts that are associated with the current team identified [15,16]. In the final stage, the interpretation of the results interprets the results of both the inventory and environmental impact analysis stages, making recommendations, revealing critical implications for mining and mineral products.
The UNEP/SETAC life cycle initiative grouped environmental impacts within the UNEP/SETAC life cycle assessment midpoint and endpoint damage limits. This group relates environmental interventions in emissions that are calculated in resource consumption, life cycle inventory (LCA) analysis, and different impact categories such as climate change [17].
The selection of impact categories is usually made according to the recommended impact assessment guide or software application. That’s why, in practice, it is usually “IMPACT2002+”, “TRACI”, “CML 2002”, “ReCiPe”, “ILCD” etc. methods are used. Selecting which of these issues indicates that the impact categories can be aggregated into a less than a midpoint-endpoint indicator. To express physical flows mathematically, the inputs and outputs are determined at each stage of the LCA. According to the purposes of the study, it can be calculated using the CML (midpoint) and ReCiPe (endpoint) indicators [16].

2.2. Methods for LCA

Concerns about environmental pollution, energy, and product scarcity have increased the development of life-cycle-oriented approaches. A life cycle assessment (LCA) aims to measure the environmental impact of the entire life cycle of products. In other words, it is expressed as a tool for evaluating possible environmental impacts and resources from raw material purchase to waste management, production, and use [18,19].
The LCA is an essential tool that is used to implement the environmental impact assessment of mining operations. The LCA assesses impacts on the environment and human health, resource use, water, and soil during mining and other processes. Few published studies can measure the environmental loads of the mineral resource (copper, cobalt, gold, nickel, iron, zinc, steel, etc.) considered for life cycle assessment of extraction operations. These studies mainly focused on the assessment of impacts such as global warming, energy demand or acidification potential. Fewer of these studies consist of LCA, which includes impact analyzes based on human health, ecosystems, and resource use. This research aims to measure the environmental impact of boron mining and its impact on resource depletion. The analyses focus on the depletion of abiotic resources impact category of the LCA. It was used to make annual feasibility reports of manufacturers and USGS database calculations.
This article conducted the LCA according to the International Organization for Standardization (ISO 14040 and ISO 14044). ISO 14040 and ISO 14044 define an LCA framework and deal with environmental management. It represents the limitations and applications of the LCA and sets out the guidance and requirement for the LCA. In addition, the quantity and quality of the collected data are also provided by this standard [20,21].

2.3. Abiotic Resource Depletion in LCA

Depleting a resource means that the current geological/natural stocks of that resource in the world are reduced, or its life is short. Resource depletion serves the view that future generations should have access to the resources that we have now or at least as well as we do. Abiotic resource depletion (ADP) is one of the most debated categories as it is not a scientifically accurate method for determining the characterization factors in life cycle assessment. There could be many reasons for this controversy. First, resource reserve transcends the economy-environment system, as resource extraction depends on future technologies. Second, the chosen parameters, the characterization models, and the data to be used. None of this can be experimentally verified. The presumed availability for future resources and future technologies depends on supply and demand [22,23].
Extracting resources is a particular issue. The extraction of resources brings with it many problems. The impact category of abiotic resource depletion depends solely on natural resources, such as human health and territorial area protection [24]. Natural resources are recognized as a protected area by SETAC WIA (Environmental Society Association) including both abiotic and biotic resources [25].
The LCA and the geological community do not use the same purposes of leading geological institutions. It compared the reports that are used by the International Committee on Mineral Reserves Reporting Standards (CRIRSCO) with the reserve definitions that are used in the ADP (Table 1). The definitions of resources and reserves should be harmonized to allow better communication between both communities in the future. Institutions within the geological community are now approaching CRIRSCO definitions. It seems appropriate for the LCA community to use the same language and reports [25,26].
The disadvantage of the “reserve base” and the “economic reserve” are that the reserve size is unpredictable. It also includes economic and technical issues that aren’t directly relevant, and the estimates are almost accurate. The “ultimate reserve” is directly related to resource depletion, and it is unclear how much of the highly complex concentrations of elements and compounds will be depleted. Technical and economic developments remain uncertain about how much of the resource could be used in the distant future [24].
The amount and distribution of use of various theoretical resources in the earth’s crust are given. It is assumed that the average crustal thickness is 17 km and the crustal surface is 5,141,014 m2. The middle earth crust density is 2670 kg m3. The ultimate reserve of a resource is the surface area that is enclosed by the curve. Other estimates of the reserves are given by the size, the surface area that is enclosed by the curve, and the x-axis intersecting the circle at two points [27].
Figure 1 gives a theoretical view of the different reserves with the concept of extraction difficulty to obtain a sought-after tonal resource. In reality, the curve of the graph is not that regular, showing much more normality and also, it is very mineral-dependent, and the volatility of the parameters can change even in the same family of minerals. That why, in our study we are going to focus on boron minerals and its different potential form. boron is much more complex than other minerals, as it can have different forms (tincal, colemanite, and ulexite). However, all LCIA proposes characterization factors only for boron, in that case, one can easily understand that the reserve and the use of each form of boron can be different and the characterization factor also. According to the method that is used, its equivalent can be expressed in kilograms of antimony (Sb) or copper (Cu). The final reserve, the fundamental reserve, and the economic reserve are considered. These data varied depending on the methods (ReCiPe or CML 2002).

2.3.1. ReCiPe

ReCiPe was created by the joint effort of RIVM (Rijksinstituut Voor Volksgezonheid en Milieu), CML 2002, PRe-Consultants, Radboud Universiteit Nijmegen, and CE Delft. The ReCiPe approach combines Dutch CML 2002’s midpoint approach with Eco-indicator 99’s damage approach, helping users to choose which level, midpoint, or endpoint for reporting indicators. In the endpoint method, one of the ReCiPe methods, most of the midpoint impact classes are multiplied by the damage factors and aggregated into three characterization factors human health, ecosystems, and resource availability [17,27].
ReCiPe is commonly used in all industrial sectors to conduct LCA and even most of the indicators are recommended by the European Commission [27]. Many reasons give this method as one of the most used, the method proposes 18 midpoint-based indicator categories and 3 endpoint-based indicator categories. Moreover, ReCiPe proposes different categories as hierarchies, individualistic, and egalitarian.
The ReCiPe does not include data on resource exhaustion criteria before recent updates. It was known that the factor was zero and an LCA of a boron-containing product had no impact on the consumption of this resource and its environment. ReCiPe was updated and a “mineral resource scarcity” criterion was found with a characterization factor for boron. Finally, ReCiPe is based on ore quality. The primary extraction of a mineral resource (ME) will result in an overall decrease in ore grade (OG). This means that the worldwide ore concentration from that resource will increase the ore that is produced (OP) per kilogram of mineral resource mined. Combined with the anticipated future extraction of the mineral resource, it reveals the average ore surplus potential (SOP), which is the midpoint indicator for this impact category. The increase in excess ore potential will increase the potential for an extra cost. These two indicators lead to the belief that the first mine sites that were discovered for SOP and SCP, respectively, were higher grade or lower cost mine sites [17].
The midpoint characterization factor for resource scarcity of minerals is the excess ore potential (SOP). As such, SOP is the average amount of extra ore that will be produced in the future by mining 1 kg X of mineral resources. It considers all future production (R) of this mineral resource, based on the extra deductible average. For example, given all future boron production (which may be in a different mineral), the excess ore potential from 1 kg of boron extraction is expressed as the extraction of the mineral resource and as kg ore/kg boron per unit. The midpoint characterization factor (X) of the boron mineral resource and any reserve estimate (Rbor) (e.g., Rx) can be calculated as follows:
SOPx , R = A S O P X , R A S O P C u , R
Which yields a future-production specific SOP with the unit kg Cu-eq/kg x. To calculate the characterization criteria, it will be sufficient to calculate the ASOP of each product and the ASOP of copper. There are two steps to calculate the ASOP of these ores.
O G x = e x p α x · e x p ( β x · l n A x C M E x C M E x )
Figure 2 shows an example of the cumulative grade-tonnage relationship for copper plotted using a log-logistic regression (on a logarithmic scale).
  • Ax: Total X amount of resources mined (kg);
  • CMEx: Cumulative amount of X mineral resource currently mined (kg);
  • αx: Scale parameter of ore curve grade;
  • βx: Shape parameter of ore curve grade.
Finally, we can calculate ASOPx. OPx is equal to the inverse of OGx.
A S O P x = C M E x M M E x Δ O P x d M E x R x
  • OPx: Ore produced per 1 kg (kg);
  • MEx: A certain amount of mineral resources extracted(kg);
  • Rx: Current reserve of X resource (kg);
  • MMEx: Maximum amount that can be extracted from X mineral resource (kg).
Here, we estimated the damage to natural resource scarcity for the boron mine. Analysis of ReCiPe results for the midpoint characterization factor for boron is given in Section 3.

2.3.2. CML 2002

Developed by the Institute of Environmental Sciences (CML) at Leiden University (Netherlands), CML 2002 aimed to functionalize the ISO14040 standards and provide current best practices for midpoint indicators. CML 2002 includes nine “core” effect categories that are used in virtually all LCA studies and 12 “study-specific effect categories” are appropriately included. The most common issues are human health, cancer and non-cancer impacts, climate change, terrestrial, marine, aquatic eutrophication, acidification potential, resource scarcity, land-based impact categories, and water use and ecotoxicity. Climate change, human health, ecosystems, and resources are among the impact categories of the endpoint indicator (damage focused) [17,27].
Reducing resources is seen as the main problem in this method. Therefore, the protected area is natural resources. The characterization model is a function of resource extraction rate and natural reserve. The current primary method is based on two different problems. First, depletion of elements and a reduction of total natural reserves (in kg). Second, the depletion of fossil fuels and the depletion of the total natural energy reserve (MJ). However, we will not examine resource depletion for fossil fuels in this article. The unit of abiotic depletion potential (ADP) is the kg equivalent antimony (Sb). In this method, the LCA results are multiplied by the characterization factor (kg antimony equivalents/kg extraction) to obtain the extractions of the elements (in kg, kg antimony equivalents) [24,29].
Abioticdepletion = i A D P İ × m i i
with:
A D P i = D R i R i 2 D R r e f R r e f 2
and:
  • ADPi: Abiotic depletion potential of resource i (generally dimensionless);
  • mi: quantity of i resource extracted (kg);
  • Ri: Ultimate reserve of i resource (kg);
  • DRi: extraction rate of the reference resource, antimony (kg);
  • DRref: Extraction rate of the reference resource, Rref (kg/year).
This problem-based method is widely used in LCA studies. The results of the CML 2002 method are based on the original formula. There is also a non-essential version of CML 2002 where the CML 2002 impact category (abiotic depletion) is split into two; one uses the primary reserve, and the other uses the economic resource [30]. We will, therefore, do the calculations ourselves, using up-to-date data and potentially updating the recharacterization factor [28,31].

3. Proposition

In 2020, approximately 16,270,323 tons of boron were produced globally, and approximately 911,381 tons of boron was produced by Eti mine works in Turkey in 2020. While Turkey ranks first in world boron production with a share of 56%, it is followed by the main competitor (USA) with 27% and other producers with 17%. Due to the COVID-19 global epidemic in the world, annual boron production amounts in the extraction and production of boron were interrupted. Therefore, the amount of boron production in 2020 was relatively low compared to other years [31,32]. The amounts are calculated by considering the previous years and production %. The data of many countries for 2020 aren’t included in the USGS database. Therefore, the exact production amounts for colemanite, ulexite, and tincal in the world aren’t known. In Turkey, colemanite, ulexite, and annual production amounts have been calculated for tincal, taking into account the production % [32,33].
The distribution of world boron reserves (B2O3) by country is given in Table 2.
Boron deposits in Turkey are located in Kirka/Eskişehir, Bigadiç/Balikesir, Kestelek/Bursa, and Emet/Kütahya. In terms of the reserve, the most boron minerals are tincal (Na2O·2B2O3·10H2O) and colemanite (2CaO·3B2O3·5H2O). In Turkey, tincal deposits are located in Kırka, and colemanite deposits are situated in Emet, Bigadiç, and Kestelek. In addition, Bigadiç has an ulexite reserve, and in Kestelek, in addition to colemanite, ulexite is often obtained as a by-product. The reserve amounts on a mineral basis are given in Table 3 [32].
The annual production amounts for colemanite, ulexite, and tincal for 2020 and the final reserve amounts of the products are given in Table 4. Based on these data, CML 2002 “Abiotic Depletion” characterization factors were calculated for each mineral. In Turkey, in 2020, the reference resource (antimony) extraction rate (kg/year) is 100 thousand tons. Considering these data, we calculated the ADP characterization factors.
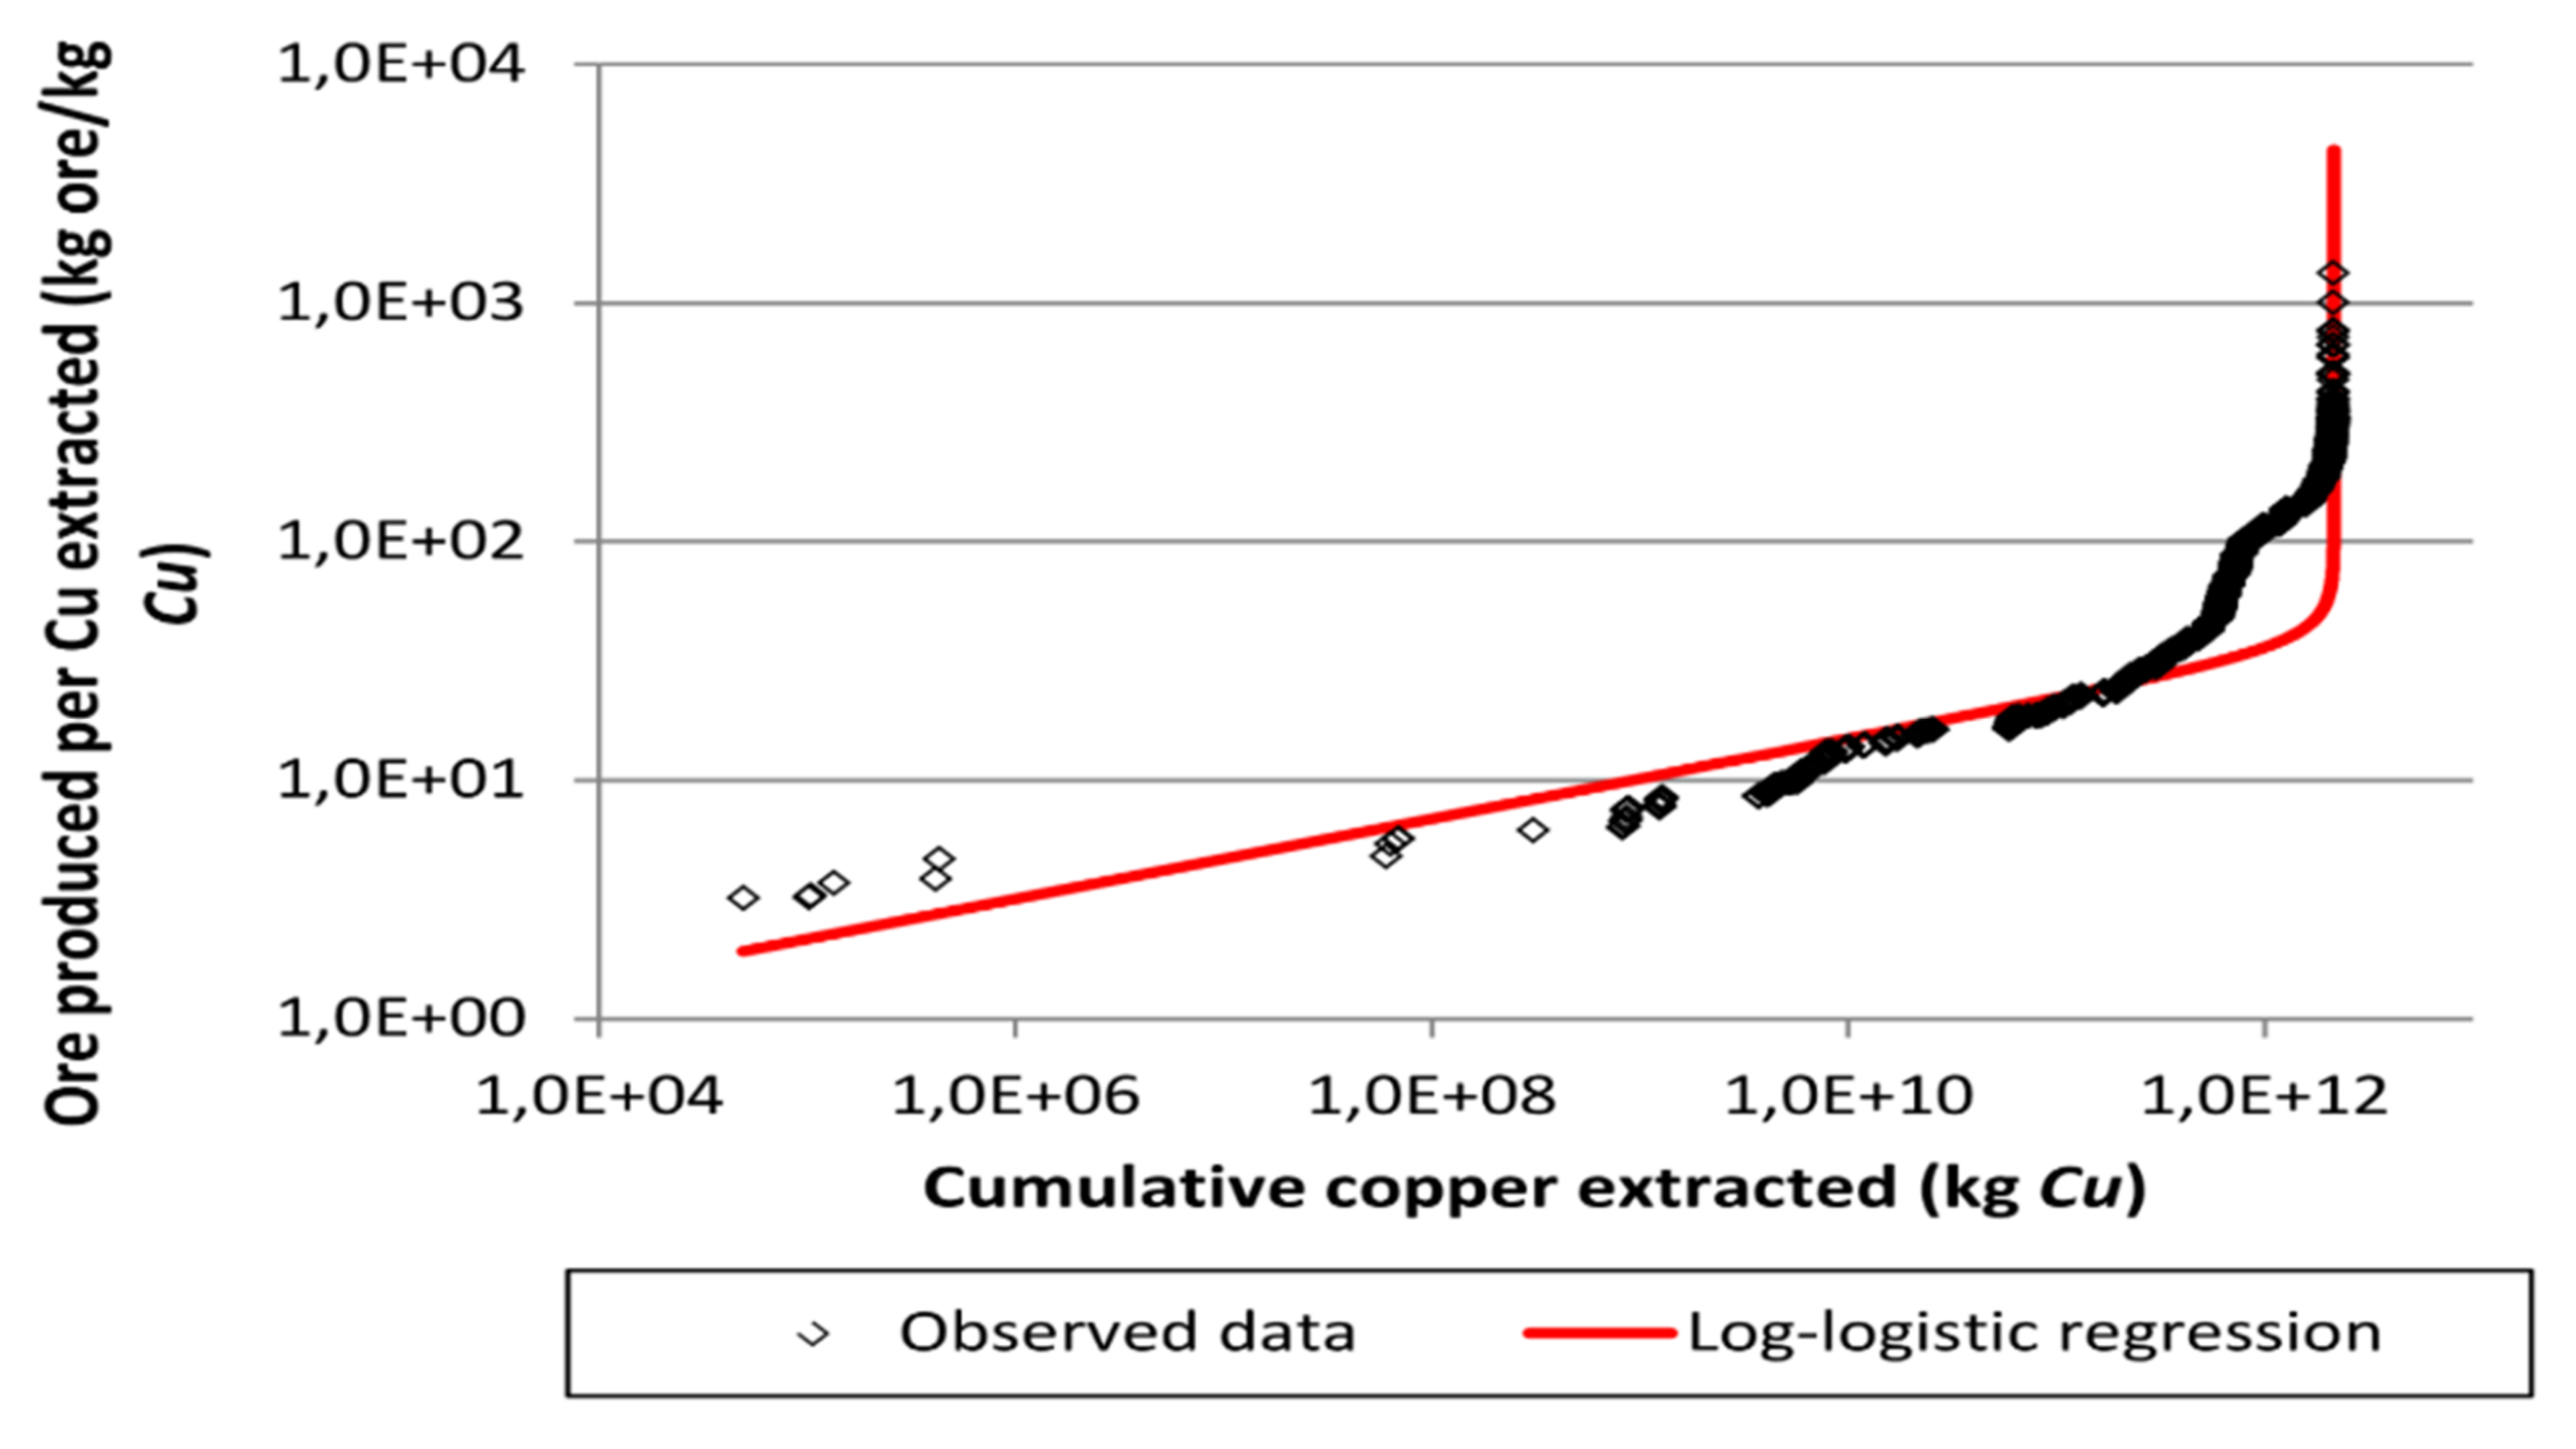
The absolute surplus potential (ASOPx) is calculated to arrive at the average cost increase due to future extraction of the boron mineral resource, the total excess cost per unit boron mineral resource. In Table 4, the amount of reserves issued for 2020 is given. To calculate the amount of extra ore to be produced (ASOPx) in the future per 1 kg of boron mineral resource mined in Table 5 and Table 6, we calculated the cumulative tonnage available (CMEx), the maximum capacity mined (MMEx) and the final reserve (Rx) of the resource used and 1 kg mined. boron mineral. The amount of ore produced for the boron mineral is given for Turkey and the world. Based on these data, ASOPx's were calculated.

4. Results

4.1. Theoretical Characterization Factors

There are two different calculation methods that were used to determine the characterization factors.
Firstly, calculations were made with the CML 2002 method, taking the final reserve and basic reserve data into account. The CML 2002 impact analysis calculated the exhaustion coefficients of the last reserve and the primary reserve resources separately. These calculation results are given in Table 7 which compared basic world reserve and final reserve results for 1999. Unfortunately, we can’t see any data for boron minerals, tincal, ulexite, and colemanite in the USGS report. Extraction data is available only in the reports of Eti mine works, but the calculated characterization factors for previous years are not known. Therefore, we could not make a comparison to prior years. The calculations provide a more general comparison for the worldwide boron supply.
The ReCiPe method was chosen as the second calculation method. The calculation results are given in Table 8. The ReCiPe is mathematically broader as it is more current than CML 2002. The reserve estimates require more precise data. The characterization factors were calculated for the world in 2016, but we cannot see them for Turkey. The absolute excess ore potentials (ASOPx) were calculated using 2020 data to determine characterization factors in the world and Turkey. Figure 3 and Figure 4 show the cumulative grade-tonnage relationship plotted using log-logistic regression (on a logarithmic scale) for existing boron minerals.
Scale parameters (αx), shape parameters (βx), and R2 of the ore curve grade were calculated in each plot. The uncertainty of the characterization factors was calculated. Information on the correlation coefficient (R2) of the cumulative grade-tonnage curves of the boron mineral resource is given in Figure 3 and Figure 4. These provide a good indication of the uncertainty in the derived CFs. Therefore, we decided to qualitatively cluster all minerals in three uncertainty classes based on each R2:
  • If 0.9 ≤ R2 ≤ 1: low uncertainty
  • If 0.8 ≤ R2 ≤ 0.9: medium uncertainty
  • If R2 < 0.8: high uncertainty

4.2. Application Case

The choice of the case study concerns a boron-based detergent. This product is currently widely used due to the pandemic, and Turkey is becoming one of the leading suppliers. We will consider the product’s simple ingredient list of 10% ethanol, 10% glycerin, 30% boric acid, 10% sodium borate, and 40% water for this case study. Our study will only focus on the abiotic depletion indicators with three scenarios of characterization factors (i) the usual model; (ii) the usual model adding three substances (colemanite, tincal, and ulexite) but using the same characterization factors than existing boron; then (iii) the usual model adding three substances (colemanite, tincal, and ulexite) but giving specific characterization factors that are proposed in Section 4.1. These three scenarios have been implemented for CML and ReCiPe as follow:
Simapro was used to assess the results and Ecoinvent 3 (APOS data) database was used for the bill of materials. The following results are given for 100 kg of detergent.
The first results that were obtained show that applying an identical characterization factor to the different ores (Scenario 2) gives a much higher impact than Scenario 1, so there is an influence of the different ores on the final impact. The analysis of the inventory shows that in the case of Scenario 2, the impact is generated 82% by colemanite and 14% by tincal. Subsequently, Scenario 3 proposes characterization factors that are adapted to each ore, which greatly reduces the influence of colemanite and tincal and then gold to 85% of the overall impact (as for Scenario 1 where it had an impact of 97%) ahead of colemanite (8%) and tincal (4%).
The results obtained with CML 2002 as kg antimony equivalents and ReCiPe expressed as kg copper equivalents are given in Figure 5 and Figure 6. The analysis has been conducted with ReCiPe with the same scenarios using the proposed characterization factors Table 9. The characteristic value of the detergent, expressed as kg antimony equivalent, is given in Table 10. The characteristic value of the detergent is expressed as kg Cu equivalent in Table 11.
The results that were obtained are completely similar to those that were obtained with CML 2002. In the same way, gold is found to be the substance having the greatest impact in Scenario 1 and 3. Both colemanite and tincal have an influence, even slight, but more than boron.

5. Conclusions

It is impossible to define a single correct method for assessing the depletion of abiotic resources. The subject is complex and new ways constantly evolve, with different perspectives and views on resource use. The underestimation of the problems that are caused by human natural resources extraction necessitates the calculation of ADPs. In this article, the effects on resource depletion were evaluated by using the CML 2002 and ReCiPe methodologies over the life cycle assessment of the existing boron reserve in Turkey. The methods were chosen because they are the most used in LCA, and the ReCiPe method is generally recommended to evaluate ADP, especially from the EU.
Since the CML 2002 impact category focuses on human and ecosystem health, it is the section that examines the elements that are taken from the ecosystem as inputs of production activities. Depletion depends on the relevant single reserve parameter of the last reserve and it is not possible to know for sure as extraction is dependent on future technological developments. In addition, the use of reference material (antimony) makes it easier to understand that it is closer to abiotic resource depletion unity. A global investigation was conducted. The environmental effects of the source causing the depletion were considered while making the assessment. The use of resources has been studied worldwide to reduce reasonable reserves. CML 2002 impact analysis, natural resource consumption, and economic value were calculated separately and updated with CML 2002 “abiotic resource depletion” characterization factor, the reserve and extraction amounts, United States Geological Survey (USGS) data, and Eti Mine works annual Boron sector report 2020 data. The calculation was made with exact reserve and base data. In the 2020 numerical reserve calculations, it was taken as the equivalent of kg antimony. The calculation results were compared with the 1999 data. However, we couldn’t find any characterization factors from previous years for colemanite, ulexite, and tinkle. A more general calculation is available for the worldwide supply of boron. When the results that are given in Table 5 and Table 6 are examined [32,33], it is seen that the characterization factor of boron is relatively low and possible resource scarcity is not expected.
Concerning the indicator of resource depletion (abiotic depletion) in the CML 2002 method, precise knowledge of the reserves is required [34]. Therefore, the slightest deviation in the estimates changes the results. The data that are used to calculate the characterization factors should be accurate estimates. However, in this paper, due to the lack of data and confidentiality of company policies, we could not draw firm conclusions and calculate characterization factors based on the estimated data. The ReCiPe is a cutting-edge and more up-to-date method for transforming lifecycle inventory into limited lifecycle impact scores at the midpoint and endpoint levels; it is based on more reliable data and offers new updates. However, it depends on the amount of ore that is produced per resource mined. The complexity of the method is more speculative as it does not apply to all materials.
CML 2002 and ReCiPe are not considered from the same perspective. For CML 2002, the calculated results for resource depletion, ReCiPe reference equivalent units are different. CML 2002 uses the antimony (Sb) equivalent, and ReCiPe uses the copper (Cu) equivalent [35,36]. However, the resource hierarchy of both methods is the same. Resources that require more effort to extract in the future differ from those that are consumed in CML 2002, regardless of the reserve that is used. Therefore, in our study, we paid attention to the reliability of the models and calculations in LCA. Since the CML 2002 method is dependent on the variability in reserve amounts and data on resource depletion depend on estimates, we cannot accept it as a 100% reliable method. In this study, the “Depletion of Abiotic Resources” study was conducted for different boron mineral resources in Turkey. The ADP results reveal that Turkey will not experience a possible resource shortage in a short time.
The component related to the more specific indicator of resource depletion is genuinely innovative; so far, only boron in its crude form has been calculated. With our study, we can highlight the importance of distinguishing between different ores and the differentiation of minerals, critically boron. For this reason, our study shows that not all boron ores are critical and the classification made by the European Union should be revised considering the differentiation of ores.
Finally, the next step of this work could be to calculate the dissipation potential of the different minerals of boron with the work of Charpentier Poncelet [37,38] that proposes to consider a lifespan of the minerals that is extracted of the earth crust.

Author Contributions

Conceptualization, B.L.; methodology, B.L.; software, B.L.; validation, B.L., S.Ç. and B.E.; formal analysis, A.Ç.; investigation, B.E. and A.Ç.; resources, B.E., A.Ç. and S.Ç.; data curation, B.L., B.E. and A.Ç.; writing—original draft preparation, A.Ç. and B.L.; writing—review and editing, A.Ç. and B.L.; visualization, A.Ç.; supervision, B.L.; project administration, B.L.; funding acquisition, A.Ç., B.L., B.E. and S.Ç. All authors have read and agreed to the published version of the manuscript.

Funding

This paper has been produced benefiting from the 2232 International Fellowship for Outstanding Researchers Program of TÜBITAK (Project No: 118C219). However, the entire responsibility of the paper belongs to the owner of the paper. The financial support received from TÜBITAK does not mean that the content of the publication is approved in a scientific sense by TÜBITAK.

Data Availability Statement

This data can be found here: 33. ETI Maden. Bor Sektör Raporu, 2020, (10 August 2021), Bor Sektör Raporu-2019, Eti Maden İşletmleri Genel Müdürlüğü, May 2020. Available online: https://www.etimaden.gov.tr/storage/2020/2019BORSEKTORRAPORU.pdf (accessed on 12 May 2020). and 35. Mineral Commodity Summaries. U.S. Geological Survey; U.S. Governement Publishing Office: Reston, VA, USA. Available online: https://pubs.er.usgs.gov/publication/mcs2021 (accessed on 19 July 2021).

Conflicts of Interest

The authors declare no conflict of interest.

References

  1. Ozkan, Ş.G.; Tombal, T.D.; Unver, I.K.; Osmanlioglu, A.E. Properties, production, uses of boron compounds and their importance in nuclear reactor technology TENMAK Bor Araşt. Enst. 2016, 1, 86–95. [Google Scholar]
  2. Helvacı, C. Geological features of neogene basins hosting borate deposits: An overview of deposits and future forecast, Turkey. Bull. Miner. Res. Explor. 2015, 151, 169–215. [Google Scholar] [CrossRef] [Green Version]
  3. Bor Sektör Raporu-2019, Eti Maden İşletmleri Genel Müdürlüğü, May 2020. Available online: https://www.etimaden.gov.tr/storage/2020/2019BORSEKTORRAPORU.pdf (accessed on 12 May 2020).
  4. Türkbay, T.; Laratte, B.; Çolak, A.; Çoruh, S.; Elevli, B. Life Cycle Assessment of Boron Industry from Mining to Refined Products. Sustainability 2022, 14, 1787. [Google Scholar] [CrossRef]
  5. Wu, J.; Li, B.; Lu, J. Life cycle assessment on boron production: Is boric acid extraction from salt-lake brine environmentally friendly? Clean Technol. Environ. Policy 2021, 23, 1981–1991. [Google Scholar] [CrossRef]
  6. Van Caneghem, J.; Vermeulen, I.; Block, C.; Cramm, P.; Mortier, R.; Vandecasteele, C. Abiotic depletion due to resource consumption in a steelwork assessed by five different methods. Resour. Conserv. Recycl. 2010, 54, 1067–1073. [Google Scholar] [CrossRef]
  7. An, J.; Xue, X. Life cycle environmental impact assessment of borax and boric acid production in China. J. Clean. Prod. 2013, 66, 121–127. [Google Scholar] [CrossRef]
  8. Sonnemann, G.; Vigon, B.W. Global Guidance Principles for Life Cycle Assessment Databases: A Basis for Greener Processes and Products: ‘Shonan Guidance Principles’; United Nations Environment Programme: Nairobi, Kenya, 2011. [Google Scholar]
  9. Polat, E.; Koyunoglu, C. Life Cycle Assessment of the Bio-Mitigation in Steel and Iron Industry Using Chlorella Sp. IOP Conf. Series: Earth Environ. Sci. 2019, 221, 012131. [Google Scholar] [CrossRef]
  10. Schulze, R.; Guinée, J.; van Oers, L.; Alvarenga, R.; Dewulf, J.; Drielsma, J. Abiotic resource use in life cycle impact assessment—Part I—Towards a common perspective. Resour. Conserv. Recycl. 2019, 154, 104596. [Google Scholar] [CrossRef]
  11. Schulze, R.; Guinée, J.; van Oers, L.; Alvarenga, R.; Dewulf, J.; Drielsma, J. Abiotic resource use in life cycle impact assessment—Part II—Linking perspectives and modelling concepts. Resour. Conserv. Recycl. 2020, 155, 104595. [Google Scholar] [CrossRef]
  12. Laratte, B.; Guillaume, B. Epistemic and Methodological Challenges of Dynamic Environmental Assessment: A Case-Study with Energy Production from Solar Cells. Key Eng. Mater. 2013, 572, 535–538. [Google Scholar] [CrossRef]
  13. Bratec, T.; Kirchhübel, N.; Baranovskaya, N.; Laratte, B.; Jolliet, O.; Rikhvanov, L.; Fantke, P. Towards integrating toxicity characterization into environmental studies: Case study of bromine in soils. Environ. Sci. Pollut. Res. 2019, 26, 19814–19827. [Google Scholar] [CrossRef] [PubMed] [Green Version]
  14. BS EN ISO 14040:2006; Environmental Management Life Cycle Assessment Principles and Framework. International Organization for Standardization: Geneva, Switzerland. 2006. Available online: http://www.cscses.com/uploads/2016328/20160328110518251825.pdf (accessed on 24 June 2021).
  15. Huijbregts, M.A.J.; Steinmann, Z.J.N.; Elshout, P.M.F.; Stam, G.; Verones, F.; Vieira, M.; Zijp, M.; Hollander, A.; van Zelm, R. ReCiPe2016: A harmonised life cycle impact assessment method at midpoint and endpoint level. Int. J. Life Cycle Assess. 2017, 22, 138–147. [Google Scholar] [CrossRef]
  16. Van Oers, L.; Guinée, J.B.; Heijungs, R. Abiotic resource depletion potentials (ADPs) for elements revisited—Updating ultimate reserve estimates and introducing time series for production data. Int. J. Life Cycle Assess. 2020, 25, 294–308. [Google Scholar] [CrossRef] [Green Version]
  17. One Click LCA. A Guide to Life-Cycle Assessment for Green Building Experts. One Click LCA. Available online: https://oneclicklca.drift.click/building-lca-ebook (accessed on 26 October 2021).
  18. Azapagic, A.; Clift, R. Life cycle assessment as a tool for improving process performance: A case study on boron products. Int. J. Life Cycle Assess. 1999, 4, 133–142. [Google Scholar] [CrossRef]
  19. Winter, M.; Ibbotson, S.; Kara, S.; Herrmann, C. Life cycle assessment of cubic boron nitride grinding wheels. J. Clean. Prod. 2015, 107, 707–721. [Google Scholar] [CrossRef]
  20. Margni, M.; Curran, M.A. Life Cycle Impact Assessment. In Life Cycle Assessment Handbook, 1st ed.; Curran, M.A., Ed.; Wiley: Montreal, QC, Canada, 2012; pp. 67–103. [Google Scholar] [CrossRef]
  21. Silvestri, L.; Forcina, A.; Silvestri, C.; Ioppolo, G. Life cycle assessment of sanitaryware production: A case study in Italy. J. Clean. Prod. 2020, 251, 119708. [Google Scholar] [CrossRef]
  22. Van Oers, L.; Guinée, J. The Abiotic Depletion Potential: Background, Updates, and Future. Resources 2016, 5, 16. [Google Scholar] [CrossRef]
  23. Rimos, S.; Hoadley, A.F.; Brennan, D.J. Environmental consequence analysis for resource depletion. Process Saf. Environ. Prot. 2014, 92, 849–861. [Google Scholar] [CrossRef]
  24. Van Oers, L.; de Koning, A.; Guinée, J.; Huppes, G. Abiotic Resource Depletion in LCA: Improving Characterisation Factors for Abiotic Resource Depletion as Recommended in the New Dutch LCA Handbook. CML, Research Report, Methodology DWW-2002-061. 2002. Available online: https://puc.overheid.nl/doc/PUC_129857_31 (accessed on 21 June 2021).
  25. Ozturk, M.; Dincer, I. Comparative environmental impact assessment of various fuels and solar heat for a combined cycle. Int. J. Hydrogen Energy 2019, 44, 5043–5053. [Google Scholar] [CrossRef]
  26. Pradel, M.; Garcia, J.; Vaija, M.S. A framework for good practices to assess abiotic mineral resource depletion in Life Cycle Assessment. J. Clean. Prod. 2020, 279, 123296. [Google Scholar] [CrossRef]
  27. Farjana, S.H.; Huda, N.; Mahmud, M.P.; Saidur, R. A review on the impact of mining and mineral processing industries through life cycle assessment. J. Clean. Prod. 2019, 231, 1200–1217. [Google Scholar] [CrossRef]
  28. Hauschild, M.Z.; Wenzel, H. Environmental Assessment of Products: Volume 2: Scientific Background; Springer: London, UK, 1997. [Google Scholar]
  29. European Commission, Joint Research Centre. Suggestions for Updating the Organisation Environmental Footprint (OEF) Method; Publications Office: Luxembourg, 2019; Available online: https://data.europa.eu/doi/10.2760/424613 (accessed on 10 December 2020).
  30. Wenzel, H.; Hauschild, M.Z.; Alting, L. Environmental Assessment of Products: Volume 1: Methodology, Tools and Case Studies in Product Development; Springer: Norwell, MA, USA, 2000. [Google Scholar]
  31. Maden ve Petrol İşleri Genel Müdürlüğü. Maden ve Petrol İşleri Genel Müdürlüğü-Hoşgeldiniz. Maden ve Petrol İşleri Genel Müdürlüğü. Available online: https://www.turkiye.gov.tr/maden-ve-petrol-isleri-genel-mudurlugu (accessed on 24 June 2021).
  32. ETI Maden. Bor Sektör Raporu. 2020. Available online: https://www.etimaden.gov.tr/storage/2021/Bor_Sektor_Raporu_2020.pdf (accessed on 10 August 2021).
  33. U.S. Geological Survey. Mineral Commodity Summaries; U.S. Governement Publishing Office: Reston, VA, USA. Available online: https://pubs.er.usgs.gov/publication/mcs2021 (accessed on 19 July 2021).
  34. Charpentier Poncelet, A.; Loubet, P.; Laratte, B.; Müller, S.; Villeneuve, J.; Sonnemann, G. A necessary step forward for proper non-energetic abiotic resource use consideration in life cycle assessment: The functional dissipation approach using dynamic material flow analysis data. Resour. Conserv. Recycl. 2019, 151, 104449. [Google Scholar] [CrossRef] [Green Version]
  35. Charpentier Poncelet, A.; Beylot, A.; Loubet, P.; Laratte, B.; Muller, S.; Villeneuve, J.; Sonnemann, G. Linkage of impact pathways to cultural perspectives to account for multiple aspects of mineral resource use in life cycle assessment. Resour. Conserv. Recycl. 2022, 176, 105912. [Google Scholar] [CrossRef]
  36. Charpentier Poncelet, A.; Helbig, C.; Loubet, P.; Beylot, A.; Muller, S.; Villeneuve, J.; Laratte, B.; Thorenz, A.; Tuma, A.; Sonnemann, G. Life cycle impact assessment methods for estimating the impacts of dissipative flows of metals. J. Ind. Ecol. 2021, 25, 1177–1193. [Google Scholar] [CrossRef]
  37. Laratte, B.; Guillaume, B.; Kim, J.; Birregah, B. Modeling cumulative effects in life cycle assessment: The case of fertilizer in wheat production contributing to the global warming potential. Sci. Total Environ. 2014, 481, 588–595. [Google Scholar] [CrossRef]
  38. Belyanovskaya, A.; Laratte, B.; Perry, N.; Baranovskaya, N. A regional approach for the calculation of characteristic toxicity factors using the USEtox model. Sci. Total Environ. 2018, 655, 676–683. [Google Scholar] [CrossRef] [Green Version]
Figure 1. Usage amounts and distributions of various theoretical resources in the earth’s crust [25].
Minerals 12 00435 g001
Figure 2. Cumulative grade-tonnage relationship for existing copper mines plotted using a log-logistic regression (in logarithmic scale) [28].
Minerals 12 00435 g002
Figure 3. Cumulative grade-tonnage relationship plotted using a log-logistic regression (on a logarithmic scale) for existing boron mines (In Worldwide).
Minerals 12 00435 g003
Figure 4. Cumulative grade-tonnage relationship plotted using a log-logistic regression (on a logarithmic scale) for existing boron mines. (In Turkey).
Minerals 12 00435 g004
Figure 5. Results with CML 2002 expressed in kg antimony equivalents.
Minerals 12 00435 g005
Figure 6. Results with ReCiPe expressed in kg Cu equivalents.
Minerals 12 00435 g006
Table 1. Types of reserves and definitions [24].
TerminologyDefinition
Ultimate ReserveThe amount of resource ultimately available (an element or regular) is estimated by multiplying its mass or volume by the average natural concentration of the resource in the primary extraction medium (for example, the earth’s crust).
Reserve baseIt is part of an identified resource that meets the current mining application’s minimum physical and chemical requirements. The reserve base includes portions of resources that have the appropriate potential to become economically usable in the planning environment.
Economic reserveThe part of the natural reserve ground can be economically extracted according to the determined order.
Table 2. World Boron Reserve 2020 [33,34].
CountriesReserve Amount
(Thousand Ton (Based on B2O3))
Distribution (%)
Turkey956,00073.6
Russia100,0007.7
USA80,0006.2
Peru22,0001.7
Argentina90000.7
China36,0002.8
Bolivia19,0001.5
Chile41,0003.2
Kazakhstan15,0001.2
Serbia21,0001.6
Total1,299,000100
Table 3. Eti mines reserve amount-2020 [32,33].
Basin NameQuantity (Ton)
Emet (Colemanite-Ulexite)1,804,886.171
Kirka (Tincal)815,398,134
Bigadiç (Colemanite-Ulexite)618,761,479
Kestelek (Colemanite)5,254,923
Total3,244,300,707
Table 4. Reserve and annual subtraction amounts for the CML method (the year 2020) [32,33].
Mineral ResourceWorld Reserve (Tons)Turkey Reserve (Tons)
Extraction (2020)Reserve (2020)Extraction (2020)Reserve (2020)
Boron16,270,3235,520,547,9459,111,3813,300,000,000
Colemanite 5,875,0002,800,000,0001,350,0002,000,000,000
Ulexite2,000,3231,600,000,000500,000450,000,000
Tincal8,300,0001,990,000,0002,790,000825,000,000
Antimony153,0001,900,0002000100,000
Table 5. Characterization factor that was obtained by ReCiPe method for Turkey (the year 2020) [32,33].
Mineral ResourceTurkey Reserve (Tons)
B2O3%OPxMExRxCMExMMEx
Boron300.00035,350,0003,300,000,0003,170,0005,350,000
Colemanite290.000292,240,0002,000,000,0004,928,0007,268,000
Ulexite250.00025500,000450,000,000625,000725,000
Tincal260.000262,480,000825,000,0005,420,0008,007,154
Copper34.830.000341,038,0003,790,0001,231,3001,279,000
Table 6. Characterization factor that was obtained by ReCiPe method for the world (the year 2020) [32,33].
Mineral
Resource
World Reserve (Tons)
B2O3%OPxMExRxCMExMMEx
Boron550.0005512,481,3435,520,547,94518,618,97637,260,273
Colemanite 50.80.000503,000,0002,800,000,0009,865,00012,666,226
Ulexite430.000432,000,0001,600,000,0002,540,0002,900,000
Tincal360.000366,750,0001,990,000,00013,550,00018,145,000
Copper88.820.0008820,000,0008,750,000,00020,400,00025,000,000
Table 7. Characterization factor that was obtained by CML method (the year 2020).
Mineral ResourceADP (CML)
Before (the Year 1999, World)After (the Year 2020)
UltimateReserve BaseUltimate (World)Reserve Base (World)Ultimate (Turkey)Reserve Base (Turkey)
Antimony111111
Boron4.27 × 10−35.28 × 10−31.25964 × 10−51.52417 × 10−54.18337 × 10−65.06188 × 10⁻⁶
Colemanite--1.7681 × 10−51.4857 × 10−51.6875 × 10−61.41797 × 10−6
Ulexite--1.84364 × 10−52.2308 × 10−51.23457 × 10−51.49383 × 10−5
Tincal--4.94524 × 10−57.38734 × 10−52.04959 × 10−53.06173 × 10−5
Table 8. Characterization factor that was obtained by ReCiPe method (the year 2020).
Mineral ResourceASOPx (ReCiPe)
Before (the Year 2016)After (the Year 2020)
WorldTurkeyWorldTurkey
Copper4.36 × 1012-4.69517 × 10−64.38362 × 10−6
Boron1.16 × 10−1-1.85719 × 10−61.98182 × 10−7
Colemanite--5.00219 × 10−73.393 × 10−7
Ulexite--9.675 × 10−85.55556 × 10−8
Tincal--8.31256 × 10−78.15346 × 10−7
Table 9. Scenarios and characterization factors for each model.
SubstancesCharacterization Factors for CMLCharacterization Factors for ReCiPe
Scenario 1Boron4.27 × 10−31.16 × 10⁻¹
Scenario 2Boron4.27 × 10−31.16 × 10⁻¹
Tincal (Borax)4.27 × 10−31.16 × 10−1
Colemanite4.27 × 10−31.16 × 10⁻¹
Ulexite4.27 × 10−31.16 × 10⁻¹
Scenario 3Boron1.25964 × 10−51.85719 × 10⁻⁶
Tincal (Borax)4.94524 × 10−58.31256 × 10−7
Colemanite1.7681 × 10−55.00219 × 10⁻⁷
Ulexite1.84364 × 10−59.675 × 10⁻⁸
Table 10. Characterized value of the detergent expressed in kg antimony equivalents.
Impact CategoryUnitTotalEthanol, Without Water, in 99.7% Solution State, from Ethylene {RER}|Market for Ethanol, without Water, in 99.7% Solution State, from Ethylene|APOS, SGlycerine {RER}|Market for Glycerine|APOS, SBoric Acid, Anhydrous, Powder {GLO}|Market for|APOS, SSodium Borates {GLO}|Market for|APOS, STap Water {BR}|Market for Tap Water|APOS, S
1 Original ADPkg antimony equivalents0.0145340.0001880.0006370.0136996.84 × 10−63.03 × 10⁻⁶
2 ADP + Borax + Colemanite + Ulexitekg antimony equivalents0.3833580.0001880.0006380.3291470.0533823.04 × 10−6
3 ADP + Borax + Colemanite + Ulexite adaptedkg antimony equivalents0.0164610.0001880.0006370.0150070.0006263.03 × 10−6
Table 11. Characterized value of the detergent expressed in kg Cu equivalents.
Impact CategoryUnitTotalEthanol, without Water, in 99.7% Solution state, from Ethylene {RER}|Market for Ethanol, without Water, in 99.7% Solution State, from Ethylene|APOS, SGlycerine {RER}|Market for Glycerine|APOS, SBoric Acid, Anhydrous, Powder {GLO}|Market for|APOS, SSodium Borates {GLO}|Market for|APOS, STap Water {BR}|Market for Tap Water|APOS, S
1 ReCiPe originalkg Cu equivalents.1.32678420.0354320.119410081.1684710.0026390.000832471
2 ReCiPe + Borax + Colemanite + Ulexitekg Cu equivalents.11.3463510.0354410.11943279.7380051.452640.000832666
3 ReCiPe + Borax + Colemanite + Ulexite adaptedkg Cu equivalents.1.32683150.0354320.119410081.1685080.0026490.000832471
Publisher’s Note: MDPI stays neutral with regard to jurisdictional claims in published maps and institutional affiliations.

