Article

Order-Disorder in the Structures of Lithium Aluminosilicate Minerals by XRD and Multinuclear NMR

1
Museo Nacional de Ciencias Naturales (MNCN-CSIC), José Gutierrez Abascal 2, 28006 Madrid, Spain
2
Instituto de Ciencia de Materiales de Madrid (CSIC), 28049 Madrid, Spain
3
Centre National de la Recherche Scientifique (CNRS), UPR3079 CEMHTI, Université d’Orléans, 1D Av. Recherche Scientifique, CEDEX 2, 45071 Orléans, France
*
Author to whom correspondence should be addressed.
Minerals 2022, 12(4), 427; https://doi.org/10.3390/min12040427
Submission received: 14 February 2022 / Revised: 21 March 2022 / Accepted: 23 March 2022 / Published: 30 March 2022
(This article belongs to the Special Issue NMR Spectroscopy in Mineralogy and Crystal Structures)

Abstract

:
The crystal structures of the lithium aluminosilicate minerals of the Li2O–Al2O3–SiO2 (LAS) system (Li1−xAl1−xSi1+xO4 system for 0.0 ≤ x ≤ 1.0), and bikitaite were determined by X-ray diffraction (XRD) in literature, suggesting several possible lattice models for each of the crystallized phases, because of the intrinsic experimental difficulties of this technique. Here, we correlate powder XRD patterns with Rietveld refinement of cell parameters and magic angle sample spinning multinuclear magnetic resonance (NMR) spectra, including 29Si, 27Al, 7Li, and 6Li spectroscopy at 7.05 T, 9.4 T, and 20 T. The aim is to select appropriate lattice models from short-range order schemes in the lithium aluminosilicate phases, from natural minerals and synthetic crystals from the crystallization of amorphous gel precursors by a ceramic route and also by hydrothermal high-pressure experiments. Solid solutions were found in α-quartz and α-cristobalite up to x ≥ 0.75, and in β-eucryptite and β-spodumene for 0.0 ≤ x ≤ 1.0, when the ceramic synthesis is at work. The local structures of these intermediate members of the β-eucryptite and β-spodumene solid-solution series have 29Si NMR spectra consistent with the Loewenstein’s rule, i.e., they have short-range order but are strictly non-periodic structures. However, β-eucryptite LiAlSiO4 end-member has a short-range structure compatible with the long-range order of the P6422 symmetry, when the crystallization is produced at hydrothermal conditions. The local structure of α-spodumene LiAlSi2O6 is consistent with the C2/c model. α-eucryptite LiAlSiO4 shows a short-range structure as that suggested by the R-3 lattice model. Petalite LiAlSi4O10 has a local structure compatible with the P2/a space group. Finally, the 29Si NMR spectra of bikitaite LiAlSi2O6·H2O indicate a short-range structure well-suited with the P1 symmetry. These results are consistent with the Ostwald‘s rule of stages, forming a order-disorder sequence of increasing long-range order from the starting fully disordered solid gels, through crystalline pseudoperiodic structures in non-stoichiometric solid solution crystals that respect the Lowenstein’s rule, up to fully ordered crystals with short-range structures from NMR close to the long-range structures by XRD, as in the stoichiometric compounds found in some natural minerals.

1. Introduction

In addition to many technological applications in glass-ceramics of the Li2O–Al2O3–SiO2 (LAS) system [1], the research of the local structure of lithium aluminosilicate mineral phases is important to understand the behaviour of the solid state during the transformation of long-range disordered and mixed compounds into particular stoichiometric crystals with fully ordered structures at the local scale. The substitution of Si by Al is accompanied by the incorporation of Li ions for local compensation of the electrical charges as Si4+ = Al3+ + Li+, giving rise to solid-solution (s.s.) series, and Si/Al order-disorder series between the SiO2 and LiAlSiO4 end-members. The ordered structures with Al > Si seem to be forbidden by the Loewenstein’s rule (Al–O–Al avoidance) as they are unknown in nature and in the laboratory. The compounds of the LAS system to be studied in this work are: α-cristobalite s.s.; α-quartz s.s.; β-eucryptite s.s. series (SiO2-LiAlSiO4); β-spodumene s.s. series (SiO2-LiAlSiO4); α-spodumene LiAlSi2O6; petalite LiAlSi4O8; and α-eucryptite LiAlSiO4. Bikitaite LiAlSi2O6·H2O will also be studied. The determination of the crystal structures of these lithium aluminosilicate minerals by X-ray diffraction (XRD) is difficult because: (i) the low scattering factor of Li atoms due to few electrons; (ii) Al and Si atoms have similar X-ray scattering factors; and (iii) the averaged character of order-disorder states and solid solutions. Therefore, several lattice models for the Li–Al-rich phases exist in the literature (Table 1), and nuclear magnetic resonance (NMR) results will be useful to suggest appropriated crystal structures from the available lattice models.
The crystal structure of quartz SiO2 consists of a Q4 tectosilicate framework of six-membered rings of SiO4 tetrahedra, forming helical chains along the c axis. Two phases are known as α-quartz P3221 and β-quartz P6222 or P6422. Both crystal structures have a single site for Si atoms and also one site for O atoms, but the α-β transition at ~573 °C is a very complex phenomenon with the formation of an incommensurated structure formed by α1 and α2 twin domains [2,3,4,5]. Considering the short characteristic time of NMR, which leads to average spectra as soon as frequency of movements are in the kHz range, the β-phase can be described as a dynamic average in time of triangular α1 and α2 twin domains of the α-phase on a unit cell scale, and the mechanism of the α-β transition is related to the fluctuations of the tetrahedra between these orientations [6,7]. The substitution of Si by Al + Li in natural quartz only occurs at a maximum level of hundreds of ppm. At the local scale, medium-range order occurs from local compensation of charges forming [AlO4/Li+]0 groups, but prolonged heating at high temperatures destroys these centers to produce [AlO4]0 defects, which are responsible for the high thermoluminescence at 380 nm [8,9]. Here, we show the chemical range in the LAS system that shows α-quartz at room temperature, and the effect of Li + Al ↔ Si substitution on the α/β transition temperature, from synthetic crystals.
The β-quartz s.s. series, also known as the β-eucryptite s.s. series or the stuffed derivatives of quartz, with the general formula Li1−xAl1−xSi1+xO4 (0 ≤ x ≤ 1), have crystal structures derived from the β-quartz SiO2 structure. It consists of a tectosilicate framework formed by six-membered rings of TO4 tetrahedra with Si and Al atoms, in a Q4n (4-nSi,nAl) Si/Al distribution, forming additional cationic sites for Li atoms at different levels in the helical channels along the c axis. Thus, Si/Al order-disorder series coexists with Si-Al + Li s.s. series. Four lattice models exist in the literature to describe the β-eucryptite structure with a LiAlSiO4 end-member composition, having a different number of atomic positions as crystallographically-distinct sites in the groups P6222 and P6422 [10,11,12,13]. Thus, the crystal structure of β-LiAlSiO4 is still up for debate. The intermediate compositions of the system are particularly complex for diffraction studies, and a Si/Al order-disorder transition at x = ~0.3 and α-β displacive transformation at x = ~0.65 have been suggested from a synchrotron XRD study [14,15]. Vibrational spectroscopy indicates Li+ positional disorder along the structural channels parallel to the c axis, inducing a framework distortion on heating [16]. In addition, NMR spectroscopy experiments on these intermediate phases have shown one site for Si atoms and two sites for Al atoms in the tetrahedral framework, and also a fast order-disorder phenomenon for each composition crystallized from a glass, based on the respect of Loewenstein’s rule for Al–O–Al avoidance [17]. However, the details of the local structure of fully ordered β-eucryptite with LiAlSiO4 composition and its relationships with that of β-quartz are still not well resolved, because the available studies used samples having only a Loewenstein order-disorder state. In addition, the local Si/Al order-disorder states at intermediate compositions of the solid solution, for instance in virgilite LiAlSi2O6 with P6222 or P6422 average symmetry from XRD [18,19], are still unknown.
The crystal structures of the β-spodumene s.s. series, having the same general formula Li1−xAl1−xSi1+xO4 (0 ≤ x ≤ 1) as in the previous structures, are thought to be stuffed derivatives of the keatite SiO2 structure, consisting of a Q4 tectosilicate framework formed by five-membered rings of SiO4 tetrahedra and tetragonal P41212 or P43212 average symmetry, with two tetrahedral sites for Si atoms [20,21]. Lattice models from XRD of the β-spodumene were obtained for LiAlSi2O6, involving Si and Al atoms in the two tetrahedral sites, and one additional tetrahedral site for Li atoms with P43212 average symmetry [22,23,24,25]. The 29Si spectrum of β-spodumene with LiAlSi2O6 composition consists of five lines of Q4n (4-nSi,nAl) spectrum for each of the two T sites nearly overlapping from a small relative displacement, and a broad asymmetric 27Al spectrum [26]. However, the details about of the Si/Al order-disorder states in the β-spodumene solid solution series are still unknown.
The α-spodumene LiAlSi2O6 polymorph was described using a lattice model with C2/c average symmetry as a Q2 pyroxene structure [34]. The lattice model of α-spodumene consists of chains of TO4 tetrahedra occupied by Si atoms giving rise to layers of octahedral M1 sites for Al, and an irregular polyhedron M2 site formed by six oxygen atoms for the coordination of Li atoms. This model is compatible with other C2/c pyroxenes with the M2 site occupied by large Ca and Na atoms, like for instance in diopside CaMgSi2O6. However, it has been suggested that the small size of the Li+ cation is mainly responsible for the degradation of symmetry from C2/c to C2 [35]. In the C2/c model, only one site exists for each cation, whereas the C2 model suggests two tetrahedral sites for Si atoms, two octahedral M1 sites for Al atoms, and a single M2 site for six coordinated Li atoms [35,36]. An additional high-pressure P21/c structure is formed at 3.19 GPa [42,43], which has not been studied here. A limited number of NMR experiments are available in the literature for these crystal structures. Single crystal NMR of α-spodumene has shown a single octahedral site with CQ = 2.95 MHz and η = 0.94 for Al atoms [44], and a 27Al MAS NMR spectrum shows a maximum at −1.9 ppm using a powdered sample [45]. More recent results found a single sharp line around 91 ppm in 29Si NMR, indicating a single site for Si atoms [26]. These previous results support the C2/c model. Note that this high-pressure phase, with a chain-structured phase, is structurally unrelated to the open framework Q4 structures formed at 1 atm of the LAS system.
The crystal structure of petalite LiAlSi4O10 is described from diffraction methods as a Q4 tectosilicate with five-membered rings of TO4 tetrahedra occupied by Si, Al, and Li atoms. Two monoclinic models are available in the literature for this mineral, involving P2/a symmetry [30,46,47,48,49] and Pa symmetry [31]. Both structural models indicate one tetrahedral site for Al atoms and also one tetrahedral site for Li atoms. However, the model with P2/a symmetry has two tetrahedral sites for Si atoms, whereas the Pa symmetry consists of four tetrahedral sites for Si atoms. The model with P2/a symmetry has 180° Si–O–Si bonds, which are difficult to justify from an aprioristic energetic point of view. Thus, these bonds were removed in the Pa symmetry model [31]. No detailed NMR data of this mineral phase are available in the literature, to aid in discriminating the correct lattice model from short-range order atomic schemes.
The crystal structure of α-eucryptite has a phenakite structure with R-3 space group, but two structural models were proposed, one with two equal tetrahedral sites for Si and Al atoms and one tetrahedral site for Li atoms [32], and the other with two different tetrahedral sites for Si, Al, and Li atoms [33].
Two lattice models exist in the literature for bikitaite LiAlSi2O6·H2O, with a zeolite Q4 framework structure having molecular water. A model with a disordered Si/Al distribution and average P21 symmetry was suggested for a specimen from Bikita, Zimbabwe [40,41]. It consists of three tetrahedral sites with Si atoms in the site T2, and Si + Al atoms in the T1 and T3 sites, and with the Li atoms coordinated by three oxygen atoms and a water molecule. Alternatively, another model is available in the literature with an ordered Si/Al distribution and P1 space group in a specimen from North Carolina, USA [37,38]. It suggests four tetrahedral sites for Si atoms, two tetrahedral sites for Al atoms, and two sites for Li atoms coordinated by three oxygen atoms, and a water molecule is also resolved. However, additional works by XRD have shown that the two types of specimens could have the same lattice model consistent with P1 symmetry [39].
In this paper, we address the characterization of lithium aluminosilicate minerals by multinuclear NMR spectroscopy at 7.05 T, 9.4 T, and 20 T, as well as the determination of unit-cell parameters using Rietveld refinement from powder XRD patterns. The aim is to investigate the local structures and the state of order in solids of the LAS system, in order to compare the lattice models and average structures suggested by reciprocal-space techniques (i.e., long-range order) with the data of the local structure from NMR techniques and DFT calculations (i.e., short-range order). The materials used for the study are: (i) minerals collected at geological sites and from museum collections including α-spodumene, petalite, α-eucryptite and bikitaite; (ii) synthetic materials for the ceramic phases, i.e., β-eucryptite and β-spodumene, produced after heating of precursor gels in the laboratory at 1 atm.; and (iii) hydrothermal synthesis of an ordered β-eucryptite at high temperature and pressure. We show that long-range disordered Q4 structures, with intermediate chemical compositions between the SiO2 and LiAlSiO4 end members (mixed crystals) are formed in the laboratory time scale from gels, as in β-eucryptite solid solution series and β-spodumene solid solution series. These structures in solid solutions consist of pseudo-periodic frameworks that respect the Al–O–Al avoidance Loewenstein’s rule. However, in nature we find minerals with fully ordered structures formed at the geological time scale having periodic structures with defined stoichiometric compositions, as in α-eucryptite, α-spodumene, petalite, and bikitaite. This sequence is consistent with an Ostwald rule of stages developed at the geological time scale.

2. Materials and Methods

2.1. Natural Specimens and Synthetic Samples

Nine specimens of α-spodumene LiAlSi2O6 from different geological environments were studied by powder XRD and electron microprobe analysis (EMPA) to know if any variability exists in the specimens. All of them were almost identical in terms of composition and powder diffraction patterns, corresponding in all cases to file 33-0786 in the PDF-2-2004 database from ICDD (International Centre for Diffraction Data, 12 Campus Blvd, Newtown Square, PA 19073, (USA) and CC 9668 in the CC 9668 in the ICSD database (Inorganic Crystal Structure Database) (Figure A1). Specimen Golconda was selected as it is a fully transparent and colorless single-crystal of spodumene without a fibrous habit from a gemmy pocket of the Golconda pegmatite, Governador Valadares, Minas Gerais (Brazil). EMPA determinations of the Si and Al contents show a chemical composition very close to the stoichiometric formula. Single-crystal XRD patterns have shown C2/c symmetry for the specimen, without any signature of a lower symmetry from additional or forbidden diffractions.
Two petalite LiAlSi4O10 specimens were studied by XRD and EMPA, showing a small difference in crystallinity from the resolution of the low intensity diffraction peaks. The multinuclear NMR results were, however, very similar and thus the results of only one specimen will be presented here, by using specimen Brazil. It matches very well with file 35-0463 in the PDF-2-2004 database and CC 100348 in the ICSD database (Figure A2). It is a fully transparent and colorless single-crystal, with a chemical composition very close to the stoichiometric formula from the Si and Al contents derived from EMPA analyses.
The α-eucryptite LiAlSiO4 phase was studied by using a specimen from the Bikita pegmatite (Zimbabwe), a famous Li-rich granitic pegmatite for the production of lithium raw materials [50]. Specimen Bikita is an intergrowth of quartz, α-eucryptite, and bikitaite LiAlSi2O6·H2O. α-eucryptite corresponds with file 89-8593 in the PDF-2-2004 database and CC 30983 in the ICDS database, and bikitaite with CC 68586 in the ICSD database (Figure A3). Backscattered electron diffraction images have shown that bikitaite is formed at the interface between the two previous minerals because of the effect of hydrothermal fluids running along the interfaces.
The Li–Al stuffed derivatives of quartz and keatite polymorphs of silica SiO2, i.e., the β-spodumene solid solution series and the β-eucryptite solid solution series as ceramic phases, were synthesized by using the Hamilton and Henderson’s gelling methods [51]. Li, Al, and Si were introduced into the gel from precursor of powdered compounds, using LiCO3 for Li, tetraethoxysilane (TEOS) for Si, and Al(NO3)3·9H2O for Al. Aluminum and lithium were introduced in stoichiometric proportions to maintain the local compensation of electrical charges for the different bulk compositions between SiO2 and LiAlSiO4. Fifteen compositions between SiO2 and LiAlSiO4 end-members were prepared. Crystallization of the amorphous gels was performed at room pressure by heating the gels at 675 °C, 850 °C, 1000 °C, and 1200 °C in a furnace, for 100 h, which is the time necessary for the crystallization of the gels with low Li + Al content. This thermal treatment is equivalent to that produced for the crystallization of glasses in literature, for instance, 850–1200 °C for times ranging from 1 to 70.5 h [52]. Figure 1 exhibits the chemical compositions used and synthesis temperatures (x axis), showing the experiments with samples having almost a pure single phase mineral composition that were used for the NMR experiments, in a modern calculated phase diagram of the LAS system from thermodynamic models [52]. Table 2 shows the chemical compositions and crystalline phases produced by the thermal treatments (y axis in Figure 1). The crystallization of a single-phase was rarely obtained, and most experiments, at low temperature and high silica compositions, involve the coexistence of amorphous material. At high temperatures, cristobalite, tridymite, β-eucryptite, β-spodumene were formed, as well as σ-Al2O3 in the Li0.89Al0.89Si1.11O4 and LiAlSiO4 gels, because of the loss of lithium atoms at 1200 °C. α-quartz was distinguished from β-quartz (i.e., β-eucryptite) by the line positions and intensities of the (102) and (111) diffractions (Figure A4, Figure A5 and Figure A6). The crystallization of the stoichiometric LiAlSiO4 β-eucryptite was performed at hydrothermal conditions at 1000 °C and 3 kbars for 48 h, with a previous transformation of the gel into a H2O-oversaturated melt at 1300 °C as precursor of the crystallization, in the Institute des Sciences de la Terre d’ Orléans (ISTO CNRS, Orléans (France), with the help of François Delbove. Single phase synthetic compounds with a β-eucryptite structure give powder XRD patterns close to files 45-0466 and 25-1183 of the PDF-2-2004 database; whereas those with a β-spodumene structure (Figure A7) correspond to file 35-0797 for Si/Al = 2/1, file 35-07974 for Si/Al = 3/1, and file 21-0503 for Si/Al = 4/1 and 5/1, of the PDF-2-2004 database.

2.2. Methods

2.2.1. Powder X-ray Diffraction (XRD)

The ceramic samples and the natural and synthetic minerals were studied by powder XRD patterns using a Bruker D8 Advance instrument from Instituto de Ciencia de Materiales de Madrid (ICMM-CSIC, Madrid, Spain) with CuKα1 radiation at 30 kV and 25 mA (Appendix A). Unit cell parameters were obtained by Rietveld refinement from the whole-pattern decomposition or profile-matching method using BRUKER-AXS TOPAS v6 (2016) using Diffrac.Eva 5.1 (2019) from BRUKER AXS, Karlsruhe (Germany) (Appendix B, Table A1, Table A2, Table A3, Table A4, Table A5, Table A6, Table A7 and Table A8 and Figure A9). This procedure was also used to quantify the main mineral phases (Table 2) produced by the thermal treatments of the precursor gel powders (two examples are shown in Figure A10 and Figure A11), and also in the mixture of quartz, bikitaite, and α-eucryptite in specimen Bikita.

2.2.2. Differential Thermal Analyses (DTA-TG)

Simultaneous differential thermal analyses (DTA) and thermogravimetric (TG) analyses were performed using a Netzsch, STA 409 model, by Esperanza Menéndez Méndez from Instituto de Ciencias de la Construcción Eduardo Torroja (IETcc-CSIC) in Madrid, Spain. The experimental conditions were 50 mg of sample, at a heating rate of 5 K/min, heating temperature to 973 K, platinum crucible, air static atmosphere, and using corundum Al2O3 as reference. This experimental procedure was used to detect the temperature Th of the α β transition on heating and the temperature Tc of the β α transition on cooling, in the Li–Al rich synthetic quartz samples, in comparison with synthetic pure quartz SiO2.

2.2.3. Nuclear Magnetic Resonance (NMR)

High resolution 29Si, 27Al, 7Li, and 6Li magic angle spinning (MAS) NMR spectra were recorded at 79.49, 104.26, 155.51, and 58.88 MHz (9.4 T magnetic field), by spinning the sample at the magic angle (54°44′′) in a Bruker AVANCE-400 spectrometer equipped with a Fourier transform unit of the Instituto de Ciencia de Materiales de Madrid (CSIC) in Madrid (Spain). The samples were spun in the range of 4 to 10 kHz. Pulses of π/2 to π/6 (4–4.5 to 1.5 μs) for 29Si, pulses of π/2 (5.5 μs) for 6Li, and pulses of π/8 (2 and 0.3 μs) for 27Al and 7Li were used. Recycle delays between 60 and 400 s for 6Li and between 60 and 28,800 s for 29Si were used to avoid saturation effects. Tetramethylsilane, Al(H2O)63+, and LiCl were used as external references at room temperature. The mean error in the measured chemical shift of 29Si and 27Al NMR components was 1 ppm. The number of accumulations ranged between 8 and 240 depending on the sample and nucleus. The 29Si signals (I = 1/2) were analyzed by comparison of experimental curves with simulated profiles using Gaussian–Lorentzian components for the different crystallographic sites in distinct crystallochemical environments and variable intensities related to the Si/Al occupation of the T sites. A similar procedure was used for the deconvolution of 7Li and 6Li spectra. 27Al spectra were fitted by using DM2015 [53] (version dmfit2015, by Dominique Massiot, CEMHTI—CNRS at Orléans (France) to calculate the quadrupolar constants CQ, the asymmetry factor η, and the linewidth of each component. When the second-order quadrupolar effects were visible in the central transition, the chemical shift and the quadrupolar constant were determined from the fitting of the line profile.
The 29Si/27Al double-resonance MAS NMR experiments on petalite were performed at 20.0 T in the laboratory of Conditions Extrêmes et Materiaux: Haute Température et Irradiation CEMHTI—CNRS at Orléans in France, using a Bruker Avance III spectrometer. Samples were packed in 3.2 mm diameter zirconia rotors spun at a spinning speed at 20 kHz. 29Si{27Al} cross-polarization experiments were done using a contact time of 5 ms with 29Si radio frequency field at 13 kHz and 27Al at 5 kHz, whereas 27Al direct excitation was performed using a radio-frequency field of 11.5 kHz, a selective pulse of 7.5 µs, and a DFS saturation of the external transitions: a total of 2000 transients were accumulated with a 30 s recycle delay. The direct excitation of 29Si was performed at 20.0 T with a radio-frequency field of 25 kHz, a pulse flip angle of 10°, a recycle delay of 120 s, and 32 scans. At 7.0 T with a radio-frequency field of 50 kHz, a pulse flip angle of 10°, a recycle delay of 45 s, and 1920 scans, by using a 4 mm diameter zirconia rotor spinning at 14 kHz, was used.

2.2.4. Density Functional Theory (DFT)

Calculations concerning atoms sites or polyhedral distortions were carried out using the CASTEP Density Functional Theory (DFT) code, which employs the gauge including projector augmented wave (GIPAW) algorithm, enabling the reconstruction of the all-electron wave function in the presence of a magnetic field. The Generalized Gradient Approximation (GGA) PBE functional was used and the core-valence interactions were described by ultrasoft pseudopotentials. Geometry optimization was performed allowing the atomic coordinates and unit cell parameters to be varied. Wavefunctions were expanded in planewaves with kinetic energy below the cut-off energy 800 eV and integrals over the Brillouin zone were performed using a Monkhorst–Pack grid with a k-point spacing of 0.07 Å−1. Optimizations were pursued until energy difference, maximum atomic force, maximum atomic displacement, and maximum stress tensor components fell below tolerances of 5 × 10⁻⁶ eV/atom, 1 × 10⁻² eV/Å, 5 × 10⁻⁴ Å, and 2 × 10⁻² GPa, respectively. For NMR parameter calculations, a cut-off energy of 1200 eV and a Monhorst-Pack grid with a k-point spacing of 0.04 Å−1 were used. The absolute shielding tensors, R, in the crystal frame were also generated. The isotropic shielding, σiso, is (1/3) Tr{R}. To correlate the calculated isotropic shielding to the isotropic chemical shift, the formula δiso = −σiso + σref was used, with σref = 324 for 29Si, σref = 89.3 for 7Li, and σref = 556 for 27Al. The values for the CQ and ηQ were obtained from the electric field gradient tensor. Published lattice models for α-spodumene [34], α-eucryptite [32,33], β-eucryptite [12], and petalite [54] were used as starting models for NMR calculations. Those models were geometry optimized and NMR parameters were calculated.

3. Results

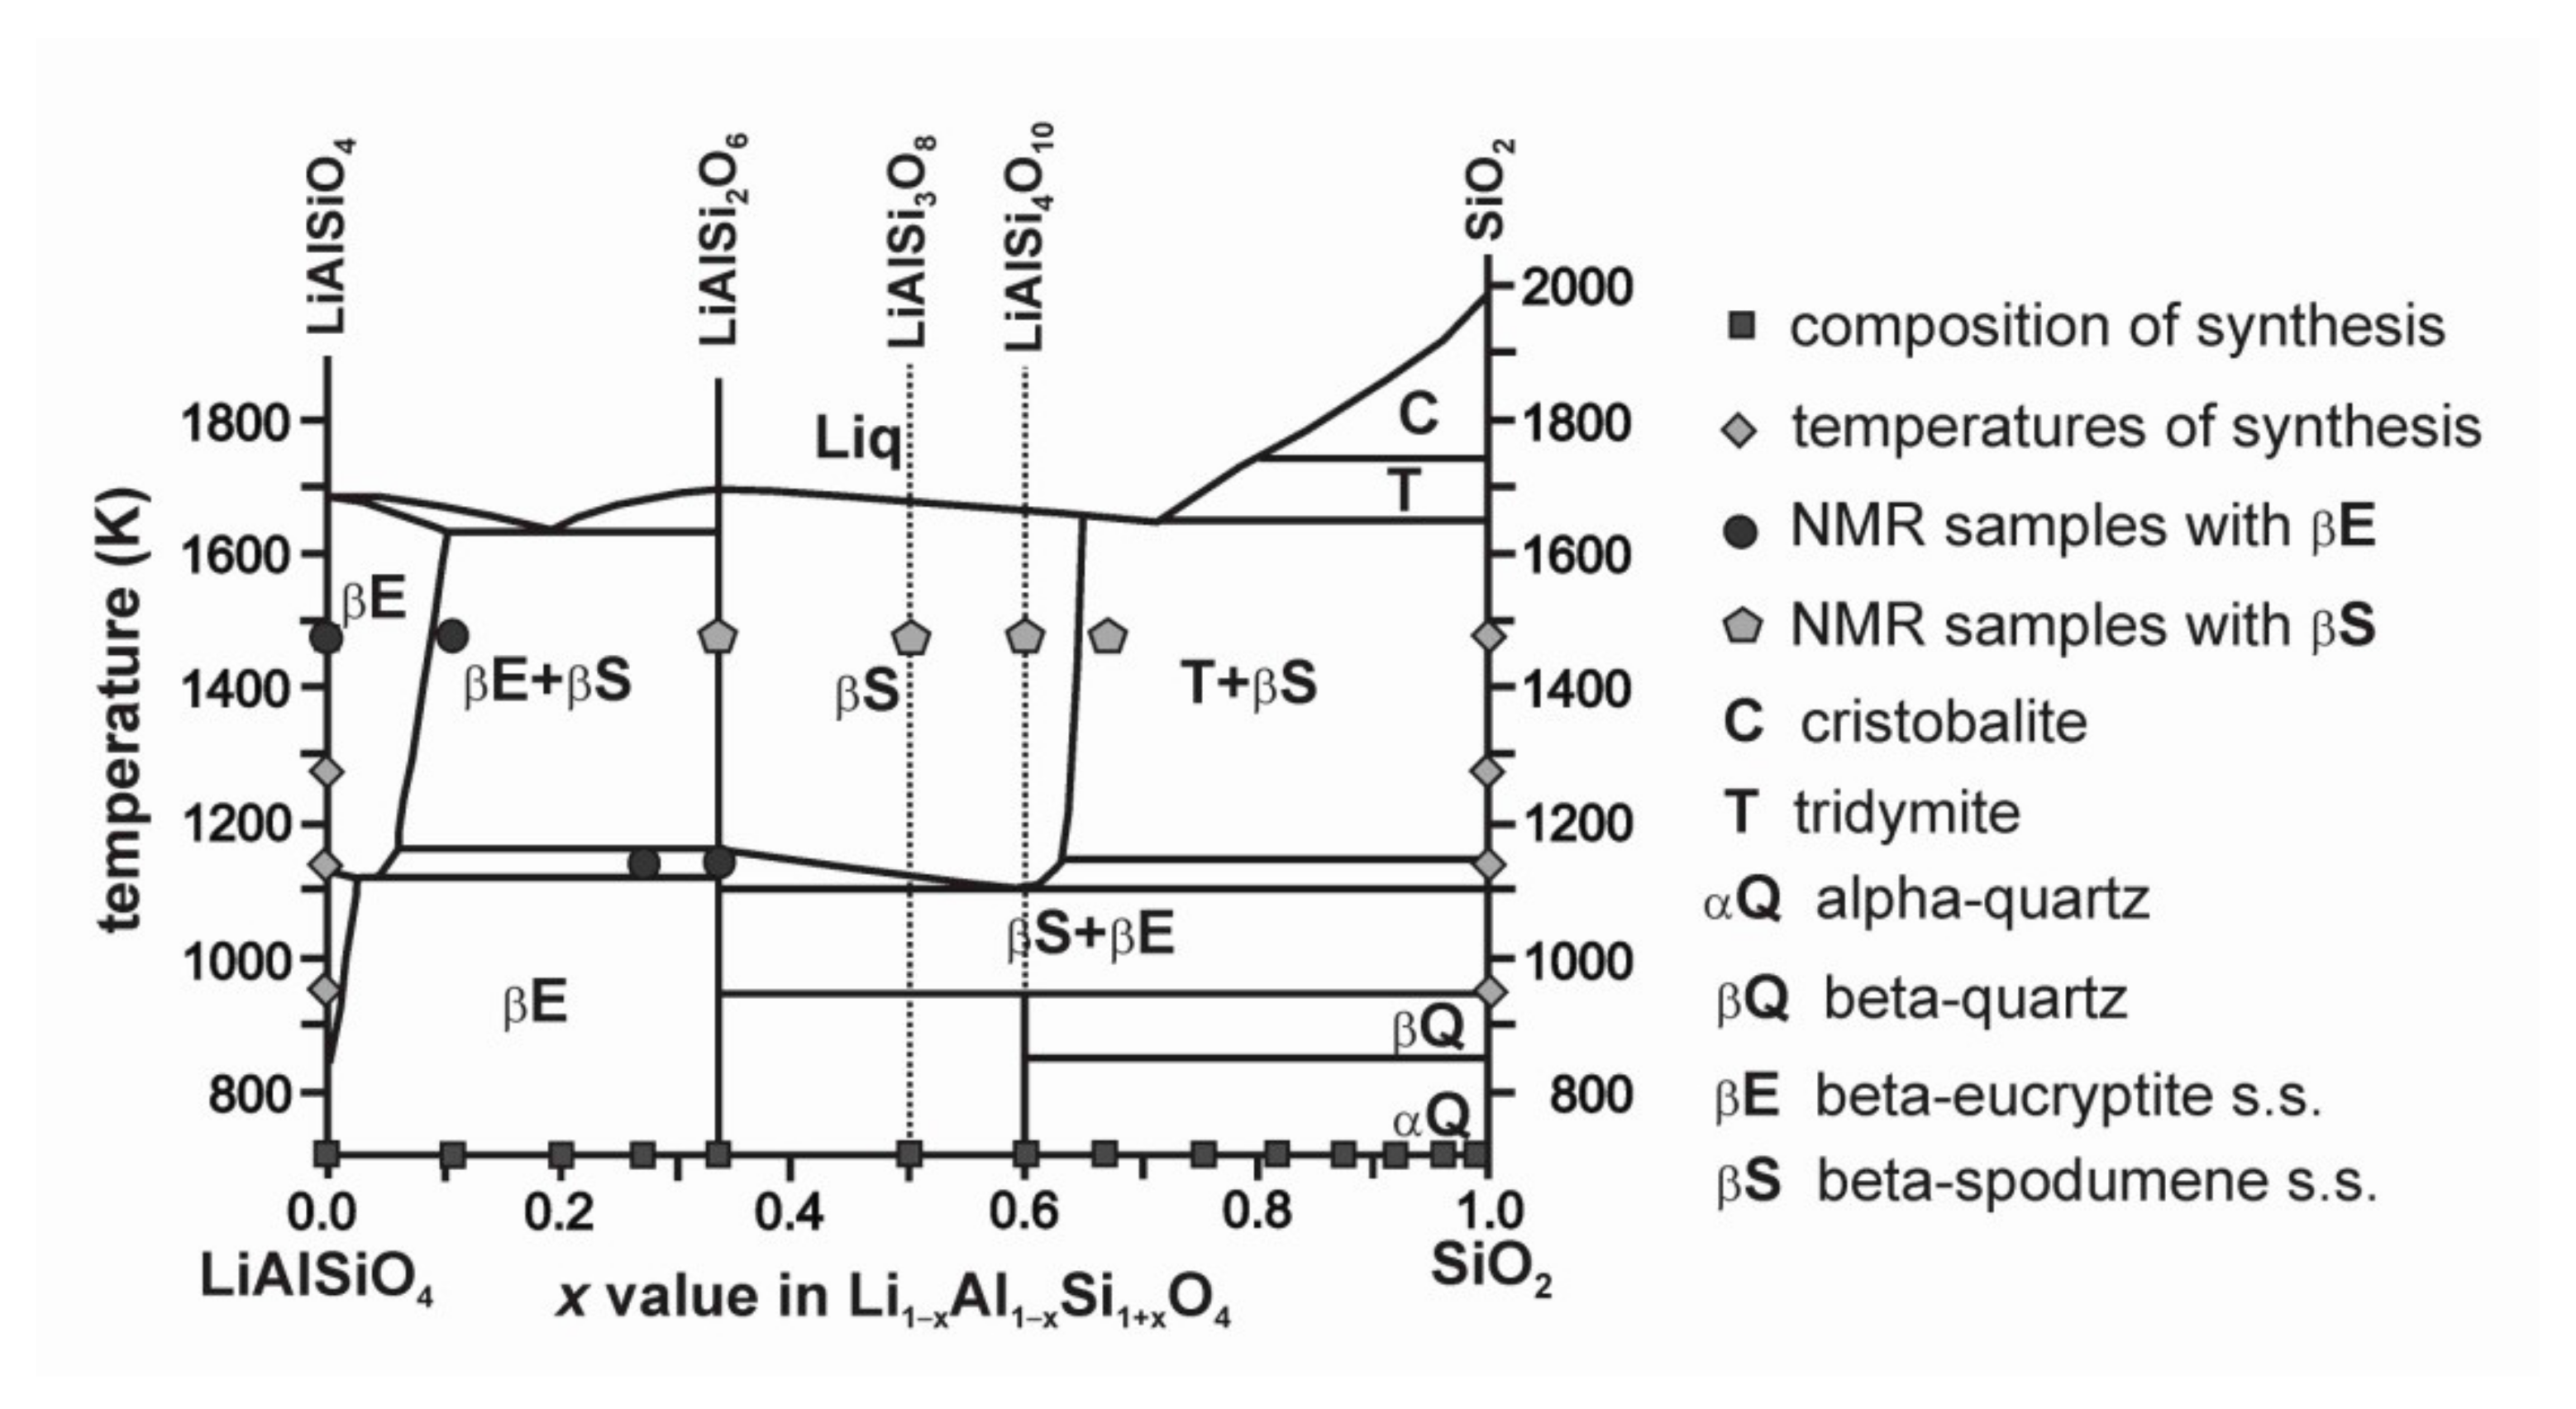
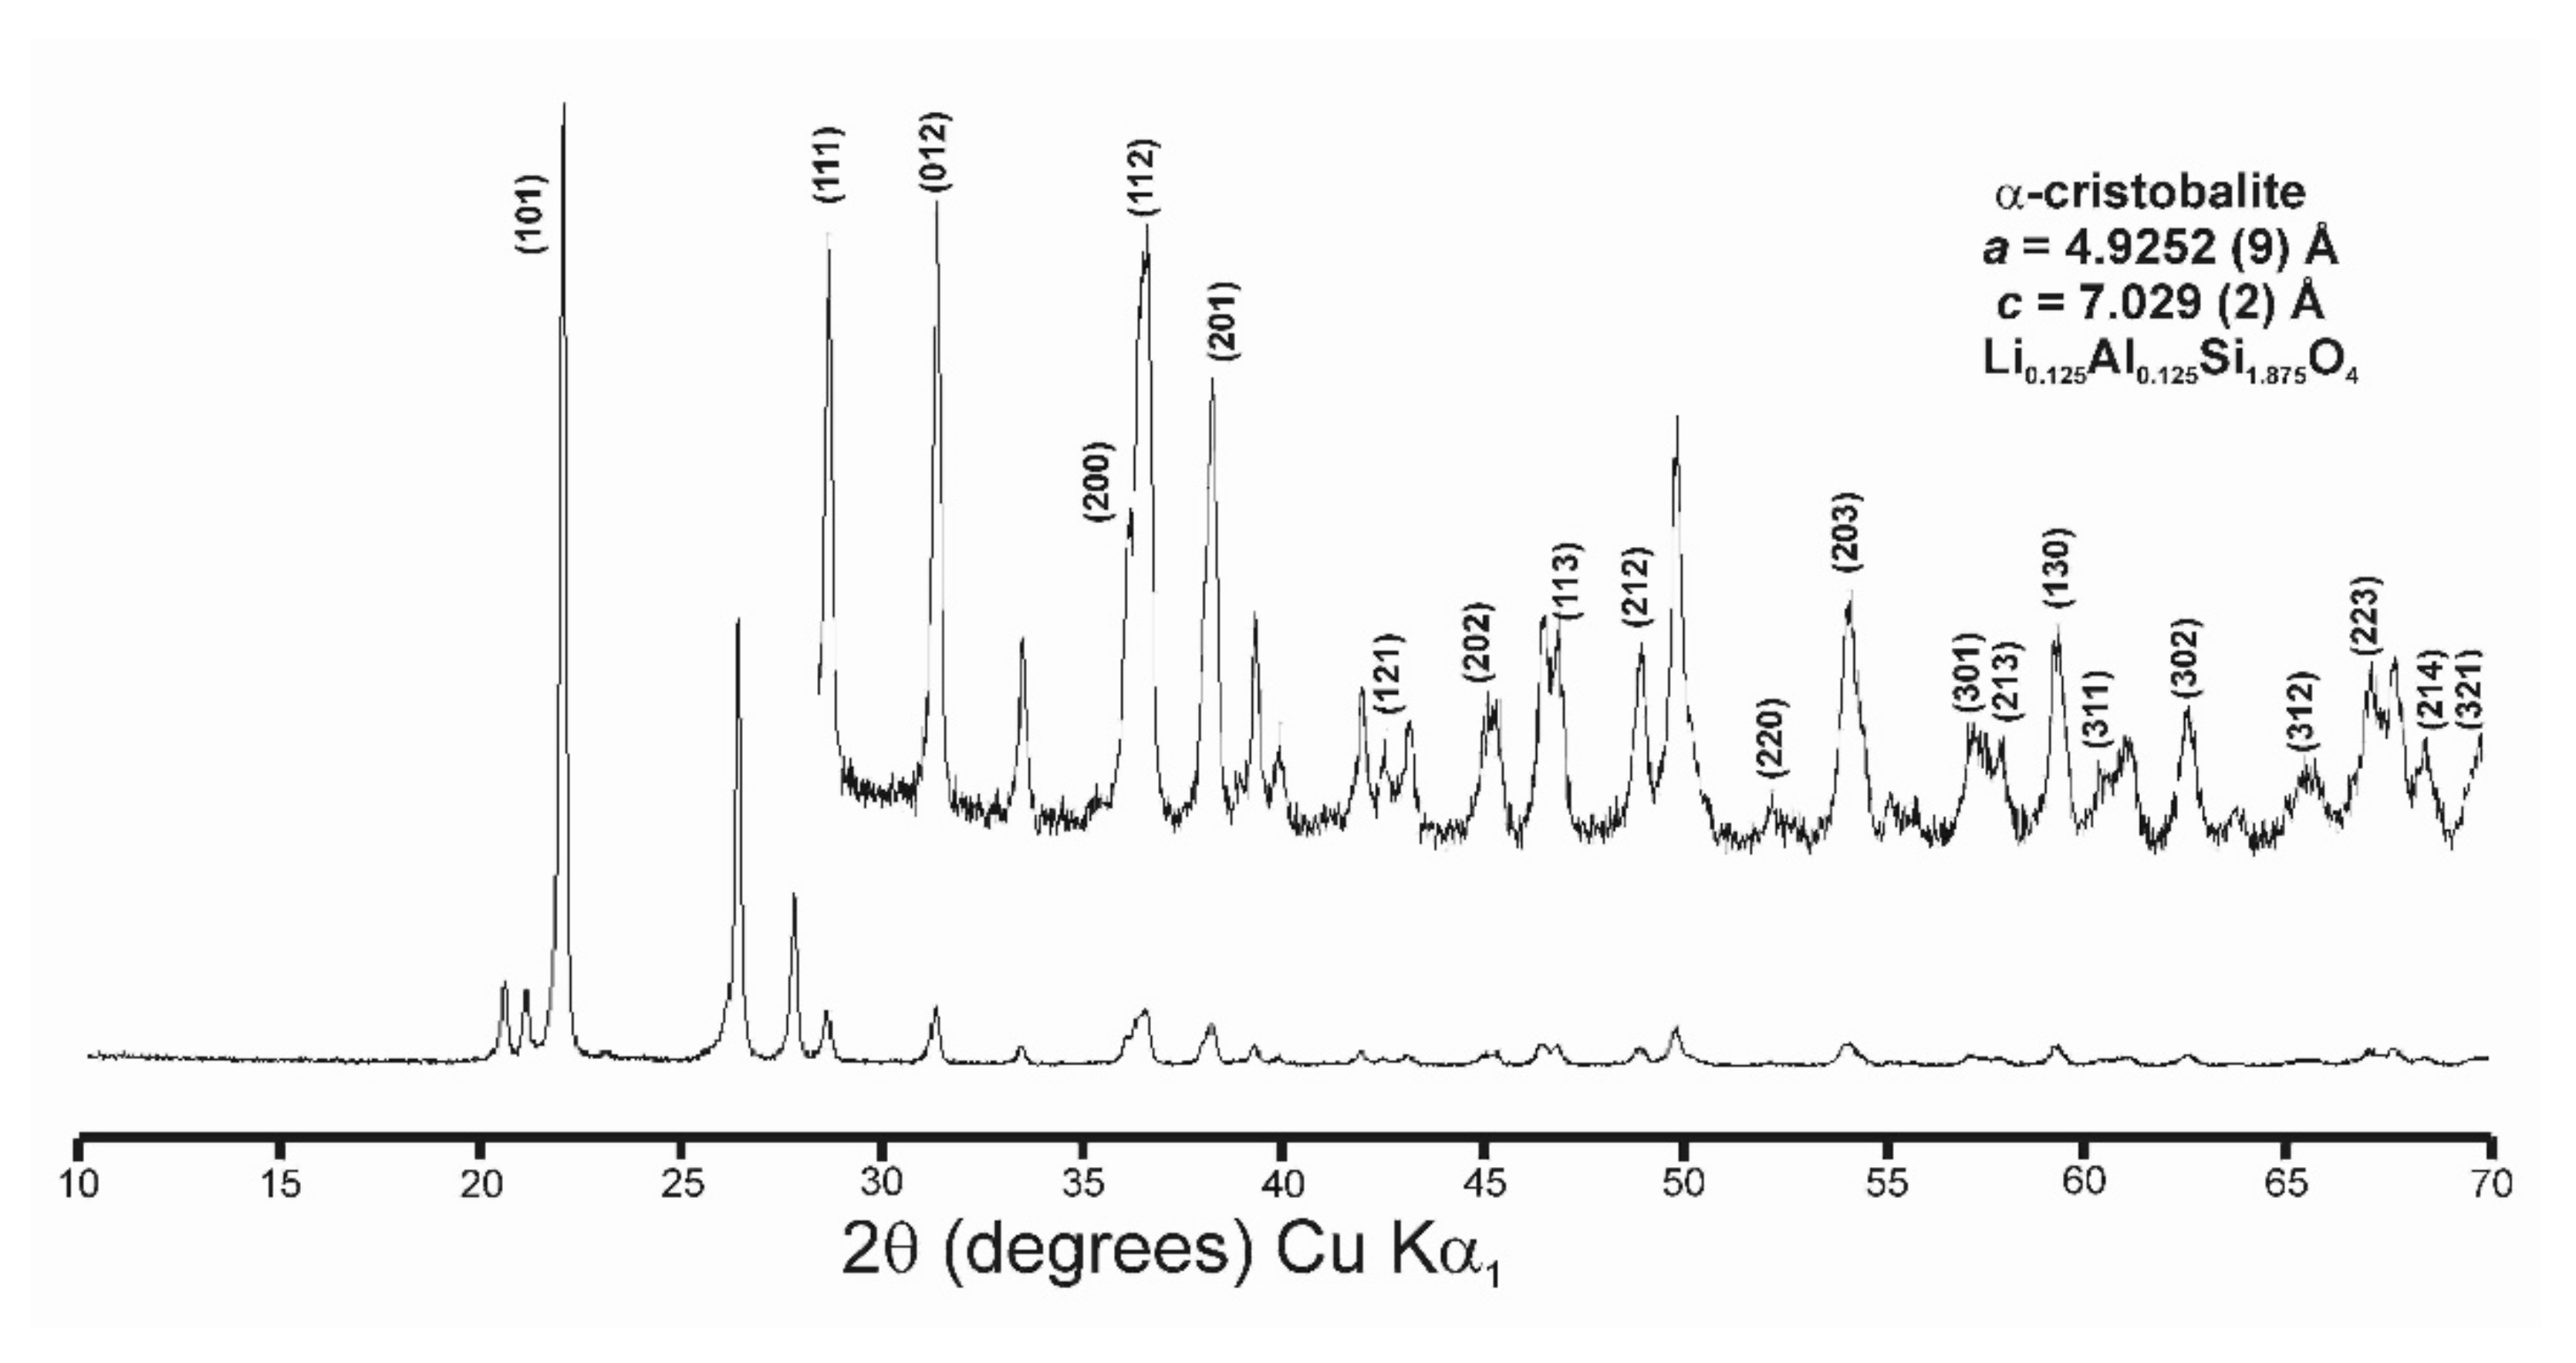
3.1. α-β Cristobalite s.s. in Li1−xAl1−xSi1+xO4 for 1.0 ≤ x ≤ 0.75

At room temperature, low-cristobalite SiO2 with space group P41212 was found after the ceramic crystallizations for x = 1.00 at 1200 °C. The Rietveld refinement of the cell parameters of this synthetic α-cristobalite SiO2, a = 4.9702 (5) Å and c = 6.9243 (9) Å, was very similar to pure SiO2 cristobalite in file CC 75300 of the ICSD database. However, a α-cristobalite s.s. was found, at least, for 1.00 ≥ x ≥ 0.75. For x = 0.875 (Figure A8), lithium-aluminum-rich compositions showed 62.5% of cristobalite at 1200 °C, and the unit-cell refinement produced a = 4.9252 (9) Å and c = 7.029 (2) Å, indicating a substantial incorporation of Li + Al atoms in the substitution of Si atoms in the β-cristobalite structure, when crystallized at high temperatures with the cubic symmetry. The Si → Li + Al substitution produced a change in the cell parameters of the α-phase when recorded by XRD at room temperature, in comparison with α-cristobalite SiO2 end-member.

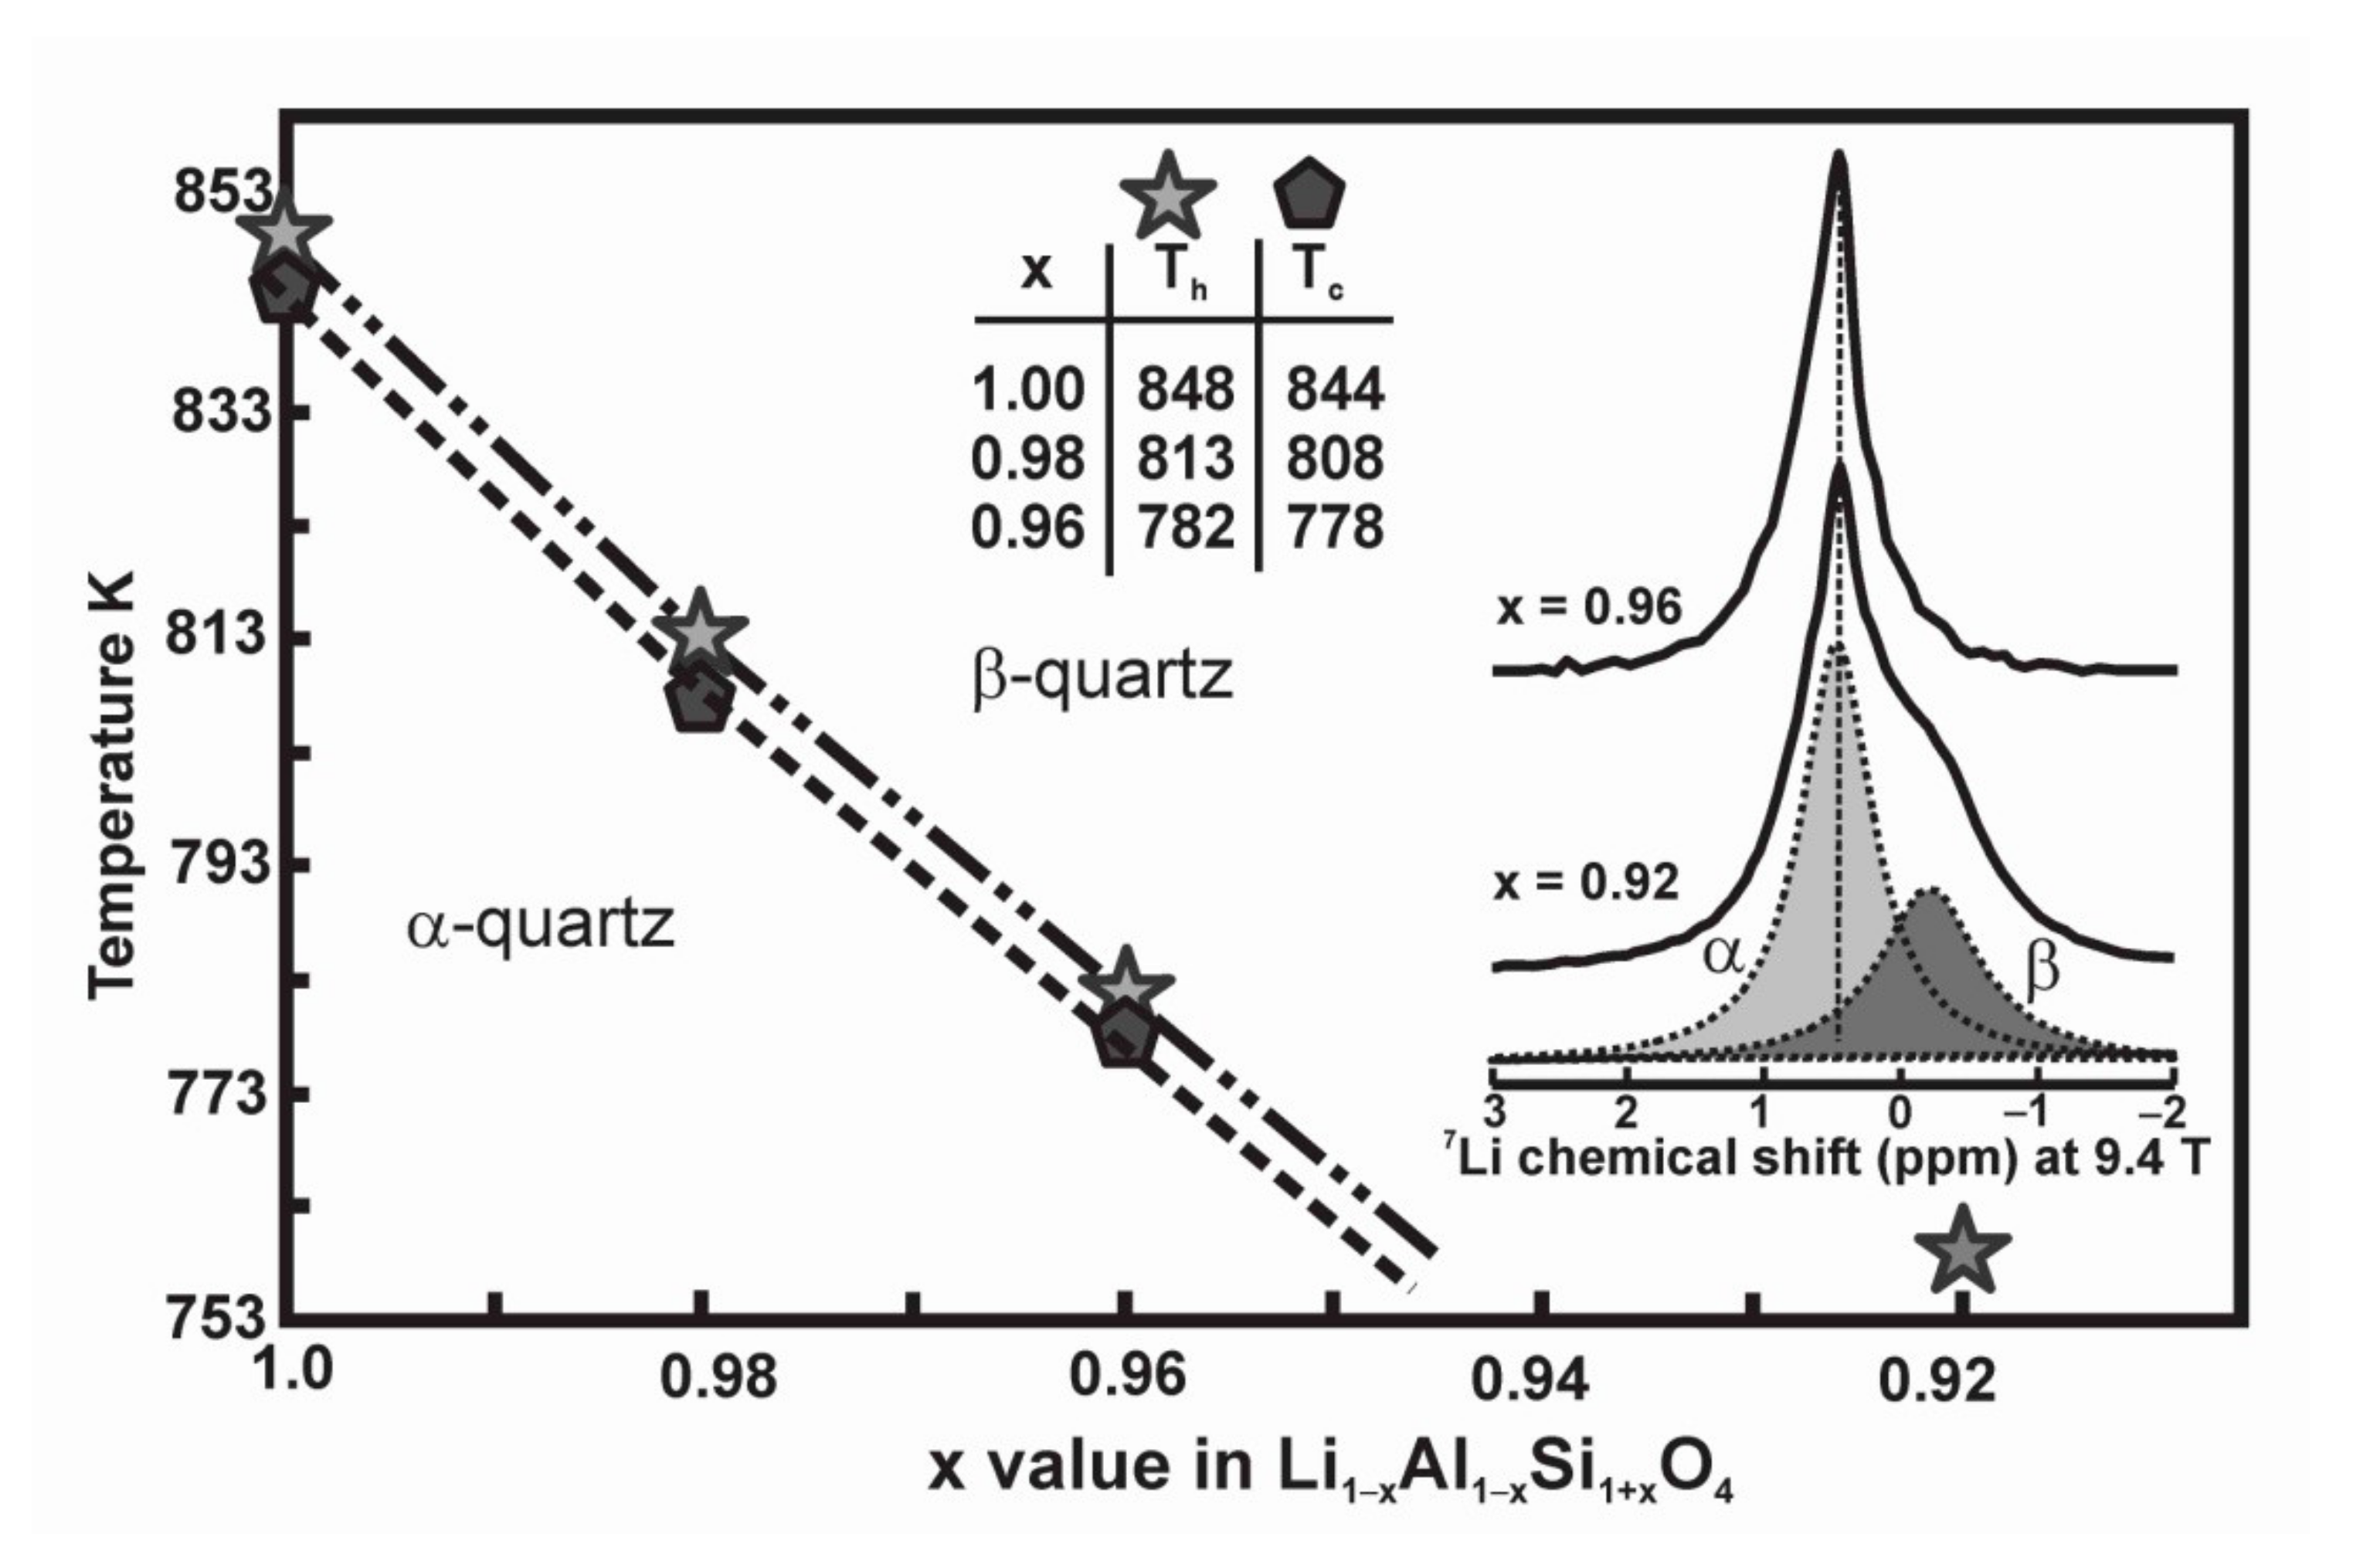
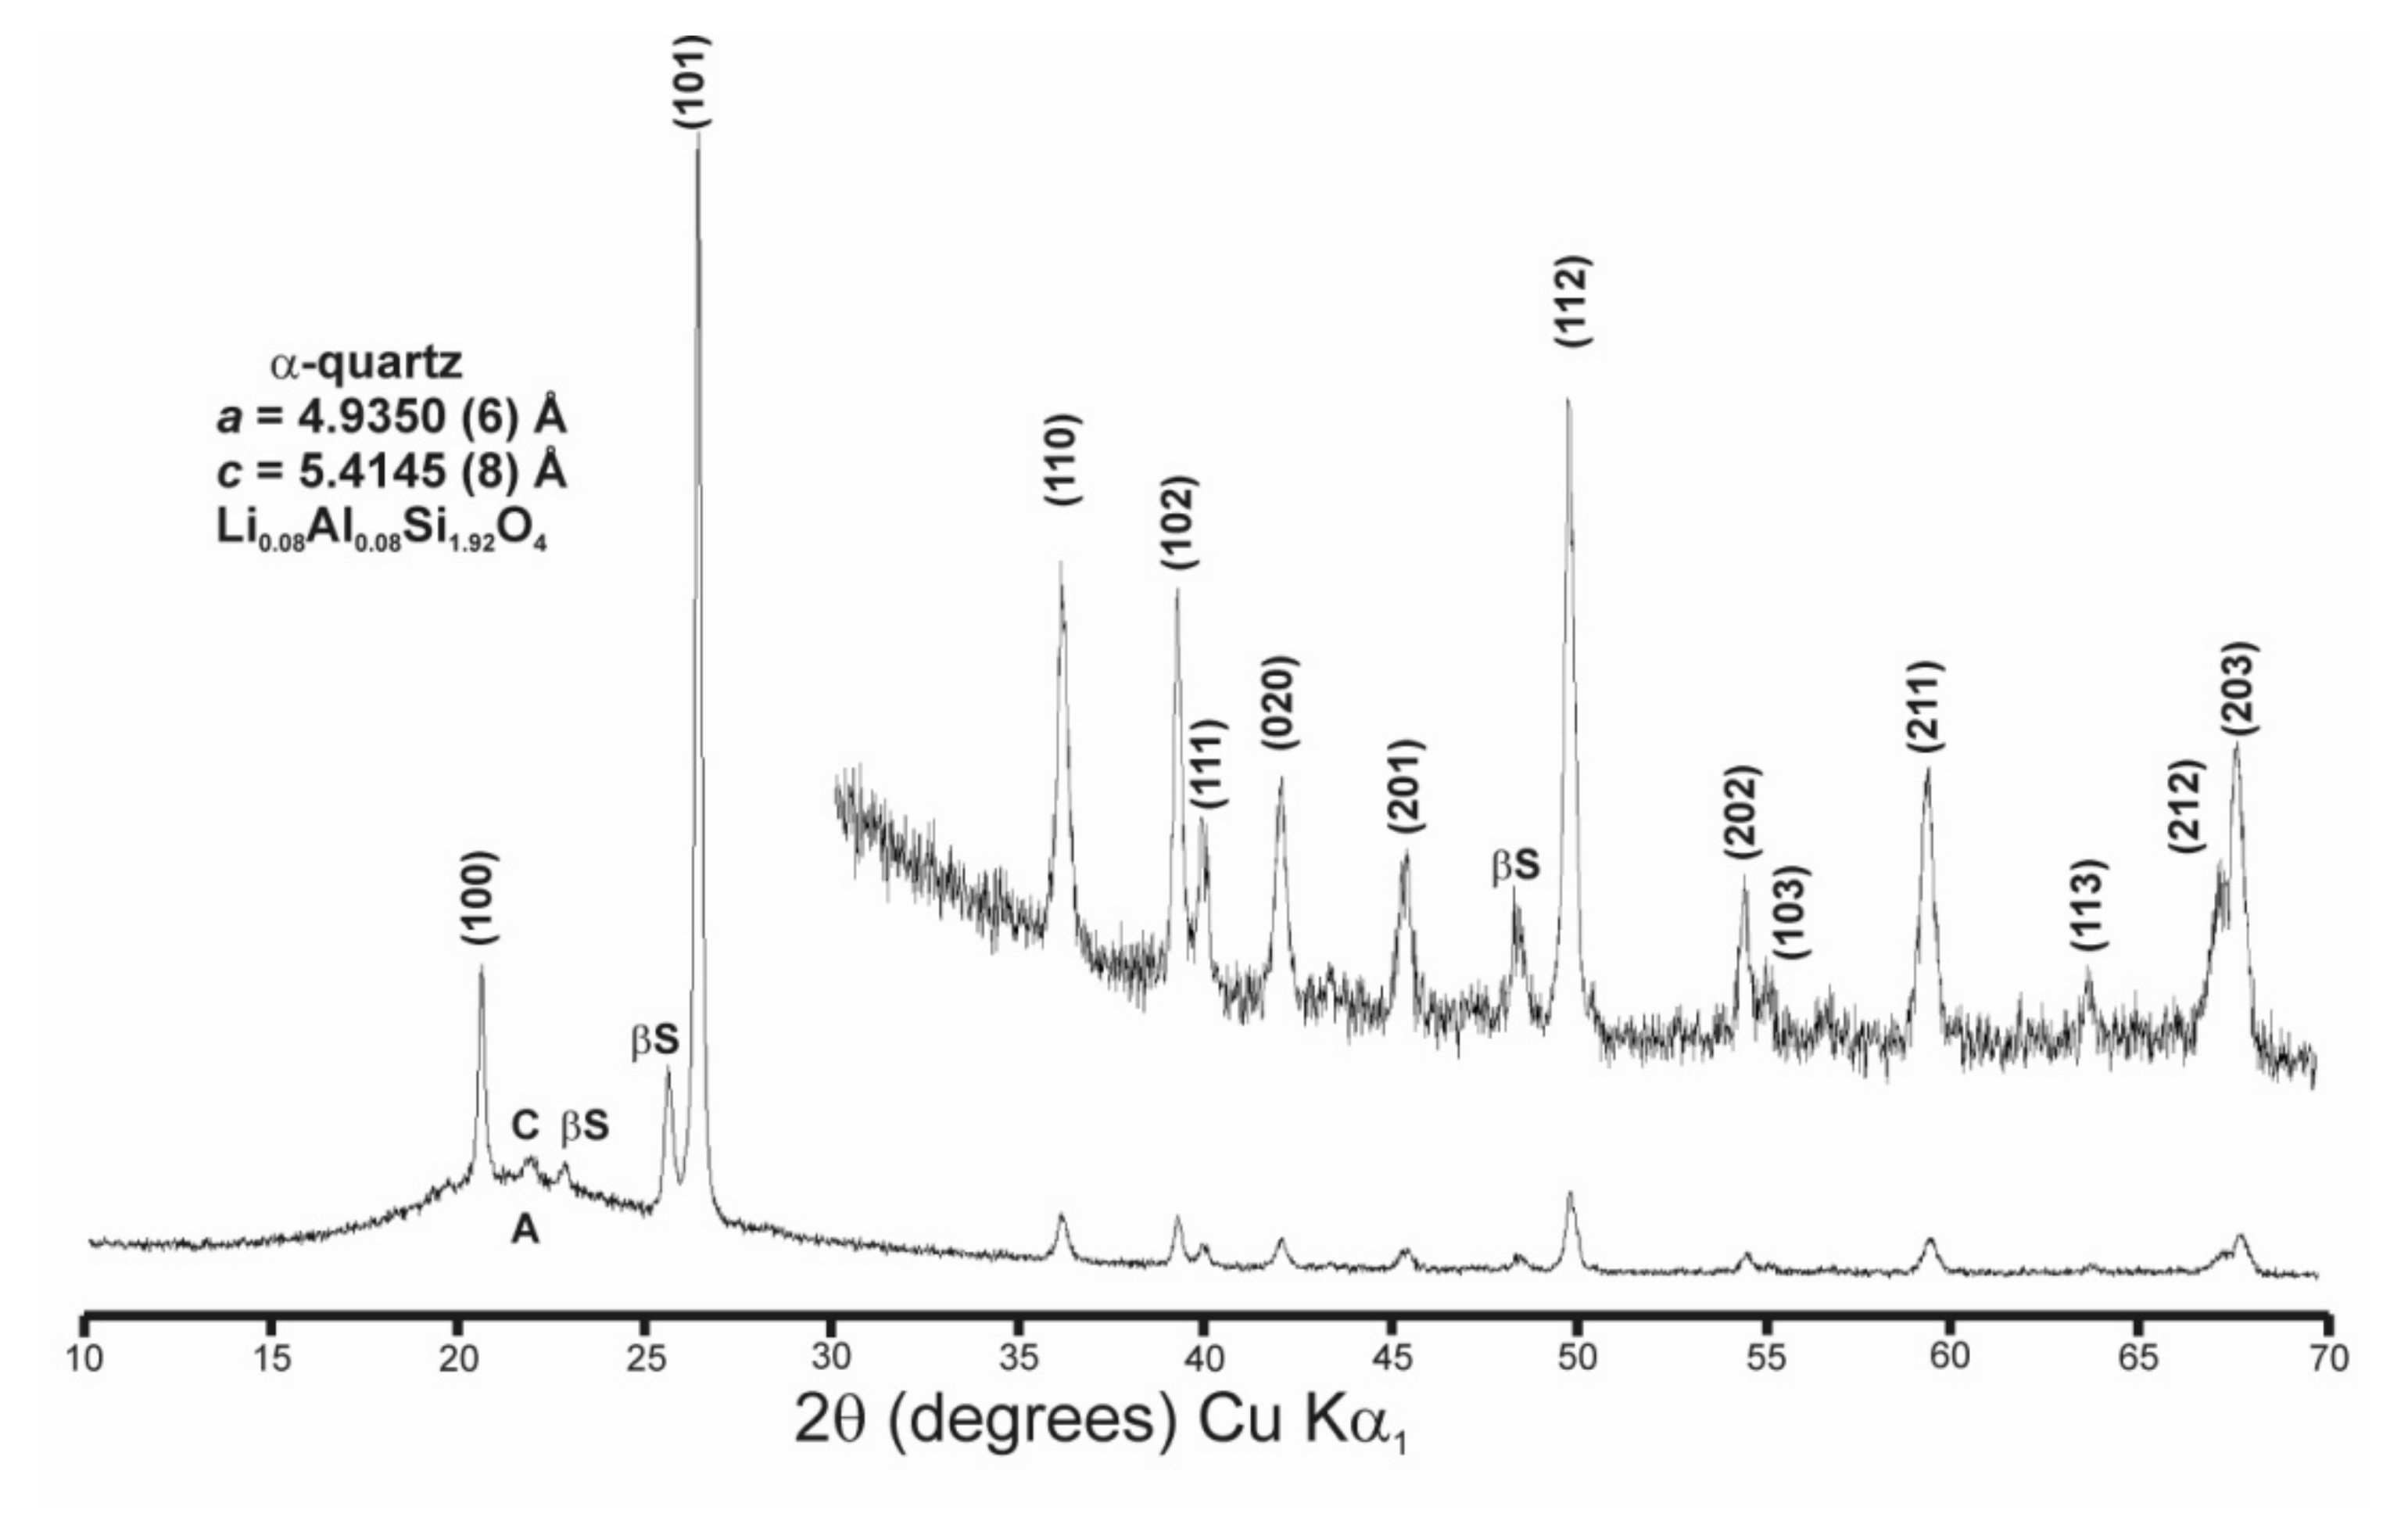
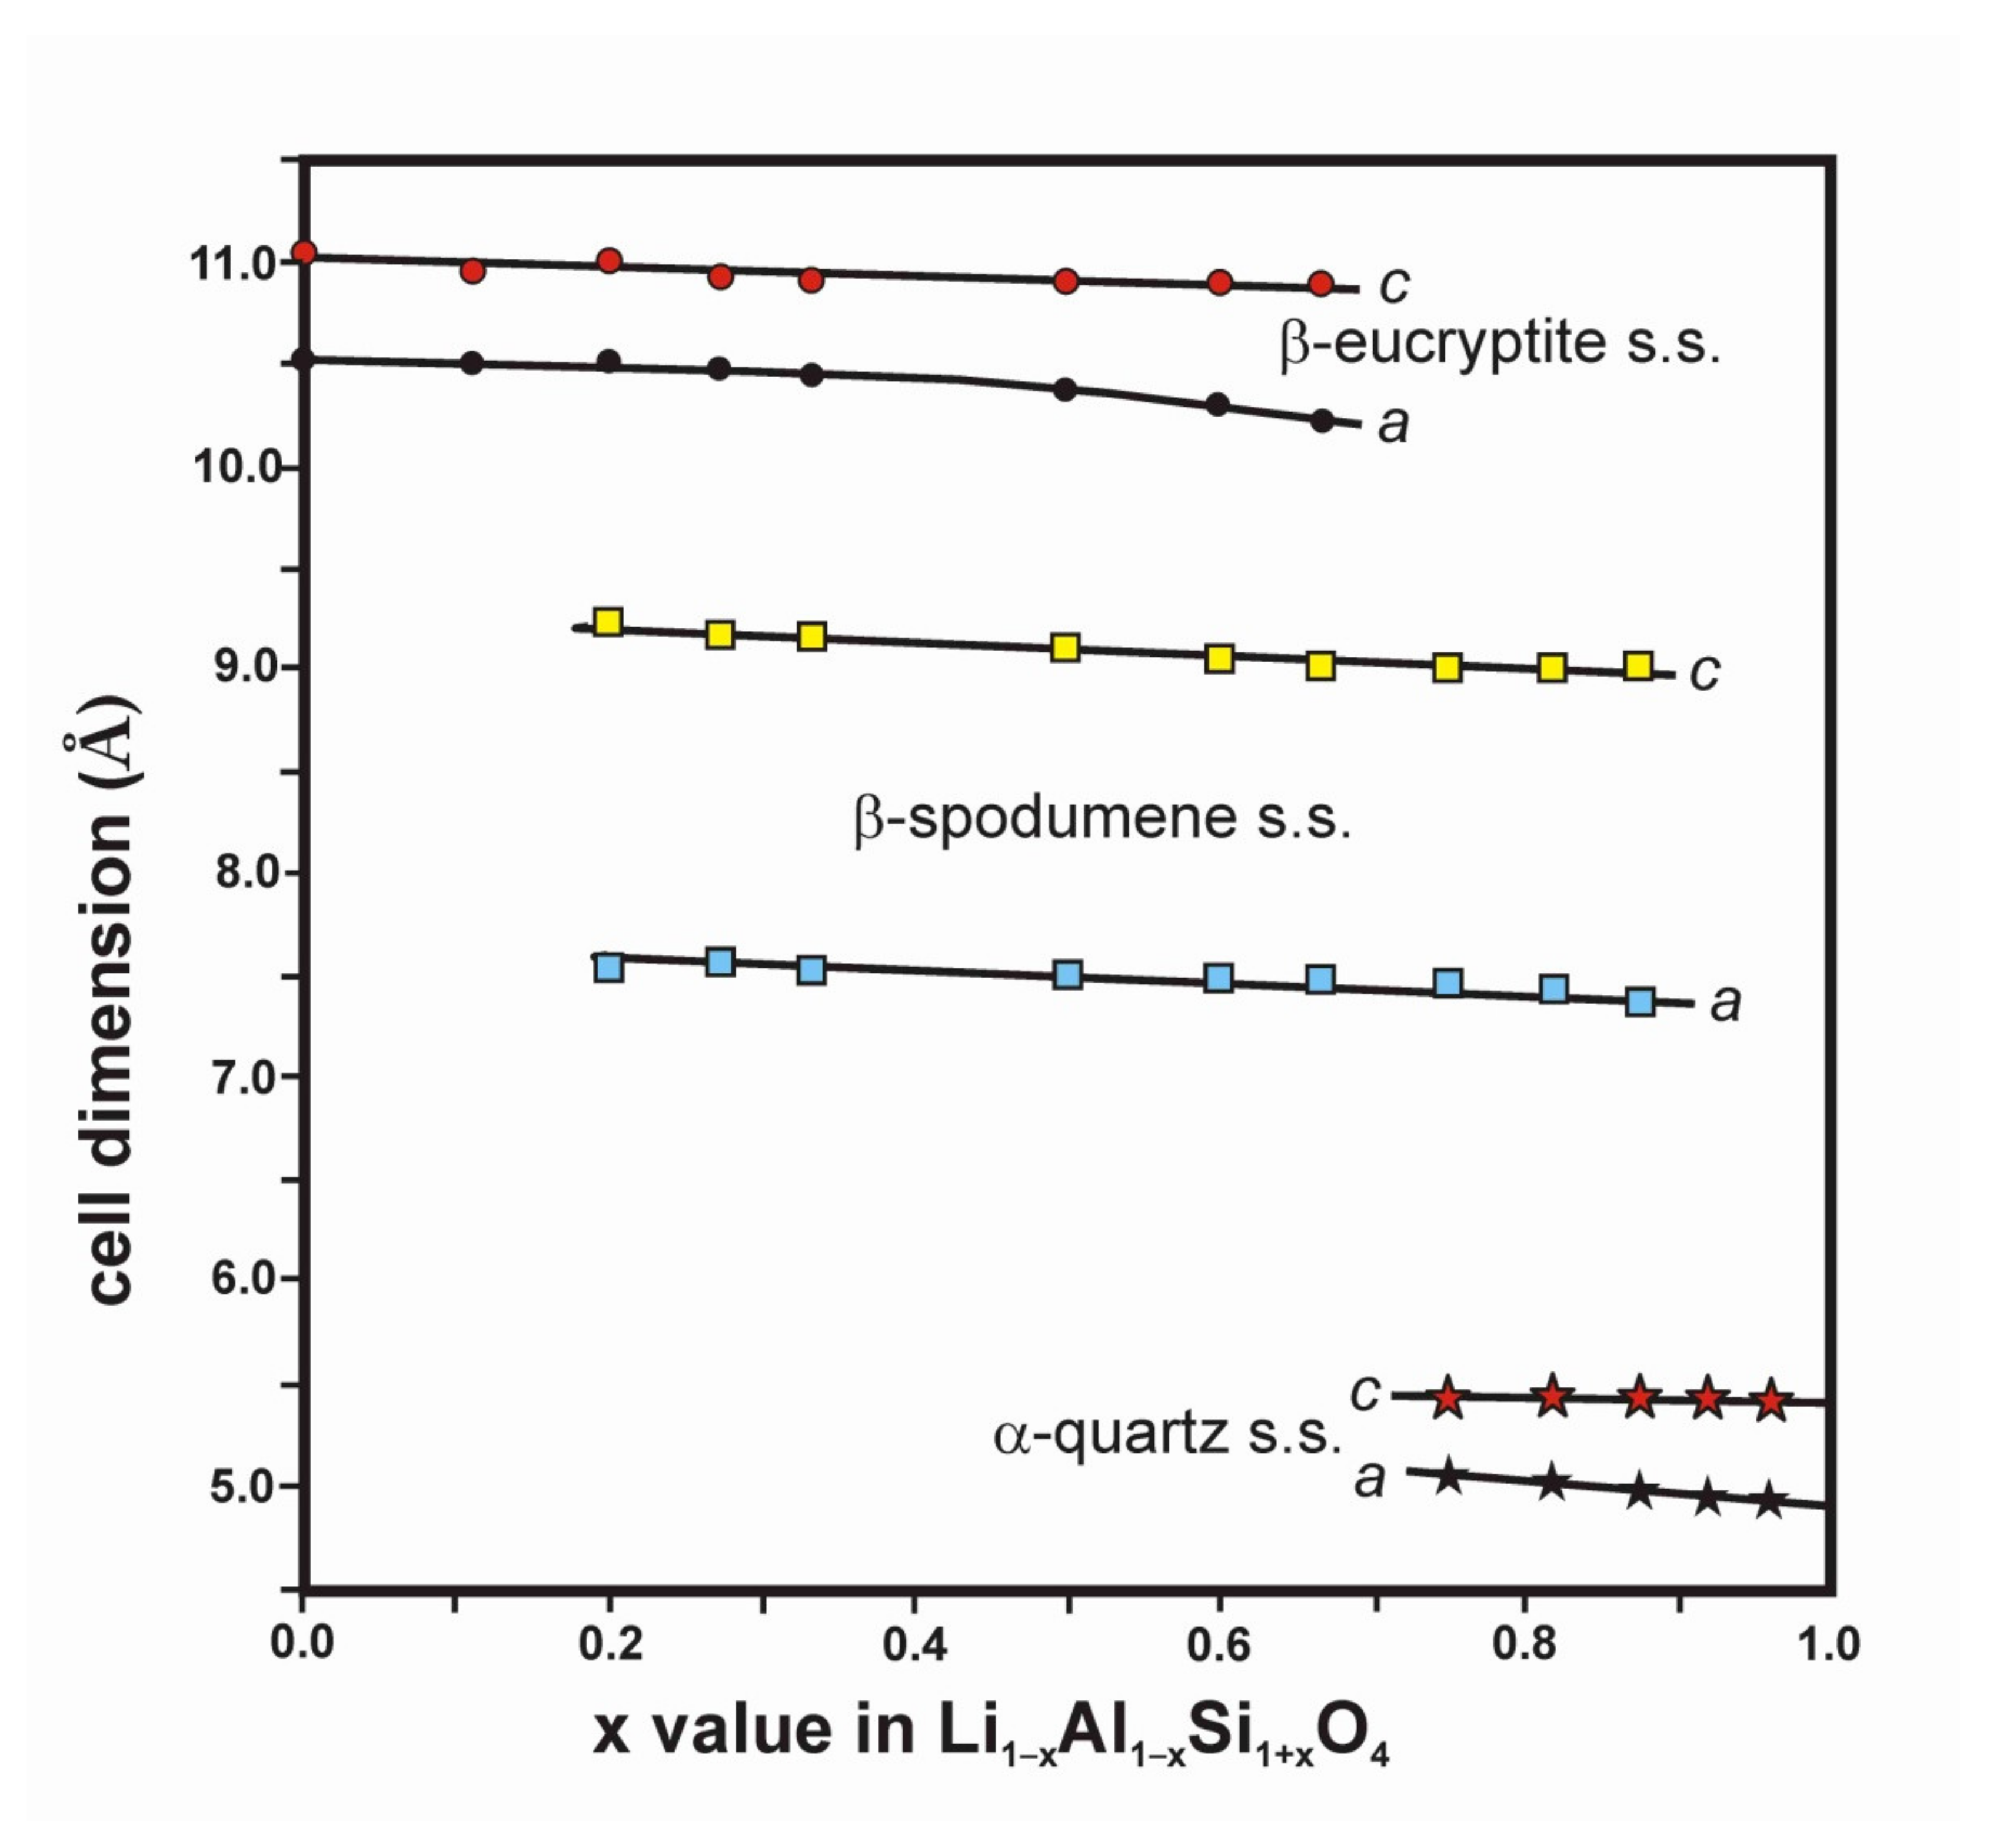
3.2. α-β Quartz s.s. in Li1−xAl1−xSi1+xO4 for 1.0 ≤ x ≤ 0.96

The hydrothermal crystallization of β-quartz at 900 °C and 3 kbars give rise to the observation of the α-phase at room temperature in a single and homogeneous phase for x > 0.96. Figure 2 shows the temperatures Th (heating) and Tc (cooling) of the α ↔ β transition of these synthetic quartz specimens. It decreases linearly from ~573 °C (~846 K) at x = 1.0 up to ~510 °C (~783 K) for x = 0.96, with a hysteresis of 5 K. For x = 0.92, two different phases were recorded by XRD and NMR spectra. The 7Li MAS NMR spectra (Figure 2, Table 3) shows a single resonance for x = 0.98 and x = 0.96 at ~0.5 ppm, but two peaks occur at x = 0.92 at 0.5 ppm and −0.2 ppm. The second value is close to that for x = 0, i.e., that of the β-eucryptite phase with LiAlSiO4 composition. The positive value in the chemical shift found in the 7Li spectra in α-quartz contrasts with the negative value observed in β-spodumene and β-eucryptite phases from ceramic experiments. The α-β transition for x = 0.92 was hardly recorded at ~485 °C (758 K) in the heating experiment, but was not observed in the cooling experiment. Thus, at this thermobarometric conditions, two different structures are formed because of a limited solid solution, involving the separation of a Li–Al rich β-quartz phase and β-eucryptite LiAlSiO4 for x ≤ 0.96, an effect that was not observed in the ceramic crystallizations. The 27Al MAS spectra in all of these samples show only a central transition signal with a broad shape (~18 ppm for x = 0.92) centered at 49.5 ppm without a clear quadrupolar profile. These results are consistent with a decrease in the stability of the solid solution in the LAS system at high pressure, in comparison with the crystallizations by the ceramic route at 1 atm.
The 7Li spectra at 9.4 T were simulated by using DM2011 software [53], G/L is the Gaussian/Lorentzian ratio, and Δδiso is the line width.

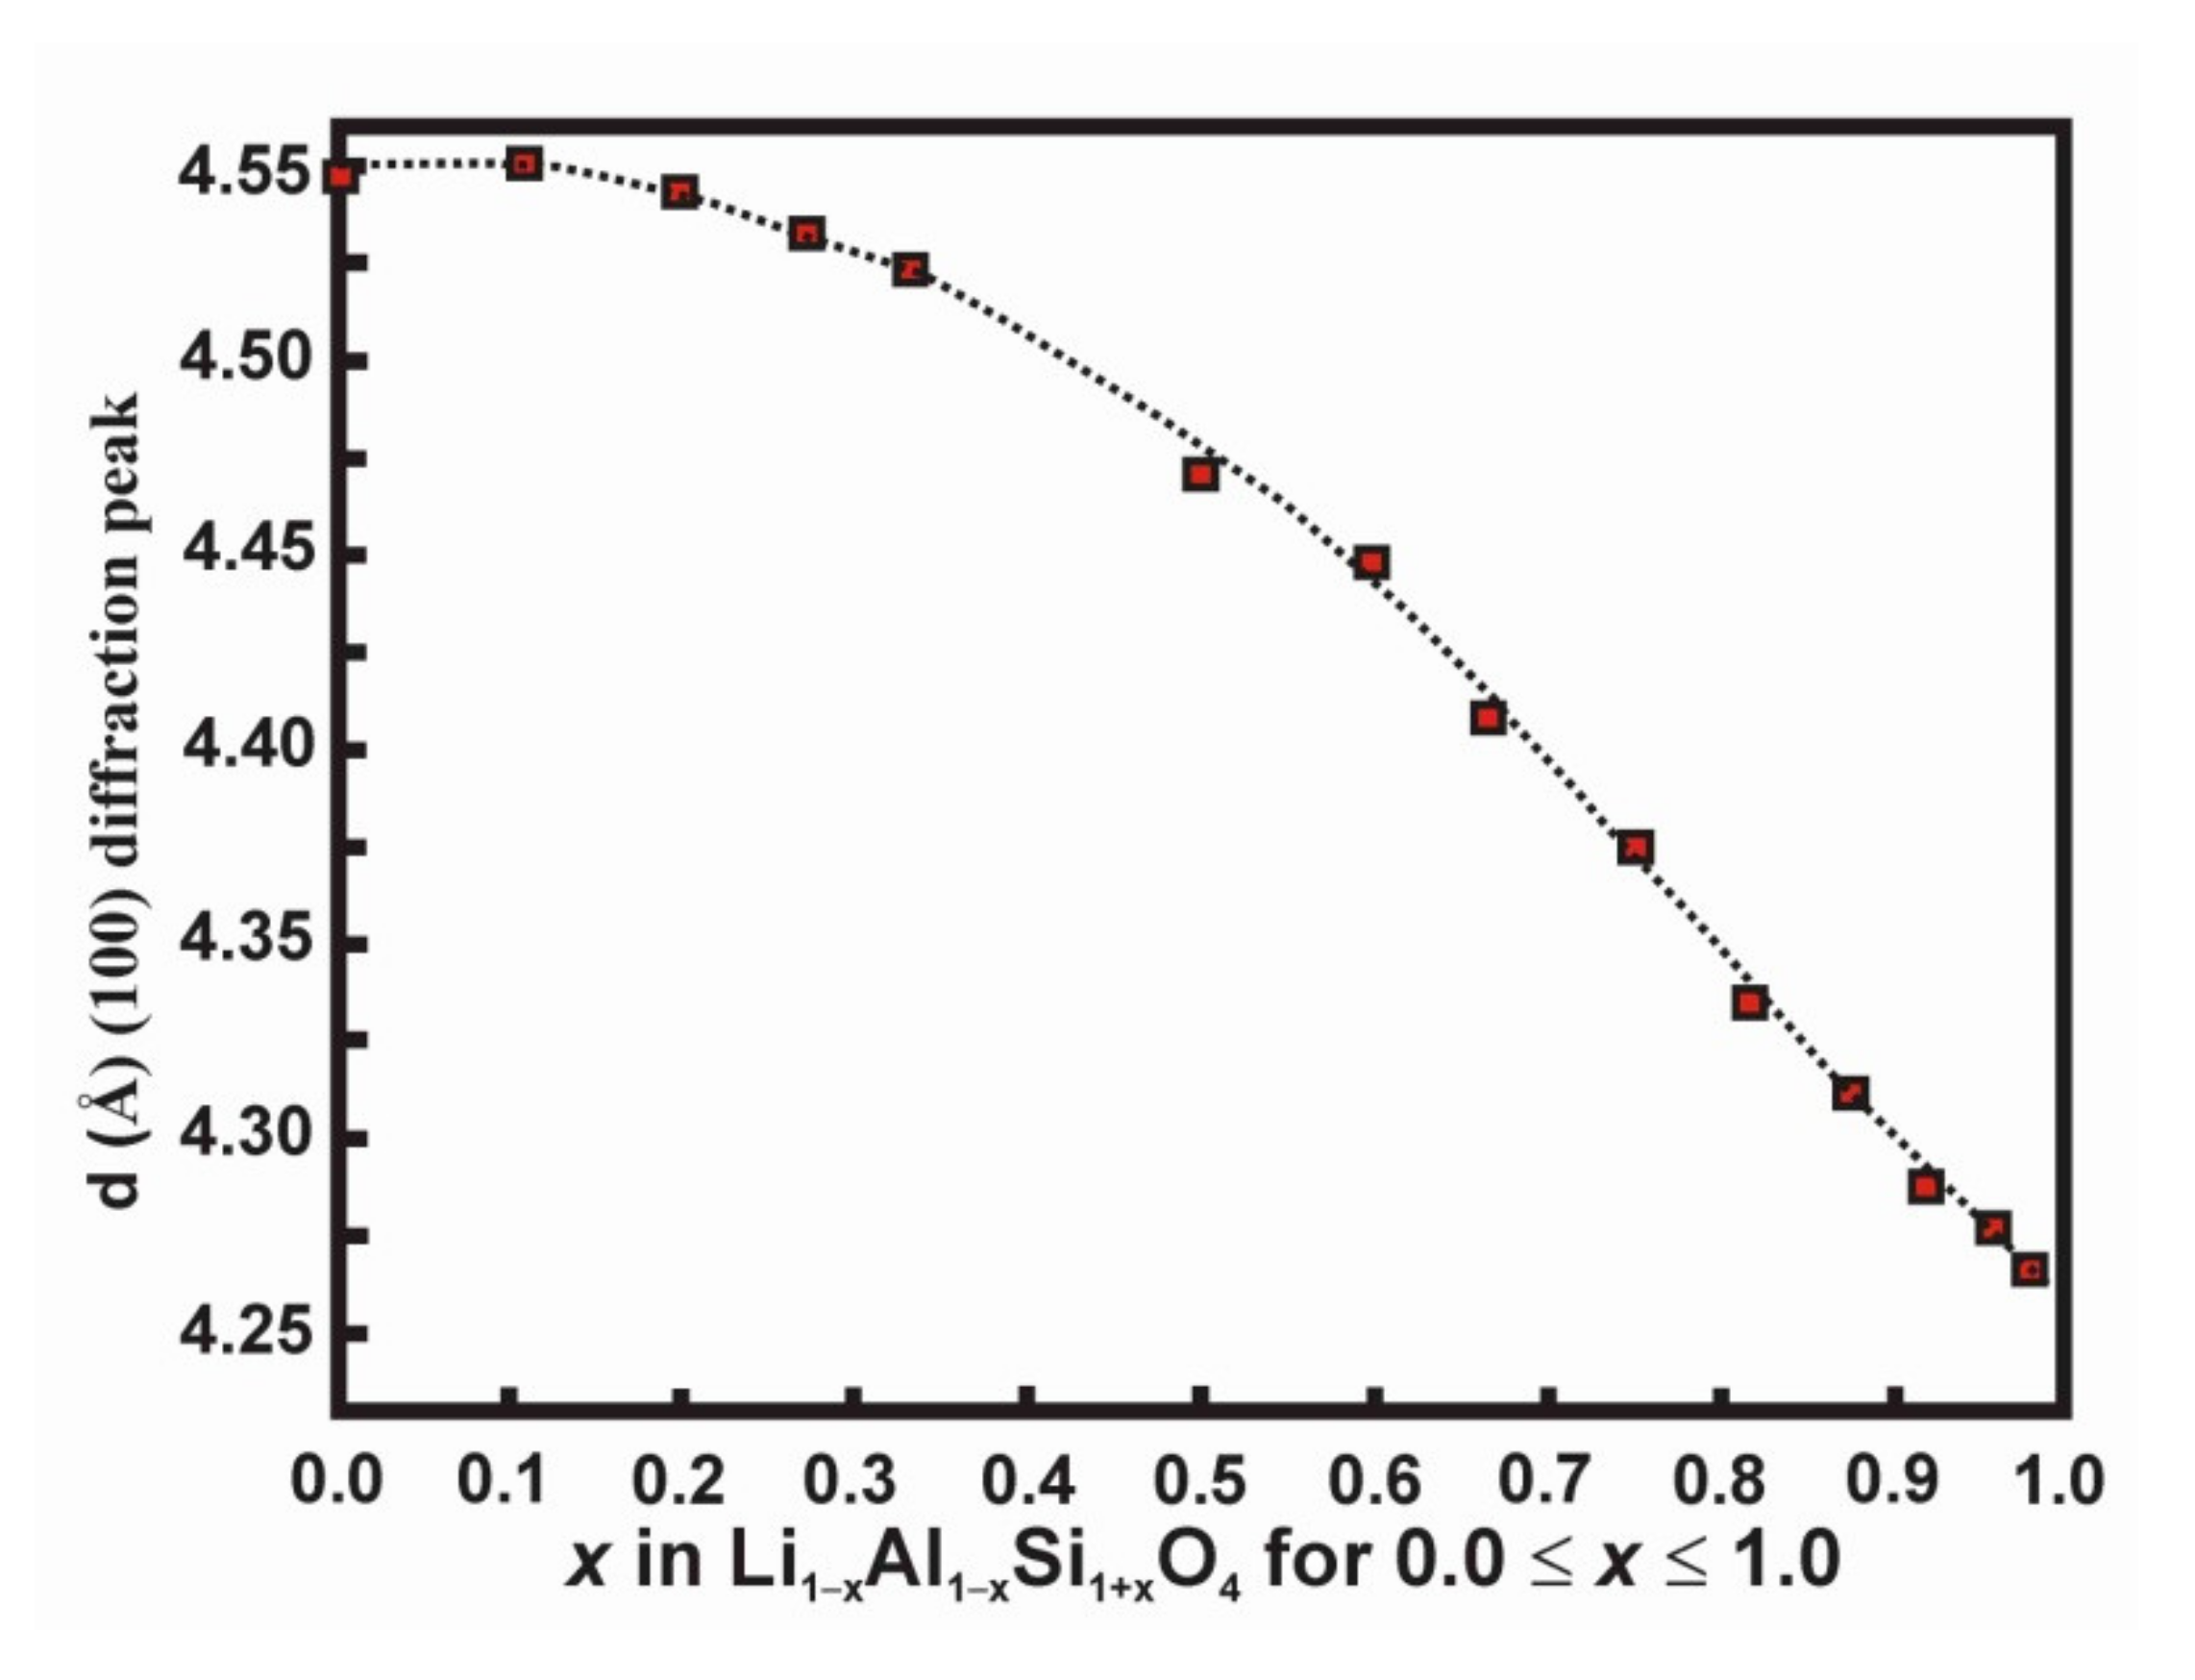
3.3. α-Quartz s.s. and β-Eucryptite s.s. in Li1−xAl1−xSi1+xO4 for 0.96 ≤ x ≤ 0.0

Fifteen chemical compositions between the SiO2 (x = 1) and LiAlSiO4 (x = 0) end-members were crystallized from precursor gels at room pressure and temperatures between 675 °C (948 K) and 1200 °C (1473 K) as ceramic crystallization experiments, producing mainly β-quartz (β-eucryptite), β-spodumene, and cristobalite. However, we found α-quartz at room temperature (Table 2, Figure A4, Appendix B) due to a β  α displacive transformation that occurred in the β-quartz during cooling for x > 0.75 (Si/Al > 7/1). For 0.667 ≤ x ≤ 0.50 experiments, mixtures with β-spodumene were produced that prevent clear distinction between the α- and β-phase in the quartz component, however, a β-eucryptite is inferred because x = 0.75 is very close to that phase, with a separation between (102) and (111) diffractions (Figure A6). For x ≤ 0.333, the β-eucryptite was resolved with sharp (201) peaks from superlattice diffractions, particularly when close to x = 0.00 (Figure A5). Thus, a displacive transformation occurred at 0.50 ≤ x ≤ 0.75, which is a similar value to that found in literature [14]. It is important to note that it is also for x < 0.75 that β-spodumene is mainly formed at high temperature in the ceramic crystallization experiments.
Hence, it was possible to record a single (100) or (200) diffraction in each sample with a α/β-quartz component, with values from ~4.25 Å at x = 0.0 to 4.55 Å at x = 1.0 (Figure 3), demonstrating the existence of a complete β-eucryptite solid solution at low pressure up to x values close to 1.0, despite the coexistence of additional phases. The LiAlSiO4 end-member produced a homogeneous β-eucryptite only at 1200 °C. However, the loss of Li atoms (evaporation) at this high temperature produced some Al excess, resulting in the crystallization of σ-Al2O3. Only four crystallization experiments produced β-eucryptite samples with close to a single phase with β-quartz structure (Table 2), which was used for the NMR analyses (Figure 4a), in particular for 0.0 ≤ x < 0.333.
The 29Si spectra of the β-eucryptite consist of groups of five resonances for Si atoms in Q4n (nAl) n = 0, 1, 2, 3, and 4 chemical environments, which were separated by approximately 5.9 ± 0.2 ppm (Figure 4a, Table 4). The chemical shifts of the individual components do not change along this chemical range, but the center of gravity of the bulk signals moves as shown in Figure 5. The intensities of these four experiments show that the Si/Al distributions are following the Loewenstein’s rule [55], as depicted in Figure 6, i.e., they have a Loewenstein order state, which is the intermediate between a total random disordered state and a fully ordered state. Samples crystallized at 1200 °C with nominal x values of 0.0 and 0.111 had a partial loss of lithium during the prolonged heating, resulting in real x values of ~0.08 and 0.20, respectively, in the analyzed products. The excess of Al atoms for the local compensation of charges does not develop non-stoichiometric compounds but the crystallization of σ–Al2O3 with Al atoms in octahedral coordination, which were recorded in both XRD patterns (Figure A5) and 27Al spectra (Figure 7a).
The center of gravity of the 7Li and 6Li spectra of the four samples with β-eucryptite structure have a very similar position at −0.2 ppm, also with similar line width and shape, indicating an analogous local environment for these cavity cations in the β-quartz structure (Figure 8a). The 7Li and 6Li spectra of these β-eucryptite samples with Loewenstein order state were simulated by means of Voigt profiles, which indicate two resonances (Table 5) with similar areas to that of the 6Li spectra in fully ordered β-eucryptite LiAlSiO4 (i.e., 3/1 in Figure 9c). The main resonance has a high quadrupolar interaction in comparison with the minor one.
The 7Li spectra at 9.4 T were simulated by using DM2011 software [53], G/L is the Gaussian/Lorentzian ratio, and Δδiso is the line width.

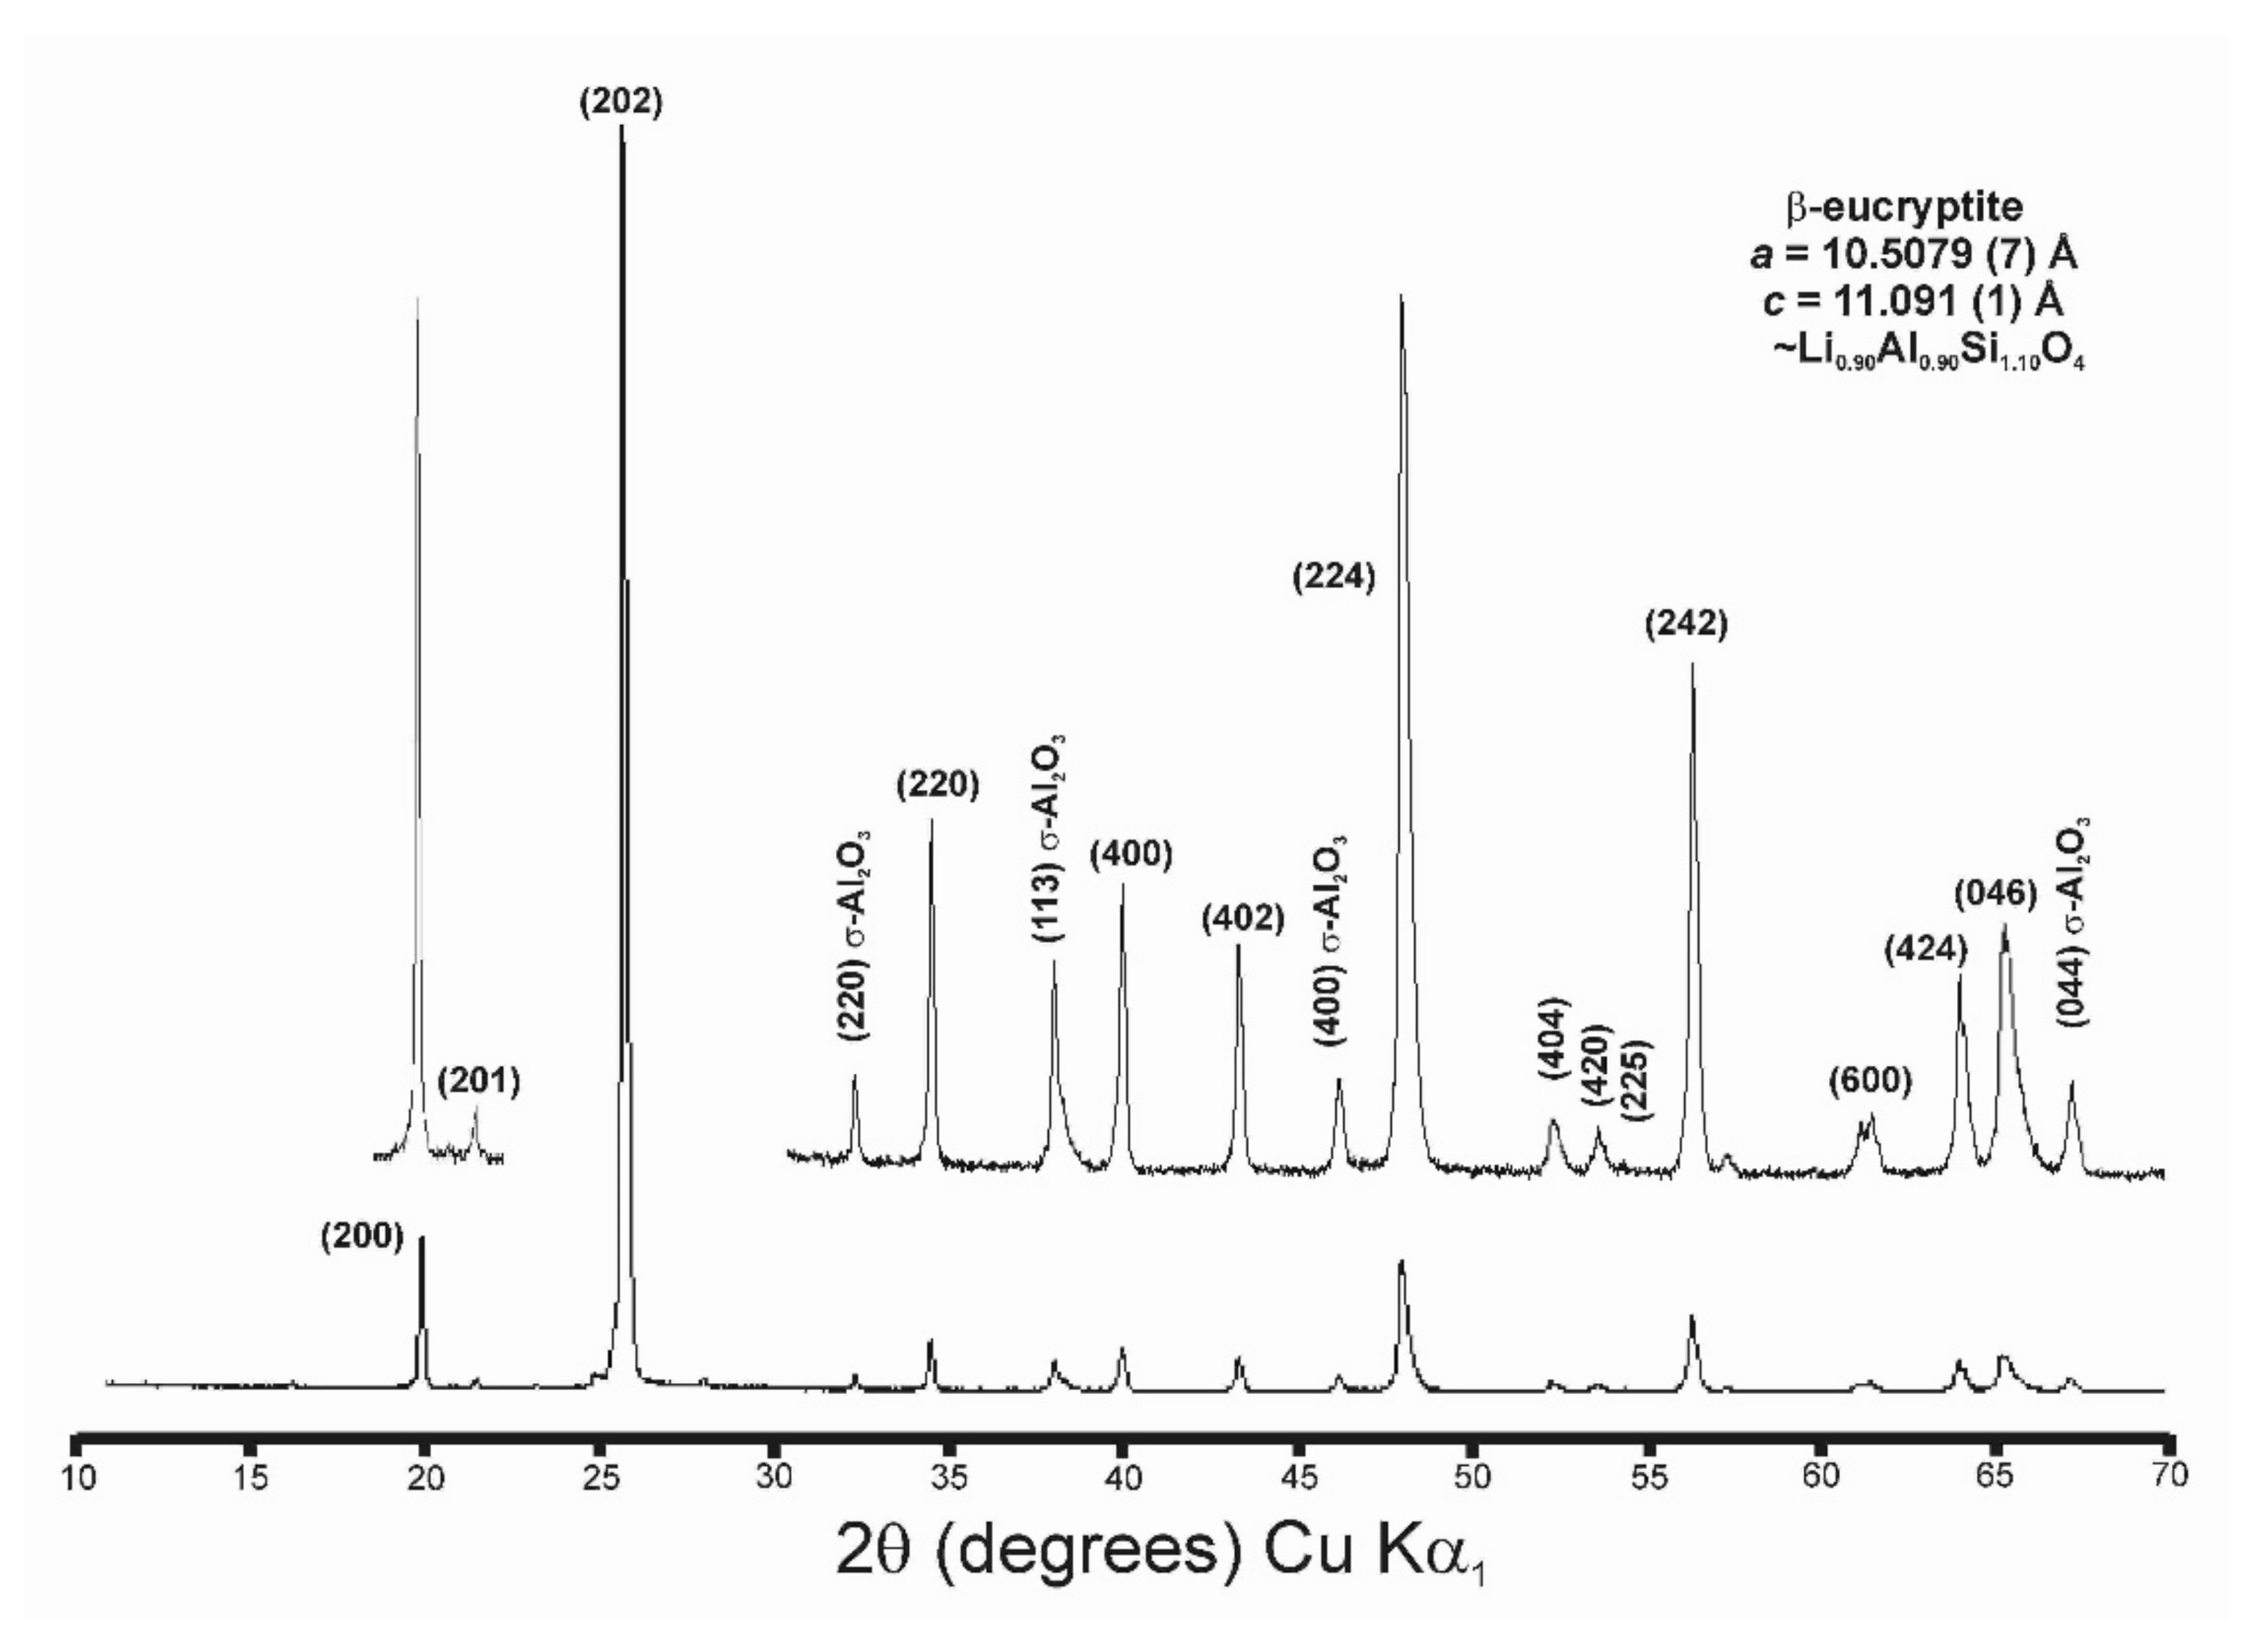
3.4. β-Eucryptite LiAlSiO4 End-Member

A stoichiometric fully ordered LiAlSiO4 compound with the β-eucryptite crystal structure was synthesized at 3 kbars and 900 °C. The NMR spectra (Figure 9) of this sample are compatible with a fully ordered structure at the local scale. Two tetrahedral sites for Si atoms with δexp at −91.9 ppm and at −90.7 ppm were found in the 29Si spectrum, and they could correspond with Si1 (6g) and Si2 (6i) in the P6422 lattice model of Pillars and Peacor (1973) [12], having δcal at −88.7 ppm and −87.6 ppm in DFT calculations. Two tetrahedral sites for Al atoms were resolved with two signals having similar area but very different shape in the 27Al spectra; one has a very symmetric shape, the other has a clear quadrupolar profile. The symmetric resonance can be simulated at δexp = 57.1 ppm, CQ~0.9 MHz, and η = 0.00, whereas the other resonance was reproduced at δexp = 59.81 ppm, CQ~3.65 MHz, and η = 0.30. These two peaks could correspond with sites Al2 (6j) and Al1 (6h), respectively, in the P6422 lattice model of Pillars and Peacor (1973) [12], inferred from DFT calculations that produced δcal at 56.48 ppm, CQ = 1.43 MHz, and η = 0.14 for the symmetric site, and δcal at 59.11 ppm, CQ = 3.64 MHz, and η = 0.31 for the asymmetric site. These values are consistent with those published in the literature by Phillips et al., (2000) [17] as δ = 61.4 ppm, CQ = 4 MHz, and η = 0.2 for the broad peak; and δ = 58.1 ppm and CQ = 0.2 MHz for the narrow peak. A broad signal was obtained in the 7Li spectrum, whereas in the 6Li spectrum two signals were resolved, one at −0.16 ppm with three times the intensity of the other at −0.41 ppm. DFT calculations made after the cited model, having three sites for Li atoms, involved three resonances at −0.15, −0.46, and −0.24, corresponding with Li1 (3b), Li2 (3c), and Li3 (6f), corresponding with the observed resonances at −0.16, −0.41, and −0.16 ppm, respectively. Thus, our experimental results are fully consistent with the P6422 lattice model of Pillars and Peacor (1973) [12], where two tetrahedral sites for Si atoms, two tetrahedral sites for Al atoms, and three channel sites (one site with double multiplicity than the other two sites) for Li atoms were proposed.

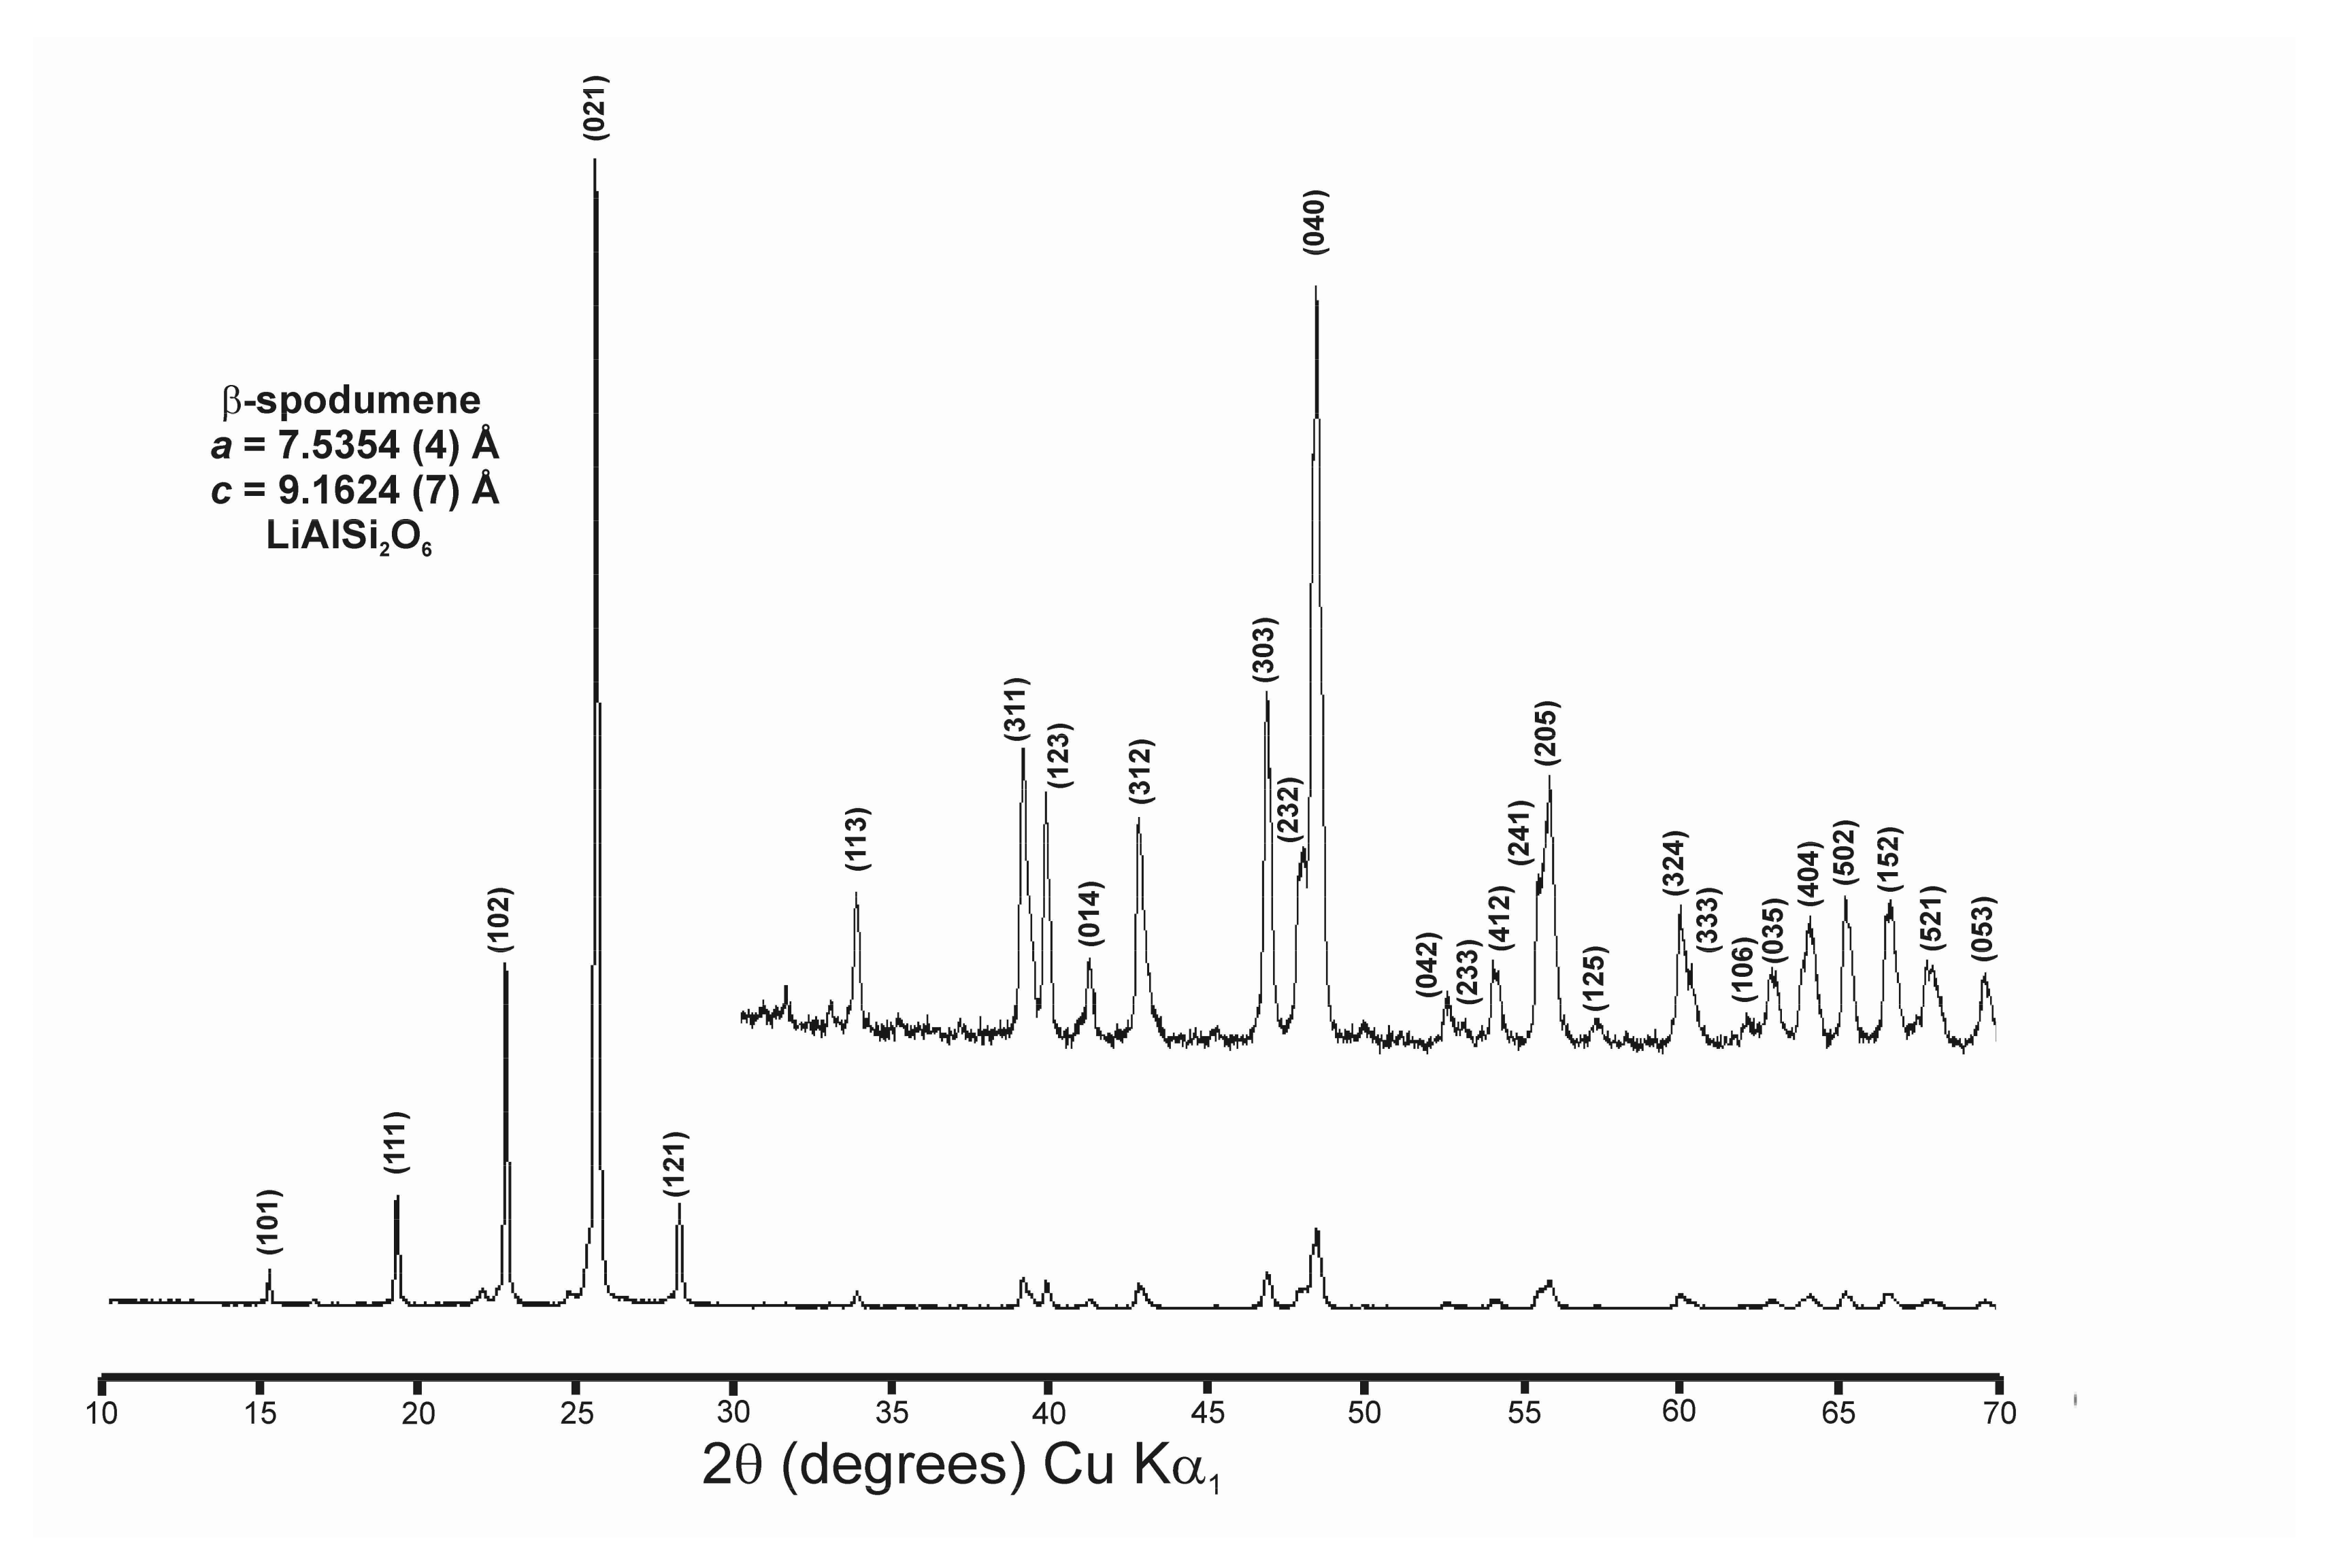
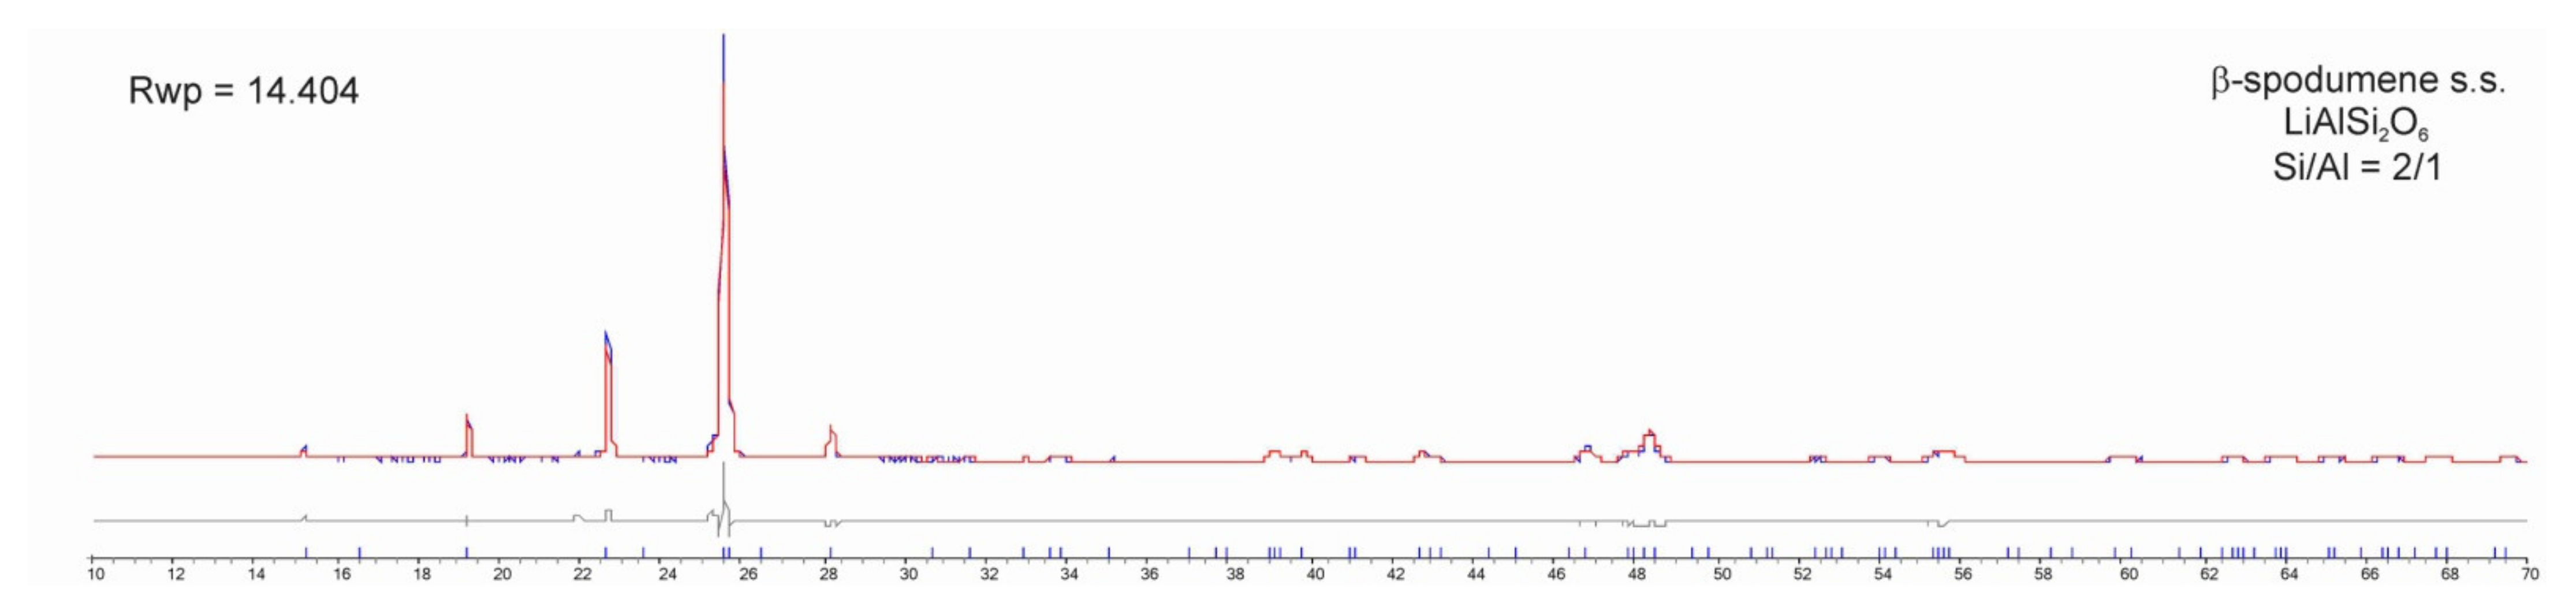
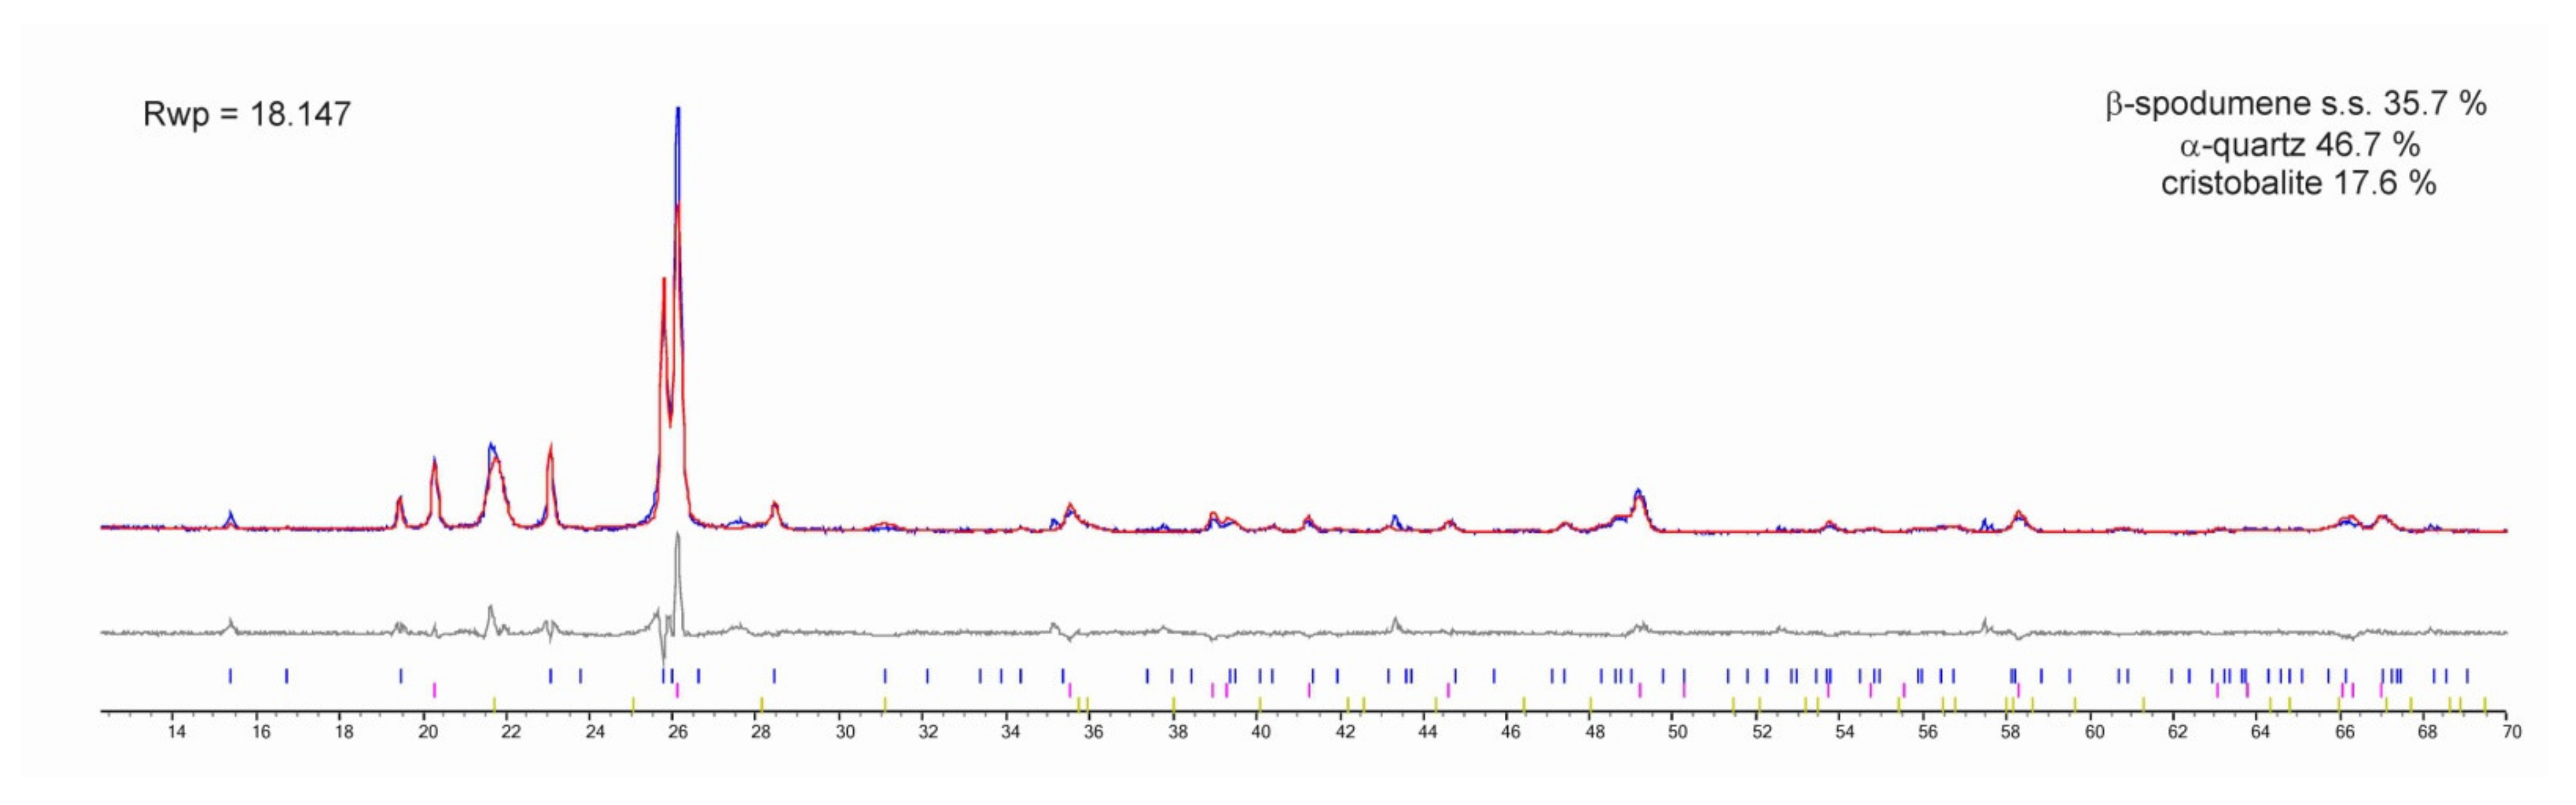
3.5. β-Spodumene s.s. Series in Li1−xAl1−xSi1+xO4

The β-spodumene phase was obtained mainly in mixtures with other phases for 0.92 < x < 0.20, and a single-phase was obtained only for 0.667 < x < 0.333, and these samples were used for the NMR characterization. Figure 4b shows the 29Si spectra of the β-spodumene, consisting of groups of five resonances from Si atoms in Q4n (nAl) n = 0, 1, 2, 3, and 4 chemical environments, with chemical shifts that were separated by 6.4 ± 0.3 ppm. The center of gravity of the spectra changes with the x value as shown in Figure 5, giving rise to linear correlation, but having a different slope to that found in the β-eucryptite structure. The intensities of the several resonances in each sample of this series also follow the Loewenstein’s rule (Figure 6), in contrast to previous suggestions from 29Si NMR at 4.7 T [56]. The 27Al spectra show that no σ-Al2O3 is formed, despite the high temperature and prolonged time of gel calcinations to form β-spodumene. This must be related to more limited loss of lithium atoms, in comparison with that of the β-eucryptite, as in the former case, the Li atoms can be in tetrahedral coordination with oxygen atoms in a tetragonal space group P43212 [22,23,24], instead of open hexagonal channels along the c-axis as in the β-quartz structure of the β-eucryptite series.
The 27Al spectra of the β-spodumene samples (Figure 7b) show a wide asymmetric signal centered at circa 45 ppm, without a clear quadrupolar profile as a result of the disordered structure, which is very similar in the studied chemical range.
The 7Li and 6Li spectra of the samples of β-spodumene are also very similar in all cases, centered at circa −0.4 ppm, as well as also in the β-eucryptite, where spectral simulations of 7Li spectra by means of Voigt profiles indicate two resonances with similar areas (i.e., 3/1) to that of the 6Li spectra, as detailed in Table 5. The main resonance has a high quadrupolar interaction in comparison with the minor one.

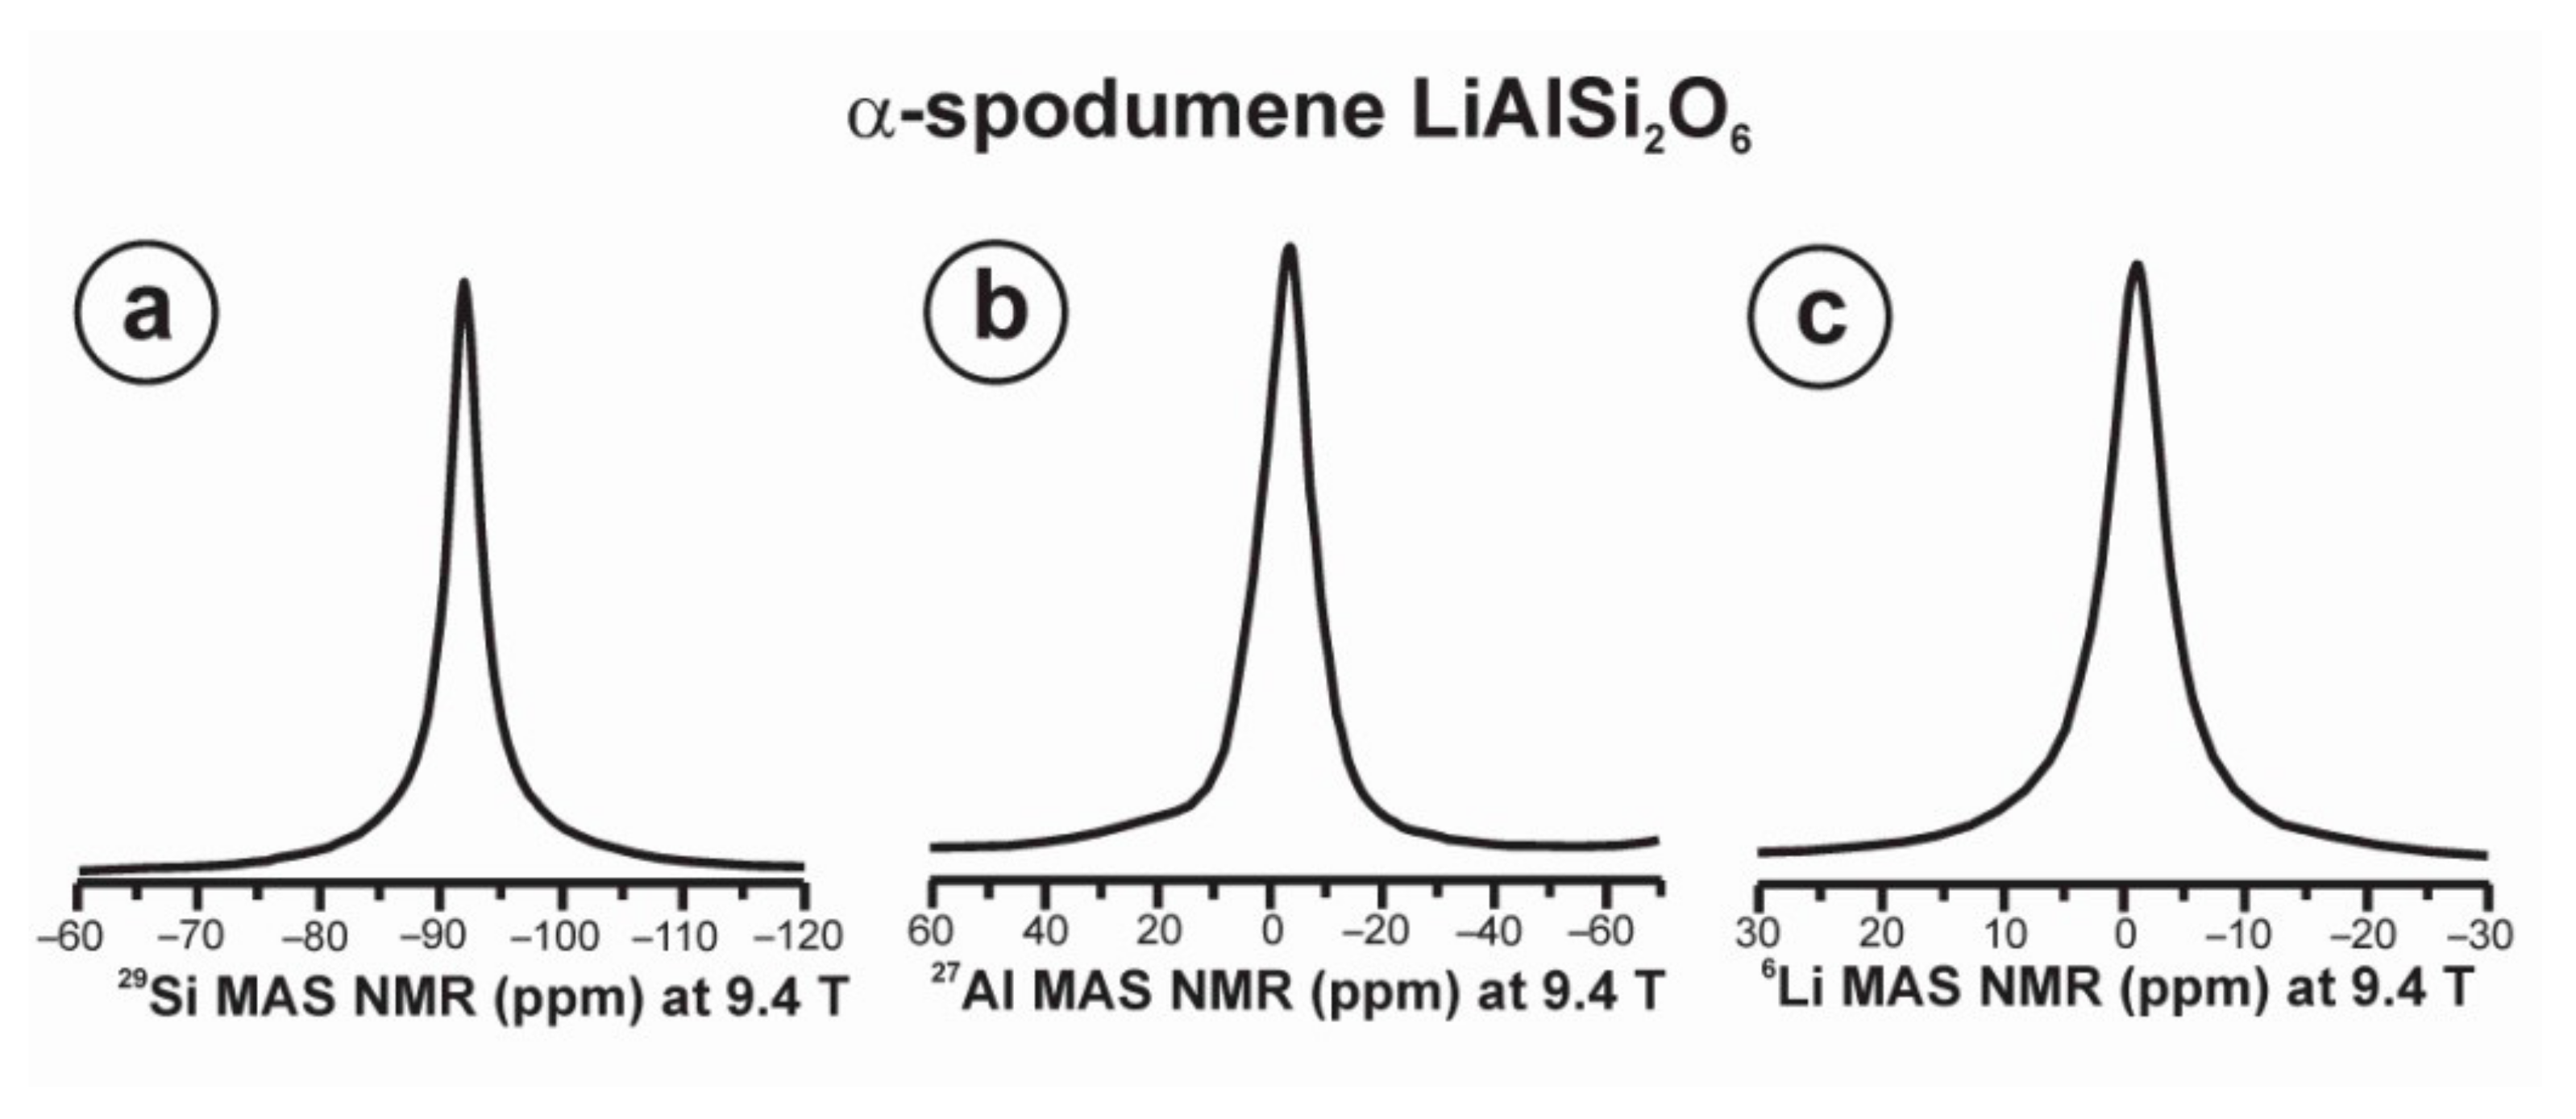
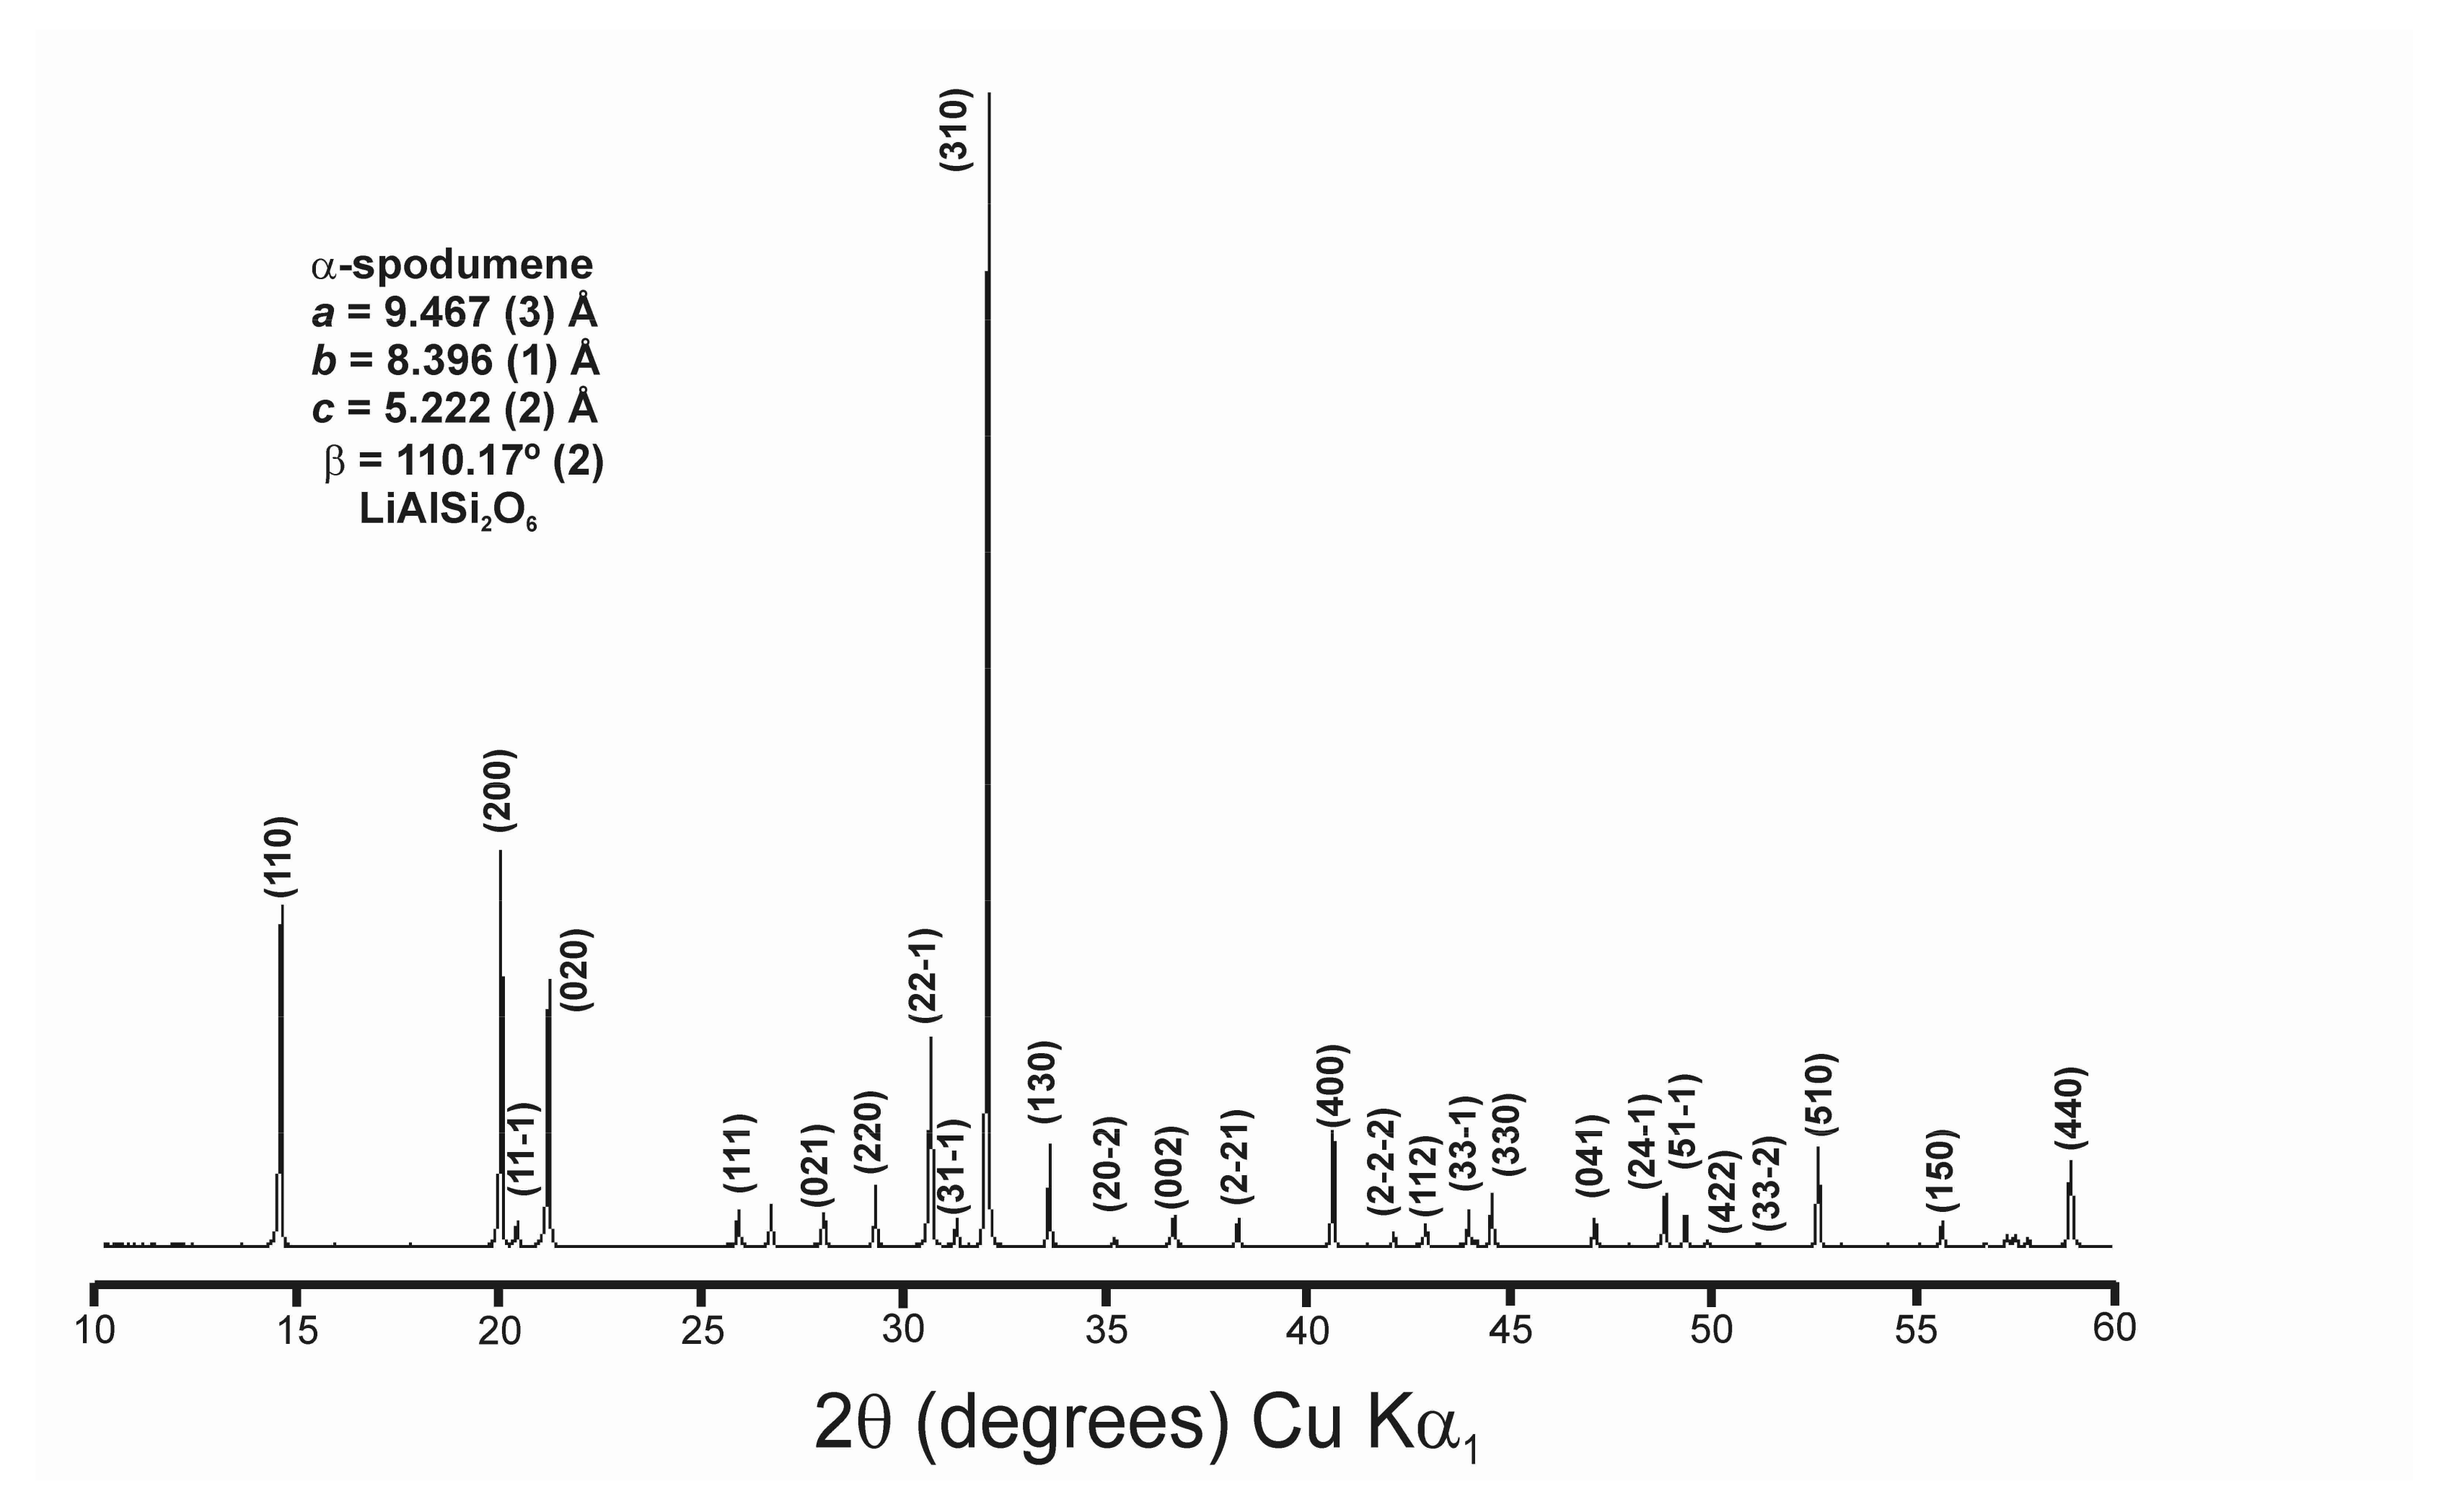
3.6. α-Spodumene LiAlSi2O6

Several specimens of this mineral phase from pegmatites from different localities and geological environments were studied by NMR, but very similar results were obtained in all cases, indicating a single and homogeneous phase for this chemical composition, in contrast with the β-spodumene series. Figure 10 shows the 29Si, 27Al, and 7Li spectra of α-spodumene at 9.4 T by using specimen Golconda. The 29Si spectrum shows a single Lorentzian peak at −91.6 ppm, with a line width of 3.9 ppm (Figure 10a), a value consistent with the Si1 (8f) site of the C2/c model, having a δcalc = −90.41 ppm from DFT calculations.
The 27Al spectrum has an octahedral component without a defined quadrupolar profile with the center of gravity at −3.5 ppm, a typical value from octahedral coordination with oxygen atoms, and a line width of 10.5 ppm (Figure 10b). This signal can be related to the Al1 (4e) site of the C2/c model, with δcalc = 4.5 ppm, CQ = 2.47 MHz, and η = 0.6 from DFT calculations. The 7Li spectrum (Figure 10c) can also be simulated with a Lorentzian profile having δiso = −1.1 ppm, Δδiso = 6.0 ppm, CQ = 69.6 ± 0.2 kHz, and η~1.0. This signal corresponds with the Li1 (4e) site of the C2/c model, having a δcalc = −1.22 ppm and CQ = 90 kHz from DFT calculations. Hence, these NMR experiments at 9.4 T are fully consistent with the lattice model with C2/c symmetry having a single structural site for each cation [57]. Note that this chemical composition was experimentally crystallized with the β-quartz structure (also called γ-spodumene [18] or the mineral species called “virgilite” [19]) using the sol-gel method at low temperatures, and with the β-spodumene structure at high temperatures (see Table 2) at 1 atm., but these two tectosilicate Q4 structures are very different from that of the pyroxene Q2 α-spodumene. It is interesting to remember that only the α-variant has been found in nature.

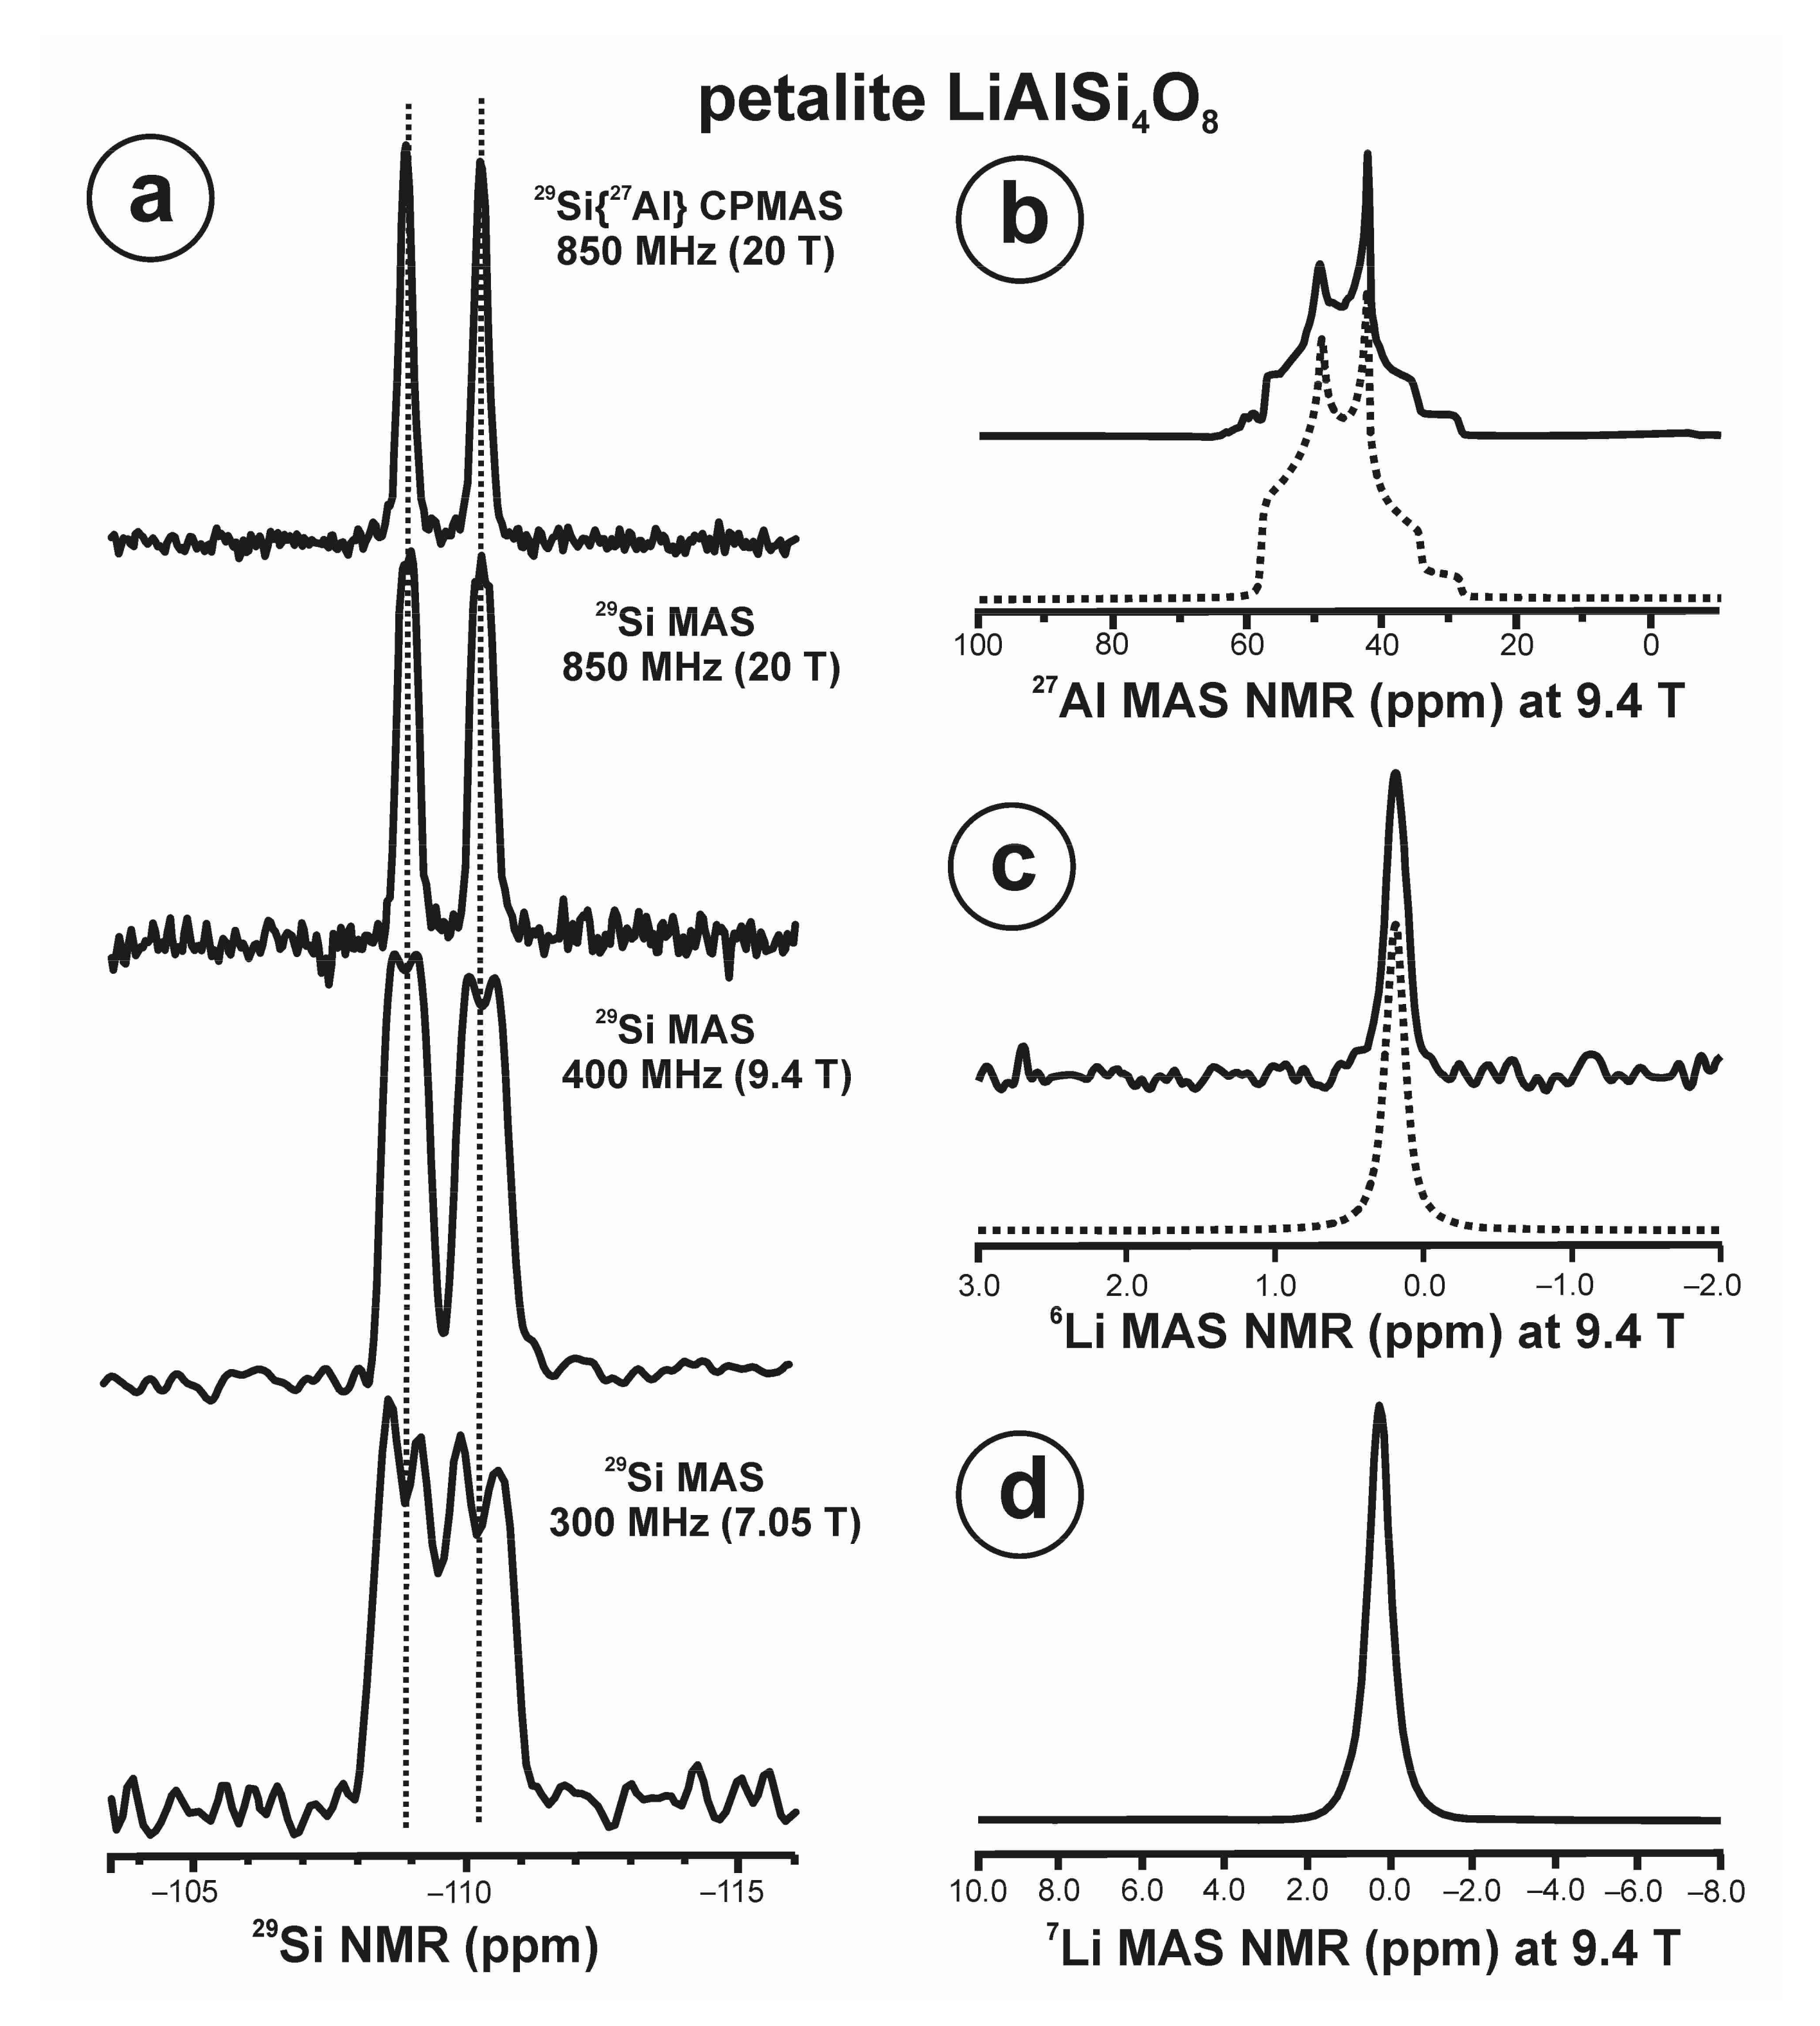
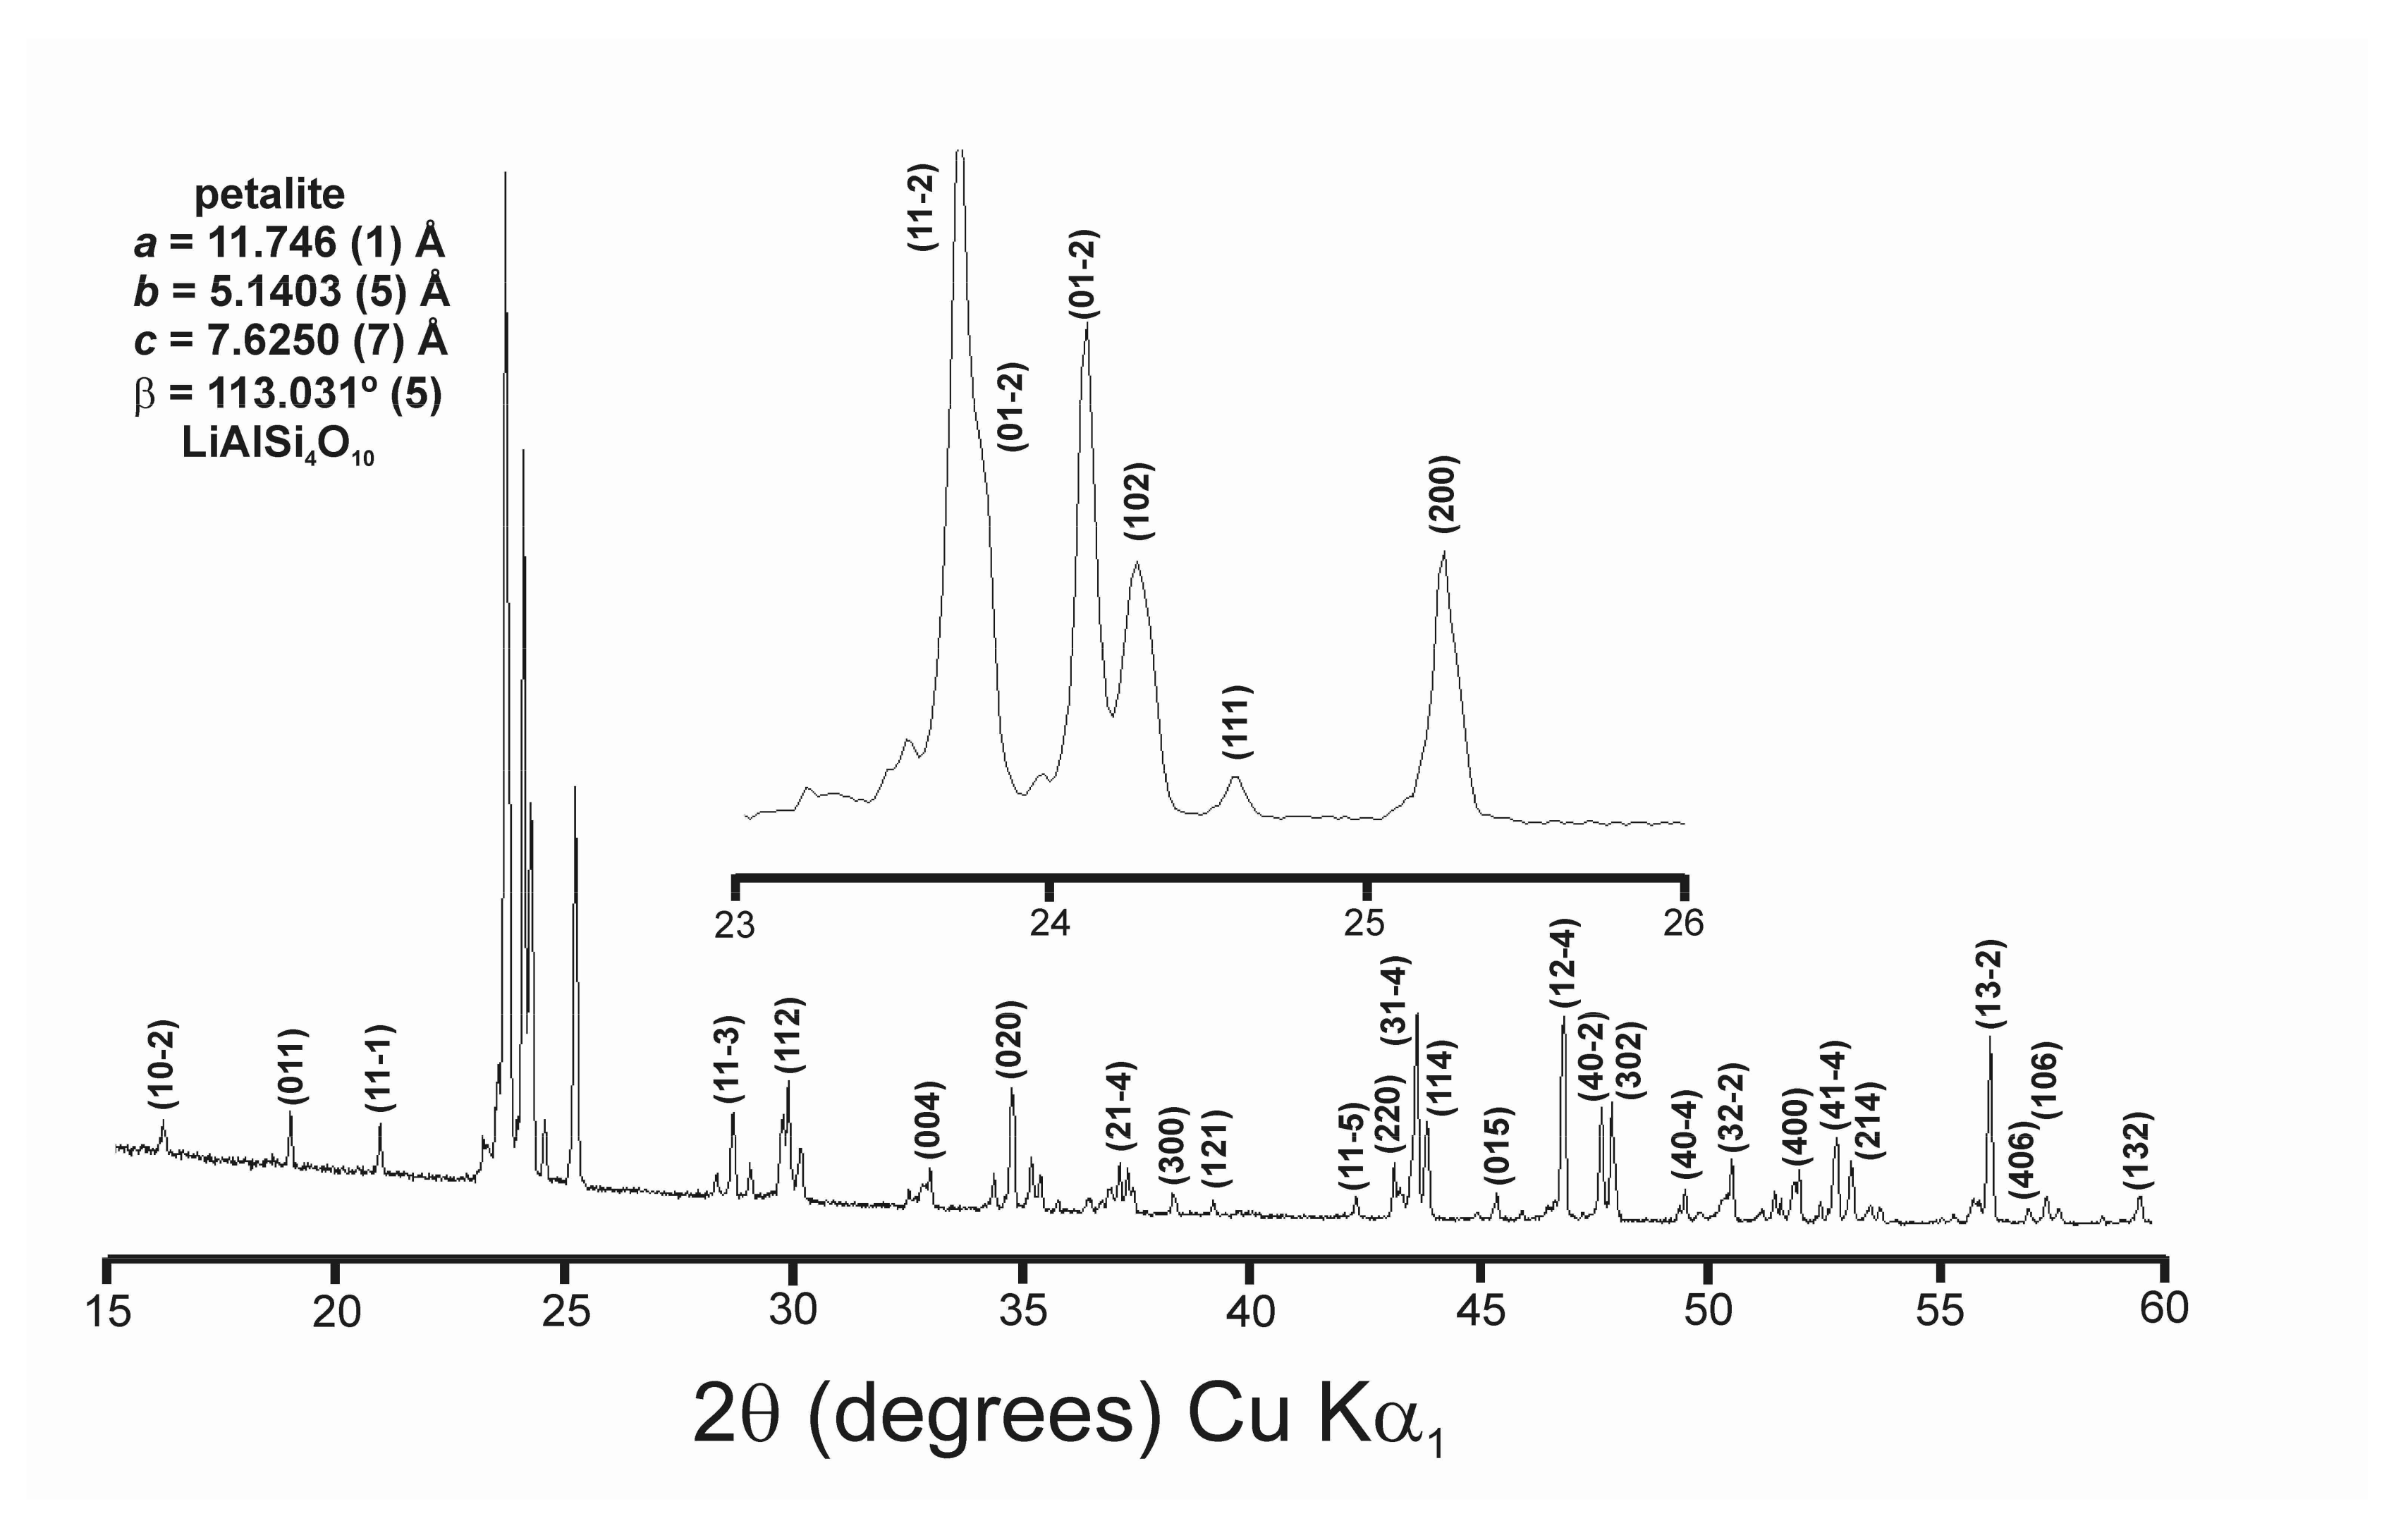
3.7. Petalite LiAlSi4O8

Figure 11 displays the NMR spectra of specimen Brazil of petalite. Unexpectedly, the 29Si spectrum of petalite (Figure 11a) changes with the external magnetic field. It shows two peaks at high magnetic field and four peaks at low magnetic field. At 20 T, single pulse and 29Si{27Al} CP MAS NMR experiments show two well define signals with maxima at −109.2 and −110.6 ppm of similar line width, but thinner in the second case. At 9.4 T, a single pulse experiment exhibits two doublets separated by ~1.5 ppm, a value similar to that observed in the separation of the two peaks at 20 T. Each doublet can be decomposed in two signals of identical line width separated by 0.47 ppm. At 7.05 T, the two doublets appear as four separated resonances with similar area, but now the doublets are separated by 0.65 ppm. It is important to note that the separation of the two peaks of each doublet is always kept constant in hertz, a behaviour expected for a doublet arising from a scalar J-coupling. This peak separation cannot be explained by residual quadrupolar splittings (dipolar/quadrupolar second order cross terms) that must be associated with a peak splitting in hertz inversely proportional to the external magnetic field, but this effect was not observed.
Two lattice models were suggested for the crystal structure of petalite. A model with four tetrahedral sites could be associated with the 29Si spectra at low magnetic fields formed by four independent resonances from Si atoms according to the Pa model of Libeau 1961 [31]. However, the 29Si spectra at various magnetic fields indicate that the four lines are actually two doublets arising from a J coupling of 41 Hz ± 3 Hz and hence only two spectroscopically-distinct tetrahedral sites for Si atoms are present. The exact origin of those doublets is unclear, since a J coupling with neighboring 29Si should still show a sharp peak (natural abundance 4%), the one with 27Al (I = 5/2) should show six lines, and the splitting disappears under 29Si{27Al} cross polarization, which selects the 27Al central transition. Nevertheless, these NMR results support a P2/a model for petalite [35,36,37,38,39,40]. The line positions of these two resonances according to DFT calculations appear at −111.51 ppm and −113.3 ppm from the Si2 (4g) and Si1 (4g) sites, respectively. The P2/a model involves Si(1)–O(1)–Si(1) bond angle equal to 180°, which is generally considered an unfavorable and anomalous configuration, and a lower symmetry was proposed to avoid such structure [31], suggesting a crystal structure with Pa symmetry that results in four tetrahedral sites for Si atoms. However, this 180° angle could be very stable as it does not change even at high-pressure single-crystal XRD experiments up to 5 GPa [58]. The 27Al, 7Li, and 6Li spectra (Figure 9b–d) are also consistent with the P2/a monoclinic models as one atomic site is resolved for Al atoms, and similarly, one atomic site is inferred for Li atoms. The 27Al spectrum can be simulated with δiso = 59.0 ppm, CQ = 4.6 MHz, and η = 0.54, resulting in similar values in DFT calculations with δcal = 58.76 ppm, CQ = 4.9 MHz, and η = 0.4. The 6Li signal was reproduced with a Gaussian curve at 0.19 ppm and line width of 0.15 ppm. The 7Li signal was simulated with a single Voigt profile (G/L = 0.36) having δiso = 0.3 ppm, Δδiso = 0.68 ppm, CQ = 20.8 ± 0.03 kHz, and η~0.0, consistent with δcal = −0.09 ppm and CQ = 13 kHz DFT calculated for the Li1(2e) site of the P2/a model [36].
Note that the petalite structure has been traditionally described as a structure formed by five-membered rings of Si atoms in tetrahedral sites, but it also can be described by means of six-membered rings composed by five Si atoms in tetrahedral sites connected by a double tetrahedra sharing an edge occupied by Al and Li atoms, according to the available lattice models [30]. Such proximity between Li and Al atoms explains the positive chemical shift value in the 7Li spectrum of petalite in comparison with the negative values in the other phases, as it was also found in Li-rich α-quartz (Figure 2), where Li atoms are supposed to be located at the center of the hexagonal channels, from available XRD methods. Hence, perhaps a similar local compensation of charges occurs in petalite and α-quartz, where nearby Li and Al atoms behave in the same way as a Si atom.

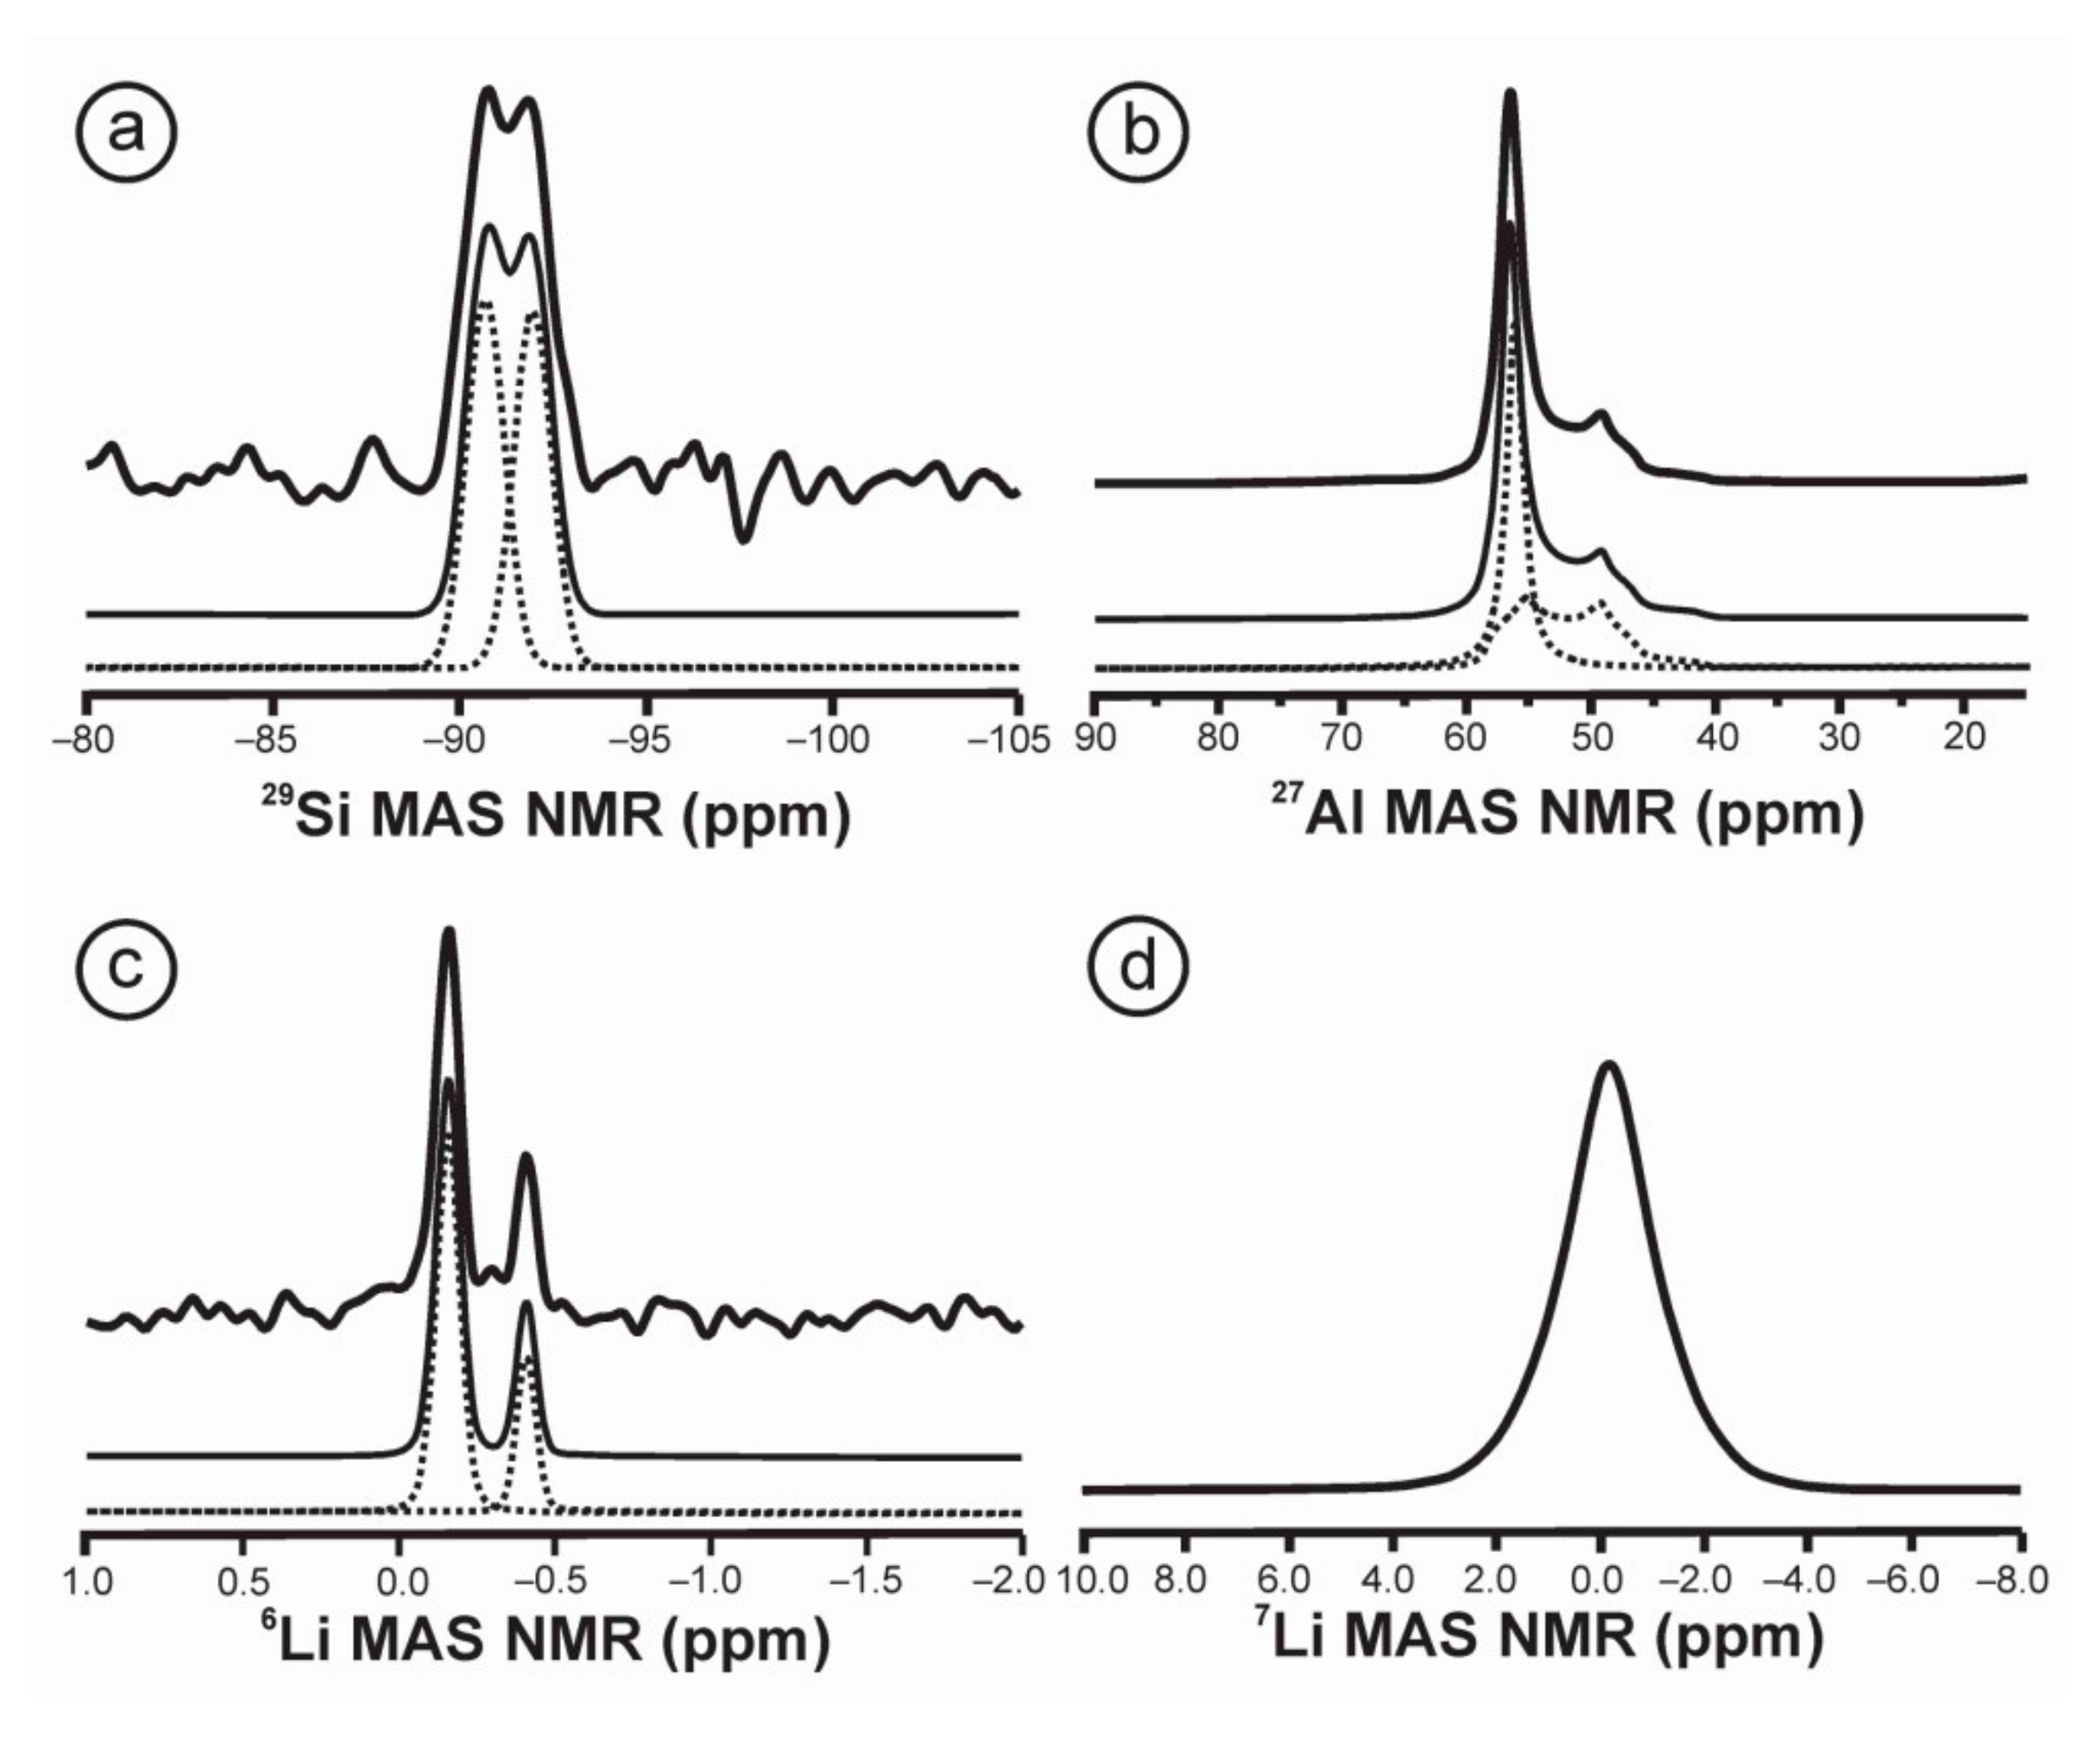
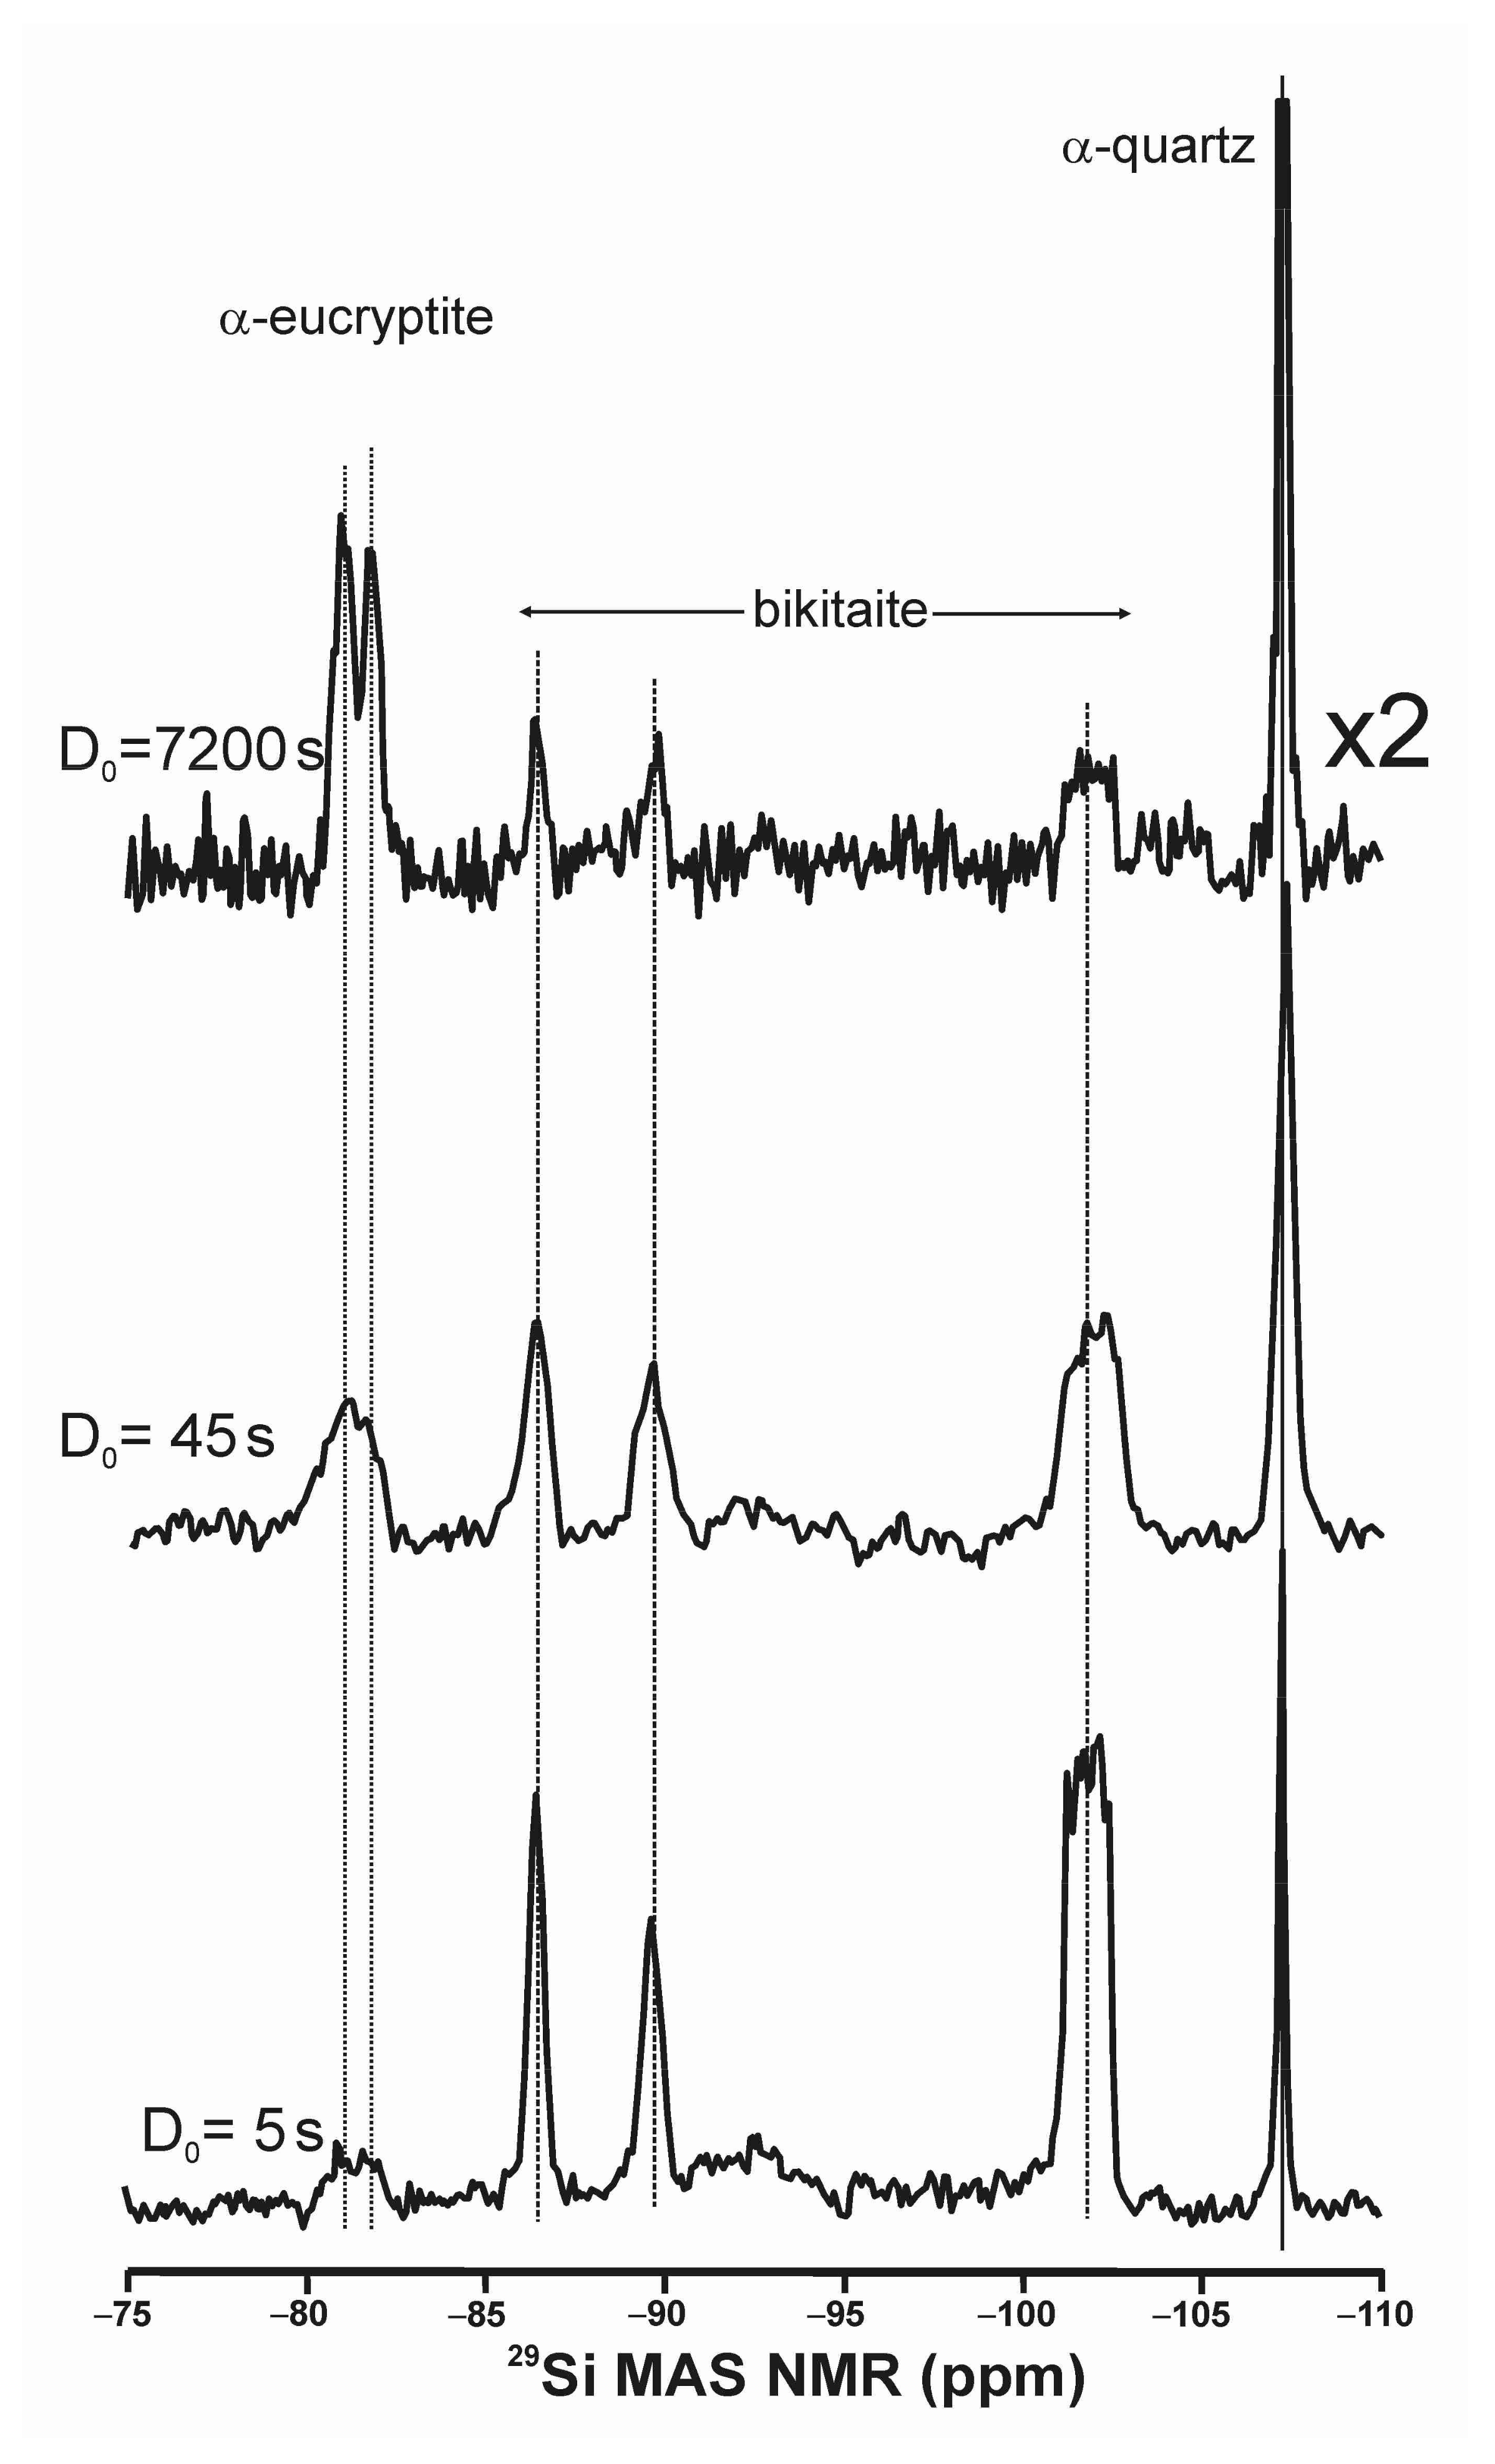
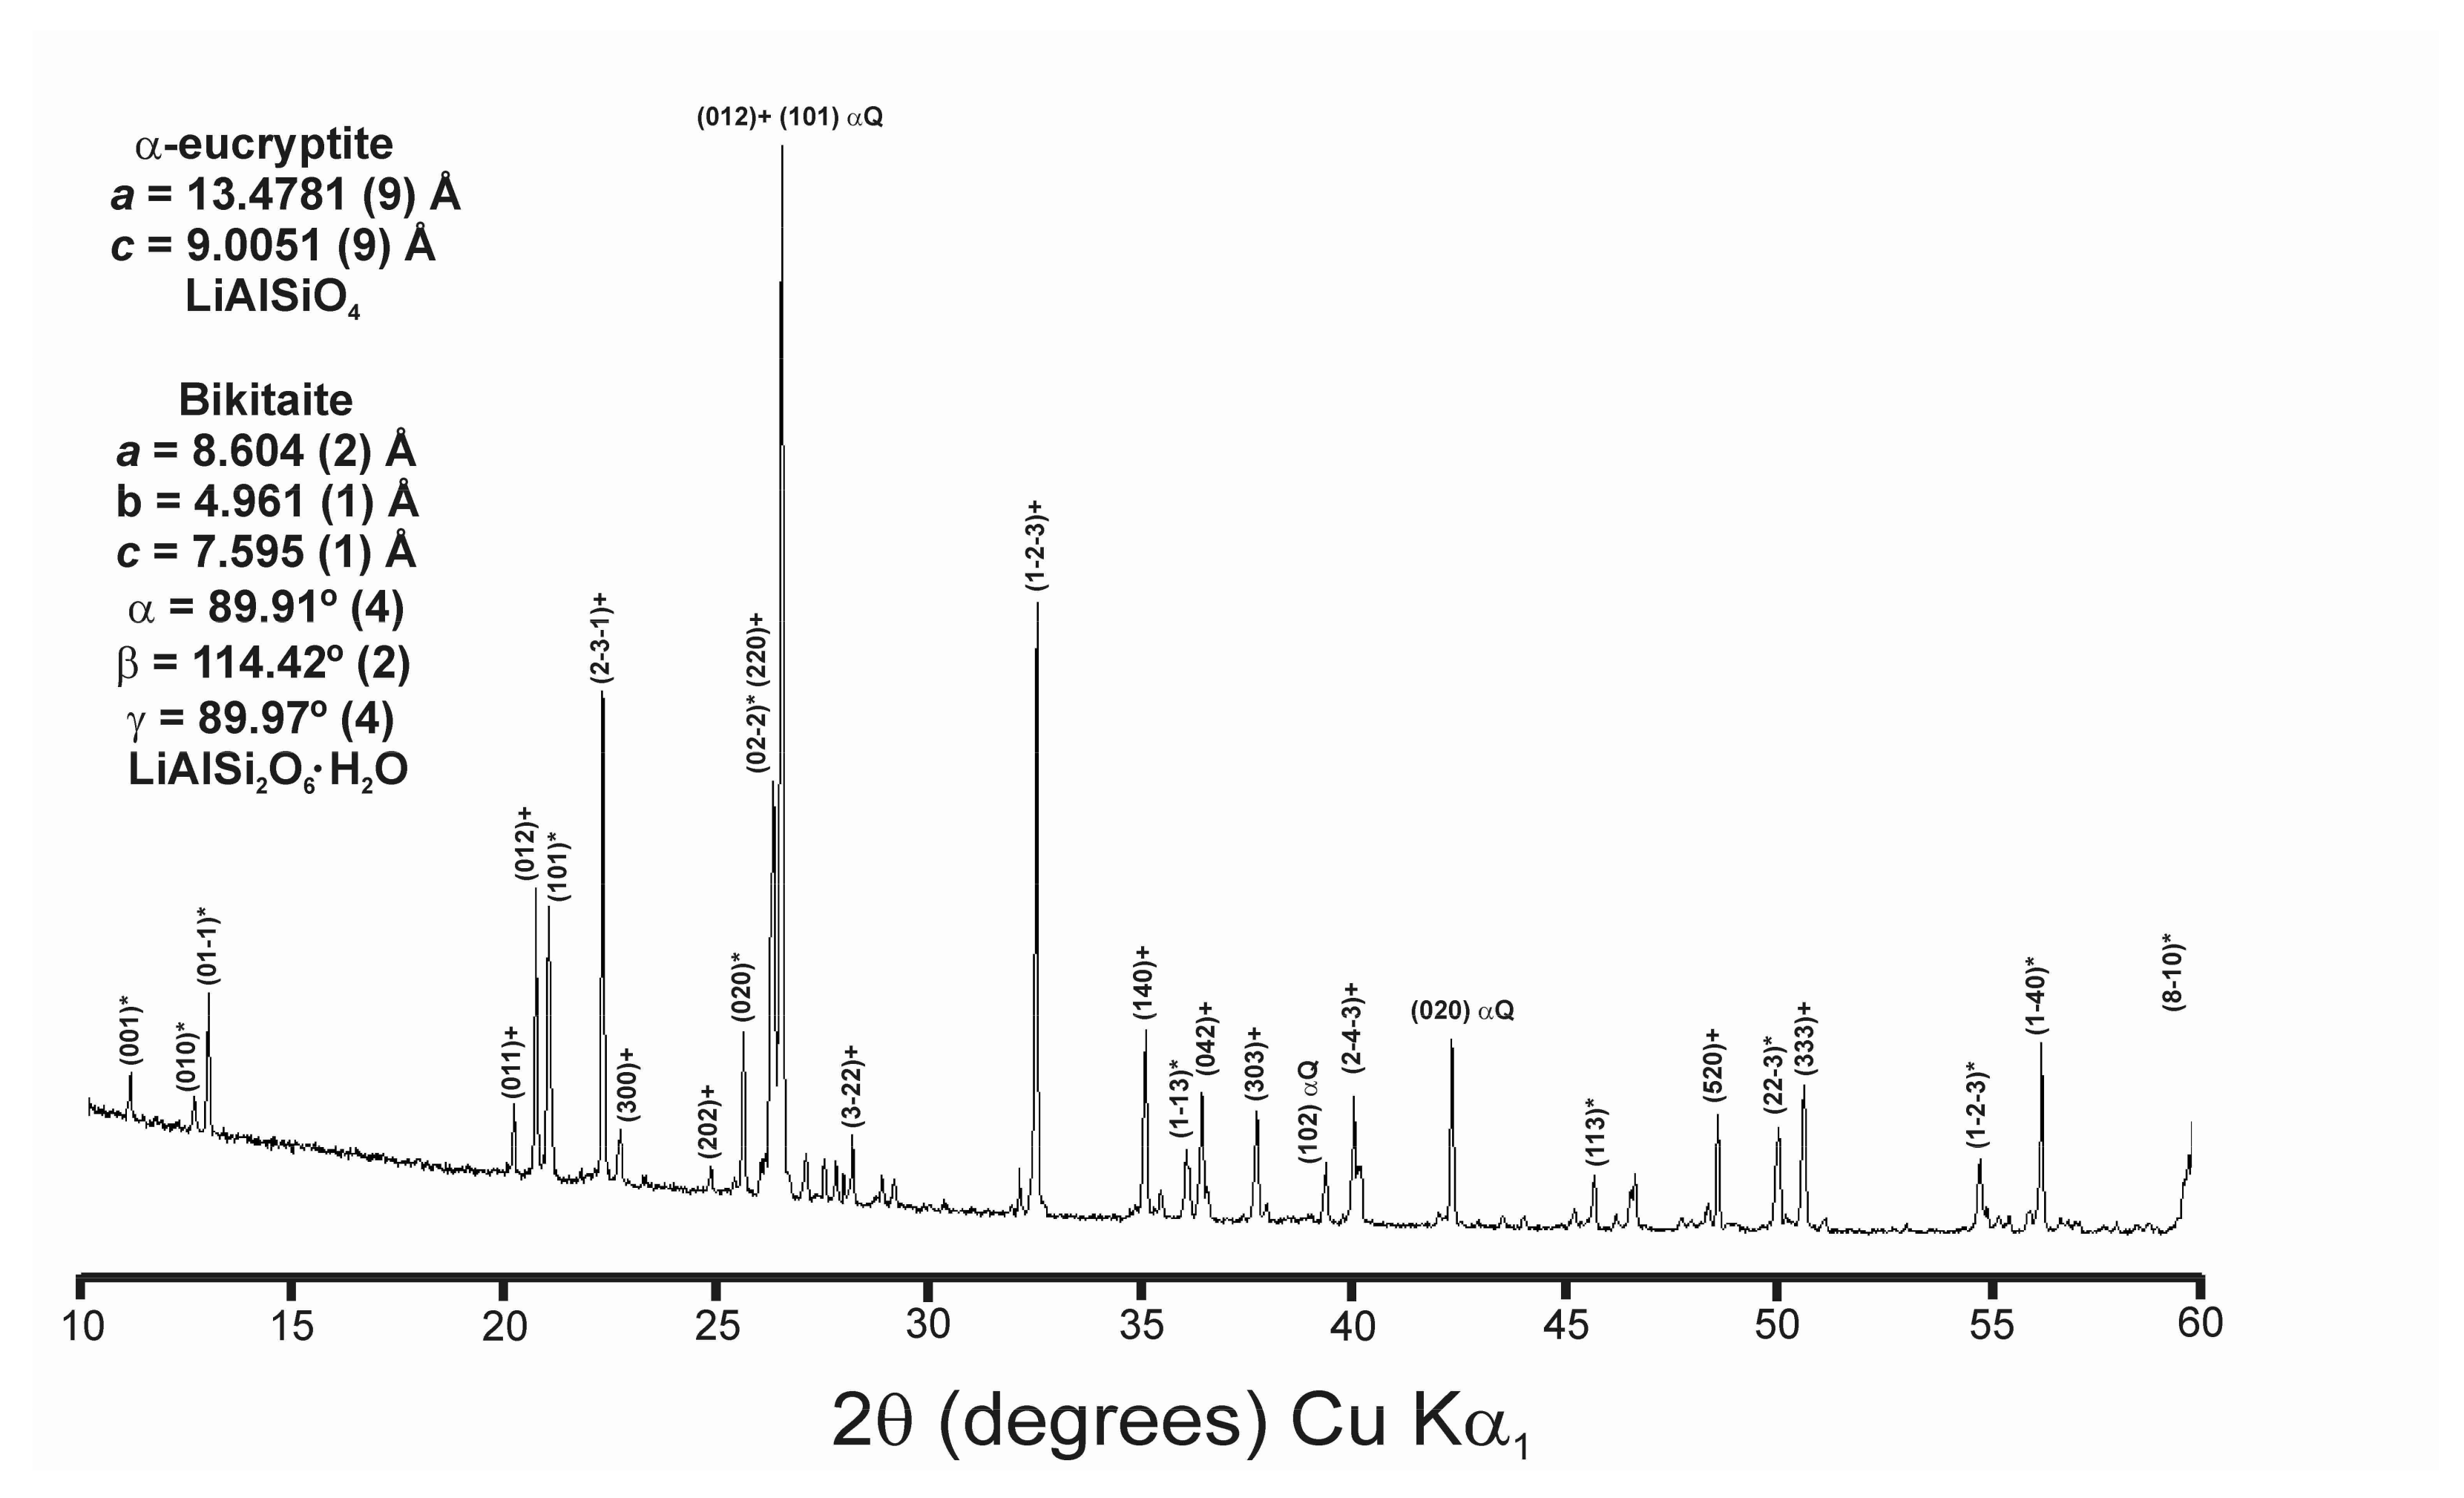
3.8. α-Eucryptite LiAlSiO4 and Bikitaite LiAlSi2O6·H2O

Figure 12 shows the 29Si spectra of specimen Bikita formed by a mixture of three minerals, i.e., α-eucryptite, bikitaite, and α-quartz SiO2, having a very dissimilar relaxation behaviour in NMR experiments. Three spectra at very different recycling time values are compared to show the variations of the intensities of the different signals, increasing the relative intensity of the two resonances of α-eucryptite with an increase of the recycling time, in relation to the other resonances of bikitaite. The two resonances of α-eucryptite appear at δexp of −81.1 ppm and −81.9 ppm, corresponding to sites Si2 (9b) and Si1 (9b) in the R–3 lattice model [42,57], with δcal of –77.48 ppm and −78.13 ppm from DFT software. Bikitaite shows three signals, a broad one at −101.9 ppm with double the area of the other two, which are located at −86.5 and 89.7 ppm. Hence, this 29Si spectrum cannot be correlated with three tetrahedral sites for Si atoms and P21 symmetry [40,41], but four tetrahedral sites for Si atoms as in the P1 model [37,38,39]. This mixture of phases did not allow us an experimental determination of the NMR parameters for Al and Li atoms in the two phases from 27Al and 7Li spectra.

4. Discussion

The previous results can be useful to understand the behaviour of crystal structures of the LAS system in three different conceptual contexts, i.e., (i) the identification of crystal structures from NMR compatible with the available lattice models from XRD; (ii) the observation of crystallization sequences with increasing order and stoichiometric compositions; and finally, (iii) the contrasting description of the crystallization progress from thermodynamic and kinetic approaches.
First, the determination of lattice models in the mineral phases of the LAS system is difficult because of intrinsic experimental difficulties, related to the low X-ray scattering factor of Li atoms due to few electrons and also because Al and Si atoms have similar X-ray scattering factors, in addition to difficulties in the own structures formed in the system with a wide diversity in order-disorder states and the ubiquitous formation of mixed crystals as solid solutions. Thus, a diversity of lattice models exists for each phase of the LAS system. In this work, NMR was used to identify the number of spectroscopically-distinct sites as different and discrete resonances to support one of the existing models for each phase, correlated with crystallographically-distinct sites from lattice models in long-range ordered structures derived from reciprocal-space technique. Note that average structures from lattice models acquired by XRD describe “ideal” long-range order in β-eucryptite and β-spodumene s.s. series, as strictly periodic structures. However, the NMR data indicate that only pseudo-periodic structures exist with “real” long-range disorder, as the local poly-atomic schemes do not develop periodic arrangements, and the “ideal” long-range order is derived from the averaging measurements. Short-range order is limited to the avoidance of Al–O–Al bonds, i.e., the respect the Loewenstein’s rule. It is a similar case to that found in other Q4 aluminosilicates, as for instance in orthoclase and sanidine K-feldspars [59,60].
The XRD and NMR study of the LAS system allowed us to distinguish the next different crystal structures:
  • α-cristobalite SiO2 end-member (x = 1.00) and α-cristobalite s.s. for 0.75 ≤ x < 1.00 were derived from the crystallization of the β-phase at T ≥ 1000 °C, which suffers a displacive β α transition on cooling. At room-temperature, the members of the solid solution are strictly pseudo-periodic, despite it is possible to describe their powder X-ray diffraction pattern with an average structure derived from the P42212 space group of α-cristobalite SiO2 end-member (Figure A8).
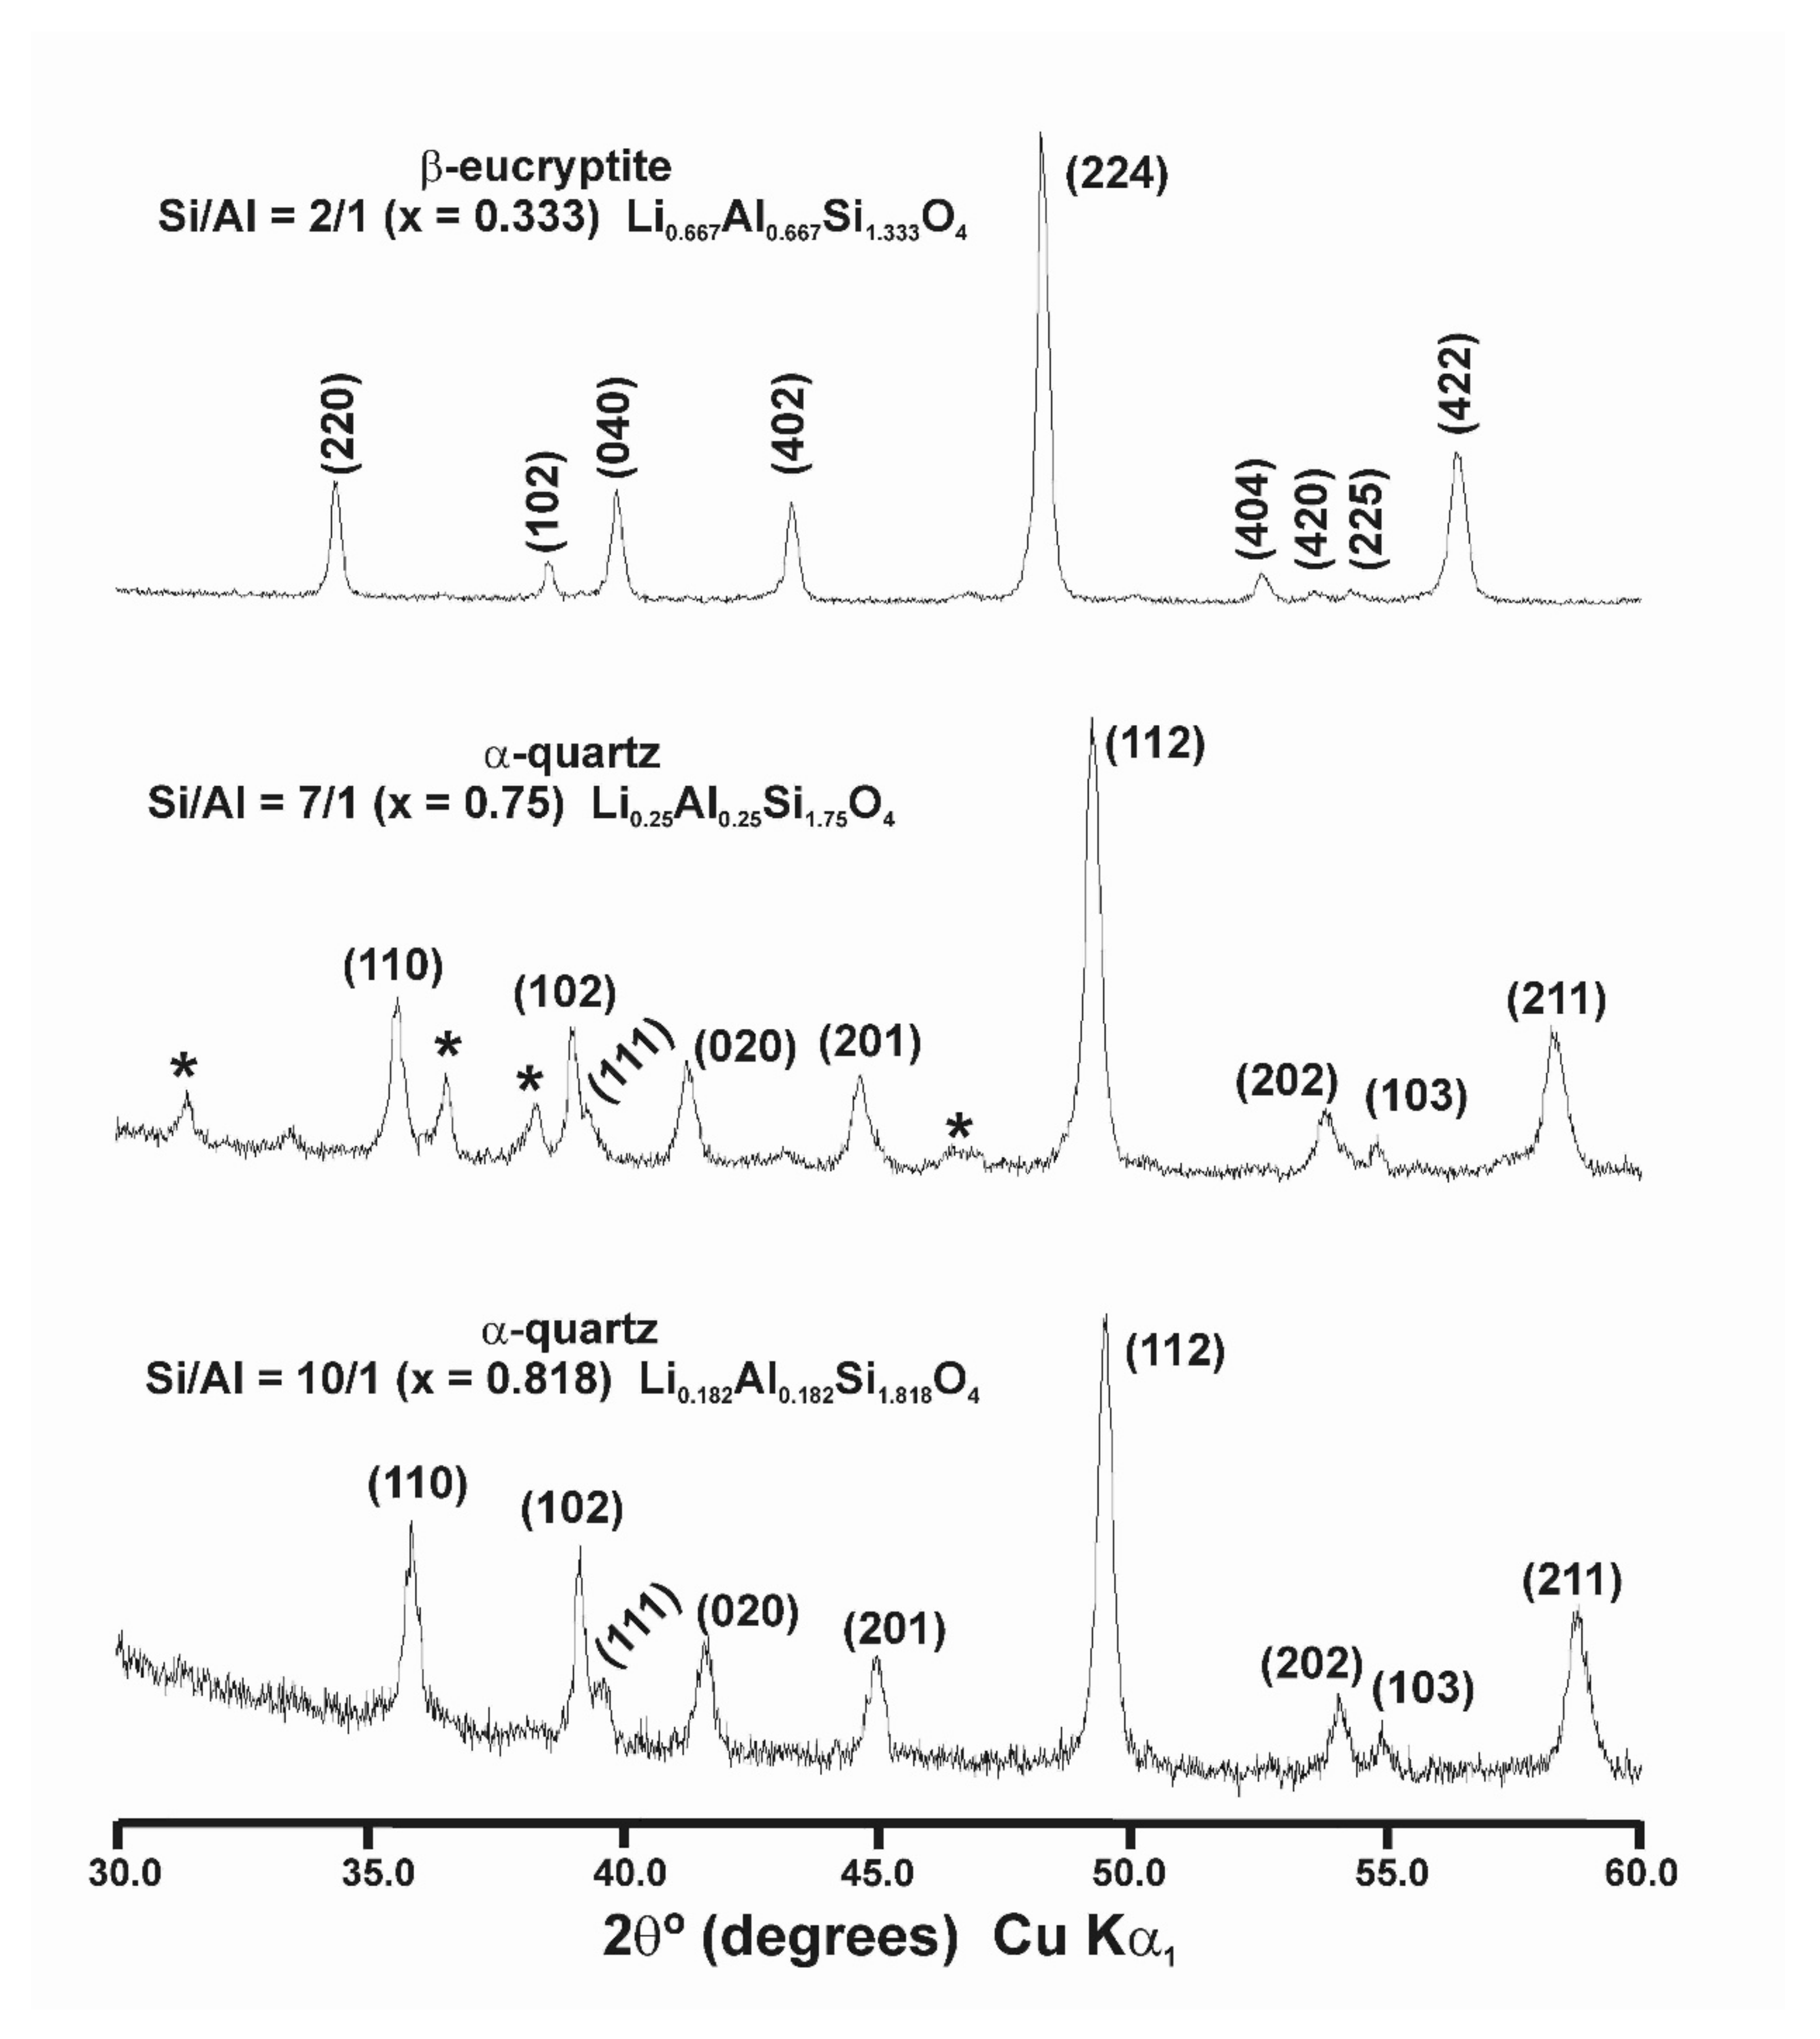
  • α-quartz SiO2 end-member and α-quartz s.s. for 0.75 ≤ x < 1.00 SiO2 were derived from the crystallization of the β-phase at T > 675 °C, which suffers a displacive β α transition on cooling, and thus, were detected at room-temperature. The members of this solid solution are strictly pseudo-periodic, despite it being possible to describe its X-ray diffraction pattern with an average structure derived from the P3221 space group of α-quartz SiO2 end-member (Figure A4 and Figure A6). The solid solution is limited at high pressure but evident at 1 atm.
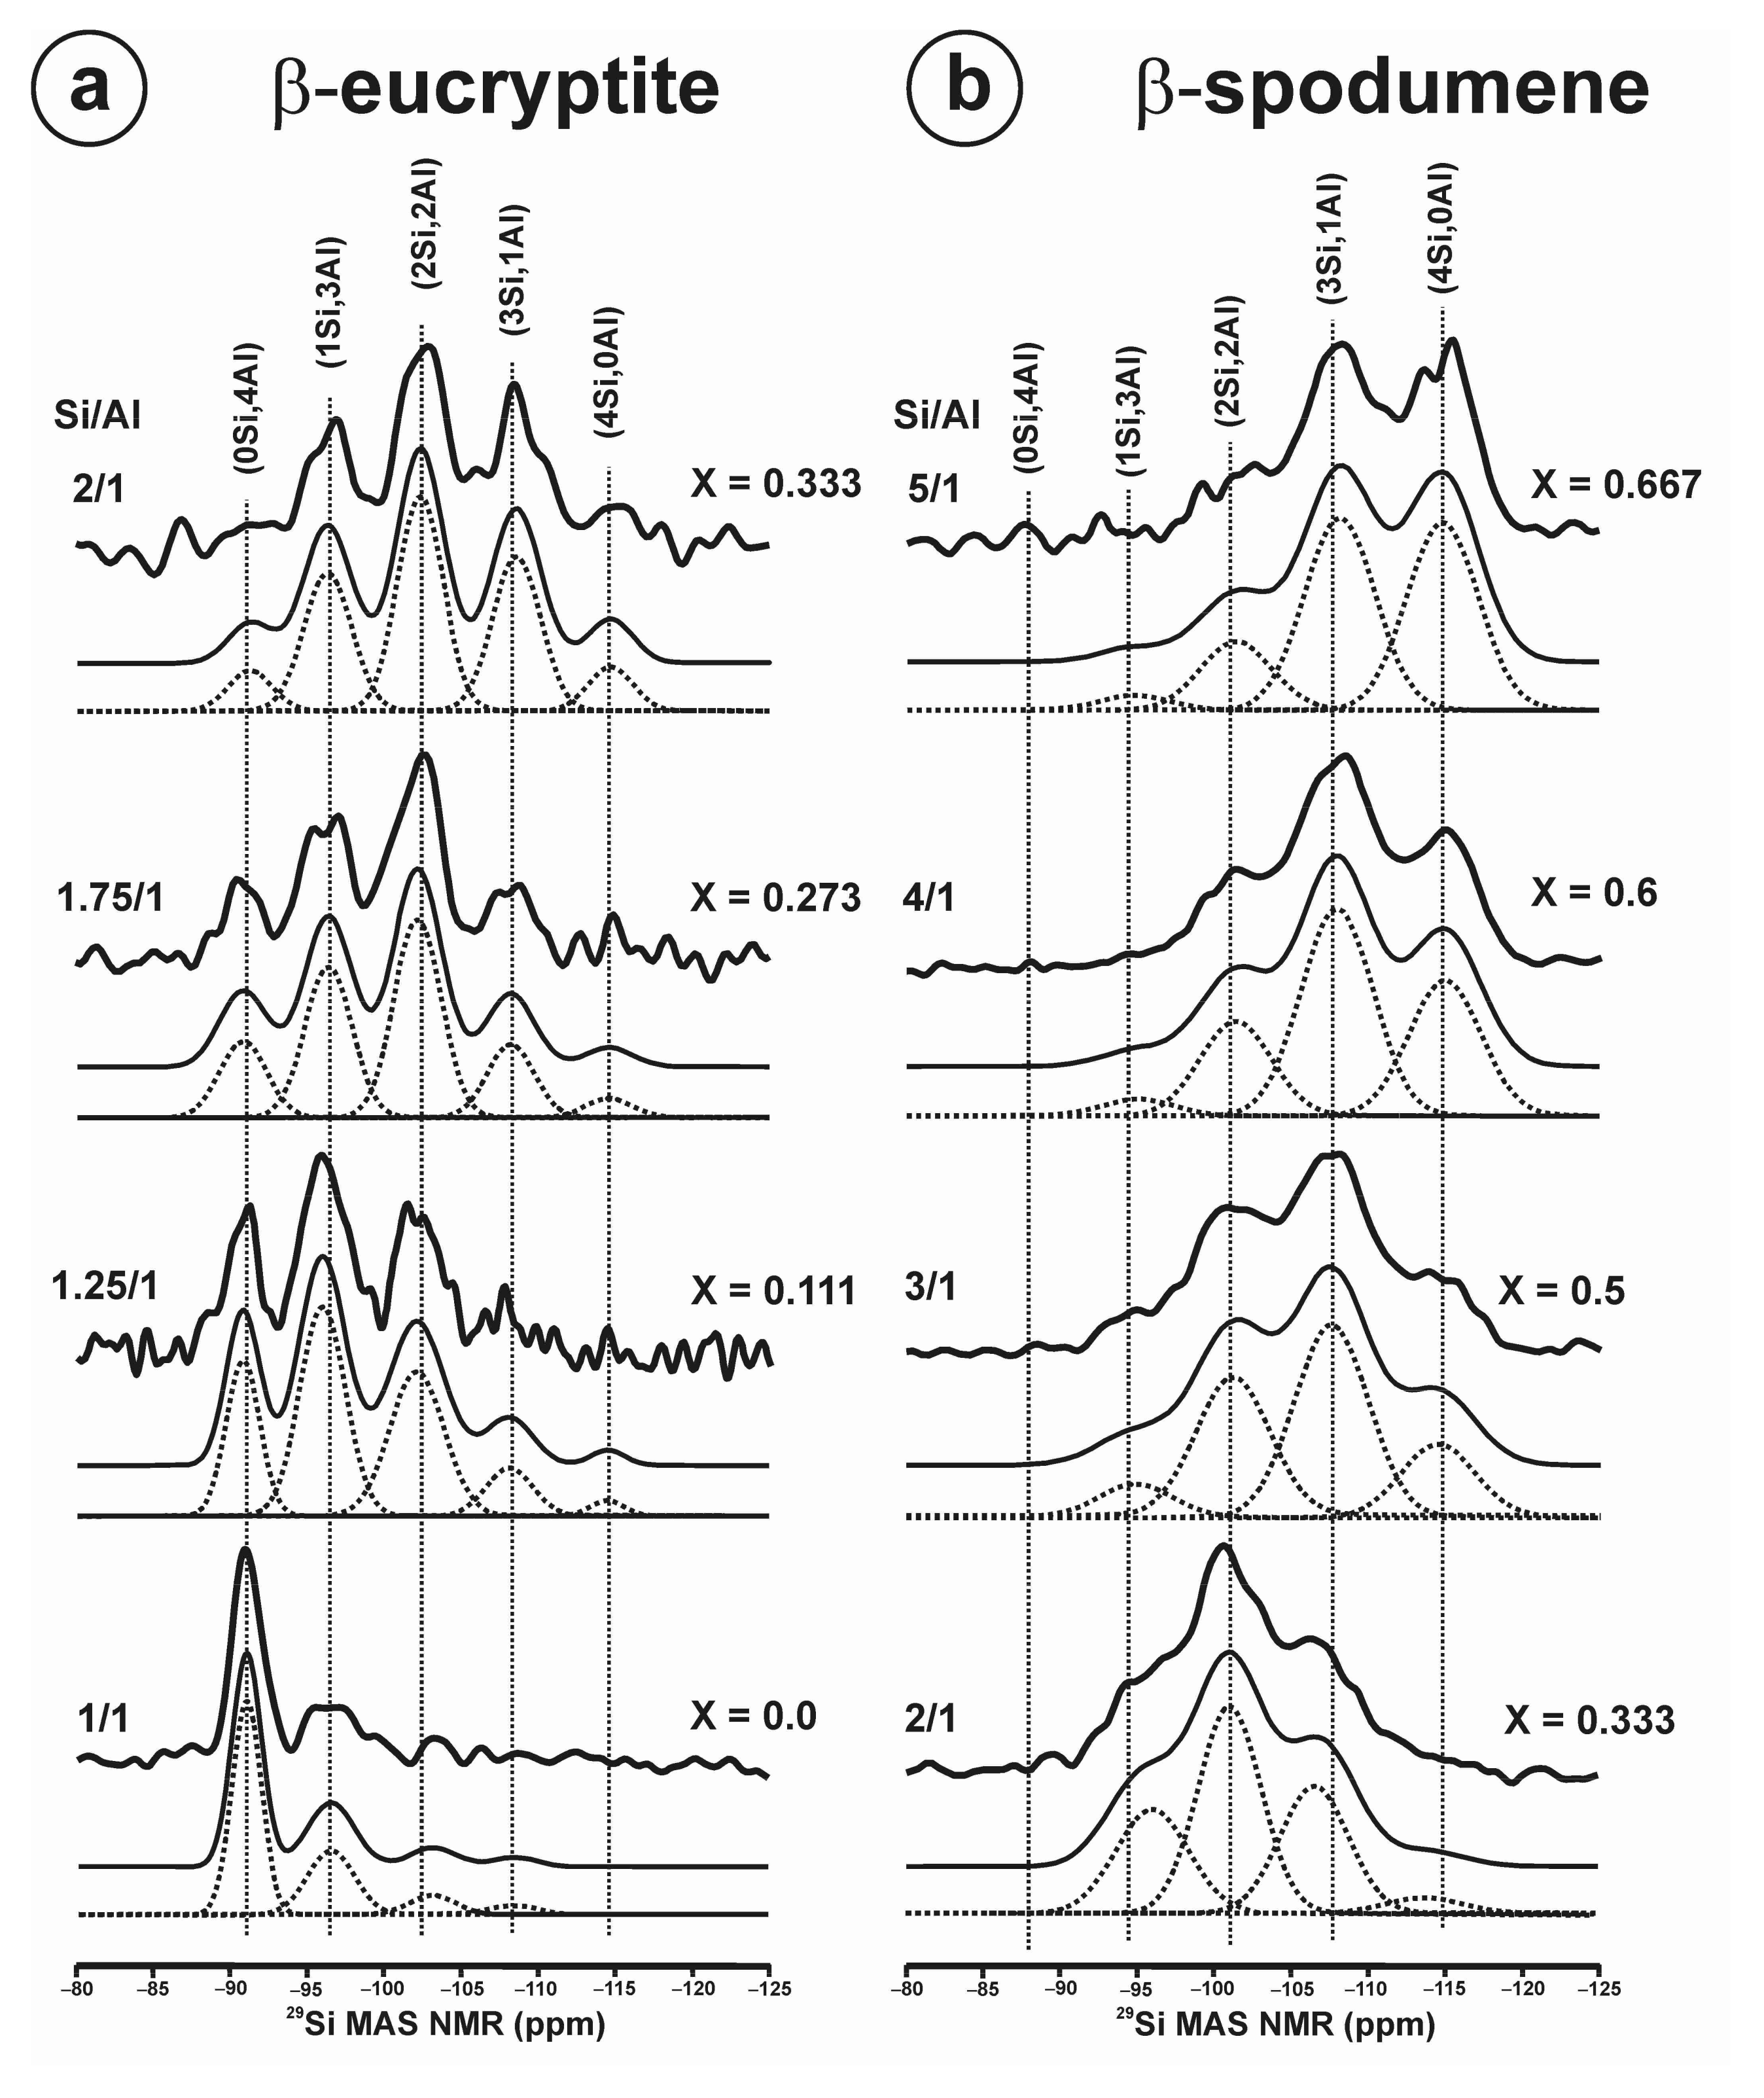
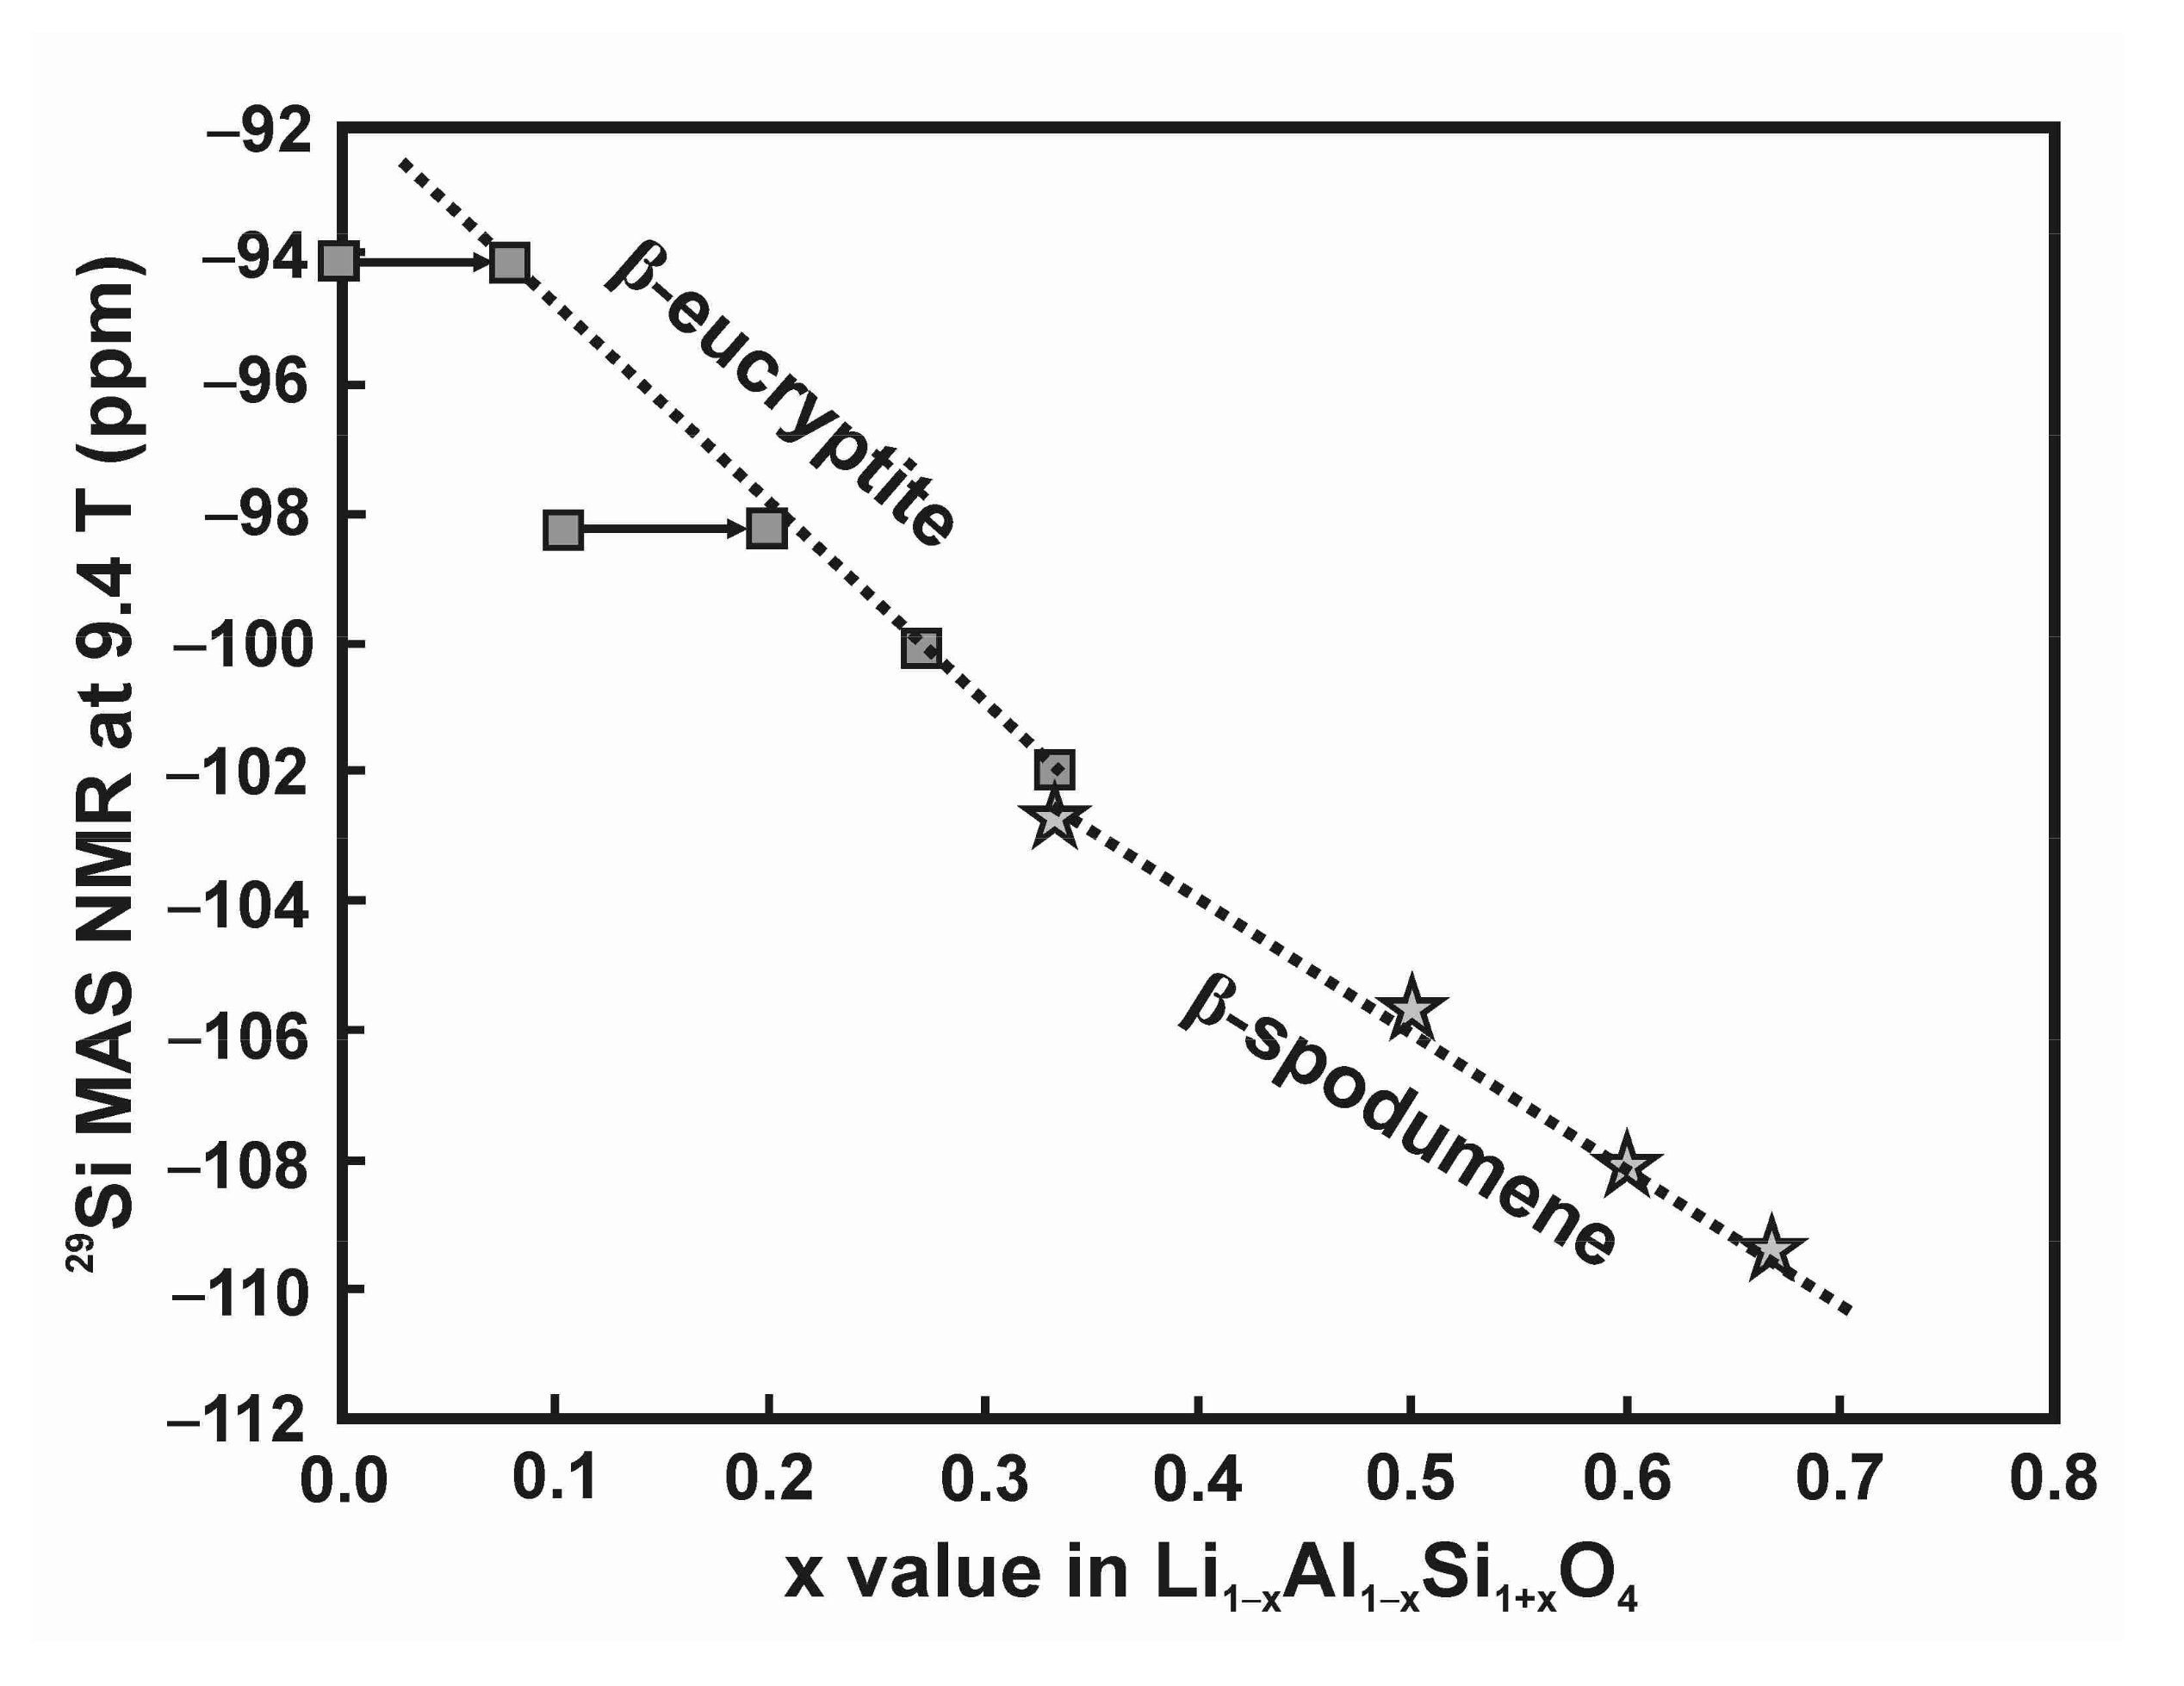
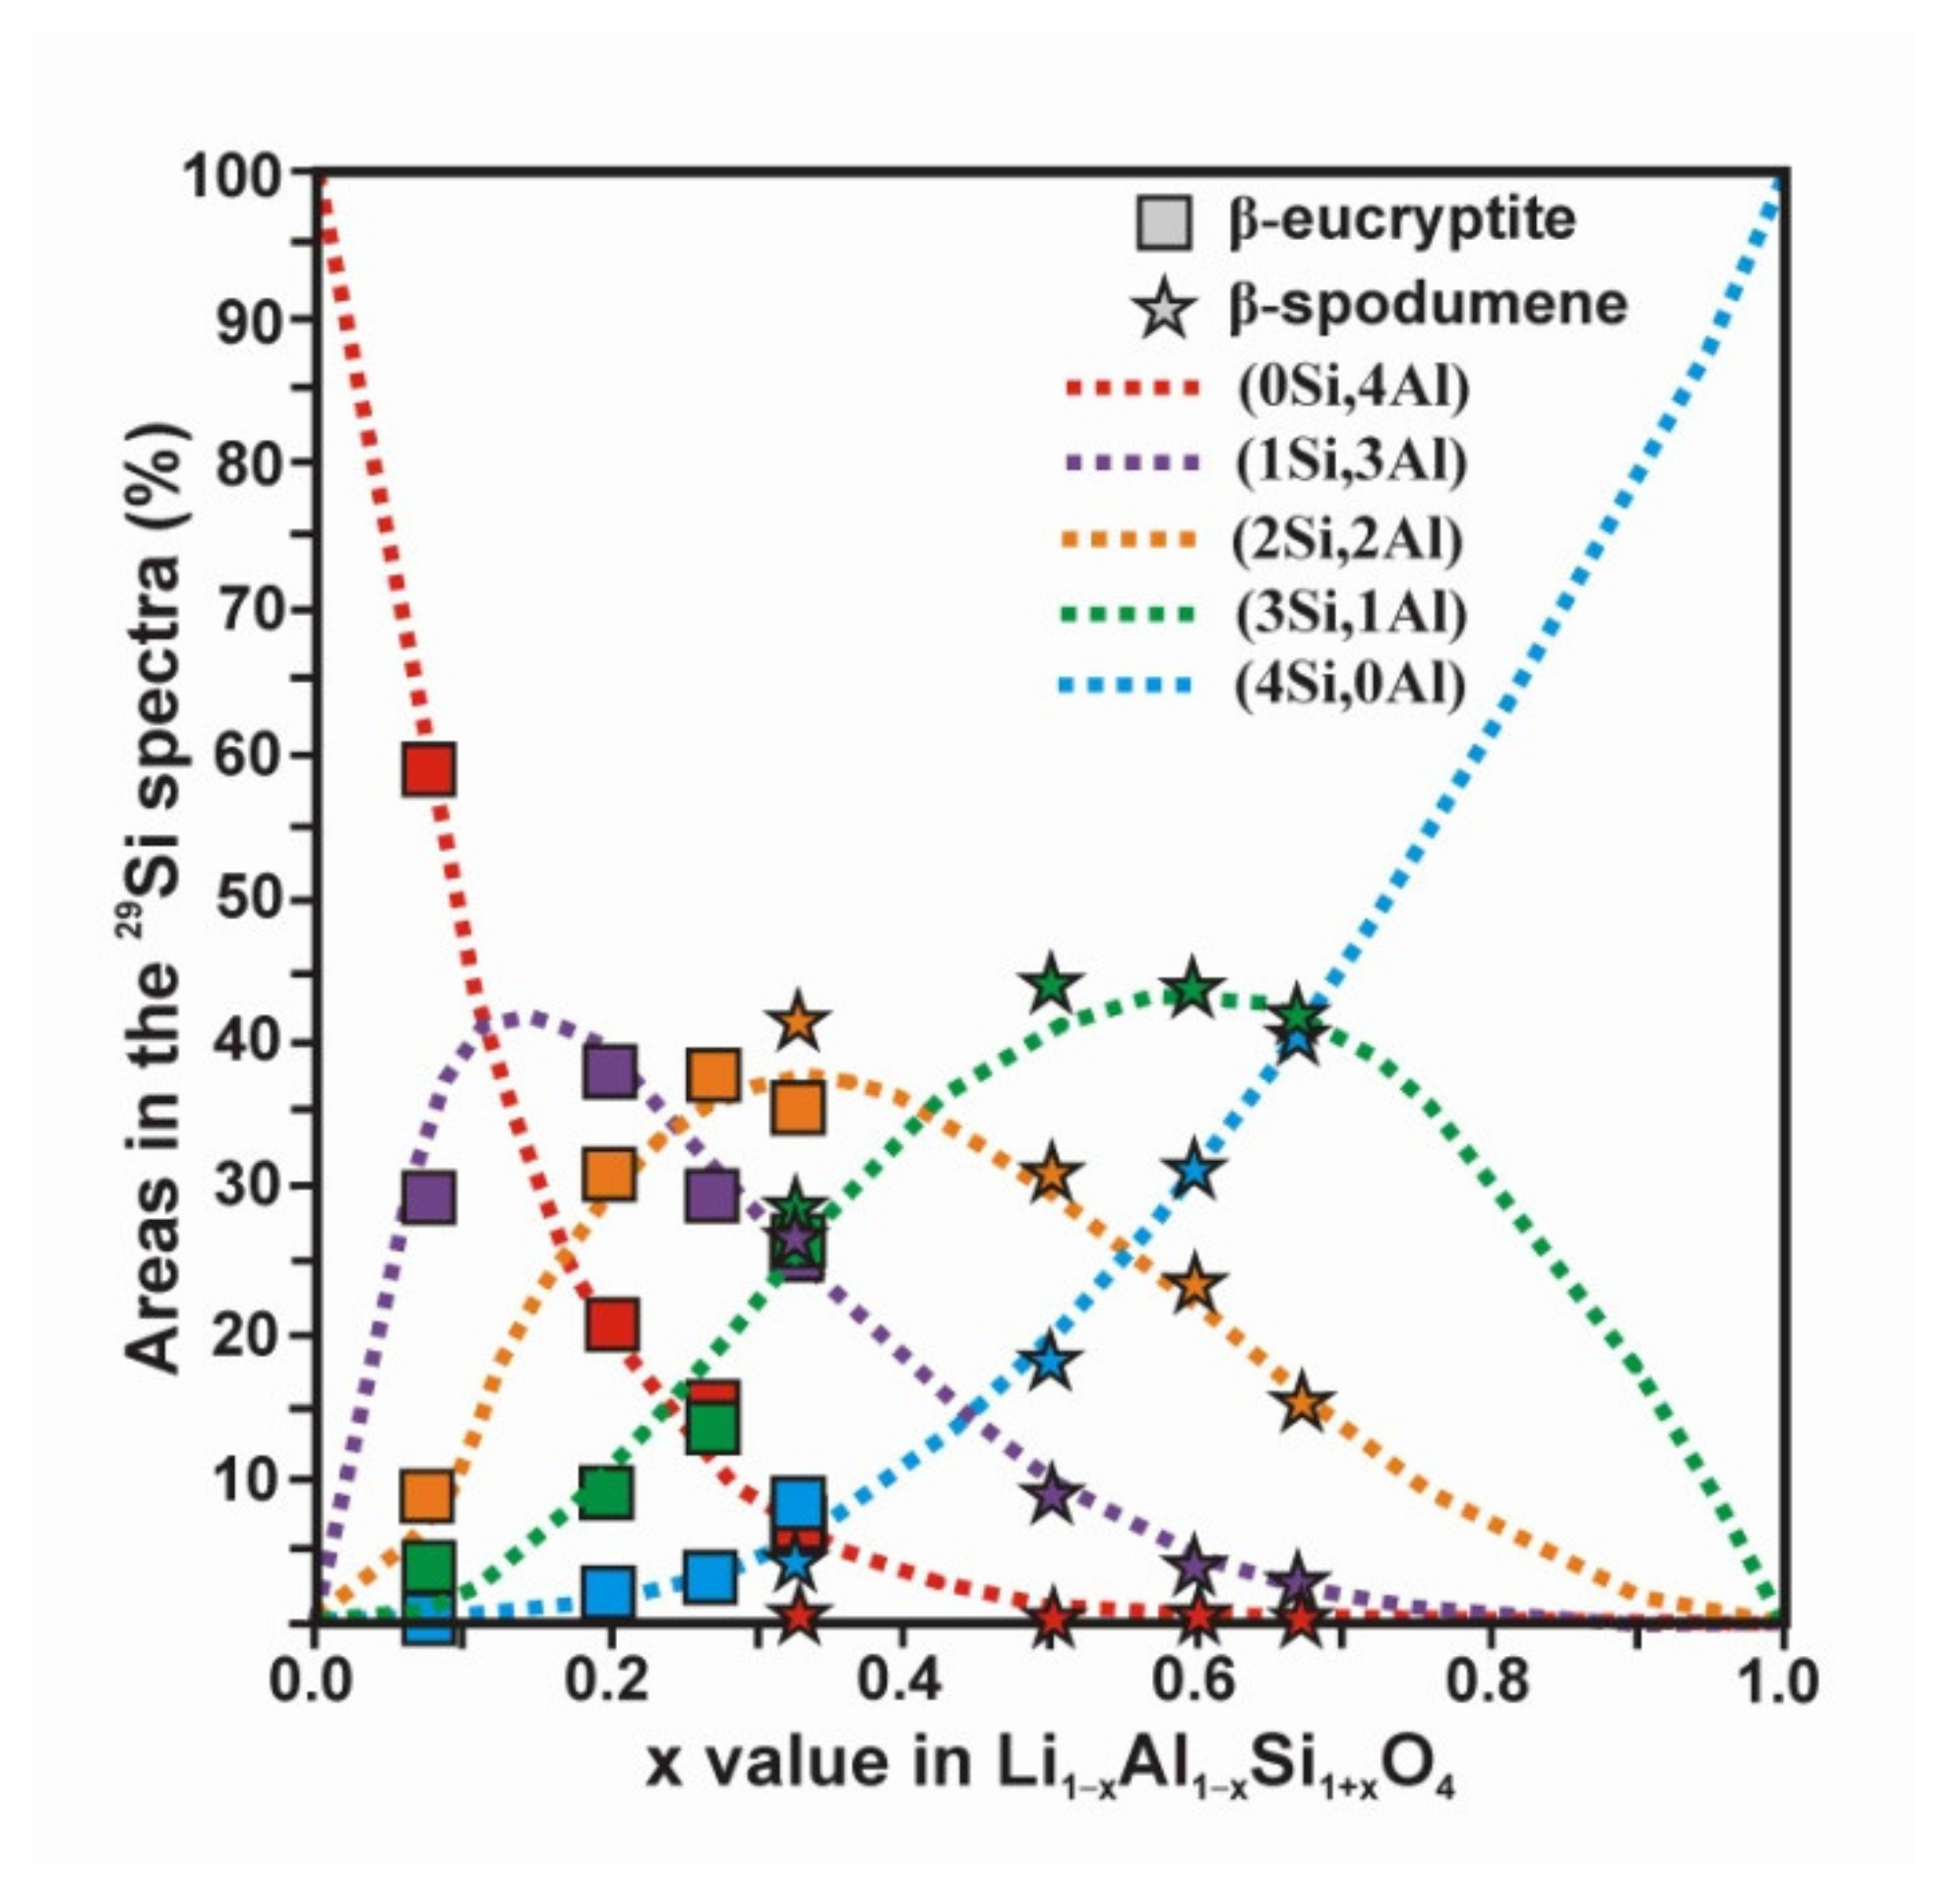
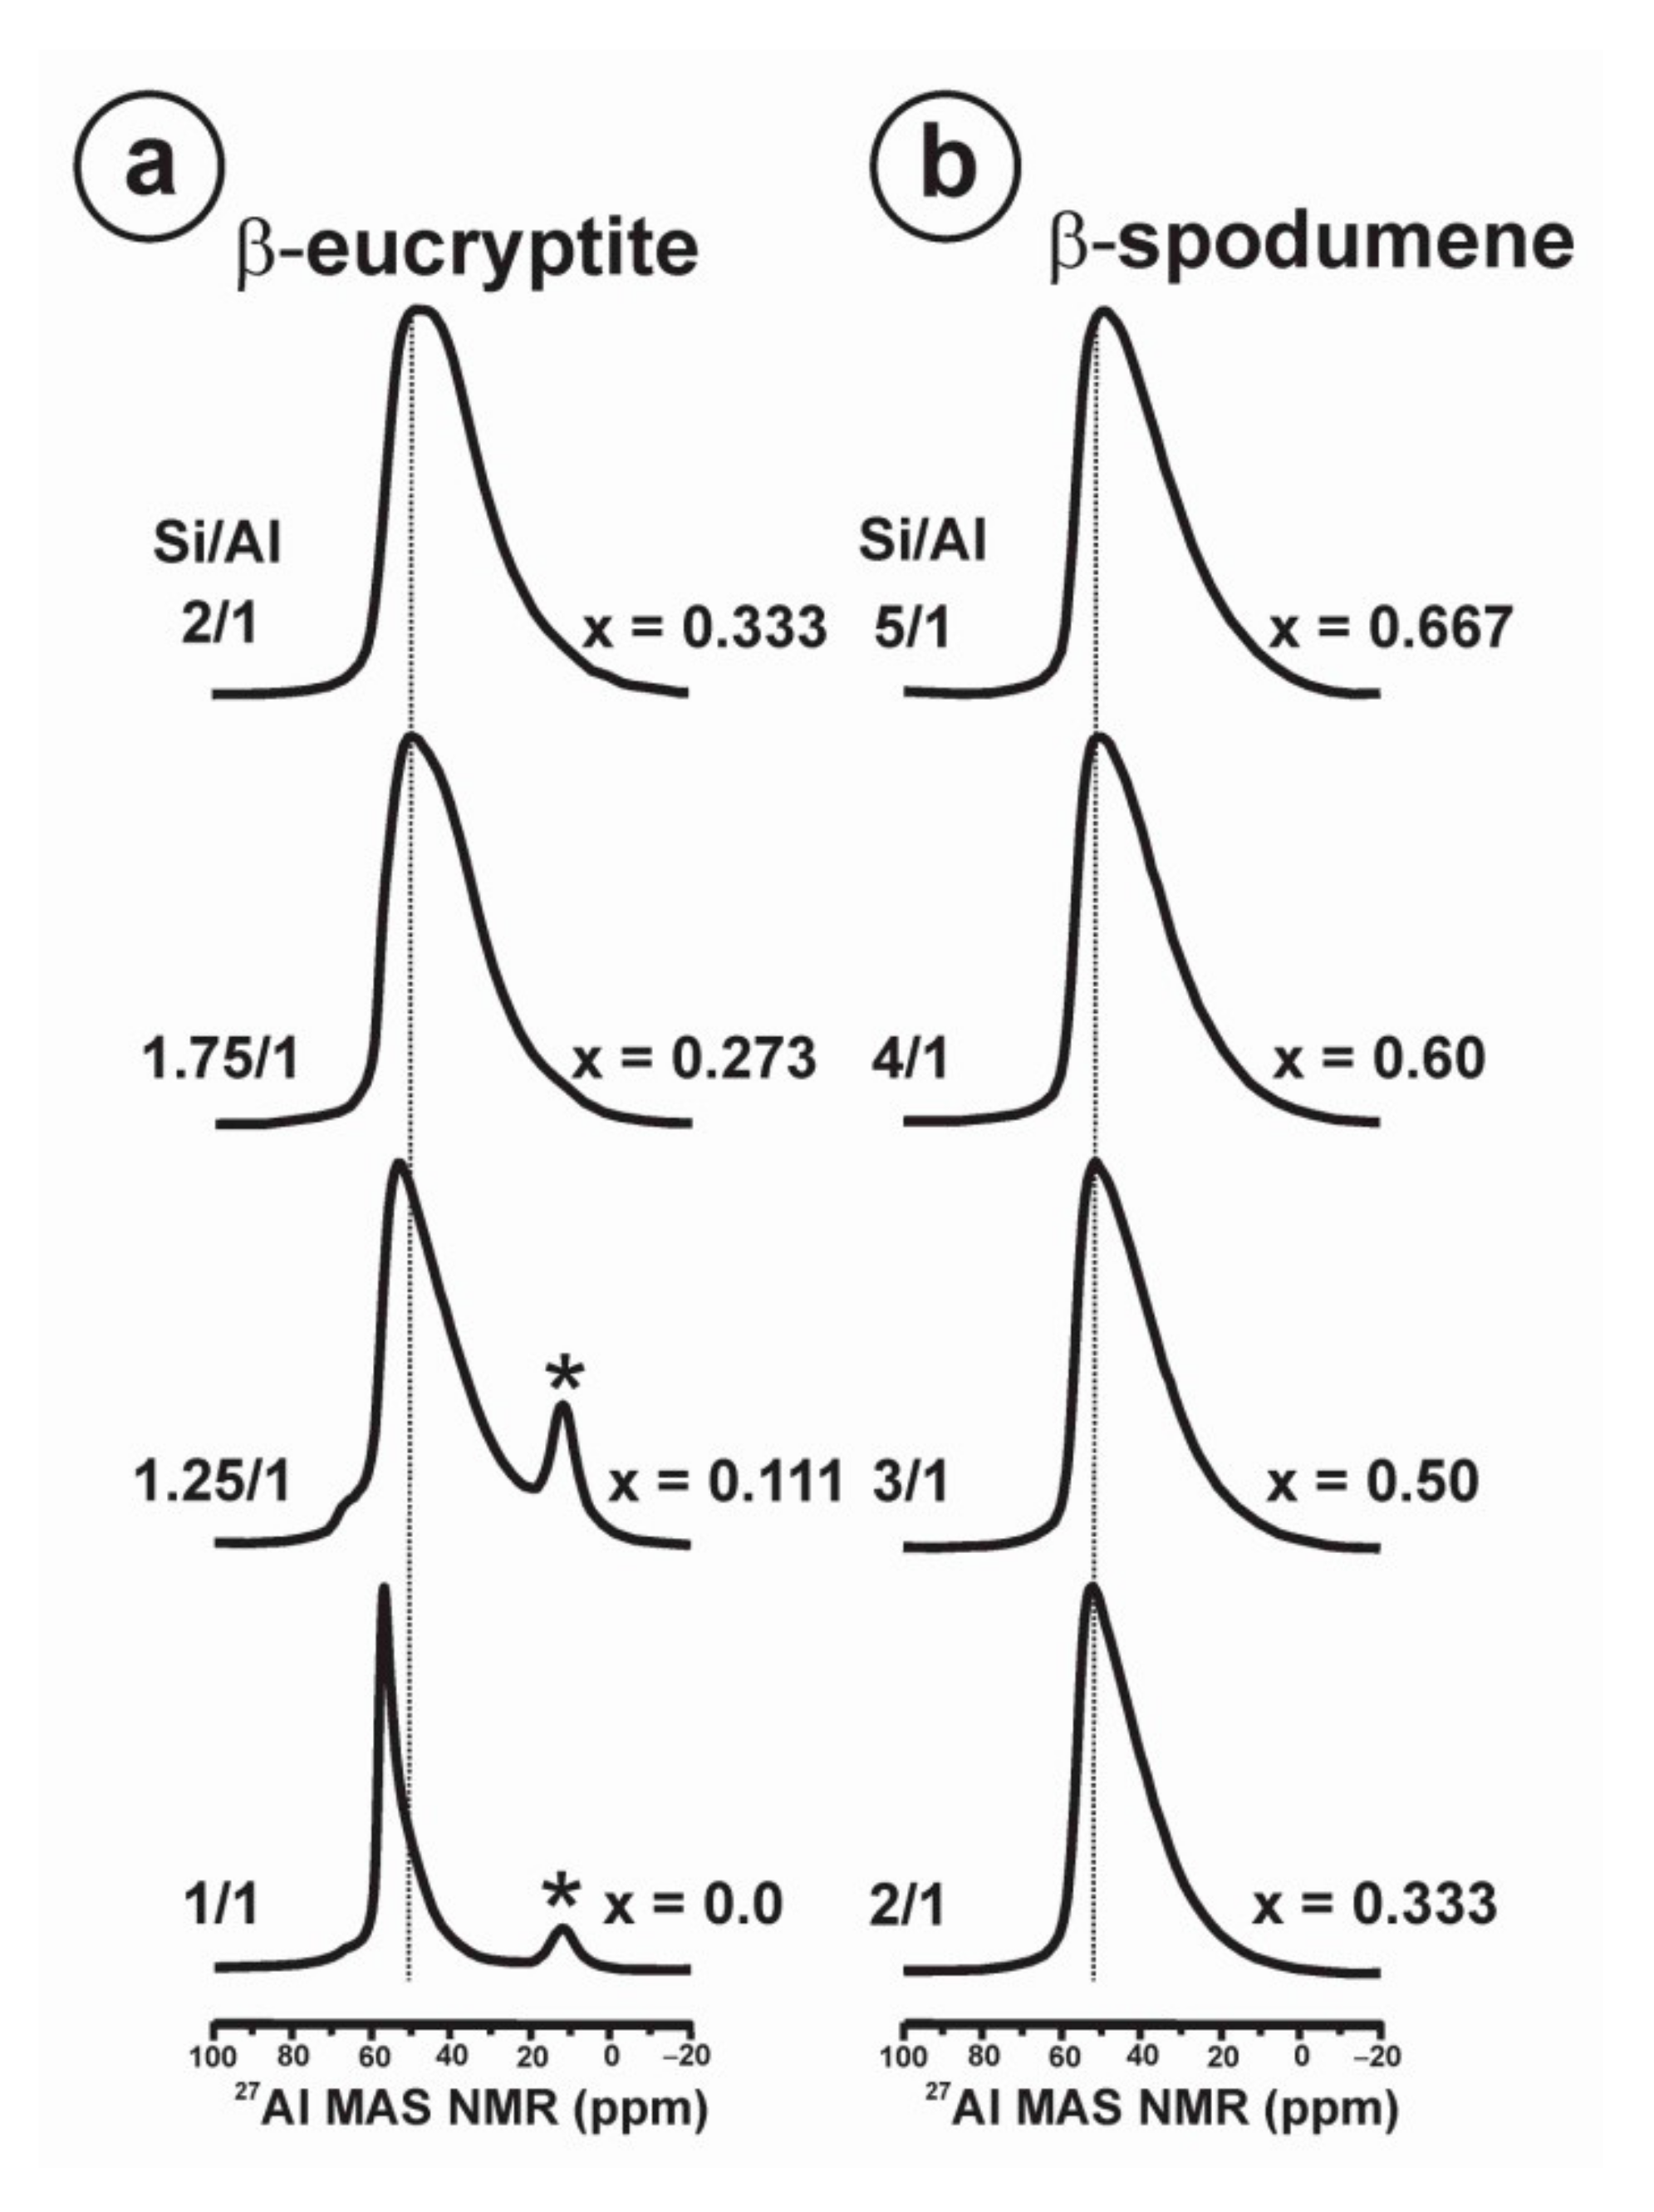
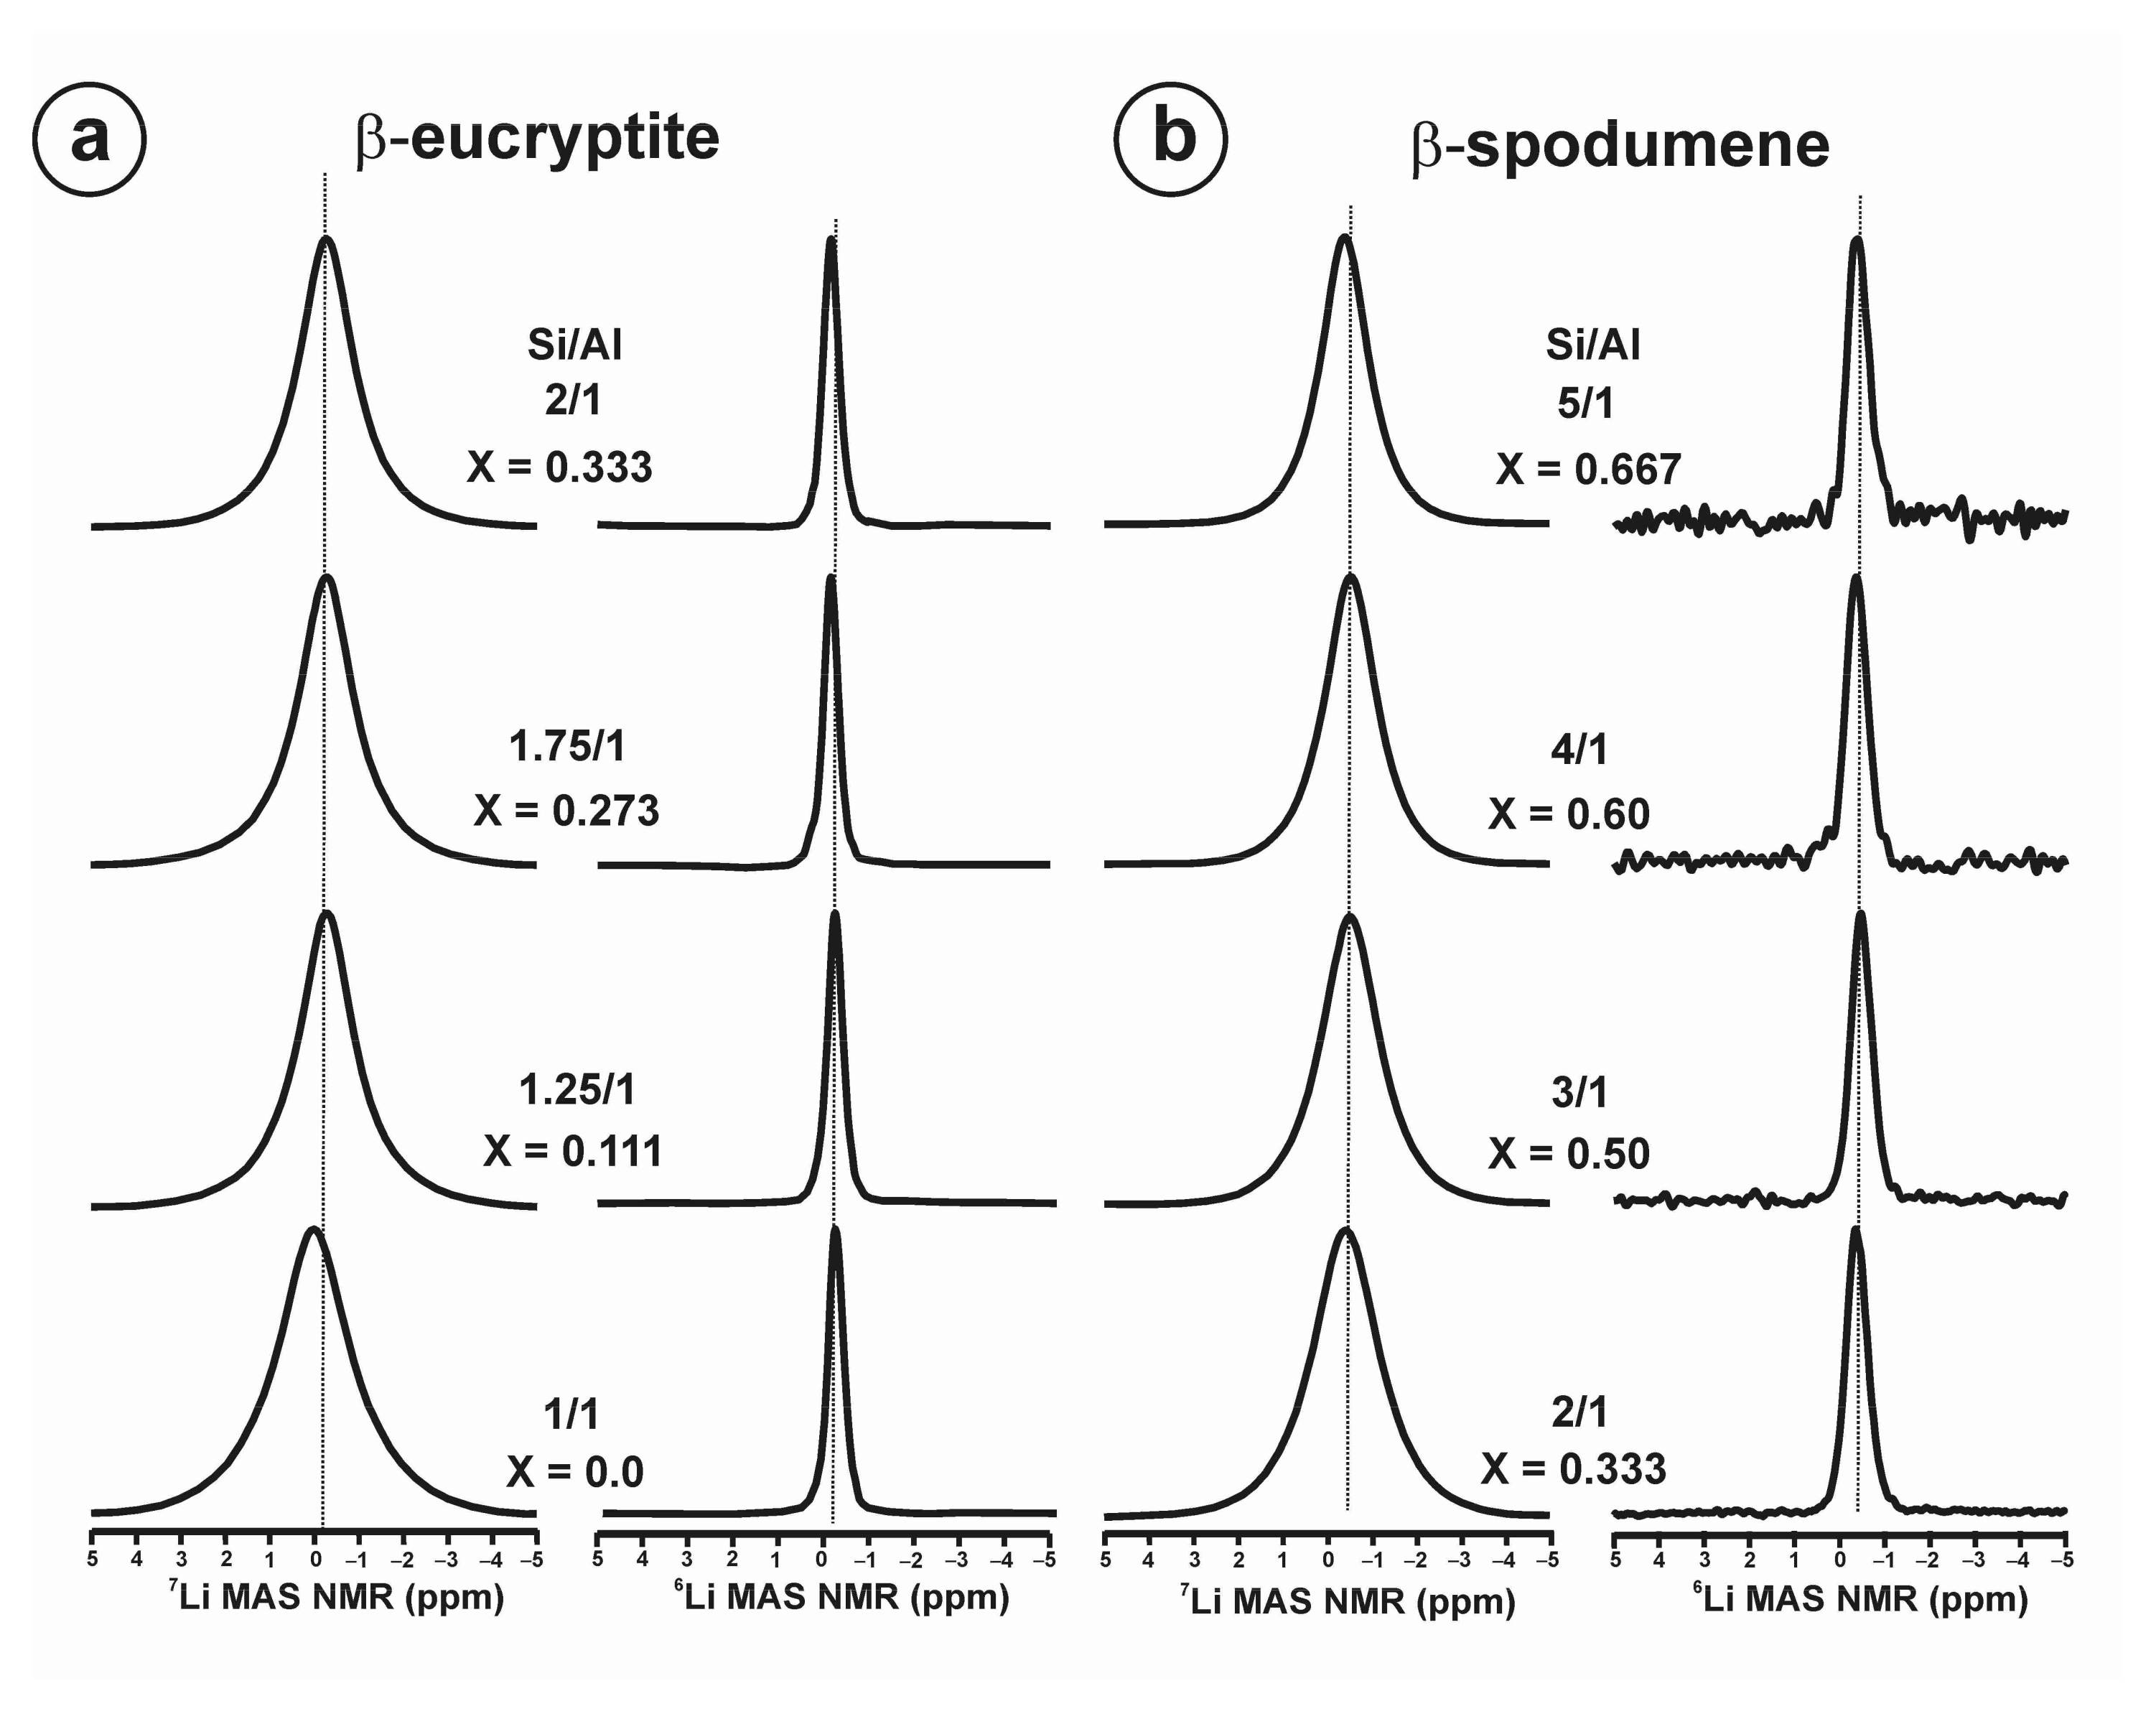
  • β-eucryptite s.s. series for 0.0 ≤ x < 1.0 is formed at high temperatures, and it is observed at room temperature when the β α transition is avoided on cooling. At room-temperature, the stuffed derivative of the β-quartz structure is evident mainly for x < 0.50 from XRD (Figure A5 and Figure A6), despite the members of the solid solution are strictly pseudoperiodic. An ordered state of the local scale is compatible with the Loewenstein’s rule. Only a single site distribution is resolved for Si and Al atoms and two site distributions are resolved for Li atoms by NMR.
  • β-eucryptite LiAlSiO4 end-member (x = 0), crystallized at 1000 °C and 3 kbars, has a fully ordered local structure from NMR that is compatible with the long-range P6422 space group from XRD [12]. Hence, short-range order and long-range order are equivalent, because the local poly-atomic schemes are strictly periodic throughout the volume.
  • β-spodumene s.s. series for 0.0 ≤ x ≤ 1.0 have strictly non-periodic structures but a Lowenstein order state at the local scale, and only a single site distribution is resolved for Si and Al atoms, whereas at least two sites for Li atoms are resolved by NMR. This short-range structure does not correspond with any available lattice model.
  • Petalite LiAlSi4O10 mineral species have a fully ordered structure at the short-range scale from NMR, which is compatible with a long-range ordered structure with P2/a space group from XRD [30].
  • α-eucryptite LiAlSiO4 mineral species have a fully ordered structure at the short-range scale from 29Si NMR, which is compatible with a long-range ordered structure with R-3 space group from XRD [32,33].
  • α-spodumene LiAlSi2O6 mineral species has a fully ordered structure at the short-range scale from NMR, which is compatible with a long-range ordered structure with C2/c space group from XRD [34].
  • Bikitaite LiAlSi2O6·H2O mineral species have a fully ordered structure at the short-range scale from NMR, which is compatible with a long-range ordered structure with P1 space group from XRD [37,38,39].
It is important to note that the gradual changes in lattice parameters in the solid solutions (Appendix B) are directly correlated with the intensities in the Q4n (4-nSi,nAl) Si/Al distribution, indicating that these structural changes are “real” chemical changes at the local scale of the crystalline solid state, and not artifacts from “ideal” features derived from averaging measurements in pseudo-periodic structures, by reciprocal-space techniques.
Second, the solid state is commonly described as a dichotomy in periodicity from reciprocal space techniques, either as crystalline or as amorphous (non-crystalline), when having or not having long-range atomic order to produce or not an indexable diffraction pattern. However, three different types of solid states were found by NMR in lithium aluminosilicate solids with framework structures in this work, including: (i) amorphous structures, without sharp peaks in XRD, with random Si/Al distributions in a complete solid solution in the gels formed along the SiO2–LiAlSiO4 range (i.e., random states); (ii) pseudo-periodic crystals with average structures from sharp peaks in XRD patterns, which respect the Loewenstein’s rule in the Si/Al distribution (i.e., Loewenstein order states), in solid solutions of the ceramic phases of the LAS system as mixed crystals, including both the β-eucryptite s.s. and the β-spodumene s.s.; and (iii) long-range ordered structures with well-defined particular ordered states as end-members or having stoichiometric atomic compositions, as in the synthetic high-pressure crystallized fully-ordered and stoichiometric LiAlSiO4 β-eucryptite, and the minerals from pegmatites (α-spodumene, α-eucryptite, petalite, and bikitaite). Crystal structures with random disorder in the Si/Al distribution of Q4 tetrahedral sites were also suggested from 29Si spectra in “crystalline” zeolites [61], as a random state different from that in amorphous structures without Bragg peaks. An additional structural state was described in β-eucryptite solid solutions by Phillips et al., (2000), in between structures with random distributions of Si–O–(Si,Al) bonds and crystal structures that respect the Loewenstein’s rule. These structures were described with a decreasing number of Al–O–Al bonds as a function of annealing time, up to a final stage where the number of Al–O–Al bonds is close to zero [17], i.e., the crystal structures described here in Figure 6 for both β-eucryptite s.s. and β-spodumene s.s. Still one more Q4 structural state was derived in “valencianite” KAlSi3O8 feldspar by 29Si NMR with a strong dispersion of charges, in addition to the restrictions imposed by the Al-O-Al avoidance, resulting into a remarkable deficiency of Si atoms in (4Si,0Al), (1Si,3Al) and (0Si,4Al) environments [59]. Therefore, six types of solid state structures can be distinguished from short-range order-disorder criteria, despite only four have been described in the LAS system, indicating that the NMR spectroscopy does not perceive the solid state as the sharp twofold approach, as derived from reciprocal-space techniques. Note that along this sequence the number of spectroscopically-distinct sites increases for the three analyzed atoms, Si, Al, and Li, implying that the progress of local ordering is related to the accommodation of atoms in several well-defined structural configurations.
Third, the average crystal structures of the ceramic phases of the LAS system, observed at the laboratory time scale, and the crystal structures of the minerals of the LAS system, observed at the geological-time scale, show a remarkable difference. In the laboratory time scale, the keatite structures formed by five-membered rings of Si atoms in tetrahedral sites are common, whereas in the geological time scale, these structures are not found. Despite petalite have been structurally related to the keatite stuffed derivatives, structural differences are clear, and a pseudo six-membered ring formed by five Si atoms and one double Al–Li atom can be described in the lattice model. For the LiAlSiO4 end-member composition, at low pressure, long-range disordered β-eucryptite crystallizes with a Loewenstein state, in contrast to the crystallization of long-range ordered β-eucryptite at high pressure. It suggests that Si/Al/Li ordering is favored at high pressure, a phenomenon also known in synthetic feldspars. At intermediate compositions of the LAS system, the β-eucryptite s.s. crystallizes mainly at low temperatures, whereas β-spodumene s.s. crystallizes mainly at high temperatures (see Table 2), despite they are not stable phases at the geological time scale. For 0.333 ≥ x ≥ 0.667 (i.e., for Si/Al ratios between 2/1 and 5/1), the main product of crystallization is β-spodumene, suggesting that the number of tetrahedra that form the main structural units of the formed crystals (i.e., the tetrahedral rings!) are directly related to the Si/Al ratio, i.e., pentahedral T-rings are formed on average by four Si atoms and one Al atom. However, for x > 0.75 (i.e., for Si/Al > 7), quartz structures with hexahedral T-rings are the major mineral phase of the LAS system (Table 2). Note that this value is similar to the limit for the stabilization of the β-quartz phase at room temperature. It is possible to infer that when less than one Al atom occurs on average per six-membered ring, the structure of the β-quartz cannot be stabilized at room temperature and collapses on cooling by the displacive transformation to form α-quartz. However, when one or more Al atoms are forming the hexahedral T-rings (with close Li atoms for the local compensation of charges), the β-quartz structure can be stabilized on cooling. Hence, all of these facts indicate that crystal formation and later solid state behaviour is kinetically controlled by the Ostwald’s rule of stages, more than by thermodynamic laws, as also happens in feldspars.

Author Contributions

Conceptualization mainly by L.S.-M. and J.S.; the NMR experiments were performed by I.S., V.D.-G. and P.F.; software DFT by V.D.-G.; synthesis of ceramic samples and collected minerals by L.S.-M.; analyses of the NMR spectra by L.S.-M., P.F., I.S. and V.D.-G.; the Rietveld refinements of cell parameters and mineral quantifications by M.F. All authors contributed to discuss and write the paper. All authors have read and agreed to the published version of the manuscript.

Funding

This research was funded by the Ministerio de Ciencia e Innovación PID2019-106662RB-C42, and Ministerio de Economía y Competitividad MAT2017-86450-C4-1-R.

Data Availability Statement

Not applicable.

Acknowledgments

We thank Francois Delvobe for the synthesis of the β-eucrytite at 1000 °C and 3 kbars in ISTO (CNRS, France), and Museo Nacional de Ciencias Naturales (MNCN-CSIC) for the mineral specimens of α-spodumene. We thank to Alfredo Fernández Larios from ICTS CNME (UCM) for the results of electron microprobe analyses using a JXA 8900. We would also like to thank Esperanza Menéndez Méndez for the DTA-TG analyses performed in the IETcc (CSIC).

Conflicts of Interest

The authors declare no conflict of interest.

Appendix A. Powder XRD Patterns from Selected Minerals

Figure A1. Powder XRD pattern of α-spodumene LiAlSi2O6 with a = 9.467 (3) Å, b = 8.396 (1) Å and c = 5.222 (2) Å, α = 90°, β = 110.17° (2), and γ = 90°, with (hkl) from the model C2/c space group in specimen Golconda, with cell parameters very similar to file CC 9668 in ICSD database, with a = 9.449 (1) Å, b = 8.386 (1) Å and c = 5.215 (2) Å, α = 90°, β = 110.10° (2), and γ = 90°.
Minerals 12 00427 g0a1
Figure A2. Powder XRD pattern of petalite LiAlSi4O8 with Rietveld refinement cell parameters as a = 11.746 (1) Å, b = 5.1403 (5) Å and c = 7.6250 (7) Å, α = 90°, β = 113.031° (5), and γ = 120° in a model P2/a in specimen Brazil, very similar to file CC 100348 in ICSD database, with a = 11.7540 (11) Å, b = 5.1395 (5) Å, c = 7.6296 (7) Å, α = 90°, β = 113.04° (1), and γ = 90°, from Effemberger (1980) [30].
Minerals 12 00427 g0a2
Figure A3. Powder XRD pattern of α-eucryptite LiAlSiO4 with a = b = 13.4781 (9) Å, c = 9.0051 (9) Å, α = β = 90°, and γ = 120° with some (hkl)* from the R-3 space group, very similar to CC 30983 [57] with a = b =13.471 (3) Å, c = 8.998 (2) Å, α = β = 90°, and γ = 120°; and bikitaite LiAlSi2O6·H2O with a = 8.604 (2) Å, b = 4.961 (1) Å, c = 7.595 (1) Å, α = 89.91° (4), β = 114.42° (2), and γ = 89.97° (4), with some (hkl)+ from a P1 space group, very similar to CC 68586 with a = 8.6071 (9) Å, b = 4.9540 (5) Å, c = 7.572 (7) Å, α = 89.900° (7), β = 114.437° (8), and γ = 89.900° (7) [38], with some quartz diffractions used as internal standard, from specimen Bikita. The Rietveld quantification of these three mineral phases is: α-eucryptite 52.1 wt %, bikitaite 19.8 wt %, and α-quartz 28.1 wt %.
Minerals 12 00427 g0a3
Figure A4. Powder XRD pattern of α-quartz Li0.08Al0.08Si1.92O4 (Si/Al = 25/1) with a = b = 4.9350 (6) Å and c = 5.4145 (8) Å with (hkl) peaks from the P3221 space group symmetry, synthesized at 850 °C and 1 atm. File 16331 is α-SiO2 in ICSD database with a = b = 4.921 Å, c = 5.400 Å, α = 90°, β = 90°, and γ = 120°, which is very similar to the low content Li–Al quartz here synthesized. The sample was crystallized from the amorphous precursor gel at 850 °C and 1 atm. Some additional peaks from cristobalite SiO2 (C) and β-spodumene (βS) are also marked, and the residual contents of amorphous material (A) is also observed.
Minerals 12 00427 g0a4
Figure A5. Powder XRD pattern of β-eucryptite synthesized at 1200 °C and 1 atm, nominal x = 0 (real x = 0.1 from the loss of lithium and crystallization of σ-Al2O3) having approximate composition as Li0.90Al0.90Si1.10O4, and Rietveld refinement cell parameters as a = b = 10.5079 (7) Å, c = 11.091 (1) Å, α = 90°, β = 90°, and γ = 120°, with (hkl) from the P6422 model of Pillars and Peacor (1973) [12]. The specimen is very similar to file CC 22010 in ICSD database, with a = b = 10.5058 (6) Å, c = 10.9526 (7) Å, α = β = 90°, and γ = 120°. Peaks from σ-Al2O3 are from file CC 69213 in ICSD database, corresponding to gamma alumina file 29-00636 in PDF database. The (201) diffraction was clear for x ≤ 0.5 at T ≥ 1000 °C.
Minerals 12 00427 g0a5
Figure A6. Powder XRD pattern of three samples crystallized by the ceramic method at 850 °C showing the diffractions of the α-quartz and β-eucryptite phases, * for Li–Al-rich cristobalite SiO2 diffractions.
Minerals 12 00427 g0a6
Figure A7. Powder XRD pattern of LiAlSi2O6 β-spodumene with composition x = 0.333 (Si/Al = 2/1) in the solid solution series, with a = b = 7.5354 (4) Å, c = 9.1769 (7), and α = β = γ =90°, with (hkl) peaks from the P43212 space group symmetry [23,24], synthesized at 1200 °C, 1 atm, with cell parameters very similar to file CC 14232 in ICSD database, with a = b = 7.534 (5) Å, c = 9.158 (9) Å, and α = β = γ = 90°.
Minerals 12 00427 g0a7
Figure A8. Powder XRD pattern of α-cristobalite Li0.125Al0.125Si1.875O4 (Si/Al = 15/1) with a = b = 4.9252 (9) Å and c = 7.029 (2) Å, and α = β = γ = 90°, with (hkl) peaks from the P41212 space group symmetry, synthesized at 1200 °C and 1 atm. File 75300 is α-cristobalite in ICSD database, with a = b = 4.9717 (4) Å, c = 6.9223 (3) Å, and α = β = γ = 90°, which is related to this pattern. The sample was crystallized from the amorphous precursor gel at 1200 °C and 1 atm. Some additional peaks from β-spodumene and β-eucryptite are not marked in the figure.
Minerals 12 00427 g0a8

Appendix B. Rietveld Refinement of Cell Parameters from Powder XRD Patterns

Table A1. α-quartz P3221 or β-eucryptite P6422; samples synthesized at 675 °C.
Si/Al Ratiox ValueLi1−xAl1−xSi1+xO4Formulaa (Å)c (Å)V (Å3)
1/01.00Si2O4SiO2---
100/10.98Li0.02Al0.02Si1.94O4LiAlSi100O202---
50/10.96Li0.04Al0.04Si1.96O4LiAlSi50O102---
25/10.92Li0.08Al0.08Si1.92O4LiAlSi25O524.939 (4)5.433 (5)114.8 (2)
15/10.875Li0.125Al0.125Si1.875O4LiAlSi15O324.987 (2)5.421 (3)116.7 (1)
10/10.818Li0.182Al0.182Si1.818O4LiAlSi10O225.022 (1)5.433 (2)118.68 (7)
7/10.75Li0.25Al0.25Si1.75O4LiAlSi7O165.0667 (8)5.441 (1)120.96 (5)
5/10.667Li0.333Al0.333Si1.667O4LiAlSi5O1210.234 (4)10.906 (5)989.3 (8)
4/10.60Li0.40Al0.40Si1.60O4LiAlSi4O1010.292 (2)10.917 (2)1001.5 (4)
3/10.50Li0.50Al0.50Si1.50O4LiAlSi3O810.368 (1)10.911 (2)1015.7 (4)
2/10.333Li0.666Al0.666Si1.333O4LiAlSi2O610.4446 (7)10.9092 (9)1030.6 (2)
1.75/1 (7/4)0.273Li0.727Al0.727Si1.273O4Li4Al4Si7O2410.4678 (6)10.9210 (7)1036.3 (1)
1.5/1 (3/2)0.20Li0.80Al0.80Si1.20O4Li2Al2Si3O1010.506 (3)10.981 (4)1049.6 (8)
1.25/1 (5/4)0.111Li0.889Al0.889Si1.111O4Li4Al4Si5O1210.4942 (6)10.9403 (8)1043.4 (1)
1/10LiAlSiO4LiAlSiO410.517 (2)10.994 (3)1053.0 (5)
Table A2. β-spodumene P43212; samples synthesized at 675 °C.
Si/Al Ratiox ValueLi1−xAl1−xSi1+xO4Formulaa (Å)c (Å)V (Å3)
1/01.00Si2O4SiO2---
100/10.98Li0.02Al0.02Si1.94O4LiAlSi100O202---
50/10.96Li0.04Al0.04Si1.96O4LiAlSi50O102---
25/10.92Li0.08Al0.08Si1.92O4LiAlSi25O52---
15/10.875Li0.125Al0.125Si1.875O4LiAlSi15O32---
10/10.818Li0.182Al0.182Si1.818O4LiAlSi10O22---
7/10.75Li0.25Al0.25Si1.75O4LiAlSi7O16---
5/10.667Li0.333Al0.333Si1.667O4LiAlSi5O12---
4/10.60Li0.40Al0.40Si1.60O4LiAlSi4O107.497 (1)9.056 (3)509.0 (3)
3/10.50Li0.50Al0.50Si1.50O4LiAlSi3O87.515 (2)9.097 (3)513.8 (3)
2/10.333Li0.666Al0.666Si1.333O4LiAlSi2O6---
1.75/1 (7/4)0.273Li0.727Al0.727Si1.273O4Li4Al4Si7O24---
1.5/1 (3/2)0.20Li0.80Al0.80Si1.20O4Li2Al2Si3O10---
1.25/1 (5/4)0.111Li0.889Al0.889Si1.111O4Li4Al4Si5O12---
1/10LiAlSiO4LiAlSiO4---
Table A3. α-quartz P3221 or β-eucryptite P6422; samples synthesized at 850 °C.
Si/Al Ratiox ValueLi1−xAl1−xSi1+xO4Formulaa (Å)c (Å)V (Å3)
1/01.00Si2O4SiO2---
100/10.98Li0.02Al0.02Si1.94O4LiAlSi100O202---
50/10.96Li0.04Al0.04Si1.96O4LiAlSi50O1024.938 (1)5.412 (2)114.29 (7)
25/10.92Li0.08Al0.08Si1.92O4LiAlSi25O524.9549 (4)5.4148 (6)115.12 (2)
15/10.875Li0.125Al0.125Si1.875O4LiAlSi15O324.982 (1)5.427 (2)116.66 (7)
10/10.818Li0.182Al0.182Si1.818O4LiAlSi10O225.0147 (5)5.4324 (7)118.31 (3)
7/10.75Li0.25Al0.25Si1.75O4LiAlSi7O165.0536 (4)5.4399 (6)120.32 (2)
5/10.667Li0.333Al0.333Si1.667O4LiAlSi5O1210.181 (2)10.893 (3)977.9 (4)
4/10.60Li0.40Al0.40Si1.60O4LiAlSi4O1010.298 (17)10.899 (18)1000.9 (17)
3/10.50Li0.50Al0.50Si1.50O4LiAlSi3O810.373 (1)10.905 (2)1016.3 (3)
2/10.333Li0.666Al0.666Si1.333O4LiAlSi2O610.4410 (6)10.9092 (7)1029.9 (1)
1.75/1 (7/4)0.273Li0.727Al0.727Si1.273O4Li4Al4Si7O2410.4693 (6)10.9153 (7)1036.1 (1)
1.5/1 (3/2)0.20Li0.80Al0.80Si1.20O4Li2Al2Si3O1010.520 (2)11.056 (3)1059.7 (5)
1.25/1 (5/4)0.111Li0.889Al0.889Si1.111O4Li4Al4Si5O1210.497 (1)10.956 (1)1045.5 (3)
1/10LiAlSiO4LiAlSiO410.522 (1)11.064 (2)1061.0 (4)
Table A4. β-spodumene P43212; samples synthesized at 850 °C.
Si/Al Ratiox ValueLi1−xAl1−xSi1+xO4Formulaa (Å)c (Å)V (Å3)
1/01.00Si2O4SiO2---
100/10.98Li0.02Al0.02Si1.94O4LiAlSi100O202---
50/10.96Li0.04Al0.04Si1.96O4LiAlSi50O102---
25/10.92Li0.08Al0.08Si1.92O4LiAlSi25O52---
15/10.875Li0.125Al0.125Si1.875O4LiAlSi15O32---
10/10.818Li0.182Al0.182Si1.818O4LiAlSi10O22---
7/10.75Li0.25Al0.25Si1.75O4LiAlSi7O167.472 (4)9.013 (9)503.2 (7)
5/10.667Li0.333Al0.333Si1.667O4LiAlSi5O127.4875 (5)9.0105 (8)505.1 (1)
4/10.60Li0.40Al0.40Si1.60O4LiAlSi4O107.493 (1)9.043 (2)507.8 (2)
3/10.50Li0.50Al0.50Si1.50O4LiAlSi3O87.513 (1)9.098 (1)513.6 (2)
2/10.333Li0.666Al0.666Si1.333O4LiAlSi2O67.535 (4)9.152 (4)519.6 (5)
1.75/1 (7/4)0.273Li0.727Al0.727Si1.273O4Li4Al4Si7O247.625 (3)9.124 (4)530.6 (5)
1.5/1 (3/2)0.20Li0.80Al0.80Si1.20O4Li2Al2Si3O107.534 (2)9.122 (4)517.7 (4)
1.25/1 (5/4)0.111Li0.889Al0.889Si1.111O4Li4Al4Si5O12---
1/10LiAlSiO4LiAlSiO4---
Table A5. α-quartz P3221 or eucryptite P6422; samples synthesized at 1000 °C.
Si/Al Ratiox ValueLi1−xAl1−xSi1+xO4Formulaa (Å)c (Å)V (Å3)
1/01.00Si2O4SiO2---
100/10.98Li0.02Al0.02Si1.94O4LiAlSi100O202---
50/10.96Li0.04Al0.04Si1.96O4LiAlSi50O1024.9365 (4)5.4108 (7)114.19 (2)
25/10.92Li0.08Al0.08Si1.92O4LiAlSi25O524.9553 (3)5.4152 (7)115.16 (2)
15/10.875Li0.125Al0.125Si1.875O4LiAlSi15O324.9785 (6)5.4214 (9)116.37 (3)
10/10.818Li0.182Al0.182Si1.818O4LiAlSi10O225.0104 (6)5.4307 (8)118.07 (3)
7/10.75Li0.25Al0.25Si1.75O4LiAlSi7O165.0450 (6)5.4375 (8)119.85 (3)
5/10.667Li0.333Al0.333Si1.667O4LiAlSi5O1210.180 (5)10.876 (9)976.1 (5)
4/10.60Li0.40Al0.40Si1.60O4LiAlSi4O1010.279 (1)10.913 (3)998.6 (4)
3/10.50Li0.50Al0.50Si1.50O4LiAlSi3O810.348 (1)10.916 (2)1012.4 (3)
2/10.333Li0.666Al0.666Si1.333O4LiAlSi2O610.4436 (5)10.9121 (7)1030.7 (1)
1.75/1 (7/4)0.273Li0.727Al0.727Si1.273O4Li4Al4Si7O2410.4715 (4)10.9251 (5)1037.5 (1)
1.5/1 (3/2)0.20Li0.80Al0.80Si1.20O4Li2Al2Si3O1010.517 (2)11.006 (3)1054.2 (5)
1.25/1 (5/4)0.111Li0.889Al0.889Si1.111O4Li4Al4Si5O1210.495 (1)10.963 (2)1045.6 (3)
1/10LiAlSiO4LiAlSiO410.516 (1)11.054 (2)1058.7 (4)
Table A6. β-spodumene P43212; samples synthesized at 1000 °C.
Si/Al Ratiox ValueLi1−xAl1−xSi1+xO4Formulaa (Å)c (Å)V (Å3)
1/01.00Si2O4SiO2---
100/10.98Li0.02Al0.02Si1.94O4LiAlSi100O202---
50/10.96Li0.04Al0.04Si1.96O4LiAlSi50O102---
25/10.92Li0.08Al0.08Si1.92O4LiAlSi25O52---
15/10.875Li0.125Al0.125Si1.875O4LiAlSi15O327.364 (3)9.03 (3)489.7 (32)
10/10.818Li0.182Al0.182Si1.818O4LiAlSi10O227.434 (7)9.01 (2)498.1 (12)
7/10.75Li0.25Al0.25Si1.75O4LiAlSi7O167.479 (2)8.994 (4)503.1 (3)
5/10.667Li0.333Al0.333Si1.667O4LiAlSi5O127.4871 (5)9.0075 (8)504.9 (1)
4/10.60Li0.40Al0.40Si1.60O4LiAlSi4O107.4934 (5)9.0437 (8)507.8 (1)
3/10.50Li0.50Al0.50Si1.50O4LiAlSi3O87.5113 (7)9.094 (1)513.1 (1)
2/10.333Li0.666Al0.666Si1.333O4LiAlSi2O67.5348 (9)9.157 (1)519.8 (1)
1.75/1 (7/4)0.273Li0.727Al0.727Si1.273O4Li4Al4Si7O247.5405 (9)9.165 (1)521.1 (1)
1.5/1 (3/2)0.20Li0.80Al0.80Si1.20O4Li2Al2Si3O107.5258 (8)9.124 (1)516.8 (1)
1.25/1 (5/4)0.111Li0.889Al0.889Si1.111O4Li4Al4Si5O12---
1/10LiAlSiO4LiAlSiO4---
Table A7. α-quartz P3221 or β-eucryptite P6422; samples synthesized at 1200 °C.
Si/Al Ratiox ValueLi1−xAl1−xSi1+xO4Formulaa (Å)c (Å)V (Å3)
1/01.00Si2O4SiO2---
100/10.98Li0.02Al0.02Si1.94O4LiAlSi100O202---
50/10.96Li0.04Al0.04Si1.96O4LiAlSi50O1024.935 (2)5.420 (3)114.4 (1)
25/10.92Li0.08Al0.08Si1.92O4LiAlSi25O524.9581 (9)5.418 (1)115.34 (5)
15/10.875Li0.125Al0.125Si1.875O4LiAlSi15O324.9815 (8)5.423 (1)116.55 (5)
10/10.818Li0.182Al0.182Si1.818O4LiAlSi10O225.0095 (7)5.4286 (9)117.98 (4)
7/10.75Li0.25Al0.25Si1.75O4LiAlSi7O165.0506 (1)5.4397 (1)120.17 (3)
5/10.667Li0.333Al0.333Si1.667O4LiAlSi5O12---
4/10.60Li0.40Al0.40Si1.60O4LiAlSi4O10---
3/10.50Li0.50Al0.50Si1.50O4LiAlSi3O8---
2/10.333Li0.666Al0.666Si1.333O4LiAlSi2O6---
1.75/1 (7/4)0.273Li0.727Al0.727Si1.273O4Li4Al4Si7O2410.4801 (4)10,9361 (5)1040.2 (1)
1.5/1 (3/2)0.20Li0.80Al0.80Si1.20O4Li2Al2Si3O1010.502 (1)10.942 (1)1045.2 (2)
1.25/1 (5/4)0.111Li0.889Al0.889Si1.111O4Li4Al4Si5O1210.5058 (6)10.9526 (7)1046.9 (1)
1/10LiAlSiO4LiAlSiO410.5079 (7)11.091 (1)1060.6 (2)
Table A8. β-spodumene P43212; samples synthesized at 1200 °C.
Si/Al Ratiox ValueLi1−xAl1−xSi1+xO4Formulaa (Å)c (Å)V (Å3)
1/01.00Si2O4SiO2---
100/10.98Li0.02Al0.02Si1.94O4LiAlSi100O202---
50/10.96Li0.04Al0.04Si1.96O4LiAlSi50O102---
25/10.92Li0.08Al0.08Si1.92O4LiAlSi25O52---
15/10.875Li0.125Al0.125Si1.875O4LiAlSi15O327.385 (11)8.993 (26)490.5 (21)
10/10.818Li0.182Al0.182Si1.818O4LiAlSi10O227.449 (4)8.998 (9)499.4 (8)
7/10.75Li0.25Al0.25Si1.75O4LiAlSi7O167.4803 (8)8.995 (1)503.3 (1)
5/10.667Li0.333Al0.333Si1.667O4LiAlSi5O127.4876 (3)9.0100 (4)505.14 (4)
4/10.60Li0.40Al0.40Si1.60O4LiAlSi4O107.4938 (3)9.0511 (5)508.29 (5)
3/10.50Li0.50Al0.50Si1.50O4LiAlSi3O87.5076 (5)9.0936 (8)512.6 (9)
2/10.333Li0.666Al0.666Si1.333O4LiAlSi2O67.5354 (4)9.1624 (6)520.3 (1)
1.75/1 (7/4)0.273Li0.727Al0.727Si1.273O4Li4Al4Si7O247.5471 (5)9.1769 (7)522.7 (9)
1.5/1 (3/2)0.20Li0.80Al0.80Si1.20O4Li2Al2Si3O107.5241 (7)9.124 (1)516.5 (1)
1.25/1 (5/4)0.111Li0.889Al0.889Si1.111O4Li4Al4Si5O12---
1/10LiAlSiO4LiAlSiO4---
Figure A9. Variation of the average cell parameters (Å) for each nominal chemical composition (x value) in the three mineral solid solutions: β-eucryptite, β-spodumene, and α-quartz.
Minerals 12 00427 g0a9
Figure A10. Example of a Rietveld refinement with single mineral composition, for sample x = 0.333 at 1200 °C, experimental profile in blue, simulated profile in red, and difference in gray, with 100% β-spodumene having a = 7.53254 (4) Å and c = 9.1624 (6) Å.
Minerals 12 00427 g0a10
Figure A11. Example of a Rietveld refinement with three mineral phases, for sample x = 0.75 at 1200 °C, experimental profile in blue, simulated profile in red, and difference in gray, with β-spodumene a = 7.4803 (8) Å and c = 8.995 (1) Å; α-quartz a = 5.0506 (1) Å; and c = 5.4397 (1) Å.
Minerals 12 00427 g0a11

References

  1. Venkateswaran, C.; Sreemoolanadhan, H.; Vaish, R. Lithium aluminosilicate (LAS) glass-ceramics: A review of recent progress. Int. Mater. Rev. 2021, 66, 1–38. [Google Scholar] [CrossRef]
  2. Van Tendeloo, G.; Van Landuyt, J.; Amelickx, S. The α-β phase transition in quartz and AlPO4 as studied by electron microscopy and diffraction. Phys. Status Solidi (a) 1976, 33, 723–735. [Google Scholar] [CrossRef]
  3. Dolino, G.; Bachheimer, J.P.; Berge, B.; Zeyen, C.M.E.; Van Tendeloo, G.; Van Landuyt, J.; Amelinckx, S. Incommensurate phase of quartz: III. Study of the coexistence state between the incommensurate and the α-phases by neutron scattering and electron microscopy. J. Phys. 1984, 45, 901–912. [Google Scholar] [CrossRef]
  4. Van Landuyt, J.; Van Tendeloo, G.; Amelickx, S.; Walker, M.B. Interpretation of Dauphiné-twin-domain configuration resulting from the a-b phase transition in quartz and aluminum phosphate. Phys. Rev. B 1985, 31, 2986–2992. [Google Scholar] [CrossRef] [PubMed]
  5. Heaney, P.J.; Veblen, D.R. Observations on the α-β phase transition in quartz: A review of imaging and diffraction studies and some new results. Am. Mineral. 1991, 76, 1018–1032. [Google Scholar]
  6. Spearing, D.R.; Stebbins, J.F. The 29Si NMR shielding tensor in low quartz. Am. Mineral. 1989, 74, 956–959. [Google Scholar]
  7. Spearing, D.R.; Farnan, I.; Stebbins, J.F. Dynamics of the α-β phase transitions in quartz and cristobalite as observed by in-situ high temperature 29Si and 17O NMR. Phys. Chem. Miner. 1992, 19, 307–321. [Google Scholar] [CrossRef]
  8. Martini, M.; Peleari, A.; Spinolo, G.; Vedda, A. Role of [AlO4]0 centers in the 380 nm thermoluminescence of quartz. Phys. Rev. B 1995, 52, 138–142. [Google Scholar] [CrossRef] [PubMed]
  9. Sánchez-Muñoz, L.; Correcher, V.; García-Guinea, J.; Delgado, A. Thermoluminescence of a lithium aluminum rich beta quartz for dosimetry purposes. Radiat. Protec. Dos. 1999, 84, 543–546. [Google Scholar] [CrossRef]
  10. Tscherry, V.; Schulz, H.; Laves, F. Average and superstructure of beta-eucryptite (LiAlSiO4). Part I. Average Structure. Zeit. Kristall. 1972, 135, 161–174. [Google Scholar]
  11. Tscherry, V.; Schulz, H.; Laves, F. Average and superstructure of beta-Eucryptite (LiAlSiO4). Part II. Superstructure. Zeit. Kristall. 1972, 135, 175–198. [Google Scholar]
  12. Pillars, W.W.; Peacor, D.R. The crystal structure of beta eucryptite as a function of temperature. Am. Mineral. 1973, 58, 681–690. [Google Scholar]
  13. Sartbaeva, A.; Redfern, S.A.T.; Lee, W.T. A neutron diffraction and Rietveld analysis of cooperative Li motion in beta-eucryptite. J. Phys. Cond. Mat. 2004, 16, 5267–5278. [Google Scholar] [CrossRef] [Green Version]
  14. Xu, H.; Heaney, P.J.; Beall, G.H. Phase transition induced by solid solution in stuffed derivatives of quartz: A power synchrotron XRD study of the LiAlSiO4-SiO2 join. Am. Mineral. 2000, 85, 971–979. [Google Scholar] [CrossRef]
  15. Xu, H.; Heaney, P.J.; Navrotsky, A. Thermal expansion and structural transformations of the stuffed derivatives of quartz along the LiAlSiO4-SiO2 join: A variable-temperature power synchrotron XRD study. Phys. Chem. Min. 2001, 28, 302–312. [Google Scholar] [CrossRef]
  16. Zhang, M.; Salje, E.K.H.; Heaney, P.J. Vibrational spectroscopy of beta-eucryptite (LiAlSiO4): Optical phonons and phase transitions(s). Phys. Chem. Min. 2003, 30, 457–462. [Google Scholar] [CrossRef]
  17. Phillips, B.L.; Xu, H.; Heaney, P.; Navrostsky, A. 29Si and 27Al MAS-NMR spectroscopy of β-eucryptite (LiAlSiO4): The enthalpy of Si,Al ordering. Am. Mineral. 2000, 85, 181–188. [Google Scholar] [CrossRef]
  18. Li, C.T. The crystal structure of LiAlSi2O6 III (high-quartz solid solution). Zeit. Krist. 1968, 127, 327–348. [Google Scholar]
  19. French, B.M. Virgilite: A new lithium aluminum silicate mineral from the Macusani glass, Peru. Am. Mineral. 1978, 63, 461–465. [Google Scholar]
  20. Shropshire, J.; Keat, P.; Vaughan, P.A. The crystal structure of keatite, a new form of silica. Zeit. Krist. 1959, 112, 409–413. [Google Scholar] [CrossRef]
  21. Demuth, T.; Jeanvoine, Y.; Hafner, J.; Angyan, J.G. Polymorphism in silica studied in the local density and generalized-gradient approximations. J. Phys. Cond. Matter 1999, 11, 3833–3874. [Google Scholar] [CrossRef]
  22. Skinner, B.J.; Evans, H.T. Crystal chemistry of β-spodumene solid solutions on the join Li2O·Al2O3-SiO2. Am. J. Sci. 1960, 258A, 312–324. [Google Scholar]
  23. Li, C.T.; Peacor, D.R. The crystal structure of LiAlSi2O6-II (beta-spodumene). Acta Cryst. 1968, B27, 1132–1140. [Google Scholar]
  24. Clarke, P.T.; Spink, J.M. The crystal structure of beta spodumene, LiAlSi2O6 II. Zeit. Krist. 1969, 130, 420–426. [Google Scholar] [CrossRef]
  25. Baumgartner, B.; Müller, G. Framework distortion by large ions in MAlSi2O6 aluminosilicates with keatite structure. Eur. J. Miner. 1990, 2, 155–162. [Google Scholar] [CrossRef] [Green Version]
  26. Nordmann, A.; Cheng, Y.-B.; Bastow, T.J.; Hill, A.J. Structural characterization of lithium aluminosilicate glass and glass ceramics derived from spodumene mineral. J. Phys. Cond. Matt. 1995, 7, 3115–3128. [Google Scholar] [CrossRef]
  27. Downs, R.T.; Palmer, D. The pressure behaviour of alpha-cristobalite. Am. Mineral. 1994, 79, 9–14. [Google Scholar]
  28. Wei, P.H. The structure of quartz. Zeit. Krist. 1935, 92, 355–362. [Google Scholar] [CrossRef]
  29. Tucker, M.G.; Keen, D.A.; Dove, M.T. A detailed structural characterization of quartz on heating through the alpha–beta transition. Mine. Mag. 2001, 65, 489–507. [Google Scholar] [CrossRef]
  30. Effenberger, H. Petalit, LiAlSi4O10: Verfeinerung der Kristallstruktur, Diskussion der Raumgruppe und Infrarot-Messung. Tscher. Mineral. Petrog. Mitt. 1980, 27, 129–142. [Google Scholar] [CrossRef]
  31. Libeau, V.F. Untersuchungen an Schichtsilikaten des Formertyps Am(Si2O5)n. III. Zur Kristallstruktur von petalit, LiAlSiO4. Acta Cryst. 1961, 14, 399–406. [Google Scholar] [CrossRef]
  32. Hesse, K.F. Crystal structures of natural and synthetic alpha eucryptite, LiAlSiO4. Zeit. Krist. 1985, 172, 147–151. [Google Scholar] [CrossRef]
  33. Daniels, P.; Fyfe, C.A. Al, Si order in the crystal structure of alpha-eucryptite (LiAlSiO4). Amer. Mineral. 2001, 86, 279–283. [Google Scholar] [CrossRef]
  34. Tribaudino, M.; Nestola, F.; Prencipe, M.; Rundlof, H. A single-crystal neutron diffraction investigation of spodumene at 54 K. Can. Mineral. 2003, 41, 521–527. [Google Scholar] [CrossRef] [Green Version]
  35. Clark, J.R.; Appleman, D.E.; Papike, J.J. Crystal-chemical characterization of clinopyroxenes based on eight new structure refinements. Mineral. Soc. Am. Spec. Paper 1969, 2, 31–50. [Google Scholar]
  36. Cameron, M.; Papike, J.J. Crystal chemistry of silicate pyroxenes. Rev. Miner. Geochem. 1982, 7, 5–92. [Google Scholar]
  37. Bissert, G.; Liebau, F. The crystal structure of a triclinic bikitaite, LiAlSi2O6 (H2O) with ordered Al/Si distribution. Neues Jahr. Mineral. Monats. 1986, 6, 241–252. [Google Scholar]
  38. Ståhl, K.; Kvick, Å.; Ghose, S. One-dimensional water chain in the zeolite bikitaite: Neutron diffractiuon study at 13 and 295 K. Zeolites 1989, 9, 303–311. [Google Scholar] [CrossRef]
  39. Quartieri, S.; Sani, A.; Vezzalini, G.; Galli, E.; Fois, E.; Gamba, A.; Tabacchi, G. One-dimensional ice in bikitaite: Single-crystal X-ray diffraction, infra-red spectroscopy and ab-initio molecular dynamics studies. Microporous Mesoporous Mater. 1999, 30, 77–87. [Google Scholar] [CrossRef]
  40. Appleman, D.E. The crystal structure of bikitaite LiAlSi2O6H2O. Acta Cryst. 1960, 13, 1002. [Google Scholar]
  41. Kocman, V.; Gait, R.I.; Rucklidge, J. The crystal structure of bikitaite Li[AlSi2O6]·H2O. Am. Mineral. 1974, 59, 71–78. [Google Scholar]
  42. Arlt, T.; Angel, R.J. Displacive phase transitions in C-centred clinopyroxenes: Spodumene, LiScSi2O6 and ZnSiO3. Phys. Chem. Min. 2000, 27, 719–731. [Google Scholar] [CrossRef]
  43. Thompson, R.M.; Downs, R.T. Model pyroxenes II: Structural variation as a function of tetrahedral rotation. Am. Mineral. 2004, 89, 614–628. [Google Scholar] [CrossRef]
  44. Petch, H.E.; Cranna, N.G.; Volkoff, G.M. Second order nuclear quadrupole effects in single crystals: Part II. Experimental results for spodumene. Can. J. Phys. 1953, 31, 837–858. [Google Scholar] [CrossRef]
  45. Kirkpatrick, R.J. MAS NMR spectroscopy of minerals and glasses. Rev. Miner. Geochem. 1988, 18, 341–403. [Google Scholar]
  46. Tagai, T.; Ried, H.; Joswig, W.; Korekawa, M. Kristallographische Untersunchungen eines Petalits mittels Neutronenbeugung und Transmissions-elektronenmikroskopic. Zeit. Kristall. 1982, 160, 159–170. [Google Scholar] [CrossRef]
  47. Haussühl, E.; Schreuer, J.; Winkler, B.; Haussühl, S.; Bayarjargal, L.; Milman, V. Structure-property relations and thermodynamic properties of monoclinic petalite, LiAlSi4O10. J. Phys. Cond. Matt. 2012, 24, 345402. [Google Scholar] [CrossRef] [PubMed]
  48. Knight, K.S. The temperature-dependence of the volume expansivity and the thermal expansion tensor of petalite between 4.2 K and 600 K. J. Mineral. Petrol. Sci. 2014, 109, 118–1242. [Google Scholar] [CrossRef] [Green Version]
  49. Kaminskii, A.A.; Haussühl, E.; Eichler, H.J.; Hanuza, J.; Mᶏczka, M.; Yoneda, H.; Shirakawa, A. Lithium silicate, LiAlSiO4 (petalite)-a novel monoclinic SRS-active crystal. Laser Phys. Lett. 2015, 12, 085002. [Google Scholar] [CrossRef]
  50. Hurlbut, C.S. Bikitaite, LiAlSi2O6·H2O, a new mineral from Southern Rhodesia. Am. Mineral. 1957, 32, 792–797. [Google Scholar]
  51. Hamilton, D.L.; Henderson, C.M.B. The preparation of silicate compositions by a gelling method. Min. Mag. 1968, 36, 832–838. [Google Scholar] [CrossRef]
  52. Konar, B.; Kim, D.G.; Jung, I.H. Critical thermodynamic optimization of the Li2O-Al2O3-SiO2 system and its application for the thermodynamic analysis of glass-ceramics. J. Eur. Ceram. Soc. 2018, 38, 3881–3904. [Google Scholar] [CrossRef]
  53. Massiot, D.; Fayon, F.; Capron, M.; King, I.; Le Calvé, S.; Alonso, B.; Durand, J.O.; Bujoli, B.; Gan, Z.H.; Hoatson, G. Modelling one and two-dimensional solid-state NMR spectra. Magn. Reson. Chem. 2002, 40, 70–76. [Google Scholar] [CrossRef]
  54. Zemann-Hedlik, A.; Zemann, J. Die Kristallstruktur von Petalit, LiAlSi4O10. Acta Cryst. 1955, 8, 781–787. [Google Scholar] [CrossRef]
  55. Lowenstein, W. The distribution of aluminum in the tetrahedral of silicat es and aluminates. Am. Mineral. 1954, 39, 92–96. [Google Scholar]
  56. Stumpf-Nothof, K.; Weiden, N. 29Si-MAS-NMR spectra of keatite-type aluminosilicates. Zeit. Kristall. 1992, 200, 265–274. [Google Scholar] [CrossRef]
  57. Warren, B.E.; Biscoe, J. The crystal structure of monoclinic pyroxenes. Zeit. Krist. 1931, 80, 391–401. [Google Scholar] [CrossRef]
  58. Ross, N.L.; Zhao, J.; Slebodnick, C.; Spencer, E.C.; Chakoumakos, B.C. Petalite under pressure: Elastic behaviour and phase stability. Am. Mineral. 2015, 100, 714–721. [Google Scholar] [CrossRef]
  59. Sánchez-Muñoz, L.; Sanz, J.; Sobrados, J.; Gan, Z.H. Medium-range-order in disordered K-feldspars by multinuclear NMR. Am. Mineral. 2013, 98, 2115–2131. [Google Scholar] [CrossRef] [Green Version]
  60. Sánchez-Muñoz, L.; Sanz, J.; Sobrados, I.; Gan, Z.H.; Santos, J.I. Medium-range order in crystal structures of minerals. In Applications of NMR Spectroscopy in the Solid State; Biblioteca de Ciencias 47; Consejo Superior de Investigaciones Científicas (CSIC): Madrid, Spain, 2019; pp. 103–131. [Google Scholar]
  61. Klinowski, J.; Ramdas, S.; Thomas, J.M. A re-examination of Si, Al ordering in zeolite NaX and NaY. J. Chem. Soc. Faraday Trans. 1982, 78, 1025–1050. [Google Scholar] [CrossRef]
Figure 1. Simplified phase diagram of the Li2O–Al2O3–SiO2 (LAS) system corresponding to the compositional range between LiAlSiO4 and SiO2 calculated in [52]. The experimental temperatures and chemical compositions for the synthesis of samples are shown in the y axis and x axis, respectively. The selected samples with single-phase compositions for the NMR spectra are shown.
Minerals 12 00427 g001
Figure 2. Linear variation of the temperatures Th and Tc of the α β transition of quartz on heating and cooling with the stoichiometric substitution of Si by Al + Li, with an x value in Li1−xAl1−xSi 1+xO4, using three points for x ≥ 0.96. The 7Li MAS NMR spectra for x = 0.92 and x = 0.96, using samples crystallized at 900 °C and 3 kbars, are shown.
Minerals 12 00427 g002
Figure 3. Variation of the spacing d in Å for the (200) diffraction peak of the β-eucryptite solid solution series or of the (100) diffraction in α-quartz, using Cu Kα1 radiation, for x values in Li1−xAl1−xSi1+xO4 along the solid-solution series, using samples crystallized at 1 atm and temperatures between 675 °C and 1200 °C (Table 2, Appendix B).
Minerals 12 00427 g003
Figure 4. The 29Si spectra of β-eucryptite in (a), and β-spodumene in (b) for different x values. The position and intensity of the deconvolutions are in Table 4. The mineral species called “virgilite” corresponds to LiAlSi2O6 composition for Si/Al = 2/1 with β-eucryptite structure.
Minerals 12 00427 g004
Figure 5. Correlations between the center of gravity of the 29Si spectra with the x value in the solid-solution series of Li1−xAl1−xSi1+xO4 for four samples of β-eucryptite and four samples of β-spodumene. The nominal positions for x = 0.0 and 0.1 are corrected (arrows) from the loss of Li atoms by heating during the mineral synthesis.
Minerals 12 00427 g005
Figure 6. Values of the areas in % of the several components from the deconvolution of 29Si spectra at 9.4 T against the x value in Li1−xAl1−xSi1+xO4 for samples with β-eucryptite and β-spodumene structures. Dashed lines show the variation of the areas of the five Q4n (nAl) n = 0, 1, 2, 3, and 4 chemical environments according to a Si/Al Loewenstein’s distribution. The probabilities pn (n is the number of Al atoms around a Si atom) of the five chemical environments are defined by p0 = (1 − r)4; p1 = 4(1 − r)3r; p2 = 6r2(1 − r)2; p3 = 4r3(1 − r); and p4 = r4, where r = Al/Si. The samples with β-eucryptite structure are represented by squares having different colors for the different chemical environments, whereas the samples with β-spodumene structure are represented by stars.
Minerals 12 00427 g006
Figure 7. The 27Al MAS NMR spectra of β-eucryptite (a) and β-spodumene (b), for several x values in Li1−xAl1−xSi1+xO4 along the solid solutions. The signal of octahedral aluminum from σ-Al2O3 is marked with an asterisk * in the samples with nominal x values of 0.0 and 0.111.
Minerals 12 00427 g007
Figure 8. The 7Li (left column) and 6Li (right column) MAS NMR spectra of β-eucryptite (a), and β-spodumene (b), for several x values in Li1−xAl1−xSi1+xO4 along the solid solutions.
Minerals 12 00427 g008
Figure 9. The 29Si, 27Al, 6Li, and 7Li MAS NMR spectra of ordered β-eucryptite LiAlSiO4 from crystallization at 900 °C and 3 kbars in hydrothermal conditions. (a) The 29Si spectrum have two signals with the same area, as also occurs in the 27Al (b), but having very different quadrupolar parameters. (c) The 6Lispectra consist of two resonances, the largest with an area three times greater than the smallest. (d) The 7Li spectrum only allows resolving a single site (Table 3). NMR parameters of the spectra are described in the text.
Minerals 12 00427 g009
Figure 10. The 29Si (a), 27Al (b) and 7Li (c) MAS NMR spectra of α-spodumene in specimen Golconda.
Minerals 12 00427 g010
Figure 11. The MAS NMR spectra of petalite LiAlSi4O8 from specimen Brazil. (a) The 29Si spectra as 29Si{27Al} at 20 T, single pulse at 20 T, single pulse at 9.4 T, and single pulse at 7.05 T. (b) The 27Al spectrum at 9.4 T. (c,d) are the 6Li and 7Li spectra at 9.4 T, respectively. See the NMR parameters in text.
Minerals 12 00427 g011
Figure 12. The 29Si MAS NMR spectra of specimen Bikita (Figure A3) is formed by a mixture of α-eucryitite with signals at −81.1 and −81.9 ppm; bikitaite with resonances at −86.5, −89.7, and a broad centered signal at −101.9 ppm (with twice the area of the other two); α-quartz at −107.3 ppm, in three different spectra recorded with recycling times (D0 values in seconds) of 5 s and 7200 s at 9.4 T; and also of 45 s at 7.05 T. For the spectra using D0 of 5 s and 45 s, pulses of 0.5 μs (10°) were used; whereas for the spectrum with D0 of 7200 s, pulses of 30° were employed.
Minerals 12 00427 g012
Table 1. Lattice models of the minerals (*) and ceramic phases (+) of the LAS system at room temperature and bikitaite.
NameFormulaSpace
Group
Sites
Si, Al, Li
DescriptionRef.
α-cristobalite s.s. (*+)SiO2P412121, 0, 0Natural and synthetic[27]
α-quartz s.s. (*+)SiO2P32211, 0, 0Natural and synthetic, low-temperature phase[28]
β-quartz s.s. (*+)SiO2P64221, 0, 0Natural and synthetic, high-temperature phase[29]
P62221, 1, 1Synthetic, high-temperature phase, glass-ceramics, beta-quartz structure[10]
β-eucryptite s.s.SiO2-LiAlSiO4 2, 2, 3[12]
(+) P64222, 2, 5[11]
4, 4, 3[13]
β-spodumene s.s.
(+)
SiO2-LiAlSiO4P432122, 2, 1Synthetic, high-temperature phase, glass-ceramics, keatite structure[23,24]
Petalite (*)LiAlSi4O10P2/a2, 1, 1Typical of Li-rich granitic pegmatites[30]
[31]
Pa4, 1, 1
α-eucryptite (*)LiAlSiO4R-32, 2, 1
2, 2, 2
Typical of Li-rich granitic pegmatites with phenakite structure[32]
[33]
α-spodumene (*)LiAlSi2O6C2/c
C2
1, 1, 1
2, 2, 1
Fibrous habit typical of Li-richgranitic pegmatites[34]
[35,36]
Bikitaite (*)LiAlSi2OH2OP1
P21
4, 2, 1
3, 2, 2
Rare mineral from rare Li-richgranitic pegmatites[37,38,39]
[40,41]
Table 2. Chemical compositions and crystalline phases produced by the thermal treatments.
Si/Al Ratiox ValueLi1−xAl1−xSi1+xO4Formula675 °C, 100 h850 °C, 100 h1000 °C, 100 h1200 °C, 100 h
βS-βE(αQ)-CβS-βE(αQ)-CβS-βE(αQ)-CβS-βE(αQ)-C
1/01.00Si2O4SiO2AAA0.0-0.0-100.0
100/10.98Li0.02Al0.02Si1.98O4LiAlSi100O202AA + αQA + αQ0.0-1.3-98.7
50/10.96Li0.04Al0.04Si1.96O4LiAlSi50O102AA + αQ0.0-92.9-7.1 + A0.0-12.3-87.7
25/10.92Li0.08Al0.08Si1.92O4LiAlSi25O520.0-100.0-0.00.0-100.0-0.09.3-81.3-9.48.3-30.9-60.8
15/10.875Li0.125Al0.125Si1.875O4LiAlSi15O320.0-100.0-0.00.0-100.0-0.01.4-64.7-33.93.9-33.6-62.5
10/10.818Li0.182Al0.182Si1.818O4LiAlSi10O220.0-100.0-0.00.0-100.0-0.03.3-67.2-29.611.6-45.1-43.3
7/10.75Li0.25Al0.25Si1.75O4LiAlSi7O160.0-100.0-0.05.9-75.7-18.48.1-74.2-17.735.7-46.8-17.6
5/10.667Li0.333Al0.333Si1.667O4LiAlSi5O120.0-100.0-0.074.1-23.9-2.191.0-9.0-0.0100.0-0.0-0.0
4/10.60Li0.40Al0.40Si1.60O4LiAlSi4O1035.4-64.4-0.056.8-8.9-34.381.5-17.5-0.0100.0-0.0-0.0
3/10.50Li0.50Al0.50Si1.50O4LiAlSi3O827.7-72.3-0.047.2-46.4-6.468.6-31.4-0.0100.0-0.0-0.0
2/10.333Li0.666Al0.666Si1.333O4LiAlSi2O60.0-100.0-0.07.1-92.9-0.024.9-75.1-0.0100.0-0.0-0.0
1.75/1 (7/4)0.273Li0.727Al0.727Si1.273O4Li4Al4Si7O240.0-100.0-0.06.4-92.6-0.020.2-79.8-0.047.1-52.9-0.0
1.5/1 (3/2)0.20Li0.80Al0.80Si1.20O4Li2Al2Si3O1030.2-18.9-27.37.3-92.7-0.048.8-51.6-0.037.3-62.7-0.0
1.25/1 (5/4)0.111Li0.889Al0.889Si1.111O4Li4Al4Si5O1218.2-81.8-0.02.0-96.0-2.00.0-100.0-0.00.0-100.0-0.0
1/10LiAlSiO4LiAlSiO431.5–45.8–22.76.3-93.7-0.00.0-100.0-0.00.0-100.0-0.0
The mineral proportions wt % were calculated by Rietveld refinements (see Appendix B) and they consist of three main mineral components: (i) C or cristobalite, (ii) βS or β-spodumene s.s., and (iii) βE or β-eucryptite s.s. were formed at high temperature, but this phase was observed at room temperature for x ≤ 0.667, whereas α-quartz αQ (bold) was observed at room temperature for x ≥ 0.75. Additional minor phases were also observed including tridymite, keatite, σ-Al2O3, and also non-crystallized amorphous material (A) in the high-silica compositions obtained at low temperatures, particularly for 675 °C in all compositions.
Table 3. Deconvolution of the 7Li MAS NMR spectra of hydrothermal α-quartz and fully ordered β-eucryptite.
Phasex Value%δiso (ppm)Δδiso (ppm)G/LCQ (kHz)η
α-quartz s.s.0.9270
30
0.5
−0.2
0.7
1.0
0.0
0.0
81.1 ± 0.37
26.6 ± 1.08
1.00
1.00
0.961000.50.600.087.7 ± 0.380.61 ± 0.01
0.981000.50.370.093.1 ± 0.590.52 ± 0.02
β-eucryptite
LiAlSiO4
0.001000.02.380.4395.4 ± 0.230.61 ± 0.01
Table 4. Deconvolution of the 29Si MAS NMR spectra of β-eucryptite and β-spodumene selected samples.
Phasex Valueδ/%(0Si,4Al)(1Si,3Al)(2Si,2Al)(3Si,1Al)(4Si,0Al)Line WidthBarycentre
β-eucryptite0.000
(0.080) *
δ
%
−90.9
59.42
−96.5
28.14
−103.1
8.37
−108.4
4.06
−114.9
0.00
3.6 ± 1.0−94.2
0.111
(0.200) *
δ
%
−90.9
20.63
−96.1
37.54
−102.2
30.91
−108.2
8.88
−114.6
2.04
3.3 ± 0.8−98.3
0.273δ
%
−90.9
14.76
−96.4
29.06
−102.2
38.36
−108.3
14.15
−114.6
3.67
3.6 ± 1.0−100.2
0.333δ
%
−91.2
6.44
−96.3
24.00
−102.3
35.50
−108.5
26.91
−114.6
7.14
3.5 ± 1.0−102.7
β-spodumene0.333δ
%
-
0.00
−96.11
25.33
−101.1
41.48
−106.7
28.70
−113.6
4.50
5.7 ± 0.7−102.1
0.500δ%-
0.00
−94.8
7.64
−101.1
31.57
−107.6
44.07
−114.5
16.73
5.7 ± 0.1−105.7
0.600δ%-
0.00
−95.4
3.80
−101.6
23.44
−107.9
42.61
−114.5
30.15
5.5 ± 0.4−108.1
0.667δ%-
0.00
−94.9
3.22
−101.4
14.95
−108.1
41.23
−114.8
40.60
5.5 ± 0.1−109.4
δ line position, line width and barycentre in ppm, and areas in % for each component. The line width used for the deconvolution was variable for each chemical environment. * Experiments with nominal x equal to 0.0 and 0.111 have experimental x values equal to 0.08 and 0.20 due to the loss of lithium atoms.
Table 5. Deconvolution of the 7Li MAS NMR spectra of β-eucryptite and β-spodumene selected samples.
Phasex Value%δiso (ppm)Δδiso (ppm)G/LCQ (kHz)η
β-eucryptite0.00080.1
19.9
0.0
0.0
2.4
1.3
0.7
0.2
104.1 ± 0.4
20.7 ± 2.28
0.39 ± 0.00
0.60 ± 0.53
0.11175.7
24.3
−0.2
−0.2
2.9
1.2
0.6
0.9
90.9 ± 0.60
11.4 ± 0.24
0.50 ± 0.01
0.60 ± 0.68
0.27378.9
21.2
−0.2
−0.2
2.5
1.0
0.6
1.0
91.5 ± 0.52
12.5 ± 2.54
0.48 ± 0.60
0.00 ± 0.40
0.33378.7
21.3
−0.2
−0.2
2.4
1.1
0.6
0.9
88.6 ± 0.56
15.3 ± 0.92
0.49 ± 0.01
0.04 ± 1.15
β-spodumene0.33388.6
11.4
−0.3
−0.4
2.1
1.1
0.6
1.0
119.4 ± 0.43
21.0 ± 1.33
0.39 ± 0.4
0.60 ± 0.4
0.50082.8
17.2
−0.4
−0.4
1.7
1.0
0.6
0.0
118.8 ± 0.39
23.2 ± 2.95
0.38 ± 0.00
0.96 ± 0.61
0.60084.1
15.9
−0.5
−0.5
1.6
0.9
0.6
0.3
116.5 ± 0.4
21.6 ± 1.35
0.41 ± 0.00
0.60 ± 0.25
0.66783.8
16.2
−0.3
−0.3
1.5
0.9
0.6
0.2
115.4 ± 0.35
20.5 ± 1.32
0.42 ± 0.00
0.86 ± 0.31
Publisher’s Note: MDPI stays neutral with regard to jurisdictional claims in published maps and institutional affiliations.

