
Indicator Minerals, Pathfinder Elements, and Portable Analytical Instruments in Mineral Exploration Studies


Abstract
:1. Introduction
2. Indicator Minerals
3. Pathfinder Elements
Element Ratios
4. Portable Techniques for Mineral Exploration Studies
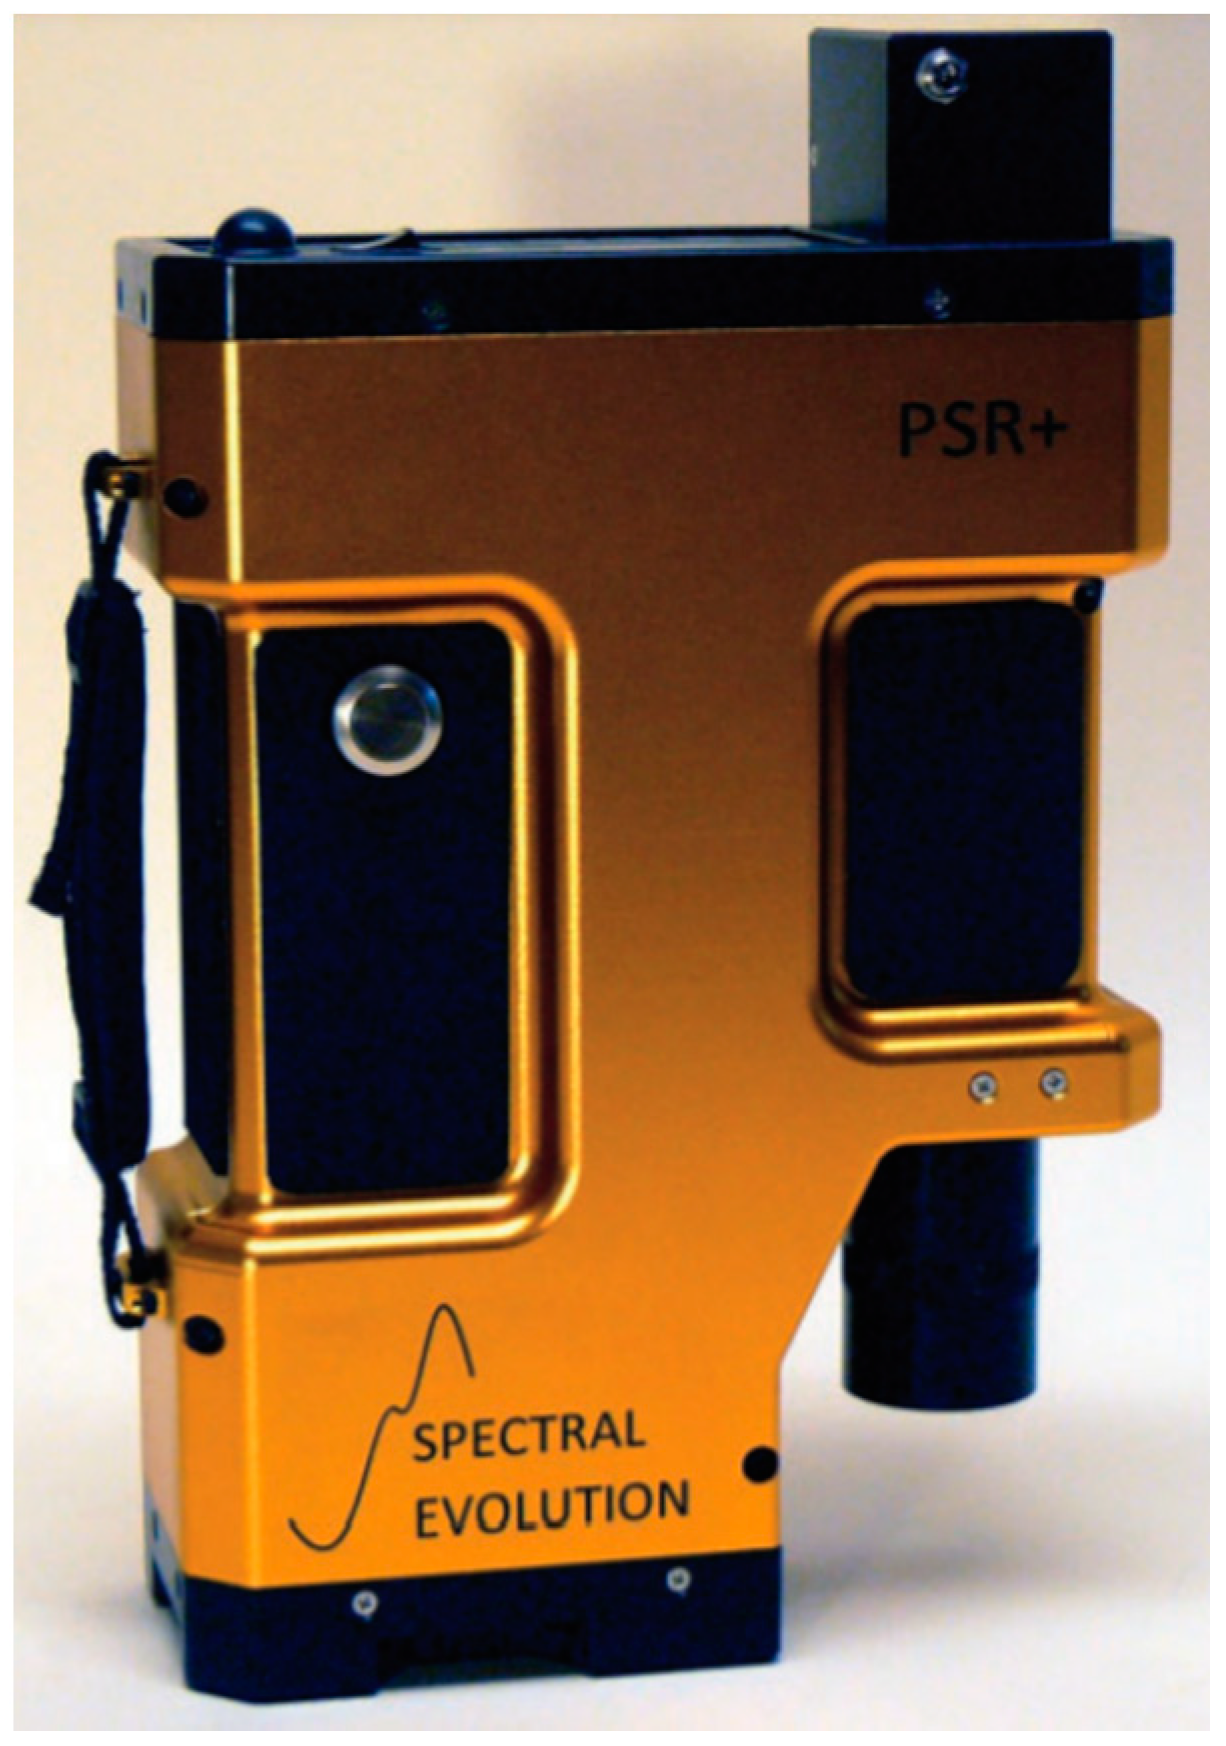
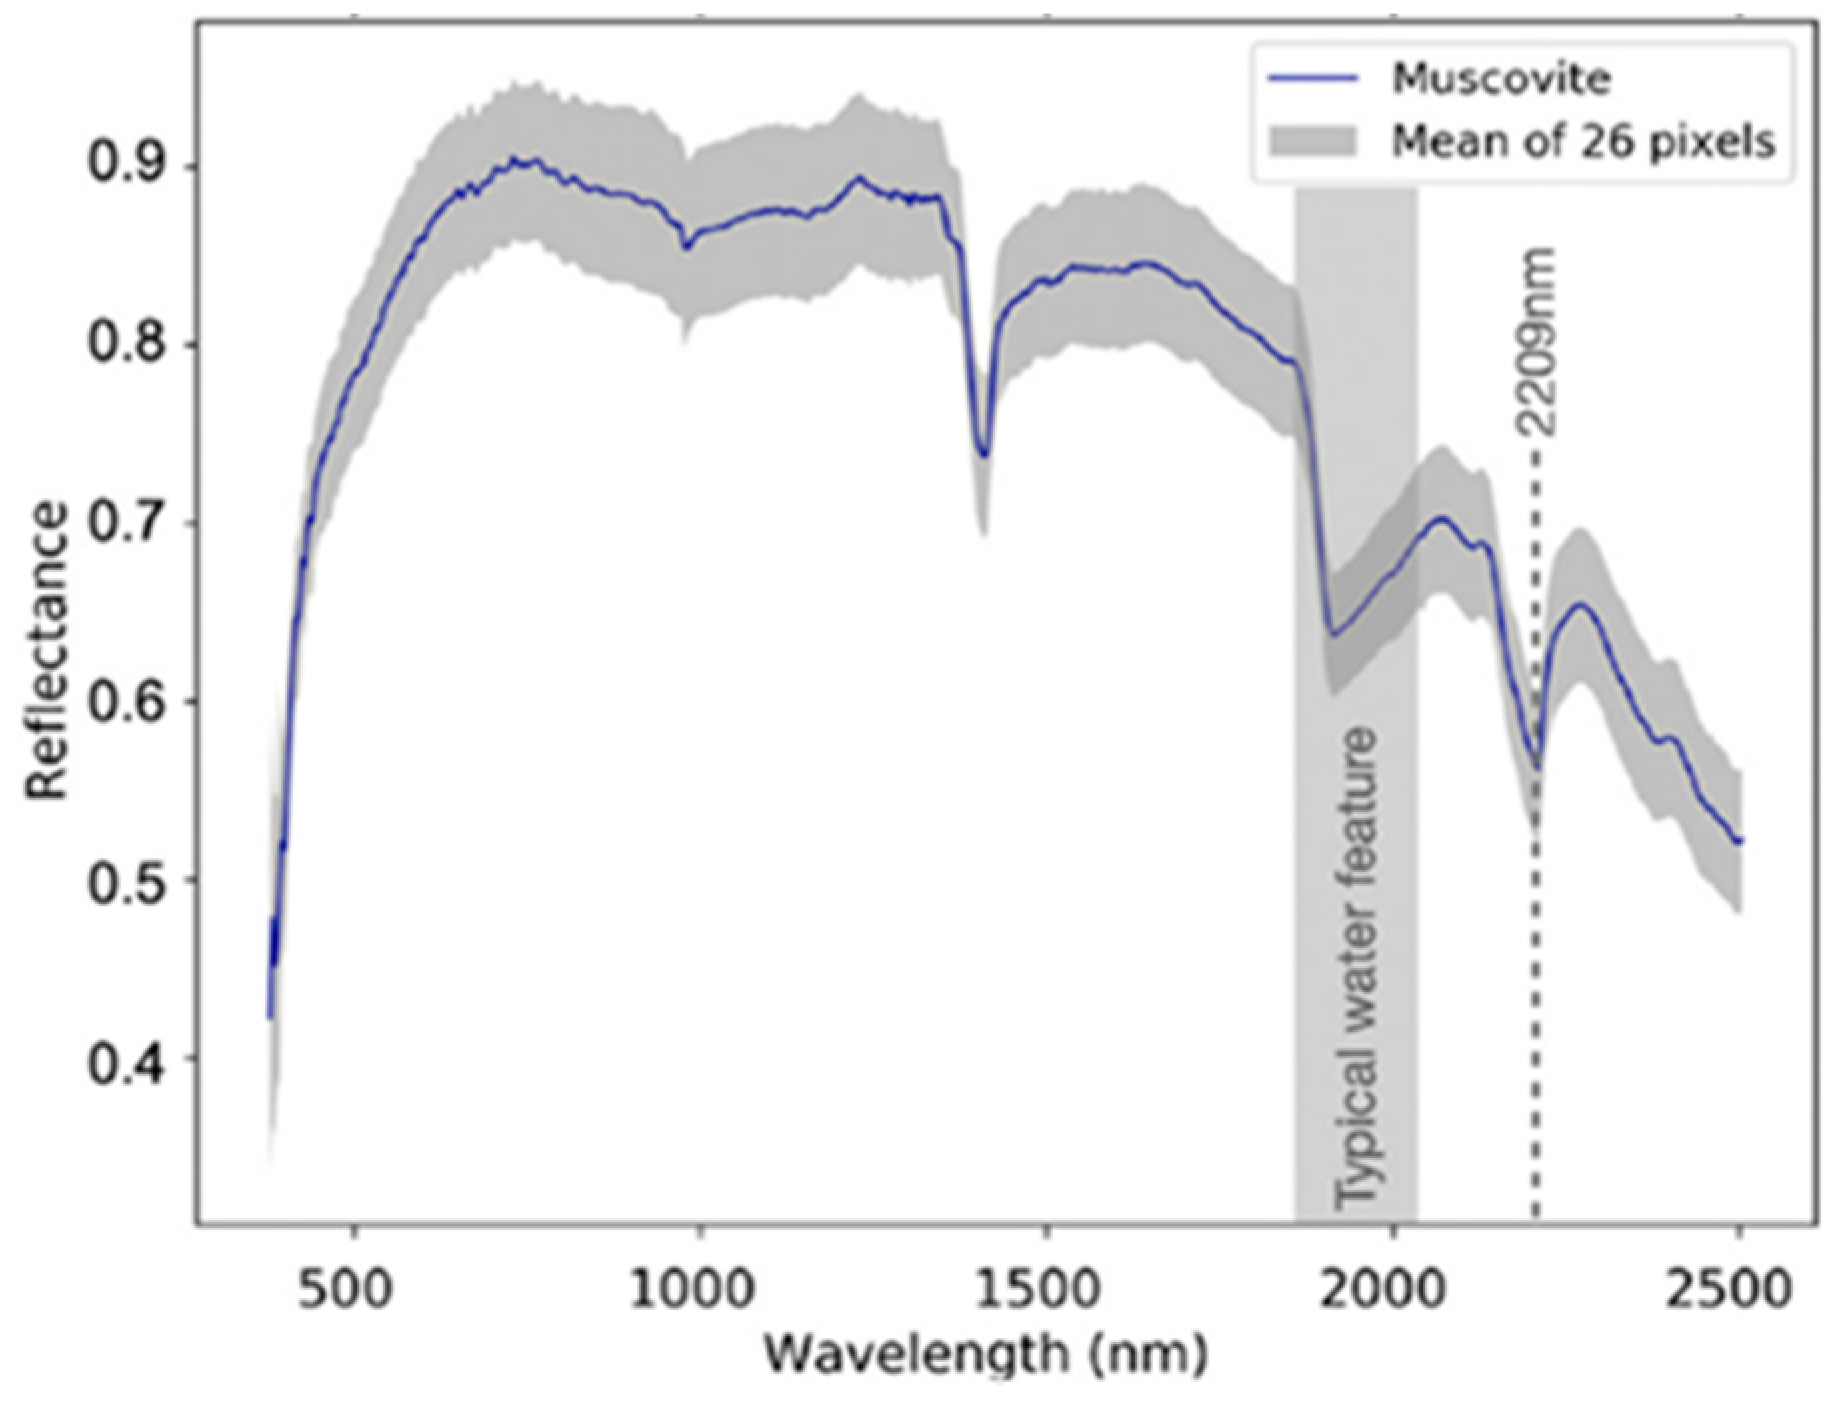
4.1. Portable Vis-NIR-SWIR Macro-Spectroscopy
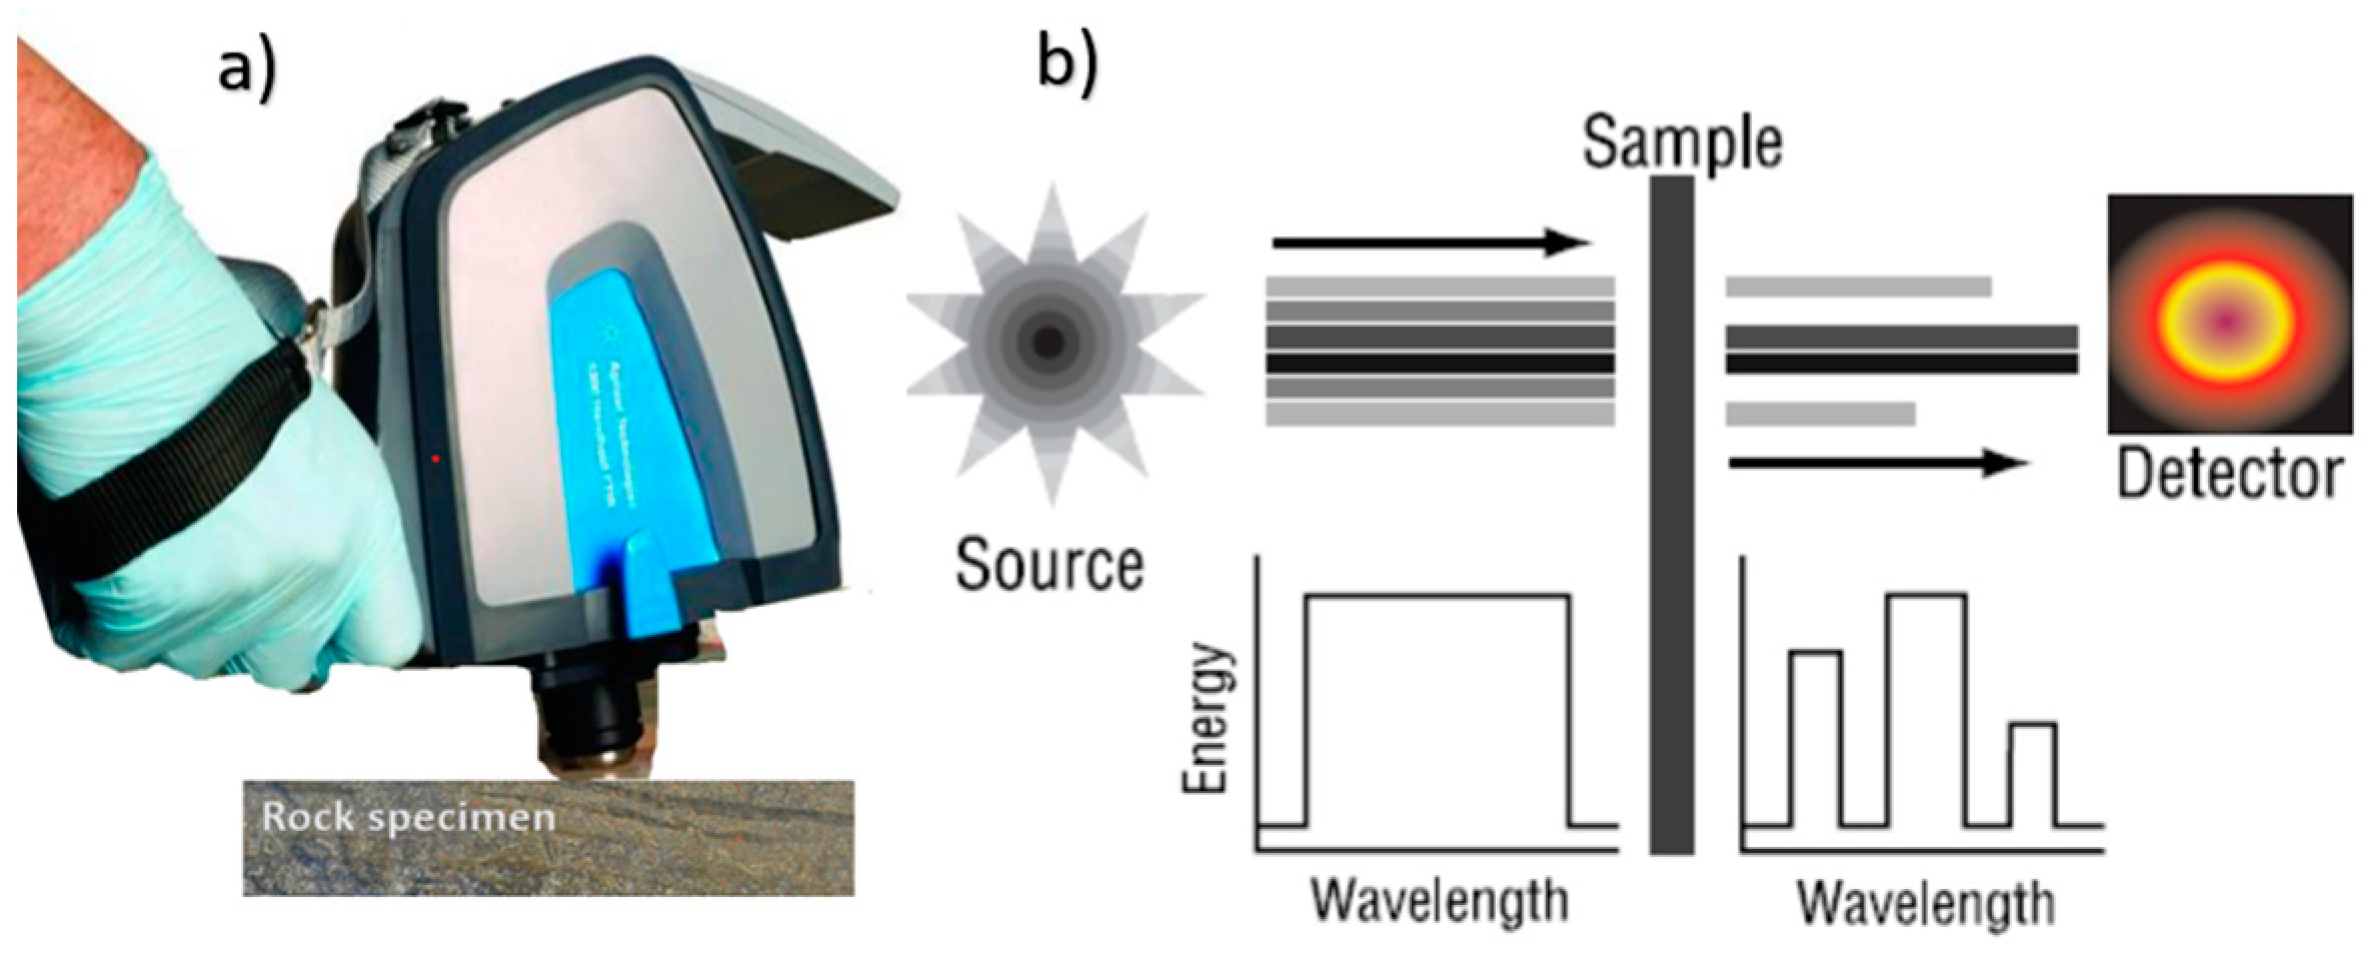
4.2. Portable Fourier Transformed Infrared Spectrometer (FTIR)
4.2.1. FTIR Spectroscopy in Copper Mining and Metallurgy
4.2.2. FTIR Spectroscopy in Limestone Industry
4.2.3. Characterization of Different Minerals in River Sand
4.2.4. FTIR in Hydrocarbon Exploration
4.3. Radiometric Surveys
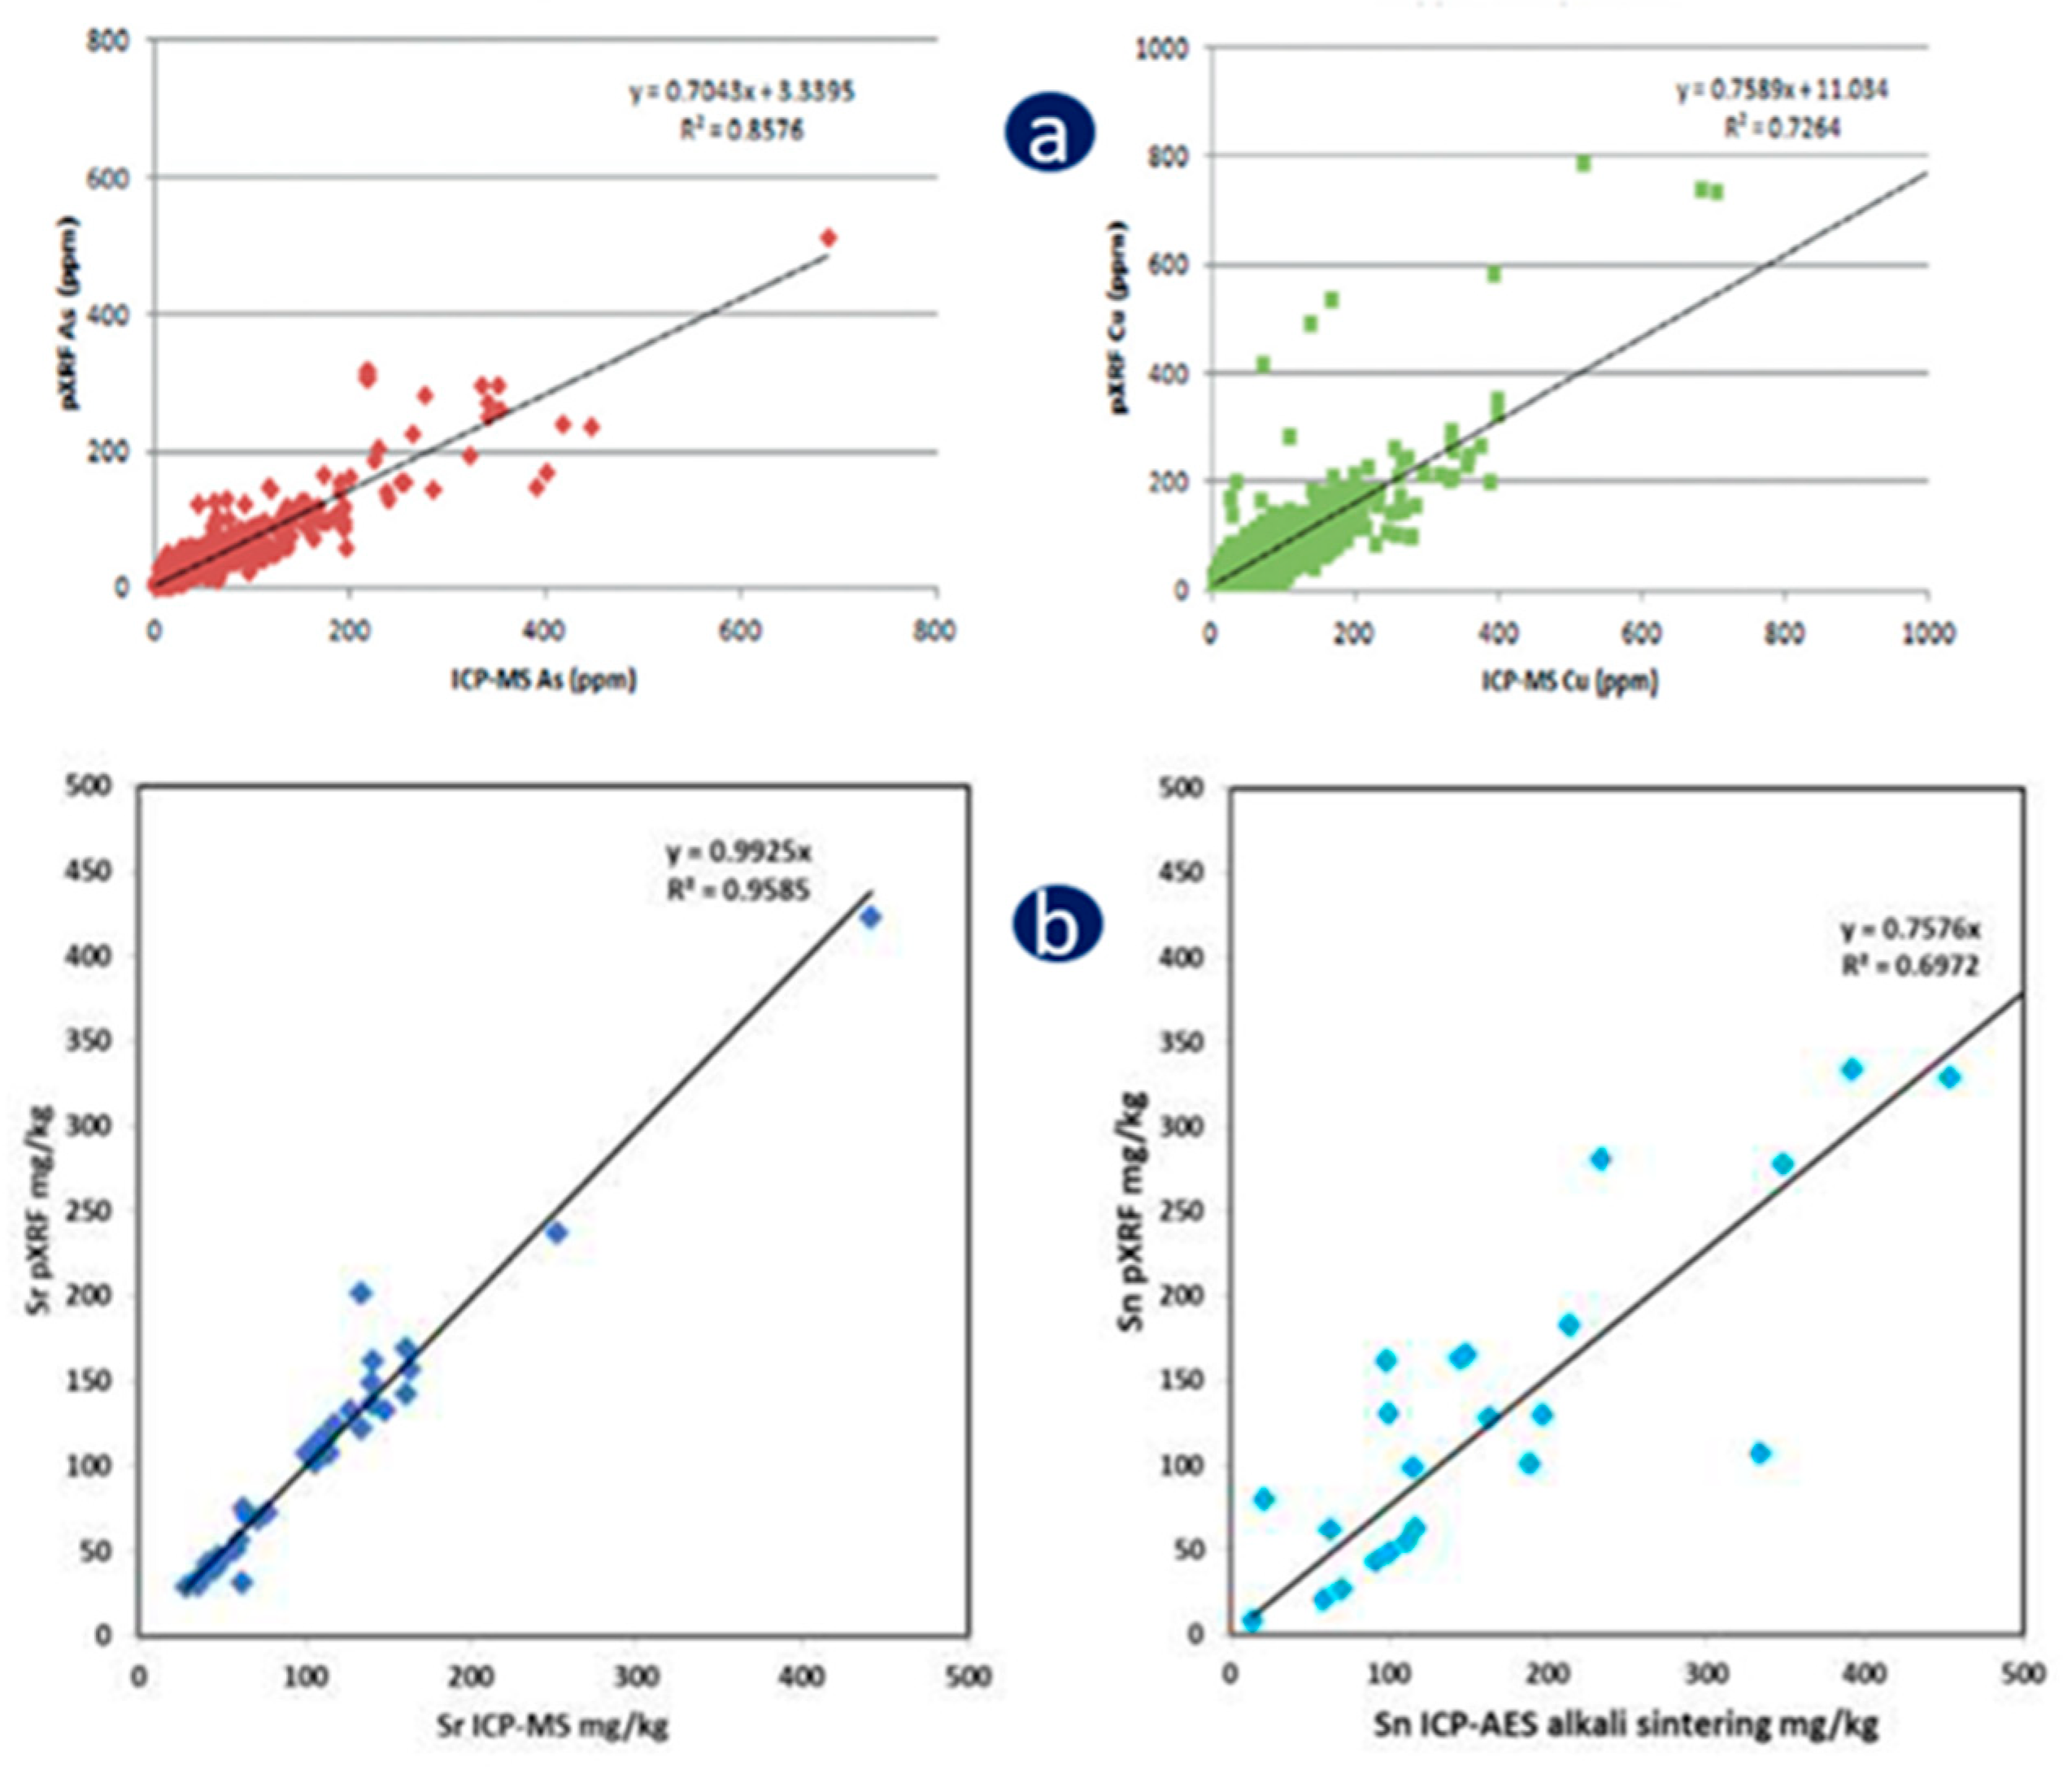
4.4. pXRF
4.4.1. pXRF in Mineral Exploration Using Surface Sediments
4.4.2. pXRF in Li Exploration
4.4.3. pXRF in REE Exploration
4.4.4. Gold and PGE Exploration Studies Using pXRF
5. Portable X-ray Diffraction Spectrometer (pXRD)
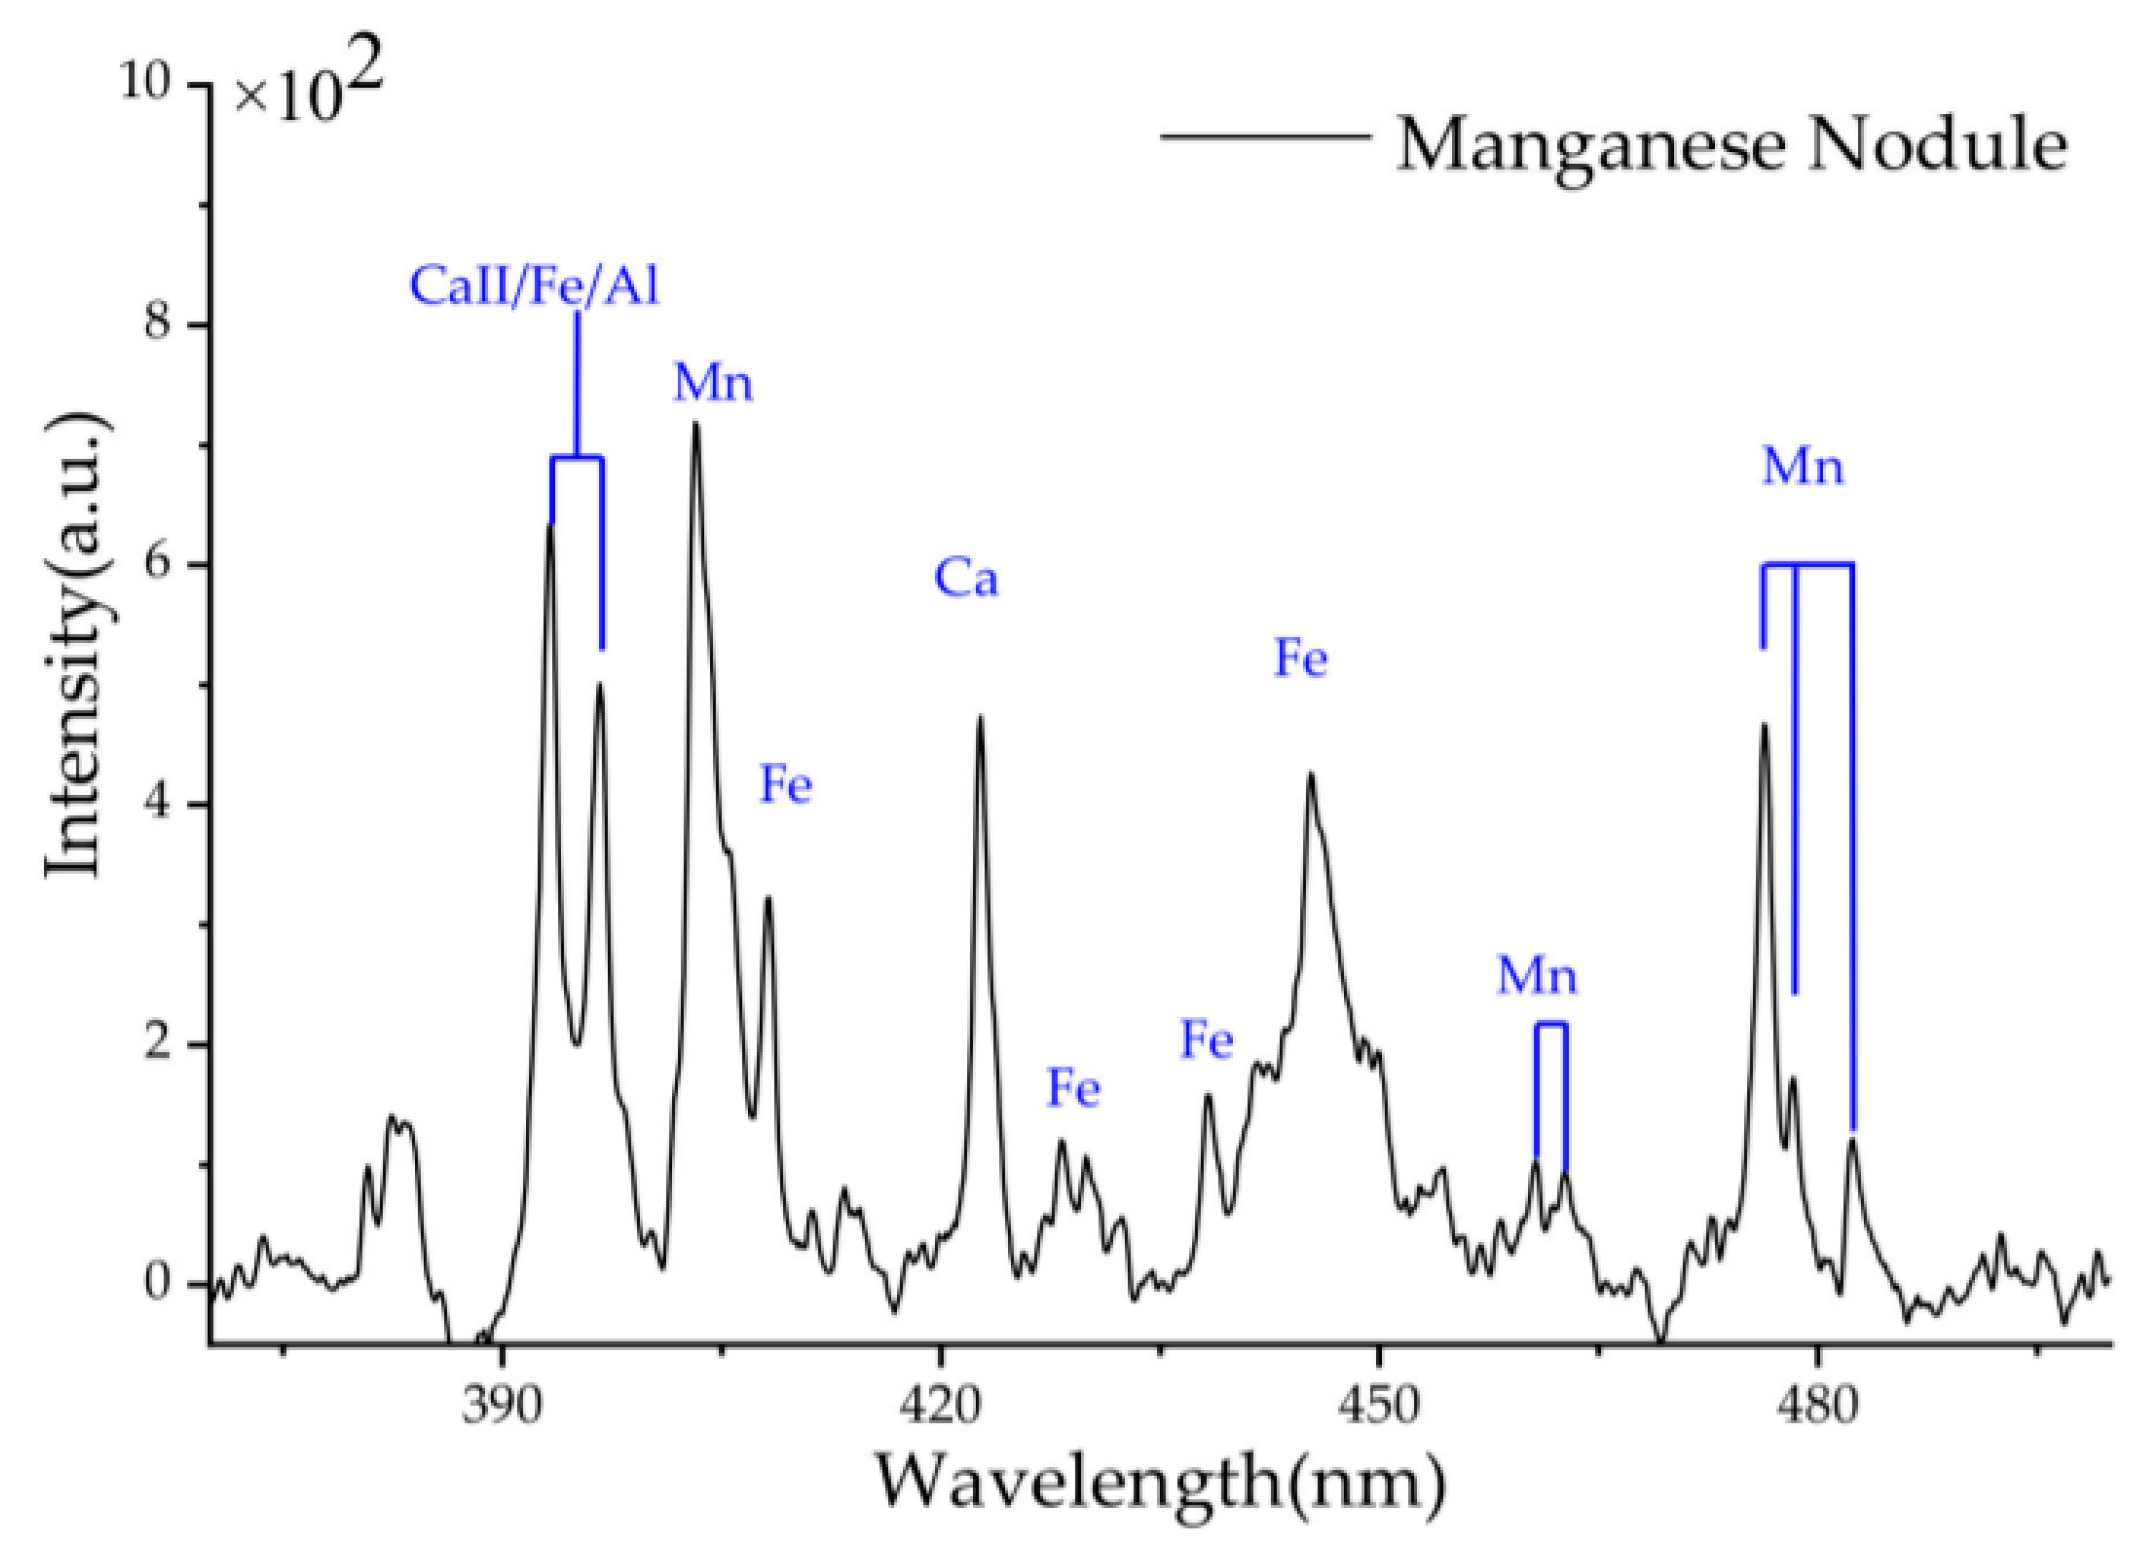
6. pLIBS


6.1. pLIBS to Trace Gold Provenance
6.2. pLIBS in Li-Exploration Studies
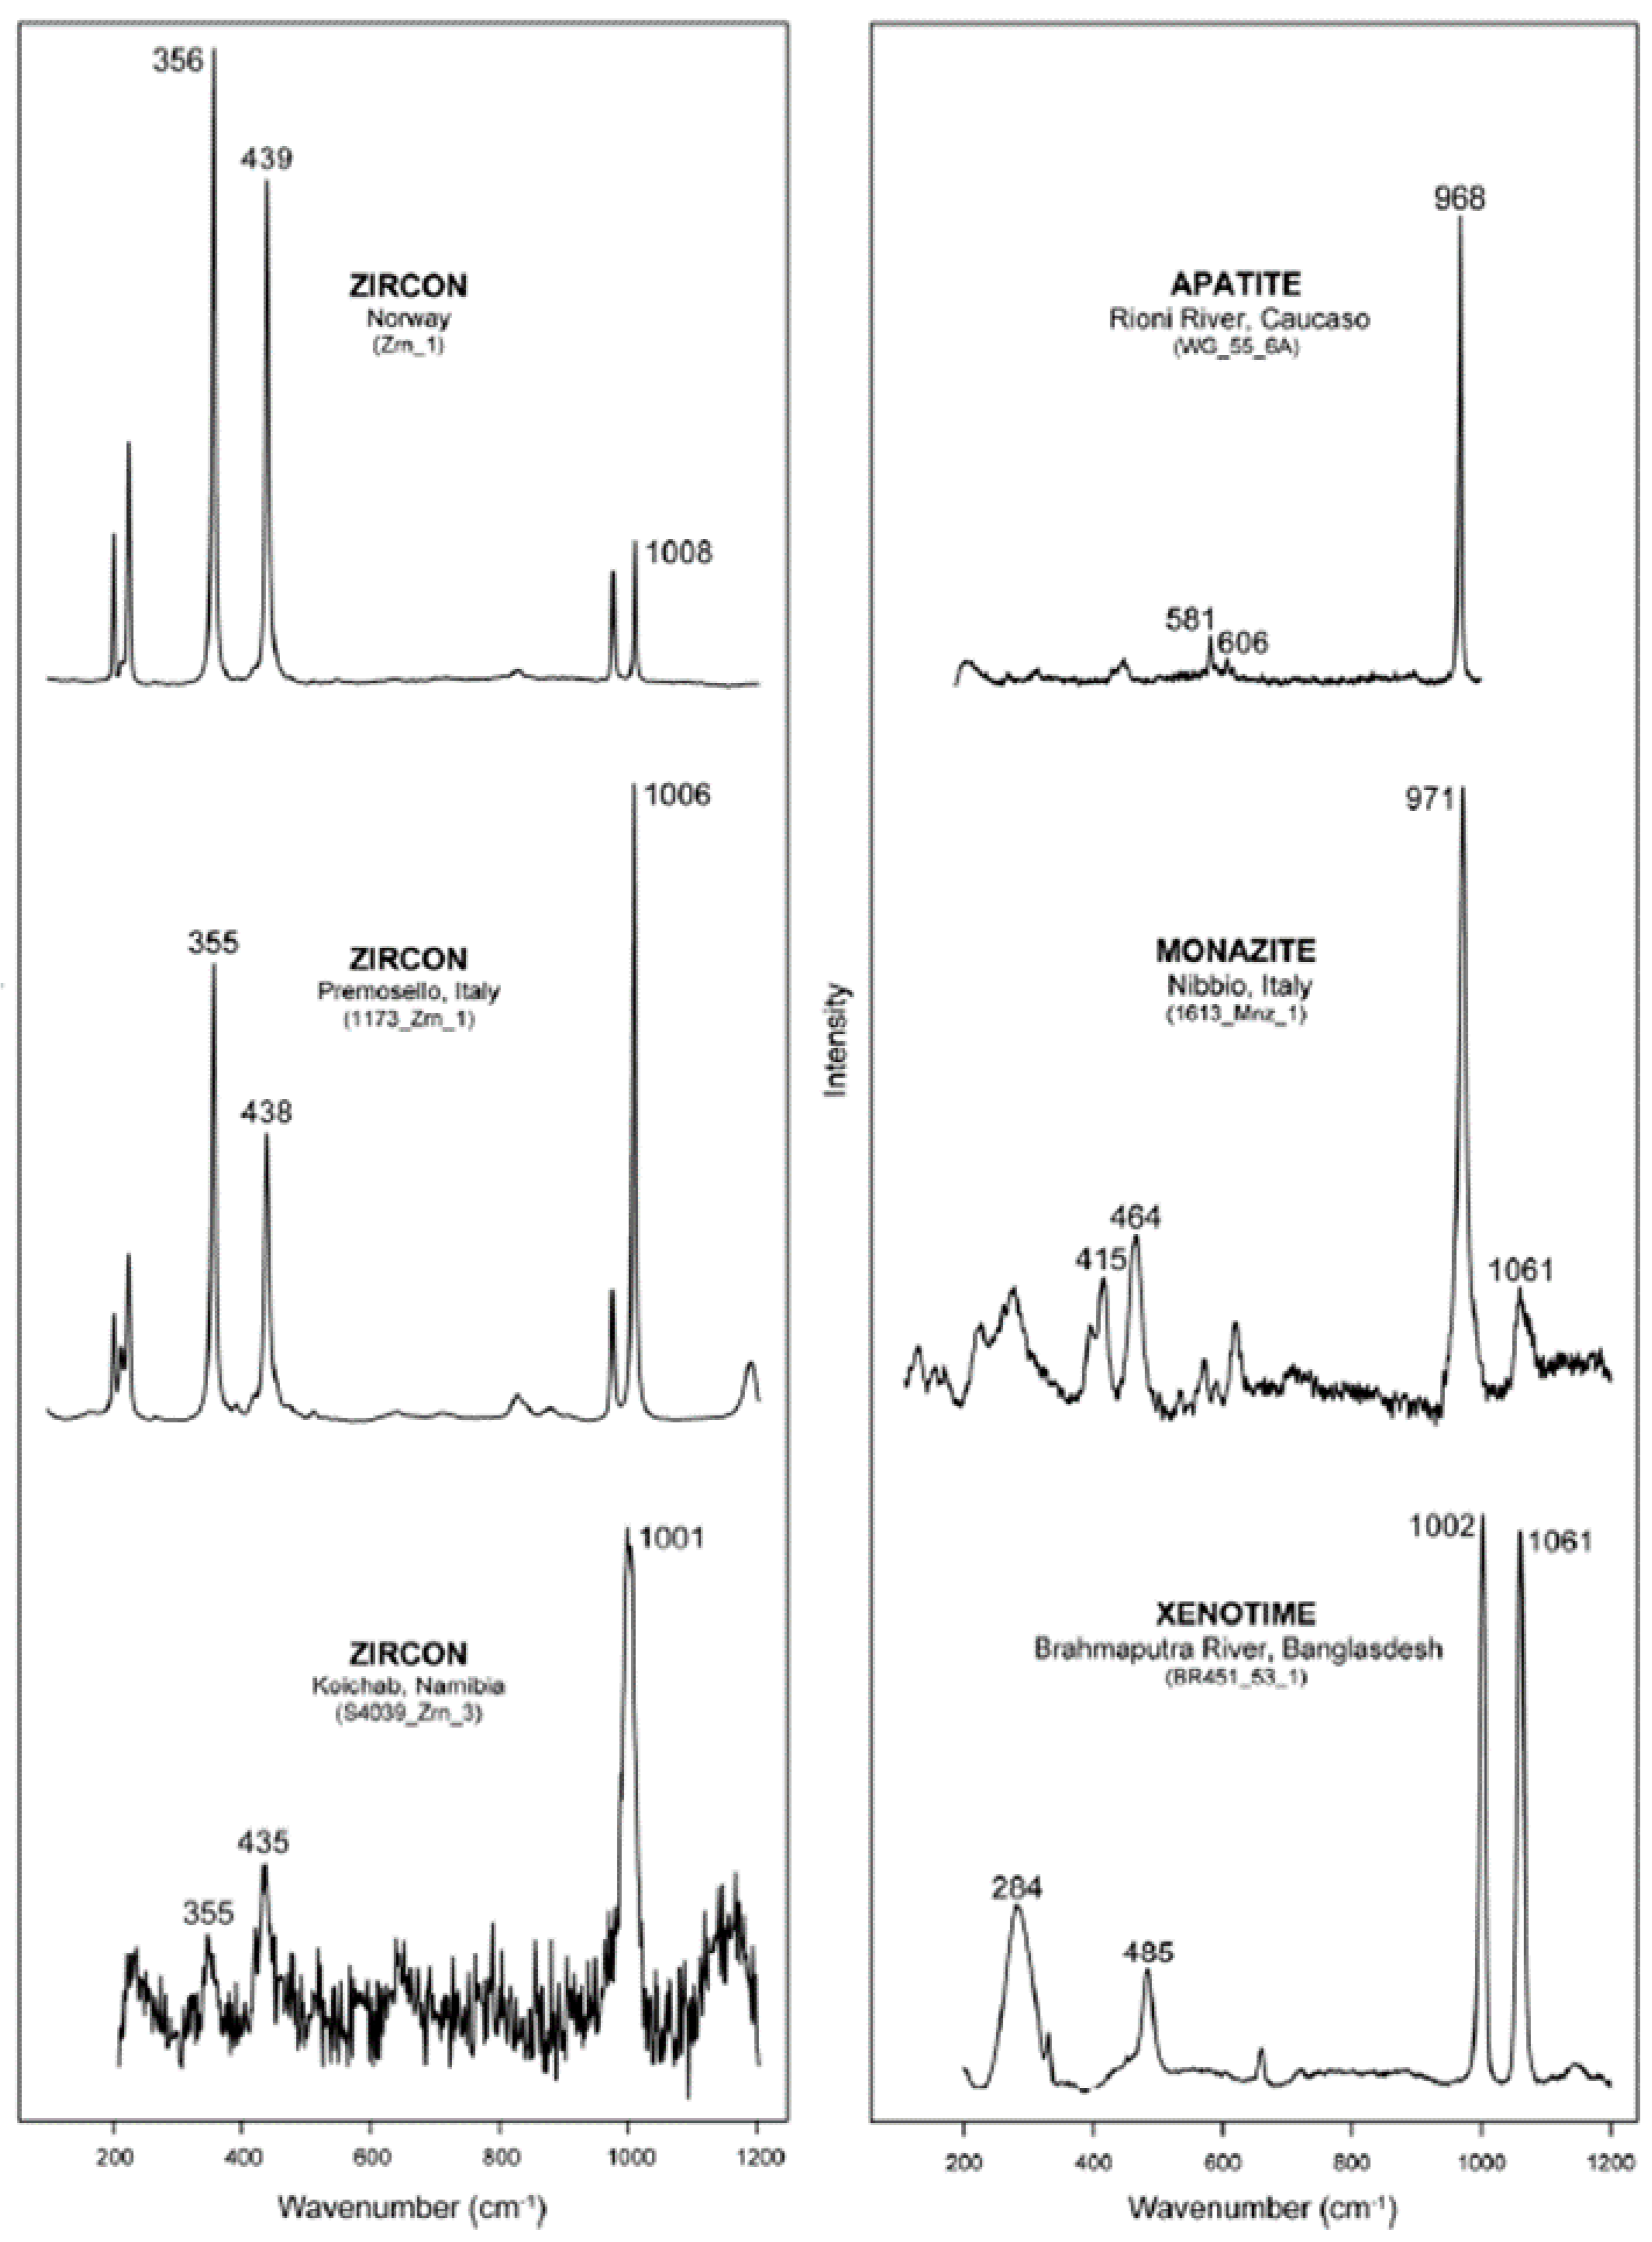
7. μRaman Analyzer
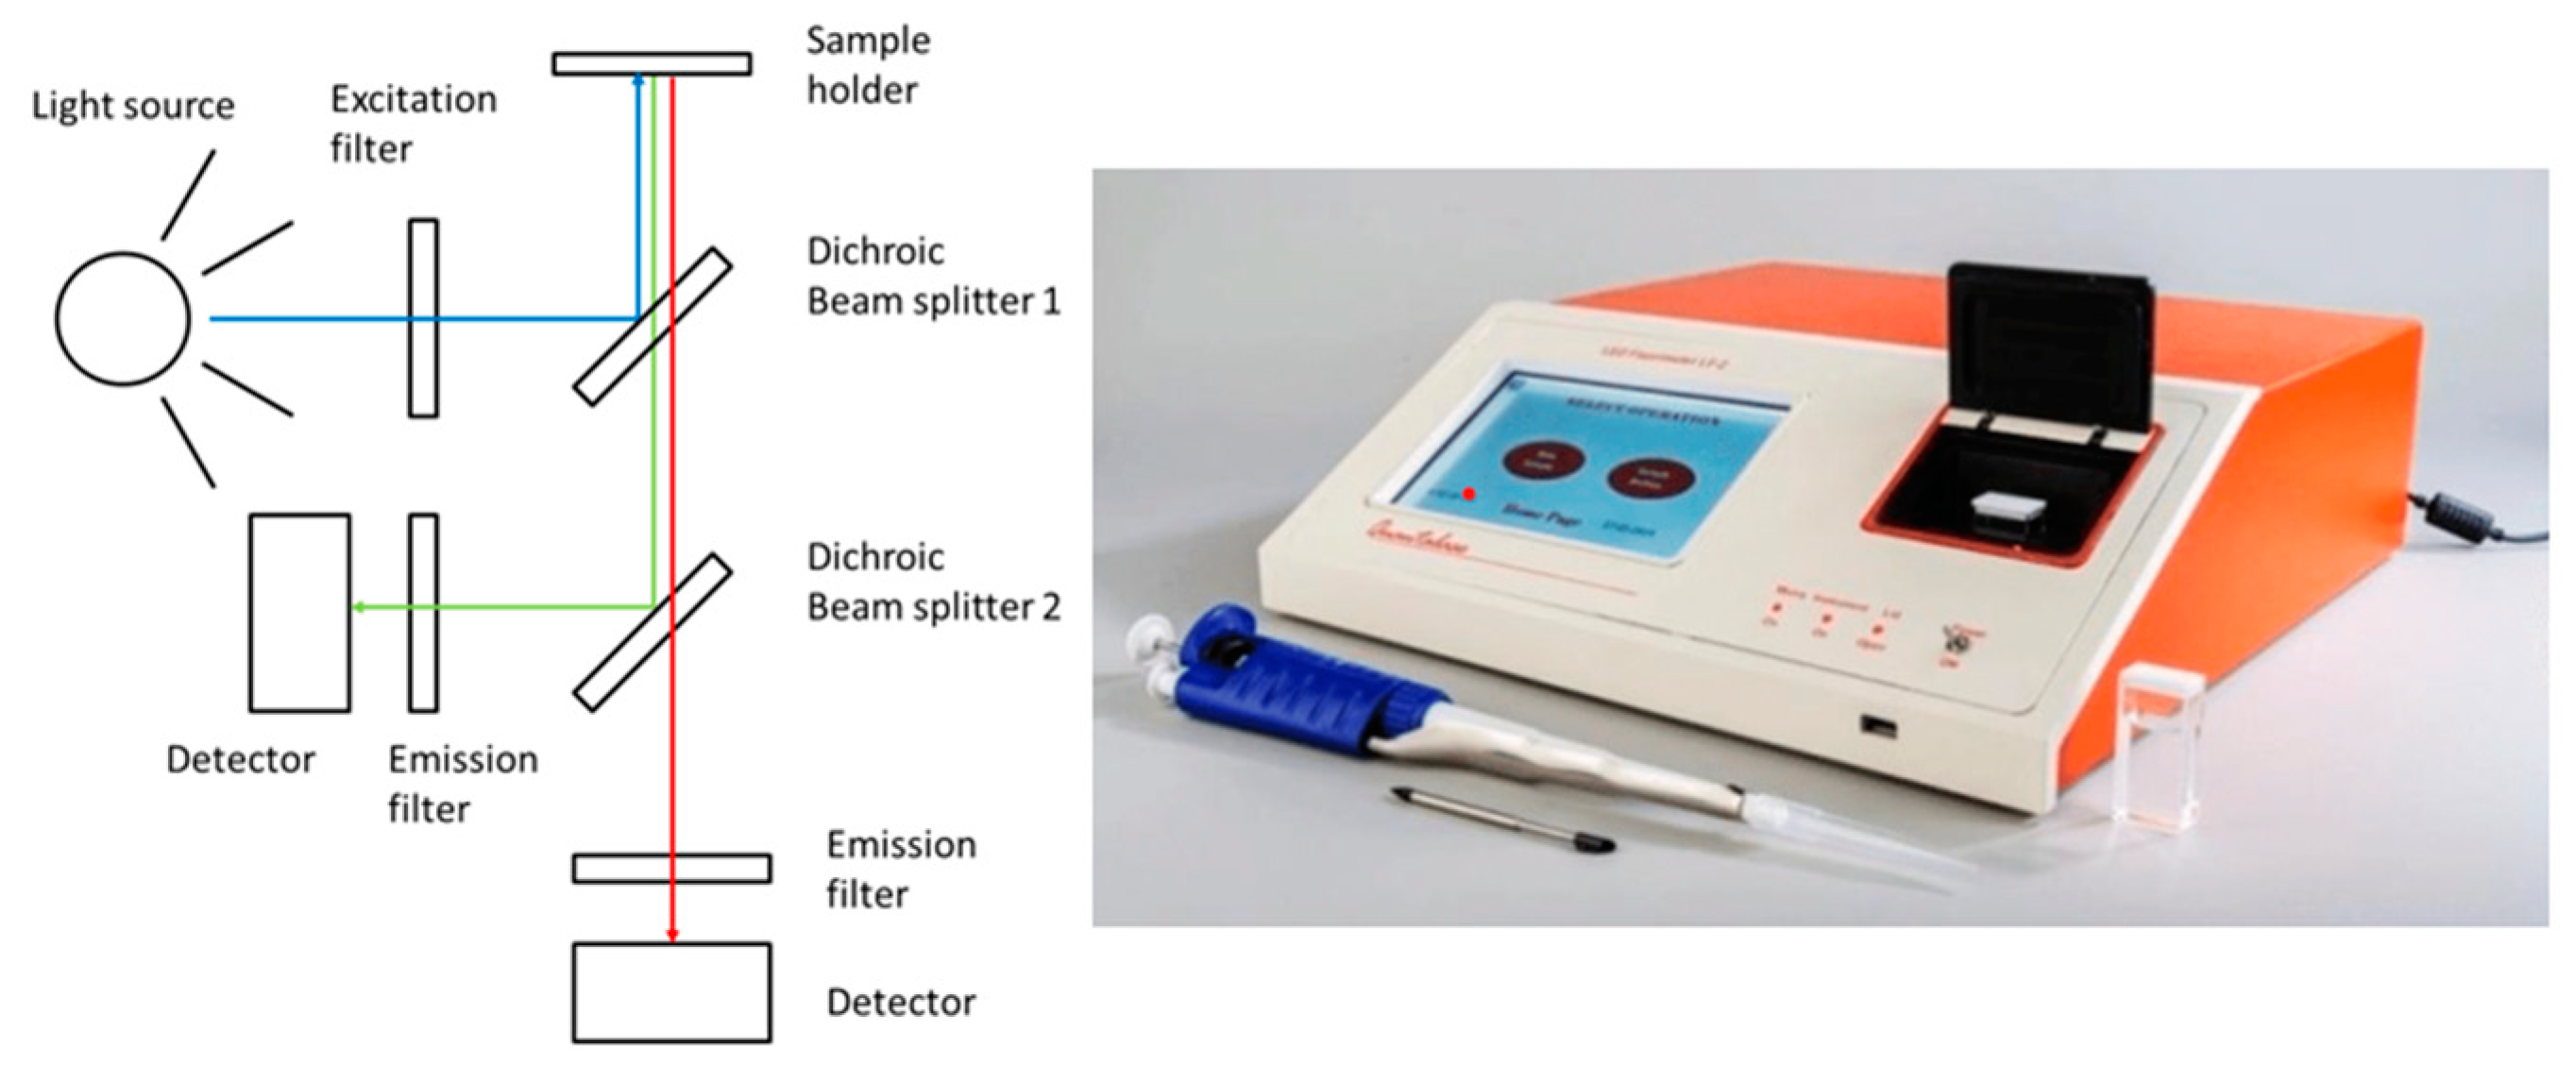
8. LED Fluorimeter
9. Core Scanners
10. Portable Multi-Analytical Devices and Micro Analytical Devices to Explore Terrestrial and Extra-Terrestrial Rocks
11. Role of Portable Analytical Tools/Sensors in Deep-Sea Exploration
12. Comparison of Performances of Field-Portable Instruments versus Laboratory Instruments
13. Challenges in Data Quality and Ways to Overcome
14. Conclusions and Future
Funding
Acknowledgments
Conflicts of Interest
References
- Paulen, R.C.; Paradis, S.; Plouffe, A.; Smith, I.R. Base metal exploration using indicator minerals in glacial sediments, northwestern Alberta, Canada. In Proceedings of the 24TH International Applied Geochemistry Symposium, Fredericton, NB, Canada, 1–4 June 2009; pp. 557–560. [Google Scholar]
- Chakraborty, R.; Kereszturi, G.; Durance, P.; Pullanagari, R.; Ashraf, S.; Anderson, C. Biogeochemical Exploration of Gold Mineralization and its Pathfinder Elements Using Hyperspectral Remote Sensing. In Proceedings of the IGARSS 2020—2020 IEEE International Geoscience and Remote Sensing Symposium, Waikoloa, HI, USA, 26 September–2 October 2020; pp. 5119–5122. [Google Scholar] [CrossRef]
- Azmi, H.; Moarefvand, P.; Maghsoudi, A. Gold anomaly ranking based on stream sediment geochemistry in the Fariman–Kashmar axis, NE Iran. Acta Geochim. 2021, 40, 135–149. [Google Scholar] [CrossRef]
- Balaram, V.; Rahaman, W.; Roy, P. Recent Advances in MC-ICP-MS Applications in the Earth, Environmental Sciences: Challenges and Solution. Geosyst. Geoenvironm. 2022, 1, 100019. [Google Scholar] [CrossRef]
- Baumgartner, R.J.; Kunzmann, M.; Spinks, S.; Bian, X.; John, S.C.; Blaikie, T.N.; Hu, S. Zinc isotope composition of the Proterozoic clastic-dominated McArthur River Zn-Pb-Ag deposit, northern Australia. Ore Geol. Rev. 2021, 139, 104545. [Google Scholar] [CrossRef]
- Balaram, V. Strategies to overcome interferences in elemental and isotopic geochemical studies by quadrupole ICP-MS: A critical evaluation of the recent developments. Rapid Commun. Mass Spectrom. 2021, 35, e9065. [Google Scholar] [CrossRef]
- Xie, X.; Wang, X.; Zhang, Q.; Zhou, G.; Cheng, H.; Liu, D.; Cheng, Z.; Xu, S. Multi-scale geochemical mapping in China. Geochem. Explor. Environ. Anal. 2008, 8, 333–341. [Google Scholar] [CrossRef]
- McClenaghan, M.B. Indicator mineral methods in mineral exploration. Geochem. Explor. Environ. Anal. 2005, 5, 233–245. [Google Scholar] [CrossRef] [Green Version]
- Brandt, S.; Fassbender, M.L.; Klemd, R.; Macauley, C.; Felfer, P.; Haase, K.M. Cumulate olivine: A novel host for heavy rare earth element mineralization. Geology 2020, 49, 457–462. [Google Scholar] [CrossRef]
- Porter, J.K.; McNaughton, N.J.; Evans, N.J.; McDonald, B.J. Rutile as a pathfinder for metals exploration. Ore Geol. Rev. 2020, 120, 103406. [Google Scholar] [CrossRef]
- Nzulu, G.; Eklund, P.; Magnuson, M. Characterization and identification of Au pathfinder minerals from an artisanal mine site using X-ray diffraction. J. Mater. Sci. 2021, 56, 7659–7669. [Google Scholar] [CrossRef]
- Nude, P.M.; Asigri, J.M.; Yidana, S.M.; Arhin, E.; Foli, G.; Kutu, J.M. Identifying Pathfinder Elements for Gold in Multi-Element Soil Geochemical Data from the Wa-Lawra Belt, Northwest Ghana: A Multivariate Statistical Approach. Int. J. Geosci. 2012, 3, 62–70. [Google Scholar] [CrossRef] [Green Version]
- Korshunova, V.A.; Charykova, M. Mobile Forms of Gold and Pathfinder Elements in Surface Sediments at the Novye Peski Gold Deposit and in the Piilola Prospecting Area (Karelia Region). Minerals 2019, 9, 34. [Google Scholar] [CrossRef] [Green Version]
- McClenaghan, M.B.; Cabri, L.J. Review of gold and platinum group element (PGE) indicator minerals methods for surficial sediment sampling. Geochem. Explor. Environ. Anal. 2011, 11, 251–263. [Google Scholar] [CrossRef]
- Morgenstern, R.; Turnbull, R.E.; Hill, M.P.; Durance, P.M.J.; Rattenbury, M.S. Rare Earth Element Mineral Potential in New Zealand. GNS Sci. Consult. Rep. 2018, 23, 211. [Google Scholar]
- Hattori, K.H.; Cameron, E.M. Using the high mobility of palladium in surface media in exploration for platinum group element deposits: Evidence from the Lac des Iles region, northwestern Ontario. Econ. Geol. 2004, 99, 157–171. [Google Scholar] [CrossRef]
- Layton-Matthews, D.; McClenaghan, M.B. Current Techniques and Applications of Mineral Chemistry to Mineral Exploration; Examples from Glaciated Terrain: A Review. Minerals 2022, 12, 59. [Google Scholar] [CrossRef]
- Hale, M. Pathfinder Applications of Arsenic, Antimony and Bismuth in Geochemical Exploration. Dev. Econ. Geol. 1981, 15, 307–323. [Google Scholar] [CrossRef]
- Gale, G.H. Vectoring volcanogenic massive sulphide deposits using rare earth elements and other pathfinder elements at the Ruttan mine, Manitoba (NTS 63B5). In Report of Activities 2003, Manitoba Industry, Trade and Mines; Manitoba Geological Survey: Brandon, MB, Canada, 2003; pp. 54–73. [Google Scholar]
- McClenaghan, M.B.; Parkhill, M.A.; Pronk, A.G.; Sinclair, W.D. Indicator mineral and till geochemical signatures of the Mount Pleasant W-MoBi and Sn-Zn-In deposits, New Brunswick, Canada. J. Geochem. Explor. 2017, 172, 151–166. [Google Scholar] [CrossRef] [Green Version]
- Trueman, D.L.; Cerny, P. Exploration for Rare-Element Granitic Pegmatites. In Granitic Pegmatites in Science and Industry: Mineralogical Association of Canada Short Course Handbook; Cerny, P., Ed.; Scientific Research: Winnipeg, MB, Canada, 1982; Volume 8, pp. 463–494. [Google Scholar]
- Fabre, C.; Ourti, N.; Mercadier, J.; Cardoso-Fernandes, J.; Dias, F.; Perrotta, M.; Koerting, F.; Lima, A.; Kaestner, F.; Koellner, N.; et al. Analyses of Li-Rich Minerals Using Handheld LIBS Tool. Data 2021, 6, 68. [Google Scholar] [CrossRef]
- Makvandi, S.; Beaudoin, G.; McClenaghan, M.B.; Quirt, D.; Ledru, P. PCA of Fe-oxides MLA data as an advanced tool in provenance discrimination and indicator mineral exploration; case study from bedrock and till from the Kiggavik U deposits area (Nunavut, Canada). J. Geochem. Explor. 2019, 197, 199–211. [Google Scholar] [CrossRef]
- Joyce, N.J. Alteration Mineralogy and Pathfinder Element Inventory in the Footprint of the Mcarthur River Unconformity-Related Uranium Deposit, Canada. Master’s Thesis, Queen’s University, Kingston, ON, Canada, 2016. [Google Scholar]
- Cohen, N.E.; Brooks, R.R.; Reeves, R.D. Pathfinders in geochemical prospecting for uranium in New Zealand. Econ. Geol. 1969, 64, 519–525. [Google Scholar] [CrossRef]
- Plouffe, A. The glacial transport and physical partitioning of mercury and gold in till: Implications for mineral exploration with examples from central British Columbia, Canada. Geol. Soc. Lond. Spec. Publ. 2001, 185, 287–299. [Google Scholar] [CrossRef]
- Bayari, E.; Foli, G.L.; Gawu, S.K.Y. Geochemical and pathfinder elements assessment in some mineralized regolith profiles in Bole-Nangodi gold belt in north-eastern Ghana. Environ. Earth Sci. 2019, 78, 268. [Google Scholar] [CrossRef]
- Somarin, K.; Steinhage, I. Use of field-portable XRF in exploration of PGE-enriched zones in the Pilanesberg PGE deposit, Bushveld Complex, South Africa. Geochem. Explor. Environ. Anal. 2021, 21, geochem2020-075. [Google Scholar] [CrossRef]
- Johnsen, A.R.; Thomsen, T.B.; Thaarup, S.M. Test of vegetation-based surface exploration for detection of Arctic mineralisations: The deep buried Kangerluarsuk Zn-Pb-Ag anomaly. J. Geochem. Explor. 2020, 220, 106665. [Google Scholar] [CrossRef]
- Kadel-Harder, I.M.; Spry, P.G.; McCombs, A.L.; Zhang, H. Identifying pathfinder elements for gold in bulk-rock geochemical data from the Cripple Creek Au–Te deposit: A statistical approach. Geochem. Explor. Environ. Anal. 2021, 21, geochem2020-048. [Google Scholar] [CrossRef]
- Steiner, B.M. Tools and Workflows for Grassroots Li–Cs–Ta (LCT) Pegmatite Exploration. Minerals 2019, 9, 499. [Google Scholar] [CrossRef] [Green Version]
- Plimer, I.R.; Elliott, S.M. The use of Rb/Sr ratios as a guide to mineralization. J. Geochem. Explor. 1979, 12, 21–34. [Google Scholar] [CrossRef]
- Meima, J.A.; Rammlmair, D.; Junge, M. The use of Laser Induced Breakdown Spectroscopy for the mineral chemistry of chromite, orthopyroxene and plagioclase from Merensky Reef and UG-2 chromitite, Bushveld Complex, South Africa. Chem. Geol. 2022, 589, 120686. [Google Scholar] [CrossRef]
- Cao, Y.; Linnen, R.; Good, D.; Samson, I. Applications of the combined portable XRF-benchtop SEM methodology to PGE exploration. Ore Geol. Rev. 2018, 101, 32–53. [Google Scholar] [CrossRef]
- El-Makky, A.M. Statistical Analyses of La, Ce, Nd, Y, Nb, Ti, P, and Zr in Bedrocks and Their Significance in Geochemical Exploration at the Um Garayat Gold Mine Area, Eastern Desert, Egypt. Nat. Resour. Res. 2011, 20, 157–176. [Google Scholar] [CrossRef]
- Lindagato, P.; Li, Y.; Yang, G.; Duan, F.; Wang, Z. Application of geostatistical analyst methods in discovering concealed gold and pathfinder elements as geochemical anomalies related to ore mineralization. Geologos 2018, 24, 95–109. [Google Scholar] [CrossRef] [Green Version]
- Leybourne, M.I. Aqueous geochemistry in geochemical exploration. In Mineral Deposits of Canada: A Synthesis of Major Deposit-Types, District Metallogeny, Evolution of Geological Provinces, and Exploration Methods; Goodfellow, W.D., Ed.; Geological Association of Canada: St. John’s, NL, Canada, 2007; Volume 5, pp. 1007–1033. [Google Scholar]
- Narayanaswamy; Balaram, V.; Ramkumar, N.; Anjaiah, K.V. Concentrations of gold in natural waters from lateritic terrain, Wynad-Nilambur gold fields, Kerala, India and its possible role in exploration. J. Geol. Soc. India 1998, 52, 301–304. [Google Scholar]
- Balaram, V.; Satyanarayanan, M.; Anabarasu, K.; Rao, D.V.S.; Dar, A.M.; Kamala, C.T.; Charan, S.N. Hydro-Geochemical Prospecting for Platinum Group of Elements (PGE) in the Sittampundi Layered Ultramafic Complex, Tamil Nadu, India: Pd as an Indicator of Mineralization. J. Geol. Soc. India 2019, 94, 341–350. [Google Scholar] [CrossRef]
- Balaram, V. Current Advances in Miniaturization of Analytical Instruments—Applications in Cosmochemistry, Geochemistry, Exploration and Environmental Sciences. Spectroscopy 2016, 31, 40–44. [Google Scholar]
- Crocombe, R.A. Portable Spectroscopy. Appl. Spectrosc. 2018, 72, 1701–1751. [Google Scholar] [CrossRef]
- Francos, N.; Notesco, G.; Ben-Dor, E. Estimation of the Relative Abundance of Quartz to Clay Minerals Using the Visible–Near-Infrared–Shortwave-Infrared Spectral Region. Appl. Spectrosc. 2021, 75, 882–892. [Google Scholar] [CrossRef]
- Booysen, R.; Lorenz, S.; Thiele, S.T.; Fuchsloch, W.C.; Marais, T.; Nex, P.A.M.; Gloaguen, R. Accurate hyperspectral imaging of mineralized outcrops: An example from lithium-bearing pegmatites at Uis, Namibia. Remote Sens. Environ. 2022, 269, 112790. [Google Scholar] [CrossRef]
- Simpson, M.P.; Christie, A.B. Exploration of New Zealand mineral deposits and geothermal systems using X-ray diffraction (XRD) and reflectance spectrometry (SWIR): A comparison of techniques. GNS Sci. Rep. 2016, 61, 45. [Google Scholar] [CrossRef]
- Booysen, R.; Jackisch, R.; Lorenz, S.; Zimmermann, R.; Kirsch, M.; Nex, P.A.M.; Gloaguen, R. Detection of REEs with lightweight UAV-based hyperspectral imaging. Sci. Rep. 2020, 10, 17450. [Google Scholar] [CrossRef]
- Barton, I.F.; Gabriel, M.J.; Lyons-Baral, J.; Barton, M.D.; Duplessis, L.; Roberts, C. Extending geo-metallurgy to the mine scale with hyperspectral imaging: A pilot study using drone- and ground-based scanning. Min. Metall. Explor. 2021, 38, 799–818. [Google Scholar] [CrossRef]
- Stuart, M.B.; McGonigle, A.J.S.; Davies, M.; Hobbs, M.J.; Boone, N.A.; Stanger, L.R.; Zhu, C.; Pering, T.D.; Willmott, J.R. Low-Cost Hyperspectral Imaging with a Smartphone. J. Imaging 2021, 7, 136. [Google Scholar] [CrossRef] [PubMed]
- Liancun, X.; Zhizhong, Z.; Chunxia, C.; Yang, G. Mineral identification and geological mapping using near-infrared spectroscopy analysis. In Proceedings of the 2017 International Conference on Progress in Informatics and Computing (PIC), Nanjing, China, 15–17 December 2017. [Google Scholar] [CrossRef]
- Lemière, B.; Uvarova, Y.A. New developments in field portable geochemical techniques and on-site technologies and their place in mineral exploration. Geochem. Explor. Environ. Anal. 2019, 20, 205–216. [Google Scholar] [CrossRef]
- Salisbury, J.W.; Walter, L.S.; Vergo, N. Mid-InfraRed (2.1–25 μm) Spectra of Minerals: First Edition, 1st ed.; United States Geological Survey: Reston, VI, USA, 1986.
- Kakavand, A.; Adl-Zarrabi, B. Introduction of Possible Inspection Methods for Evaluating Thermal Aging Status of Existing Pre-Insulated District Heating Systems; University of Technology: Gothenburg, Sweden, 2015; pp. 1–29. [Google Scholar]
- Dehaine, Q.; Tijsseling, L.T.; Rollinson, G.K.; Buxton, M.W.N.; Glass, H.J. Geometallurgical Characterization with Portable FTIR: Application to Sediment-Hosted Cu-Co Ores. Minerals 2022, 12, 15. [Google Scholar] [CrossRef]
- Bawa, A.S.; Ousmane, M.S.; Mamane, O.S.; Yacoubai, A.C.; Natatou, I. XRD and Infrared study of limestone from Chadawanka (Tahoua, Niger). J. Mater. Environ. Sci. 2021, 12, 664–672. [Google Scholar]
- Chandrasekaran, A.; Kumar, C.K.S.; Sathish, V.; Manigandan, S.; Tamilarasi, A. Effect of minerals and heavy metals in sand samples of Ponnai river, Tamil Nadu, India. Sci. Rep. 2021, 11, 23199. [Google Scholar] [CrossRef]
- Khang, V.V.; Korovkin, M.V.; Ananyeva, L.G. Identification of clay minerals in reservoir rocks by FTIR spectroscopy. IOP Conf. Ser. Earth Environ. Sci. 2016, 43, 012004. [Google Scholar] [CrossRef] [Green Version]
- Zhang, J.; Cao, J.; Xiang, B.; Zhou, N.; Ma, W.; Li, E. Fourier-Transform Infrared Proxies for Oil Source and Maturity: Insights from the Early Permian Alkaline Lacustrine System, Junggar Basin (NW China). Energy Fuels 2019, 33, 10704–10717. [Google Scholar] [CrossRef]
- Spasennykh, M.; Chekhonin, E.; Leushina, E. A Summary of “Petrophysics and Geochemistry of Unconventional Reservoirs”. Geosciences 2021, 11, 453. [Google Scholar] [CrossRef]
- Killeen, P. Gamma ray spectrometric methods in uranium exploration—Application and interpretation. Geophys. Geochem. Search Met. Ores 1979, 31, 163–230. [Google Scholar]
- McCay, A.T.; Harley, T.L.; Younger, P.L.; Sanderson, D.C.W.; Cresswell, A.J. Gamma-ray Spectrometry in Geothermal Exploration: State of the Art Techniques. Energies 2014, 7, 4757–4780. [Google Scholar] [CrossRef] [Green Version]
- Bharti, R.; Kalimuthu, R.; Ramakrishnan, D. Spectral pathways for exploration of secondary uranium: An investigation in the desertic tracts of Rajasthan and Gujarat, India. Adv. Space Res. 2019, 56, 1613–1626. [Google Scholar] [CrossRef]
- Maden, N.; Akarya, E. Gamma ray spectrometry for recognition of hydrothermal alteration zones related to a low sulfidation epithermal gold mineralization (eastern Pontides, NE Türkiye). J. Appl. Geophys. 2015, 122, 74–85. [Google Scholar] [CrossRef]
- Shives, R.B.K. Using gamma ray spectrometry to find rare metals. In Symposium on Strategic and Critical Materials Proceedings, Nov. 2015, Victoria, British Columbia. British Columbia Ministry of Energy and Mines, British Columbia Geological Survey Paper; Simandl, G.J., Neetz, M., Eds.; British Columbia Geological Survey: Victoria, BC, Canada, 2015; Volume 3, pp. 199–209. [Google Scholar]
- Bosco, G.L. Development and application of portable, hand-held X-ray fluorescence spectrometers. Trends Anal. Chem. 2013, 45, 121–134. [Google Scholar] [CrossRef]
- Potts, P.J.; Webb, P.C. X-ray fluorescence spectrometry. J. Geochem. Explor. 1992, 44, 251–296. [Google Scholar] [CrossRef]
- Yellepeddi, R.; Thomas, R. New developments in wavelength dispersive XRF and XRD for the analysis of foodstuffs and pharmaceutical materials. Spectroscopy 2006, 21, 36–41. [Google Scholar]
- Balaram, V. Current and emerging analytical techniques for geochemical and geochronological studies. Geol. J. 2021, 56, 2300–2359. [Google Scholar] [CrossRef]
- Hall, G.E.M.; McClenaghan, M.B.; Pagé, L. Application of portable XRF to the direct analysis of till samples from various deposit types in Canada. Geochem. Explor. Environ. Anal. 2015, 16, 62–84. [Google Scholar] [CrossRef]
- Camara, C.G.; Escobar, J.V.; Hird, J.R.; Putterman, S.J. Correlation between nanosecond x-ray flashes and stick-slip friction in peeling tape. Nature 2008, 455, 1089–1092. [Google Scholar] [CrossRef]
- Gallhofer, D.; Lottermoser, B.G. The influence of spectral interferences on critical element determination with portable x-ray fluorescence spectrometer (pXRF). Minerals 2018, 8, 320. [Google Scholar] [CrossRef] [Green Version]
- Analytical Methods Committee AMCTB No. 89. Hand-held X-ray fluorescence spectrometry. Anal. Methods 2019, 11, 2498–2501. [Google Scholar] [CrossRef]
- Bloise, A.; Miriello, M. Multi-Analytical Approach for Identifying Asbestos Minerals in Situ. Geosciences 2018, 8, 133. [Google Scholar] [CrossRef] [Green Version]
- Durance, P.; Jowitt, S.M.; Bush, K. An assessment of portable X-ray fluorescence spectroscopy in mineral exploration, Kurnalpi Terrane, Eastern Goldfields Super terrane, Western Australia. Appl. Earth Sci. Trans. Inst. Min. Metall. B 2014, 123, 150–163. [Google Scholar] [CrossRef]
- Sarala, P. New advances in geochemical exploration in glaciated terrain—examplesfrom northern Finland. In Proceedings of the 24th International Applied Geochemistry Symposium, Fredericton, NB, Canada, 1–4 June 2009; Volume II, pp. 585–587. [Google Scholar]
- Somarin, A.; Zhou, L.; Steinhage, I. Application of handheld XRF on Ta-Nb-Sn-W ore: Factory calibration or user calibration? Geochem. J. 2021, 55, 149–158. [Google Scholar] [CrossRef]
- Van de Ven, M.; Gazley, M.; Sterk, R.; Aldrich, S.; Werner, E. Exploration for Lithium-Caesium-Tantalum (LCT) pegmatites in New Zealand. In Proceedings of the New Zealand Minerals Forum, Hamilton, New Zealand, 18 November 2020; pp. 87–91. [Google Scholar]
- Simandl, G.J.; Fajber, R.; Paradis, S. Portable X-ray fluorescence in the assessment of rare earth element enriched sedimentary phosphate deposits. Geochem. Explor. Environ. Anal. 2014, 14, 161–169. [Google Scholar] [CrossRef]
- Robertson, M.E.A.; Feather, C.E. Determination of gold, platinum and uranium in South African ores by high-energy XRF spectrometry. X-Ray Spectrom. 2004, 33, 164–173. [Google Scholar] [CrossRef]
- Balaram, V.; Subramanyam, K.S.V. Sample Preparation for Geochemical Analysis: Strategies and Significance. Adv. Sample Prep. 2022, 1, 100010. [Google Scholar] [CrossRef]
- Lemiere, B.A. Review of pXRF (Field Portable X-ray Fluorescence) Applications for Applied Geochemistry. J. Geochem. Explor. 2018, 188, 350–363. [Google Scholar] [CrossRef] [Green Version]
- Borisov, S.V.; Podberezskaya, N.V. X-ray diffraction analysis: A brief history and achievements of the first century. J. Struct. Chem. 2012, 53, 1–3. [Google Scholar] [CrossRef]
- Etter, M.; Dinnebier, R.E. A Century of Powder Diffraction: A Brief History. Z. Anorg. Allg. Chem. 2014, 640, 3015–3028. [Google Scholar] [CrossRef]
- Hansford, G.; Thomas, R. Handheld X-ray Diffraction for Remote, Field-Based Applications. Spectroscopy 2015, 30, 14–21. [Google Scholar]
- Pöllmann, H.; König, U. Monitoring of Lithium Contents in Lithium Ores and Concentrate-Assessment Using X-ray Diffraction (XRD). Minerals 2021, 11, 1058. [Google Scholar] [CrossRef]
- Cremers, D.A.; Radziemski, L.J. Handbook of Laser-Induced Breakdown Spectroscopy; John Wiley & Sons: Hoboken, NJ, USA, 2013. [Google Scholar]
- Radziemski, L.; Cremers, D. A brief history of laser-induced breakdown spectroscopy: From the concept of atoms to LIBS 2012. Spectrochim. Acta Part B At. Spectrosc. 2013, 87, 3–10. [Google Scholar] [CrossRef]
- Connors, B.; Somers, A.; Day, D. Application of Handheld Laser-Induced Breakdown Spectroscopy (LIBS) to Geochemical Analysis. Appl. Spectrosc. 2016, 70, 810–815. [Google Scholar] [CrossRef] [PubMed]
- Senesi, G.S.; Harmon, R.S.; Hark, R.R. Field-portable and handheld LIBS: Historical review, current status and future prospects. Spectrochim. Acta Part B At. Spectrosc. 2020, 175, 106013. [Google Scholar] [CrossRef]
- Harmon, R.S.; Senesi, G.S. Laser-Induced Breakdown Spectroscopy—A geochemical tool for the 21st century. Appl. Geochem. 2021, 128, 104929. [Google Scholar] [CrossRef]
- Hark, R.R.; Harmon, R.S. Geochemical Fingerprinting Using LIBS. In Laser Induced Breakdown Spectroscopy–Theory & Applications; Musazzi, S., Perini, U., Eds.; Springer: Berlin/Heidelberg, Germany, 2014; pp. 309–348. [Google Scholar]
- Mukhopadhyay, P. Development and Characterization of Diode Pumped Solid State Lasers. Saarbrucken; LAP LAMBERT Academic Publishing GmbH & Co. KG: Saarbrücken, Germany, 2011; pp. 1–184. [Google Scholar]
- Harmon, R.S.; Lawley, C.J.M.; Watts, J.; Harraden, C.J.; Somers, A.M.; Hark, R.R. Laser-Induced Breakdown Spectroscopy—An Emerging Analytical Tool for Mineral Exploration. Minerals 2019, 9, 718. [Google Scholar] [CrossRef] [Green Version]
- Buckley, S. Geochemical analysis using laser-induced breakdown spectroscopy. Spectroscopy 2021, 36, 9–14. [Google Scholar]
- Andrade, D.F.; Pereira-Filho, E.R.; Amarasiriwardena, D. Current trends in laser-induced breakdown spectroscopy: A tutorial review. Appl. Spectrosc. Rev. 2020, 56, 98–114. [Google Scholar] [CrossRef]
- Rethfeldt, N.; Brinkmann, P.; Riebe, D.; Beitz, T.; Köllner, N.; Altenberger, U.; Löhmannsröben, H.-G. Detection of Rare Earth Elements in Minerals and Soils byLaser-Induced Breakdown Spectroscopy (LIBS) Using Interval PLS. Minerals 2021, 11, 1379. [Google Scholar] [CrossRef]
- Idris, N.; Lahna, K.; Ramli, M.; Abidin, T.F.; Budi, W.S.; Suliyanti, M.M.; Kurniawan, K.H.; Tjia, M.O.; Kagawa, K. Characteristics of laser induced breakdown investigated by a compact, nongated optical multichannel analyzer system and its potential application. Heliyon 2020, 6, e05711. [Google Scholar] [CrossRef]
- Day, D. Handheld Laser Induced Breakdown Spectroscopy (HHLIBS). In Portable Spectroscopy and Spectrometry 1: Technologies and Instrumentation, 1st ed.; Richard, A., Crocombe, R.A., Leary, P.E., Kammrath, B.W., Eds.; John Wiley & Sons: Hoboken, NJ, USA, 2021; pp. 321–343. [Google Scholar]
- Pochon, A.; Desaulty, A.M.; Bailly, L. Handheld Laser-Induced Breakdown Spectroscopy (LIBS) as a fast and easy method to trace gold. J. Anal. At. Spectrom. 2020, 35, 254–264. [Google Scholar] [CrossRef]
- Walting, R.J.; Scadding, C.J.; May, C.D. Chemical fingerprinting of gold using laser ablation–inductively coupled plasma–mass spectrometry (LA-ICP-MS). J. R. Soc. West. Aust. 2014, 97, 87–96. [Google Scholar]
- Kerrich, R.; Wyman, D.A. Review of developments in trace-element fingerprinting of geodynamic settings and their implications for mineral exploration. Aust. J. Earth Sci. 1997, 44, 465–487. [Google Scholar] [CrossRef]
- Harhira, A.; Bouchard, P.; Rifai, K.; Haddad, J.E.; Sabsabi, M.; Blouin, A.; Laflamme, M. Advanced laser-induced breakdown spectroscopy (LIBS) sensor for gold mining. In Proceedings of the 56th Conference of Metallurgists COM, Vancouver, BC, Canada, 30 August 2017. [Google Scholar]
- Wise, M.A.; Harmon, R.S.; Curry, A.; Jennings, M.; Grimac, Z.; Khashchevskaya, D. Handheld LIBS for Li Exploration: An Example from the Carolina Tin-Spodumene Belt, USA. Minerals 2022, 12, 77. [Google Scholar] [CrossRef]
- Fabre, C.; Ourti, N.E.; Ballouard, G.; Mercadier, J.; Cauzid, J. Handheld LIBS analysis for in situ quantification of Li and detection of the trace elements (Be, Rb and Cs). J. Geochem. Explor. 2022, 236, 106979. [Google Scholar] [CrossRef]
- Ray, B.H.; Carron., K.T. From Portable Raman to Mobile Raman: The Progression of Raman Spectroscopy. In Next-Generation Spectroscopic Technologies XI; Druy, M.A., Crocombe, R.A., Barnett, S.M., Profeta, L.T.M., Eds.; SPIE: Bellingham, WA, USA, 2018; Volume 10657, p. 1065704. [Google Scholar] [CrossRef]
- Mitsutake, H.; Poppi, R.J.; Breitkreitz, M.C. Raman Imaging Spectroscopy: History, Fundamentals and Current Scenario of the Technique. Rev. J. Braz. Chem. Soc. 2019, 30, 11. [Google Scholar] [CrossRef]
- Balaram, V. Field-portable instruments in mineral exploration: Past, present and future. J. Appl. Geochem. 2017, 19, 382–399. [Google Scholar]
- Levitan, D.M.; Hammarstrom, J.M.; Gunter, M.E.; Ii, S.; Robert, R.; Chou, I.-M.; Piatak, N.M. Mineralogy of mine waste at the Vermont asbestos group mine, Belvidere Mountain, Vermont. Am. Mineral. 2009, 94, 1063–1066. [Google Scholar] [CrossRef] [Green Version]
- Sergeeva, A.V.; Zhitova, E.S.; Nuzhdaev, A.A.; Zolotarev, A.A.; Bocharov, V.N.; Ismagilova, R.M. Infrared and Raman Spectroscopy of Ammoniovoltaite, (NH4)2Fe2+5Fe3+ 3Al(SO4)12(H2O)18. Minerals 2020, 10, 781. [Google Scholar] [CrossRef]
- Moroz, T.N.; Edwards, H.G.M.; Zhmodik, S.M. Detection of carbonate, phosphate minerals and cyanobacteria in rock from the Tomtor deposit, Russia, by Raman spectroscopy. Spectrochim. Acta Part A Mol. Biomol. Spectrosc. 2021, 250, 119372. [Google Scholar] [CrossRef]
- Groppo, C.; Rinaudo, C.; Cairo, S.; Gastaldi, D.; Compagnoni, R. Micro-Raman spectroscopy for a quick and reliable identification of serpentine minerals from ultramafics. Eur. J. Miner. 2006, 18, 319–329. [Google Scholar] [CrossRef]
- Orlando, A.; Franceschini, F.; Muscas, C.; Pidkova, S.; Bartoli, M.; Rovere, M.; Tagliaferro, A. A Comprehensive Review on Raman Spectroscopy Applications. Chemosensors 2021, 9, 262. [Google Scholar] [CrossRef]
- Kim, Y.; Caumon, M.C.; Barres, O.; Sall, A.; Cauzid, J. Identification and composition of carbonate minerals of the calcite structure by Raman and infrared spectroscopies using portable devices. Spectrochim. Acta Part A Mol. Biomol. Spectrosc. 2021, 261, 119980. [Google Scholar] [CrossRef] [PubMed]
- Arbiol, C.; Layne, G.D. Raman Spectroscopy Coupled with Reflectance Spectroscopy as a Tool for the Characterization of Key Hydrothermal Alteration Minerals in Epithermal Au–Ag Systems: Utility and Implications for Mineral Exploration. Appl. Spectrosc. 2021, 75, 1475–1496. [Google Scholar] [CrossRef] [PubMed]
- Lundsgaard-Nielsen, S.M.; Pors, A.; Banke, S.O.; Henriksen, J.E.; Hepp, D.K.; Weber, A. Critical-depth Raman spectroscopy enables home- use non-invasive glucose monitoring. PLoS ONE 2018, 13, e0197134. [Google Scholar] [CrossRef] [PubMed] [Green Version]
- Ando, S.; Garzanti, E. Raman spectroscopy in heavy-mineral studies, 2014. In Sediment Provenance Studies in Hydrocarbon Exploration and Production; Scott, R.A., Smyth, H.R., Morton, A.C., Richardson, N., Eds.; Geological Society: London, UK, 2013; Volume 386. [Google Scholar] [CrossRef]
- Balaram, V.; Rani, A.; Rathore, D.P.S. Uranium in groundwater in parts of India and world: A comprehensive review of sources, impact to the environment and human health, analytical techniques, and mitigation technologies. Geosystems Geoenvironment 2022, 1, 100043. [Google Scholar] [CrossRef]
- Rathore, D.P.S. Advances in technologies for the measurement of uranium in diverse matrices. Talanta 2008, 77, 9–20. [Google Scholar] [CrossRef] [PubMed]
- Mehra, R.; Gupta, D.; Jakhu, R. Risk Assessment for Natural Uranium Present in Ground Water of Mahendragarh district of Haryana. J. Radiat. Nucl. Appl. 2017, 2, 67–73. [Google Scholar] [CrossRef]
- Kale, A.; Bandela, N.; Kulkarni, J. Spatial distribution and risk assessment of naturally occurring uranium along with correlational study from Buldhana district of Maharashtra, India. J. Radioanal. Nucl. Chem. 2021, 327, 771–787. [Google Scholar] [CrossRef]
- Winterburn, P.A.; Noble, R.R.P.; Lawie, D. Advances in Exploration Geochemistry, 2007 to 2017 and beyond. Geochem. Explor. Environ. Anal. 2017, 20, 495–505. [Google Scholar] [CrossRef] [Green Version]
- Gopal, L.; Hanuman, V.V.; Chakrapani, G. Separation Cum Pre-Concentration Technique for Determination of Uranium in Sea, Brine and Ground Water at Nano to Sub nanogram Levels. Int. J. Sci. Res. Sci. Technol. 2020, 7, 1–11. [Google Scholar] [CrossRef]
- Dunlea, A.G.; Murray, R.W.; Tada, R.; Alvarez-Zarikian, C.A.; Anderson, C.H.; Gilli, A.; Giosan, L.; Gorgas, T.; Hennekam, R.; Irino, T.; et al. Intercomparison of XRF core scanning results from seven labs and approaches to practical calibration. Geochem. Geophys. Geosystems 2020, 21, e2020GC009248. [Google Scholar] [CrossRef]
- Rosa, R.D.L.; Khodadadzadeh, M.; Tusa, L.; Kirsch, M.; Tornos, F.G.; Delgado, R.T.; Gloaguen, R. Mineral quantification at deposit scale using drill-core hyperspectral data: A case study in the Iberian Pyrite Belt. Ore Geol. Rev. 2021, 139, 104514. [Google Scholar] [CrossRef]
- Paradis, M.C.M.; Doucet, F.R.; Rifai, K.; Özcan, L.Ç.; Azami, N.; Vidal, F. ECORE: A New Fast Automated Quantitative Mineral and Elemental Core Scanner. Minerals 2021, 11, 859. [Google Scholar] [CrossRef]
- Meima, J.A.; Rammlmair, D. Investigation of compositional variations in chromitite ore with imaging Laser Induced Breakdown Spectroscopy and Spectral Angle Mapper classification algorithm. Chem. Geol. 2020, 532, 119376. [Google Scholar] [CrossRef]
- Guo, F.; Clemens, S.; Liu, X.; Long, Y.; Li, D.; Tan, L.; Liu, C.; Yan, H.; Sun, Y. Application of XRF scanning to different geological archives. Earth Space Sci. 2021, 8, e2020EA001589. [Google Scholar] [CrossRef]
- Munteanu, M.; Sädbom, S.; Paaso, J.; Bergqvist, M.; Arvanitidis, N.; Arvidsson, R.; Kolacz, J.; Bakalis, E.; Ivanov, D.; Grammi, K.; et al. X-MINE project (H2020): Testing the capabilities of X-ray techniques in drill core scanning and ore sorting. In Proceedings of the EGU General Assembly Conference Abstracts, Online, 4–8 May 2020. [Google Scholar] [CrossRef]
- Eichstaedt, H.; Ho, C.Y.J.; Kutzke, A.; Kahnt, R. Performance measurements of machine learning and different neural network designs for prediction of geochemical properties based on hyperspectral core scans. Aust. J. Earth Sci. 2022, 2017344. [Google Scholar] [CrossRef]
- Rull, F.; Veneranda, M.; Manrique-Martinez, J.A.; Sanz-Arranz, A.; Saiz, J.; Medina, J.; Lopez-Reyes, G. Spectroscopic study of terrestrial analogues to support rover missions to Mars—A Raman-centred review. Anal. Chim. Acta 2021, 339003. [Google Scholar] [CrossRef]
- Rammelkamp, K.; Gasnault, O.; Forni, O.; Bedford, C.C.; Dehouck, E.; Cousin, A.; Lasue, J.; David, G.; Gabriel, T.S.J.; Maurice, S.; et al. Clustering supported classification of ChemCam data from Gale crater, Mars. Earth Space Sci. 2021, 8, e2021EA001903. [Google Scholar] [CrossRef]
- Qu, H.; Ling, Z.; Qi, X.; Xin, Y.; Liu, C.; Cao, H. A Remote Raman System and Its Applications for Planetary Material Studies. Sensors 2021, 21, 6973. [Google Scholar] [CrossRef]
- Gonzalez-Fernandez, O.; Rivero, L.; Queralt, I.; Viladevall, M. Distribution of metals in vadose zone of the alluvial plain in a mining creek inferred from geochemical, mineralogical and geophysical studies: The Beal Wadi Case (Cartagena–La Union Mining District, SE Spain). Water Air Soil Pollut. 2011, 221, 45–61. [Google Scholar] [CrossRef]
- Dhanada, V.S.; George, S.D.; Kartha, V.B.; Chidangil, S.; Unnikrishnan, V.K. Hybrid LIBS-Raman-LIF systems for multi-modal spectroscopic applications: A topical review. Appl. Spectrosc. Rev. 2020, 56, 463–491. [Google Scholar] [CrossRef]
- Miller, K.A.; Brigden, K.; Santillo, D.; Currie, D.; Johnston, P.; Thompson, K.F. Challenging the Need for Deep Seabed Mining from the Perspective of Metal Demand, Biodiversity, Ecosystems Services, and Benefit Sharing. Front. Mar. Sci. 2021, 8, 706161. [Google Scholar] [CrossRef]
- Takaya, Y.; Yasukawa, K.; Kawasaki, T.; Fujinaga, K.; Ohta, J.; Usui, Y.; Nakamura, K.; Kimura, J.I.; Chang, Q.; Hamada, M.; et al. The tremendous potential of deep-sea mud as a source of rare-earth elements. Sci. Rep. 2018, 8, 5763. [Google Scholar] [CrossRef] [PubMed] [Green Version]
- Milinovic, J.; Rodrigues, F.J.L.; Barriga, F.J.A.S.; Murton, B.J. Ocean-Floor Sediments as a Resource of Rare Earth Elements: An Overview of Recently Studied Sites. Minerals 2021, 11, 142. [Google Scholar] [CrossRef]
- Nyga, R.; Neu, W. Double-pulse technique for optical emission spectroscopy of ablation plasmas of samples in liquids. Opt. Lett. 1993, 18, 747–749. [Google Scholar] [CrossRef]
- Thornton, B.; Takahashi, T.; Sato, T.; Sakka, T.; Tamura, A.; Matsumoto, A.; Nozaki, T.; Ohki, T.; Ohki, K. Development of a deep-sea laser-induced breakdown spectrometer for in situ multi-element chemical analysis. Deep. Sea Res. 2015, 95, 20–36. [Google Scholar] [CrossRef] [Green Version]
- Liu, C.; Guo, J.; Tian, Y.; Zhang, C.; Cheng, K.; Ye, W.; Zheng, R. Development and Field Tests of a Deep-Sea Laser-Induced Breakdown Spectroscopy (LIBS) System for Solid Sample Analysis in Seawater. Sensors 2020, 20, 7341. [Google Scholar] [CrossRef]
- Balaram, V. Rare Earth Elements: Sources and Applications, in Environmental Technologies to Treat Rare Earth Elements Pollution: Principles and Engineering; Arindam, S., Piet, N.L., Eds.; IWA Publishers: London, UK, 2022; pp. 75–114. [Google Scholar] [CrossRef]
- Obhođaš, J.; Sudac, D.; Meric, I.; Pettersen, H.E.S.; Uroić, M.; Nađ, K.; Valković, V. In-situ measurements of rare earth elements in deep sea sediments using nuclear methods. Sci. Rep. 2018, 8, 4925. [Google Scholar] [CrossRef] [Green Version]
- Milinovic, J.; Barriga, F.J.; Murton, B.J. Analysis of deep-ocean sediments from the TAG hydrothermal field (MAR, 26° N): Application of short-wave infrared reflectance (SWIR) spectra for offshore geochemical exploration. J. Soils Sediments 2020, 20, 3472–3486. [Google Scholar] [CrossRef]
- Balaram, V. Recent trends in the instrumental analysis of rare earth elements in geological and industrial materials. Trends Anal. Chem. 1996, 15, 475–486. [Google Scholar] [CrossRef]
- Broekaert, J.A.C. Analytical Atomic Spectrometry with Flames and Plasmas; John Wiley & Sons: Hoboken, NJ, USA, 2002; pp. 1–375. [Google Scholar]
- Gałuszka, A.; Migaszewski, Z.M.; Namieśnik, J. Moving your laboratories to the field—Advantages and limitations of the use of field portable instruments in environmental sample analysis. Environ. Res. 2015, 140, 593–603. [Google Scholar] [CrossRef] [PubMed]
- Arne, D.C.; Mackie, R.A.; Jones, S.A. The use of property-scale portable X-ray fluorescence data in gold exploration: Advantages and limitations. Geochem. Explor. Environ. Anal. 2014, 14, 233–244. [Google Scholar] [CrossRef]
- Sarala, P.; Taivalkoski, A.; Valkama, J. Portable XRF: An Advanced On-Site Analysis Method in Till Geochemical Exploration, in Novel Technologies for Greenfield Exploration; Special Paper, 57, Sarala, P., Eds.; Geological Survey of Finland: Espoo, Finland, 2015; pp. 63–86. [Google Scholar]
- Burlakovs, J.; Kaczala, F.; Orupõld, K.; Bhatnagar, A.; Vincevica-Gaile, Z.; Rudovica, V.; Kriipsalu, M.; Hogland, M.; Stapkevica, M.; Hogland, W.; et al. Field-portable X-ray fluorescence spectrometry as rapid measurement tool for landfill mining operations: Comparison of field data vs. laboratory analysis. Intern. J. Environ. Anal. Chem. 2015, 95, 609–617. [Google Scholar] [CrossRef]
- Sarala, P. Comparison of different portable XRF methods for determining till geochemistry. Geochem. Explor. Environ. Anal. 2016, 16, 181–192. [Google Scholar] [CrossRef]
- Bower, D.M.; Yang, C.S.C.; Hewagama, T.; Nixon, C.A.; Aslam, A.; Whelley, P.L.; Eigenbrode, J.L.; Jin, F.; Ruliffson, J.; Kolasinski, J.R.; et al. Spectroscopic characterization of samples from different environments in a Volcano-Glacial region in Iceland: Implications for in situ planetary exploration. Spectrochim. Acta Part A Mol. Biomol. Spectrosc. 2021, 263, 120205. [Google Scholar] [CrossRef]
- Laperche, V.; Lemière, B. Possible Pitfalls in the Analysis of Minerals and Loose Materials by Portable XRF, and How to Overcome Them. Minerals 2021, 11, 33. [Google Scholar] [CrossRef]
- Vıtek, P.; Jehlicka, J.; Edwards, H.G.M. Practical Considerations for the Field Application of Miniaturized Portable Raman Instrumentation for the Identification of Minerals. Appl. Spectrosc. 2013, 67, 767–778. [Google Scholar] [CrossRef]
- Duée, C.; Orberger, B.; Maubec, N.; Laperche, V.; Capar, L.; Bourguignon, A.; Bourrat, X.; El Mendili, Y.; Chateigner, D.; Gascoin, S.; et al. Impact of heterogeneities and surface roughness on pXRF, pIR, XRD and Raman analyses: Challenges for on-line, real-time combined mineralogical and chemical analyses on drill cores and implication for “high speed” Ni-laterite exploration. J. Geochem. Explor. 2018, 198, 1–17. [Google Scholar] [CrossRef]
- Balaram, V. Assessment of ICP-MS method using the interlaboratory QA study of two Polish soil RMS. Accredit. Qual. Assur. 2000, 5, 325–330. [Google Scholar] [CrossRef]
- Balaram, V.; Patil, M.L.; Agrawal, A.K.; Rao, D.V.S.; Charan, S.N.; Satyanarayanan, M.; Mathur, R.; Kapilavastu, K.; Sarma, D.S.; Gowda, M.S.; et al. Preparation and certification of high-grade gold geochemical reference material. Accredit. Qual. Assur. 2006, 11, 329–335. [Google Scholar] [CrossRef]
- Bhatt, C.R.; Jain, C.J.; Gouegue, C.L.; McIntyre, D.L.; Singh, J.P. Determination of Rare Earth Elements in Geological Samples Using Laser-Induced Breakdown Spectroscopy (LIBS). Appl. Spectrosc. 2017, 72, 114–121. [Google Scholar] [CrossRef] [PubMed]
- Fuchs, M.C.; Beyer, J.; Lorenz, S.; Sharma, S.; Renno1, A.D.; Heitmann, J.; Gloaguen, R.A. Spectral library for laser-induced fluorescence analysis as a tool for rare earth element identification. Earth Syst. Sci. Data 2021, 13, 4465–4483. [Google Scholar] [CrossRef]


| Deposits of Interest | Type of Deposit | Main Pathfinder Minerals | Main Pathfinder Elements | Reference |
|---|---|---|---|---|
| Gold | Pyrite, chalco-pyrite, arsenopyrite, bismuthinite magnetite, tellurides, tetrahedrite, pyrite, sphalerite, muscovite, monazite, bastnäsite, quartz, scheelite, wolframite, cassiterite. | Fe, Mn, Cu, Co, Ni, Sb, Zn, As, Bi, Te, Sn, Se, Tl, Ag, Hg, Pb, Mo and W. | [12,13,14] | |
| REE | Carbonatite rocks | Bastnäsite group, ancylite, monazite, (fluor)apatite, pyrochlore, xenotime, florencite. | Na, Mg, Fe, P, Ba, F, S, Sr, Ca, Nb, Th, U, Zr, Cu, Ta, Ti, V, Mn, Pb. | [15] |
| Igneous rocks (including hydrothermal upgrade) | Bastnäsite group, aegirine, eudialyte, loparite, allanite, monazite, fergusonite, zircon, xenotime, fluorapatite, ancylite, gadolinite, euxenite, mosandrite. | Na, K, Fe, Al, Zr, Ti, Nb, Ta, Li, F, Cl, Si, Th, U, P, Cs, Rb, Sn, W, Mo, Be, Ga, Hf, Mn, B. | ||
| Placers and palaeoplacers | Monazite, xenotime, allanite, euxenite. | Ti, Nb, Zr, Au, Sn, Th, U, Pb, F. | ||
| Laterites | Monazite, apatite, pyrochlore, crandallite group, bastnäsite group, churchite, rhabdophane, plumbogummite, zircon, florencite, xenotime, cerianite. | Fe, Al, Nb, Zr, Ti, Sn, Mn, P, low Si, negative Ce anomaly. | ||
| Ion-adsorption | Clay minerals (mainly kaolinite and halloysite). | High Si (>75%), low P. | ||
| Iron oxide-associated (including IOCG) deposits | Bastnäsite, synchysite, monazite, xenotime, florencite, britholite. | Fe, Cu, U, Au, Ag, Ba, F, P, S. | ||
| Seafloor deposits, such as manganese nodules, ferromanganese crust, phosphorite. | Vernadite, todorokite, Fe-oxyhydroxide, carbonate fluorapatite, francolite. | Mn, Fe, P, Cu, Ni, Co. | ||
| Cu-Ni-PGE | pentlandite, chalcopyrite, pyrite, millerite, PGM, chromite, Cr-diopside, enstatite, olivine, Cr-andradite. | Ni, Cu, Pd, As, Cr, Co, S, PGE | [16,17] | |
| Volcanogenic massive sulphide (VMS) deposits (Cu, Pb, Zn, Ag, Au) | Galena, sphalerite, chalcopyrite, pyrrhotite, gold, pyrite, gahnite, staurolite, cassiterite, spessartine, sillimanite, andalusite, beudantite, jarosite, barite, tourmaline, hogcomite, nigerite. | Cu, Zn, Pb, Ag, Mo, Sn, Ba As, Sb, In, Te, Bi, and Tl | [17,18,19] | |
| W-Mo-Bi, and Sn-Zn-In deposits | Cassiterite, wolframite, molybdenite, topaz, chalcopyrite, galena, sphalerite, arsenopyrite, pyrite, loellingite, beudantite, anglesite, plumboferrite, plumbogummite. | Ag, As, Cd, Cu, Pb, Re, Te, Tl | [20] | |
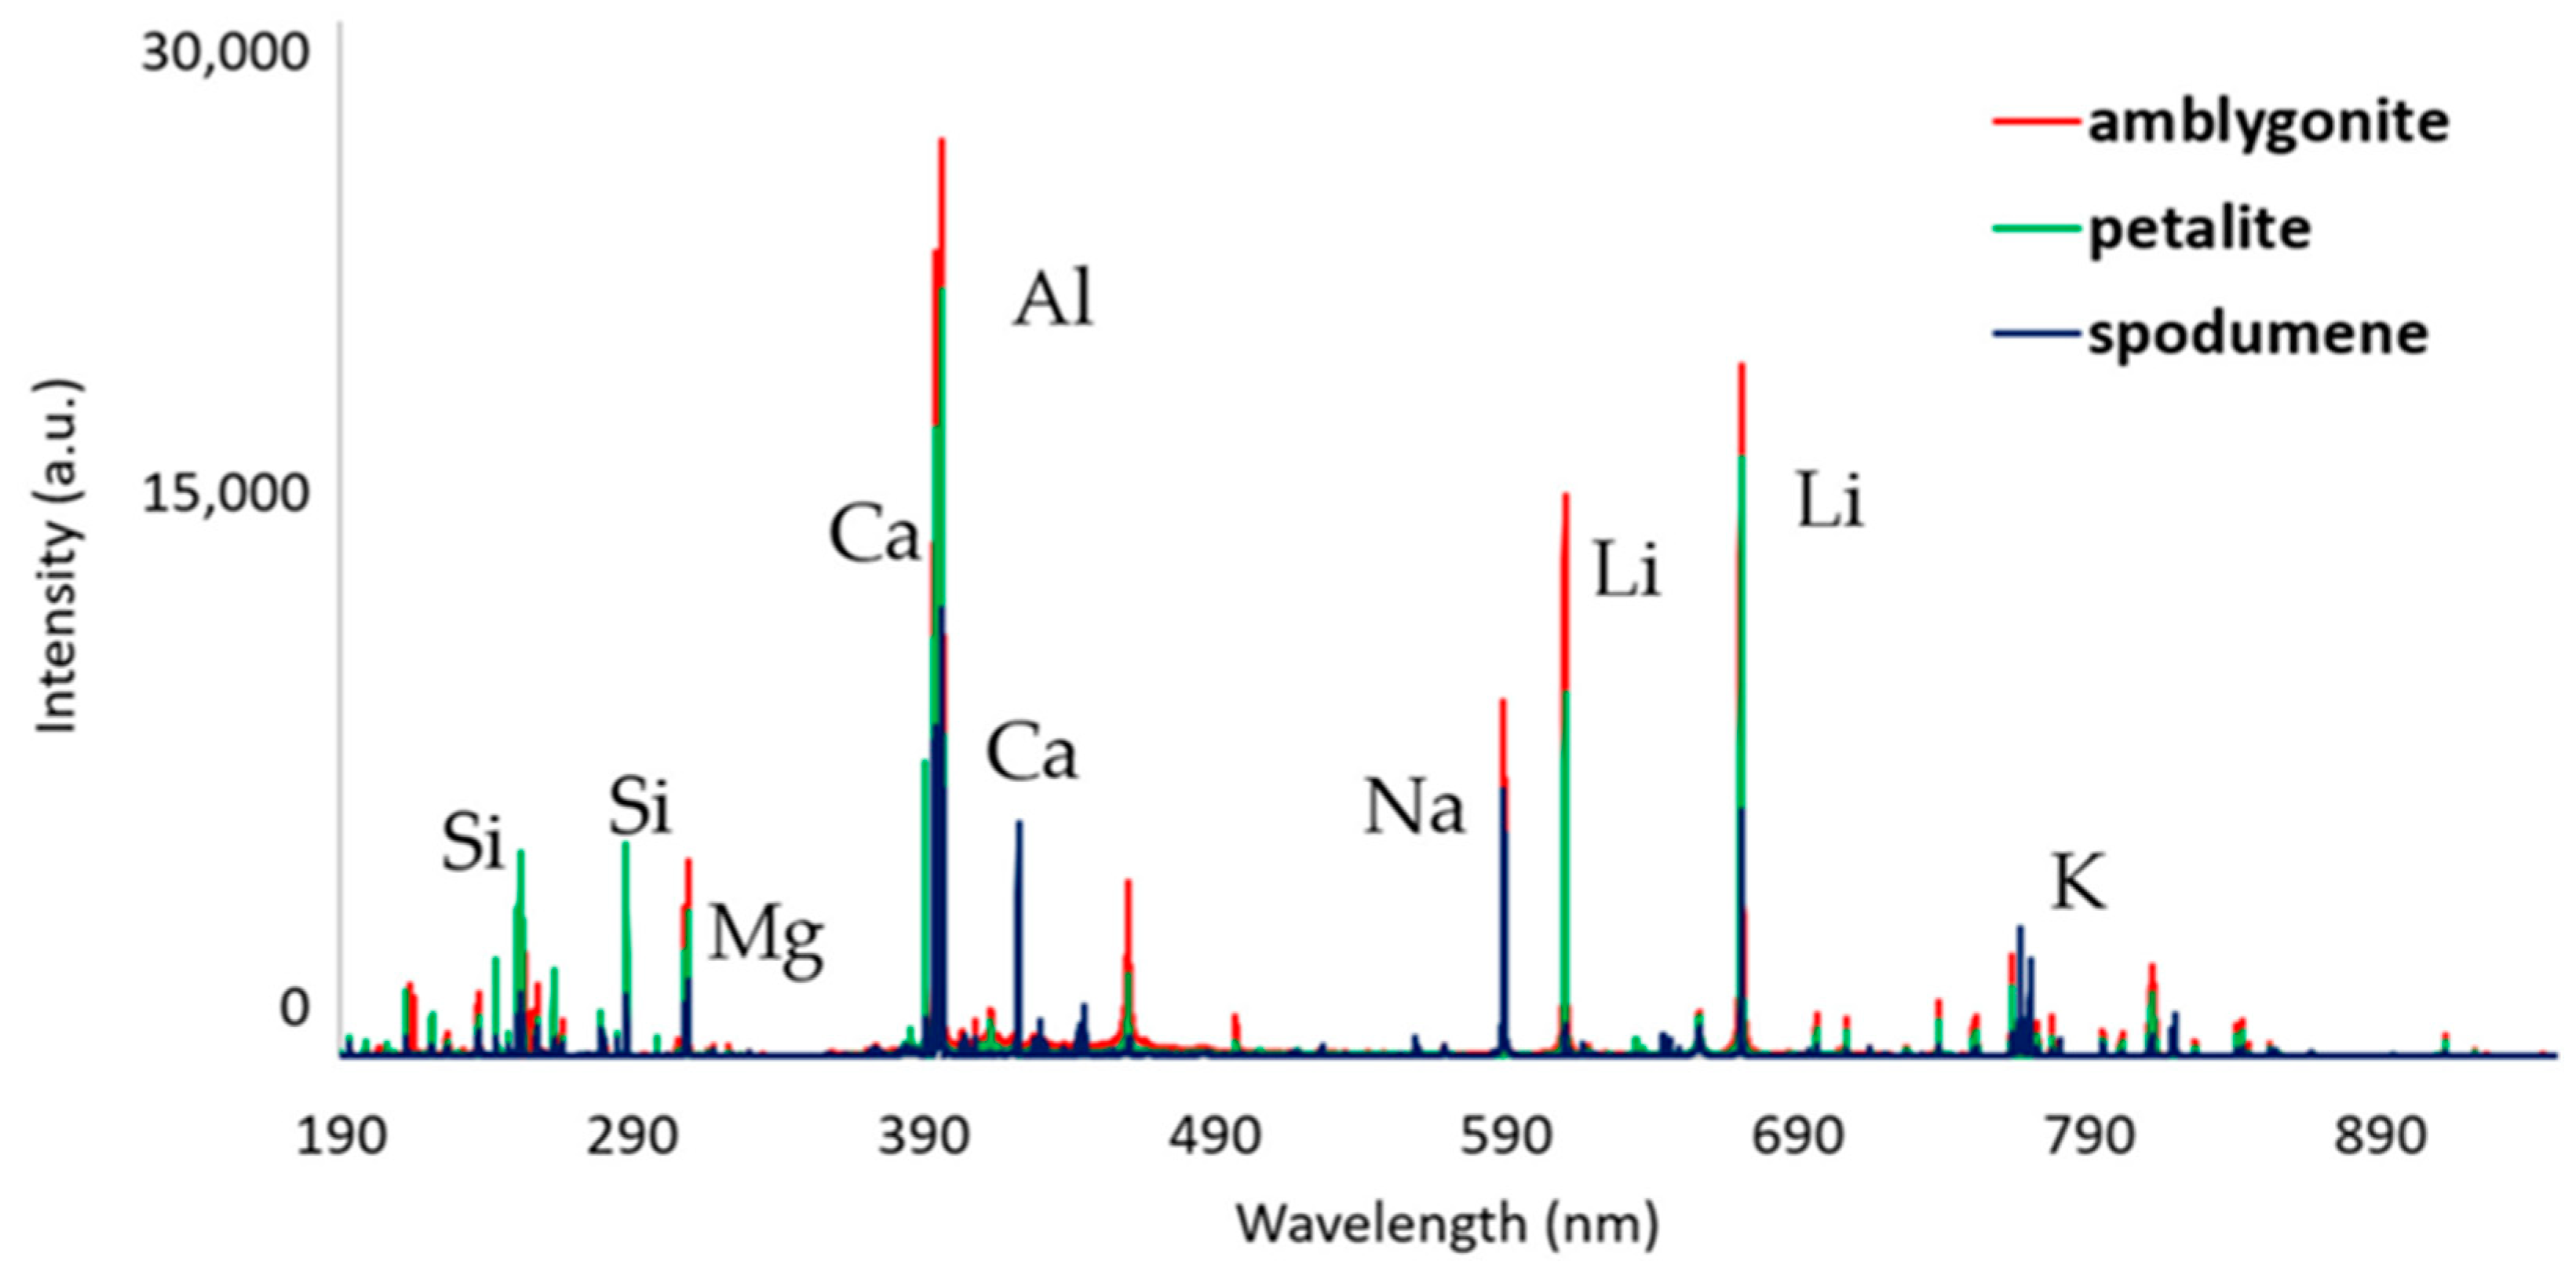
| Li | Spodumene, petalite, amblygonite, quartz, K-feldspar, albite, or montebrasite, lepidolite, zinnwaldite, eucryptite, cassiterite, lithiophilite, holmquisite, triphylite, quartz, muscovite, apatite, tourmaline tantalite-columbite, beryl. | K, Ca, Rb, Sr, Y, Nb, Sn, Cs, Ta, Sb, W, Bi, As, Ga, Tl, and the REE | [21,22] | |
| Kimberlite-hosted diamonds | - | Cr-pyrope, Cr-diopside, eclogitic garnet, Mg-ilmenite, chromite, olivine, diamond. | C | [17] |
| U | Uraninite (pitchblende), thorianite, tourmaline, sulphides, monazite, allanite, zircon, baddelyite, niccolite, U-Th anatase, U-Th rutile, brannerite, magnetite. | Cu, Ag, As, Cr, Pb, Zn, Ni, Co, Re, Be, P, Mo, Mn, REE and radiogenic Pb isotopes | [23,24,25] |
| Element. | pXRF LOD | Element | pXRF LOD | Element | pXRF LOD | Element | pXRF LOD |
|---|---|---|---|---|---|---|---|
| Ag | <10 | Cr | <10 | Pb | <0.05 | Ti | <10 |
| As | <5 | Cu | <10 | Rb | <5 | V | <10 |
| Au | <10 | Fe | <10 | S | <200 | W | <10 |
| Ca | <50 | K | <50 | Sn | <20 | Y | <5 |
| Cl | <200 | Mn | <10 | Sr | <5 | Zn | <5 |
| Co | <10 | Mo | <5 | Th | <5 | Zr | <5 |
| S. No | Name of the Portable Instrument | Working Principle | Components | Features | Applications |
|---|---|---|---|---|---|
| 1 | Short-wavelength infrared (SWIR) spectrometer | Can measure reflectance in the short wavelength infrared range of 1300–2500 nm based on the interaction between light and molecular bonds of minerals present in the sample. | Czerny–Turner, Echelle and Transmission Optical Spectrographs, NIR covers from 780 to 1400 nm, and SWIR from 1400 to 3000 nm. | Operates in absorption/transmission/reflection modes. High sensitivity over the NIR and SWIR range. Spectral analysis can identify several minerals, most minerals can be detected up to 0.01 wt.%. | Used for mapping both mineral assemblages and changes in mineral composition, as well as providing data to aid lithological characterization and the development of alteration maps and help to develop three-dimensional deposit models. |
| 2 | FTIR | FTIR spectroscopy is a dispersed method in which measurements are performed over a broad spectrum instead of a narrow band of frequencies. The interferogram signal is transmitted through or bounces from the sample surface, where specific energy wavelengths are absorbed. The beam eventually passes through the detector and is further passed on to the processing computer for Fourier transformation of energy signals. | Different components of FTIR are the IR source, interferometer, and a detector. | It is a non-destructive technique for obtaining molecular information, offers high precision, accuracy, speed, enhanced sensitivity, and ease of operation. | To determine the mineral species, mineral composition. |
| 3 | Instruments for Radiometric surveys (Geiger–Müller counter) | It detects ionizing radiation, such as alpha particles, beta particles, and gamma rays, using the ionization effect produced in a Geiger–Müller tube. | A G–M counter has two main parts—a sealed tube, or chamber filled with gas, and an information display. | The sensitivity of the GM tube is such that any particle capable of ionizing a single atom of the filling gas of the tube will initiate an avalanche of ionization in the tube. | It can detect radioactive isotopes such as 40K, 234Th, and 238U in rocks, minerals, and soils in the course of mineral prospecting. |
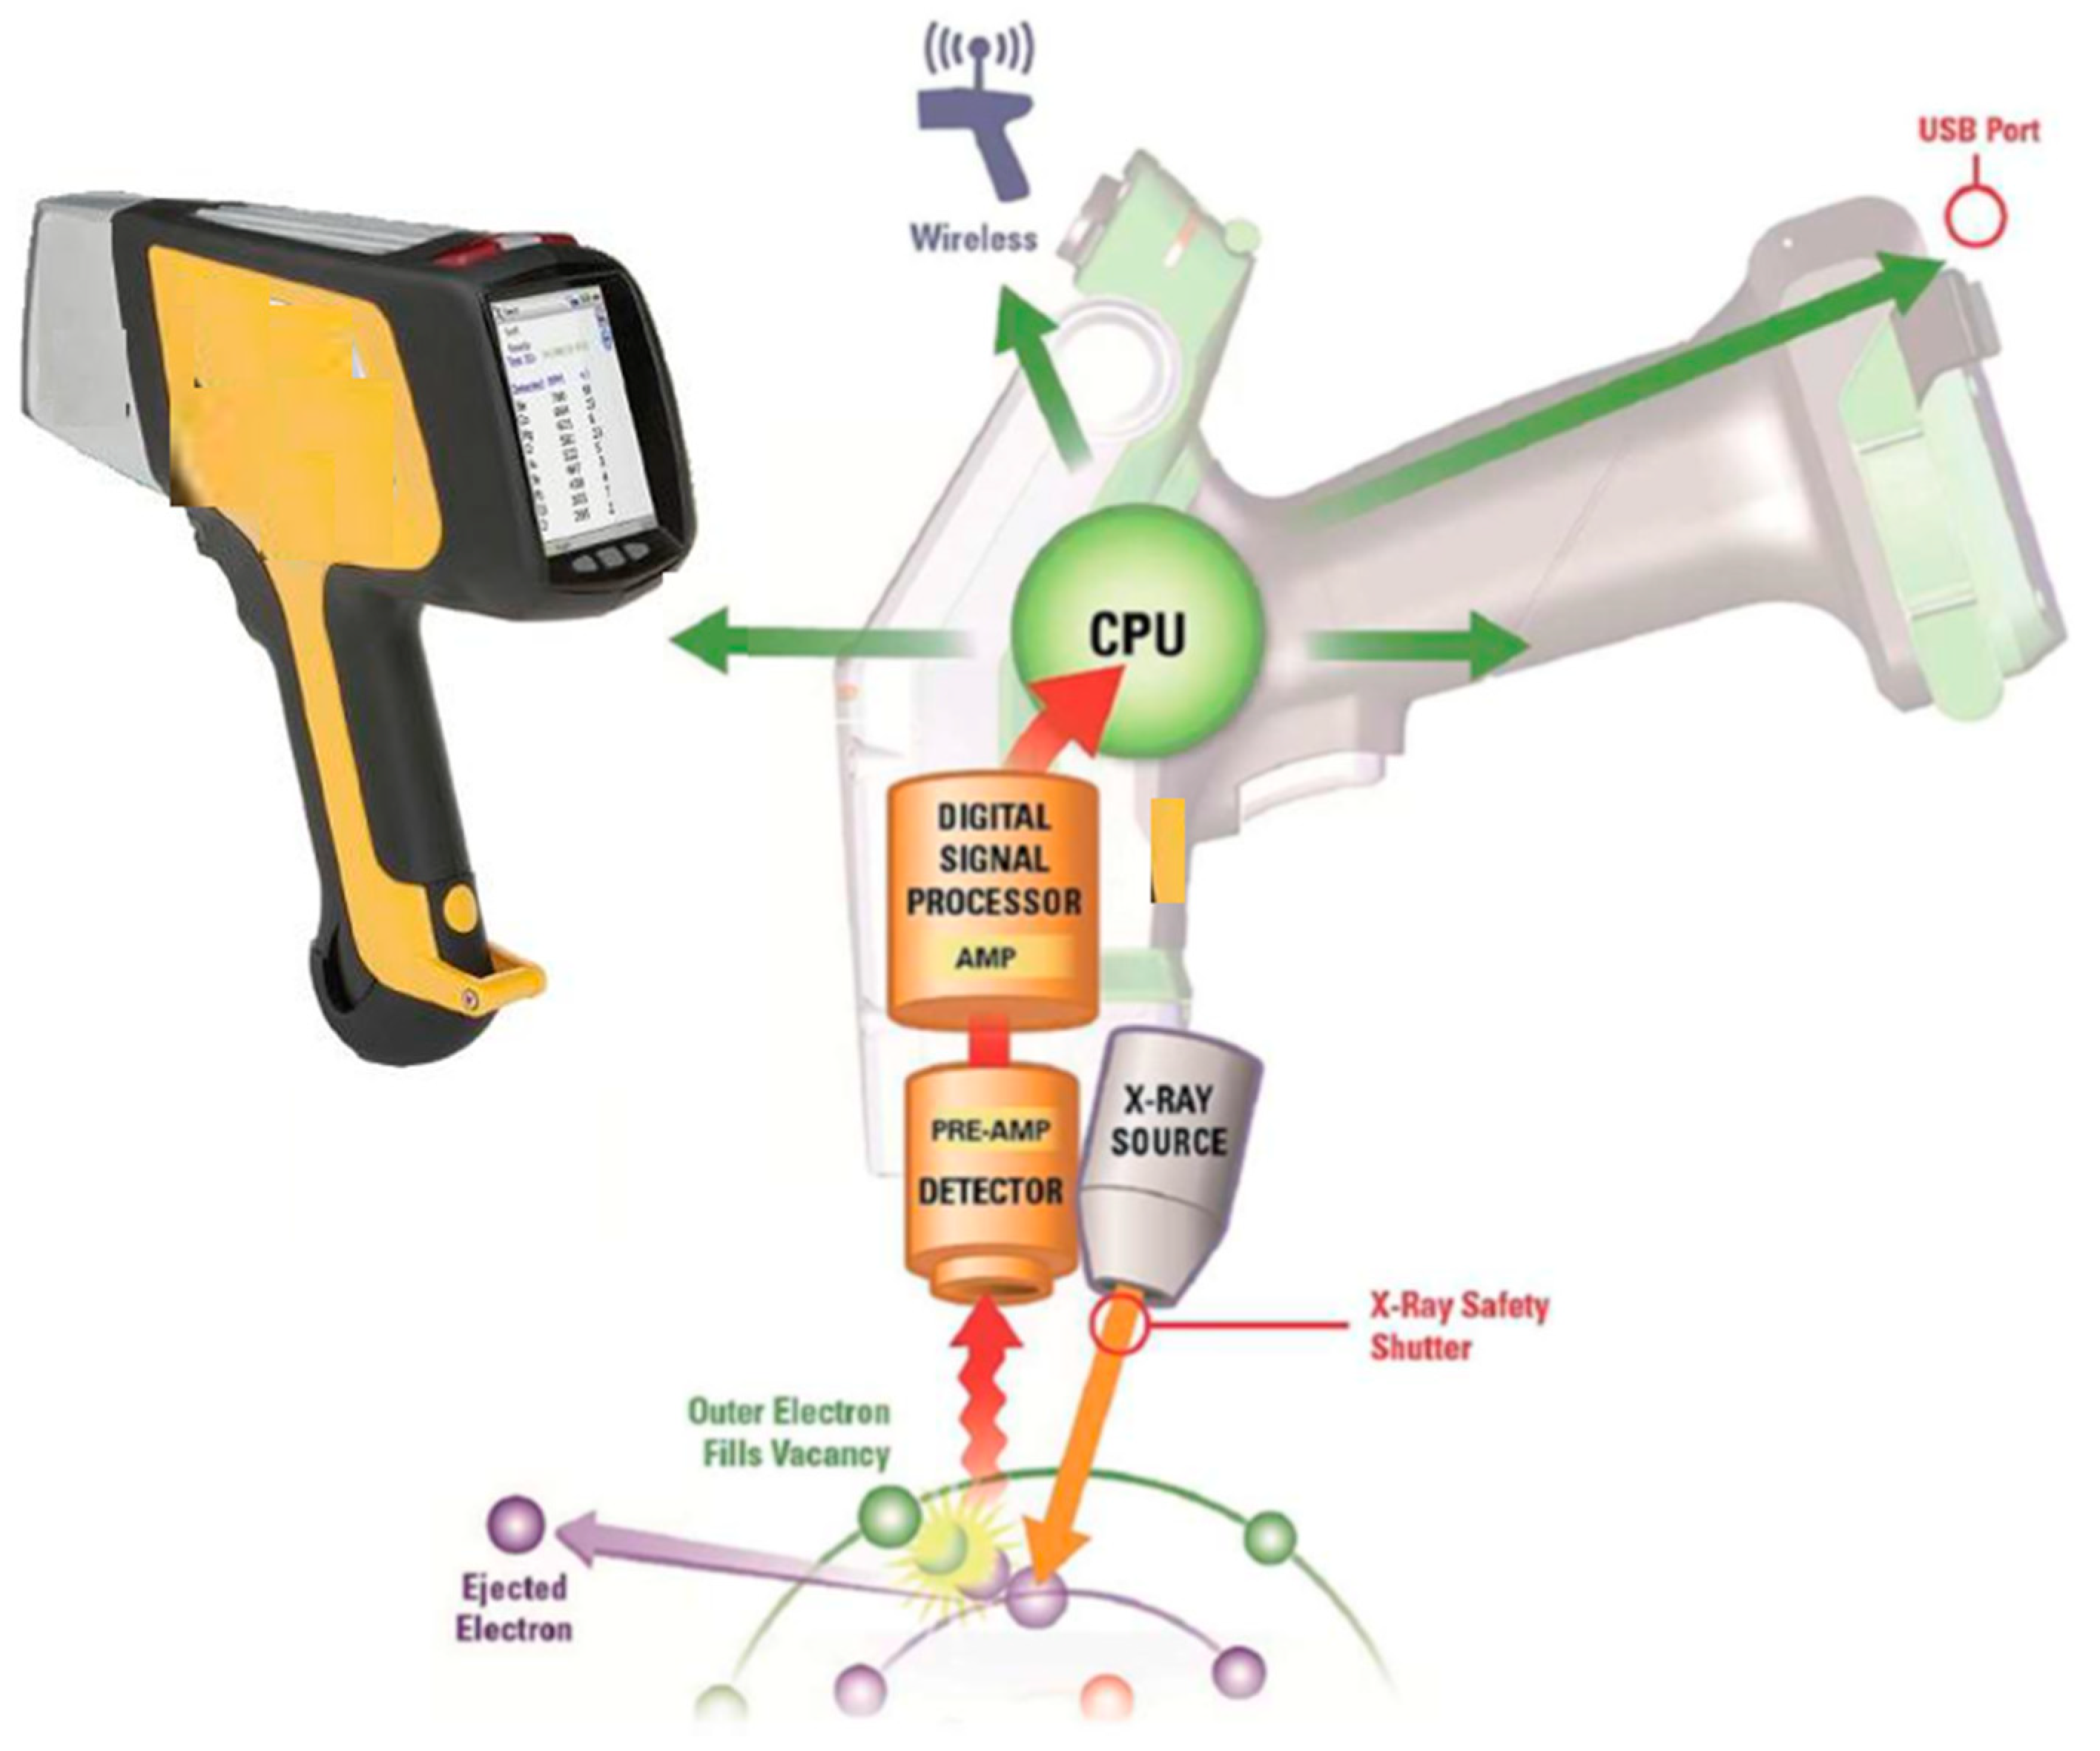
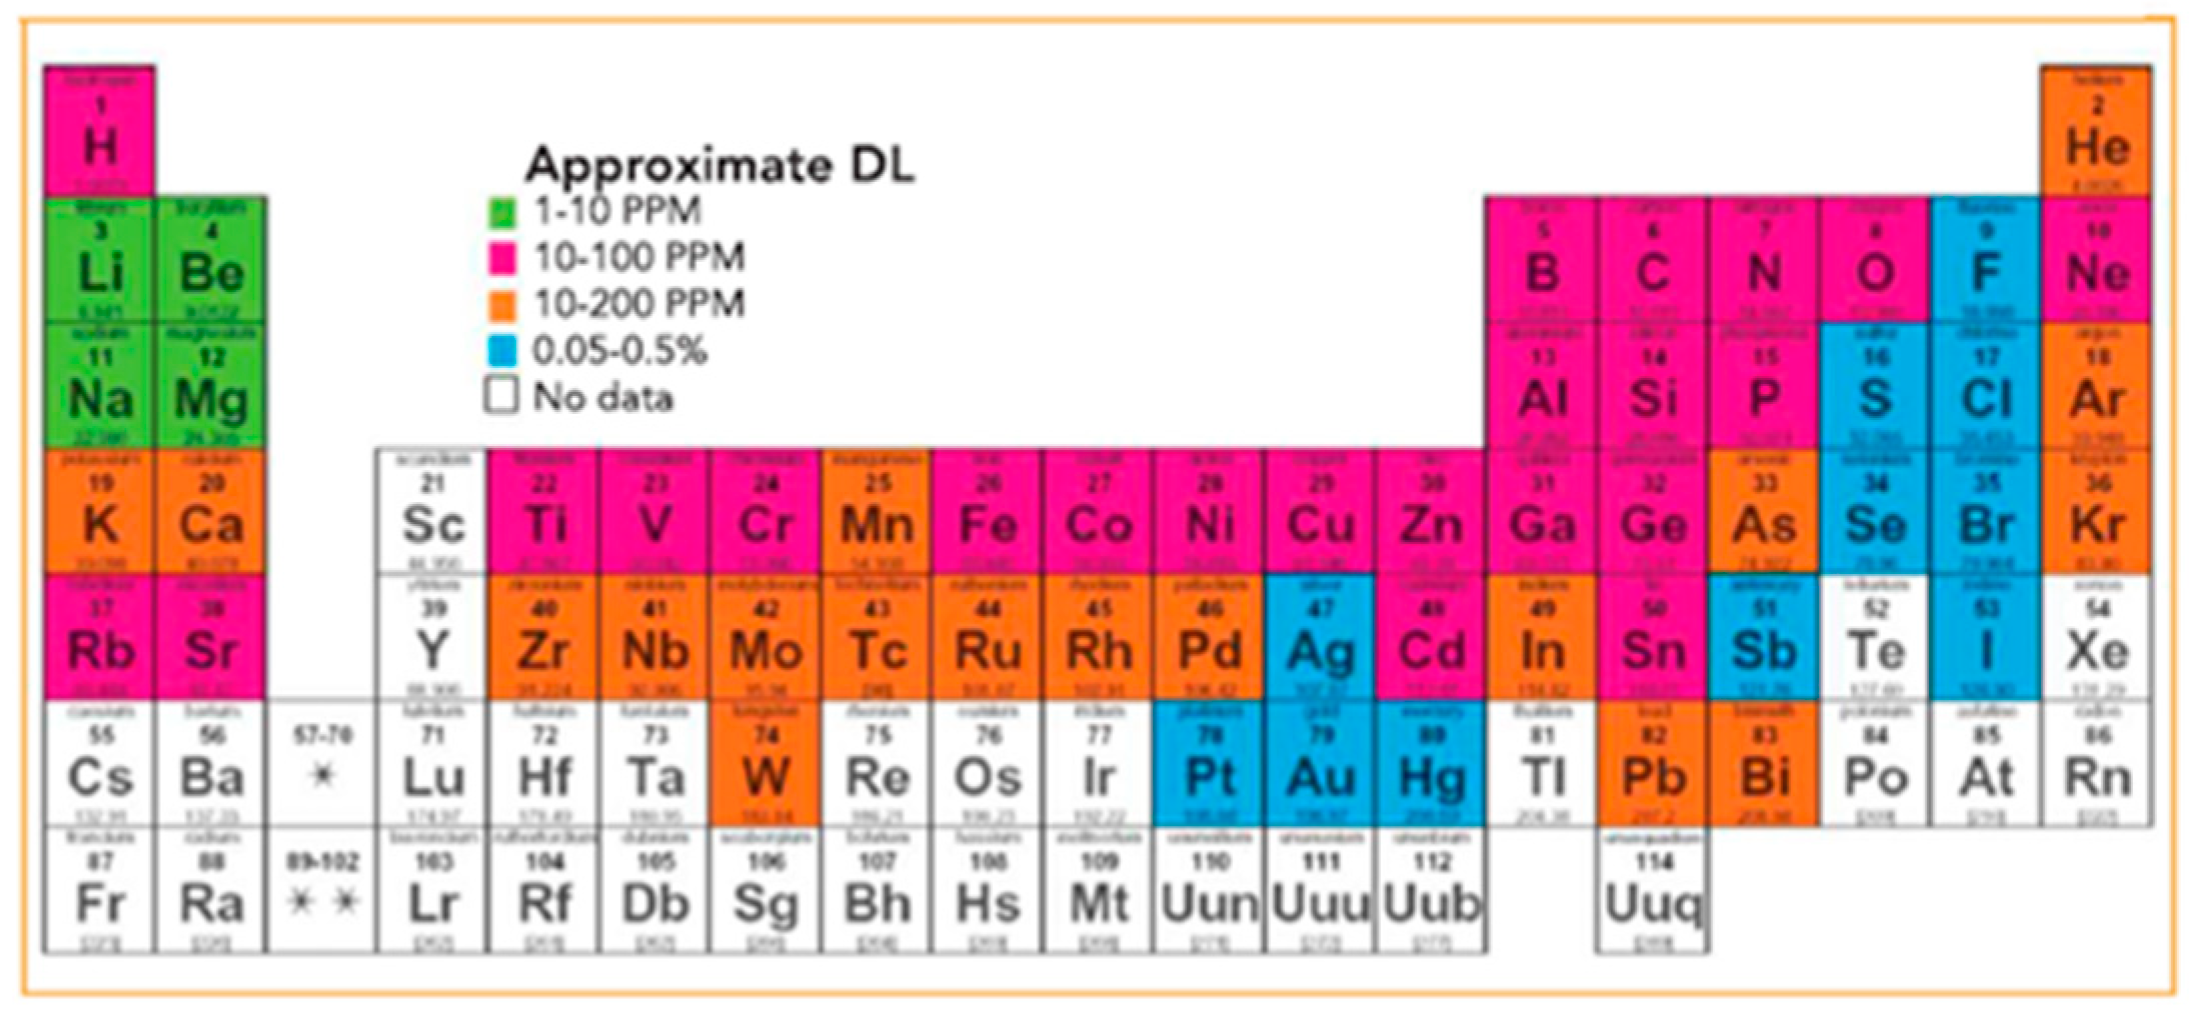
| 4 | XRF | When X-ray radiation strikes the sample, the inner shell electrons of the atoms of elements within the sample with sufficient energy to cause an electron in the K and L-shells to be displaced. The atom reestablishes equilibrium by another electron dropping into the vacated electron position. This return to atomic stability emits a photon of energy that is characteristic of each element present in the sample. | Comprises an X-ray excitation source, X-ray detector, and a data acquisition and analysis unit. | Detection limits of 5 to 30 µg/g for most trace elements, low background noise, high temperature stability, high resolution at high count rates, and fast processing times. | Used for the determination of the elemental composition of rocks, sediments, and other geological materials. |
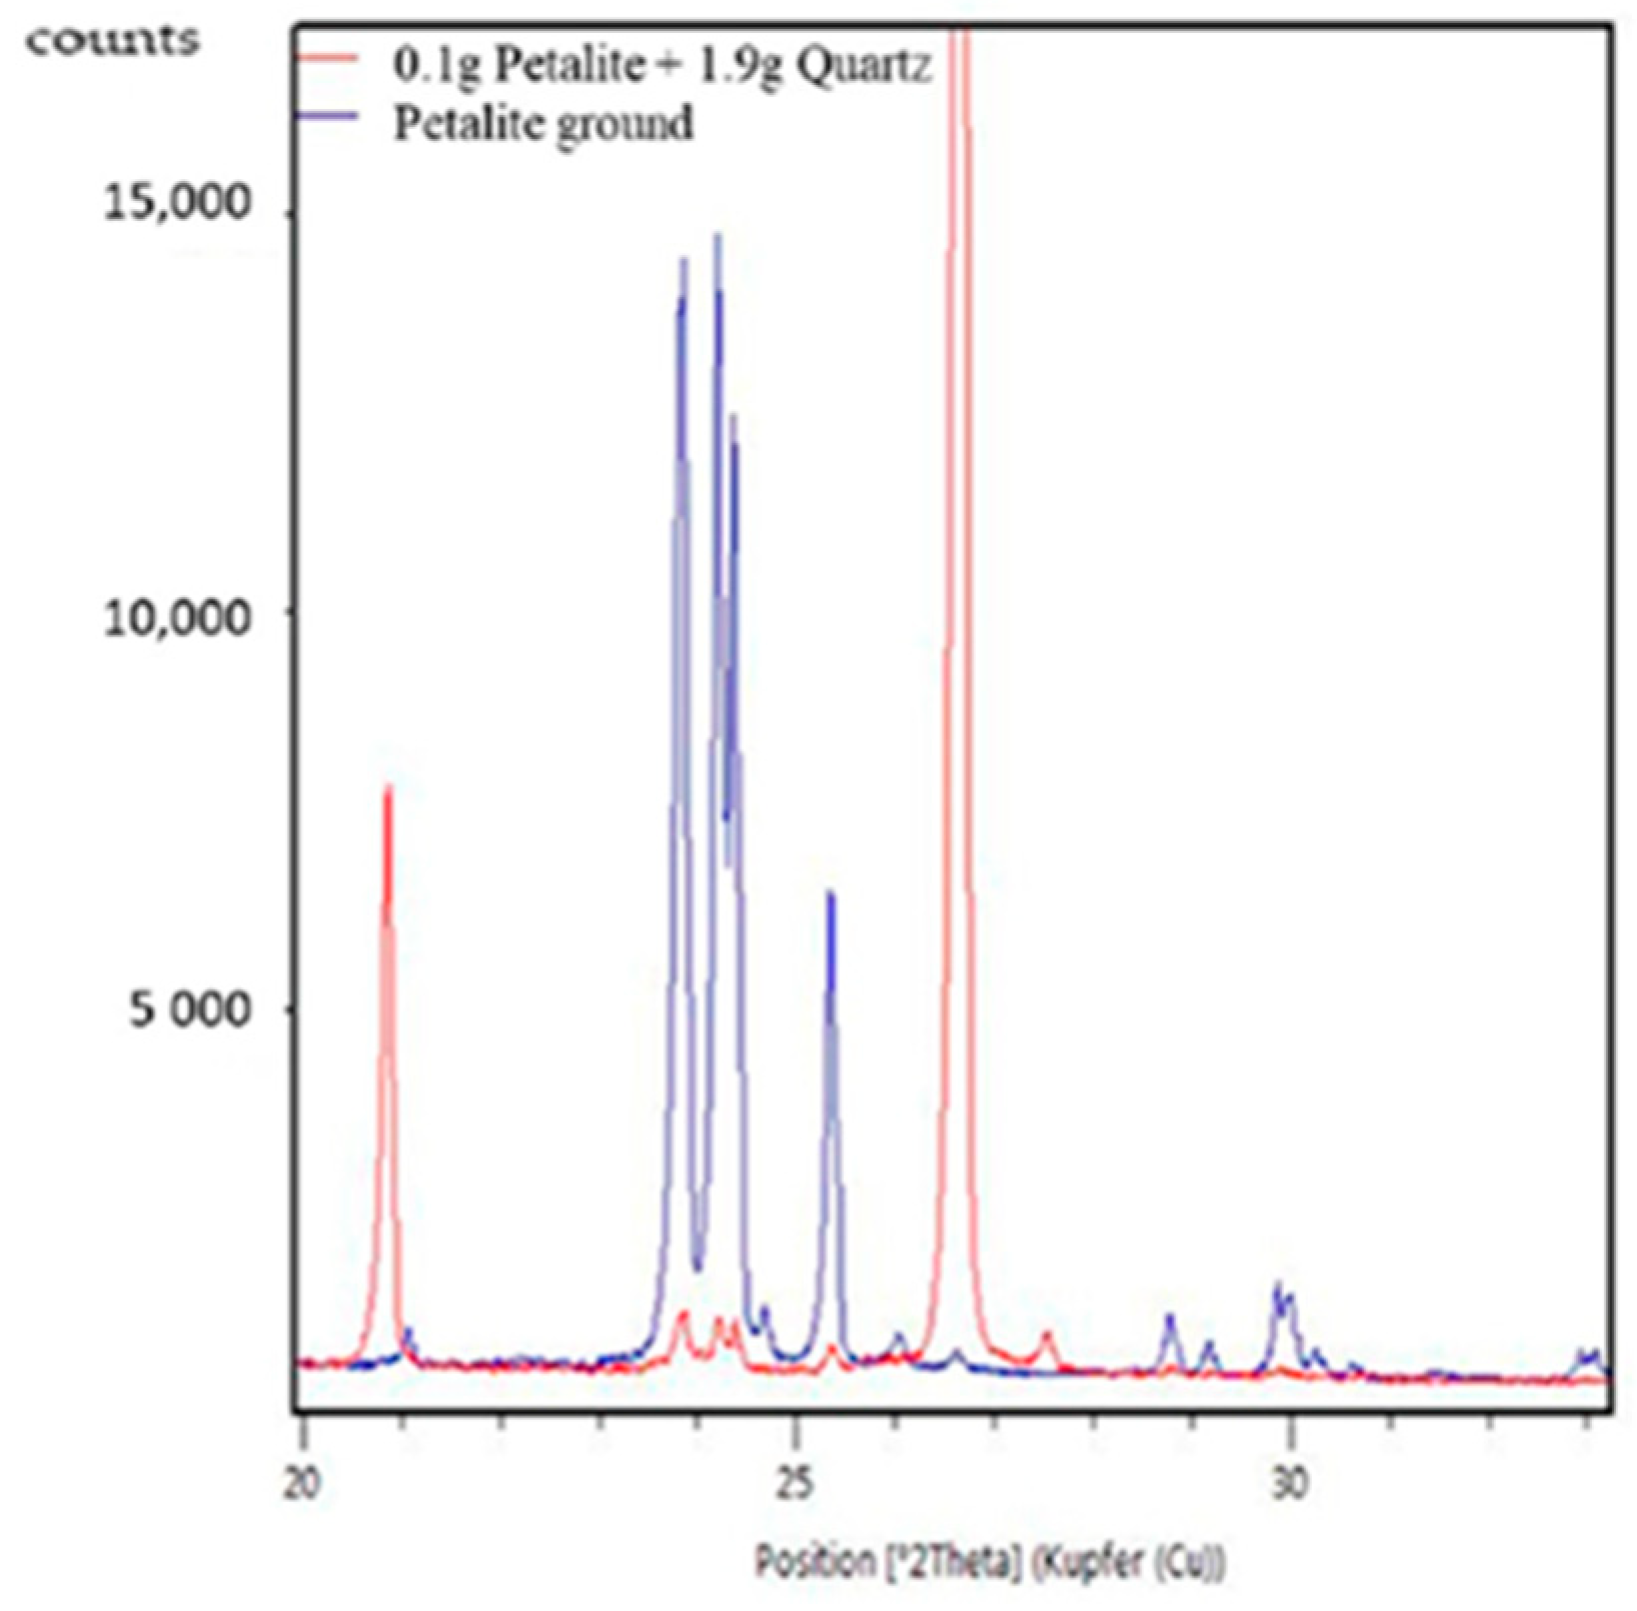
| 5 | XRD | The diffraction patterns result from constructive interference between X-rays scattered by successive parallel atomic planes of the crystal structure. | Portable XRD houses a 2.7 W Rh anode transmission X-ray tube source and a 10 mm2 silicon drift detector (SDD). | The limit of detection in XRD is in the 1–5% range, which depends on the sample matrix. | XRD can perform qualitative and quantitative identification of minerals in rocks, soils, and other geological materials. |
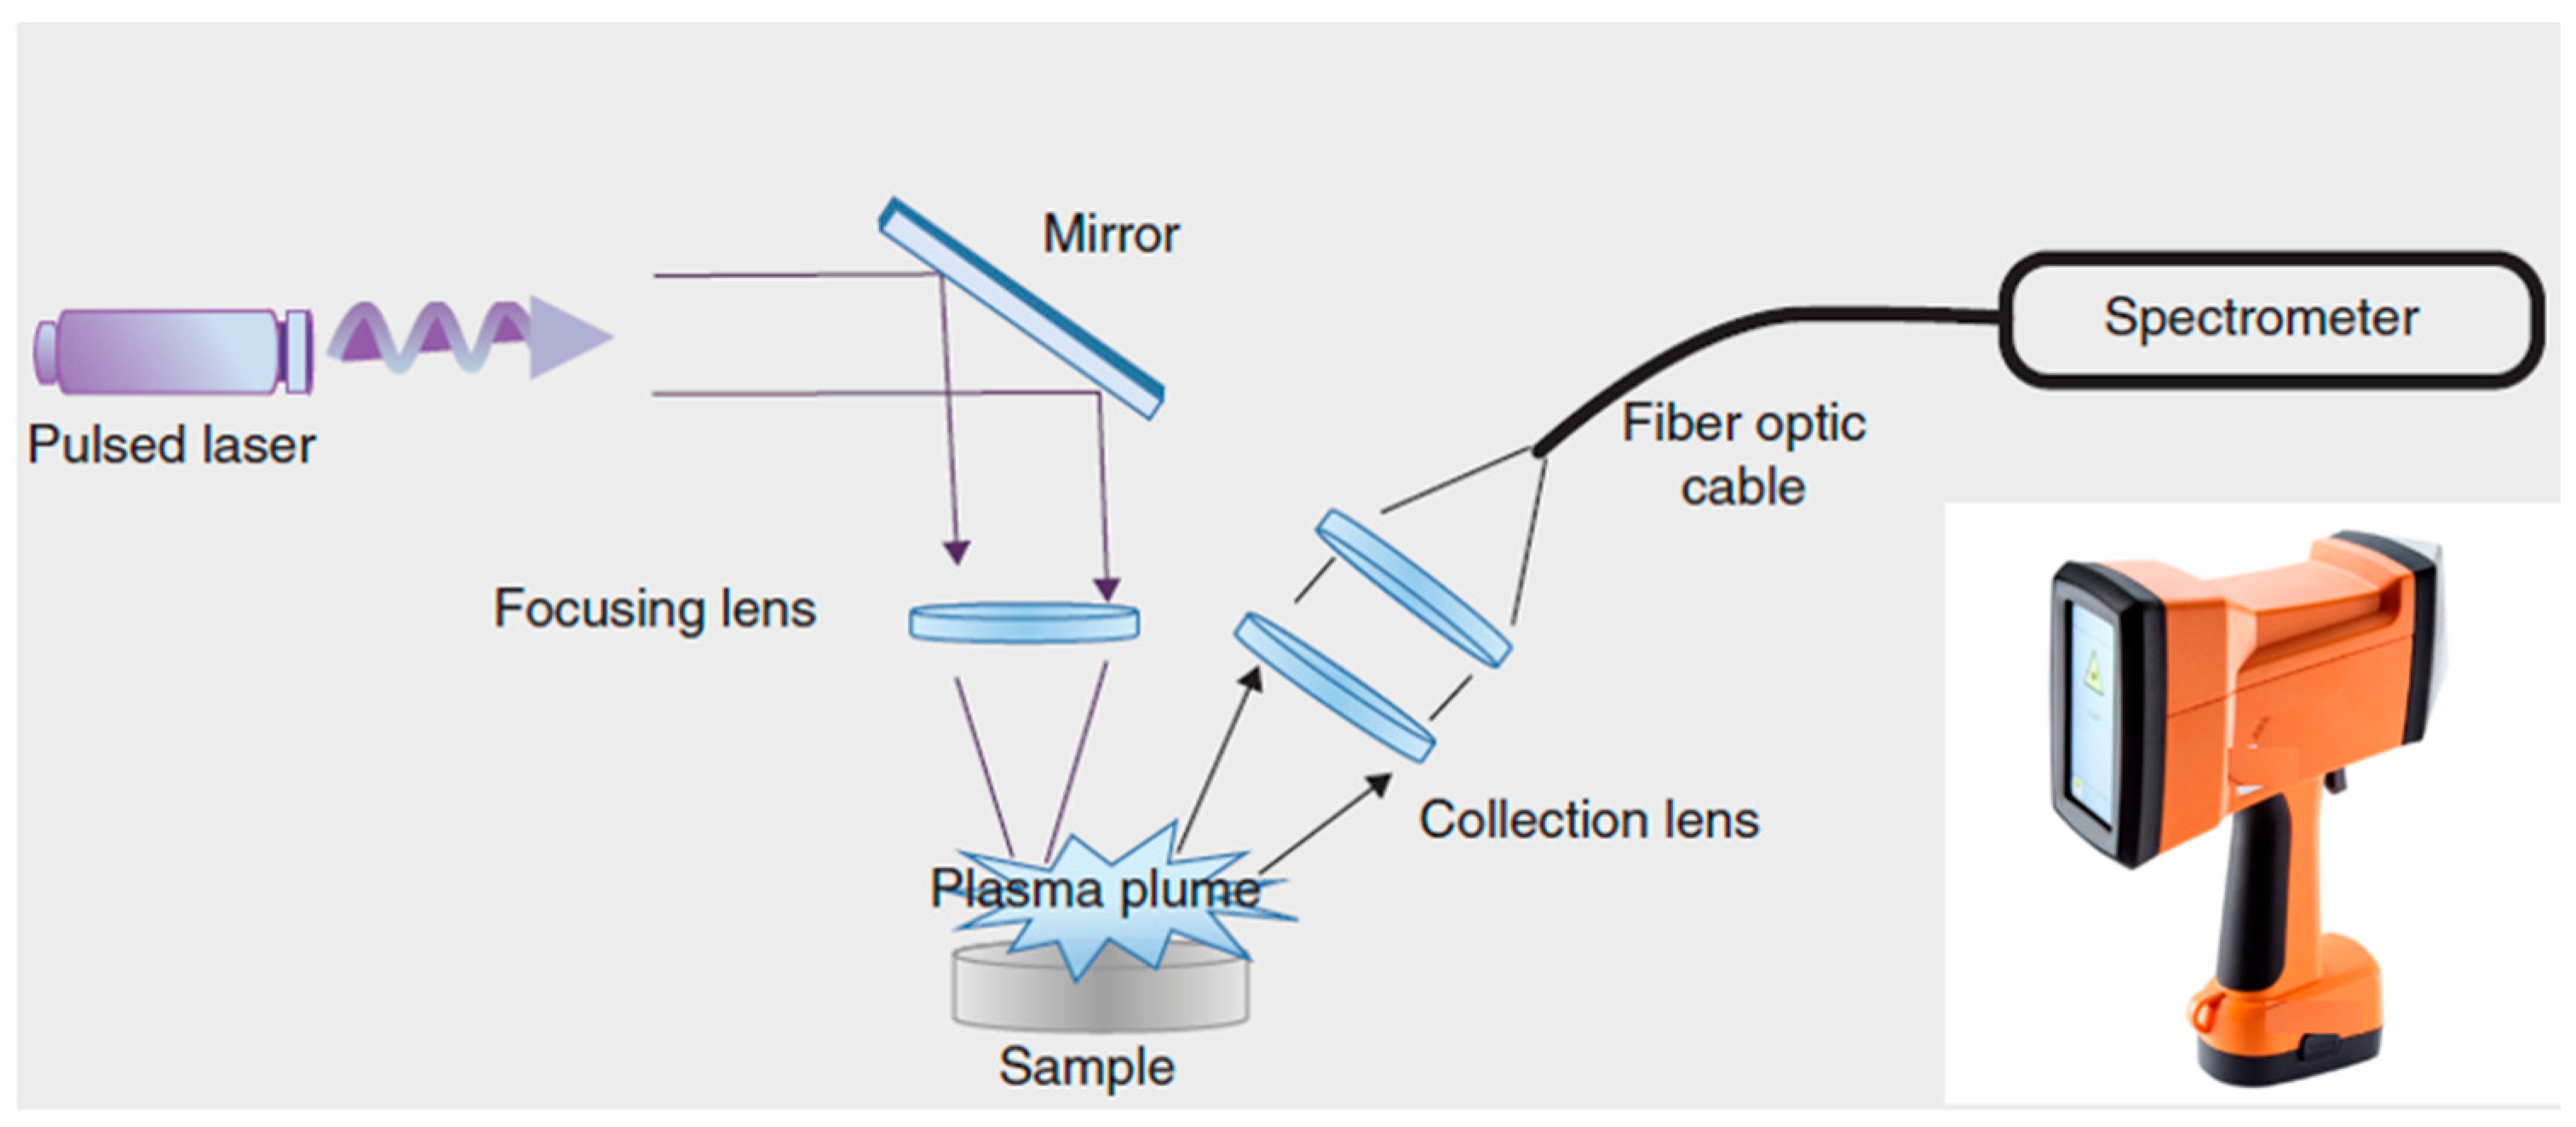
| 6 | LIBS | When an intense and highly focused laser pulse interacts with a sample (solids, liquids, and even gases), a small plume of plasma consisting of electronically excited atoms and ions is created. As these atoms and ions decay back into their ground states, they emit characteristic wavelengths of light, which are isolated and detected. | A unit to generate a pulsed laser (typically an Nd-YAG 1064 nm laser) with a focusing system to vaporize a small portion of the sample, a spectrometer to capture the emitted light and isolate the light of the desired wavelength, and a detector. | No need for sample preparation, can detect all elements present in any type of sample using a single laser shot. | Determination of major, minor, and trace elements in rocks and other geological samples for pure and applied geochemical studies, ability to determine provenance using multivariate analysis, also can be used as a screening tool for selecting important samples for more precise analysis in a laboratory. |
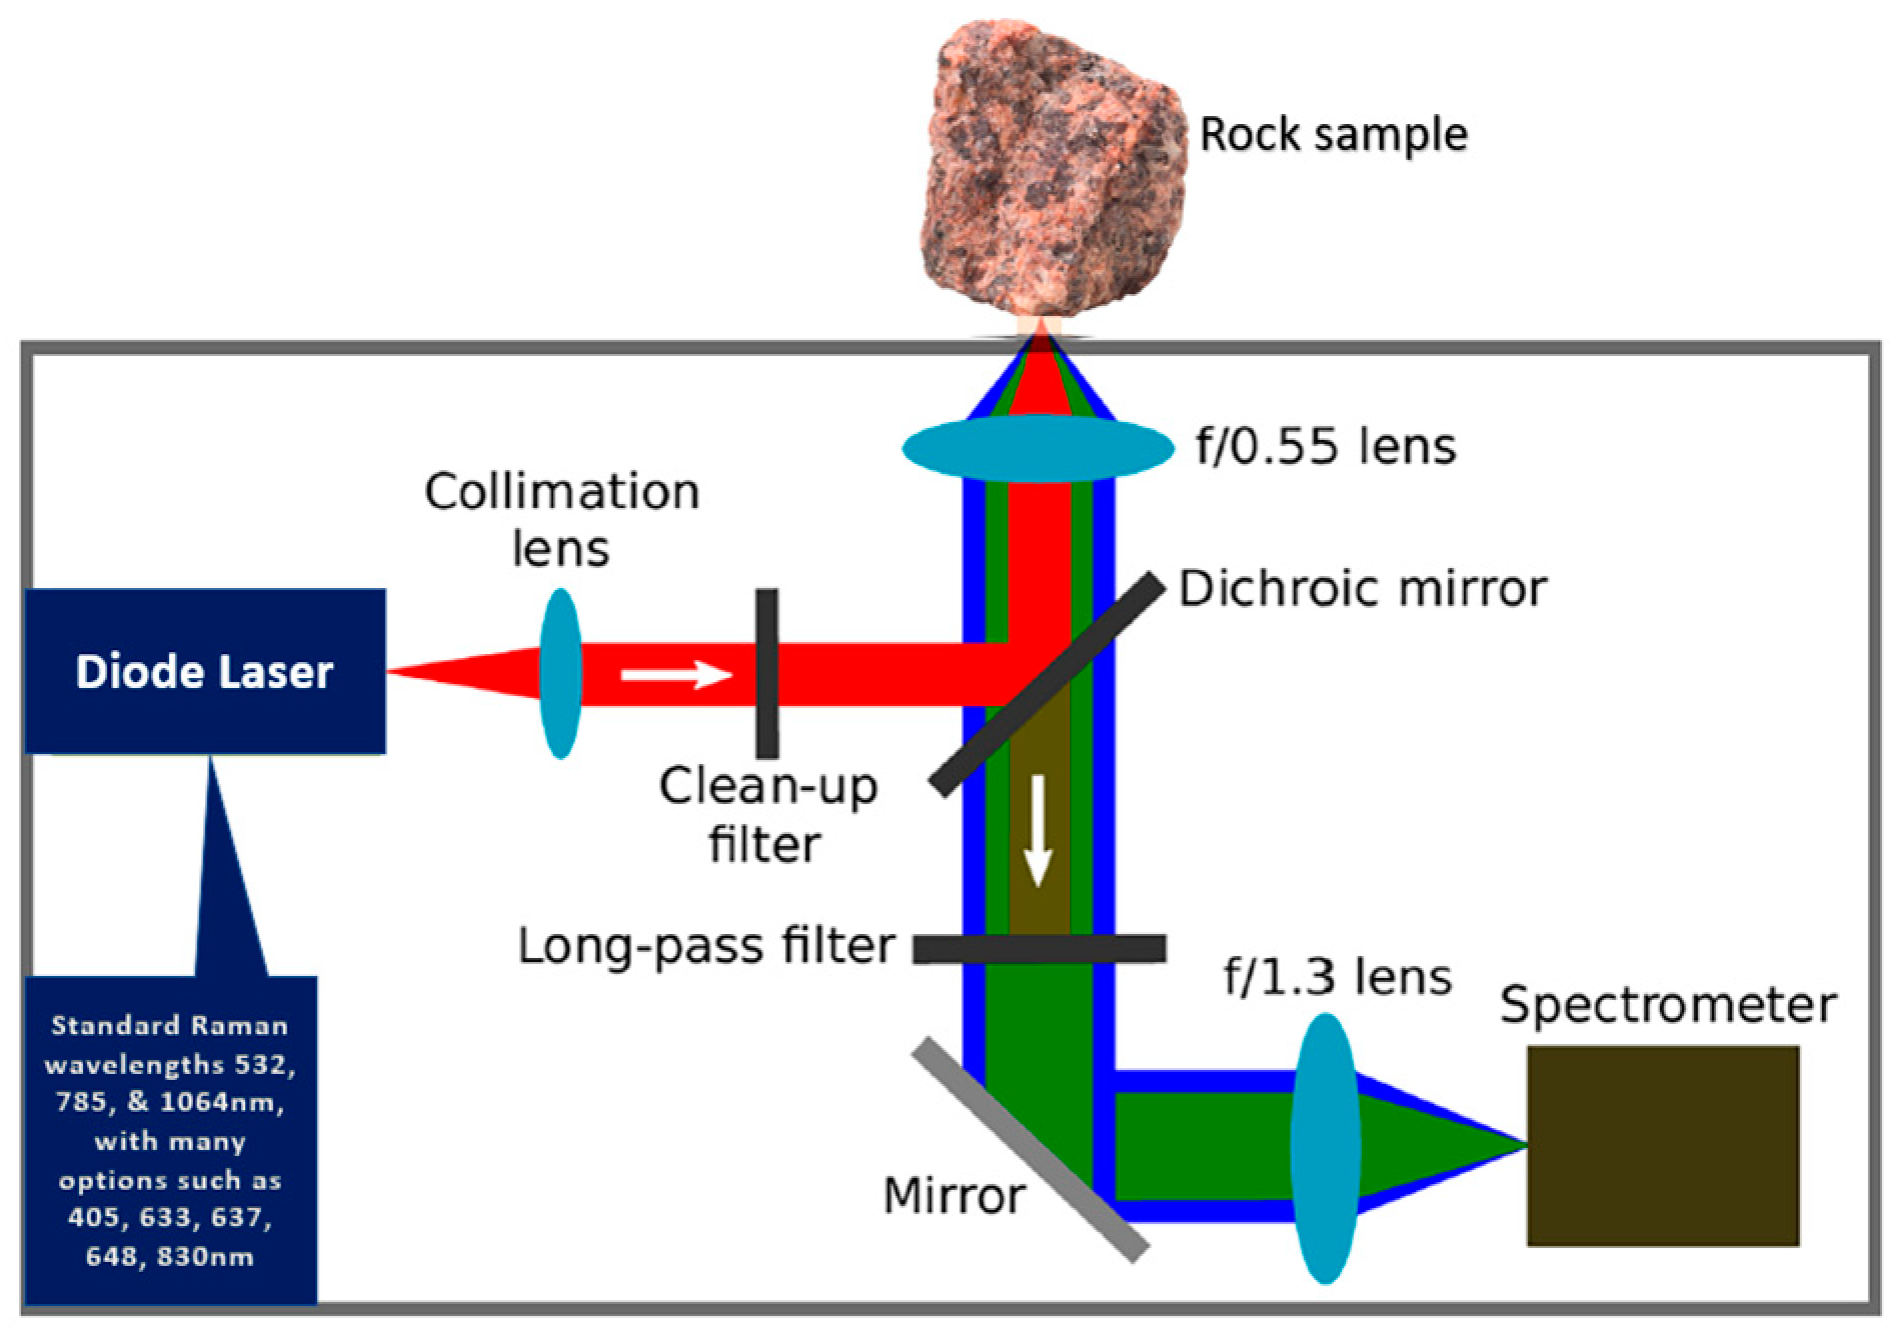
| 7 | Raman Spectrometer | When light energy in the form of a laser interacts with molecules in a gas, liquid, or solid, which results in the energy of the laser photons being shifted up or down, the shift in energy gives information about the chemical composition of the sample. | There are three primary components to any Raman spectrometer: An excitation source, a sampling apparatus, and a detector. | Chemical identification, spontaneous and stimulated, detection of minerals up to 1 µg/g concentration. This instrument was also used in the deep ocean to identify different minerals on the ocean floor. | Can provide chemical and structural fingerprint information for earth materials (solids, powders, and liquids), can deliver both chemical composition and structural information in a single measurement. |
| 8 | LED fluorimeter | The uranyl ion is excited in the sample by using electromagnetic energy of suitable wavelengths and the decay is measured with the time of the uranium phosphorescence after the termination of the incident electromagnetic radiation. | Light source of suitable wavelength, excitation filter, sample holder, dichroic beam splitter, and emission filters. | Low cost, easy to operate, offers very low detection limit for uranium. | Mostly used in water quality monitoring, potential tool for uranium exploration studies, especially by hydrogeochemical prospecting methods. |
| 9 | Core scanner based on XRF technology | Works on the principle much similar to a portable XRF. | An X-ray generator, a filter to reduce background noise, optics, and a detector. | Requires an XRF core scanner to be positioned accurately above the sediment surface, provides rapid high-resolution (down to 1 mm) records of chemical composition on split sediment cores. | Offers fast, non-destructive closely spaced analysis of major, minor, and some trace elements in drill cores by scanning the surface of split sediment cores. |
| 10 | Core scanner based on LIBS technology | The laser-induced plasma emission is collected by achromatic lenses and the optical signal is then spectrally resolved by a spectrometer that covers 220 to 990 nm with the detection of intensity light at selected wavelengths by a CMOS detector. | The laser source, the spectrometer, the 2-axis drill core translation table, and the ablation chamber in a fully automated configuration. | LIBS core scanners work in the full 220–990 nm range and a camera that can read 1000 full frames per second. | It can be used for both high-resolution mineralogical imaging and low-resolution core scanning. |
| 11 | Core scanner based on IR hyperspectral technology | Hyperspectral imaging is a chemical imaging technique by reflectance spectroscopy to identify minerals based on their spectral response to infrared light. | A tray table for carrying the core wooden tray under the field-of-view of the imaging spectrometer and a sensor to cover the IR regions of the electromagnetic spectrum. The entire setting is installed in a transportable Container. | The mineral liberation, texture, and grain information can be provided by the scanning and mapping of drill core samples, acquires data from hundreds of meters of core per day without any sample preparation. | It helps in mineral identification and quantification of the entire borehole from small samples, with high resolution mineralogical information strategically selected throughout the deposit. |
| Description | Na (mmol/kg) | K (mmol/kg) | Ca (mmol/kg) | Li In (µmol/kg) |
|---|---|---|---|---|
| In situ determination by LIBS | 470 ± 2 | 10.3 ± 0.2 | 9.7 ± 1.0 | 25 ± 9 |
| In lab determined by ICP-AES | 452 | 10.2 | 9.4 | 43.2 |
| Element/Sample Identity | POS$-2012-41.10 | POS$-2012-70.10 | POS$-2012-92.10 | POS$-2012-102.10 | ||||
|---|---|---|---|---|---|---|---|---|
| pXRF | Lab XRF | pXRF | Lab XRF | pXRF | Lab XRF | pXRF | Lab XRF | |
| Mg % | <LOD | 0.95 | <LOD | 1.04 | <LOD | 1.07 | <LOD | 1.02 |
| Al % | 6.6 | 7.95 | 6 | 8.01 | 6.3 | 8.04 | 6.3 | 8.08 |
| Si % | 35.7 | 32.7 | 31.9 | 32.4 | 34.6 | 32.3 | 33.7 | 32.2 |
| P % | <LOD | 0.075 | <LOD | 0.072 | <LOD | 0.072 | <LOD | 0.075 |
| K % | 2.28 | 2.18 | 2.26 | 2.18 | 2.36 | 2.25 | 2.27 | 2.18 |
| Ca % | 1.48 | 1.65 | 1.48 | 1.67 | 1.43 | 1.62 | 1.52 | 1.67 |
| Ti % | 0.3 | 0.312 | 0.31 | 0.336 | 0.32 | 0.336 | 0.32 | 0.336 |
| Mn (µg/g) | 420 | 372 | 432 | 411 | 419 | 418 | 453 | 411 |
| Fe % | 2.90 | 3.10 | 2.95 | 3.41 | 3.2 | 3.40 | 3.04 | 3.38 |
| S % | <LOD | 0.028 | <LOD | 0.026 | <LOD | 0.035 | <LOD | 0.029 |
| Cl % | <LOD | 0.008 | <LOD | 0.009 | <LOD | 0.011 | <LOD | 0.009 |
| V (µg/g) | 78 | 70 | 75 | 70 | 75 | 75 | 74 | 74 |
| Cr (µg/g) | 76 | 48 | 82 | 58 | 81 | 57 | 87 | 56 |
| Ni (µg/g) | 16 | <20 | <LOD | <20 | <LOD | 22 | 29 | <20 |
| Cu (µg/g) | 26 | 30 | 29 | 30 | 36 | 44 | 40 | 30 |
| Zn (µg/g) | 41 | 53 | 41 | 55 | 50 | 66 | 38 | 66 |
| As (µg/g) | 37 | 20 | 28 | 21 | 33 | 25 | 38 | <20 |
| Rb (µg/g) | 79.6 | 90 | 71.9 | 97 | 83.8 | 100 | 76.8 | 100 |
| Sr (µg/g) | 185 | 229 | 172 | 236 | 199 | 232 | 195 | 238 |
| Y (µg/g) | 15 | 18 | 11 | 26 | 16 | 21 | 13 | 26 |
| Zr (µg/g) | 225 | 198 | 198 | 187 | 223 | 193 | 219 | 191 |
| Mo (µg/g) | <LOD | <0.001 | <LOD | <0.001 | <LOD | <0.001 | <LOD | <0.001 |
| Sn (µg/g) | <LOD | <0.002 | <LOD | <0.002 | <LOD | <0.002 | <LOD | <0.002 |
| Sb (µg/g) | <LOD | <0.01 | <LOD | <0.01 | <LOD | <0.01 | <LOD | <0.01 |
| Pb (µg/g) | 10 | <20 | 10 | 24 | 13 | 21 | 8 | <20 |
| Bi (µg/g) | <LOD | <30 | 30 | <30 | <LOD | <30 | <LOD | <30 |
| Th (µg/g) | <LOD | 0.001 | <LOD | 0.001 | <LOD | <0.001 | <LOD | 0.001 |
| U(µg/g) | <LOD | <0.001 | <LOD | <0.001 | <LOD | <0.001 | <LOD | <0.001 |
Publisher’s Note: MDPI stays neutral with regard to jurisdictional claims in published maps and institutional affiliations. |
© 2022 by the authors. Licensee MDPI, Basel, Switzerland. This article is an open access article distributed under the terms and conditions of the Creative Commons Attribution (CC BY) license (https://creativecommons.org/licenses/by/4.0/).
Share and Cite
Balaram, V.; Sawant, S.S. Indicator Minerals, Pathfinder Elements, and Portable Analytical Instruments in Mineral Exploration Studies. Minerals 2022, 12, 394. https://doi.org/10.3390/min12040394
Balaram V, Sawant SS. Indicator Minerals, Pathfinder Elements, and Portable Analytical Instruments in Mineral Exploration Studies. Minerals. 2022; 12(4):394. https://doi.org/10.3390/min12040394
Chicago/Turabian StyleBalaram, V., and S. S. Sawant. 2022. "Indicator Minerals, Pathfinder Elements, and Portable Analytical Instruments in Mineral Exploration Studies" Minerals 12, no. 4: 394. https://doi.org/10.3390/min12040394