Article

Experimental Study on the Influence of Confining Pressure and Bedding Angles on Mechanical Properties in Coal

1
School of Civil Engineering and Architecture, Chongqing University of Science and Technology, Chongqing 401331, China
2
PetroChina Research Institute of Petroleum Exploration and Development, Beijing 100083, China
*
Author to whom correspondence should be addressed.
Minerals 2022, 12(3), 345; https://doi.org/10.3390/min12030345
Submission received: 24 January 2022 / Revised: 5 March 2022 / Accepted: 10 March 2022 / Published: 11 March 2022
(This article belongs to the Special Issue Fracturing of Coal and Rock Mass)

Abstract

:
Extensive bedding planes have a great influence on the mechanical properties of coal. In order to study the mechanism of the effects of bedding angles on the mechanical properties and failure characteristics of coal in the Shanxi Baode coal mine, uniaxial and triaxial compression tests and numerical simulations were conducted. The strength deterioration and microstructural changes in the samples were then analyzed with discrete element method (DEM) numerical simulation. The experimental results reveal that the power function strength criterion has good applicability to the strength characteristics of this coal. It was also found that the bedding angles have a great influence on the mechanical properties of coal. The properties of peak strength at different bedding angles roughly showed a U-shaped changing trend. The maximum strength occurred at a bedding angle of 0°, whereas the minimum strength occurred at a bedding angle of 60°. The numerical simulation and test results prove that the forms of failure of different bedding coal samples are complicated and are mainly represented by tensile and shear failures.

1. Introduction

Coal is a type of sedimentary rock. In the process of formation, it is greatly affected by climate and environmental factors, resulting in large differences in structural composition. Due to the discontinuity of environmental conditions during the formation of coal, coupled with the crustal activity stress and geothermal effect after coal formation, coal generally develops at least two sets of approximately orthogonal primary fissures. Additionally, these fissures are accompanied by holes, microcracks, joints, bedding and other weak structural planes [1]. With the frequent occurrence of coal mining accidents and the upsurge of coalbed methane mining in the 1980s, researchers realized that coal bedding angle is not only an important object for analyzing the geological structure of coal fields, but also an important engineering geological factor that affects the development of coal and coalbed methane resources [2].
Many researchers have studied the mechanical characteristics of the weak structural planes. Xu et al. [3] carried out uniaxial compression tests on rocks with different joint inclinations. The influence of inclination on the failure mode of rock was discussed and the progressive failure process of rock was studied. Cai et al. [4] conducted dynamic indirect tensile tests on coal samples to explore the influence of bedding structure on the dynamic indirect tensile strength. Yan and Wu [5] considered the influence of the loading direction and the bedding direction of the square coal sample on the Brazilian test. In order to study the mechanism of influence of the bedding structure on the mechanical properties of coal, a series of uniaxial compression tests and mesoscopic tests were carried out. Zhang et al. [6] found that the bedding structure is closely related to the whole deformation process under uniaxial loading. Hao et al. [7] conducted uniaxial compression tests on one hard coal sample with different bedding and cleat angles and found that bedding had a decisive influence on the uniaxial compressive strength of coal. Jiang et al. [8] conducted Brazilian splitting tests, uniaxial compression tests and triaxial compression tests on coal samples to study the effects of bedding on the anisotropic characteristics of coal in the coal seam. Liu et al. [9] found that the mechanical properties of coal samples with different beddings are distinctive. The uniaxial compressive strength and elastic modulus of the coal samples with parallel bedding are the largest, and the Poisson’s ratio is the smallest. The deformation and failure curves of coal samples with different beddings are also quite different. Liu et al. [10] found that in rock strata with quite different mechanical properties, the bedding plane shear slip is more obvious through experimental and theoretical analysis. Based on the bedding of coal samples, gas permeability better describes the evolution of fractures, so some researchers conducted research on the permeability of bedding coals [11]. Chen et al. [12] studied the influence of different bedding angles in coal on mechanical properties and gas permeability in a complete stress–strain process. The above researchers mainly focused on the effect of the original cracks on mechanical properties, and some researchers used prefabricated macro cracks to study the influence of prefabricated cracks on the deformation, failure and mechanical properties. Lee et al. [13] conducted uniaxial compression tests on three samples with single and double cracks and explored the process of crack initiation, propagation and coalescence. Different types of rock samples containing cracks were submitted to uniaxial and triaxial compression tests, and the influence of prefabricated cracks on the strength and deformation behavior of different rock samples was analyzed in detail [14,15,16]. The research on the mechanical properties of the original cracks and prefabricated cracks has laid the foundation for the study of the mechanical properties of weak structural planes. However, they did not take the influence of bedding angle in triaxial compression properties into consideration. So far, research on the influence of bedding angle on coal mechanical properties has been rather limited.
Furthermore, with the gradual maturity of numerical simulation software, many researchers have introduced numerical simulation methods into the study of the influence of weak structures on rock strength. Mughieda and Omar [17] established a two-dimensional finite element model to investigate the stress distribution within rock-like samples with offset open non-persistent joints under uniaxial loading. Liu et al. [18] numerically investigated the mechanical behavior of coal samples with combined flaws with various inclination angles. The results show that different flaw inclination angles result in variations in the strength and deformation of pre-cracked samples. Lv et al. [19] comprehensively studied the influence of crack parameters on coal through theoretical analysis, laboratory experiments and numerical simulation. Bahaaddini et al. [20] analyzed the shear behavior of rock joints by using numerical simulation.
In this paper, the coal is sampled into standard cylindrical samples with different bedding angles. Triaxial compression tests were carried on the different bedding angles samples, and the influence of confining pressure and bedding angles on their mechanical properties and failure characteristics are analyzed. Meanwhile, the discrete element method (DEM) was used for numerical simulation to analyze the deterioration and microstructural changes of the samples with different bedding angles under triaxial compression tests. The test results have a reference value in coal mine disaster prevention and safe production.

2. Samples and Experiments

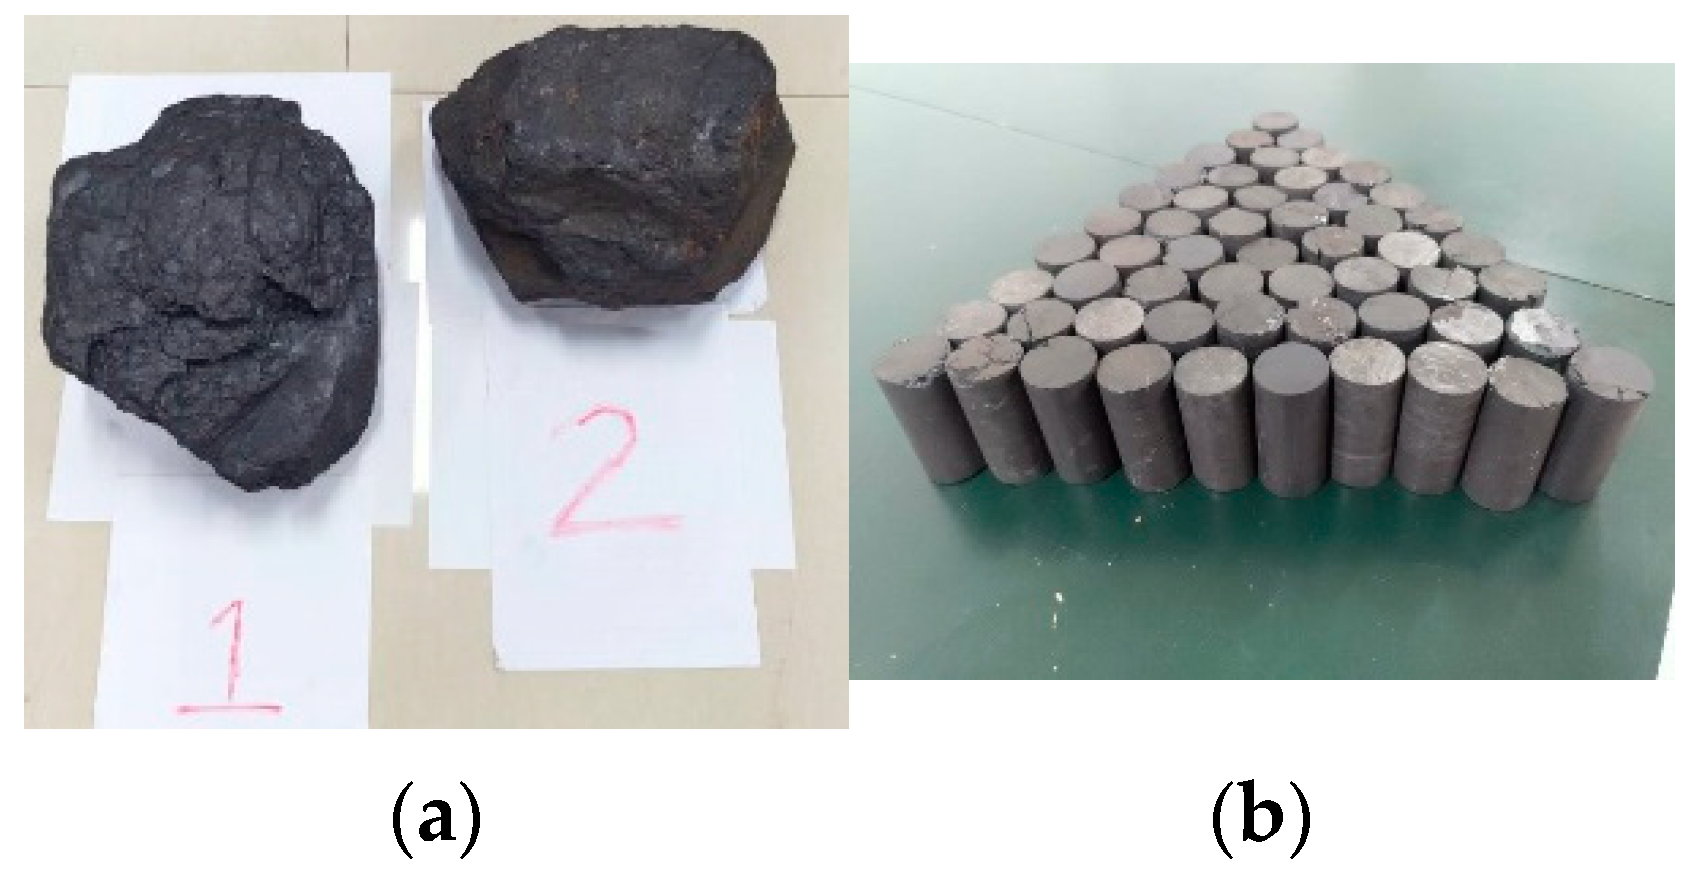
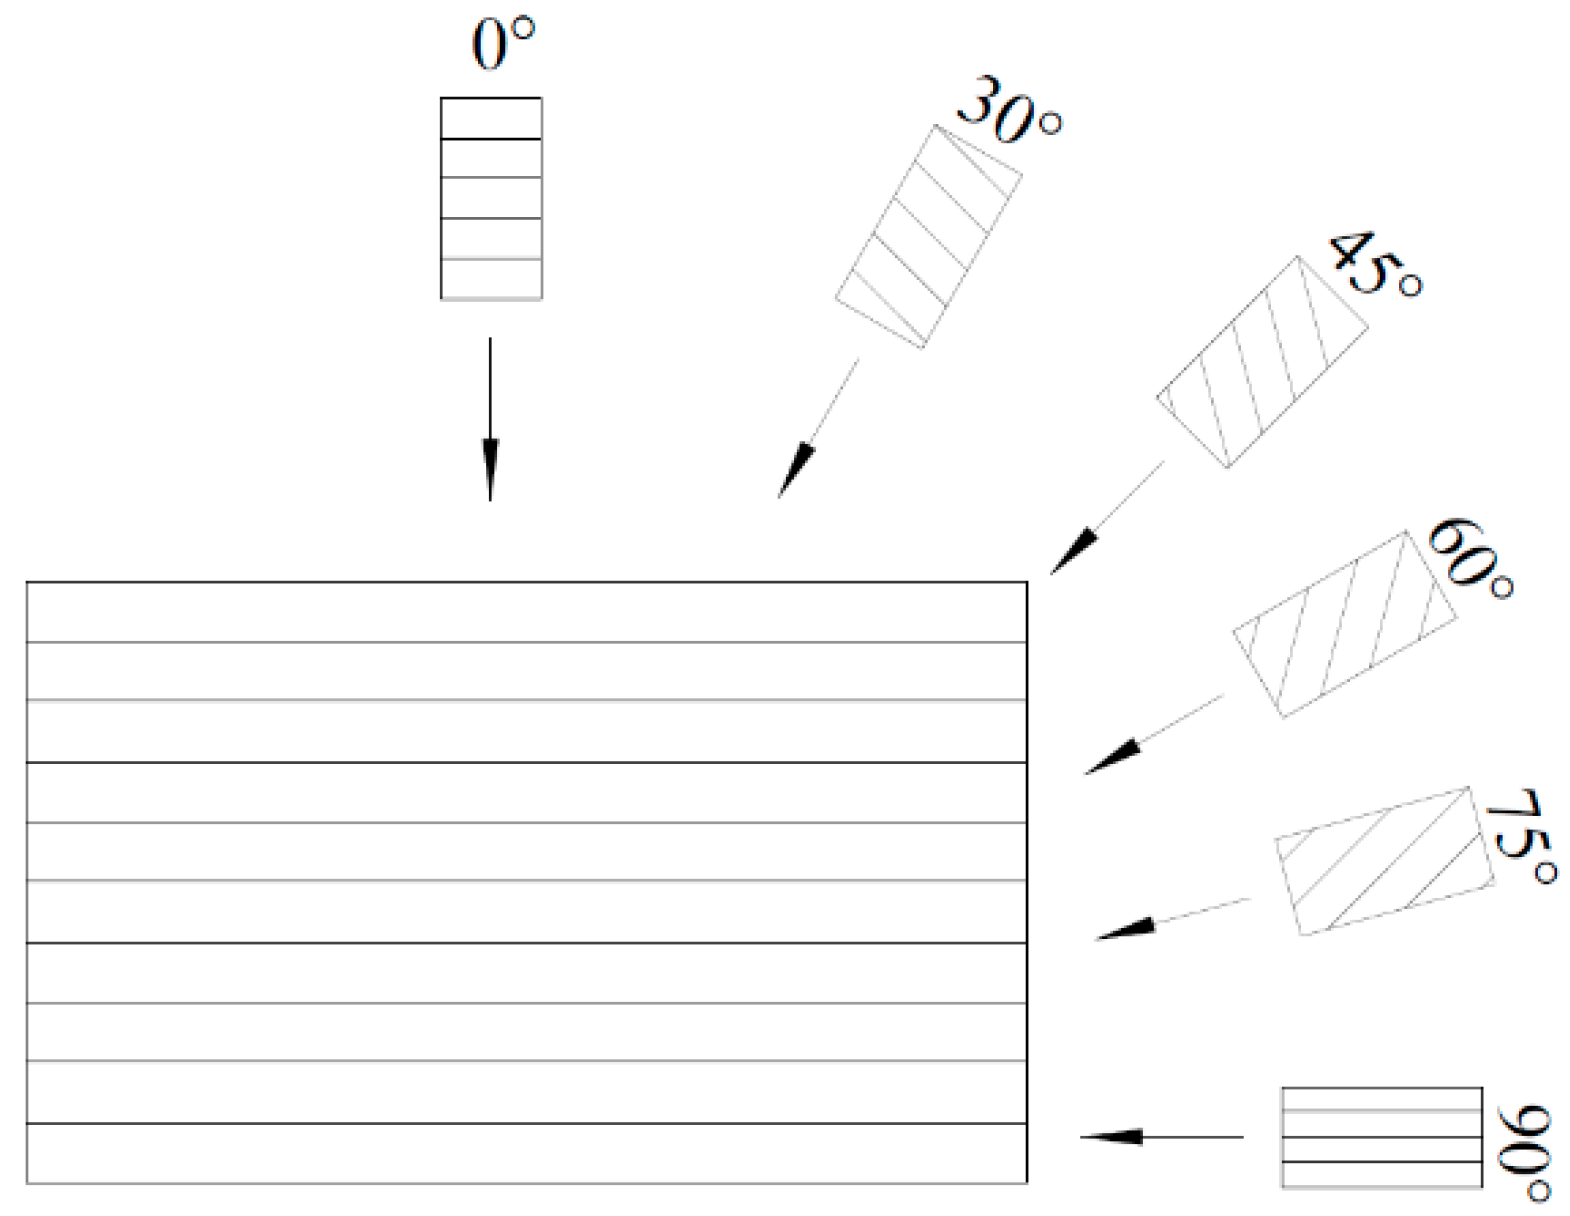
2.1. Preparation of Samples

In this study, two coal blocks were taken from the Baode coal mine at a depth of approximately 300 m in Shanxi Province, China. A series of cylindrical samples with a diameter of 25 mm and a length of approximately 50 mm were machined from these two coal blocks, which were prepared following the American Society for Testing and Materials (ASTM D7012-14). After sample processing and molding, the surfaces of both sample ends were carefully polished to a smooth surface, as shown in Figure 1. The average density of samples was approximately 1.49 g/cm3.
Two kinds of samples were created. The samples with a bedding angle of 0° were used to take the uniaxial compression tests and the triaxial compression tests, while the samples with bedding angles of 0°, 30°, 45°, 60°, 75° and 90° were used to analyze the mechanical behavior influence of the coal under the triaxial condition. The samples were obtained through different drilling angles, as shown in Figure 2.

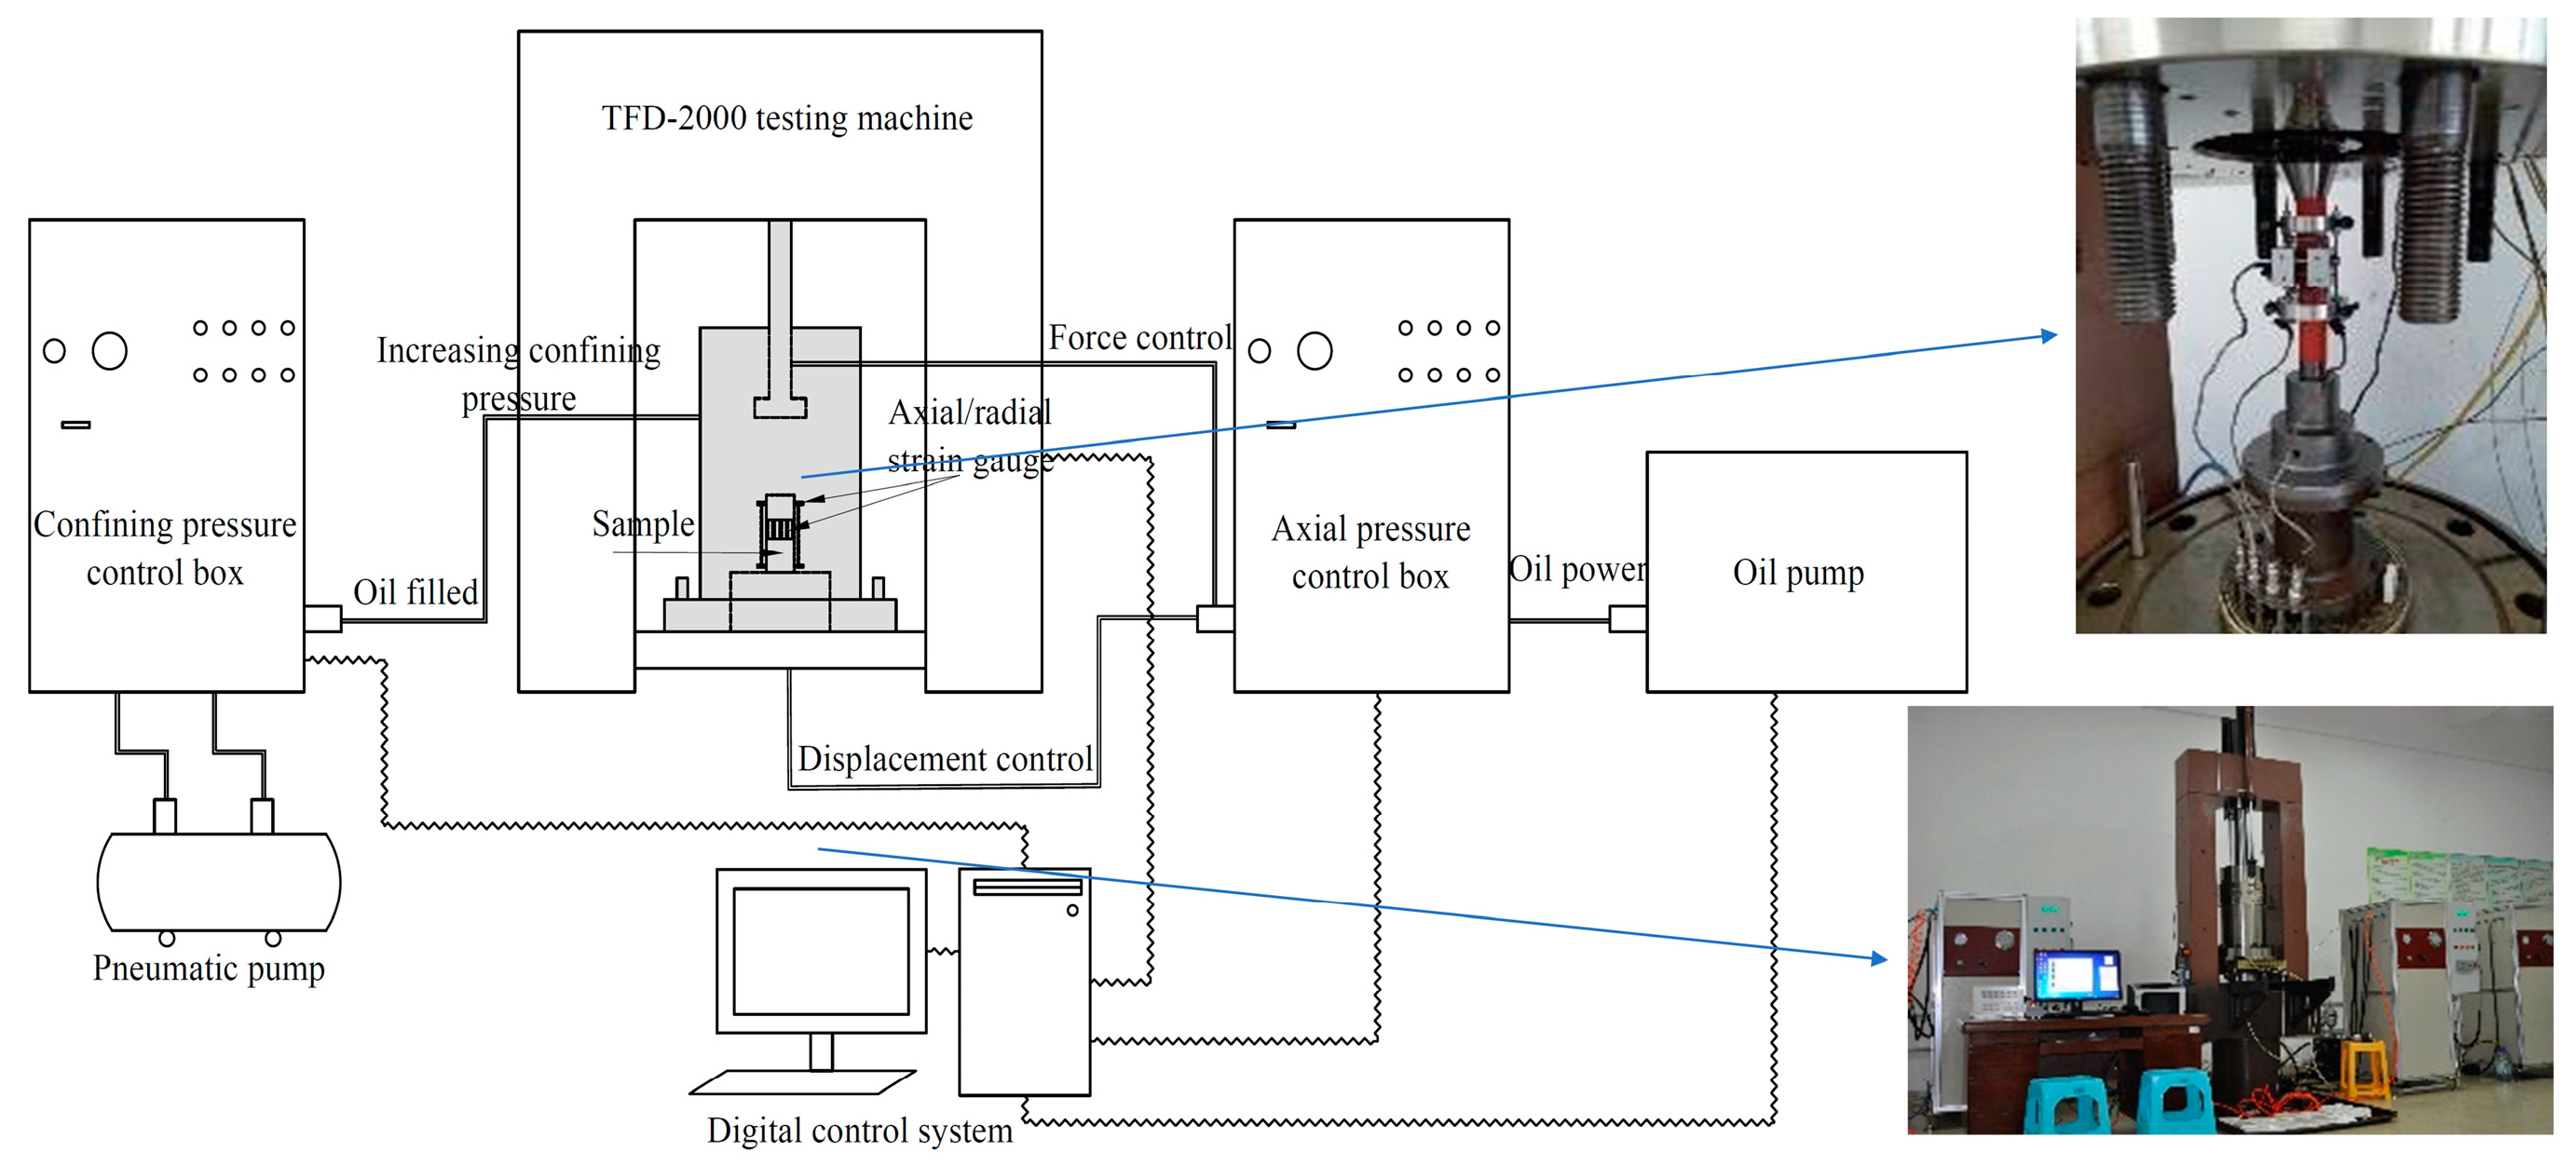
2.2. Experimental Equipment

A TFD-2000 microcomputer servo-controlled triaxial rheological testing machine, as shown in Figure 3, was used to test the mechanical properties of the samples, including uniaxial compression and triaxial compression.
The testing equipment comprises axial loading, confining pressure loading, hydraulic pressure loading, numerical control and a measuring system. The maximum axial load is 2000 kN and the measurement resolution is 10 N. The maximum confining pressure is 100 MPa and the measurement resolution is 0.001 MPa. The maximum hydraulic pressure is 70 MPa, the maximum axial deformation is 10 mm, the measurement accuracy is ±0.5%, and the temperature range is from atmospheric temperature to 200 °C. This equipment can perform the controlled tests and data analysis by computerized and robotized operations, which ensures the accuracy, timeliness and safety of the test results.

2.3. Experimental Procedure

In order to describe the deformation and failure characteristics of coal under the initial stress state, the designation of confining pressure is determined by the mining depth of the coal. The analysis of the statistical data of the measured vertical stress (σv) all over the world shows that in the depth range of 25–2700 m, σv increases linearly, which is roughly equivalent to the average volumetric weight (γ) of 27 kN/m3. In this study, the depth of the mined coal samples was approximately 300 m, so the initial stress was approximately 9 MPa. Therefore, four levels of confining pressure were set for the tests: 3, 6, 9 and 12 MPa, respectively.
All cylindrical samples were dried for 24 h in the oven at a temperature of 105 °C. The procedure of triaxial compressive tests can be described as follows. First, the confining pressure was continuously applied by stress control at a speed of 0.05 MPa/s until the sample reached the hydrostatic pressure conditions (σ1 = σ3). Then, a displacement control rate of 0.01 mm/min was used to apply the axial deviatoric stress (σ1σ3) until the sample failed. The test procedure for uniaxial compression is similar to that for triaxial compression, except that the pressurizing process is eliminated.
According to different loading methods, the specific experimental procedures and sample size parameters are shown in Table 1.

3. Mechanical Test Results

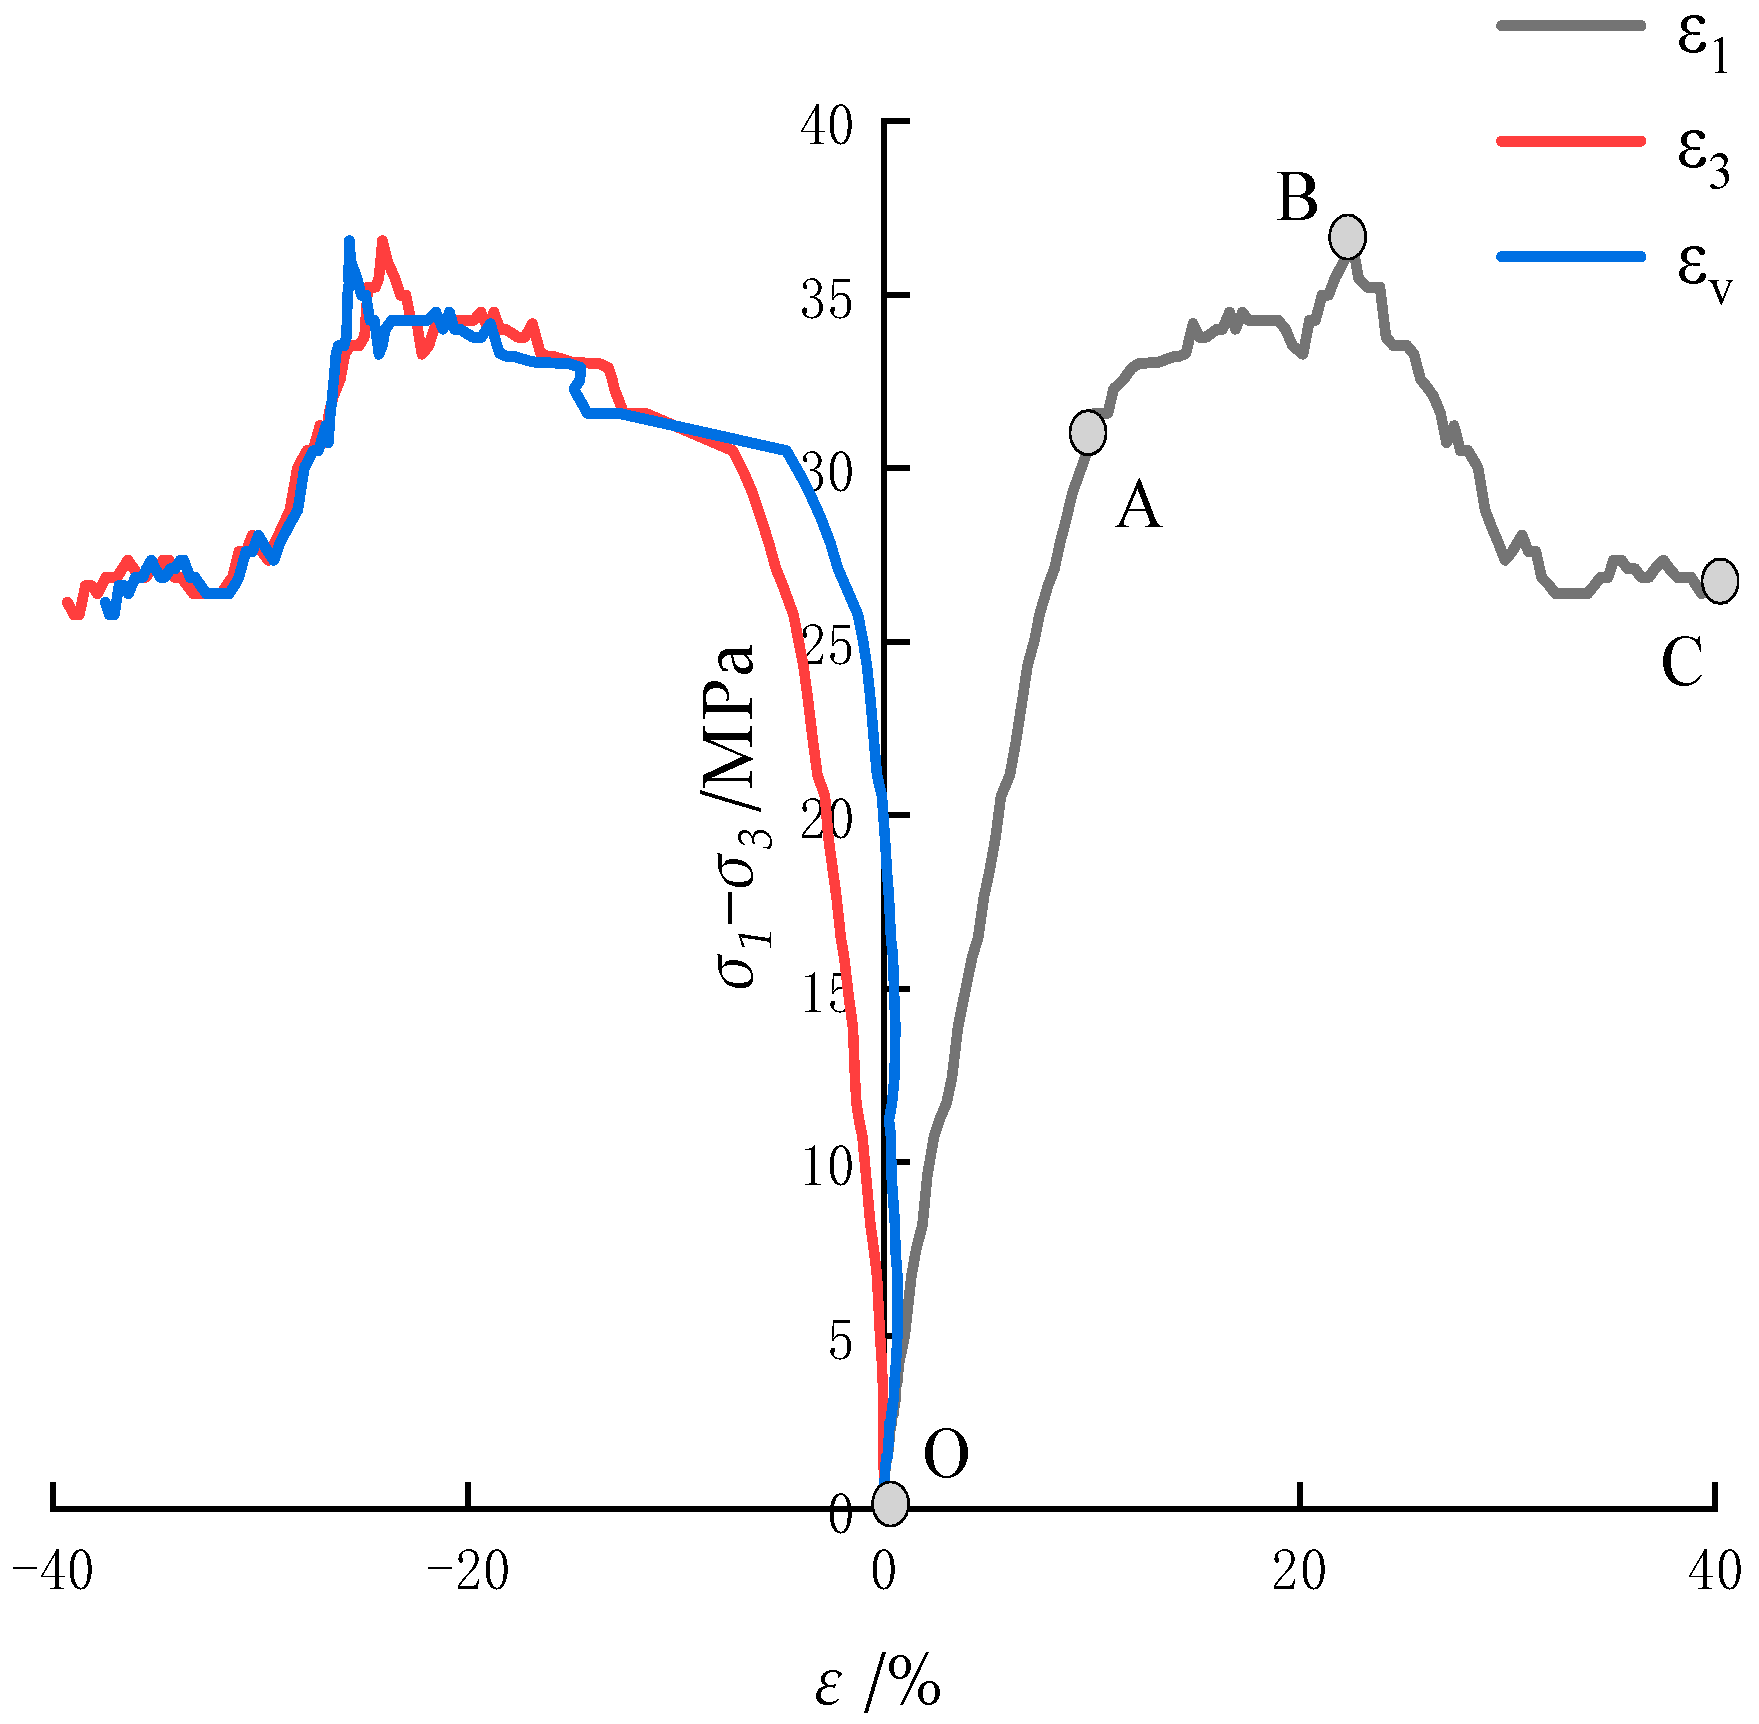
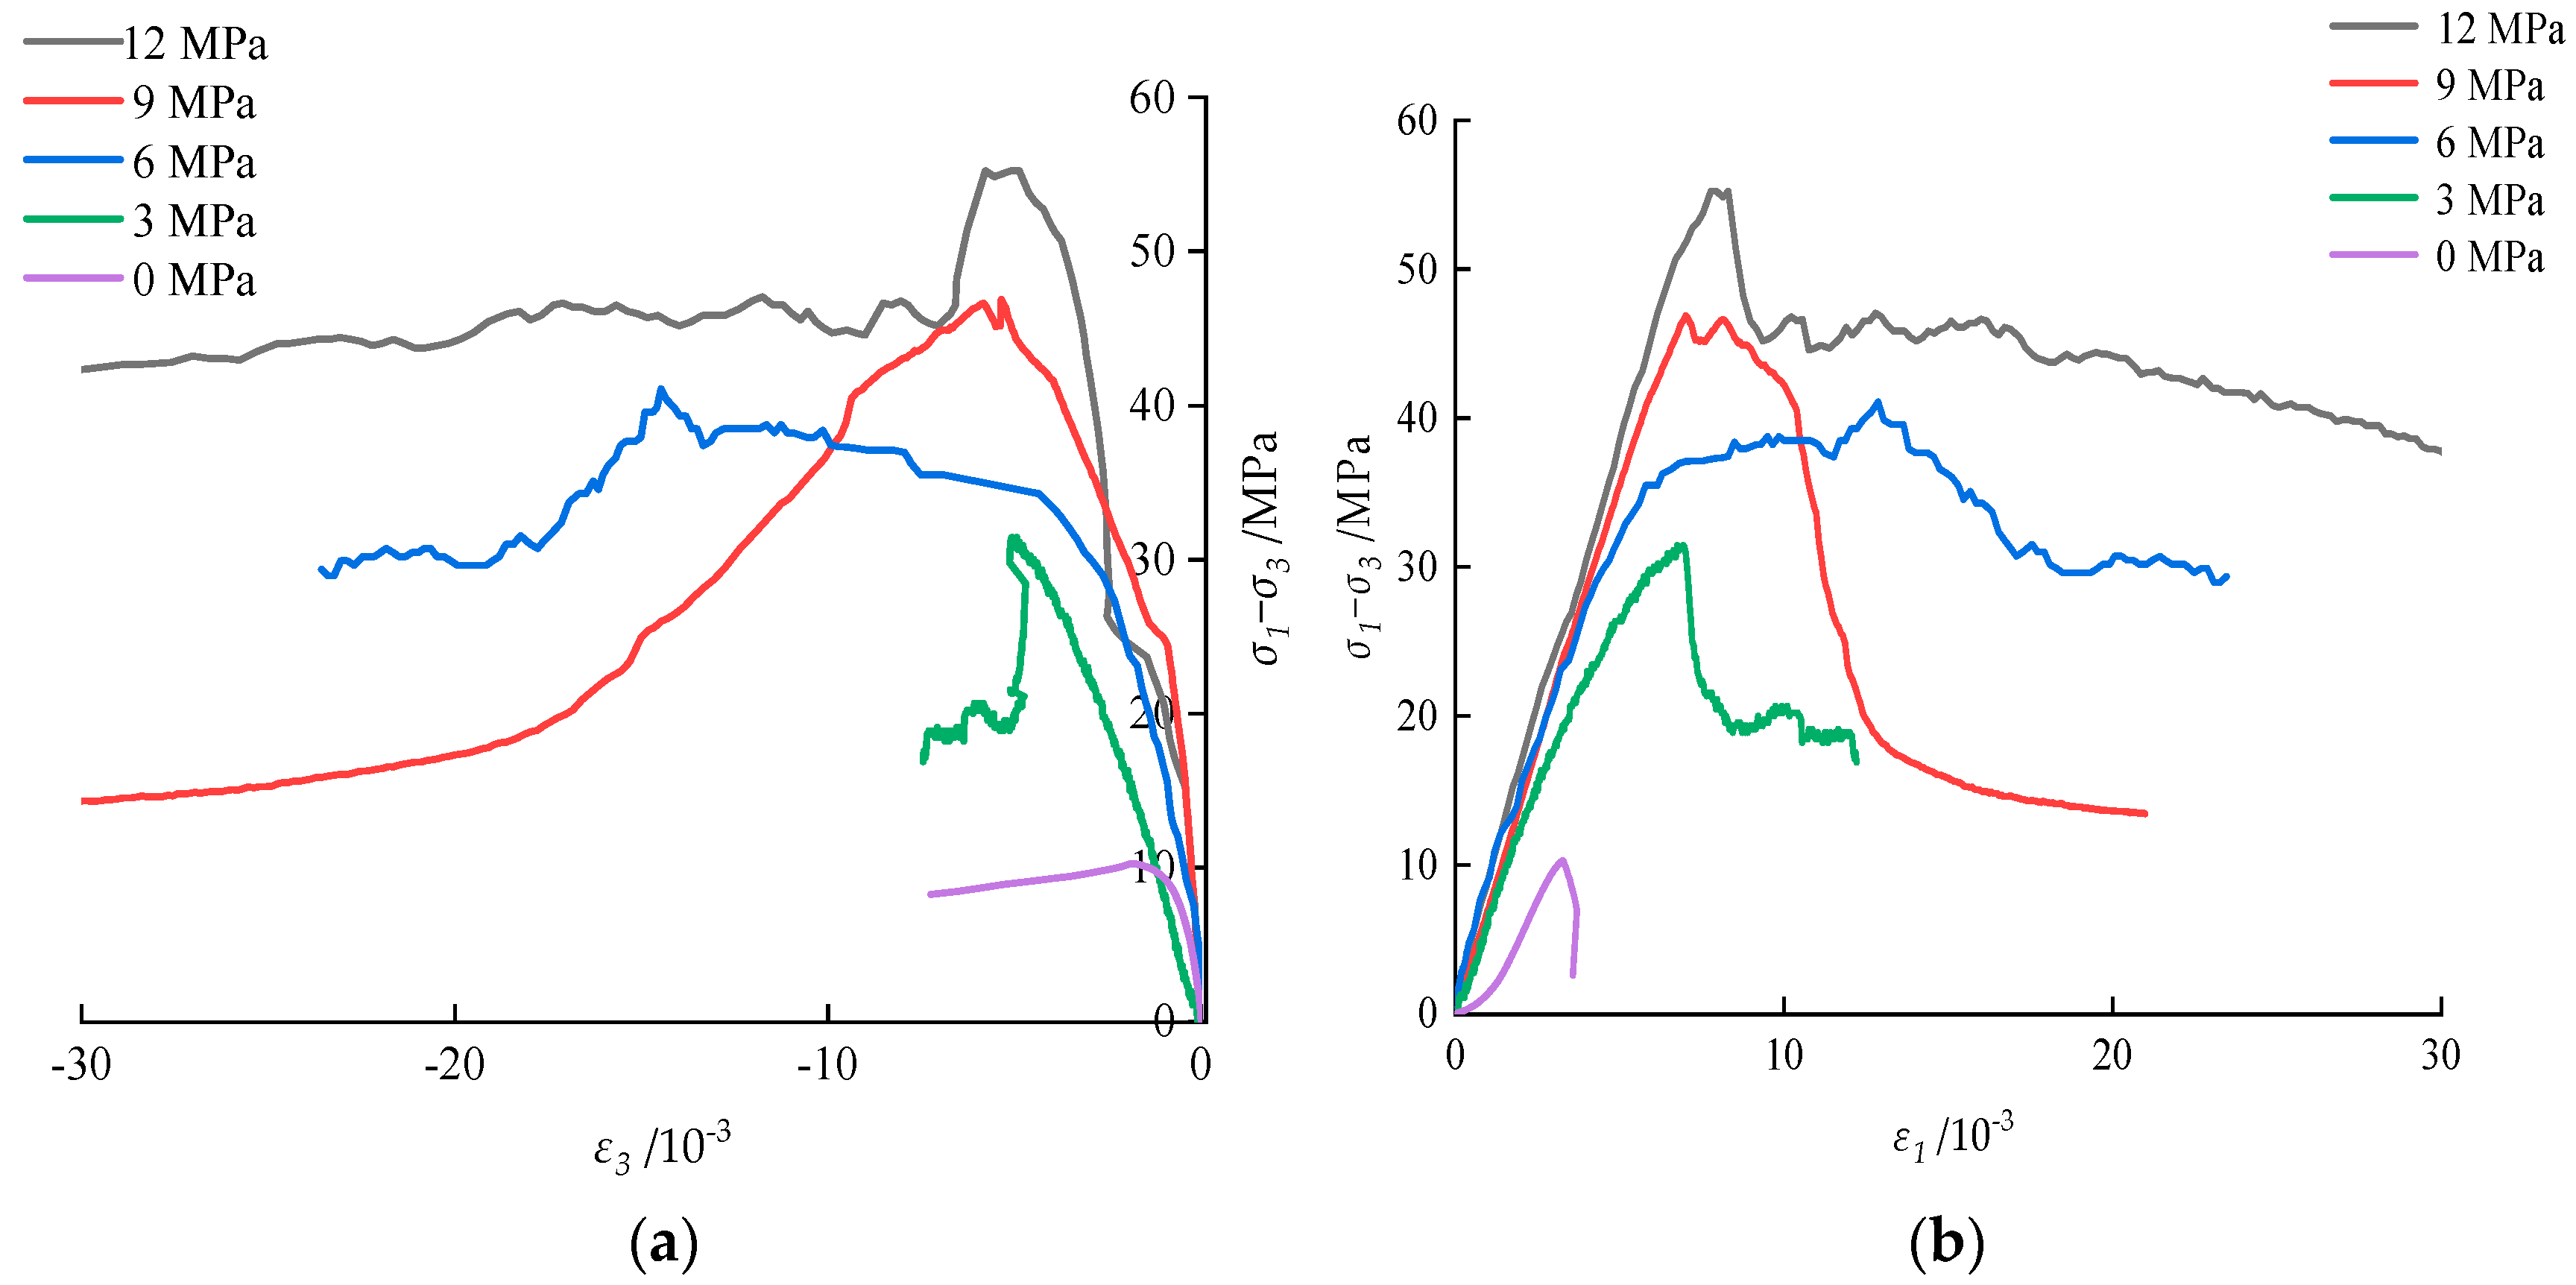
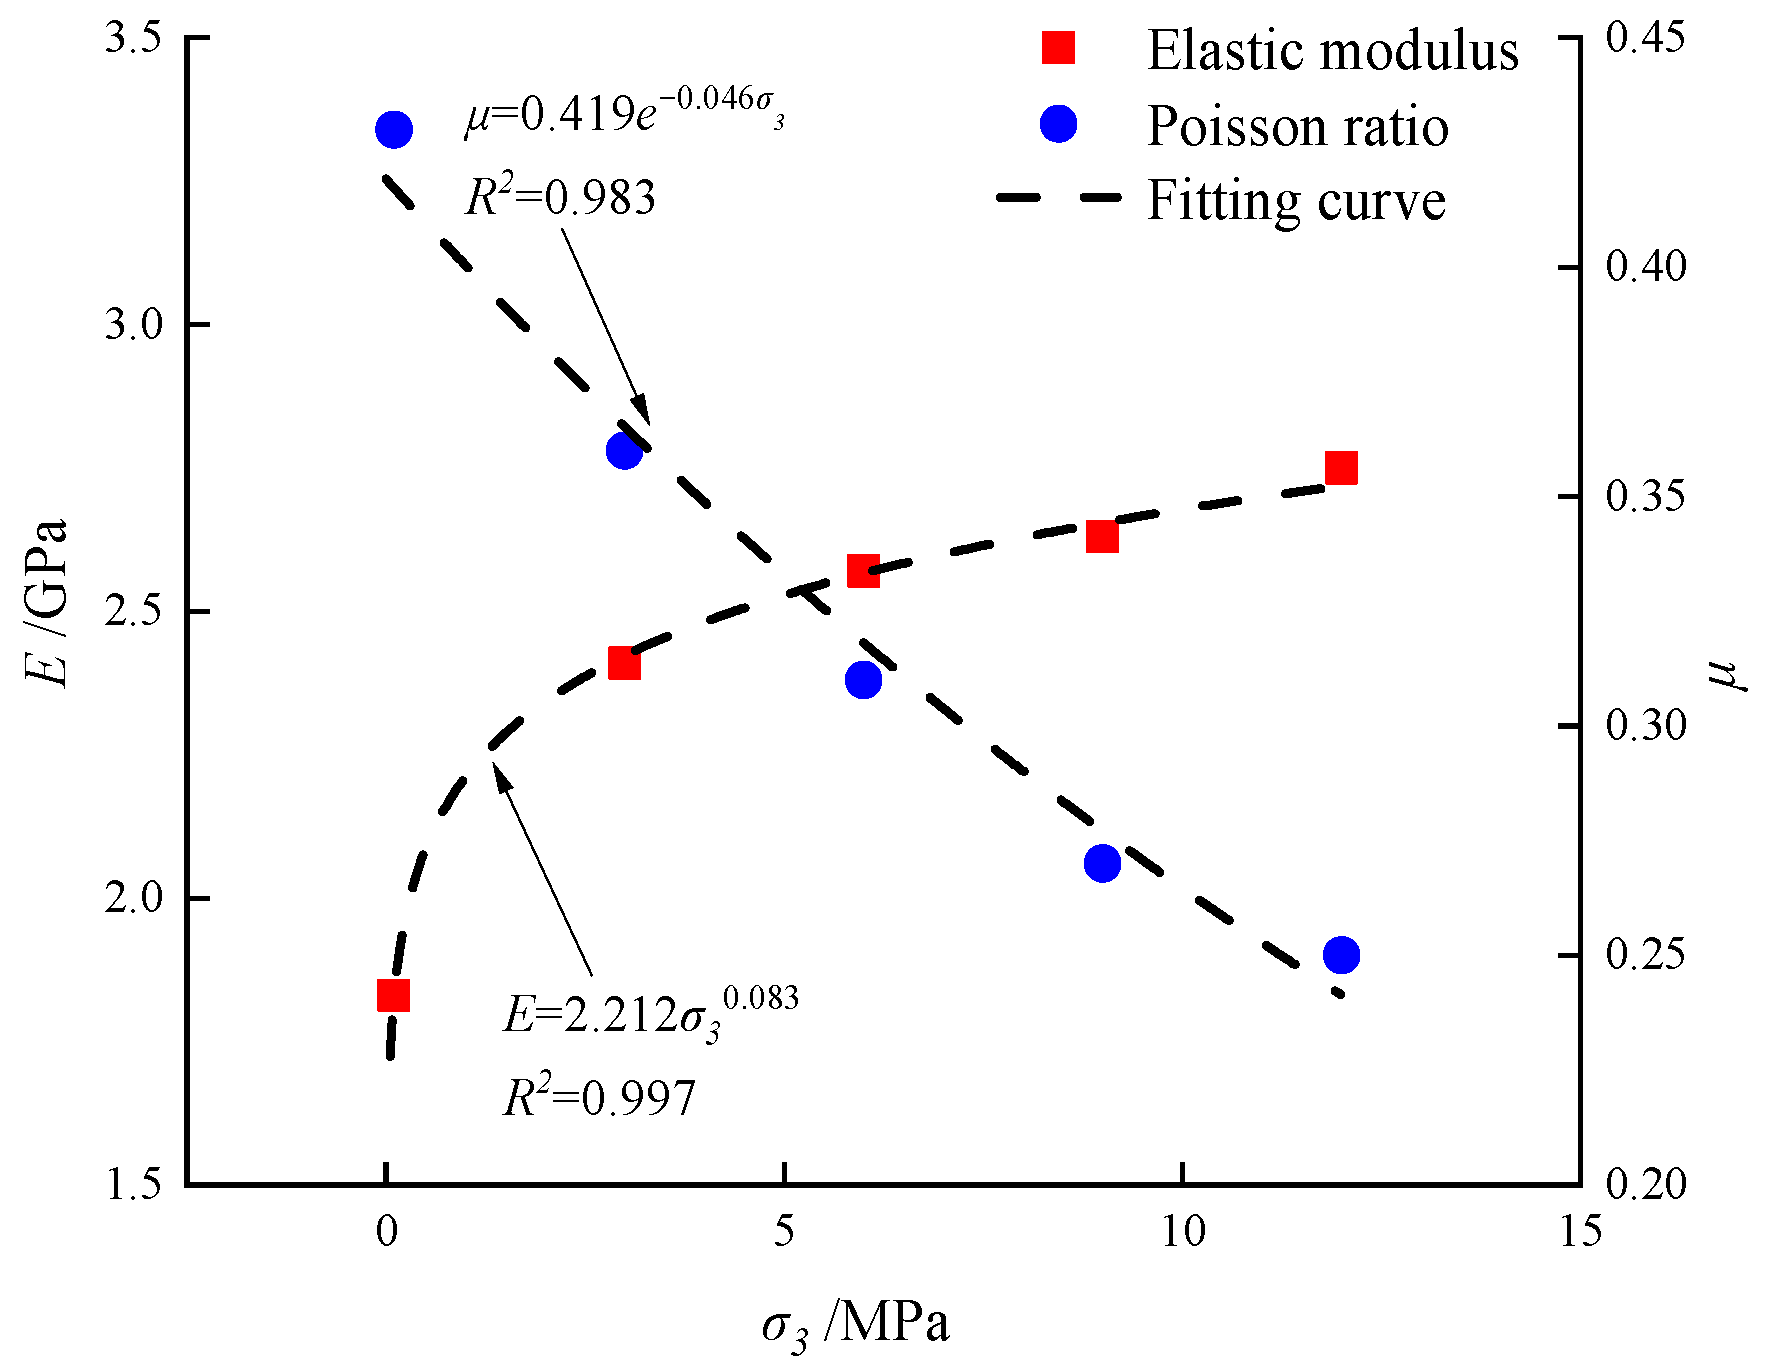
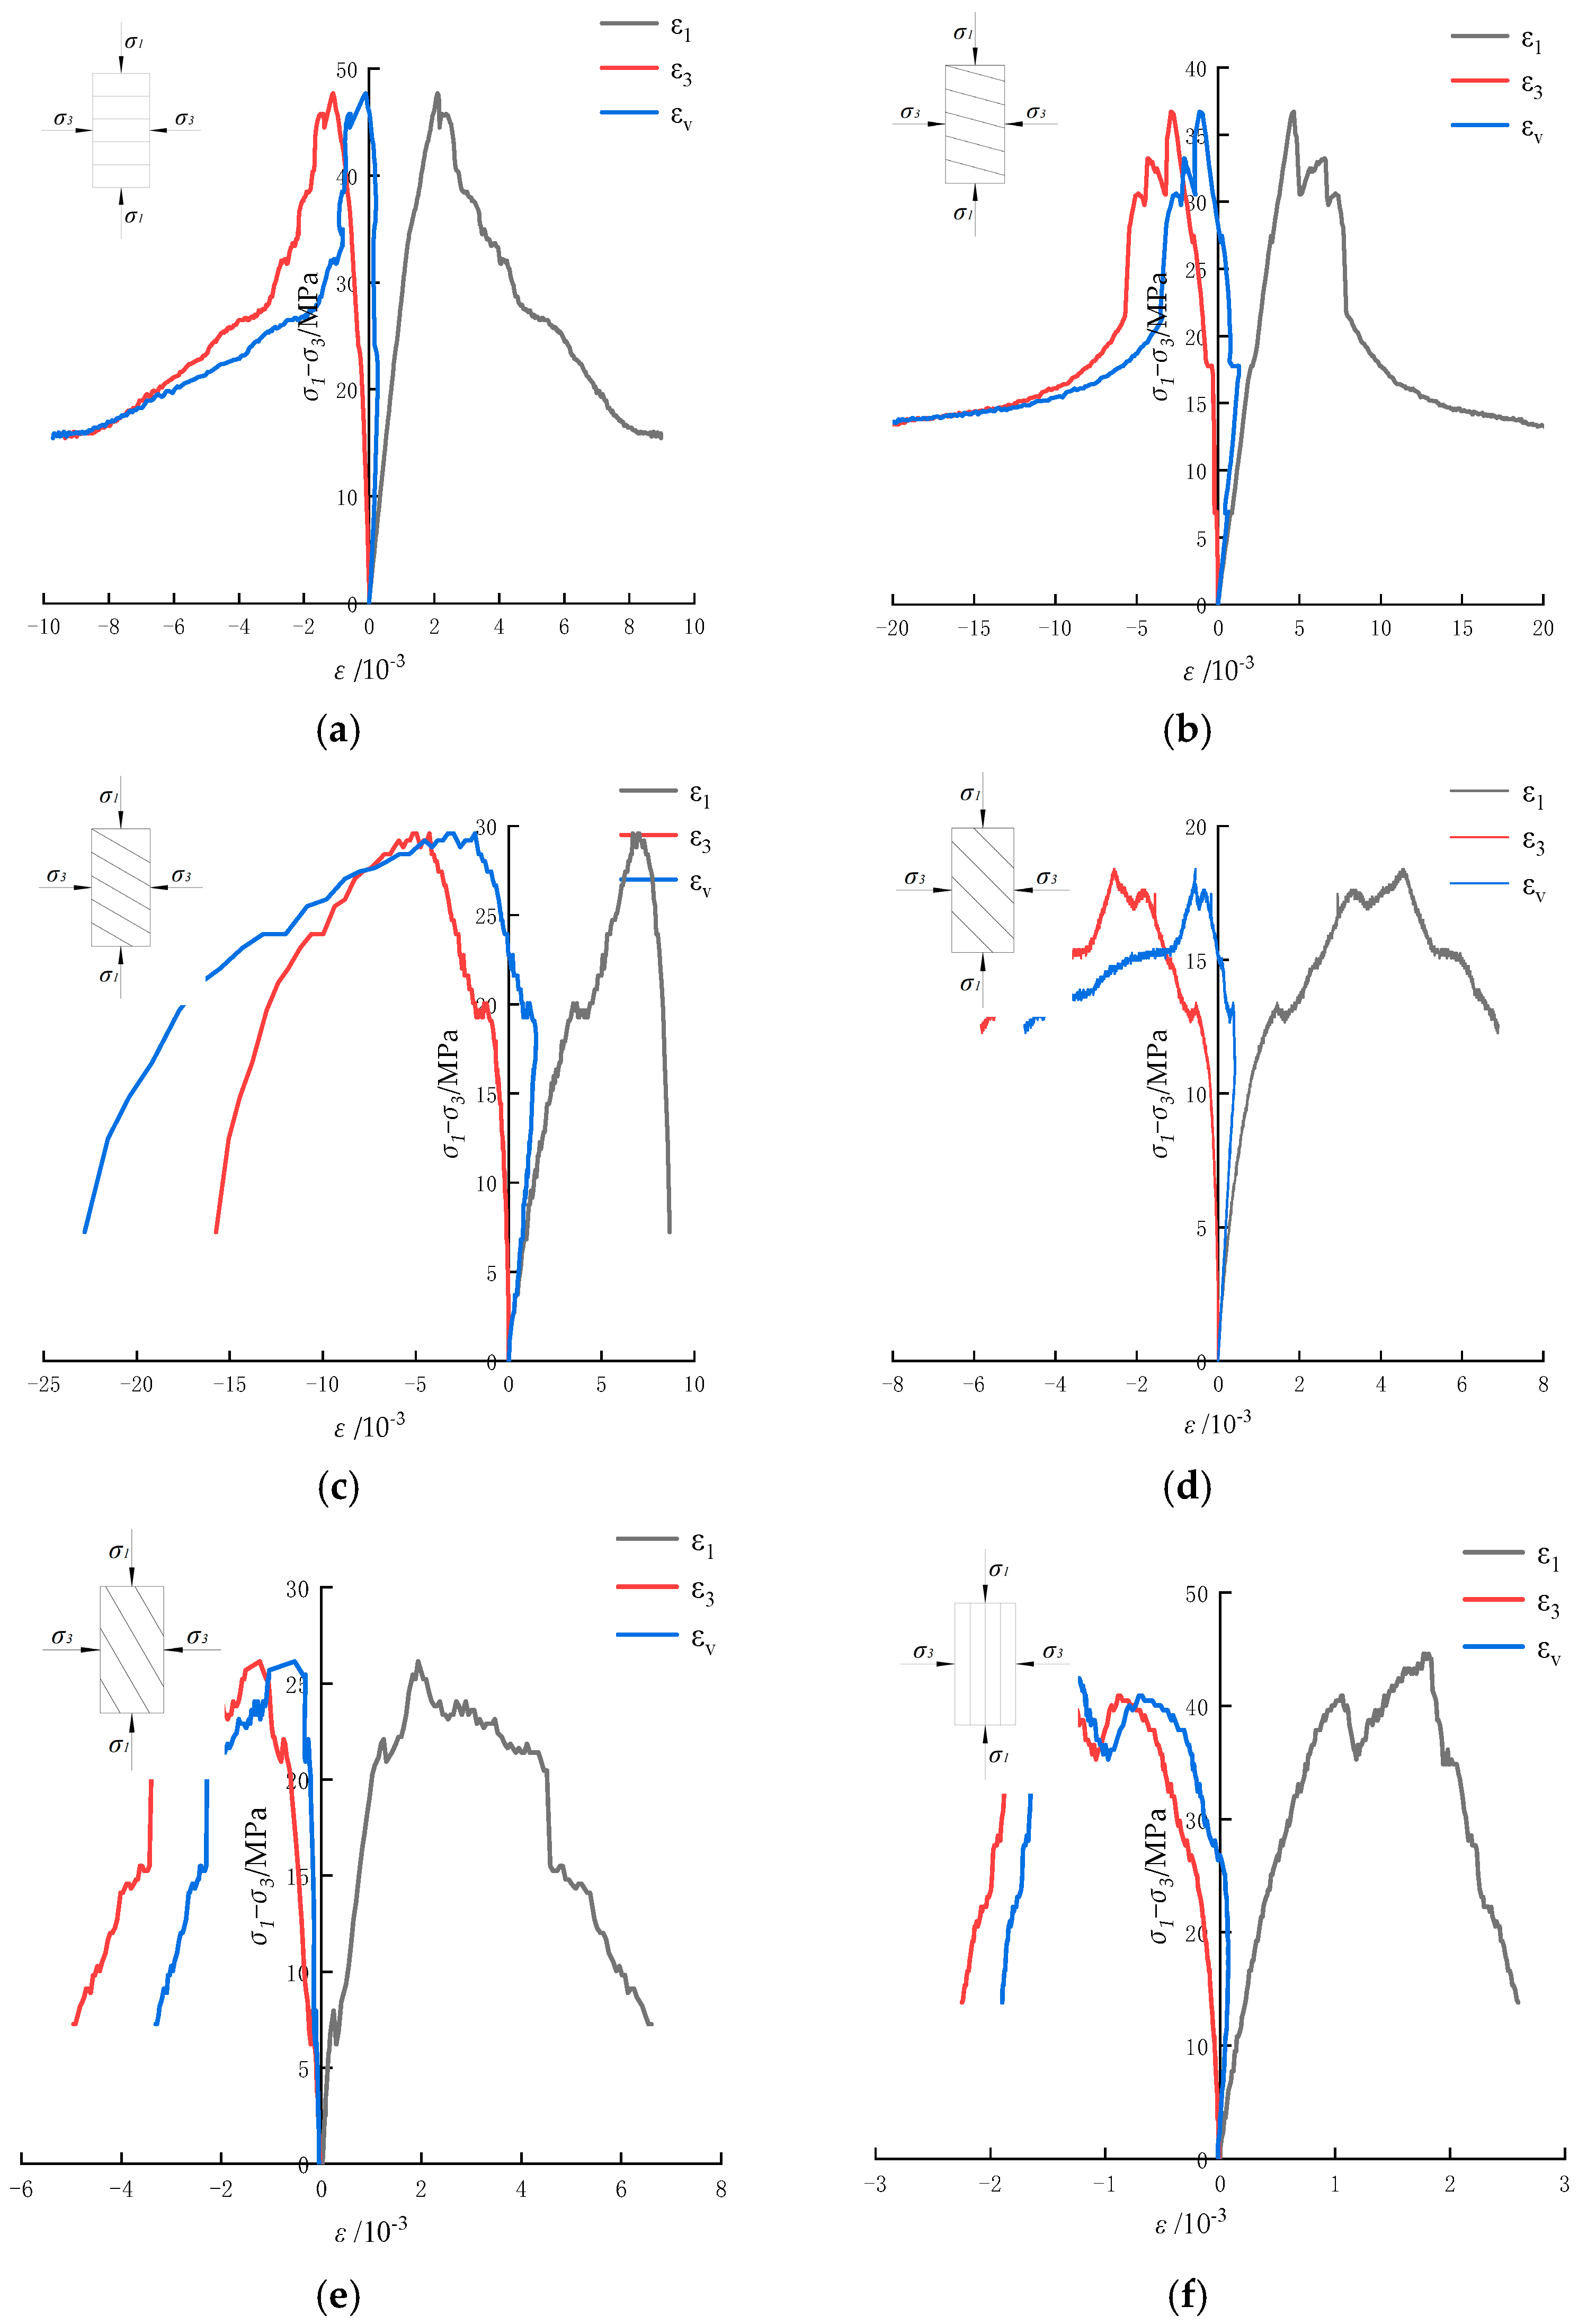
3.1. Coal Deformation Properties Analysis

Figure 4 depicts the deviatoric stress–strain curves and failure patterns of triaxial compression tests under 6 MPa. The deviatoric stress–strain curves of coal under triaxial compression can be roughly divided into three stages: the linear elastic stage (OA stage), the plastic stage (AB stage) and the residual strength and strain softening stage (BC stage) [21]. Compared with the uniaxial compression test, there are three main differences. First, the curves hardly possess the initial compaction stage. The reason is that under the hydrostatic pressure conditions before axial loading, the initial cracks of the samples are largely closed. Second, the plastic stage is more obvious than the uniaxial compression curve, and there is obvious convexity before the peak. However, it is still hard to distinguish the elastic stage and the plastic stage. Finally, as the confining pressure increases, the magnitude of the post-peak stress drop gradually decreases and obvious plasticity failure characteristics appear. When the confining pressure is 6 MPa, the post-peak axial strain presents a plasticity flow state.
Figure 5 depicts the variation in axial strain (ε1) and radial strain (ε3) with increases in confining pressure. It was found that the post-peak stress drops rapidly and exhibits obvious brittle deformation characteristics in the uniaxial compression test. With the confining pressure increases, the coal no longer exhibits an obvious initial compaction stage. Meanwhile, the elastic modulus increases continuously under the influence of confining pressure, indicating that the coal has more well-developed pore-fracture structures. Under the influence of confining pressure, the pore-fracture structures are compressed and closed, which increases the stiffness of the coal. Compared with the uniaxial compression state, the samples showed obvious plastic deformation characteristics.
The radial strain is always negative, indicating that the radial strain of the sample has been in an expansion state under the stress. The radial strain and the axial strain have a high degree of synchronization, which means that when the coal fails, the axial and radial failures occur at the same time.

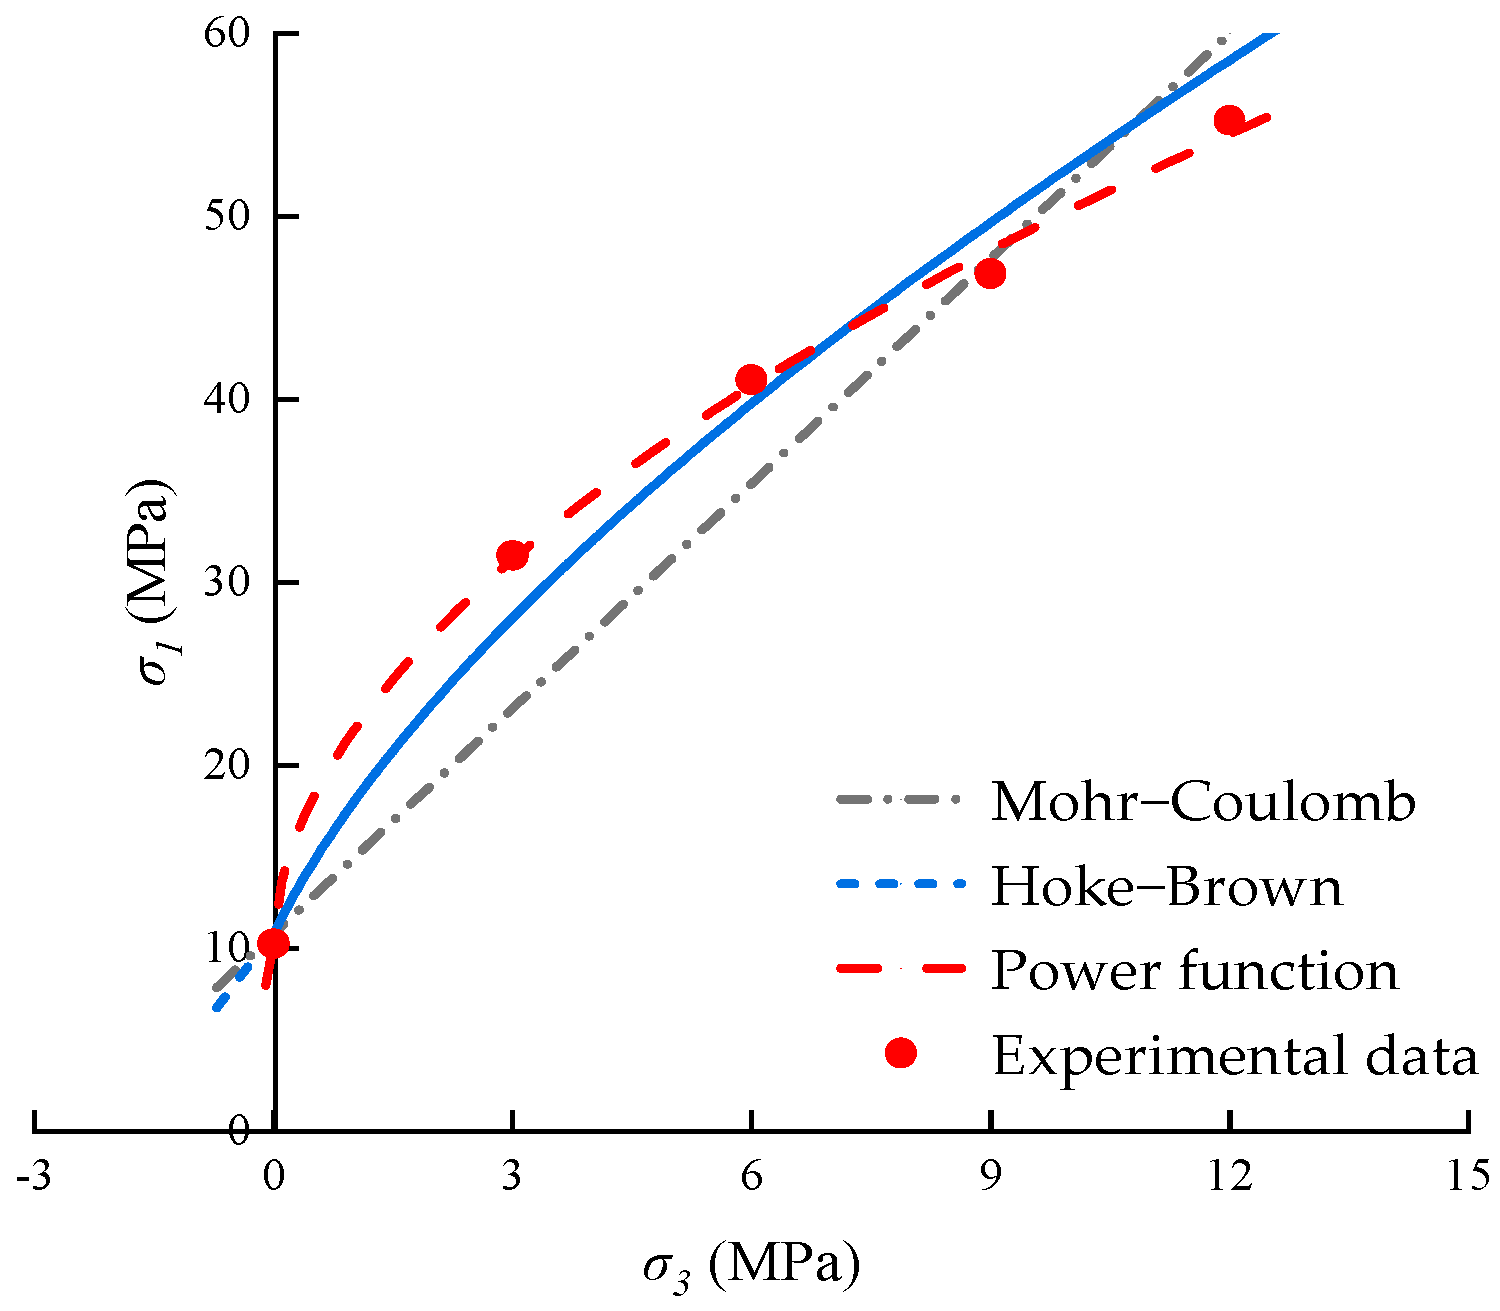
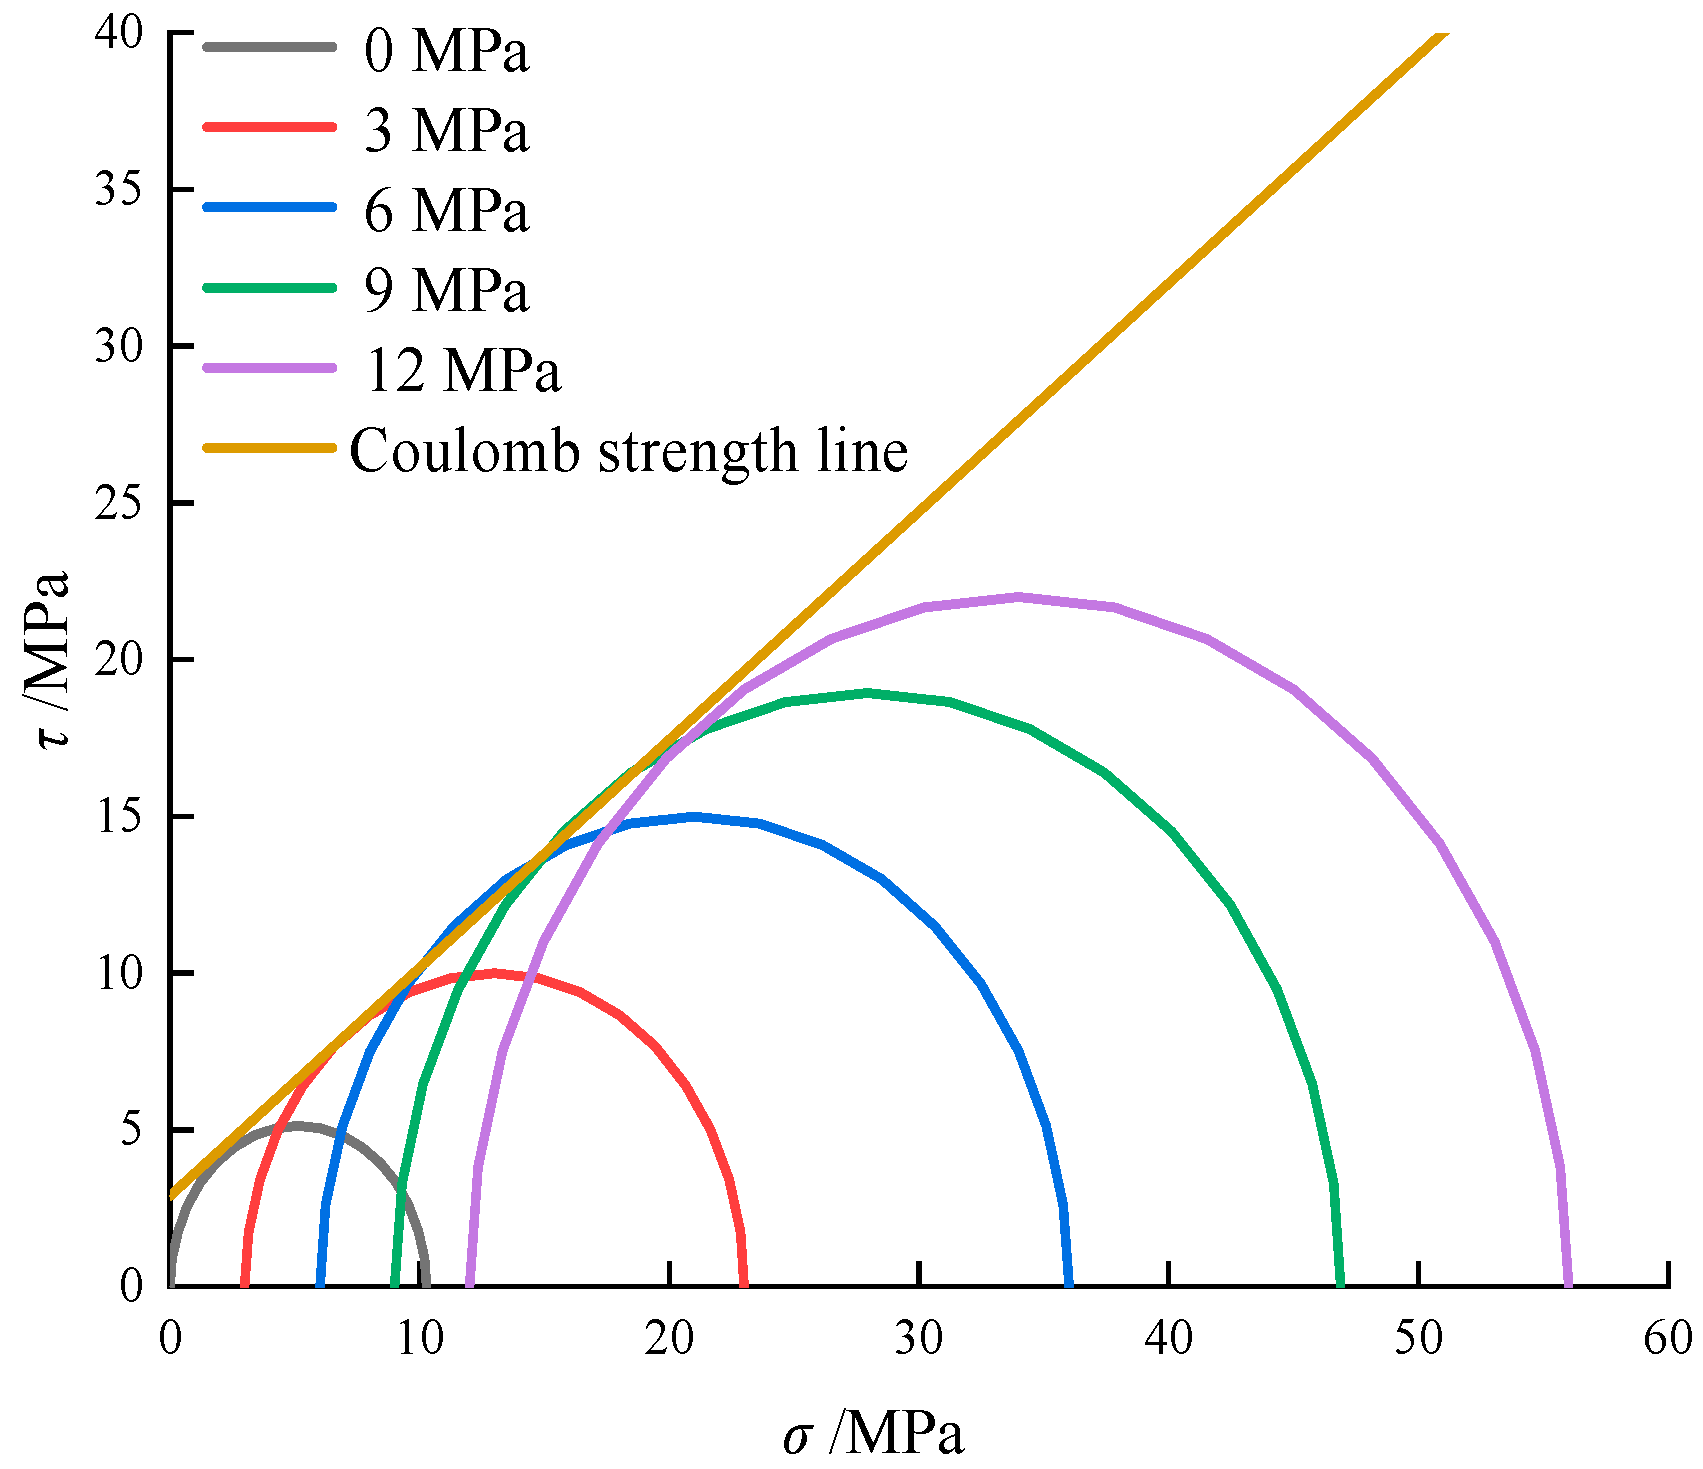
3.2. Coal Strength Properties Analysis

In order to better describe the influence of confining pressure on peak strength, classical strength theories of rock mechanics are selected to obtain for fitting analysis. The relationship between the peak strength and the confining pressure of the rock can be linearly described by the Mohr–Coulomb strength criterion [22]:
σ 1 = 2 c cos ( φ ) 1 sin ( φ ) + σ 3 1 + sin ( φ ) 1 sin ( φ )
where σ1 and σ3 are the major and minor effective principal stresses at failure, respectively. c is the cohesion, φ is the internal friction angle.
The Hoek–Brown strength criterion describes the nonlinear relationship between the peak strength and the confining pressure of the rock, and the equation is as follows:
σ 1 = σ 3 + σ c ( m i σ 3 σ c + 1 ) 0.5
where mi is an empirical parameter of rock, which reflects the hard and soft degree of rocks in the range from 0.001 to 25.0, σc is the uniaxial compressive strength of rock, and σ1 and σ3 are the maximum and minimum principal stress, respectively [23].
Bieniawski [24] proposed a power function experience strength criterion, which can be expressed as:
σ 1 σ c = 1 + A ( σ 3 σ c ) B
where A and B are lithology parameters, which can be determined by the specific rock test. The scope of A and B are given by fitting rock experimental data.
The experimental data under different confining pressures are fitted by the Mohr–Coulomb strength criterion, Hoek–Brown strength criterion and Power function criterion, as shown in Figure 6, which indicates that with the increase in confining pressure, the peak strength of the coal sample increases significantly. There are great differences in the fitting degree of different strength criteria to the experimental data. Therefore, the squared correlation coefficient (R2) is used to represent the fit degree of different strength criteria. When R2 is closer to 1, it means that the fitting degree is higher. The values of R2 for the Mohr–Coulomb, Hoek–Brown and Power function strength criterion are 0.920, 0.989 and 0.999, respectively. Therefore, the Power function strength criterion has the best applicability to coal.
Table 2 lists the results of coal under triaxial compression tests, and the deviatoric stress–strain curves are shown in Figure 5.
According to the results of the triaxial test, Mohr circles with confining pressures of 0, 3, 6, 9, and 12 MPa, and a Coulomb strength curve are shown in Figure 7. The Coulomb strength curve represents the relationship between the shear stress and the normal stress on the failure. The angle with the σ axis is the internal friction angle φ (36.1°), and the intercept on the τ axis is the cohesive force c (2.9 MPa).
Figure 8 depicts the variation in elastic modulus and Poisson’s ratio (μ) with increases in the confining pressure. In this research, E is calculated by the slope of the stress–strain curve between 0% and 50% of peak strength. As shown in Figure 8, it was found that the sample elastic modulus increases with the increase in the confining pressure and is approximated by a power function relationship, while the Poisson’s ratio decreases exponentially. As exhibited in Figure 8, the Power function is employed to depict the relationship between E and σ3 and the exponential function is used to describe the relationship between μ and σ3. According to the regression analysis, we can obtain the equation as follows:
E = 2.212 σ 3 0.083
with a good regression coefficient of R2 = 0.983.
μ = 0.419 e 0.046 σ 3
with a good regression coefficient of R2 = 0.835.

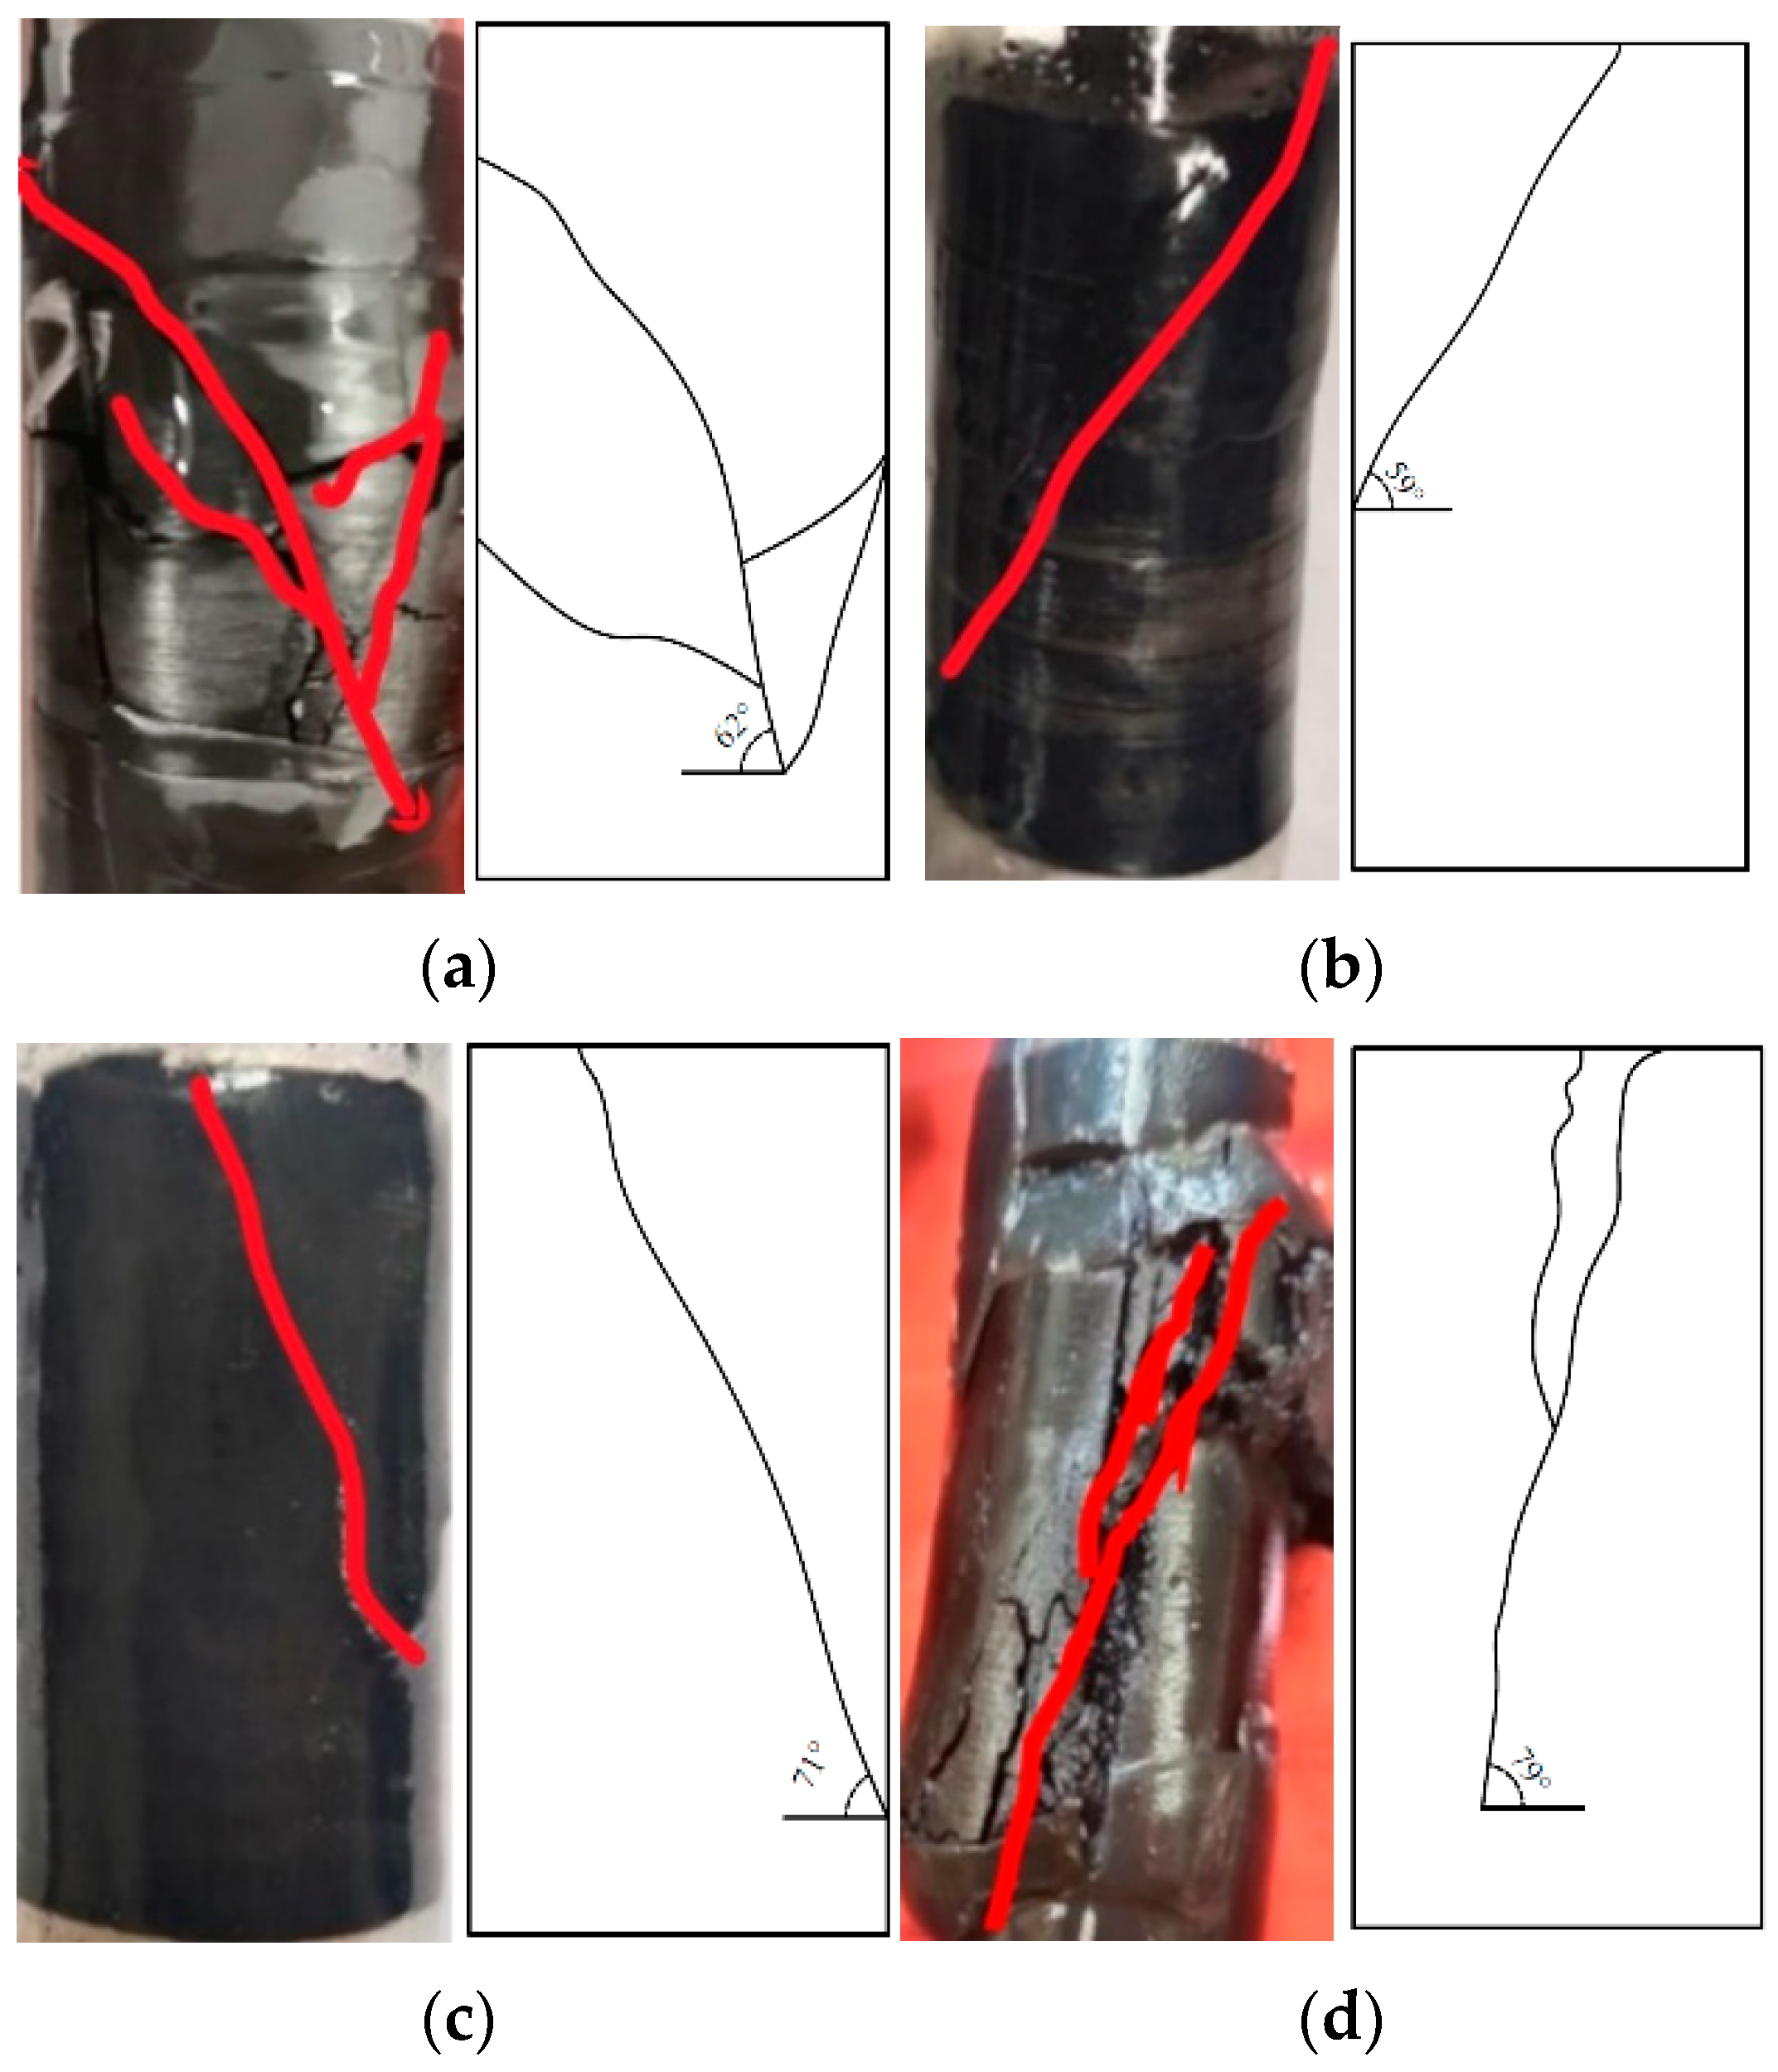
3.3. Coal Failure Properties Analysis

Figure 9 shows the failure samples after triaxial compression tests. The marked angle is the fracture of the coal sample. It was found that the failure patterns mainly represent shear failure and the fracture angles are from 59° to 79°. According to the Coulomb strength criterion, the angle of the fracture surface is estimated to be approximately 58°. There is a deviation between the actual fracture surface angle and the predicted value. The reason for the analysis is that coal has heterogeneous properties and contains random cracks alongside other defects, which may cause the coal sample to deviate along the cracks.

4. Mechanical Test Results of Different Bedding Angles of Coal

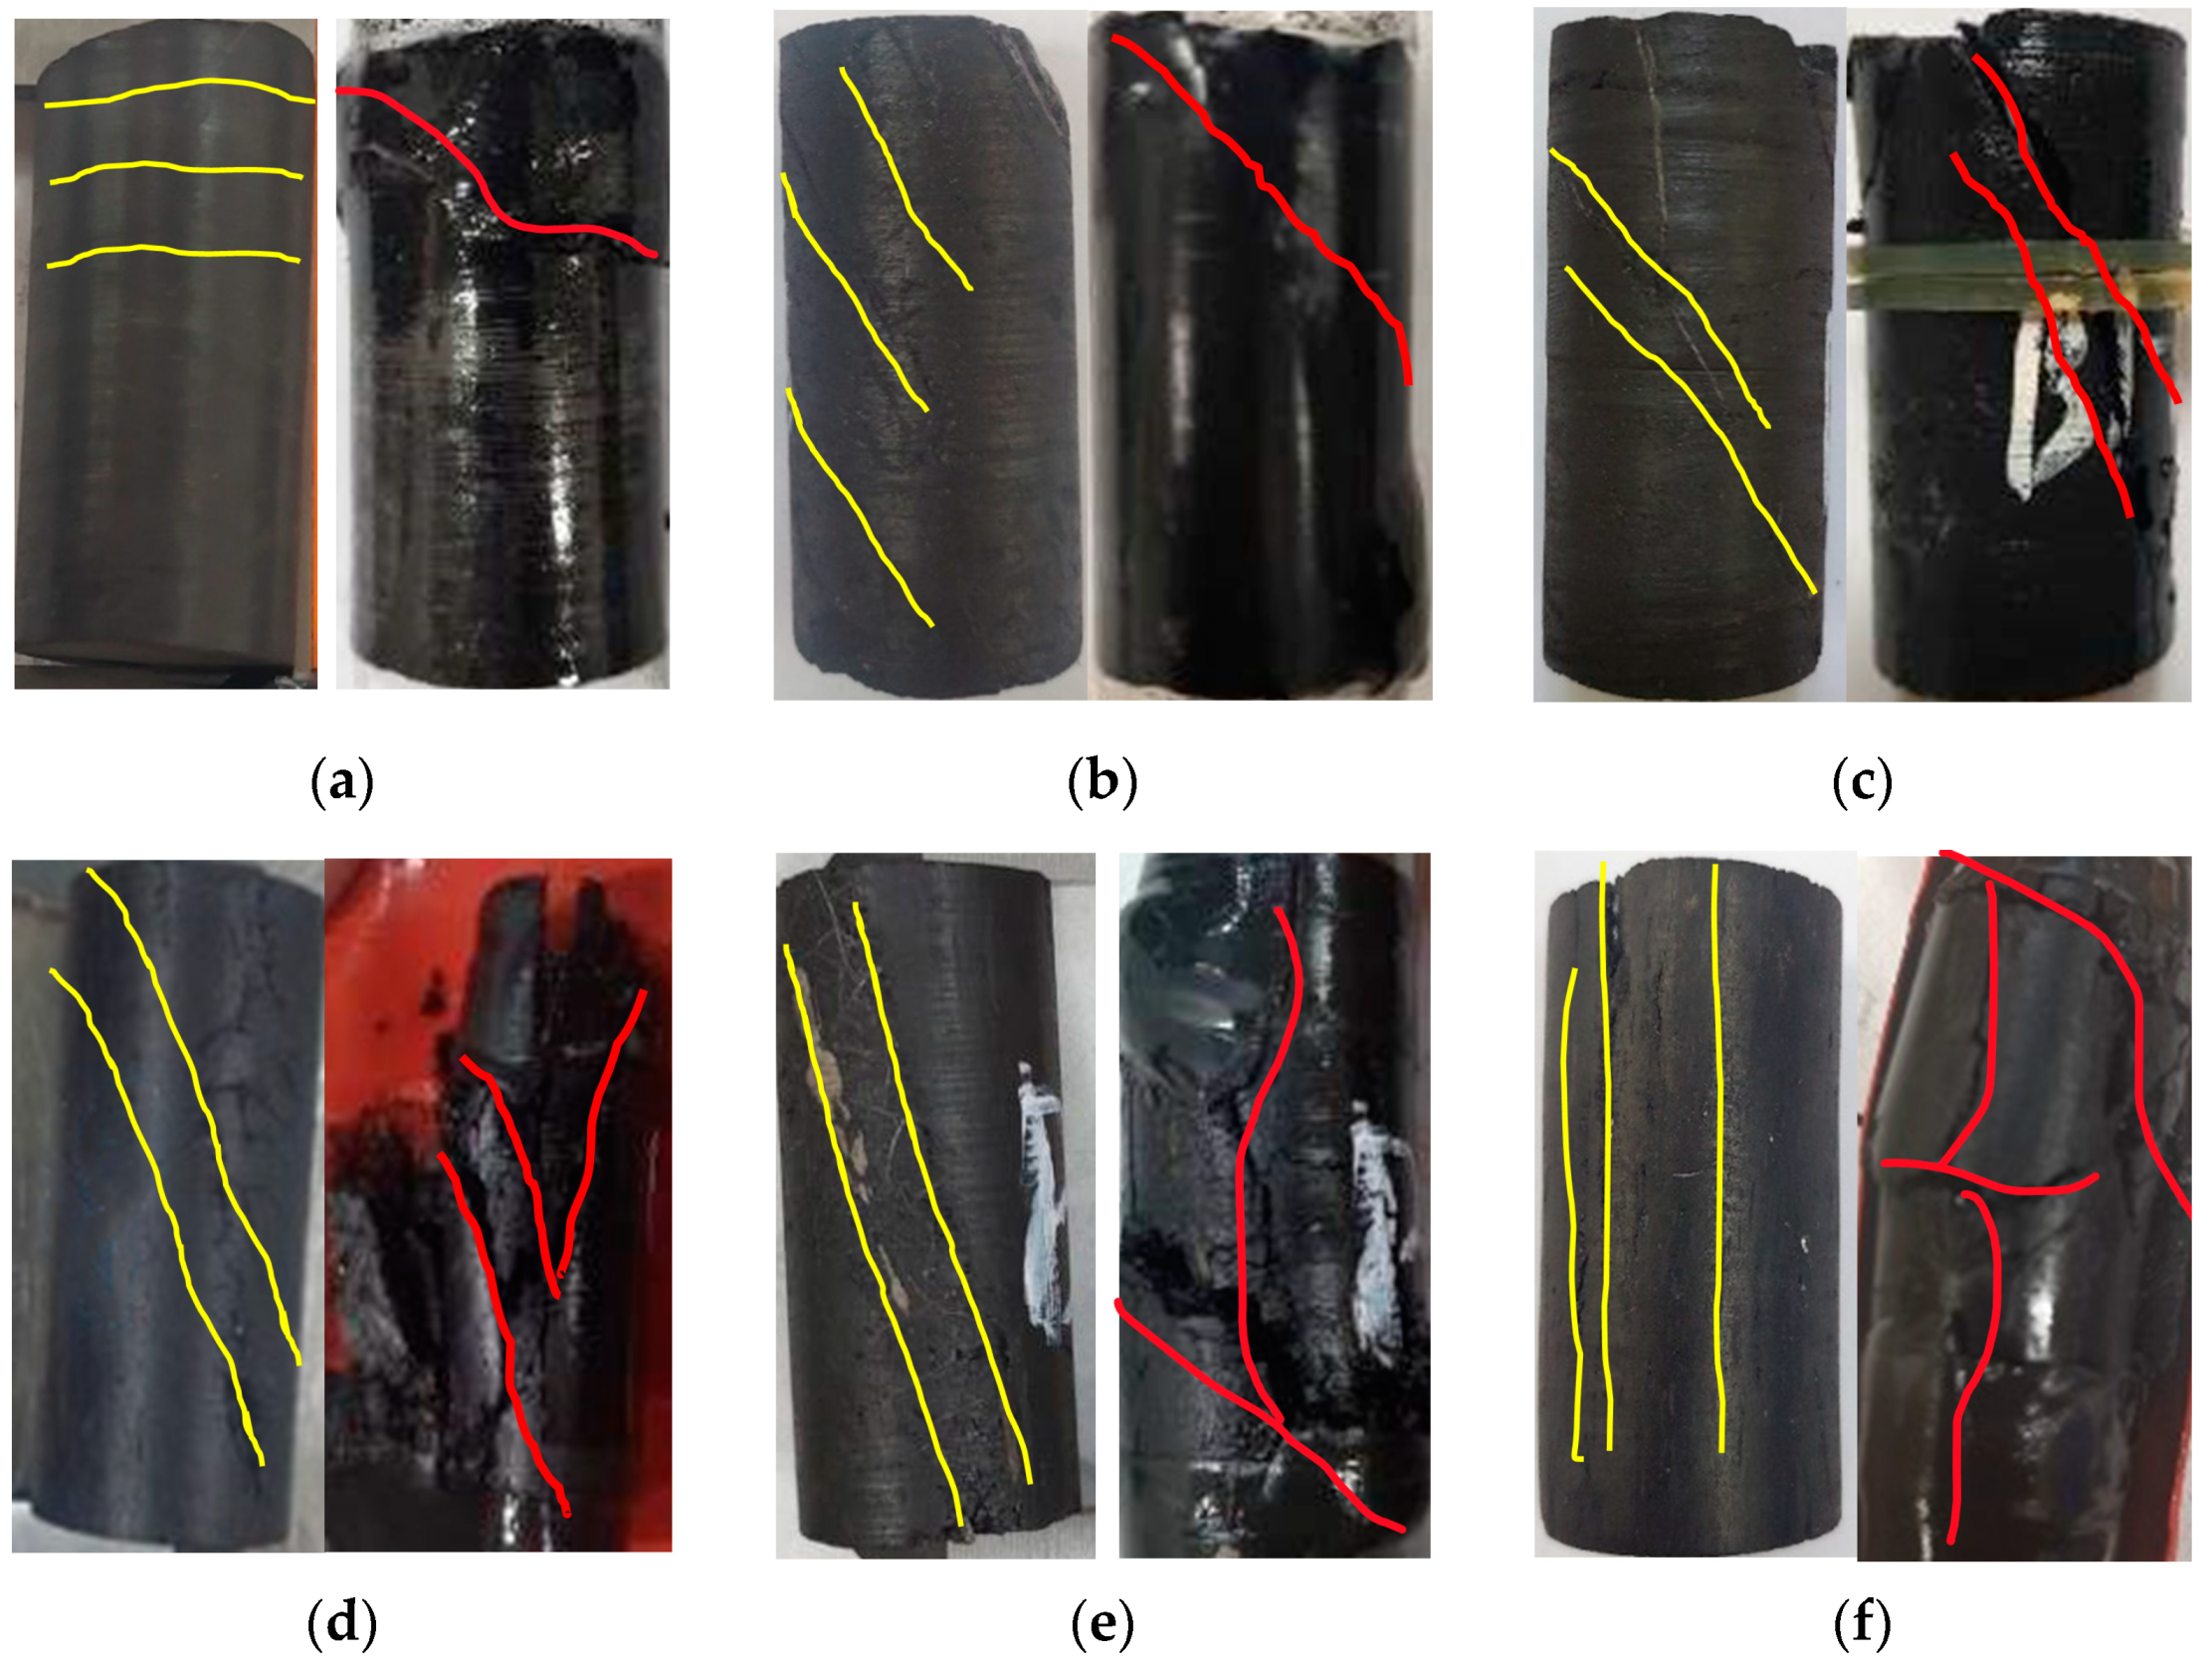
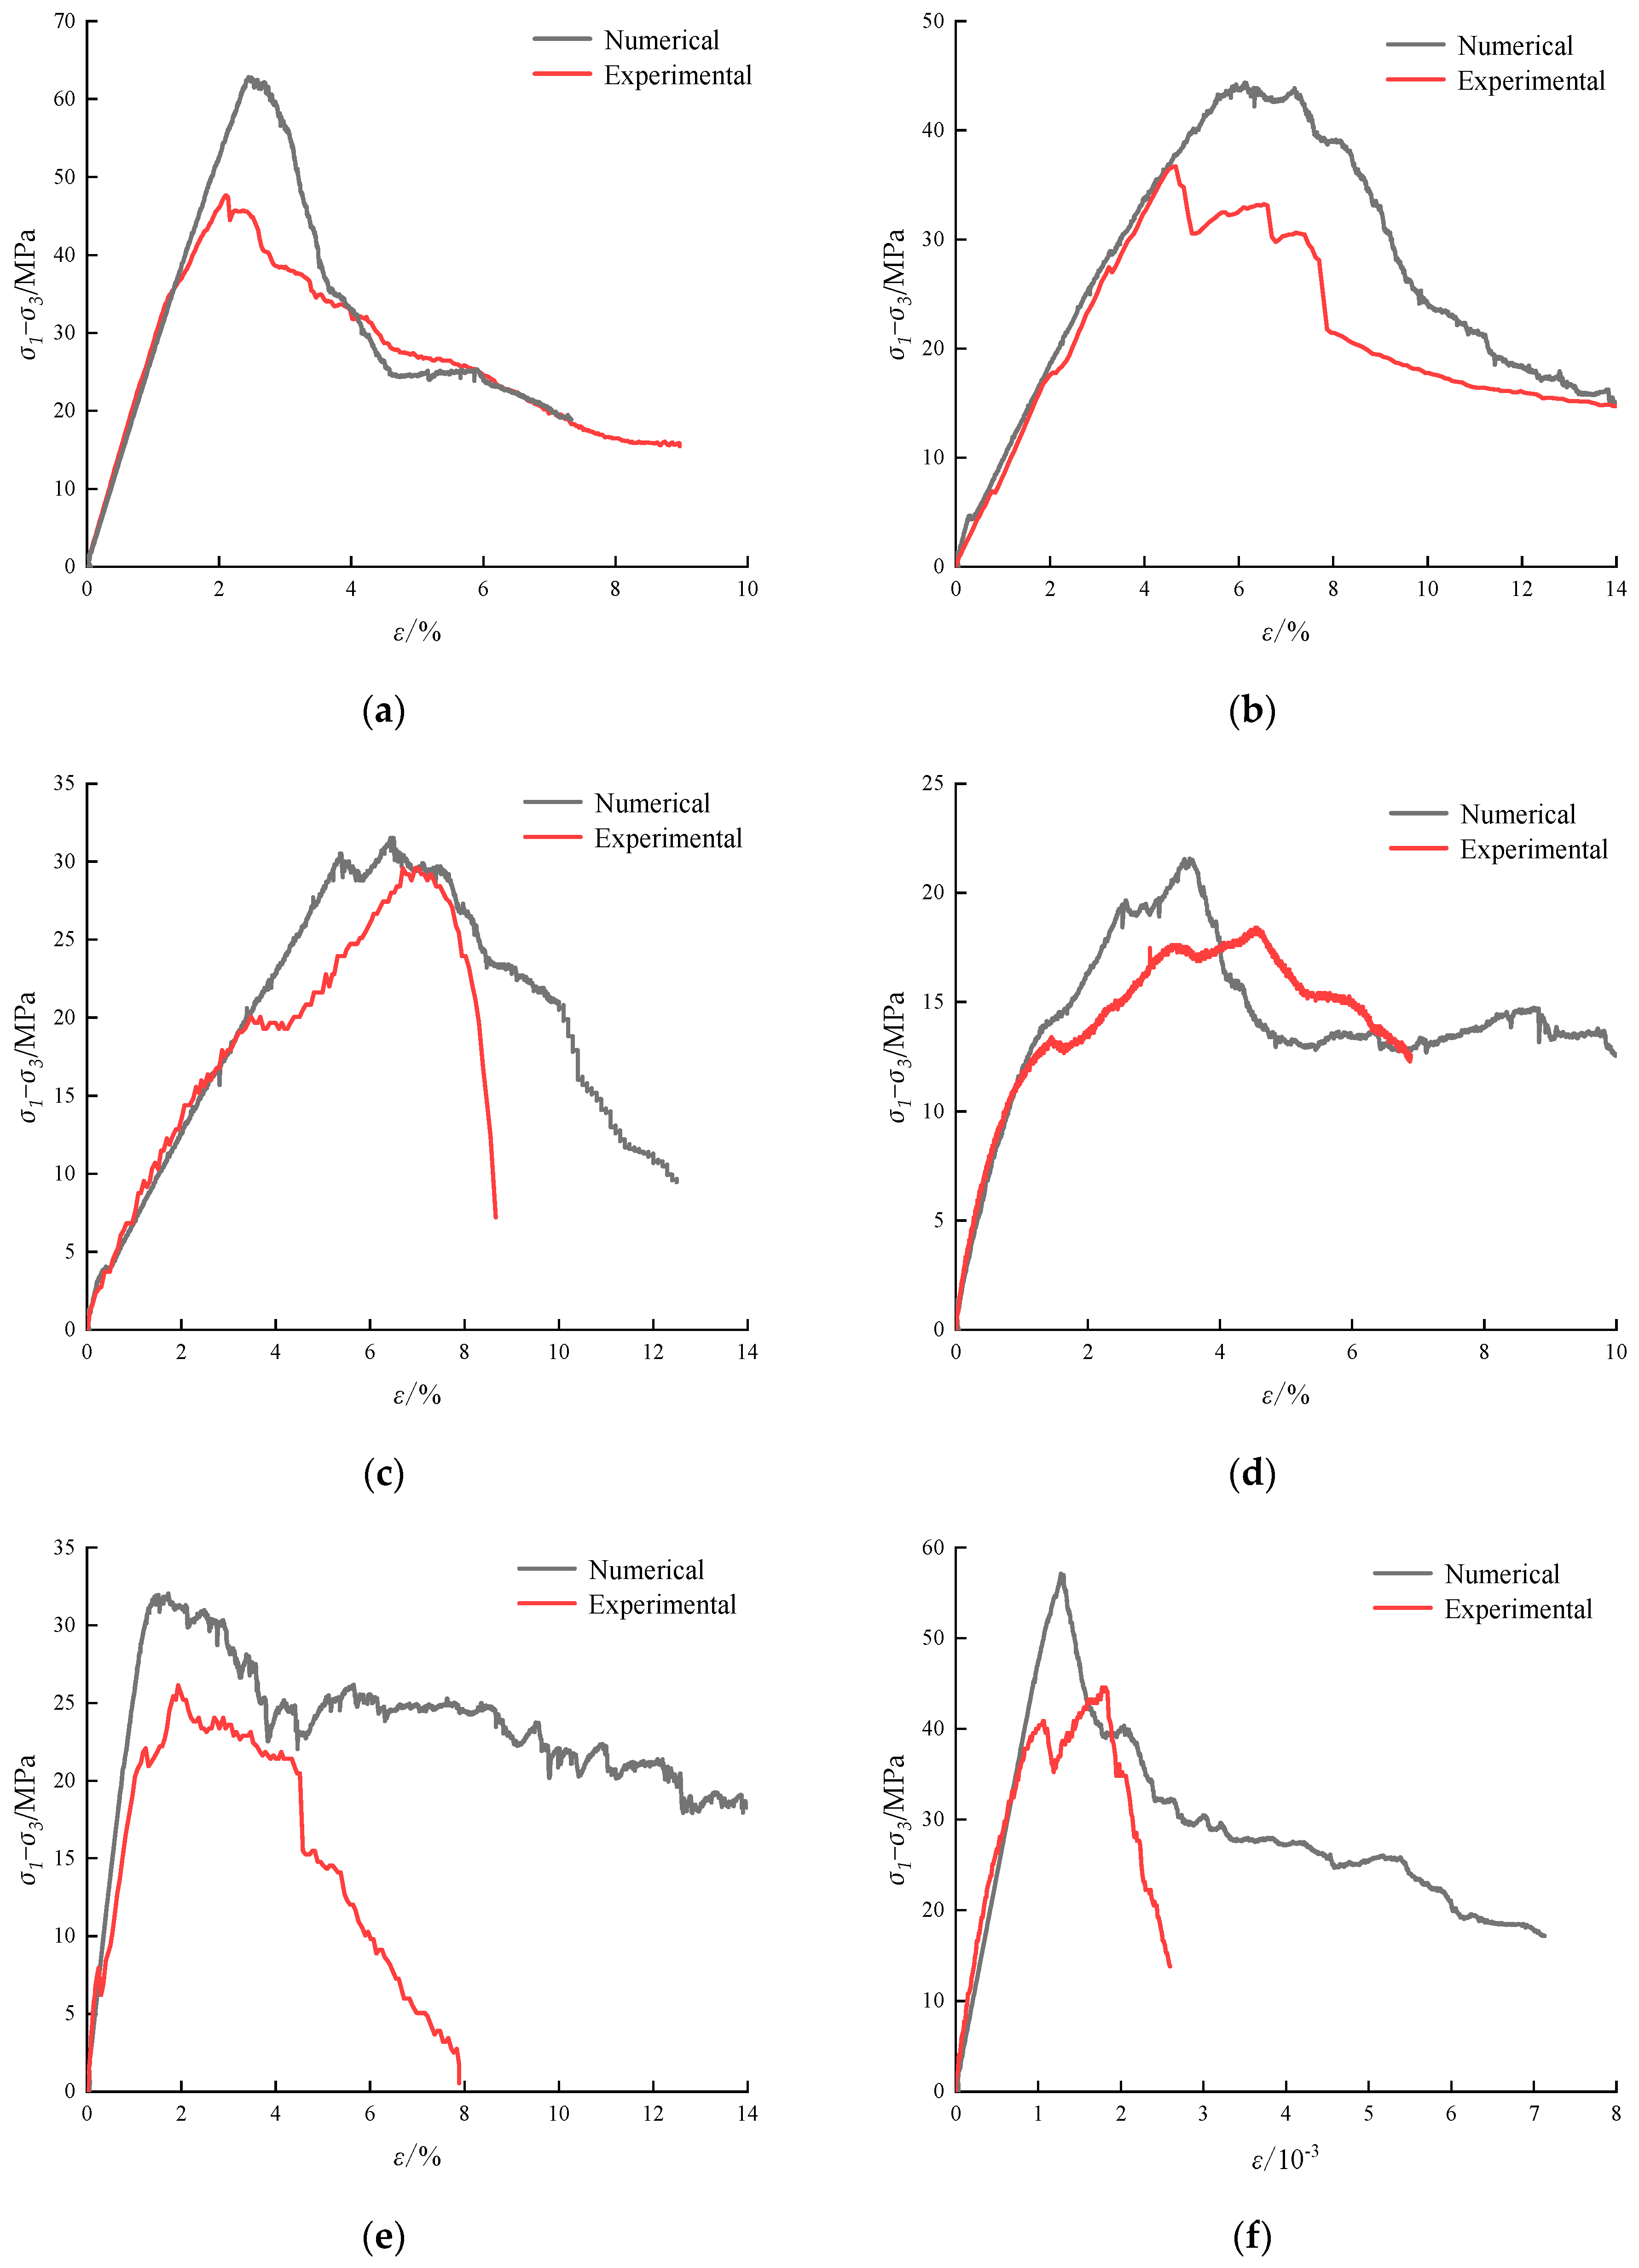
4.1. The Deformation Failure Properties of Coal with Different Bedding Angles

The coal samples were taken from the mine at a depth of approximately 300 m, with an initial stress state of 9 MPa. Therefore, the confining pressure of the triaxial compression test with different bedding angles is 9 MPa. Through the triaxial compression test, the deviatoric stress–strain curves of coal with different bedding angles are shown in Figure 10. The parameters and results of different bedding angle samples are listed in Table 3.
From Figure 10, we can see that samples with a bedding angle have undergone three stages: the linear elastic stage (stage 1), the plastic stage (stage 2) and the residual strength and strain-softening stage (stage 3). Compared with Figure 4, it was found that the pre-peak increasing stage and the post-peak softening stage of coal samples with different bedding angles are quite different, showing great anisotropy. The deviatoric stress–strain curves of the coal samples have obvious stress fluctuations before the peak, except for the coal sample with a 0° bedding angle, showing a transient peak in the middle stage. It is indicated that the coal samples with bedding planes are much more unstable; this phenomenon shows that the bedding plane has a certain influence on the stability of coal. The post-peak softening stages are more complex and diverse. The samples with 45° and 90° bedding angles show brittle failure characteristics and the post-peak stress drops rapidly, as shown in Figure 10c. The samples with other bedding angles show obvious plastic deformation properties after the peak. The post-peak plastic deformation properties are roughly divided into two types. First, the post-peak stress appears in a multiple-level drop state, as shown in Figure 10d–f. Second, the post-peak curve first decreased, then underwent a regional slow rising stage, and finally destabilized and then decreased, as shown in Figure 10a,b. In general, the deformation properties of coal samples are obviously discrete.
The radial strain (ε3) of the samples almost showed linear elastic growth at the pre-peak stage, and the growth amplitude was small. In the post-peak stage, the radial strain increases rapidly, but when it reaches half of the maximum axial strain, the samples are completely destroyed. The volumetric strains (εv) all show a left-turning trend before approaching the peak, showing an obvious expansion mechanism. In the post-peak stage, the expansion is more obvious.
The failure comparison of coal samples with different bedding planes is shown in Figure 11. It can be seen that different bedding planes lead to different failure characteristics of coal samples. Under confining pressure, the coal mainly suffers shear failure, and the shear failure surface mostly spreads around the weak structural surface. Coal samples with a bedding angle of 0° have local shear slip failure, and cross-penetrating cracks are formed locally on the failure surface and the bedding structure surface near the end. The failure modes of 30° and 45° coal samples are mainly based on the bedding plane as the main failure crack, and shear slip failure occurs. The coal samples containing 60° or 75° bedding planes have combined failures. The main failure is the shear failure along the bedding plane, but it also includes tensile cracks extending from the end of the sample and passing through the bedding plane. It shows that after bearing the axial load and the occurrence of shear slip failure, the coal sample reaches a new equilibrium state. Under the continuous axial stress and the influence of the internal microcracks, the longitudinal tension cracks extend from the end face. The volumetric strain increases rapidly, and the samples break rapidly. However, when the sample with the 90° bedding plane is damaged again, the crack development is more complicated. It is dominated by a tensile crack that penetrates both ends, and also includes shear cracks extending from the end surfaces and shear cracks partially penetrating the bedding plane. To sum up, the bedding structure has a significant impact on the failure properties of coal samples.

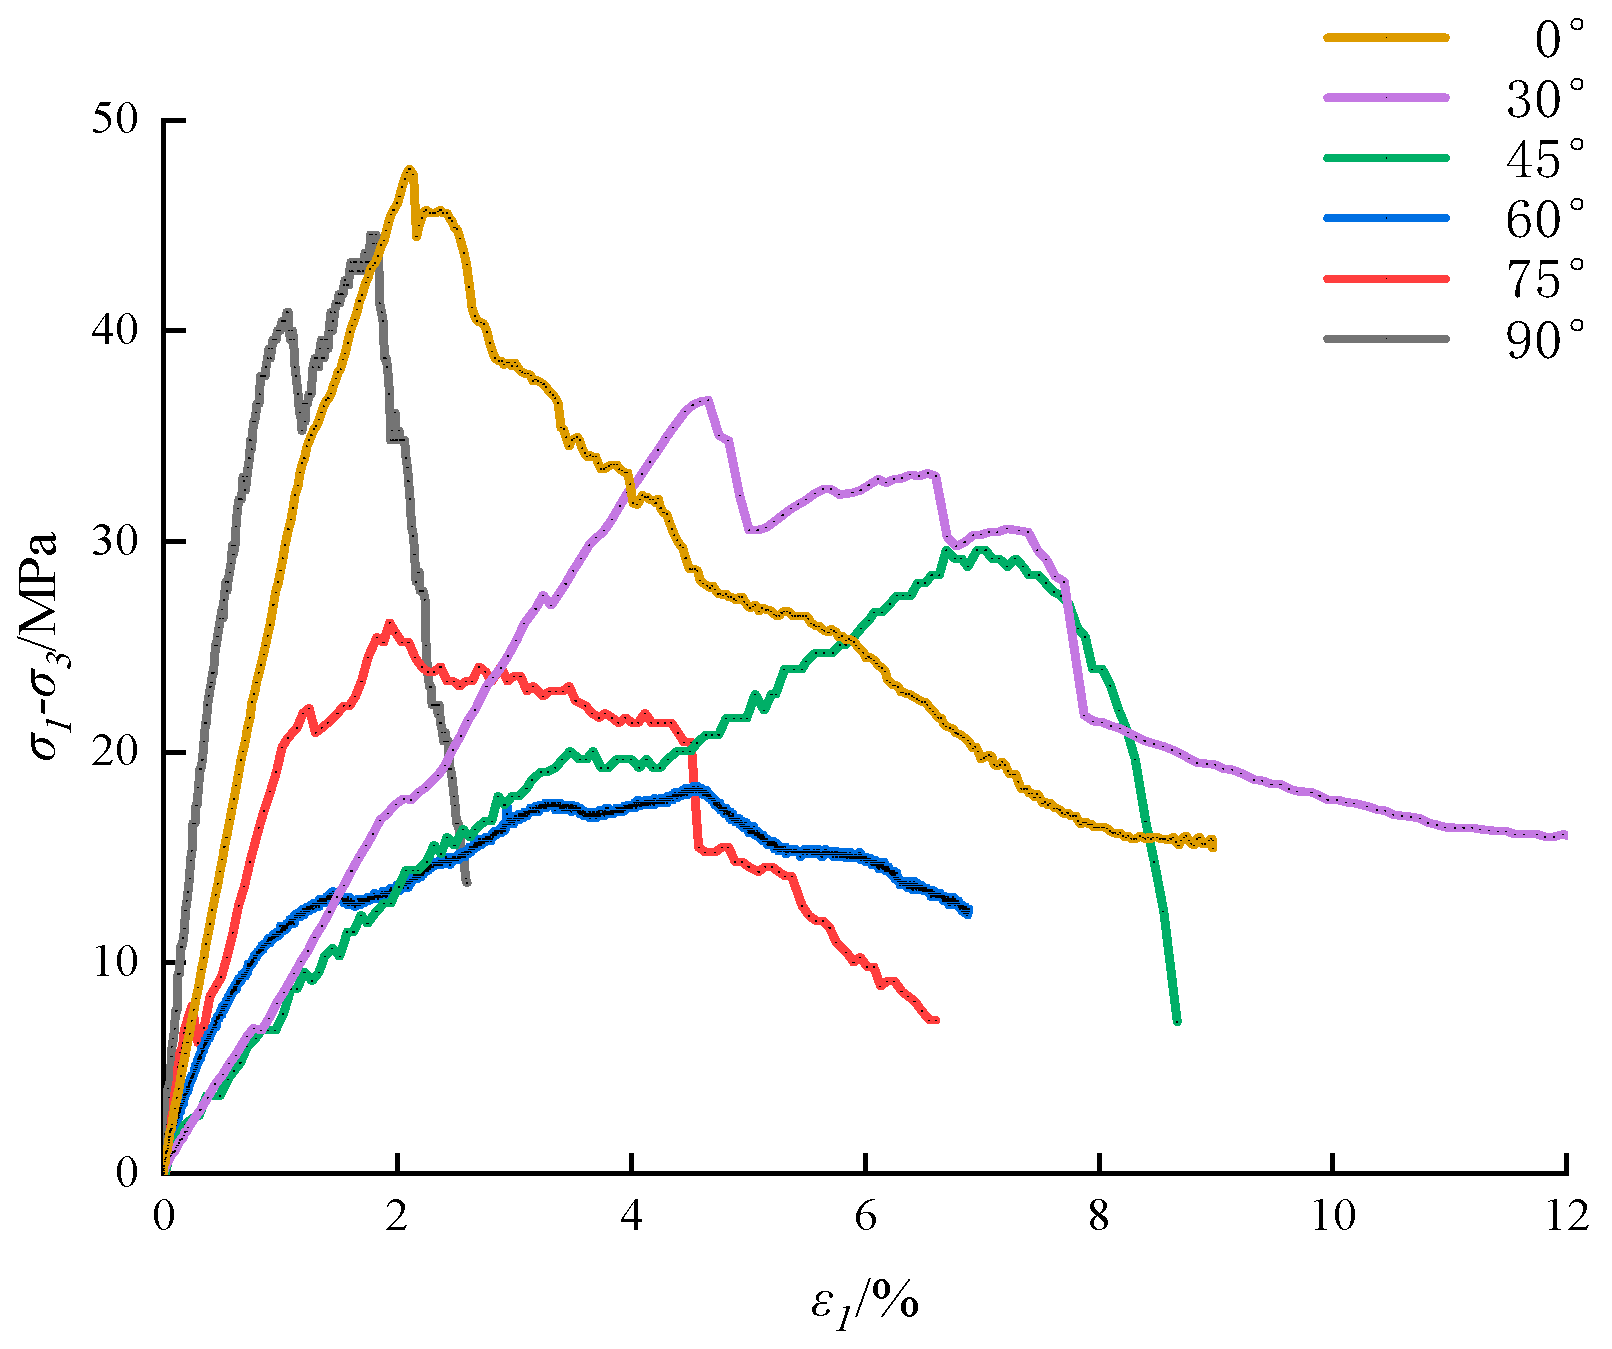
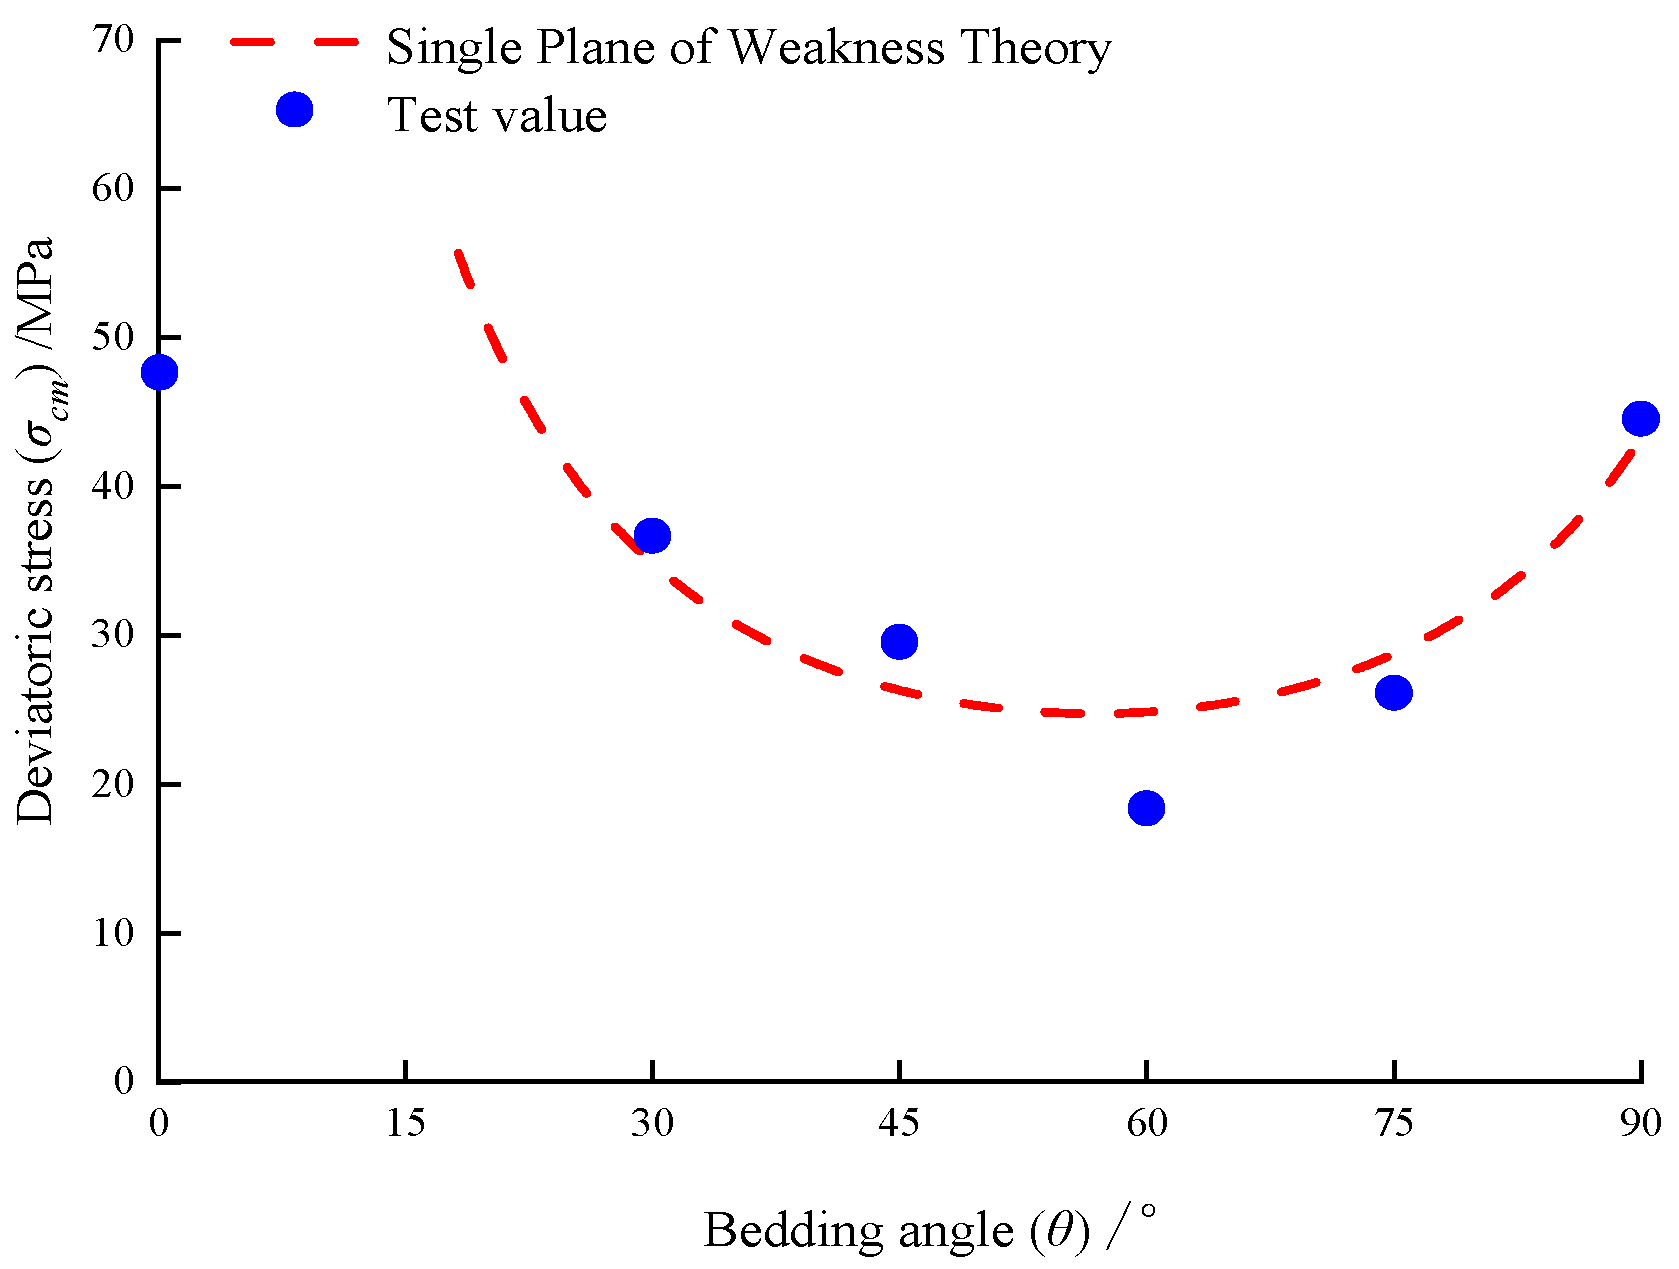
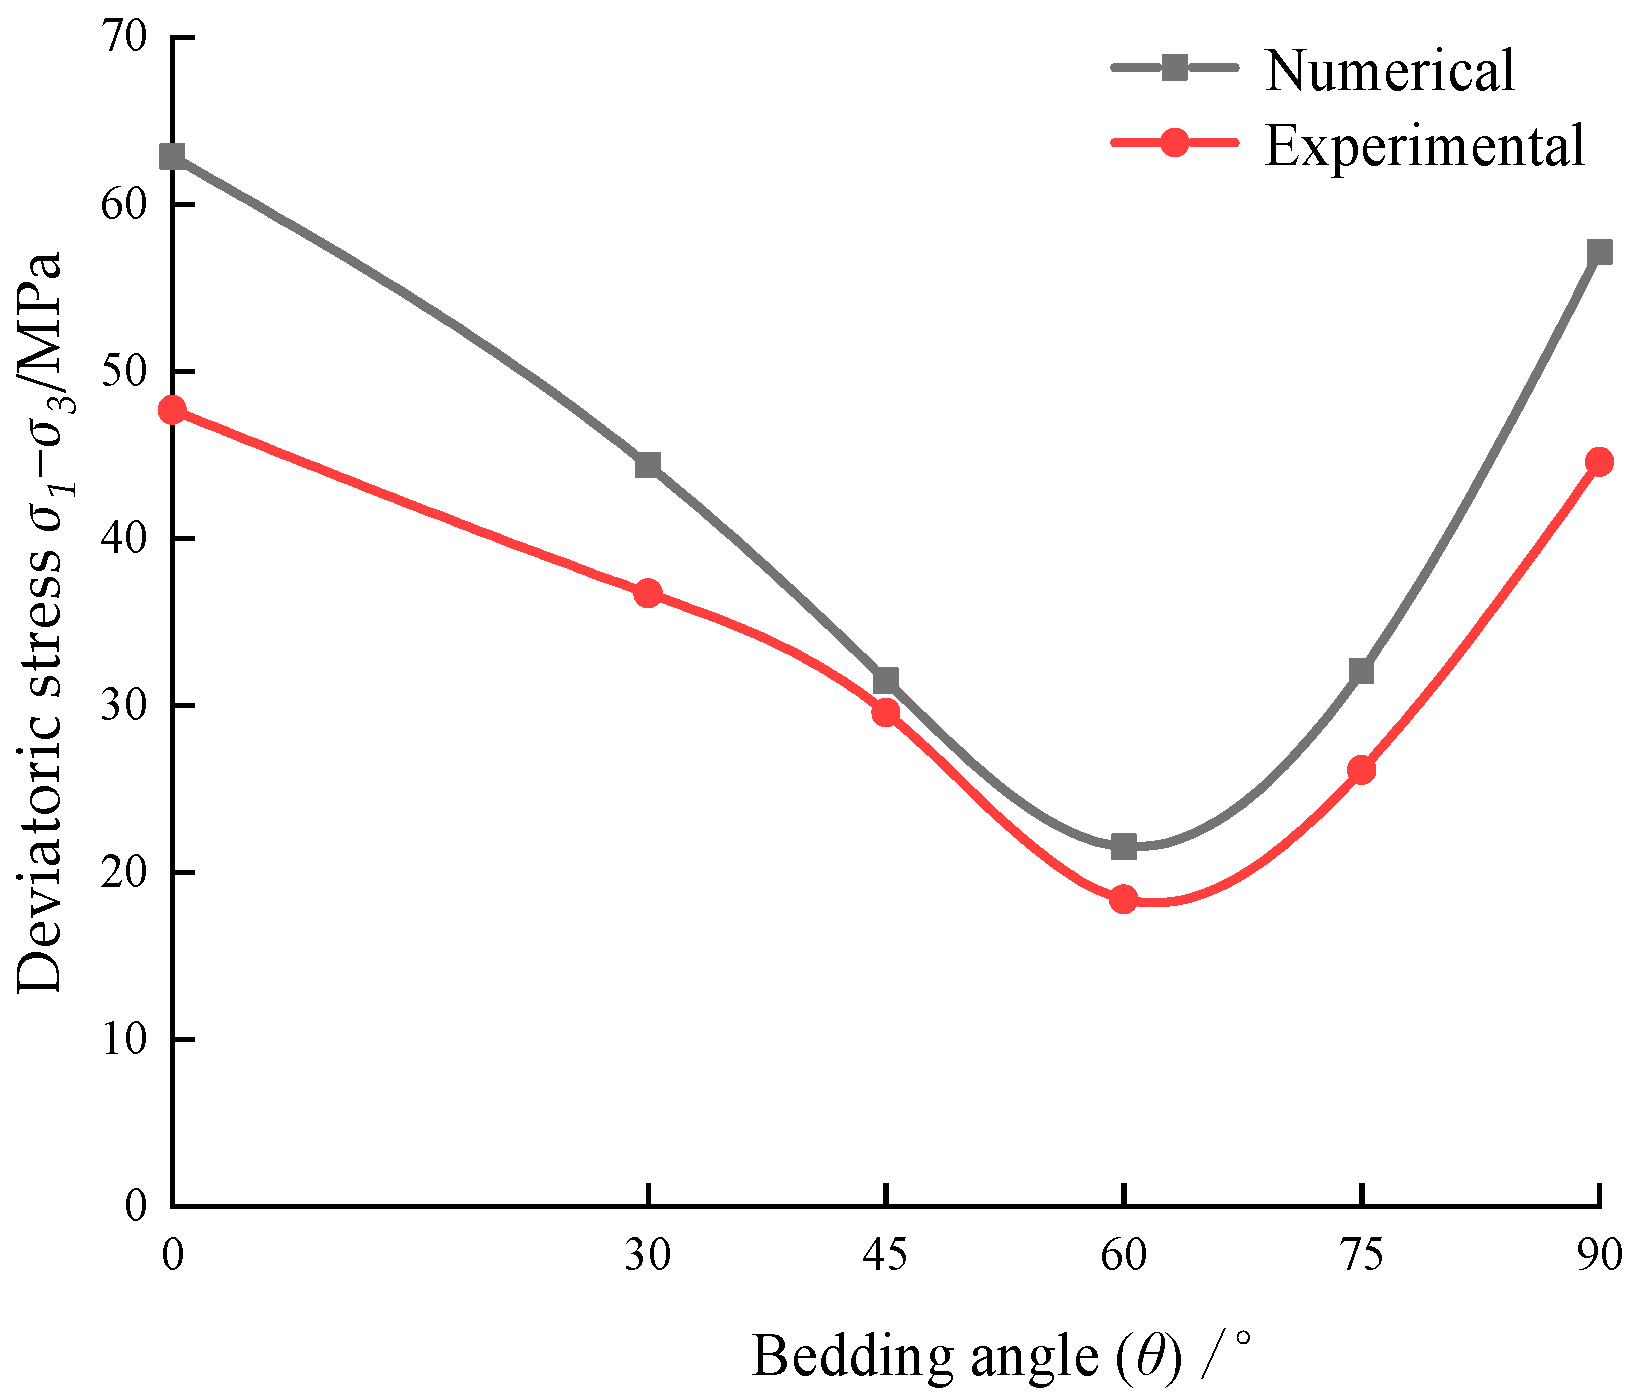
4.2. Analysis of Strength Properties of Coal with Different Bedding Angles

Figure 12 depicts the variation in deviatoric stress (σ1σ3) and axial strain (ε1) of coal samples. It can be seen that the peak strengths of coal samples with different bedding angle are quite different.
According to the test results, the relationship between the deviatoric stress and the bedding angles under triaxial compression can be drawn, as shown in Figure 13. It can be seen that the coal peak strength decreases rapidly and then increases slowly with the increase in the bedding angle. It was found that the peak strength reached the minimum value of 18.40 MPa when the bedding angle was 60°.
It can be seen from Figure 13 that the peak strength reaches the maximum value of 47.68 MPa at 0°. From 0° to 60°, the strength of the coal sample decreases rapidly. However, from 60° to 90°, the strength of coal exhibits a slow upward trend. The overall variation trend is U-shaped.
In order to obtain the variation pattern of peak strength and different bedding angles, the single plane of weakness theory based on Coulomb theory was adopted to fit the experimental data, as shown in Figure 13. The fitting function is as follows [25,26]:
σ 1 σ 3 = 2 ( c + σ 3 tan φ ) ( 1 tan θ tan φ ) sin 2 θ
where c is the cohesion, φ is the internal friction angle and θ is the angle between the bedding plane and the vertical direction.
It was found that the single plane of weakness theory can better fit the relationship between the peak strength and the bedding angle of the coal samples.

5. Numerical Simulation

5.1. Numerical Modeling

Coal is a porous media material, which has obvious inhomogeneous and discontinuous features, which leads to the complex and changeable mechanical properties and failure patterns of coal. In order to better explore the coal failure mechanics and bedding effects, the DEM was used for numerical simulation. Based on the test results, a two-dimensional rectangular model with the size of 25 mm × 50 mm was constructed to represent the bedded coal. The computational model comprises approximately 14,000 particles in different gradations and the initial porosity is set to 0.1. The model material parameters are selected as: elastic modulus 2.29 GPa, Poisson’s ratio 0.23, and density 1360 kg/m3. The confining pressure of the numerical simulation is consistent with the test (9 MPa).
With respect to the special properties of bedding coal and the development of numerical analysis technology, an increasing number of researchers have carried out laboratory tests and numerical analyses. A parallel bonding model was chosen because it can simulate the material damage evolution process [27]. The determination of microscopic parameters is mainly divided into two steps. First, referring to the numerical simulation results on bedding coal to determine the approximate range of micro-parameters [28]. Then, through continuous trial-and-error correction, the micro-parameters are adjusted until the numerical simulation curve is consistent with the test curve, as shown in Figure 14. After repeatedly adjusting the model, the well-fitting micro-parameters are listed in Table 4 and Table 5.
The deviatoric stress–strain curves obtained from the numerical simulation and laboratory test under a confining pressure of 9 MPa are plotted in Figure 14. Comparing the stress–strain curves of the numerical simulation and experimental results, some differences can be found; for example, the stress–strain curves of the numerical simulation have no obvious nonlinear elastic phase in the pre-peak stage. The numerical simulation curve is also not obvious in the softening stage before reaching the stress peak. Analyzing the reasons for these observations, we found that the test sample as a geological material has heterogeneous characteristics due to weak structures such as pores, defects and bedding planes. However, the numerical simulation idealizes the material and quantifies the parameters of the bedding surface, resulting in a certain difference between the numerical simulation curve and the experimental curve. However, by comparing and analyzing the experimental curve and the numerical simulation curve, we find that the general trend of the stress–strain curve is similar, and the position of the stress peak is basically the same, as is the change trend of the elastic modulus. It shows that the microscopic parameters used in the numerical simulation are accurate and reliable, that the model can reflect the mechanical properties of coal with different bedding angles, and at the same time, it can well simulate the deformation process of coal.
In order to explore the relationship between strength and bedding angle, the relationship between the peak strength and bedding angle of the laboratory test and numerical simulation test is plotted in Figure 15. It can be found that the peak strength shows a U-shaped change trend, whether it is a laboratory test or a numerical simulation, which is basically consistent with the results of coal with different bedding planes [29]. When the bedding angle is 0°, the peak strength is higher. When the bedding angle is rotated clockwise to 30°, the peak strength of the laboratory test decreases by 23.01%, and the peak strength of the numerical simulation test decreases by 29.04%. When the bedding angle is converted from 30° to 45°, the decline rates of the laboratory test and numerical simulation slow down slightly, to 19.42% and 28.99%, respectively. However, when the bedding angle changes from 45° to 60°, the peak strength decreases to the lowest value, and the decrease rate exceeds 30% in the second angle section. Within the bedding angle from 60° to 90°, the peak strength has a relatively large recovery. The relationship between the peak strength and the bedding angle is consistent between the laboratory test and the numerical simulation, indicating that the peak strength reaches the lowest value when the bedding dip is 60°. Therefore, when the bedding angle is 60°, the adverse effect on coal strength is the greatest.

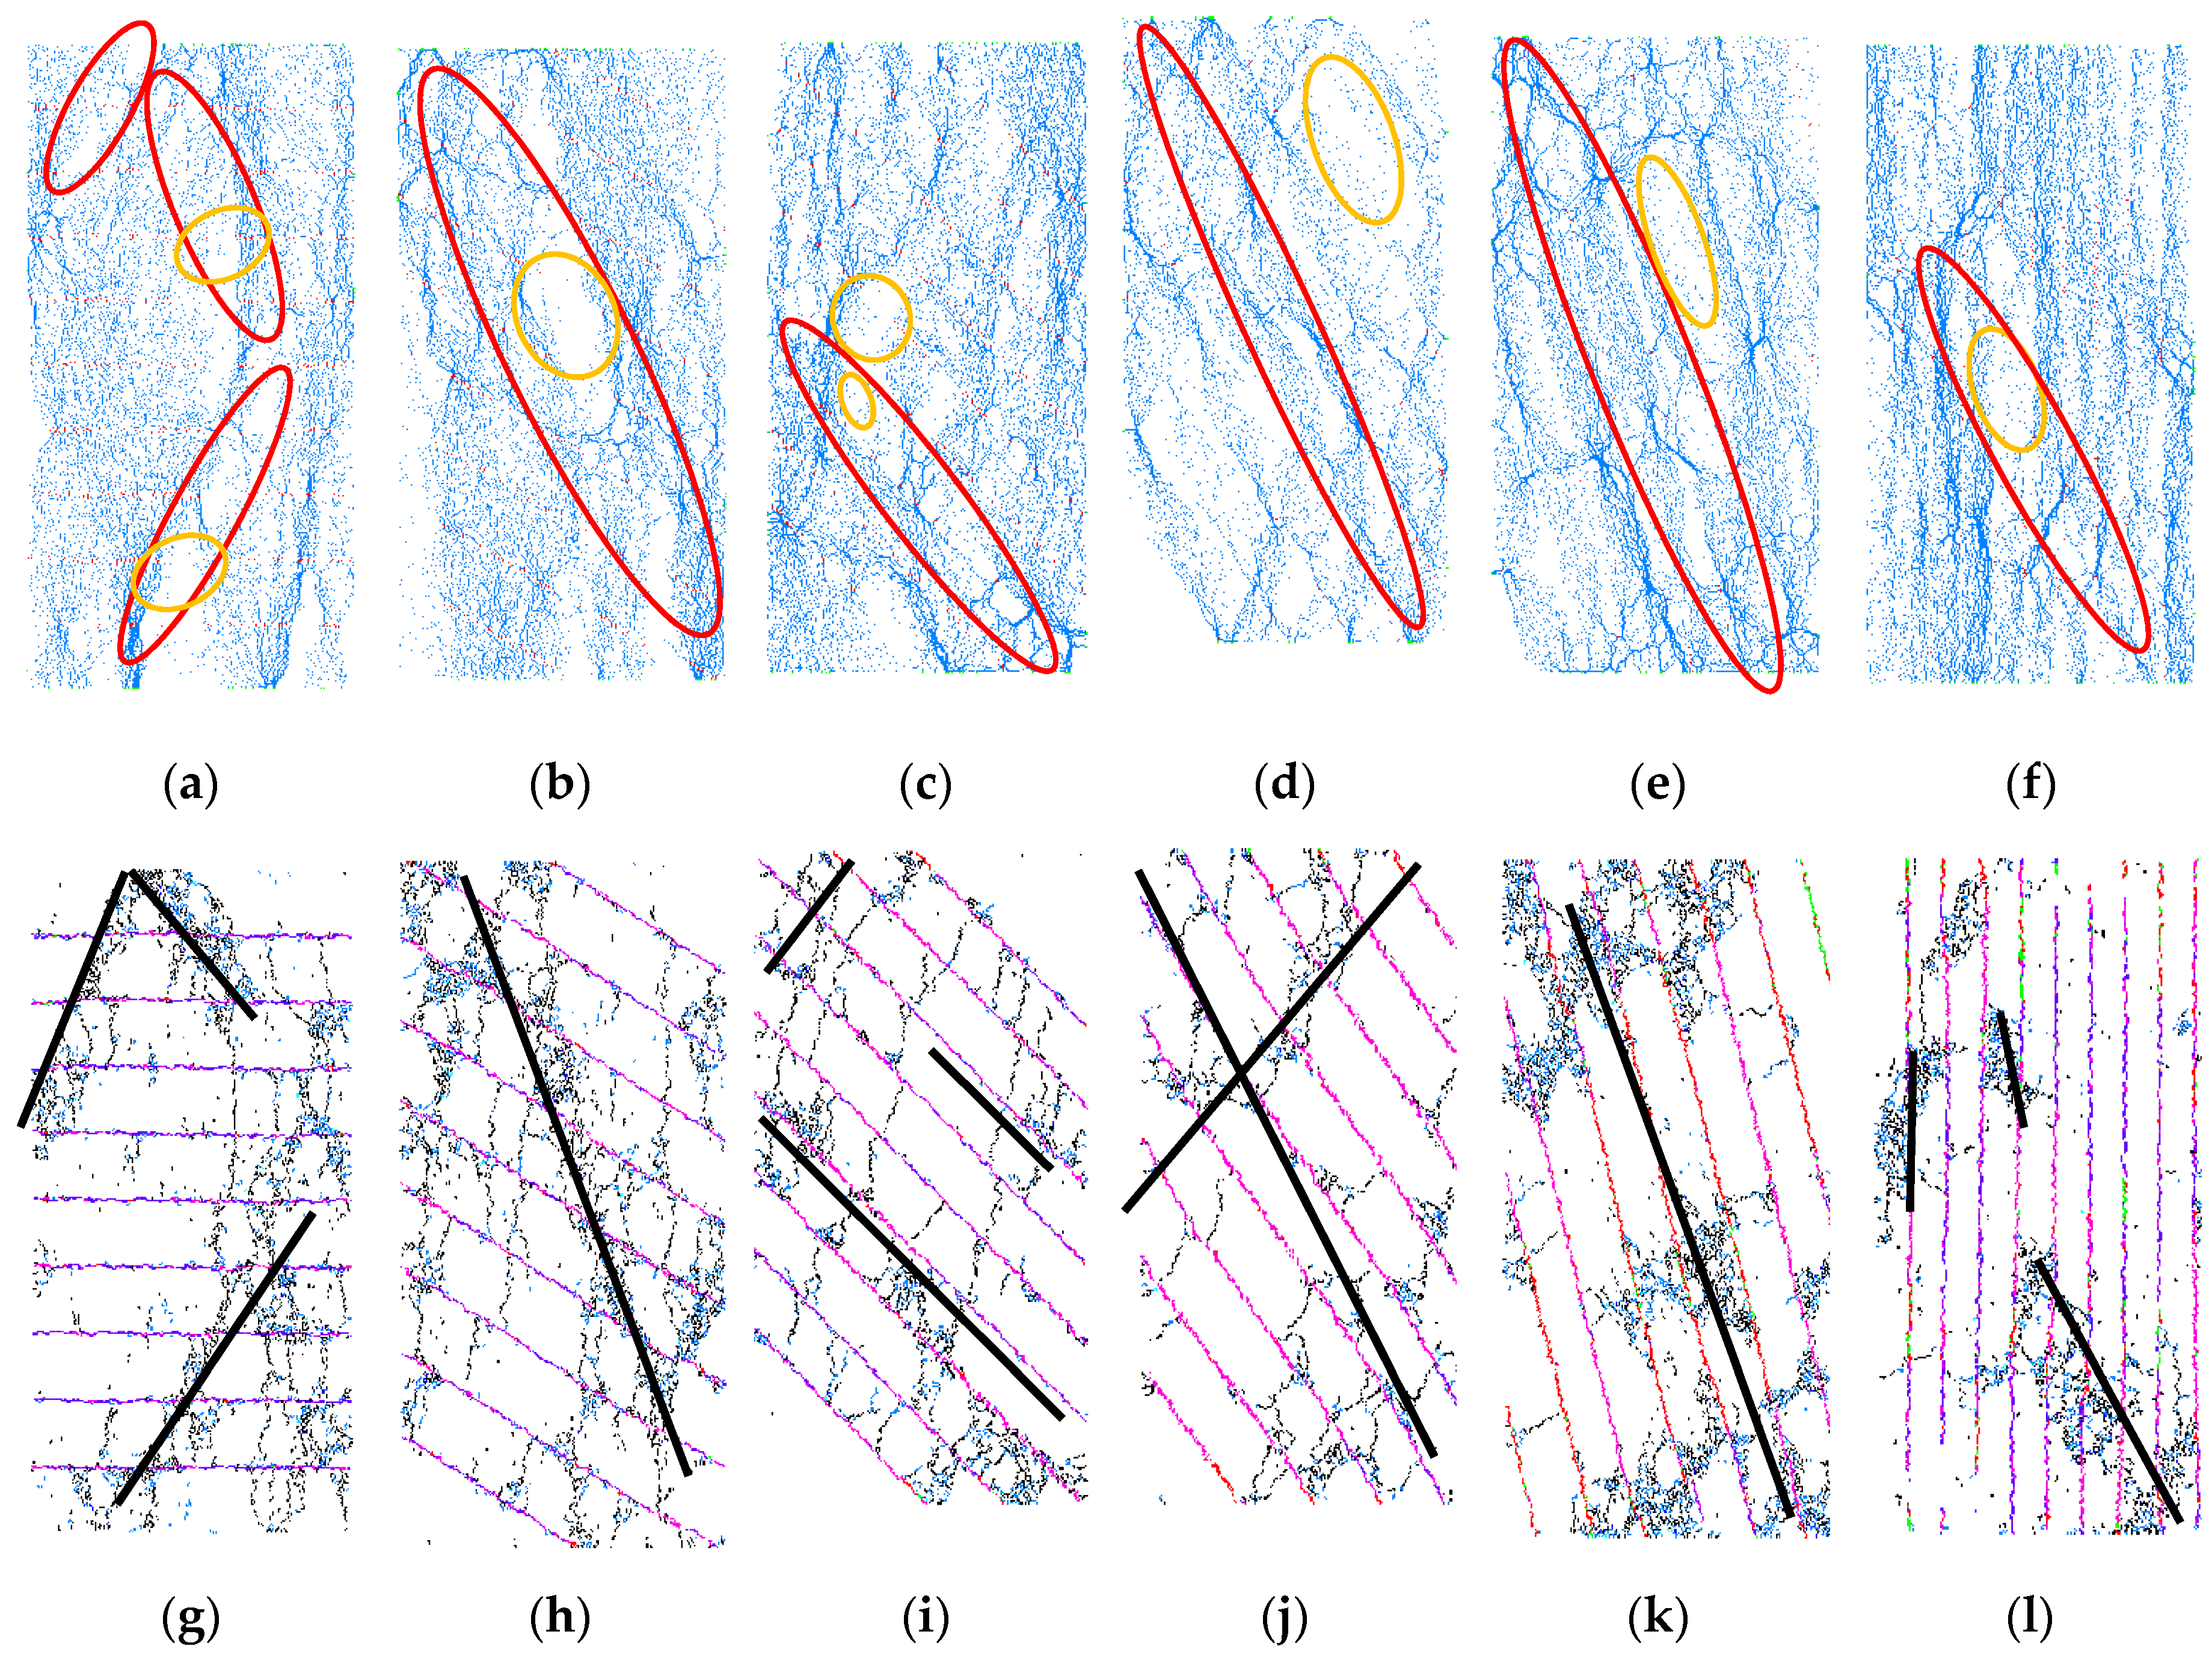
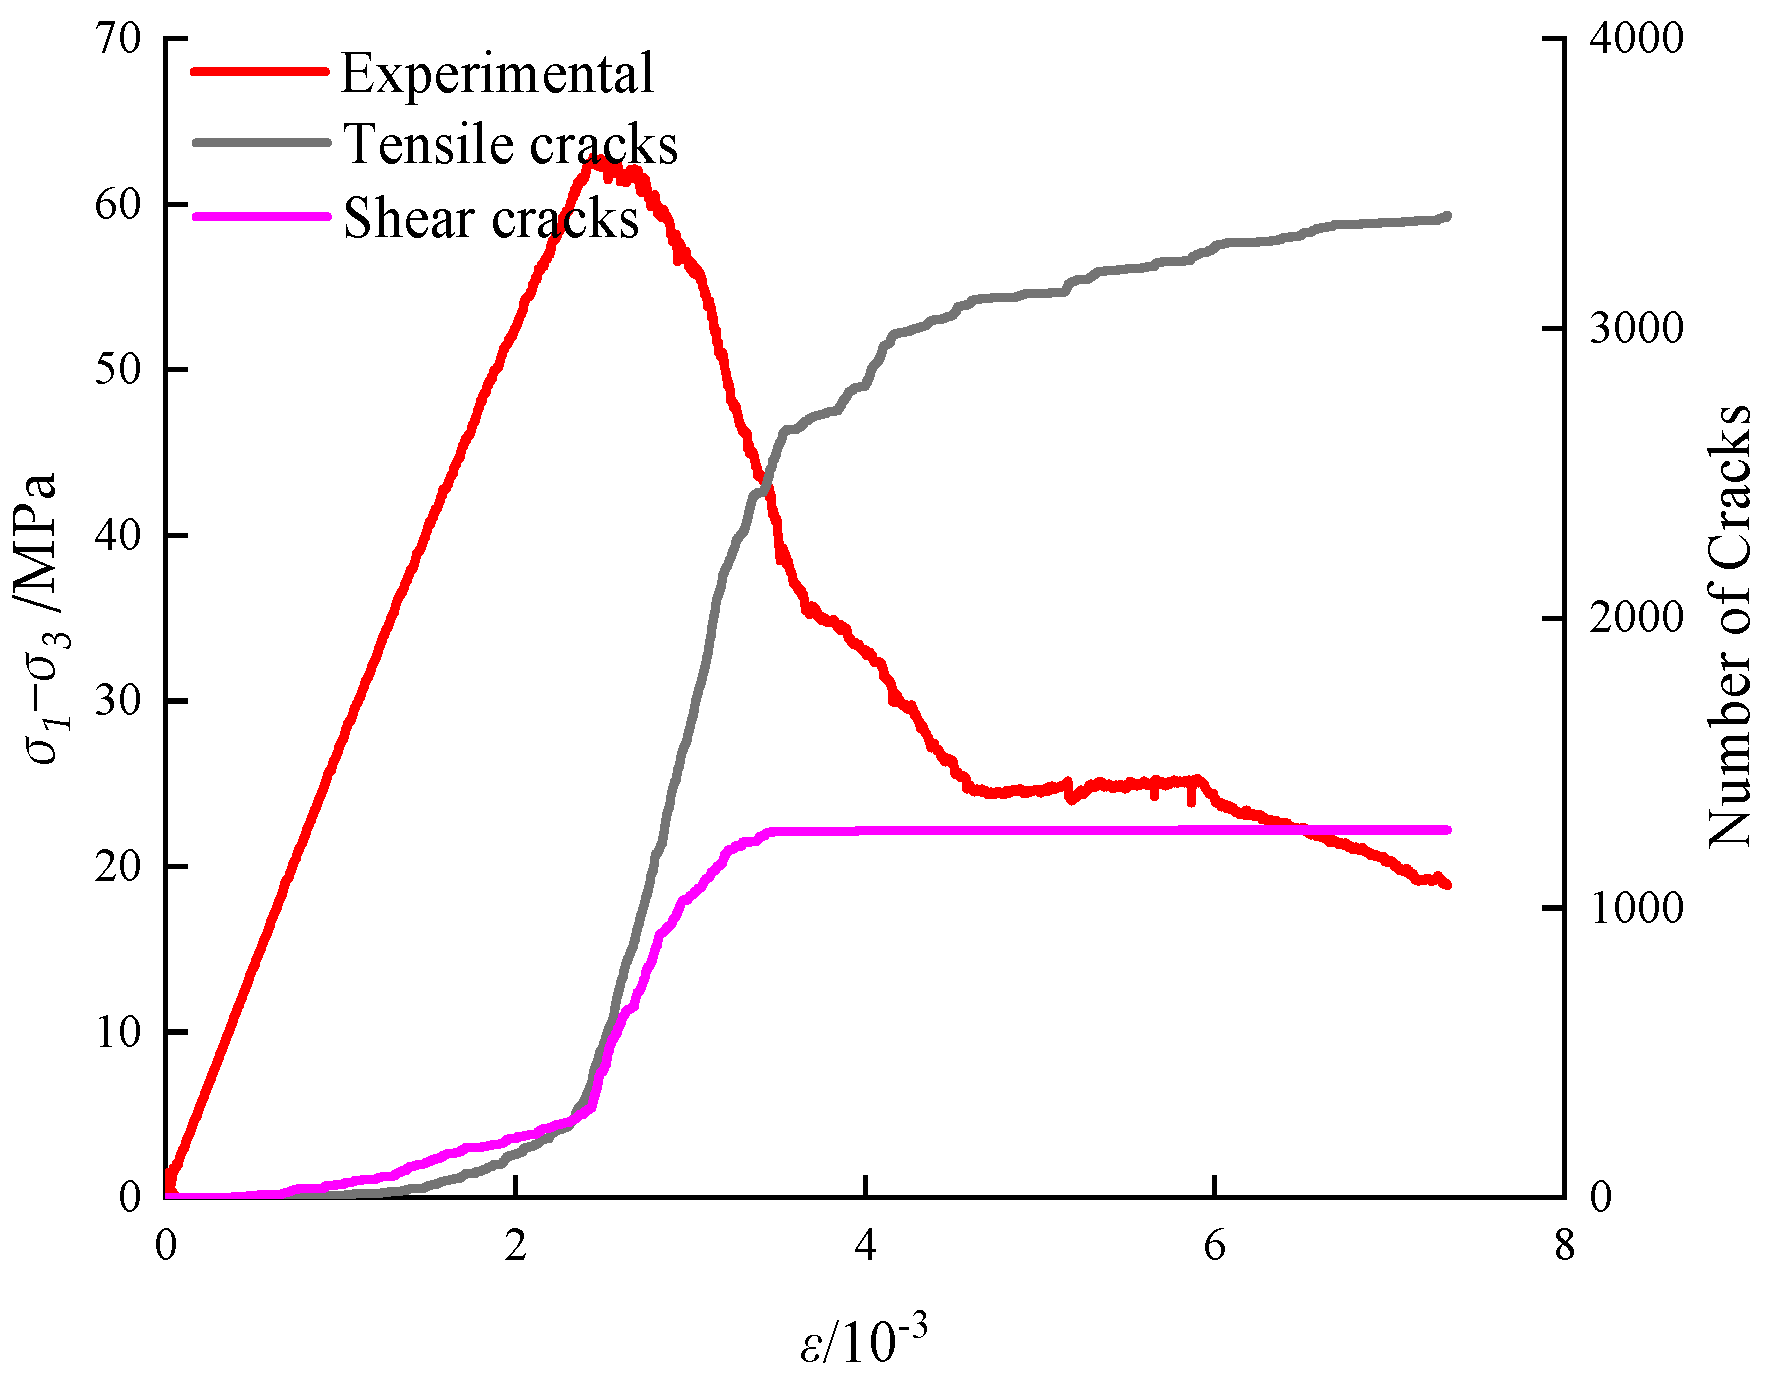
5.2. Evolution of the Microcracks

The contact force chains and the crack distribution at the failure stage of coal with different bedding angles are exhibited in Figure 16. It can be seen from the trend of the main failure surface that the failure characteristics of the coal sample are mainly represented by shear failure along the bedding angles.
The rigid spherical particles on the shear slip surface are severely squeezed, and then dislocated. The spaces between the particles are increased, thus weakening the contact force of the particles and resulting in the disappearance of the local contact force chain on the shear failure surface (red circle in Figure 16). Some blank areas are formed (orange circle in Figure 16), the rigid spherical particles in the blank areas do not bear the load, and the contact force gradually decreases until there is no load. The coal sample shows local cracking and spalling on the macroscopic view, and the sample undergoes tensile and shear failure. Around the blank area, the contact force chains recombine and form new branches, providing the coal sample with certain plastic characteristics. In the vicinity of the main crack (black line in Figure 16), a large number of tensile and shear cracks extend to the boundary of the sample, which leads to the coal falling into multiple pieces after being destroyed. In general, the development trend of microcracks shown by the numerical simulation is similar to the fracture characteristics of the samples in the test. It shows that the numerical simulation can describe the failure characteristics of the sample well.
In order to explore the microcrack development pattern, the test curve of the coal sample with a 0° bedding angle is selected for analysis. The evolution of deviatoric stress and shear and tensile microcracks are recorded during loading, as presented in Figure 17. It can be seen that tensile cracks and shear cracks develop simultaneously at the pre-peak stage and the number of shear cracks is larger, resulting in the shear failure of the samples. At the post-peak stage, due to the development of microcracks and the formation of the main shear failure surface, the number of tensile cracks increases exponentially along the failure surface. By monitoring the number of cracks, it is found that the samples underwent shear failure in a macroscopic view, but there is a large number of tensile cracks inside the samples.

6. Discussion

The research on the strength characteristics of coal under different stress states is of great scientific significance to guarantee the safety of coal mines. In order to better predict the strength variation trend of rock under different stress states, researchers introduced different strength criteria to study the strength characteristics of rock [30,31]. In this study, it is found that the power function strength criterion is most applicable to describe the strength characteristics of coal. Relevant researchers also found the applicability of the power function strength criterion in the study of the strength characteristics of different rocks [32,33]. Rock is a heterogeneous mass, and it is very important to grasp the variation characteristics of rock strength in engineering projects.
The extensive bedding planes have a significant influence on the mechanical properties of rock. Many researchers have carried out studies on rocks with different bedding angles that are common in engineering, such as coal [34,35], slate [26], sandstone [36] and shale [37]. Related studies have found that the strength of the rock presents a U-shaped change trend under the change of the bedding angle. When the bedding angle is 0° and 90°, the strength value of the rock is relatively high, which is consistent with the research conclusion of this paper. Therefore, a sufficient study of the influence of bedding plane can not only ensure the safety of construction, but also have a profound impact on the efficient mining and utilization of mineral resources. Meanwhile, it is proved to be incorrect to ignore the influence of bedding angle on rocks in the past.
In recent years, the rapid development and progress of numerical simulation technology have promoted the research of rock mechanics. It enables people to have a more intuitive understanding of the deformation and failure process of rocks. However, there are many pores in different shapes and sizes distributed in the rock, and these pore structures lead to the deviation between the numerical simulation and the experimental curve [38,39]. Therefore, controlling the error of numerical simulation within a small range to analyze the results of numerical simulation and experiment can add research methods of rock mechanics. It has become a research trend to analyze the deformation and failure characteristics of rocks through numerical simulation [40]. In this paper, the combination of numerical simulation and experiment is well realized, and the difference of bedding influence is analyzed. This enables a clearer understanding of the bedding angle of coal.

7. Conclusions

In this paper, coal collected from Shanxi, China was chosen in order to report the mechanical properties with different bedding angles. To comprehensively understand its mechanical properties, the triaxial compression test, uniaxial compression test and numerical simulations were conducted. Based on the test results and numerical simulation, the following conclusions can be drawn.
The elastic modulus of coal in triaxial tests shows a power function growth relationship with confining pressure. Poisson’s ratio decreases exponentially with the confining pressure. The strength properties of coal can be described by the Power function strength criterion. Due to the influence of initial micro-fractures, the deformation properties of coal are relatively discrete, and there are irregular intermediate short-term peaks. In general, with the increase in confining pressure, coal gradually shows plastic deformation properties.
The properties of peak strength at different bedding angles roughly showed a U-shaped changing trend. The maximum value occurred at a bedding angle of 0°, whereas the minimum value occurred at a bedding angle of 60°. By the fitting of the experimental data, it is found that the single plane of weakness theory can fit the relationship between peak strength and bedding angle of coal samples well.
The numerical simulation and test results prove that the failure forms of coal samples with different beddings are complicated and are mainly represented by tensile and shear failure. The numerical simulation curve conforms well to the experimental curve in terms of overall trend, indicating that the DEM can better simulate the different bedding coal failure characteristics.
Here, we mainly conducted triaxial compression tests of coal samples with different bedding angles and found that the deformation properties and failure characteristics are discrete. In future studies, an acoustic emission system will be used to monitor samples with different bedding angles and grasp the development of cracks during failure. A comprehensive and systematic understanding of the influence on the mechanical properties of coal warrants further study in the future.

Author Contributions

Writing—original draft preparation, Y.L.; project administration, B.Z.; resources J.Y. and J.S.; funding acquisition, W.H. and Z.L.; data curation, B.W. All authors have read and agreed to the published version of the manuscript.

Funding

This research was funded by [National Natural Science Foundation of China] grant number [Grant No. 41302223; Grant No. 51908097], [The Natural Science Foundation of Chongqing] grant number [No. cstc2020jcyj -msxm1078, No. cstc2020jcyj-msxmX0558, No. cstc2019jcyj-msxmX0258], [Scientific and Technological Research Program of Chongqing Municipal Education Commission] grant number [KJZD-K2021 01505] and by [Graduate Scientific Research and Innovation Foundation of Chongqing] grant number [CYS21502].

Data Availability Statement

All the data in the tests of this study have been listed in the paper.

Acknowledgments

The authors would like to thank the reviewers and editors who presented critical and constructive comments for the improvement of this paper.

Conflicts of Interest

The authors declare no conflict of interest.

References

  1. Ju, M.H.; Li, J.C.; Li, J.; Zhao, J. Loading rate effects on anisotropy and crack propagation of weak bedding plane-rich rocks. Eng. Fract. Mech. 2020, 230, 106983. [Google Scholar] [CrossRef]
  2. Wen, Z.J.; Wang, X.; Tan, Y.L.; Zhang, H.L.; Huang, W.P.; Li, Q.H. A study of rockburst hazard evaluation method in coal mine. Shock Vib. 2016, 2016, 8740868. [Google Scholar] [CrossRef] [Green Version]
  3. Xu, J.B.; Fei, D.Y.; Yu, Y.L.; Cui, Y.L.; Yan, C.G.; Bao, H.; Lan, H.X. Research on crack evolution law and macroscopic failure mode of joint phyllite under uniaxial compression. Sci. Rep. 2021, 11, 4196. [Google Scholar] [CrossRef] [PubMed]
  4. Cai, M.; Kaiser, P.K.; Tasaka, Y.; Maejima, T.; Morioka, H.; Minami, M. Generalized crack initiation and crack damage stress thresholds of brittle rock masses near underground excavations. Int. J. Rock Mech. Min. Sci. 2004, 41, 833–847. [Google Scholar] [CrossRef]
  5. Yan, L.H.; Wu, J.W. Test and analysis of tensile strength of coal in Huaibei Yangzhuang coal mine. Coal Sci. Technol. 2002, 30, 39–41. [Google Scholar]
  6. Zhang, Z.T.; Zhang, R.; Li, G.; Li, H.G.; Liu, J.F. The effect of bedding structure on mechanical property of coal. Adv. Mater. Sci. Eng. 2014, 2014, 952703. [Google Scholar] [CrossRef] [Green Version]
  7. Hao, X.J.; Du, W.S.; Jiang, Y.D.; Tannant, D.; Zhao, Y.X.; Guo, Y.D. Influence of bedding and cleats on the mechanical properties of a hard coal. Arab. J. Geosci. 2018, 11, 200. [Google Scholar] [CrossRef]
  8. Jiang, T.T.; Zhang, J.H.; Huang, G.; Song, S.X.; Wu, H. Experimental study on the mechanical property of coal and its application. Geomech. Eng. 2018, 14, 9–17. [Google Scholar]
  9. Liu, J.J.; Yang, M.; Wang, D.; Zhang, J.H. Different bedding loaded coal mechanics properties and acoustic emission. Environ. Earth Sci. 2018, 77, 322. [Google Scholar] [CrossRef]
  10. Liu, H.F.; Zhang, J.X.; Zhou, N.; Sun, Q.; Li, M.; Cui, Z.Z. Experimental investigation into the bedding plane slip effect on the overlying strata behavior in longwall top coal caving of soft coal seam. Adv. Civ. Eng. 2019, 2019, 1718751. [Google Scholar] [CrossRef] [Green Version]
  11. Pan, R.K.; Fu, D.; Yu, M.G.; Chen, L. Directivity effect of unloading bedding coal induced fracture evolution and its application. Int. J. Min. Sci. Technol. 2017, 27, 825–829. [Google Scholar]
  12. Chen, Y.L.; Zhang, Y.N.; Li, X.L. Experimental study on influence of bedding angle on gas permeability in coal. J. Pet. Sci. Eng. 2019, 179, 173–179. [Google Scholar] [CrossRef]
  13. Lee, H.; Jeon, S. An experimental and numerical study of fracture coalescence in pre-cracked specimens under uniaxial compression. Int. J. Solids Struct. 2011, 48, 979–999. [Google Scholar] [CrossRef] [Green Version]
  14. Meng, Y.Y.; Hong, W.J.; Liu, X.W.; Yin, Q.; Zhang, L.; Liu, H.X. Experimental and numerical investigation on the effect of bedding plane properties on fracture behaviour of sandy mudstone. Theor. Appl. Fract. Mech. 2021, 114, 102989. [Google Scholar] [CrossRef]
  15. Yang, S.Q.; Dai, Y.H.; Han, L.J.; Jin, Z.Q. Experimental study on mechanical behavior of brittle marble samples containing different flaws under uniaxial compression. Eng. Fract. Mech. 2009, 76, 1833–1845. [Google Scholar] [CrossRef]
  16. Yin, Q.; Jing, H.W.; Su, H.J. Investigation on mechanical behavior and crack coalescence of sandstone specimens containing fissure-hole combined flaws under uniaxial compression. Geosci. J. 2018, 22, 825–842. [Google Scholar] [CrossRef]
  17. Mughieda, O.; Omar, M.T. Stress analysis for rock mass failure with offset joints. Geotech. Geol. Eng. 2008, 26, 543–552. [Google Scholar] [CrossRef]
  18. Liu, T.; Lin, B.Q.; Zou, Q.L.; Zhu, C.J.; Yan, F.Z. Mechanical behaviors and failure processes of precracked specimens under uniaxial compression a perspective from microscopic displacement patterns. Tectonophysics 2016, 672–673, 104–120. [Google Scholar] [CrossRef]
  19. Lv, H.Y.; Tang, Y.S.; Zhang, L.F.; Cheng, Z.B.; Zhang, Y.N. Analysis for mechanical characteristics and failure models of coal specimens with non-penetrating single crack. Geomech. Eng. 2019, 17, 355–365. [Google Scholar]
  20. Bahaaddini, M.; Hagan, P.C.; Mitra, R.; Hebblewhite, B.K. Scale effect on the shear behaviour of rock joints based on a numerical study. Eng. Geol. 2014, 181, 212–223. [Google Scholar] [CrossRef]
  21. Eberhardt, E.; Stead, D.; Stimpson, B.; Read, R.S. Identifying crack initiation and propagation thresholds in brittle rock. Can. Geotech. J. 1998, 35, 222–233. [Google Scholar] [CrossRef]
  22. Renani, H.R.; Martin, C.D. Slope stability analysis using equivalent Mohr–Coulomb and Hoek-Brown criteria. Rock Mech. Rock Eng. 2020, 53, 13–21. [Google Scholar] [CrossRef]
  23. Hoek, E.; Brown, E.T. Empirical strength criterion for rock masses. J. Geotech. Eng. Div. 1980, 106, 1013–1035. [Google Scholar] [CrossRef]
  24. Bieniawski, Z.T. Estimating the strength of rock materials. J. S. Afr. Inst. Min. Metall. 1974, 74, 312–320. [Google Scholar] [CrossRef]
  25. Jaeger, J.C. Shear Failure of Anistropic Rocks. Geol. Mag. 1960, 97, 65. [Google Scholar] [CrossRef]
  26. Hao, X.J.; Wang, S.H.; Xu, Q.S.; Yang, D.Q.; Zhang, Q.; Jin, D.X.; Wei, Y.N. Influences of confining pressure and bedding angles on the deformation, fracture and mechanical characteristics of slate. Constr. Build. Mater. 2020, 243, 118255. [Google Scholar] [CrossRef]
  27. Liu, W.R.; Wang, X.; Li, C.M. Numerical study of damage evolution law of coal mine roadway by particle flow code (PFC) model. Geotech. Geol. Eng. 2019, 37, 2883–2891. [Google Scholar] [CrossRef]
  28. Yoon, J. Application of experimental design and optimization to PFC model calibration in uniaxial compression simulation. Int. J. Rock Mech. Min. Sci. 2007, 44, 871–889. [Google Scholar] [CrossRef]
  29. Song, H.H.; Jiang, Y.D.; Elsworth, D.; Zhao, Y.X.; Wang, J.H.; Liu, B. Scale effects and strength anisotropy in coal. Int. J. Coal Geol. 2018, 195, 37–46. [Google Scholar] [CrossRef]
  30. You, M.Q. Study of Mathematical equation and parameter determination of strength criteria for rock. Chin. J. Rock Mech. Eng. 2010, 29, 2172–2184. [Google Scholar]
  31. Peng, J.; Rong, G.; Cai, M.; Wang, X.J.; Zhou, C.B. An Empirical Failure Criterion for Intact Rocks. Rock Mech. Rock Eng. 2014, 47, 347–356. [Google Scholar] [CrossRef]
  32. Shi, X.C.; Meng, Y.F.; Li, G. Comparative analyses of several rock strength criteria. Rock Soil Mech. 2011, 32, 209–216. [Google Scholar]
  33. Zhao, B.Y.; Li, Y.F.; Huang, W.; Wang, X.P.; Chen, C. Experimental study on mechanical properties of shale rock and its strength criterion. Arab. J. Geosci. 2021, 14, 264. [Google Scholar] [CrossRef]
  34. Cong, T.Z.; Zhai, C.; Sun, Y.; Xu, J.Z.; Tang, W.; Zheng, Y.F.; Zhu, X.Y.; Yang, L. Study on transient boiling heat transfer of coal with different bedding angles quenched by liquid nitrogen. Case Stud. Therm. Eng. 2021, 28, 101463. [Google Scholar] [CrossRef]
  35. Cheng, Y.F.; Jiang, L.; Wang, H.D.; Ansari, U.; Han, Z.Y.; Ding, J.P. Experimental Study on Pore Structure and Mechanical Properties of Stratified Coal. Int. J. Geomech. 2017, 17, 04017116. [Google Scholar] [CrossRef]
  36. Jin, Y.; Yao, W.; Duan, K.; Liu, X.Y.; Zhu, Y.L. Experimental study and discrete element method modeling of compression and permeability behaviors of weakly anisotropic sandstones. Int. J. Rock Mech. Mini. Sci. 2020, 134, 104437. [Google Scholar]
  37. Wang, Y.P.; Liu, X.J.; Liang, L.X. Influences of bedding planes on mechanical properties and prediction method of brittleness index in shale. Lithol. Reserv. 2018, 30, 12. [Google Scholar]
  38. Yang, S.Q.; Huang, Y.H.; Jing, H.W.; Liu, X.R. Discrete element modeling on fracture coalescence behavior of red sandstone containing two unparallel fissures under uniaxial compression. Eng. Geol. 2014, 178, 28–48. [Google Scholar] [CrossRef]
  39. Zhou, Z.L.; Tan, L.H.; Cao, W.Z.; Zhou, Z.Y.; Cai, X. Fracture evolution and failure behaviour of marble specimens containing rectangular cavities under uniaxial loading. Eng. Fract. Mech. 2017, 184, 183–201. [Google Scholar] [CrossRef]
  40. Tan, L.H.; Ren, T.; Yang, X.H.; He, X.Q. A numerical simulation study on mechanical behaviour of coal with bedding planes under coupled static and dynamic load. Int. J. Min. Sci. Technol. 2018, 28, 791–797. [Google Scholar] [CrossRef]
Figure 1. Initial materials and molded samples. (a) Initial materials. (b) Molded samples.
Minerals 12 00345 g001
Figure 2. Angle relationship between the drill bit and the rock samples.
Minerals 12 00345 g002
Figure 3. TFD-2000 microcomputer servo-controlled triaxial rheological testing machine.
Minerals 12 00345 g003
Figure 4. Deviatoric stress–strain curves of sample with 0° under confining pressure of 6 MPa.
Minerals 12 00345 g004
Figure 5. The variation between deviatoric stress and strain of samples with 0° under different confining pressures. (a) radial strain (ε3). (b) axial strain (ε1).
Minerals 12 00345 g005
Figure 6. Fitting results of peak strength under different strength criteria.
Minerals 12 00345 g006
Figure 7. Mohr circles of triaxial compression test under different confining pressures.
Minerals 12 00345 g007
Figure 8. The relationship between elastic modulus, Poisson’s ratio and confining pressure.
Minerals 12 00345 g008
Figure 9. Failure patterns of triaxial compression test under different confining pressure. (a) 3 MPa. (b) 6 MPa. (c) 9 MPa. (d) 12 MPa.
Minerals 12 00345 g009
Figure 10. Deviatoric stress–strain curves of coal samples with different bedding angles under confining pressure of 9 MPa. (a) 0°. (b) 30°. (c) 45°. (d) 60°. (e) 75°. (f) 90°.
Minerals 12 00345 g010
Figure 11. Comparison of coal samples with different bedding angles before and after failure. (a) 0°. (b) 30°. (c) 45°. (d) 60°. (e) 75°. (f) 90°.
Minerals 12 00345 g011
Figure 12. Deviatoric stress-axial strain curves of coal samples with different bedding angles under confining pressure of 9 MPa.
Minerals 12 00345 g012
Figure 13. Variation in peak stress of coal samples with different bedding angles.
Minerals 12 00345 g013
Figure 14. Deviatoric stress–strain curves of coal with different bedding angles in the numerical simulation and laboratory test. (a) 0°. (b) 30°. (c) 45°. (d) 60°. (e) 75°. (f) 90°.
Minerals 12 00345 g014
Figure 15. Comparison of numerical simulation and laboratory test results.
Minerals 12 00345 g015
Figure 16. Failure pattern of coal with different bedding angles. (a) Contact force chain of 0°; (b) Contact force chain of 30°; (c) Contact force chain of 45°; (d) Contact force chain of 60°; (e) Contact force chain of 75°; (f) Contact force chain of 90°; (g) Main cracks of 0°; (h) Main cracks of 30°; (i) Main cracks of 45°; (j) Main cracks of 60°; (k) Main cracks of 75°; (l) Main cracks of 90°.
Minerals 12 00345 g016
Figure 17. Crack evolution during triaxial loading with bedding angle 0°.
Minerals 12 00345 g017
Table 1. Geometric information of coal samples and the experimental projects.
Sample No.Diameter
/D (mm)
Height
/H (mm)
Density
/ρ (g/cm3)
Confining Pressure
/σ3 (MPa)
Bedding Angle
/θ (°)
D1-125.0552.041.33100
S325.1250.851.7423
S625.3352.771.5896
S925.3552.431.3239
S1225.0451.301.40512
B1-125.3852.281.36690
B1-225.1152.401.31630
B1-325.1651.941.30045
B1-425.3452.161.27960
B1-524.9752.391.37275
B1-625.0652.341.30390
Table 2. Mechanical test results of samples with 0°.
Sample No.Confining
Pressure
/σ3 (MPa)
Peak Deviatoric Stress
/σcm (MPa)
Peak Axial Strain
/ε1m (mm/mm)
Peak Radial Strain
/ε3m (mm/mm)
Peak Volumetric Strain
/εvm (mm/mm)
Elastic
Modulus
/E (GPa)
Poisson
Ratio
/μ
D1-1010.27 3.28 −1.87 −0.45 1.830.43
S3331.47 6.75 −4.94 −3.13 2.410.36
S6641.08 12.87 −14.47 −16.08 2.570.31
S9946.88 7.02 −5.35 −3.67 2.630.27
S121255.25 8.32 −4.43 −0.55 2.750.25
Table 3. Mechanical test results of samples with different angles at 9 MPa.
Sample No.Bedding Angle
/θ (°)
Peak
Deviatoric Stress
/σcm (MPa)
Peak Axial Strain
/ε1m (mm/mm)
Peak Radial Strain
/ε3m (mm/mm)
Peak
Volumetric Strain
/εvm (mm/mm)
Elastic
Modulus
/E (GPa)
Poisson
Ratio
/μ
B1-1047.68 2.10 −1.11 −0.11 2.630.27
B1-23036.71 4.66 −2.90 −1.14 1.820.26
B1-34529.58 6.96 −4.96 −2.96 1.640.25
B1-46018.40 4.53 −2.55 −0.56 1.910.27
B1-57526.15 1.93 −1.24 −0.54 2.440.35
B1-69044.561.77−1.60−1.442.760.39
Table 4. Micro-parameters of numerical model.
Minimum Particle
Radius
/mm
Particle Density
/kg·m−3
Stiffness Ratio of ParticlesFriction Coefficient of ParticlesNormal Strength of Contact Bonding
/MPa
Tangential Strength of Contact Bonding
/MPa
0.2413601.50.574.02.0
Table 5. Micro-parameters of bedded particles.
Particle Normal
Stiffness/
Gpa·m−1
Particle Tangential
Stiffness
/Gpa·m−1
Friction Coefficient of ParticlesNormal Strength of
Contact Bonding
/MPa
Tangential Strength of Contact Bonding
/MPa
6605602.91.03.0
Publisher’s Note: MDPI stays neutral with regard to jurisdictional claims in published maps and institutional affiliations.

