Article

High-Throughput Analysis of Offshore Well Drill-Cuttings via SEM-Automated Mineralogy Using Single-Step Trans-Vertical Moulds

1
Core Research Equipment and Instrument Training Network (CREAIT), Memorial University of Newfoundland, St. John’s, NL A1C 5S7, Canada
2
Department of Earth Sciences, Memorial University of Newfoundland, St. John’s, NL A1C 5S7, Canada
*
Author to whom correspondence should be addressed.
Minerals 2022, 12(3), 337; https://doi.org/10.3390/min12030337
Submission received: 15 December 2021 / Revised: 3 March 2022 / Accepted: 5 March 2022 / Published: 9 March 2022
(This article belongs to the Special Issue Electron Microbeam and X-ray Techniques: Advances and Applications)

Abstract

:
Single-step trans-vertical moulds used to prepare grain mounts for SEM-automated-mineralogy based instruments have been shown to lead to more representative sample statistics. For samples that contain a variety of mineral phases, denser phases can settle to the bottom of an epoxy mould during the curing phase. Slicing and polishing a cross section through density-stratified moulds of the sample material can compensate for this. Aliquots from offshore drill well cuttings were prepared using three different methods: (1) traditional epoxy mounting, (2) two-step trans-vertical moulds, and (3) single-step trans-vertical moulds. All were analysed with a FEI Quanta 650 FEG instrument using MLA software with similar acquisition parameters. The results indicate that the single-step trans-vertical moulds are reproducible, lead to more accurate statistics, and yield MLA calculated elemental assays that closely match with data from standard analytical methods. In addition, these moulds can be made in half the time of the two-step trans-vertical moulds, and because of the unique geometry of the custom-made SEM holders, the analytical throughput is doubled. Depending on the size fraction of the well cuttings, the throughput can be further increased by slicing off the remaining epoxy to allow for more samples in the 26x TV holder. A unique cell holder was created to accommodate these trans-vertical samples, allowing them to fit into a LA-ICP-MS instrument such that detailed follow-up microanalyses can be conducted on specific minerals. For instance geochronology can be conducted on grains of interest (e.g., zircons), which had been mapped by the SEM-MLA.

1. Introduction

Scanning electron microscopy (SEM) based automated mineralogy has become a vital tool for mineralogical research over the last 30 years [1,2]. The standard sample preparation for mineral samples has involved mounting material in a 30–32 mm diameter round epoxy mount and polishing the surface [3]. More recently, trans-vertical mounting has become accepted as a more accurate method for sample preparation in order to avoid bias from density settling [4,5,6,7,8]. A case study is presented here to further support the use of single step trans-vertical mounting to reduce sample bias and increase analysis throughput. In this study, it is demonstrated that the single-step trans-vertical mould can be used to analyse drill well cuttings from offshore Newfoundland, an area containing four fields that account for 5% of Canadian oil production. Mineralogical analysis of drill core cuttings can aid exploration and production in terms of defining paleoenvironments and oil charge history [9]. The new sample holder described herein can accommodate rectangular samples in a laser ablation inductively coupled plasma mass spectrometry (LA-ICP-MS) facility, to enable in situ geochronological dating of phases, such as zircons and monazites.

1.1. Background of Sample Preparation Methods

An industry standard for the preparation of mineral grain mounts has consisted of adding epoxy to an aliquot of sized material and allowing it to cure in a 30–32 mm diameter cast [3]. However, during the curing process and after the stirring of the particles, denser particles can preferentially sink, leading to a mineralogically stratified sample. If one were to polish the bottom of this sample and then analyse it by the scanning electron microscopy with mineral liberation analysis (SEM-MLA), the resulting 2D surface would be overrepresented in minerals with high density or Z (mean atomic number) phases, while underrepresenting those with low Z values. SEM-MLA is limited to analysing a 2D surface, so any sampling bias on this surface due to this density settling in 30 mm round mounts would be reflected and carried forward in the final results. To account for this bias, trans-vertical sections can be produced and analysed to obtain a more accurate analysis by analysing along the vertical direction in the epoxy, parallel to the settling direction [4,5,6]. However, first iterations of trans-vertical mounts were laborious, as they required multiple steps and two periods of epoxy curing. The only answer to this problem, besides trans-vertical sections, is to mount a smaller amount of sample material (e.g., 0.3 gm) to create a thin monolayer (cf. [9]); the trade-off of this method is fewer sample grains to analyse.
Previously, a single-step method to produce trans-vertical sections was used, which is easily reproducible and yields a sample mould, which is representative of the host rock material [7,8]. This has been used to study iron-ores from the Labrador trough (Newfoundland, Canada) in great detail. Some of the advantages of this method are that this eliminates the need for a two-step preparation method, while increasing instrument throughput due to the new rectangular sample geometry. The revised polishing method for this material also uses a fraction of the consumables during this phase, making it much more economical to prepare these sample moulds [7].

1.2. Drill Cuttings

The material examined in this study was drill (i.e., well) cuttings, which consist of broken rock fragments derived from the drilling of an offshore borehole. The boreholes from which the cuttings were derived had been drilled in the offshore Newfoundland Grand Banks. In contrast with solid drill core, due to their broken, fine-grained disaggregated natures, cuttings material is typically very difficult to use for petrographic and textural studies. Though originally designed for use on mine sites and mining applications, SEM-MLA can provide insight into depositional environments, provenance, and petroleum system potential when applied to sedimentary samples, as first summarised by Sylvester [10] and used by others [9,11,12].
The sample material represented a wide variety of lithologies ranging from sandstone through siltstones and shales to limestones. In many samples, fragments of all these lithologies are mixed together. The grain sizes of the cutting materials analysed in this study ranged from 75 to 180 µm, which is essentially silt to fine sand-sized. Lithic fragments of finer-grained material, such as shale, however, were also observed in the SEM-MLA analysis. As the cutting materials represent broken, crushed rock, medium to coarse sand-sized particles, if present in the well interval, they would be represented in the samples as fragments of larger grains.

2. Materials and Methods

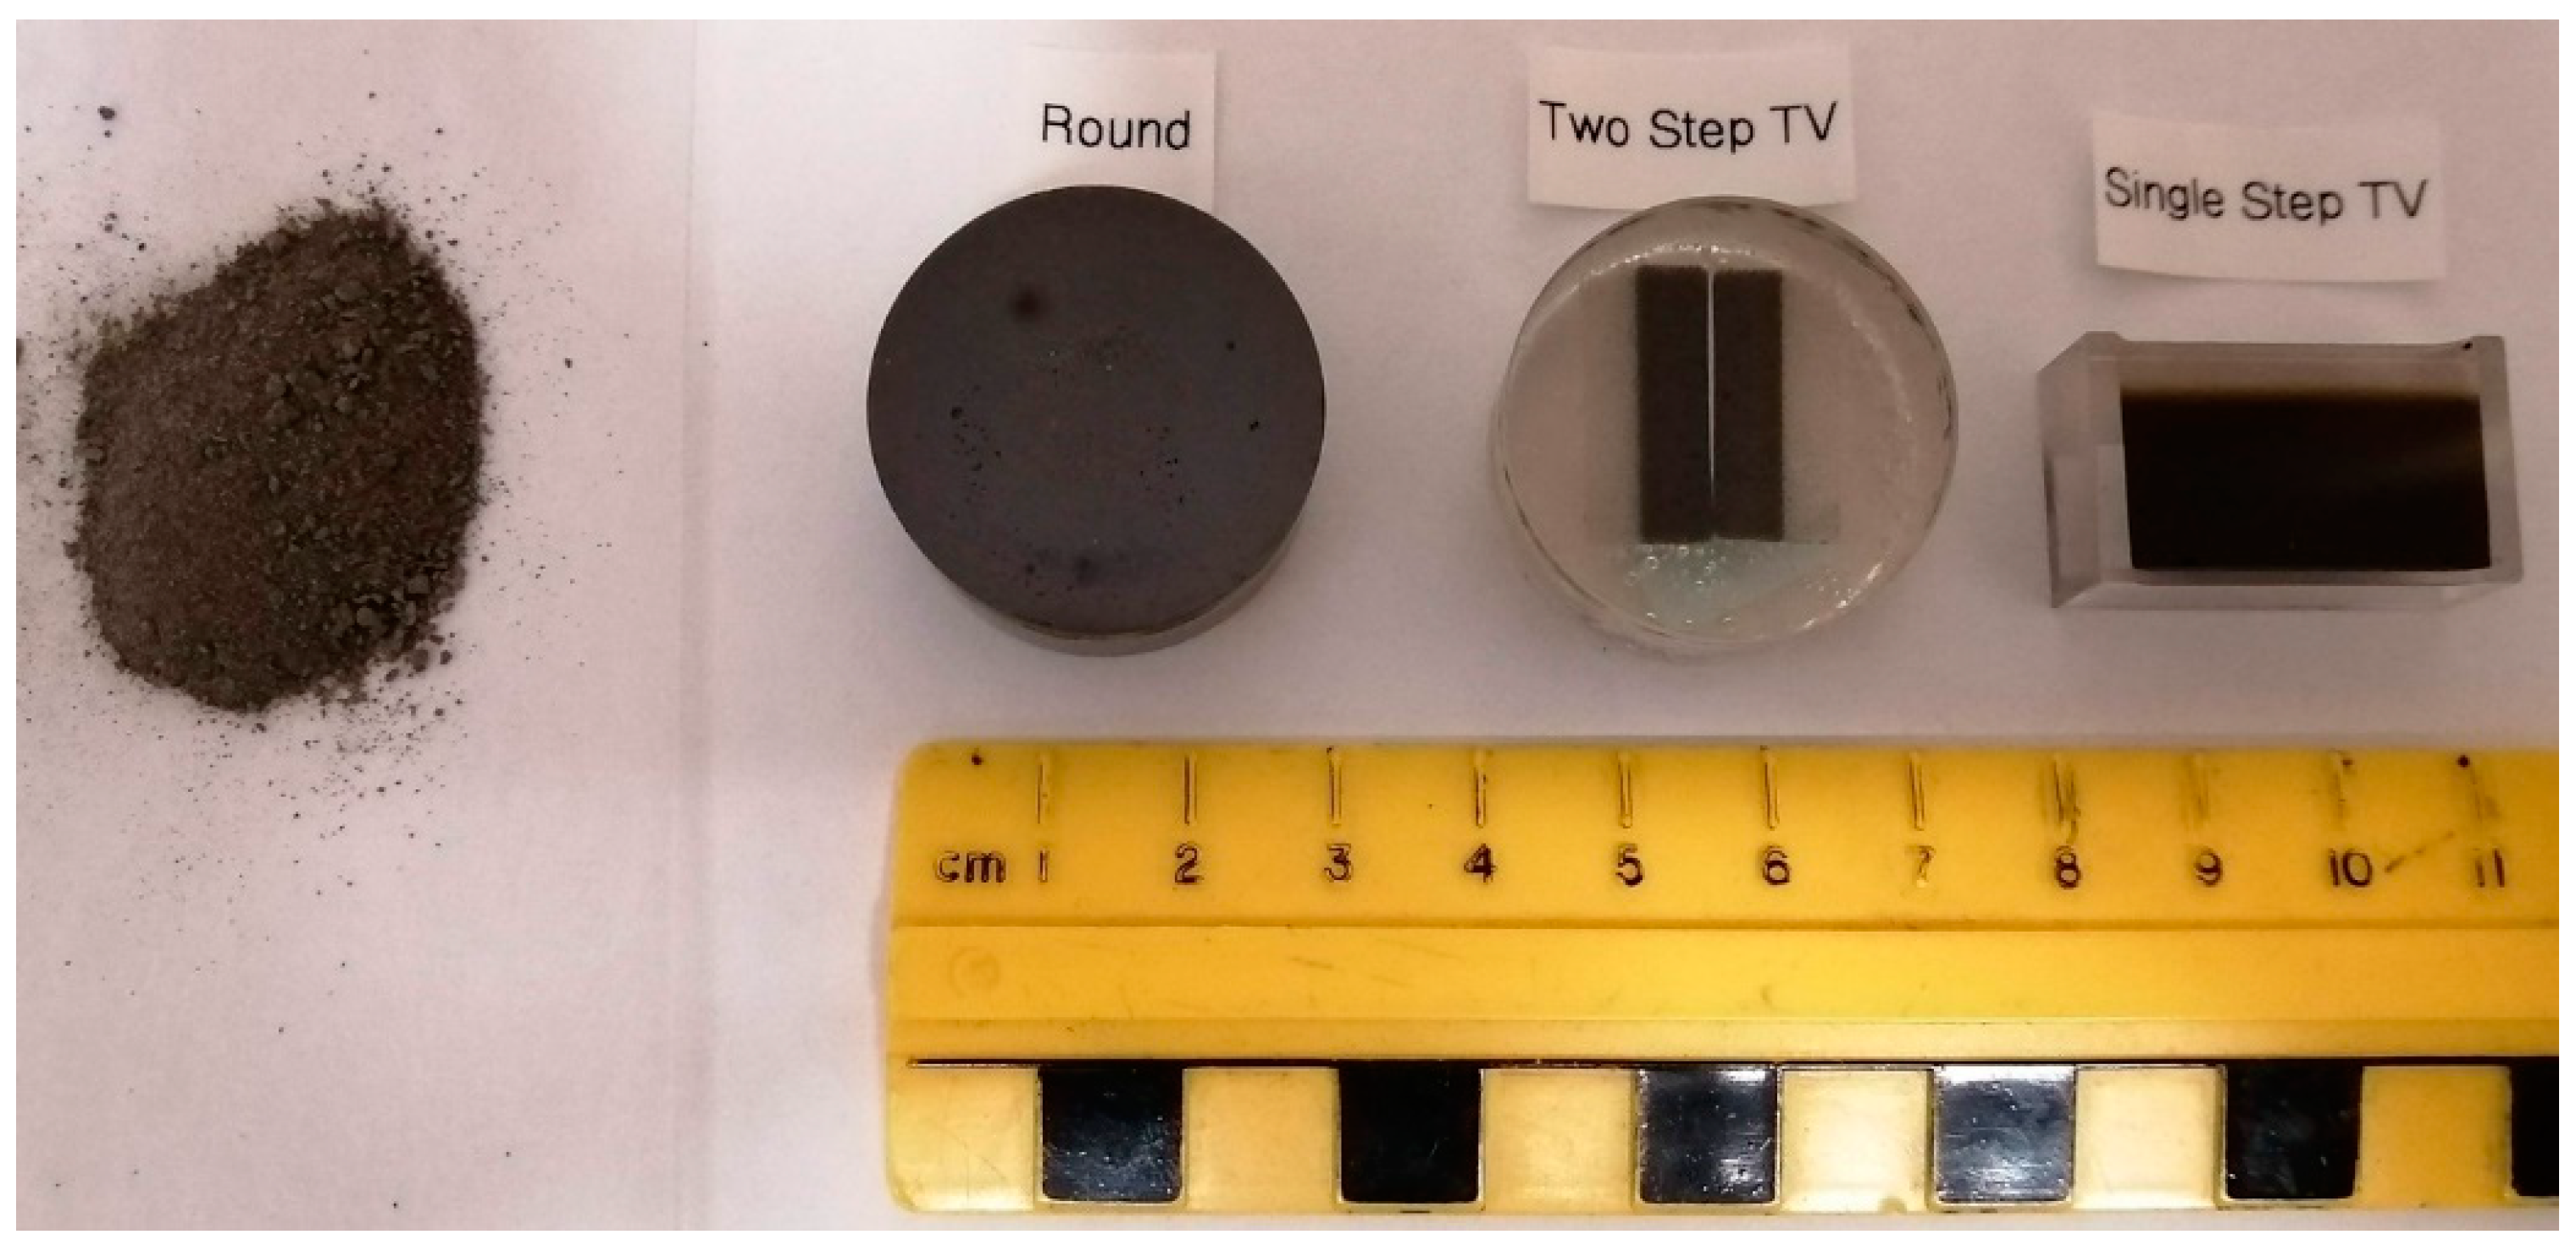
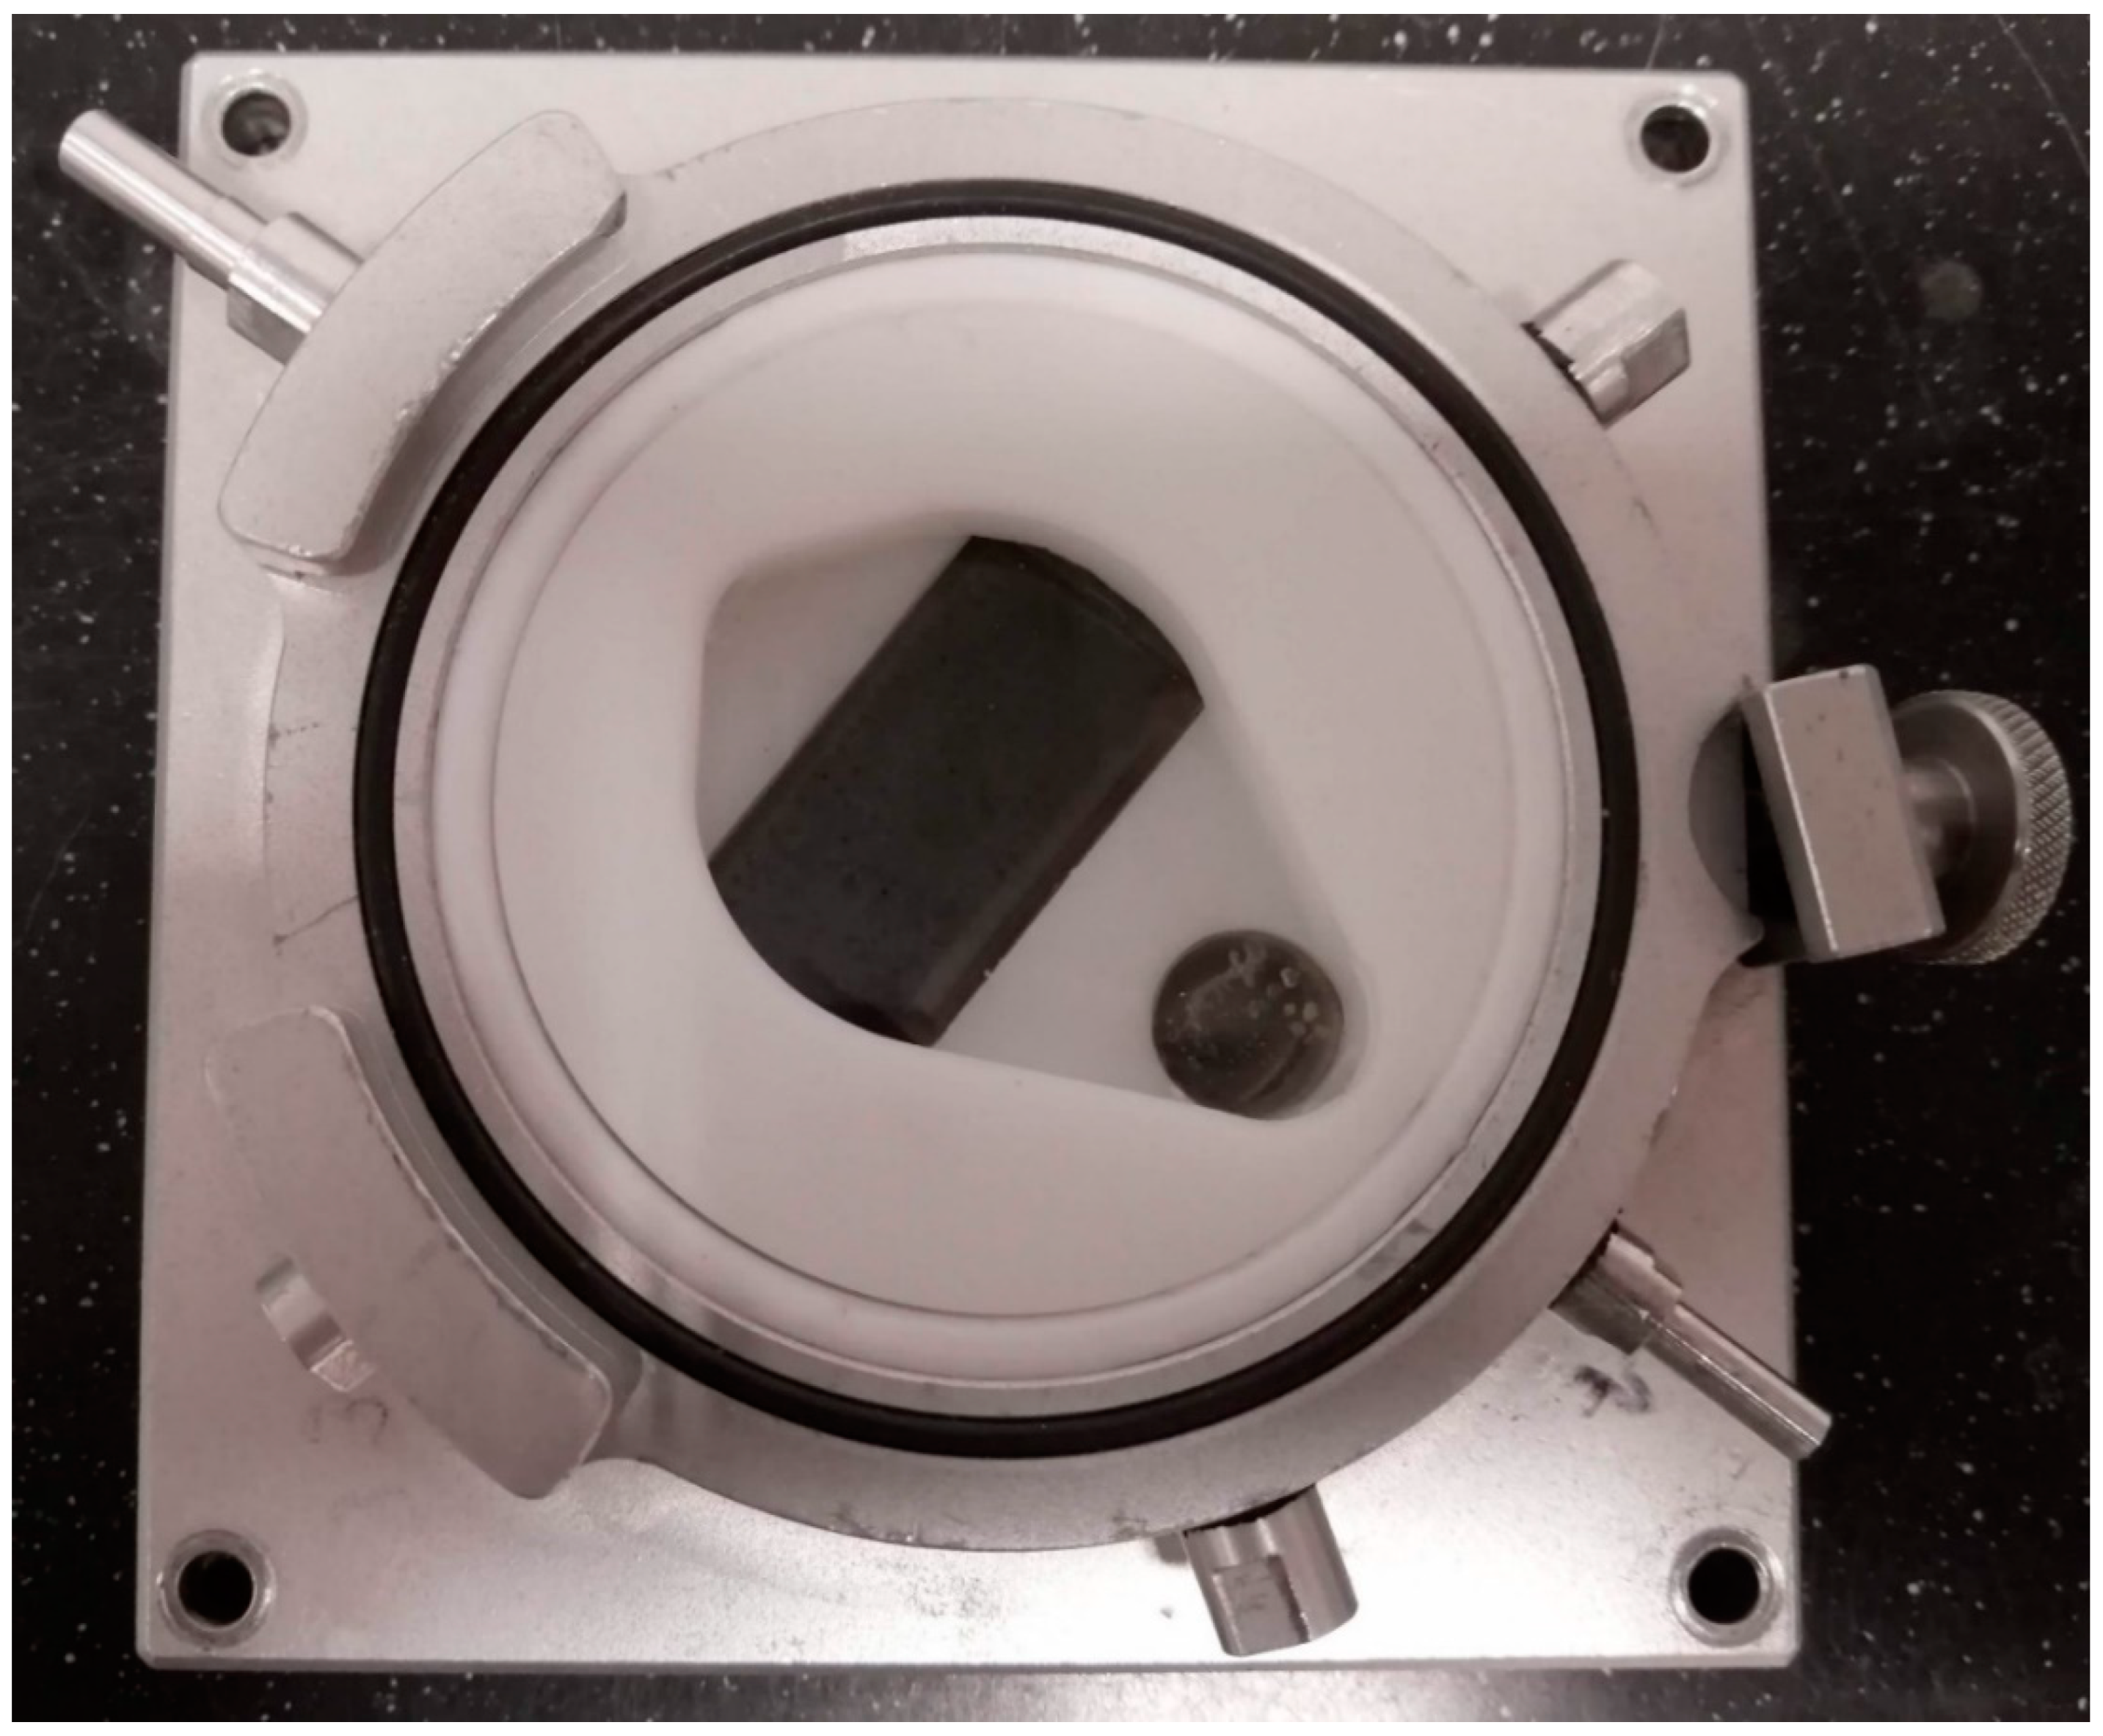
2.1. Sample Preparation

Preparation for MLA analysis of the cutting samples used in this study involved multiple steps. First, the sample material was lightly crushed using a mortar and pestle to break up clumps of sample material and barite drilling mud, but not to disaggregate rock material. This lightly crushed material was then washed with soap and water to remove the barite drilling mud. After washing, the sample material was wet sieved into three size fractions: <75 µm, 75 < x < 180 µm, and >180 µm and subsequently dried under a heat lamp.
The target size fraction for this type of analysis is the 75–180 µm fraction. For each sample, this fraction was representatively split using automatic rifflers until optimum sample weights of 1 to 5 g per separate were produced for each mould type.
For this comparative study, sample moulds were produced in three different manners (Figure 1). A traditional round puck (left) was created by adding approximately 5 g of sample material to a 30 mm wide mounting cup, into which Struers Epofix epoxy was added and stirred with a toothpick. The sample was then allowed to cure overnight. A two-step 30 mm trans-vertical mould (middle) was produced by adding 5 g of material to a cap plug cast, and allowing it to cure overnight. The subsequent day, a trans-vertical section was cut from the mould using an Allied High-Tech rock saw; two of these slices were mounted side by side in a 30 mm-in-diameter mounting cup. Finally, a single-step trans-vertical mould (right) was produced by adding approximately 1 g of material into the narrow slit of a custom mould. Epoxy was added to this sample, and it was stirred with a toothpick prior to curing. This sample was cut length-wise to allow for any potential density-stratified section to be revealed, and this custom sample was polished as per Grant et al., 2016 [7]. Six samples were mounted using each these three methods and analysed by SEM-MLA, for a total of eighteen analyses.

2.2. Scanning Electron Microscope Instrument Parameters

Mineral liberation analysis was performed on a FEI MLA 650 field emission gun (FEG) scanning electron microscope. MLA software version 3.1.4.683 was used for the analysis in extended backscattered electron (XBSE) mode. Instrument settings included 800 dpi frame resolution, a horizontal field width (HFW) of 1.5 mm, 10 nA beam current, a working distance of 13.5 mm, 16 µs BSE dwell time, 12 ms spectral dwell time, and 25 kV high voltage. The EDX detectors of the instrument were calibrated on a copper standard prior to analysis, with the brightness/contrast set as black for epoxy (grayscale of 0) and white for copper (grayscale of 256). With both the two-step and single-step trans-vertical moulds, the entire sample area was analysed by the MLA technique.

2.3. Laser Ablation ICP-MS

The MLA can identify and map minerals in the cuttings sample mould, from which radiogenic ages can be determined by LA-ICP-MS analytical techniques. The most important of these minerals is zircon (ZrSiO4), which has become the standard mineral for detrital mineral dating and is readily mapped by MLA (cf. [12]). The co-ordinates of zircon grains in the cutting samples from this study were digitally recorded such that a given sample could then be placed in the LA-ICP-MS instrument, and using the recorded co-ordinates, a specific zircon grain could be located and analysed. Only zircon grains suitable for analysis by LA-ICP-MS were mapped, and these were unbroken and unaltered grains that were at least 30 µm in diameter; the minimum ablation beam diameter for LA is 30 µm.
To facilitate the ability to locate x,y coordinates of zircons and other mineral species, a specially designed holder was created for the LA-ICP-MS unit at Memorial University. The holder was created by the Technical Services department at Memorial University (Figure 2) and meant to hold the single-step trans-vertical mould.
The LA-ICP-MS laboratory consists of a Thermo-Scientific ELEMENT XR magnetic sector, single-collector ICP-MS coupled with a Lambda Physik ComPex Pro 110 ArF excimer GeoLas laser ablation system operating at a wavelength of 193 nm and a pulse width of 20 ns. Standard reference materials were used for calibration and fractionation corrections.

3. Results

3.1. MLA Results

Table 1 illustrates the modal mineralogy results for one of the six samples (sample 2) as a representative analysis. When working with SEMs, relative mineral density and brightness are often displayed as a Z value, where Z is the mean atomic number. For an example of a mineral with a low Z value, quartz (Z = 10.8) is measured as 66.73 ± 0.13 wt % in the traditional round mould, which increases to 69.02 ± 0.18 wt% when measured in the single step trans-vertical mould. In an opposing manner, several minerals in this material with a high Z values, such as siderite (Z = 16.5), ilmenite (Z = 19.0) and magnetite (Z = 21.0), define modal abundances, which decrease by 50% or more when analysed in a trans-vertical mould, proving density settles in the 30 mm-in-diameter grain mounts. The Z values for these minerals are taken from Table 4.1 in Reed [13].
Table 2 lists the MLA calculated assay results for each of the three sample prep method. The elemental assay values for the both the two-step and single-step trans-vertical mould align well with the standard mounting method.
The single-step trans-vertical moulds have the extra advantages of being made in half the time of two-step trans-vertical moulds, requiring much less consumables to polish [7] and can also be placed in a modified holder that allows for at least 26 samples to easily fit in the SEM chamber for a single automated analysis [14]. This greatly increases the throughput of this valuable instrumentation.

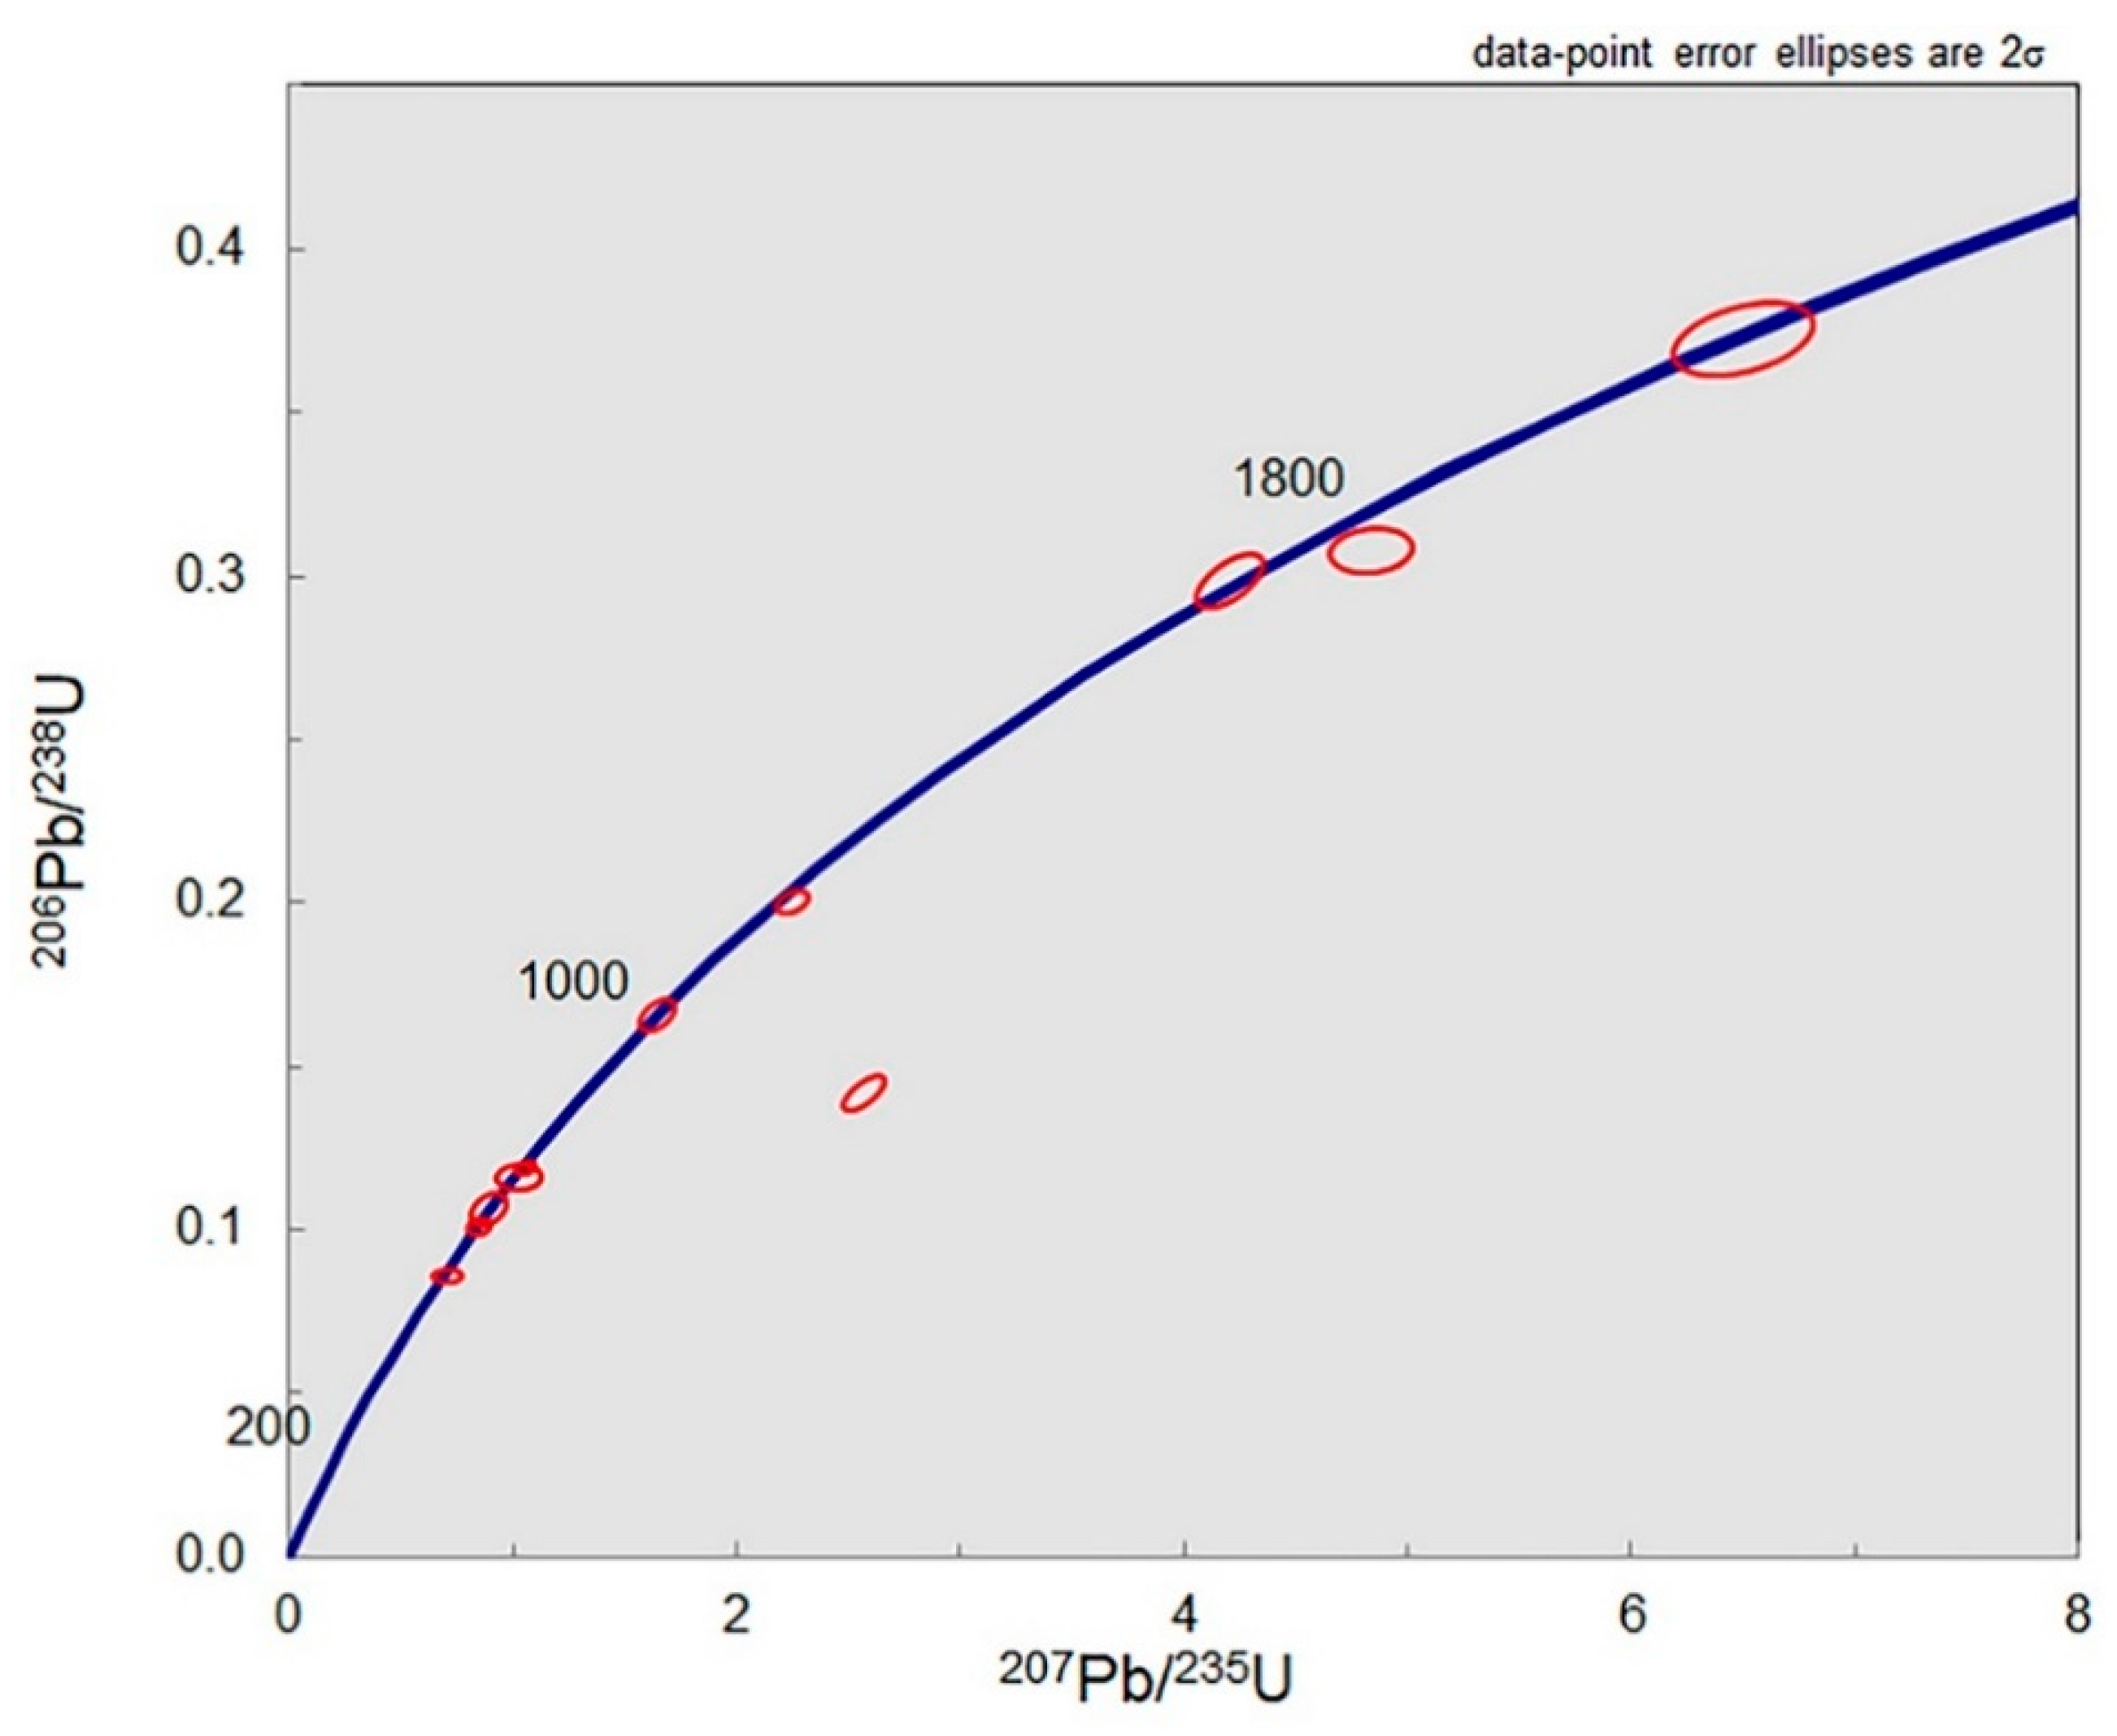
3.2. LA-ICP-MS Results

The MLA identified a range in the numbers of dateable zircons in different samples. The best sample in terms of suitable zircons was Sample 4. Eleven zircon grains of suitable size were mapped in the single step mount of Sample 4 and were analysed by LA-ICP-MS. Ages and 2-sigma uncertainties were calculated from the corrected 207Pb/206Pb, 207Pb/235U and 206Pb/238U ratios and the data were reduced using Iolite 2.5 software [15]. A Concordia diagram (Figure 3) was produced from the Isoplot/Ex3.75macro program [16]. U-Pb age results are displayed in Table 3. While this single dataset is too small to be a robust detrital zircon dataset, most of the grains are concordant and it demonstrates the utility of combining SEM-MLA and LA-ICP-MS analysis using the single step trans-vertical mounting method.
One of the advantages in analysing these samples with single-step trans-vertical moulds is that a “North position arrow” is not required. When using the circular moulds, it is necessary to take at least two reference images from opposing corners to generate the x,y coordinate spreadsheet used to translate coordinates from the SEM platform used for MLA to another analytical instrument, such as EPMA or LA-ICP-MS. These must be supplemented by an arrow to ensure appropriate orientation in the LA-ICP-MS. The round samples can rotate, and thus reference images are needed to ensure that the moulds are placed into the other instrument in the same orientation that they were imaged in the SEM. However, as the cell holder used for the TV moulds is perfectly rectangular, this is a nearly “perfect fit” and it is very easy to locate the top right and bottom left corners. This saves time that is used to take images prior to MLA, as well as the time needed to set up each sample prior to LA-ICP-MS.

4. Conclusions

SEM-MLA is a fast and accurate tool for identifying modal percentages of minerals in a sample. This method was used to analyse offshore well drill-cuttings with single-step trans-vertical moulds. This is a superior sample preparation method, which removes the analytical bias associated with scanning the typical density-stratified sample. This sample preparation method increases the throughput of the instrument, while enabling easier and more reproducible sample preparation. Additionally, the sample preparation method presented in this study allowed typically difficult samples, like drill-cuttings, to be analysed with relative ease. This study demonstrated that a modified cell holder was made for LA-ICP-MS and zircon grains found during MLA were then subsequently age-dated. This sample preparation technique offers many advantages with no appreciable disadvantage.

Author Contributions

Conceptualisation, methodology and software: D.G., D.J.G. and D.W. Original draft preparation: D.G. Writing, review and editing: D.G., D.J.G. and D.W. All authors have read and agreed to the published version of the manuscript.

Funding

This research received no external funding.

Acknowledgments

We would like to thank Markus Wälle and Rebecca Lam, CREAIT Network, Memorial University of NL, Canada, for assistance in the Laser Ablation ICP-MS laboratory. We would like to thank the Technical Services department at Memorial University for their assistance in producing the modified holder for of the TV mounts for the LA-ICP-MS lab.

Conflicts of Interest

The authors declare no conflict of interest.

References

  1. Gottlieb, P.; Wilkie, G.; Sutherland, D.; Ho-Tun, E.; Suthers, S.; Perera, K.; Jenkins, B.; Spencer, S.; Butcher, A.; Rayner, J. Using quantitative electron microscopy for process mineralogy applications. JOM 2000, 52, 24–25. [Google Scholar] [CrossRef]
  2. Gu, Y. Automated scanning electron microscope based mineral liberation analyzer. An introduction to JKMRC/FEI mineral liberation analysis. J. Miner. Mater. Charact. Eng. 2003, 2, 33–41. [Google Scholar] [CrossRef]
  3. Jackson, B.; Reid, A.F.; Wittenburg, J.C. Technical note—Rapid production of high quality polished sections for automated image analysis of minerals. Proc. Australas. Inst. Min. Metall. 1984, 289, 93–97. Available online: http://hdl.handle.net/102.100.100/283002?index=1 (accessed on 21 May 2019).
  4. Shaffer, M. Sample preparation methods for image analysis. In Proceedings of the Geometallurgy and Applied Mineralogy, Conference of Mineralogists, Sudbury, ON, Canada, 22 August 2009. [Google Scholar]
  5. Kwitko-Ribeiro, R. New sample preparation developments to minimize mineral segregation in process mineralogy. In Proceedings of the 10th International Congress for Applied Mineralogy (ICAM), Trondheim, Norway, 1–5 August 2011; Broekmans, M., Ed.; Springer: Berlin/Heidelberg, Germany, 2012. [Google Scholar] [CrossRef]
  6. Blaskovich, R.J. Characterizing Waste Rock Using Automated Quantitative Electron Microscopy. Master’s Thesis, The University of British Columbia, Vancouver, BC, Canada, 2013. [Google Scholar]
  7. Grant, D.C.; Goudie, D.J.; Shaffer, M.; Sylvester, P. A single-step trans-vertical epoxy preparation method for maximising throughput of iron-ore samples via SEM-MLA analysis. Appl. Earth Sci. TIMM B 2016, 125, 57–62. [Google Scholar] [CrossRef]
  8. Pooler, R.; Dold, B. Optimization and quality control of automated quantitative mineralogy analysis for acid rock drainage prediction. Minerals 2017, 7, 12. [Google Scholar] [CrossRef] [Green Version]
  9. Wilton, D.H.C.; Winter, L.S. SEM-MLA (Scanning electron microprobe—Mineral liberation analyser) research on indicator minerals in glacial till and stream sediments—An example from the exploration for awaruite in Newfoundland and labrador. In Quantitative Mineralogy and Microanalysis of Sediments and Sedimentary Rocks; Mineralogical Association of Canada Short Course Series; Mineralogical Association of Canada: Quebec, QC, Canada, 2012; Volume 42, pp. 265–283. [Google Scholar]
  10. Sylvester, P.J. Use of the mineral liberation analyzer (MLA) for mineralogical studies of sediments and sedimentary rocks. In Mineralogical Association of Canada Short Course 42; Memorial University: St. John’s, NL, Canada, 2012; Volume 1, pp. 1–16. [Google Scholar]
  11. Wilton, D.H.C.; Feely, M.; Costanzo, A.; Hunt, J.; Norris, D. MLA-SEM analysis of well cuttings from Newfoundland and labrador offshore basins. In Proceedings of the Conjugate Margins Conference 2018, Halifax, NS, Cannada, 19–22 August 2018; Dalhousie University Basin and Reservoir Lab: Halifax, NS, Cannada, 2019. Volume Extended Abstracts. pp. 182–191. [Google Scholar]
  12. Scott, M.; Sylvester, P.J.; Wilton, D.H.C. A provenance study of upper jurassic hydrocarbon source rocks of the flemish pass basin and central ridge, offshore Newfoundland, Canada. Minerals 2021, 11, 265. [Google Scholar] [CrossRef]
  13. Reed, S.J.B. Electron Microprobe Analysis and Scanning Electron Microscopy in Geology; Cambridge University Press: Cambridge, UK, 2005; pp. 55–60. [Google Scholar]
  14. Grant, D.C.; Goudie, D.J.; Baird, E. Analysis of 98 individual—200 mesh iron ore samples in a single scanning electron microscope-automated mineralogy session. Appl. Earth Sci. TIMM B 2018, 127, 38–43. [Google Scholar] [CrossRef]
  15. Paton, C.; Hellstrom, J.; Paul, B.; Woodhead, J.; Hergt, J. Iolite: Freeware for the visualisation and processing of mass spectrometric data. J. Anal. At. Spectrom. 2011, 26, 2508–2518. [Google Scholar] [CrossRef]
  16. Ludwig, K.R. User’s Manual for isoplot 3.00, a geochronological toolkit for microsoft excel berkeley geochronol. Cent. Spec. Publ. 2003, 4, 70. [Google Scholar]
Figure 1. Raw sample material alongside the three cast methods.
Minerals 12 00337 g001
Figure 2. Custom laser ablation cell for analysing rectangular trans-vertical MLA mounts.
Minerals 12 00337 g002
Figure 3. U-Pb Concordia diagram for zircon grains from Sample 4.
Minerals 12 00337 g003
Table 1. Modal mineralogy of sample 2 via SEM-MLA analysis (XBSE; extended backscattered electron mode) with three different methods of sample preparation (n = 3 replicates for each analysis).
MineralStandard 30 mm Sample30 mm Two-Step TV SampleSingle-Step TV Sample
wt% Avgwt% S.D.wt% Avgwt% S.D.wt% Avgwt% S.D.
Quartz66.730.1367.830.1569.020.18
Calcite18.460.1718.670.1418.240.09
Orthoclase4.300.134.090.094.110.08
Muscovite1.540.041.260.051.060.02
Albite1.380.051.370.031.310.07
Biotite1.250.031.320.061.030.07
Chlorit-Fe1.150.041.140.070.860.11
Siderite0.850.030.610.040.500.03
Illite0.800.030.740.010.840.04
Lévyne (Ca)0.480.010.390.040.460.02
Vesuvianite0.360.040.230.020.230.01
Pyrite0.360.040.350.050.280.03
Ilmenite0.310.010.210.020.110.01
Organic0.270.020.180.020.310.00
Rutile0.260.030.250.020.150.02
Chlorite0.220.020.210.020.140.02
Magnetite0.190.020.090.030.090.01
Diopside0.150.020.120.030.080.02
Table 2. Comparison of MLA calculated assay for sample 2 across the sample prep methods.
ElementStandard 30 mm Sample30 mm Two-Step TV SampleSingle-Step TV Sample
Al1.321.211.14
Ba0.010.010.01
C2.602.532.58
Ca7.637.667.62
F0.020.020.02
Fe1.451.291.29
H0.050.050.04
K0.920.860.82
Mg0.320.310.29
Na0.160.140.14
O50.8450.9950.94
P0.010.010.02
Pb0.000.000.01
S0.190.190.24
Si34.1334.4434.56
Ti0.270.240.22
Zn0.020.010.01
Table 3. Comparison of MLA calculated assay for sample 2 across the sample prep methods.
Sample 4 New TV207Pb/235U Age (Ma)2SE206Pb/238U Age (Ma)2SE
Zircon Grain #11640 rim9832498824
Zircon Grain #11640 core119217117714
Zircon Grain #155135342853011
Zircon Grain #19066204235203943
Zircon Grain #262566383365023
Zircon Grain #26854178526172928
Zircon Grain #289326232162011
Zircon Grain #309617281672310
Zircon Grain #3949212922585326
Zircon Grain #460747064170618
Zircon Grain #48570167122168335
Publisher’s Note: MDPI stays neutral with regard to jurisdictional claims in published maps and institutional affiliations.

