1. Introduction
The final step of the open nuclear fuel cycle is the final radioactive waste disposal. Considering the time span, some radionuclides require to decay to their natural levels, which requires a properly selected design of the disposal system to protect the environment and humans for hundreds of thousands of years. Approaching the construction of the first geological repository for highly radioactive waste in the world, the understanding and predictability of the behavior of engineered barrier material becomes more important than ever. For example, the radioactive waste management organization (WMO), Posiva Oy in Finland, was granted a construction license for a spent nuclear fuel encapsulation plant and final disposal facility at Olkiluoto by the Finnish government in 2015 [
1]. The facility is under construction now. By the end of 2021, Posiva Oy submitted the license application for the operation of the encapsulation and final disposal facility [
2]. Sweden and France are the countries where the license application for the deep geological repository (DGR) construction has been prepared by their national waste management organizations (SKB and ANDRA, respectively) and are under regulatory review.
Each engineered barrier considered in the disposal concept has a predefined function (or functions) to contribute to the overall safety of the facility. The overall safety will be ensured by assigning multiple safety functions. The main, and widely acknowledged key safety functions, are containment, isolation, and retardation, as defined in the IAEA document [
3]. Depending on the predefined function, the barrier material characteristics or features that help to fulfill the assigned function are identified. These characteristics or features are named performance indicators/criteria/target properties, and are to be followed by some detailed technical requirements [
4], design requirements, system requirements [
5,
6], etc. Consider the following example of a bentonite. In the SKB KBS-3 concept, the bentonite barrier was assigned several functions, and the limitation of advective mass transfer is one of them. The performance target for diffusive transport is a hydraulic conductivity of <10
−12 m/s. Accordingly, there is a technical requirement for an emplaced barrier to have a minimum value, leading to a hydraulic conductivity of less than 10
−12 m/s. This then led to the research and testing of the relationship between the dry density (or porosity) and material hydraulic conductivity of MX-80 [
7,
8,
9,
10,
11,
12,
13,
14]. Besides, the minimum dry density, yielding a swelling pressure of >3 MPa, is also a technical requirement in the KBS-3 concept, and this density will contribute to the barrier function, in order to keep the canister in position [
4]. Such technical requirements have led to the investigations of relationship between dry density and swelling pressure [
12,
15]. For bentonite materials, the swelling pressure, due to hydration under constant volume conditions, has been reported to increase with dry density in an exponential form [
9,
10,
14,
15]. According to [
15], the empirical relationship between the dry density
[Mg/m
3] and final swelling pressure
(MPa) for MX-80 bentonite is:
On the other hand, the maximum dry density should be so that a swelling pressure should not exceed 10 MPa. In order to avoid the impact of mechanical load on the canister, a dense enough barrier will limit the microbial activity, too [
4]. The previously given example indicates the high importance of the barrier material density, once it is emplaced in the repository. During the emplacement, technological gaps and voids could not be avoided. Therefore, the adequate understanding and knowledge of barrier density evolution in space and time forms a basis for the justification of the disposal concept and safety, among the other factors.
The research and development activities have been performed, since the consideration of geological disposal has started in different countries. While most of the research focused on such aspects as temperature effect [
16,
17], liquid/gas flow properties [
18,
19,
20], mechanical [
10,
21], or chemical [
22,
23] aspects, not much has been done considering barrier density distribution, in relation to emplacement and its further evolution, in contact with groundwater. The lack of such research has been acknowledged, and the European Commission H2020 programme project BEACON (Bentonite Mechanical Evolution) started in 2017 [
24]. The objective of the project is to develop the understanding of fundamental processes that lead to bentonite homogenization and improve the capabilities of the numerical models predicting those processes. As noted in [
24], the sufficient prediction of the swelling and homogenization process of bentonite material remains challenging, from a conceptual and a numerical point of view. New experiments, with different bentonite materials, have been planned in the project to support the development of numerical models. It is important to note that the material quite commonly considered for future repositories (MX-80 type bentonite) has been investigated experimentally and numerically within this project, among the other bentonites.
A number of numerical models, of different complexities, have been developed, starting with one phase or multiphase flow equations, coupled with the equation of motion in mechanics. The later are derived with different assumptions about material behavior under external stress and range from the assumption of linear and isotropic [
25,
26] or non-linear elastic properties [
13,
26,
27,
28] to more complex models, considering elasto-plastic strains [
28,
29], or models based on hypoplasticity [
30], from which the Barcelona basic model [
31] or the Barcelona expansive model [
32,
33,
34] are the most known ones. Despite the increasing complexity and number of parameters to be calibrated consequently, relatively simplified models are still being developed and tested for further analysis. Simplified models could be useful, if there is an interest in the macroscopic elastic volumetric behavior or the swelling pressure of bentonite-based barriers under fully saturated conditions. The acknowledgement of relevance of coupled and highly nonlinear thermal, hydraulic, mechanical, etc., processes is increasing, and more researchers focus on this complex topic.
The Lithuanian Energy Institute (LEI) participates in the modeling activities, within the BEACON project. The efforts have been focused on developing a non-linear elastic hydro-mechanical model, capable of representing the hydro-mechanical behavior of bentonite, when in contact with water. The mathematical model has been implemented in COMSOL Multiphysics (version 5.6, COMSOL, Inc., Burlington, MA 01803, USA) and tested against experiments performed by the project partners. Some of the modeling results of Febex type bentonite behavior under hydration were analyzed and compared with experimental results in [
35]. In this paper, the modeling results of the hydro-mechanical behavior of the granular MX-80 bentonite form are presented and validated by high-pressure oedometer experiments, performed by EPFL [
36].
2. Methodology
This study focused on the numerical analysis of the hydro-mechanical behavior of an MX-80 type granular bentonite sample, at the laboratory scale. The hydromechanical behavior of compacted bentonite was analyzed under different conditions: hydration with groundwater under confined volume conditions and hydration under free swelling conditions and subsequent mechanical loading. The experiments were performed in a high-pressure odeometer, within the EC H2020 BEACON project. These experiments focused on the influence of two different hydro-mechanical (HM) stress paths on the final state of granular MX-80 bentonite [
36].
As it is described in [
36], all samples were initially prepared by pouring the granular material in the oedometric ring. The ring was of 12.5 mm height, with a diameter of 35.0 mm. The dry density of the sample ranged from 1480 to 1500 kg/m
3, and the corresponding values of void ratio were in the range of 0.83–0.85. This ring was placed into a high-rigidity, stainless-steel cylindrical cell. Hydration with deaerated, deionized water took place through drainage plates at the top and bottom of the oedometer cell. Water pressure was kept constant (20 kPa) in all stages of the experiments. Pore size distribution, basic properties of MX-80 bentonite, and more detailed information on experimental setup are given in [
36,
37]. Two experiments (stress paths) were followed, with the following stages (
Figure 1):
Path AB’C’: hydration with water in confined volume conditions and axial swelling pressure was measured. During the subsequent compression stage, vertical stress increased, in steps, up to 20 MPa.
Path ABCD: hydration with water under constant vertical stress of 21 kPa. During the subsequent compression stage, vertical stress increased, in steps, up to 20 MPa.
Analysis was based on the numerical solution of partial differential equations describing coupled processes, such as water flow in porous media and mechanical deformations, induced by clay particles swelling. Hydration-induced swelling was modeled as elastic strain, and its impact on porosity change was assessed. Increasing stiffness, in case of the compression under high stress, was represented by the functional relationship with the void ratio. Plastic deformations of bentonite were not considered in the current formulation. Material-specific constitutive relationships, such as the water retention curve, were considered in the model formulation. Mechanical deformations have an influence on material porosity and, therefore, impact the water mass balance, too. Water flow-related parameters (specific moisture capacity, storage coefficient, and permeability) were prescribed as a function of porosity and, thus, were updated during the simulation. The non-linear, elastic HM model formulation was implemented in a platform for numerical simulations (COMSOL Multiphysics). The comparison of the modeling and experimental results, as well as the discussion, is presented in
Section 3 of this paper.
2.1. Mathematical Model
2.1.1. Flow Model
Hydration with water of an initially unsaturated material was represented with a partial differential equation for the mass balance of water, considering the pressure of the liquid phase, as the main variable, and assuming that the pore space not filled with water contains immobile air at atmospheric pressure:
where
is the density of water,
Cm is specific moisture capacity,
g is the acceleration of gravity,
Se is the effective saturation,
S is the storage coefficient,
pl is the dependent variable (pressure of water),
ks is absolute permeability at saturated conditions,
μ is the dynamic viscosity of water,
kr is relative permeability,
z represents elevation, and
Qm is the fluid source (positive) or sink (negative).
The fluid velocity (Darcy flux) is defined:
Relative permeability is commonly defined as a function of effective saturation [
38,
39]:
or
where
l is the connectivity factor and can be treated as a fitting parameter. The relationship between relative permeability and effective saturation, better representing experimental conditions, is selected. The material of high density has a higher potential to expand. This means that, after contact with water, bentonite particles tend to expand more and quickly, close larger pores/channels, accessible for water transport. In this way, water transport is reduced and could be described by lower permeability, using the van Genuchten relative permeability model (Equation (4)), for example. If hydrating water is pressurized, it is pressed into the largest open pores/channels, moves quickly into the bentonite, and saturates a larger part of the material, in comparison to saturation with not pressurized water or water vapor.
Water saturation (
) or the degree of saturation (when expressed in %) is equal to the fraction of the pore space occupied by water:
Then, the effective (normalized) saturation (
Se) is defined as follows:
where
is the residual volume fraction of a liquid phase in porous media when there is no continuous flow of this phase, and
is a maximal saturated volume fraction of the analysed material. In case
, the effective saturation, mathematically, is equal to water saturation. If all pores are water saturated, then the water saturation is 1, or the degree of saturation is 100%.
2.1.2. Water Retention Model
The difference between the pressure potentials of gas and liquid in unsaturated conditions, caused by the action of capillary and adsorption forces, is called suction (capillary pressure):
Complementing the material-specific constitutive relationship is required for full mathematical model formulation. The so-called water retention curve (WRC) represents the overall saturation state of the material and is often expressed as the relationship between suction and saturation, as well as suction and water content.
A thorough analysis of the EPFL test procedure and measured properties of MX-80 bentonite samples (void ratio, strains, and swelling pressure) showed that the sample void ratio undergoes large changes: from the initial 0.83 to 2.32, in the case of a free swelling step, and decreases to 0.56 after the compression step. The experimentally determined WRC for MX-80 was provided in [
40]. It was difficult to calibrate a water retention model based on basic van Genuchten relation [
38], with parameter
nVG = 1.66 and void ratio dependent air entry pressure, derived in [
40], for confined volume and free swelling conditions. In order to apply the same WRC for the modeling of both paths of the EPFL test, the water retention model, proposed by J.A. Bosch et al. [
41], was analyzed. In their model water ratio,
(ratio of water volume with respect to volume of solids) is described as a sum of two terms. The first one refers to the capillary water ratio (
), as a volume of non-adsorbed water, with respect to the volume of solids; the second term is called the adsorbed water ratio (
) and is expressed as a volume of adsorbed water, with respect to the volume of solids [
41]:
The evolution of the capillary water ratio (
) is described with the expression proposed by van Genuchten:
where
e is a total void ratio,
s is suction, and
nVG is the van Genuchten parameter.
Parameter
is related to air entry pressure (
a), as follows:
The adsorbed water ratio (
) depends on relative humidity,
RH, according to a Freundlich isotherm:
where
is the molecular mass of water,
is water density,
is universal gas constant,
is temperature, and
m is the fitting parameter. With this WRC formulation, water saturation is defined as a ratio of water ratio
and total void ratio
(
).
In current study, the WRC calibration has been done, with the assumption that the maximum absorbed water ratio is a function of void ratio, instead of constant. This assumption is in line with the knowledge that, at highly compacted bentonite (low void ratio), the number of water monolayers in clay platelets is limited, but increasing at a higher sample void ratio. Parameters for WRC, proposed by J. A. Bosch [
41], are presented and compared to the parameters to be used in the current study of the EPFL experiments (
Table 1).
The experimental WRCs and simulated WRCs are presented in
Figure 2. The simulated WRC was in line with the maximum water content (0.85), which would be attained in a sample of large void ratio (2.37), under fully saturated conditions. Based on the consolidation test results, reported in [
15], the corresponding gravimetric water content was 1.55, after sample hydration, under 8 kPa vertical stress. As the final void ratio was 4.26, water saturation was estimated as 99.69%, with the assumption of water density of 1000 kg/m
3. The simulated WRCs, with lower void ratio, were in line with the experimental data presented in [
40].
2.1.3. Swelling Model
It is well-known that a bentonite-based material swells if it comes in contact with water or vapor. Under conditions with no physical restriction for expansion, it will result in a volume change, while, under confined volume conditions, the hydrated material will exert mechanical load against the retaining cell walls. In this study, the mechanical behavior of bentonite was represented using a pure elastic constitutive model, based on generalized Hooke’s law, complemented with hydration (swelling)-induced strain, in analogy with temperature-induced strain, in [
25]:
where
σij is the stress tensor,
are the components of the fourth-order stiffness tensor of material properties,
εkl is the total strain tensor, and
is the swelling strain tensor. This is a conservative representation of strains, without distinguishing whether they are related to changes in microstructure or macrostructure. The interest is the overall behavior of granular MX-80 bentonite under hydration with water and the ability of its representation with averaged estimates, such as water saturation. With an assumption of reversible deformations, material stiffness can be determined by Young’s modulus and Poisson ratio (
ν) in elasticity. Young’s modul (
E) is as follows:
where
K is the bulk modulus. Young’s modulus was assumed to be dependent on the changing void ratio, but it is not allowed to become less than the prescribed minimum value. Such a definition meant to represent overall material behavior, in terms of increased resistance to external load during the compression:
where
A is the fitting parameter,
e is the void ratio, and
Emin is Young’s modulus, corresponding to the minimum bulk modulus. This relationship was assumed to be nonlinear and in need an experimental verification.
The elastic swelling model [
25] was applied to model the EPFL experiments, where the swelling strain was defined as proportional to the change of the effective saturation:
where
βsw is the swelling coefficient for an isotropic material,
n is porosity, Δ
Se is the change in the effective saturation, and
δij is Kronecker-delta. The swelling coefficient should depend on bentonite type, density, sample form, hydrating water composition, experimental conditions (confined volume and unconstrained swelling conditions), etc. It could be related to swelling coefficient,
Cs, that are normally determined from the void ratio e-log (vertical stress) relationship, measured in the oedometer cell. Results from the conventional and high capacity oedometer cells [
15] indicated different swelling coefficients
Cs of granular MX-80 of dry density of 1500 kg/m
3, depending on hydration conditions: 0.12 (hydration under confined volume conditions and subsequent compression) and 0.55 (for hydration under 8 kPa vertical stress and subsequent compression). Considering this, the parameter
βsw was calibrated for the modeling of a particular path and set different (larger) for Path ABCD, in comparison to Path AB’C’.
2.1.4. Porosity Change
With the assumption of the slow deformation of a solid [
42], the porosity change could be evaluated as a function of volumetric strain
εv (
εv =
ε11 +
ε22 +
ε33):
The following relationships between hydro and mechanical processes were considered in the current hydro-mechanical model:
Feedback on water mass balance, through water source/sink, due to change of porosity [
42]:
2.2. Numerical Model
The EPFL experiments (Path AB’C’ and Path ABCD) were simulated with a numerical model, developed in COMSOL Multiphysics (Burlington, MA, USA). COMSOL Multiphysics is a general-purpose platform for modeling a number of various processes and their applications. It contains conventional physics-based user interfaces, as well as interfaces for the definition of partial differential equations by the user. The defined system of partial differential equations is solved with the finite element method.
2.2.1. Geometry and Discretization
The experiments were performed by EPFL in a cell, with an oedometric ring, with a height of 12.5 mm and diameter of 35.0 mm [
36,
37]. Therefore, the dimensions of the modeling domain representing the sample were based on these ring dimensions. The numerical model was set in 2D axisymmetric geometry. The modeling domain was discretized uniformly into 2500 rectangular mesh elements, as presented in
Figure 3.
Hydration, by water, through the top and bottom of the odeometer cell, was represented by the boundary conditions proper for the modeling domain.
2.2.2. Input Parameters
The input parameters used to model the HM behavior of granular MX-80 bentonite are summarized in
Table 2.
2.2.3. Initial and Boundary Conditions
The simulation of water flow, by solving a partial differential equation of water mass balance, requires proper initial and boundary conditions. The hygroscopic water content of the samples was 6% [
36], which corresponds to a 20% degree of saturation of the analyzed samples (the void ratio of 0.85 and specific gravity (SG) of 2.78 for MX-80).
For Path ABCD, the initial water pressure was assigned a value corresponding to the degree of saturation of 20%, based on the water retention curve. No initial stresses and strains were assumed. The constant water pressure of 20 kPa was set on the top and bottom boundary, and no-flow boundary conditions were set to the side of the model domain. For the top boundary, an additional equation (Equation (21) type) was solved for displacement (
), as a function of the difference in average mean stress (
pm) and external load over time (
L(
t)) (Equation (22)).
For the first step (“saturation phase” in confined volume conditions) of Path AB’C’, the initial water pressure was set to correspond to the degree of saturation of 20%, based on the water retention curve. No initial stresses and strains were assumed. The constant water pressure of 20 kPa was set on the top and bottom boundary, and no-flow boundary conditions were set to the side of the model domain. Roller-type boundary conditions were accepted for all boundaries, as no displacements were allowed in normal direction, as well as no friction on the wall. For the second step (“compression phase”), the initial conditions of variables were obtained from the preceding step. The hydraulic boundary conditions were set the same as in step 1. For the top boundary condition, an additional equation was solved for displacement, as a function of the difference in mean stress and external load over time (L(t)) (Equation (22)).
3. Results and Discussion
The section below describes the outcomes of the modeling, which represent transient behavior of the material and its final state. Firstly, the evolution of swelling pressure, saturation, and dry density over time is presented and discussed. Then, the void ratio evolution over vertical stress is described.
3.1. Hydration under Confined Volume Conditions and Subsequent Compression (Path AB’C’)
3.1.1. Swelling Pressure
The hydration of the bentonite material of dry density, considered as a geological repository barrier (>1000 kg/m
3) in confined volume conditions, will lead to the build-up of swelling pressure against the cell walls. The modeled swelling pressure is presented in
Figure 4, together with the experimentally measured vertical stress, reported in [
36,
37].
As
Figure 4 shows, the time of maximum swelling pressure differed for the three samples, under the same hydraulic and mechanical conditions. According to Equation (1), the expected swelling pressure for MX-80 of 1500 kg/m
3 dry density is 3.2 MPa. The modeled swelling pressure (3.14 MPa) was in line with the experimentally measured swelling pressure, particularly of sample P2-2. The measured swelling pressure of sample P2-3 was higher (by ~0.4 MPa) than that of the other two samples. The reason for this higher pressure for sample P2-3 is not clear. The evolution over time is strongly dependent on time dependent water distribution within the material over time. Therefore, material properties, such as permeability, should influence the time for sample full saturation. Taking into account the model formulation for unsaturated material permeability, as a product of relative and intrinsic permeability, the sensitivity analysis of model output to relative permeability models was performed.
The results in
Figure 5 show that the increased connectivity factor
l (3, 6, or 9) in the power law (Equation (5)) leads to slower saturation of the sample and, thus, slower pressure build-up. The van Genuchten relationship for relative permeability led to a very nonlinear dependency, with higher relative permeability values for the samples, approaching a saturation of 100%. The same maximum swelling pressure was achieved with the van Genuchten relationship for relative permeability, but it was observed relatively much later. Thus, the unsaturated permeability evolution law could only partly explain the differences in the swelling pressure evolution of the samples of the same void ratio (particularly in the maximum swelling pressure time of samples P2-1 and P2-2). Different maximums of the experimentally measured swelling pressure of the samples of the same void ratio need a further thorough analysis to exclude uncertainties related to the experimental set-up. While analyzing the laboratory experiments of bentonite hydration in general, some authors pointed out the possibly important roles of friction [
43] and sample preparation, as well [
9]. The current model formulation does not consider the friction between the bentonite sample and the cell walls. Nevertheless, this difference in the final swelling pressure values and transient evolution should be explored in more detail.
3.1.2. Saturation
The swelling pressure development was modeled, as a result of increasing sample saturation with water and subsequent volumetric strain. The degree of saturation driving the deformations is presented in
Figure 6, at different times, for the hydration stage under confined volume conditions.
As
Figure 6 shows, the hydration proceeded uniformly and relatively quickly from the top and bottom, and the saturation from the initial 20% increase to 100%, during 1200 min.
3.1.3. Dry Density
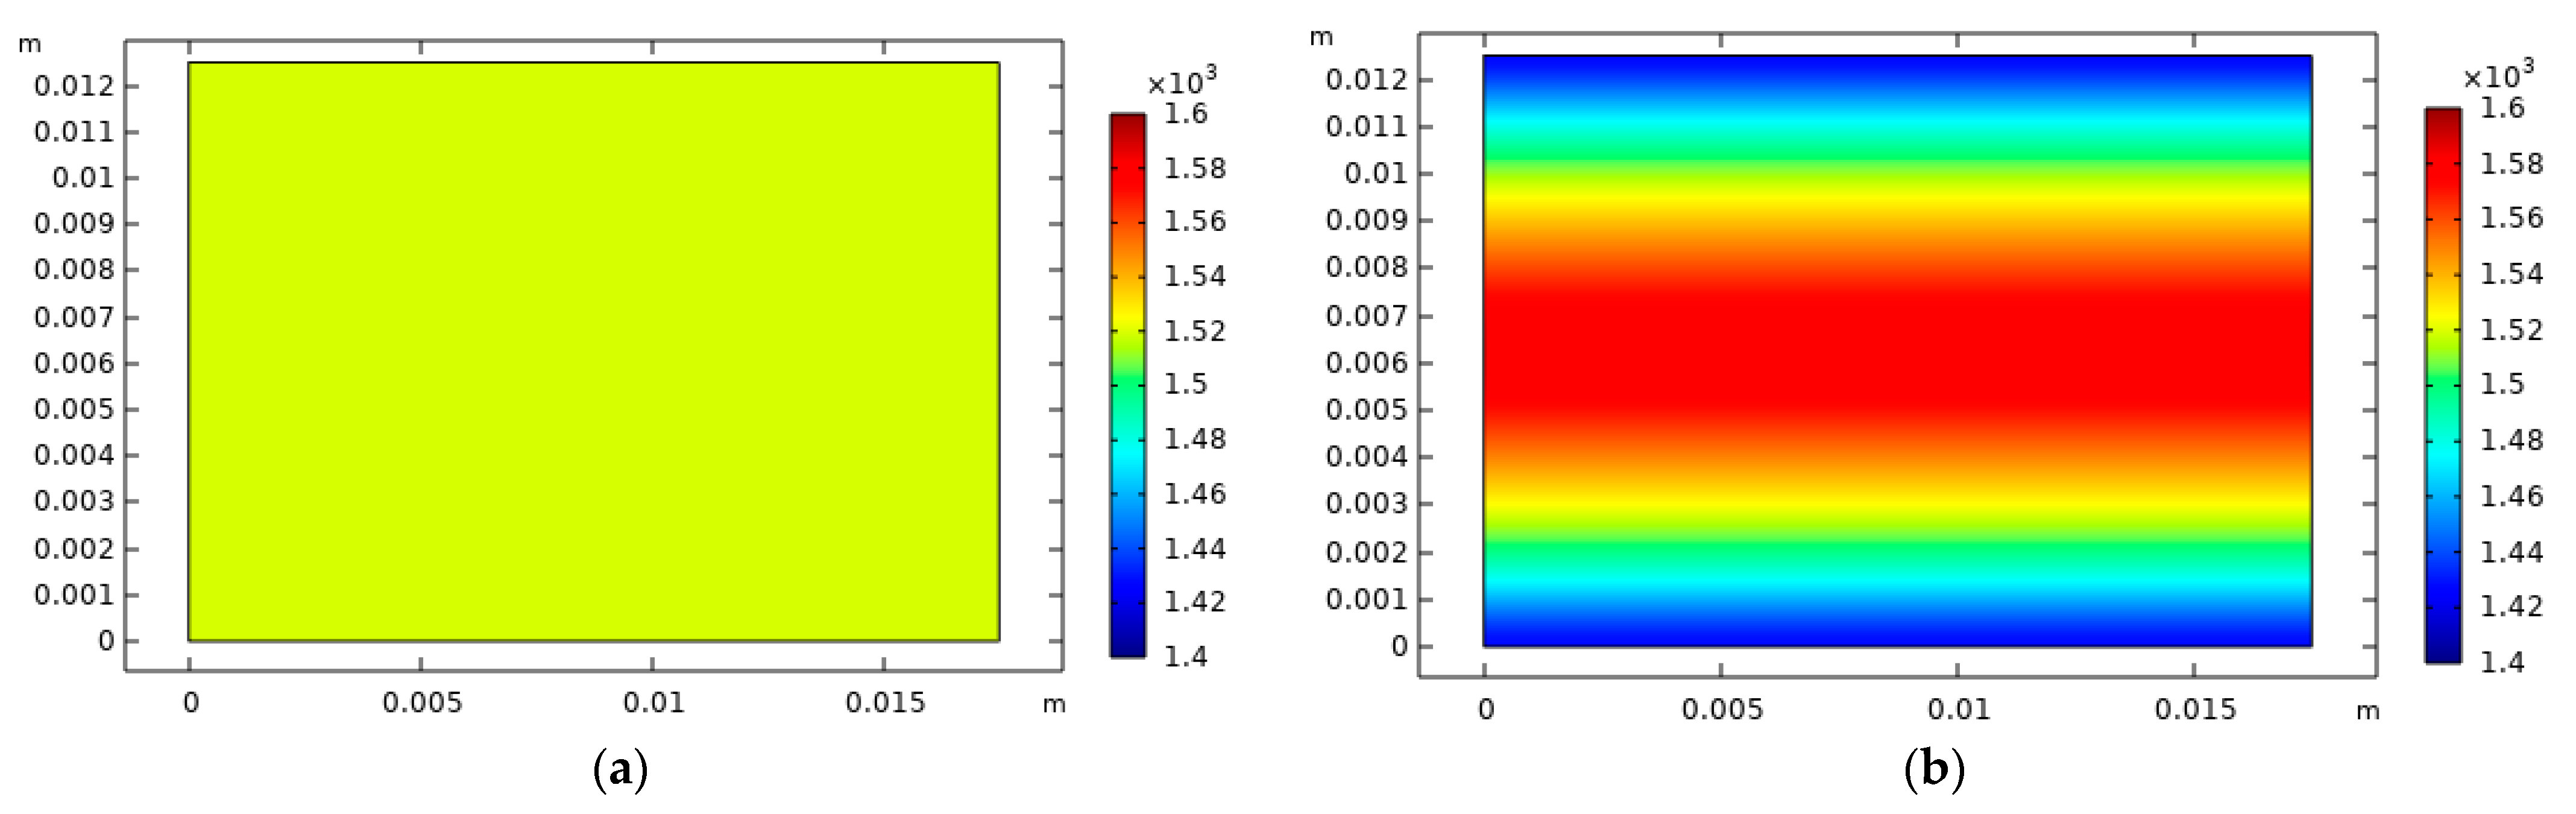
Besides the time of the fully-saturated state and final swelling pressure, dry density is also an important characteristic to be determined. Dry density evolution and distribution over the sample can be derived from porosity distribution and porosity changes, as a result of volumetric strains (Equation (17)). The distribution of dry density at different times during hydration, under confined volume conditions, is presented in
Figure 7.
As can be seen in
Figure 7, the dry density changes homogeneously along the sample. The volumetric expansion took place at the top and bottom, due to hydration, and induced the sample’s compression in the middle part. Once the sample became fully saturated, the modeled sample’s density was uniform again and reached the initial dry density of 1519 kg/m
3.
The final state of the analyzed bentonite can be expressed in different terms (saturation, void ratio, dry density, etc.). The proper dry density of the buffer material will be among other requirements for geological repository barriers, in order to ensure the safety function, predefined to a particular barrier. The spatial distribution of dry density over the sample would allow the assessment of the homogenization level over the sample.
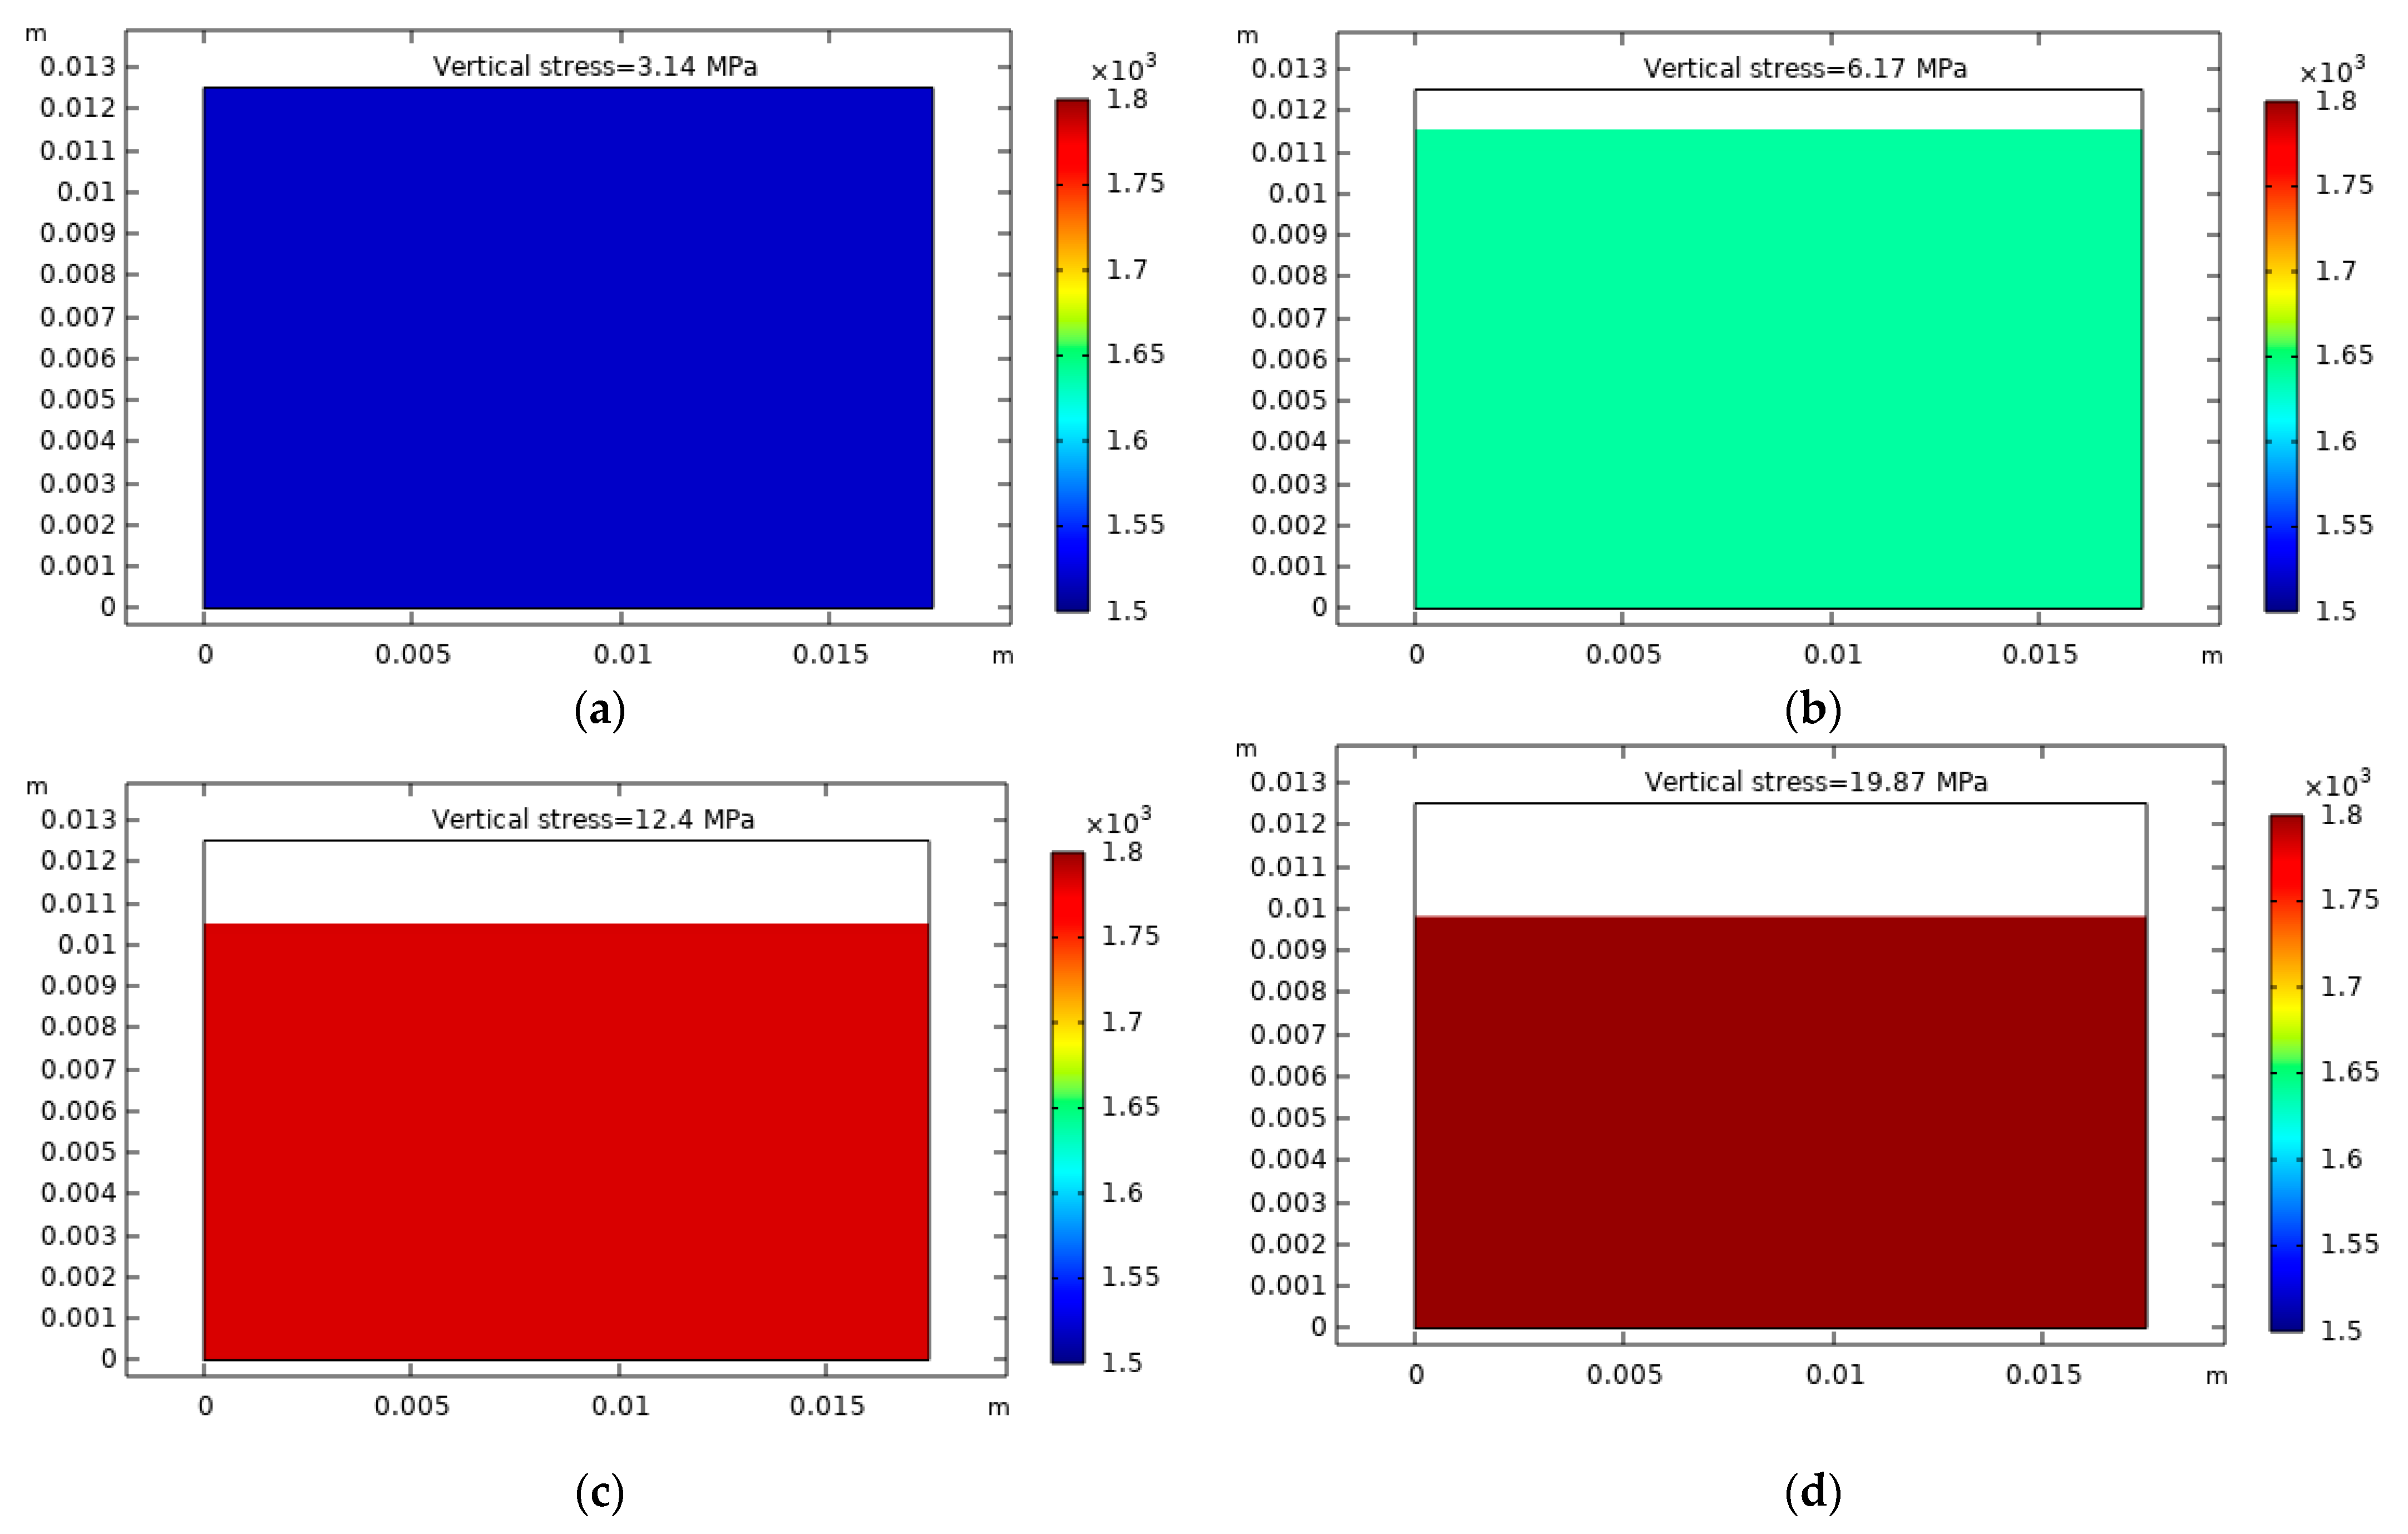
Figure 8 illustrates the modeled dry density distribution within the samples, during the compression stage in Path AB’C’.
Figure 8 shows the modeling results and demonstrates that dry density would be uniformly distributed (fully homogeneous) within the sample during the compression stage of the experiment. The distribution of dry density (or void ratio) over the sample height has not been reported; thus, the modeling results could not be compared to experimental data.
3.2. Hydration under Free Swell Conditions and Subsequent Compression (Path ABCD)
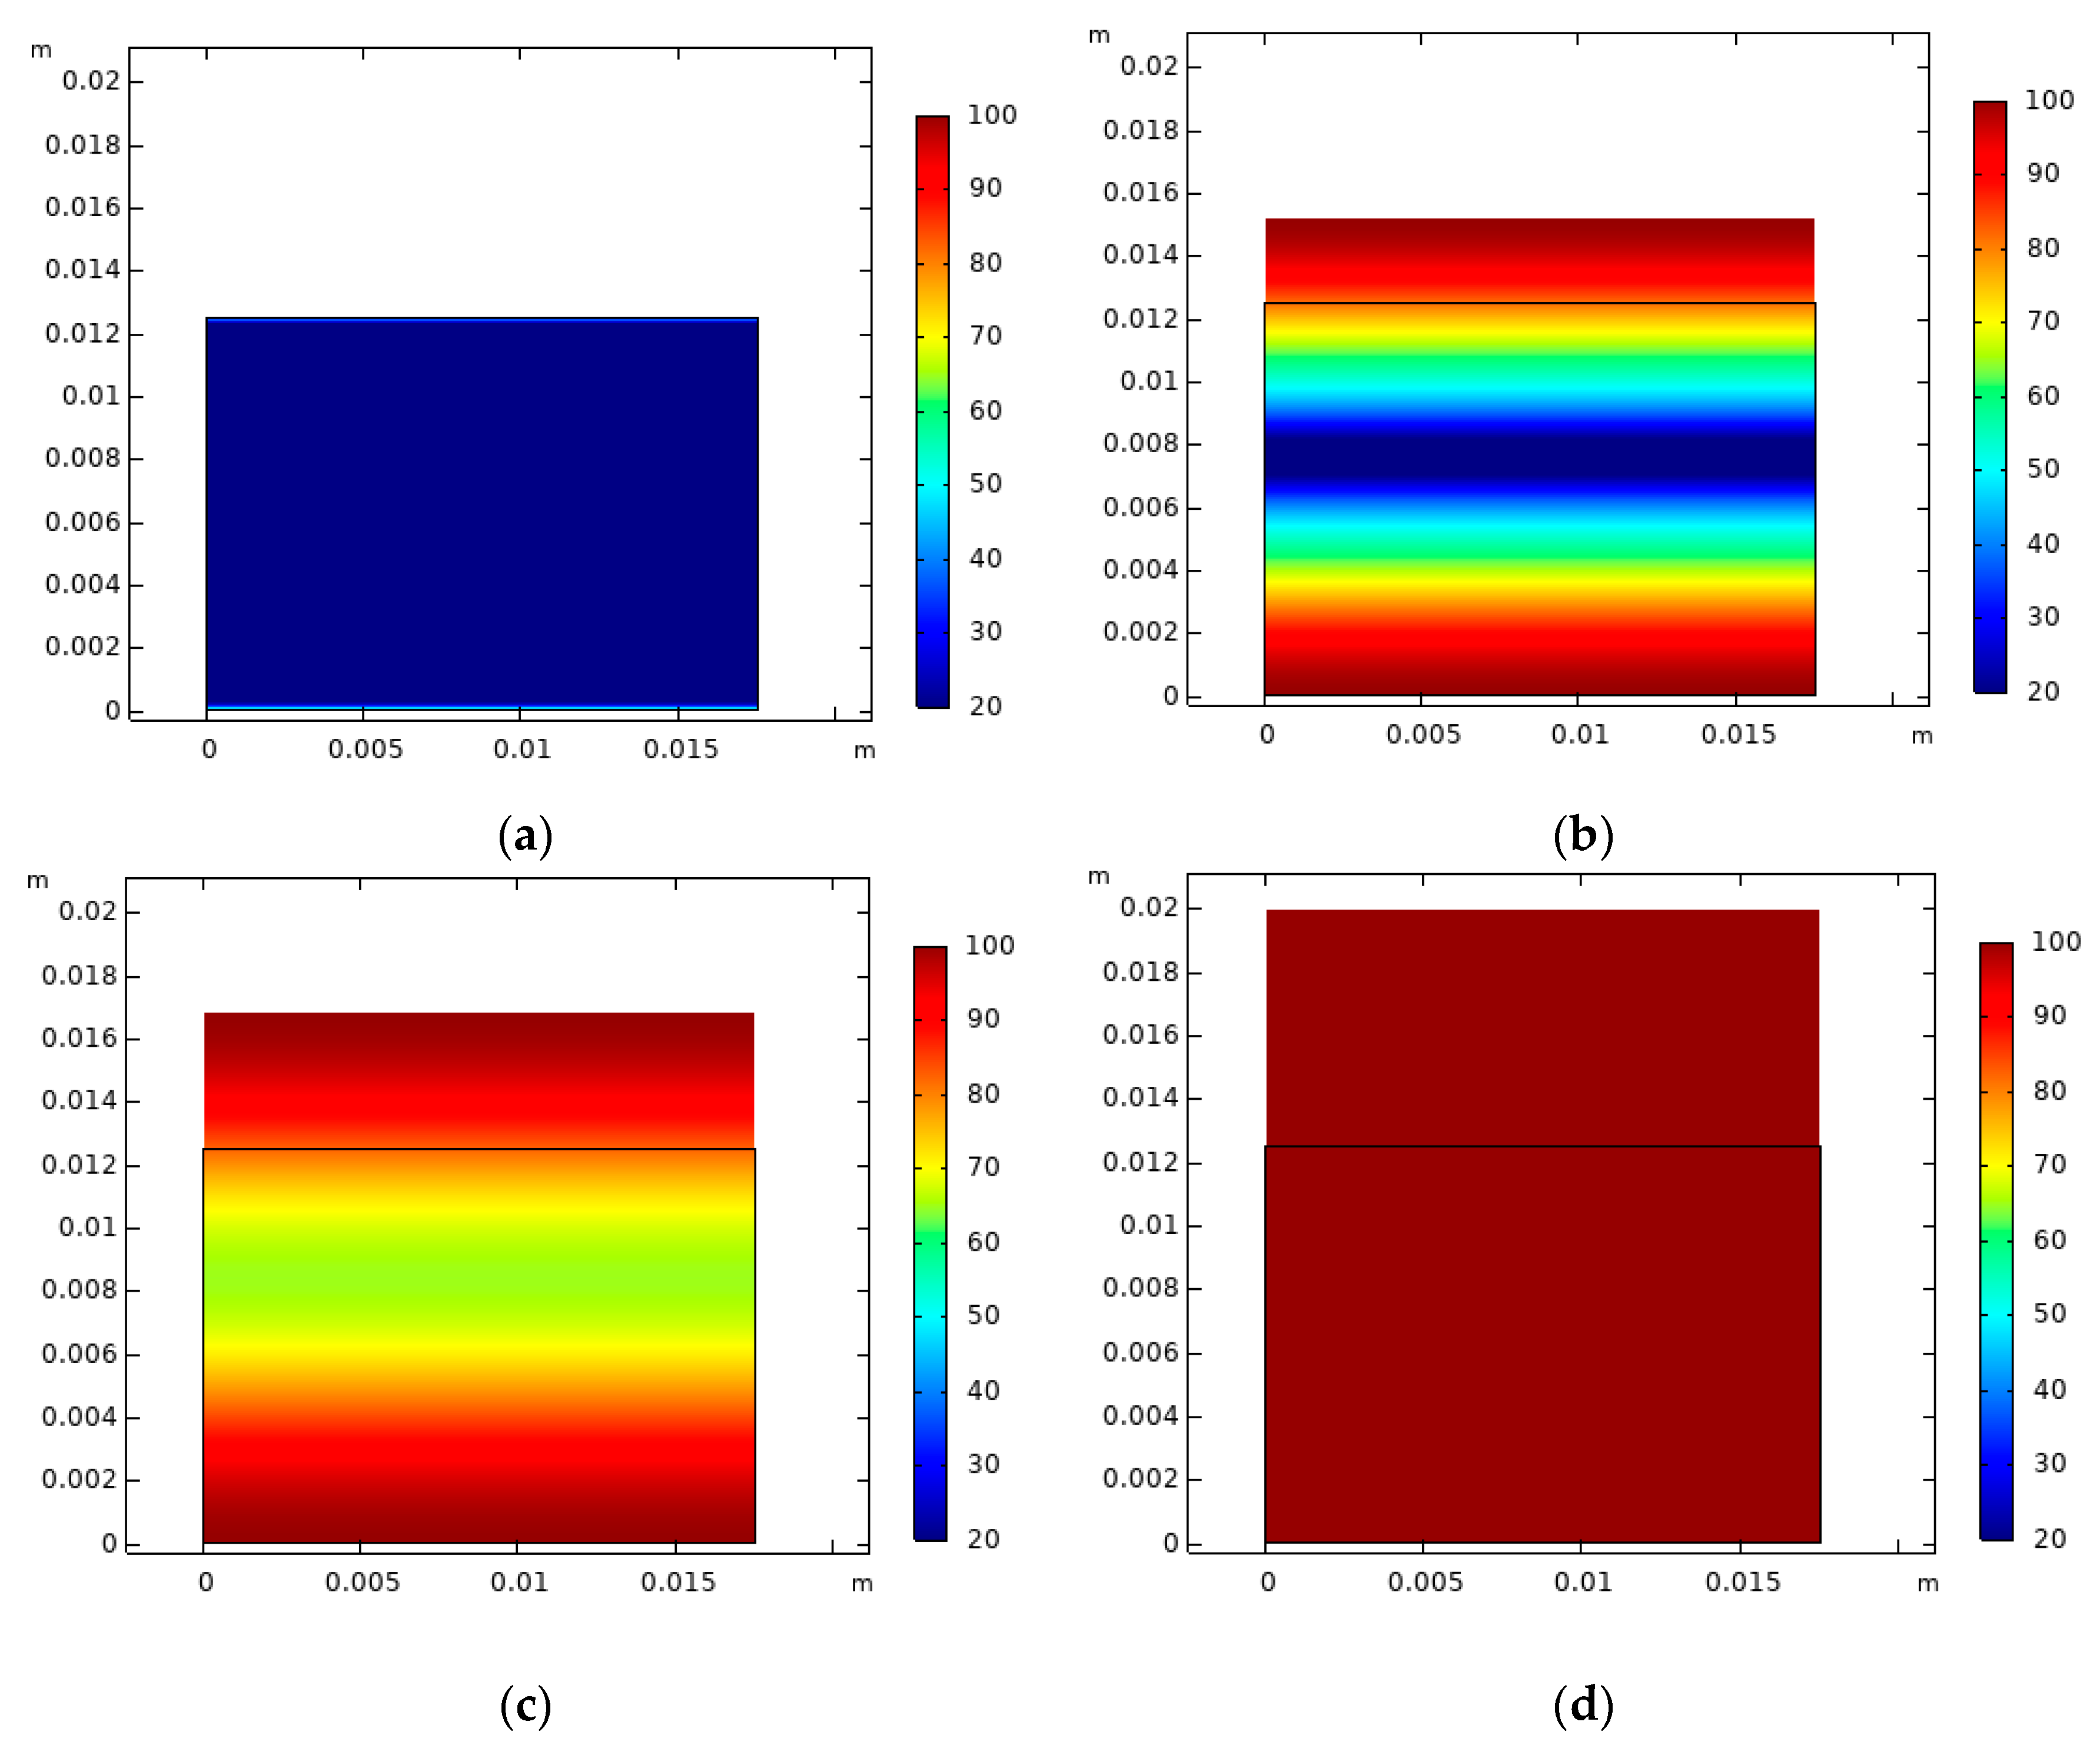
3.2.1. Saturation
In the case of saturation under low vertical stress (21 kPa) (Path ABCD), the saturation process was fast too. The modeled distribution of water saturation is presented in
Figure 9 at different times of hydration under low vertical stress.
In this case, the hydration and expansion processes took place simultaneously. Based on the modeling results, the sample would become uniformly saturated by the end of this free swelling stage of the experiment.
3.2.2. Dry Density
The change in density distribution proceeded quickly, too, when bentonite is hydrated with water under vertical stress of 21 kPa (Path ABCD, stage AB). The modeled distribution of dry density, at different times, is presented in
Figure 10.
The simulation results, presented in
Figure 10, indicate fast homogenization, in terms of dry density, with a value decreased to 838 kg/m
3. Such homogeneous distribution of dry density will result in homogeneous swelling pressure, exerted on the surroundings of the bentonite barrier, and is highly desirable.
Figure 11 presents the dry density distribution, within the sample during the compression stage.
Figure 8 and
Figure 11 present the modeling results, which indicate that dry density would be uniformly distributed (fully homogeneous) within the sample during the compression stage of the experiment, despite previous hydration conditions (free or confined volume). Fully homogenized material is highly desirable in the repository conditions, to ensure safety functions predefined for the barriers. Nevertheless, the simulated behavior might be driven by the model assumptions on elasticity and isotropic material properties.
3.3. Final State of Granular MX-80 Bentonite Samples
The overall void ratio of the samples, during the saturation and compression stages, was determined at different vertical stresses and is presented in
Figure 12. The void ratio, estimated through the numerical study, is presented, as well.
As could be seen in
Figure 12, the modeling results of void ratio evolution, during saturation under confined volume conditions and following a compression stage, showed good agreement with the experimental results. For Path ABCD (swelling under low vertical stress + compression), the modeled void ratio (large swelling strains) after the free swelling stage was in line with the experimental results. The modeled void ratio evolution during the subsequent compression stage did not indicate any presence of the sudden slope change, in the range 0.5–1 MPa, evident from the experimental data (~0.5 MPa). The modeled void ratio was overestimated to some extent, at larger vertical stress > 0.5 MPa. Nevertheless, the final void ratio for Path ABCD conditions was overestimated in the model by ~1%. Meanwhile, the final void ratio for Path AB’C’ (saturation under confined volume conditions + compression) was underestimated by ~17%, with the final model formulation. The experimental data shows a convergence of the compression lines at applied large vertical stresses, but such convergence was not observed in the simulation.
Typically, 3.2 MPa is expected for MX-80 bentonite of dry density of 1500 kg/m3, based on the empirical relationship (Equation (1)). At this stress, the measured void ratio was not the same for the analyzed hydrations paths, thus indicating stress pathway dependence. This difference in the void ratio prevailed in the modeling results; however, the numerical model overestimated it to a large extent (large difference in the void ratio). This potentially is related to the model feature, considering the reversible strains and gradual increase in material stiffness.
On the other hand, the trend of change in the slope of e-log
at high stresses was captured. In terms of the compressibility index (C
c), the change would be from 2.2 to 0.59, based on the modeling results. Meanwhile, the experimental data would suggest 1.46 and 0.52. A change in compressibility is expected for MX-80, based on [
44]. As it is reported in the referred document, a changing compression index (C
c), from 5.22 to 0.42 for vertical stresses, ranging from 0.001 to 300 MPa, would be expected. Such a bilinear trend is indicated in [
15], as well, with C
c changing from 2.14 to 0.42 for samples saturated under 8 kPa initial load and subsequent compression. The compression index, derived from the EPFL experimental results (under 21 kPa vertical stress), was lower, as the vertical load was different than of that reported in [
15,
44], as it depends on the applied load. The compressibility at high stress should be in line with experimental data previously reported in [
15,
44], but was higher than the value 0.42 reported there. This issue deserves a further, more detailed analysis. At the same time, it could be concluded that the compressibility under high stress was overestimated, to some extent, by the numerical model.
Taking into account the obtained results, it can be seen that the model’s predictive capabilities are limited in some cases. The model output could be treated more as an indicator of trends (e.g., full saturation time under same hydration conditions and void ratio at large stress (>10 MPa)), but not the absolute values. In order to increase the predictive capacity of the model, further model development work is needed, with the main focus on the consideration of friction (for laboratory scale experiments), representation of irreversible strains, and role of the microstructure on the final density distribution of MX-80 bentonite. The impact of these aspects on the overall macroscopic behavior of a barrier and its ability to maintains its safety function is of primary interest, rather than a precise replication of density distribution. A revised model, with increased predictive capacity, is the goal for our further research. It is worth mentioning that the model for lab-scale experiments serves as calibration and “preparation” of the model for larger scale tasks. However, during this scale transition, additional challenges will arise. In particular, the initial state of fabric, which could be reasonably assumed to be homogeneous in small scale, need to be justified or represented properly in the numerical model. Not fully initially homogeneous material will result in interrelated behavior at different parts of the large barrier. Besides, the proper representation of boundary conditions is, nevertheless, important, as these are hardly identical in all parts of the larger scale experiments. Upscaling of properties and coupled processes has unresolved issues and is under investigation on the international level (for example, within the H2020 project Eurad).


