Article

Orthogonal Numerical Analysis of Deformation and Failure Characteristics of Deep Roadway in Coal Mines: A Case Study

1
School of Safety Engineering, China University of Mining and Technology, Xuzhou 221116, China
2
Henan Shenhuo Group, Co., Ltd., Yongcheng 476600, China
3
Department of Mining Engineering, Balochistan University of Information Technology, Engineering and Management Sciences, Quetta 87300, Pakistan
*
Authors to whom correspondence should be addressed.
Minerals 2022, 12(2), 185; https://doi.org/10.3390/min12020185
Submission received: 20 December 2021 / Revised: 27 January 2022 / Accepted: 29 January 2022 / Published: 30 January 2022

Abstract

:
With the development of deep, underground coal mines in China, the failure mechanism of the rocks surrounding roadways is becoming increasingly complicated and the deformational control is also significantly difficult. In this study, based on the temporal and spatial deformational distribution of the deep roadway area in the 2233 working face of Fuxin Hengda Coal Mine, factors affecting the deformation and failure mechanism of deep-buried roadways, such as cohesion (c), tensile strength ( σ t ), internal friction angle (φ), vertical ground stress (p), and the horizontal-to-vertical stress ratio (λ), were analyzed using orthogonal numerical experiments. The stress and electromagnetic radiation monitoring data were used to locate areas of highly concentrated deformation in the roadway and surrounding rocks. The results show that the order of the degree of influence of the surrounding rock and geometric parameters on the deformation of the deep-buried roadway is φ > p > σ t > λ > c. The vertical stress of the roof and the horizontal stress of the two sides are negatively correlated with the tensile strength and horizontal-to-vertical stress ratio, respectively, and mainly shear failure occurs in the area. The higher the level of the surrounding rock, the more serious is the deterioration and deformation. The electromagnetic radiation reflects the distribution range of the high-stress concentration area and strength deterioration area. The test results accurately describe the deformation–deterioration-failure laws of rock surrounding deep-buried roadways influenced by different factors. The results are of great significance for analyzing the deformation and failure characteristics of rocks surrounding roadways, preventing rockburst, and supporting the parameter optimization of roadways.

1. Introduction

Coal will continue to be one of the main sources of energy in China for a long time and it has been a major strategic deployment of the country over the past few centuries. It is an inevitable trend; considering the growth in Chinese industrial development, the demand for resources from the deep pits is bound to rise. According to statistics on the rate of increase in mining depth across the country, the old mines in the eastern provinces are developing at a mining speed of 50–125 m every five years. By the end of 2017, there were more than 50 mines with a buried depth of more than 1 km. The geological environment in the shallow buried roadway is simple in stope structures, low in ground stress, and less affected by geological faults [1,2,3,4,5]. Deep mining faces many problems, such as significantly increased in situ stress, complex geological environments, and the coupling of multiphase rock masses. Owing to these factors, the physical and mechanical properties of deep rock masses and the instability mechanism of the surrounding rocks of the roadway are becoming increasingly complicated. As a result, it is difficult to accurately estimate the deformation of rocks surrounding the deep-buried roadway and the difficulty of controlling the structural stability of the rocks continues to increase [6,7,8,9,10,11]. They may even cause dynamic disasters, such as roof collapse, rockbursts, coal and gas outbursts, and large-scale floor subsidence, that could seriously jeopardize the safe and efficient operation of the coal mines.
Scholars have done a lot of outstanding work in the past on the deformation characterization and the temporal and spatial evolution of the fractural process, key parameters for the deformation control of the surrounding rocks and related supporting technologies of the roadway. Zhang et al. (2018) established the mechanics and structural model of the roadway and proposed that the roof collapse deformation is caused by buckling when the roof stratum reaches the failure limit and, as a consequence, sliding shear failure is likely to occur on the sidewalls; a decrease in bearing capacity is the root cause of floor undulation [12]. Khalymendyk et al. (2021) analyzed the relationship between the mutual restriction of the “support-rock mass” system and the particularity of the deformation mechanism of the roadway, and a linear relationship between the subsidence of the roof and the uplift of the bottom drum was established [9]. Pan et al. (2020) established a mechanical model of the “coal wall–hydraulic support–gangue” support system from which the cyclical failure span of the stope and the modified expression of the impact kinetic energy were derived [13]. An innovative control technology for fracturing through vertical walls was also proposed. Zhao et al. (2021) found that high in situ stress in deep mines, local stress concentrations in the fault, shear-slip failure, and insufficient support strength, etc., are the main reasons for the deformation and failure of the surrounding rock of the roadway crossing the fault [14]. Ding et al. (2021) found that a weak layered roadway weakened the stress transfer from the deep part of the surrounding rock to the coal bank, promoted the stress transfer from the roof to the coal bank, and intensified the shear failure and horizontal slip of the surrounding rock [15]. Sun et al. (2020) proposed a new coal-roadway pre-reinforcement method with jet grouting to strengthen the surrounding soft-coal wall and form a stable support structure [16]. Jia et al. (2021) found that the maximum depth of the plastic zone of the roadway usually faces the roof, and plastic compression–shear failure occurs when the plastic failure-affected zone contains a weak layer [17]. Until now, the mechanical properties of deep rock masses and the evolution characteristics of the original rock stress fields have not been determined with accuracy. Similarly, the distribution of stress fields in the rock mass around the deep-buried roadway and the evolution characteristics of rock movement under the influence of mining could not be determined with a fair degree of accuracy, either through mathematical calculations or a study of the mechanics involved.
Therefore, an in-depth study of the deformation characteristics of the surrounding rocks and influencing factors in deep-buried roadways is useful for controlling deformation, degradation, and destruction. It can help reveal the mechanism of instability and optimize the support design parameters of deep-buried roadways. Considering the great significance of ensuring and maintaining safe production in deep-buried mines, this study has observed the 2233 working face of the Fuxin Hengda Coal Mine as the engineering research background and adopts the method of combining simulation analysis with orthogonal experiment. Five mechanical factors on the influence of the deformation and deterioration mechanism were analyzed, including the cohesion ( c ), tensile strength ( σ t ), internal friction angle ( φ ), vertical stress ( p ), and horizontal-to-vertical stress ratio ( λ ) of the surrounding rock of the deep-buried roadway. The stress, support resistance, and electromagnetic radiation monitoring data collected in the roadway before and after the occurrence of rockbursts in the 2233 working face of the Fuxin Hengda Coal Mine were analyzed. Furthermore, the time and space characteristics of the surrounding rock-destruction of the roadway were corroborated. The research results can provide a theoretical reference for the optimization of the deformation control, reveal the failure mechanism of the surrounding rock of deep-buried roadways, and lead to the optimization of the stability control parameters. Additionally, it could shed new light on the prevention and control of rockburst disasters in roadways.

2. Failure Mechanism of Surrounding Rock of Roadway

The results of roadway deterioration and instability in the Fuxin Hengda Coal Mine are shown in Figure 1. The elastic potential energy originally stored in the surrounding rock that is naturally formed by geological processes is in a state of dynamic equilibrium [18,19,20]. However, external engineering elements, such as pressure relief owing to blasting, large-area collapse of the roof, etc., disrupt the original stress balance and the redistribution of the stress in the rock mass. This leads to the accumulation and development of the two defects of coal block yield deformation, and the accumulated elastic energy is released sharply, causing the surrounding rock to rapidly transition from the deterioration stage to instability failure (Figure 1a,b). In the evolution process of rock mass deterioration, the block primitives with a certain strength evolve to the main structure with a high degree of damage and the initial strength of the actual material is significantly reduced [21,22,23]. Among them, the Mohr–Coulomb destruction criterion is a constitutive model with strong applicability and the widest application range in geotechnical structure engineering. The Mohr–Coulomb criterion is used to describe the strength characteristics of the plastic zone of the surrounding rock, and its form is:
f s = σ 1 σ 3 N Φ + 2 c N Φ
f t = σ 3 σ t
where f s is shear failure criterion, f t is tensile failure criterion, σ 1 is the maximum axial principal stress of the coal rock unit body, σ 3 is the lateral pressure, σ t is the tensile strength, N Φ = 1 + sin Φ 1 sin Φ , Φ is the internal friction angle, and c is the cohesion.
The surrounding rock of the underground roadway is in a three-dimensional stress state [24,25,26,27]. When the local stress is large, the lateral pressure increases beyond the coal rock tensile strength threshold; the stress distribution of the surrounding rock satisfies Equation (2) but does not meet the failure conditions of Equation (1) at a point within the influence range of the spatial constraint effect. Tensile instability deformation occurs inside the rock mass. Although the surface of the surrounding rock will not be destroyed immediately under this condition, dynamic disasters, such as rockbursts, could occur. The macroscopic appearance is a constant isokinetic creep, and as time progresses, the yield of the surrounding rock surface causes changes in the properties of the coal rock mass because of the creep. The strength of the coal rock is controlled by parameters such as the internal friction angle and cohesion. Under this condition, the internal point stress of the surrounding rock within a certain depth reaches the Equation (1) requirement, leading to the accelerated failure of the surrounding rock and the expansion of the deformation failure area to the deep part of the surrounding rock. Consequently, this causes the surrounding rock to produce a loose zone and completely collapse, resulting in roadway failure. This phenomenon is manifested in the destruction of the roadway in Fuxin, either as the surface deformation of the surrounding rock-roof collapse or the bottom heave severe compression failure of the roadway; eventually, the status shown in Figure 1 is attained. From the above analysis it can be seen that the main factors affecting the deformation of the surrounding rock include the surrounding rock cohesion ( c ), tensile strength ( σ t ), internal friction angle ( φ ), vertical ground stress ( p ), and horizontal-to-vertical stress ratio ( λ ).

3. Orthogonal Numerical Simulation Experiments

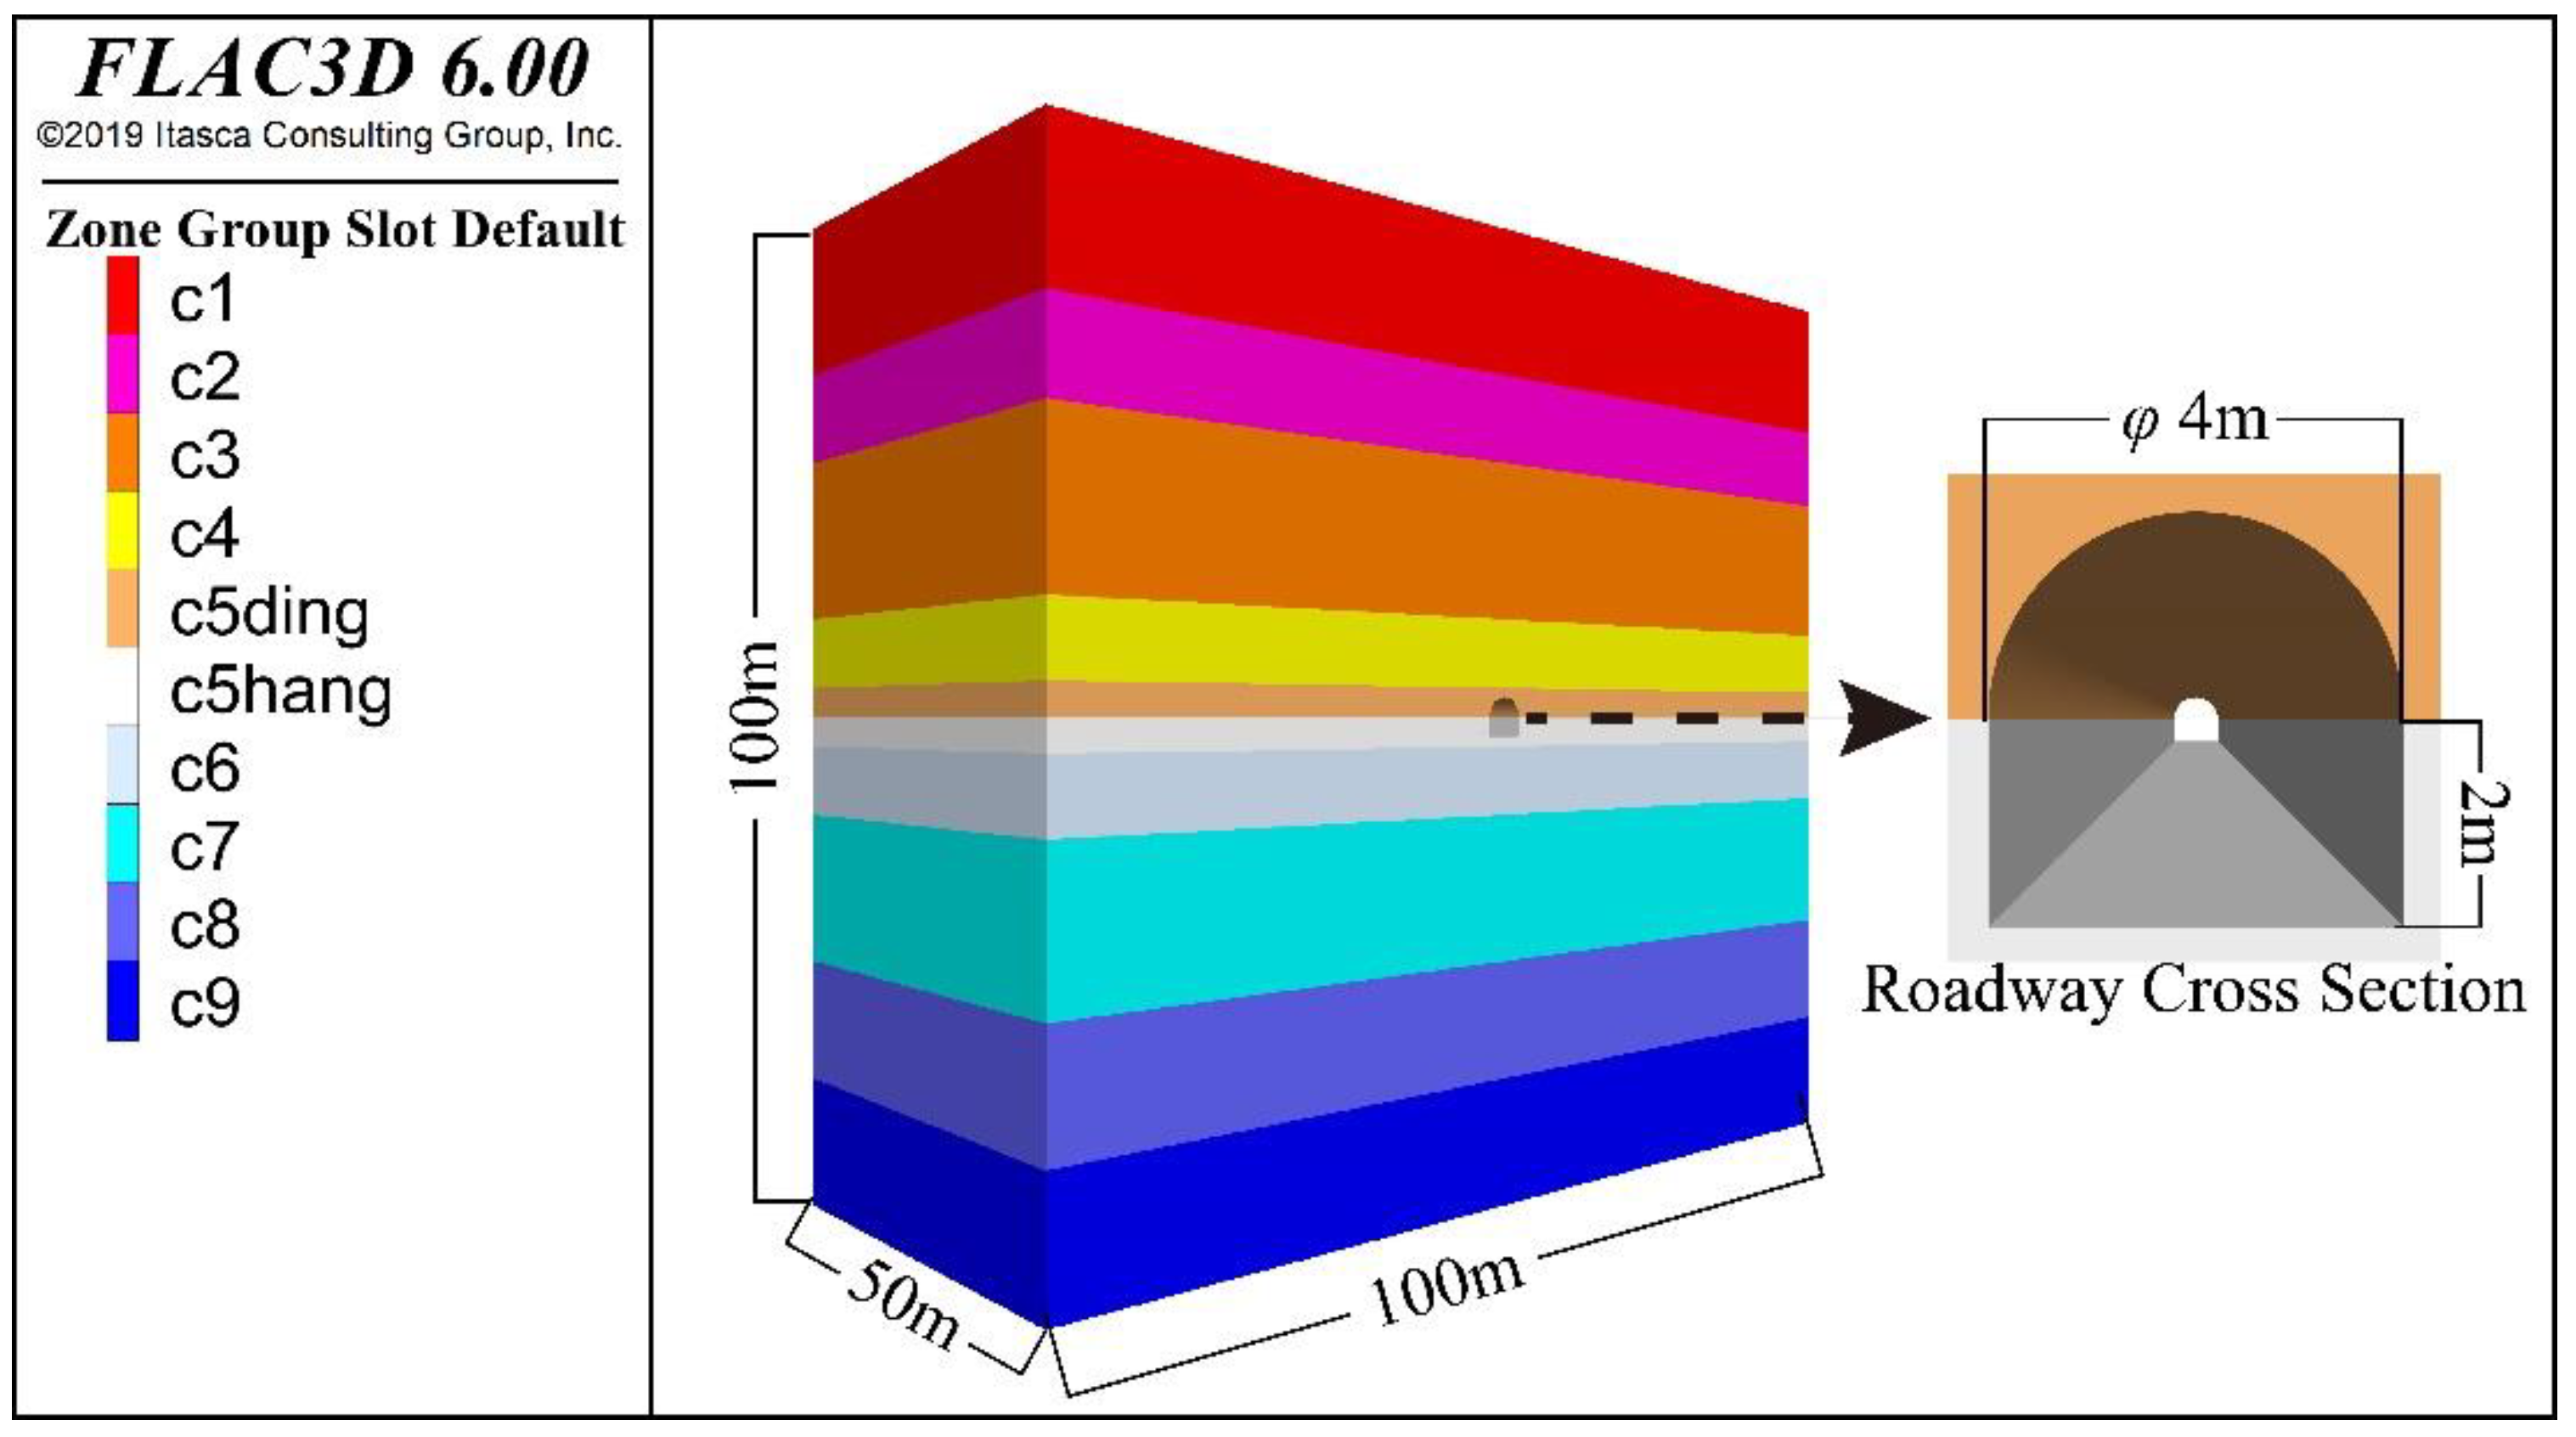
3.1. Mine Geology and Numerical Model

Six layers of coal are available for mining at the Fuxin Hengda Coal Mine that is located in Fuxin City, Liaoning Province, China. The 2233 working face in the 126-mining area is located in the Sunjiawan coal seam, whose average thickness is 4.8 m, inclination angle is 4°, and burial depth is approximately 900 m. The designed mining area of the working face was 700 × 210 m. The structure of the coal seam is complex, but the nature of the surrounding rock of the working face roadway is good. The main components of the working face roof consist of thick, hard, and coarse sandstone, whereas the floor consists of siltstone and fine sandstone. The positions of the slope of the working face and the geological histogram are shown in Figure 2 and Figure 3.
To better observe the deformation of the roadway combined with the calculation accuracy requirements of the simulation, a simplified numerical model sized 100 × 50 × 100 m with a composite structure of coal and rock in nine layers corresponding to the geological conditions of the Fuxin Hengda Coal Mine is considered. The roadway, whose model is shown in Figure 4, is located in the middle of the coal seam; the lower half of the roadway section is rectangular with a length of 4 m and width of 2 m, while the upper part is designed as a semicircular arch with a radius of 2 m. A uniform load of 30 MPa was applied to the top of the model to compensate for the overlying coal and rock layer’s own weight stress, and the horizontal-to-vertical stress ratio was set to 1, i.e., 30 MPa stress around the model. The surrounding boundary uses a fixed constraint method to limit the displacement of the boundary of the model and the Mohr–Coulomb constitutive model has been selected. The heights of the coal and rock layers in this model and their related rock and soil mechanical parameters are listed in Table 1. Based on the geological survey report of the Fuxin Hengda Coal Mine, under the premise of ensuring accuracy and computing efficiency, we established a roadway model to describe the real geological form of the mine.

3.2. Determine Evaluation Indicators

The analytic hierarchy process refers to the establishment of an evaluation system by linking the elements with the overall goal through quantitative standards, thus, providing a reasonable decision-making framework for the problem at hand. On the basis of this framework, using the method which solves the eigenvectors of the judgment matrix and passing qualitative indicators, the fuzzy quantification method ranks the relative pros and cons of the levels [28,29,30,31]. The analysis shows that the roadway deformation under the influence of mining includes roof collapse, subsidence, the bottom heave of the floor, and the displacement of the sides. The deformation of the roadway can be accurately described through an analysis of these deformations.
This study uses roadway deformation D to characterize the influence of the physical and mechanical parameters of coal on the deformation and failure of the roadway. The more serious the degree of deformation and failure of the surrounding rock, the larger the roadway deformation.
D = D i ω i
where Di: D1 is the maximum deformation of the roadway roof, D2 is the maximum deformation of the roadway sides, D3 is the maximum deformation of the roadway floor, and ω i is the corresponding deformation weight coefficient of Di.
The deformation weight coefficient ω i can be determined using the analytic hierarchy process. Based on long-term process practice and production experience, using the 1–9 scale matrix method [32,33,34], a third-order judgment matrix of the degree of deformation and weight in the roadway can be defined as follows:
P A B = [ 1 9 5 9 3 5 9 1 5 4 3 9 4 5 1 ]
Through calculation, the matrix P A B has a maximum eigenvalue λ m a x = 3.009 , then the eigenvector (0.848, 0.428, 0.3113) corresponding to the maximum eigenvalue is unitized and the following weight vector can be obtained:
ω A B = ( 0.534 ,   0.270 ,   0.196 )
where ω A B is the corresponding weights for the deformation of the roof, two sides, and floor, respectively.
Then, Equations (6) and (7) are used to test the consistency ratio of the weight vector of the single layer and determine whether the test is passed according to the ratio value:
C R = C I R I
C I = λ m a x n n 1
where CR is the eigenvalue of the single-layer weight vector ratio used to analyze and determine the construction matrix. When the judgment result CR is less than 0.1, it can be considered that the single-layer weight vector ranking result of the constructed matrix has satisfactory statistical consistency; otherwise, the construction matrix must be re-analyzed and corrected again. The consistency test eigenvalues of the third-order judgment matrix of the roadway deformation are used to judge whether the degree of inconsistency of the matrix is acceptable; when CI, the characteristic value, is equal to 0, it is considered that the constructed third-order roadway deformation matrix is completely consistent and can accurately reflect the roadway deformation characteristics; when CI is close to zero, it is considered that the matrix shows a high degree of consistency and can be used to study roadway deformation analysis; when CI deviates from 0, the inconsistency is more serious and it cannot accurately reflect the deformation characteristics of the roadway. The values of RI, the random consistency parameters, are listed in Table 2, where n is the number of factors. For the construction of the third-order judgment matrix of roadway deformation, n = 3, RI is the average random consistency index and RI = 0.52 corresponding to the number of factors n = 3.
C I = λ m a x n n 1 = 3.009 3 3 1 = 0.0045
C R = C I R I = 0.0045 0.52 = 0.000865 0.1
It can be seen from the calculation results that the value of CI is close to zero and that of CR is much less than 0.1, and based on these results the constructed roadway deformation matrix is considered to have satisfactory consistency. When evaluating the influence of different factors on the deformation of deep-buried roadways, the corresponding weights for the deformation of the roof, two sides, and floor were 53.4%, 27%, and 19.6%, respectively.

3.3. Orthogonal Experimental Design

The orthogonal experimental design is an experimental design theory and technique proposed by studying the multifactor and multilevel [35,36,37]. Consequent to analyses of the related research of scholars, this study selected five physical, mechanical, and geological factors concerning rocks, viz., tensile strength σ t , cohesion c , internal friction angle φ , vertical ground stress p , and horizontal-to-vertical stress ratio λ to study the influence of the deformation and degradation mechanism of deep-buried roadways. The internal friction angle φ actual effect in the Mohr–Coulomb equation is determined by the tangent results. The internal friction angle is used instead of the friction coefficient, because it is the internal friction angle input in the FLAC3D 6.0 software, (Itasca Regions, MN, USA), instead of the friction coefficient which facilitates understanding and application [38,39,40,41]. Each factor took four parameter levels, selected L 16 ( 4 5 ) on the orthogonal table, and conducted related experiments. The grouping value of each level and factor is determined based on the analysis of a large amount of mine data. The specific experimental plan is presented in Table 3. The selection of the parameters mainly considers the equal difference increment—each parameter increments a certain value. The vertical stress employed in the test is 15 to 45 MPa. The burial depth corresponding to 15 MPa is about 500 m, and the burial depth corresponding to 45 MPa is about 1500 m. According to the parameters in Table 3, 16 groups of FLAC3D orthogonal experiment schemes were designed. The initial model was used as the prototype to carry out the simulation calculation of the roadway under different parameter combinations and the data results of the roadway surrounding rock deformation under different conditions were obtained [42,43,44,45]. The roadway deformation index results are presented in Table 4. The experimental results were calculated and processed using normalization. After normalization, the influence of the multiplier on the deterioration and deformation analysis of the roadway can be reduced, and an influence effect of different parameters on the deterioration and deformation of the roadway can be obtained more objectively and accurately.

4. Analysis of Orthogonal Numerical Simulation Results
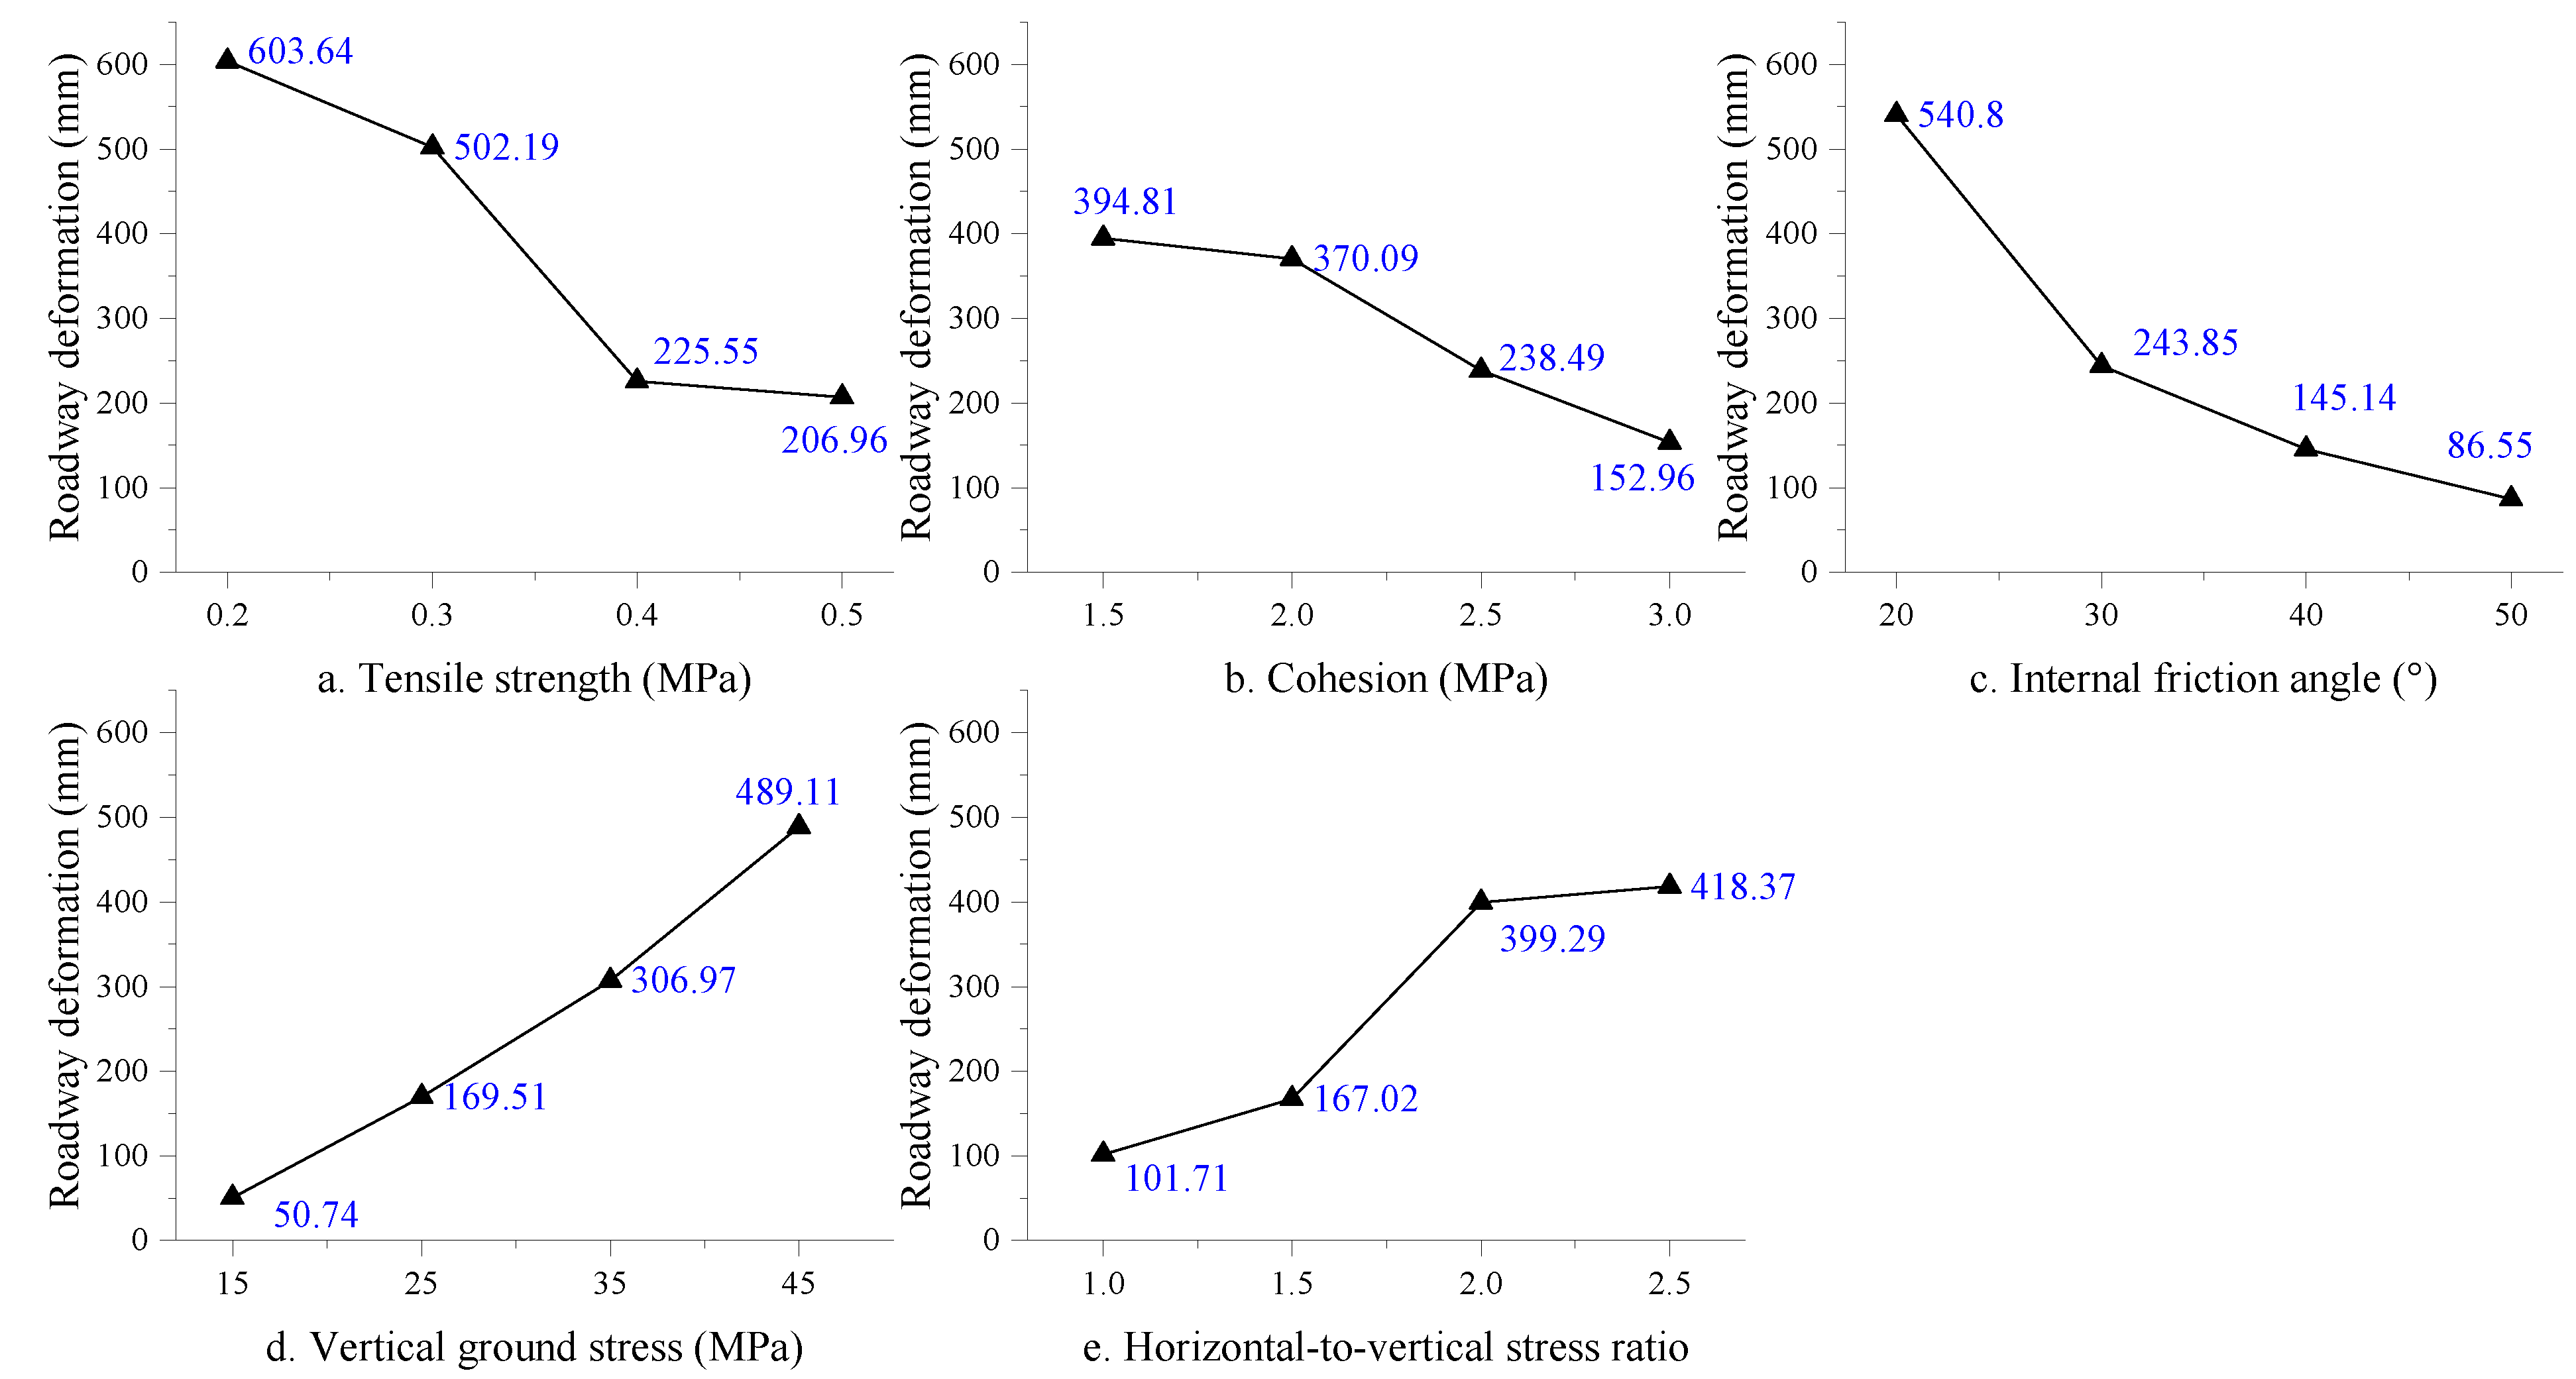
4.1. Range Analysis

Range analysis refers to the method of extracting the mean and the range corresponding to each level of various factors from the results of orthogonal experiments and analyzing the changes in various factors that affect the target fluctuation interval [46,47,48]. The range characterizes the range of influence of the corresponding factors on the evaluation index of the orthogonal experiment (the amount of roadway deformation). The range analysis and calculation of the experimental statistical results are shown in Table 4.
Through range analysis, it can be determined that the roadway deformation reaches the maximum value of 540.80 mm when the internal friction angle φ is 20° and the minimum value of 86.55 mm at 50° internal friction angle; the range is the largest at 454.25 mm when the vertical ground stress p is 15 MPa, the minimum roadway deformation is 50.74 mm, and when it is 45 MPa, the maximum value is 489.11 mm, with a large range of 438.37 mm; when the tensile strength σ t is 0.2 MPa, the minimum roadway deformation is 206.96 mm, and when it is 0.2 MPa, the maximum is 603.64 mm, with a large range of 406.68 mm. Through the sorting of the range, it can be observed that different physical and mechanical properties of the rock have varying effects on the deformation and failure of the deep-buried roadways, and the degree of influence in descending order is: φ > p > σ t > λ > c . This shows that within a certain range, φ has the greatest impact on the deformation of the deep-buried roadways, followed by p and σ t , whereas λ and c have a relatively minor influence.
Based on the average value obtained from the range analysis in Table 5, the corresponding intuitive analysis chart that describes the deformation trend of the roadway corresponding to changes in different factors can be obtained. It can be seen from Figure 5 that the tensile strength σ t , cohesion c, and internal friction angle have a negative influence on the roadway deformation. When the internal friction angle φ is less than 30°, the slope of 29.7 mm/° is higher and the internal friction angle has a significant influence on the deformation of the roadway. In contrast, when the internal friction angle is greater than 30°, the slope reduces and its influence on the deformation of the roadway weakens: the reduction speed gradually slows and the degree of roadway deformation is lower. When the tensile strength σ t increases from 0.3 to 0.4 MPa, and the deformation of the roadway drops from 502.19 to 225.55 mm, it indicates a decrease of 55.08%, which is substantial. However, with a further increase in the tensile strength, the downward trend becomes lower. The cohesion c causes a decrease in the deformation, particularly in the range between 2 and 3.0 MPa, and the change in the deformation of the roadway is significant. The vertical ground stress and horizontal-to-vertical stress ratios are positively correlated with the deformation of the roadway. The vertical ground stress p causes an increase in the road deformation and this relationship is near-linear in fashion: the curve has a slope of 14.62 mm/MPa. When the horizontal-to-vertical stress ratio λ increases from 1 to 2 it has a significant impact on the deformation of the roadway: the curve is nearly horizontal when it is between 2 and 2.5.

4.2. Results of Variance Analysis

The method of variance analysis can obtain a quantitative estimate of the significance of the decision-making effect by studying the contributions of different types of decisions to the target [49,50,51]. This is a common method for analyzing the results of orthogonal experiments. The variance analysis table of the roadway deformation is obtained by calculating the method of decomposing the sum of squared deviations, as shown in Table 6.
The five parameters have different significances in the influence of the deformation of the deep-buried roadway. As shown in Table 6, the F value of the modified model is 436.237 and the significance is 0.000, which indicates that the modified model is very significant and can accurately represent the characteristics of the roadway deformation. According to the comparison and analysis of the F value, the order of the deformation contribution degree of the various influencing factors in the roadway deformation can be calculated as: φ > p > σ t > λ > c . Among them, the F value of the internal friction angle φ and vertical ground stress σ t are higher, i.e., 665.806 and 608.174, respectively, whereas the F value of cohesion is lower—only 140.103. Cohesion c is more effective when rock is under the low-stress condition and at a shallow depth, but cohesion c has little influence on the deformation of the roadway under the high-stress state, indicated through the range and variance analysis of the results of the orthogonal simulation experiment. In summary, the internal friction angle φ and the strength of the local vertical ground stress p can significantly affect the degree of deformation of a deep-buried roadway. The internal friction angle φ represents the sliding friction and occlusal friction caused by the interaction between fine particles inside the coal rock, and under high-stress conditions, the internal friction angle dominates the shear strength of the surrounding rock. The internal friction angle simulated in this paper increases linearly, while the corresponding tangent value friction coefficient changes nonlinearly in the Mohr–Coulomb equation. The larger the internal friction angle φ, the greater the shear strength of coal and rock, the stronger the ability of the surrounding rock to resist shear sliding, the smaller the volume and distribution of the plastic zone of shear failure, and the greater the obstacle to the deformation of the surrounding rock of the roadway. Therefore, there is a negative correlation between the road deformation and the internal friction angle φ. The vertical ground stress is determined by the buried depth of the roadway. The greater the vertical ground stress, the greater the vertical load on the roadway, and the greater the promotion of roadway deformation. Therefore, roadway deformation and vertical ground stress are positively correlated. The purpose of this paper is mainly to perform an orthogonal analysis, considering the influence on the deterioration and deformation of the surrounding rock of the roadway in the process of depth change. Currently, there are many coal and metal mines with burial depths ranging from 500 to 1500 m, and more and more coal and metal mines will reach this depth in the near-future. In addition, the development trend of China’s mining industry is to go deeper. The purpose is to better and more accurately predict the deformation characteristics of the surrounding rock in the deep roadway, and to explore the instability and failure characteristics of the roadway under the state of deep burial and high in situ stress.

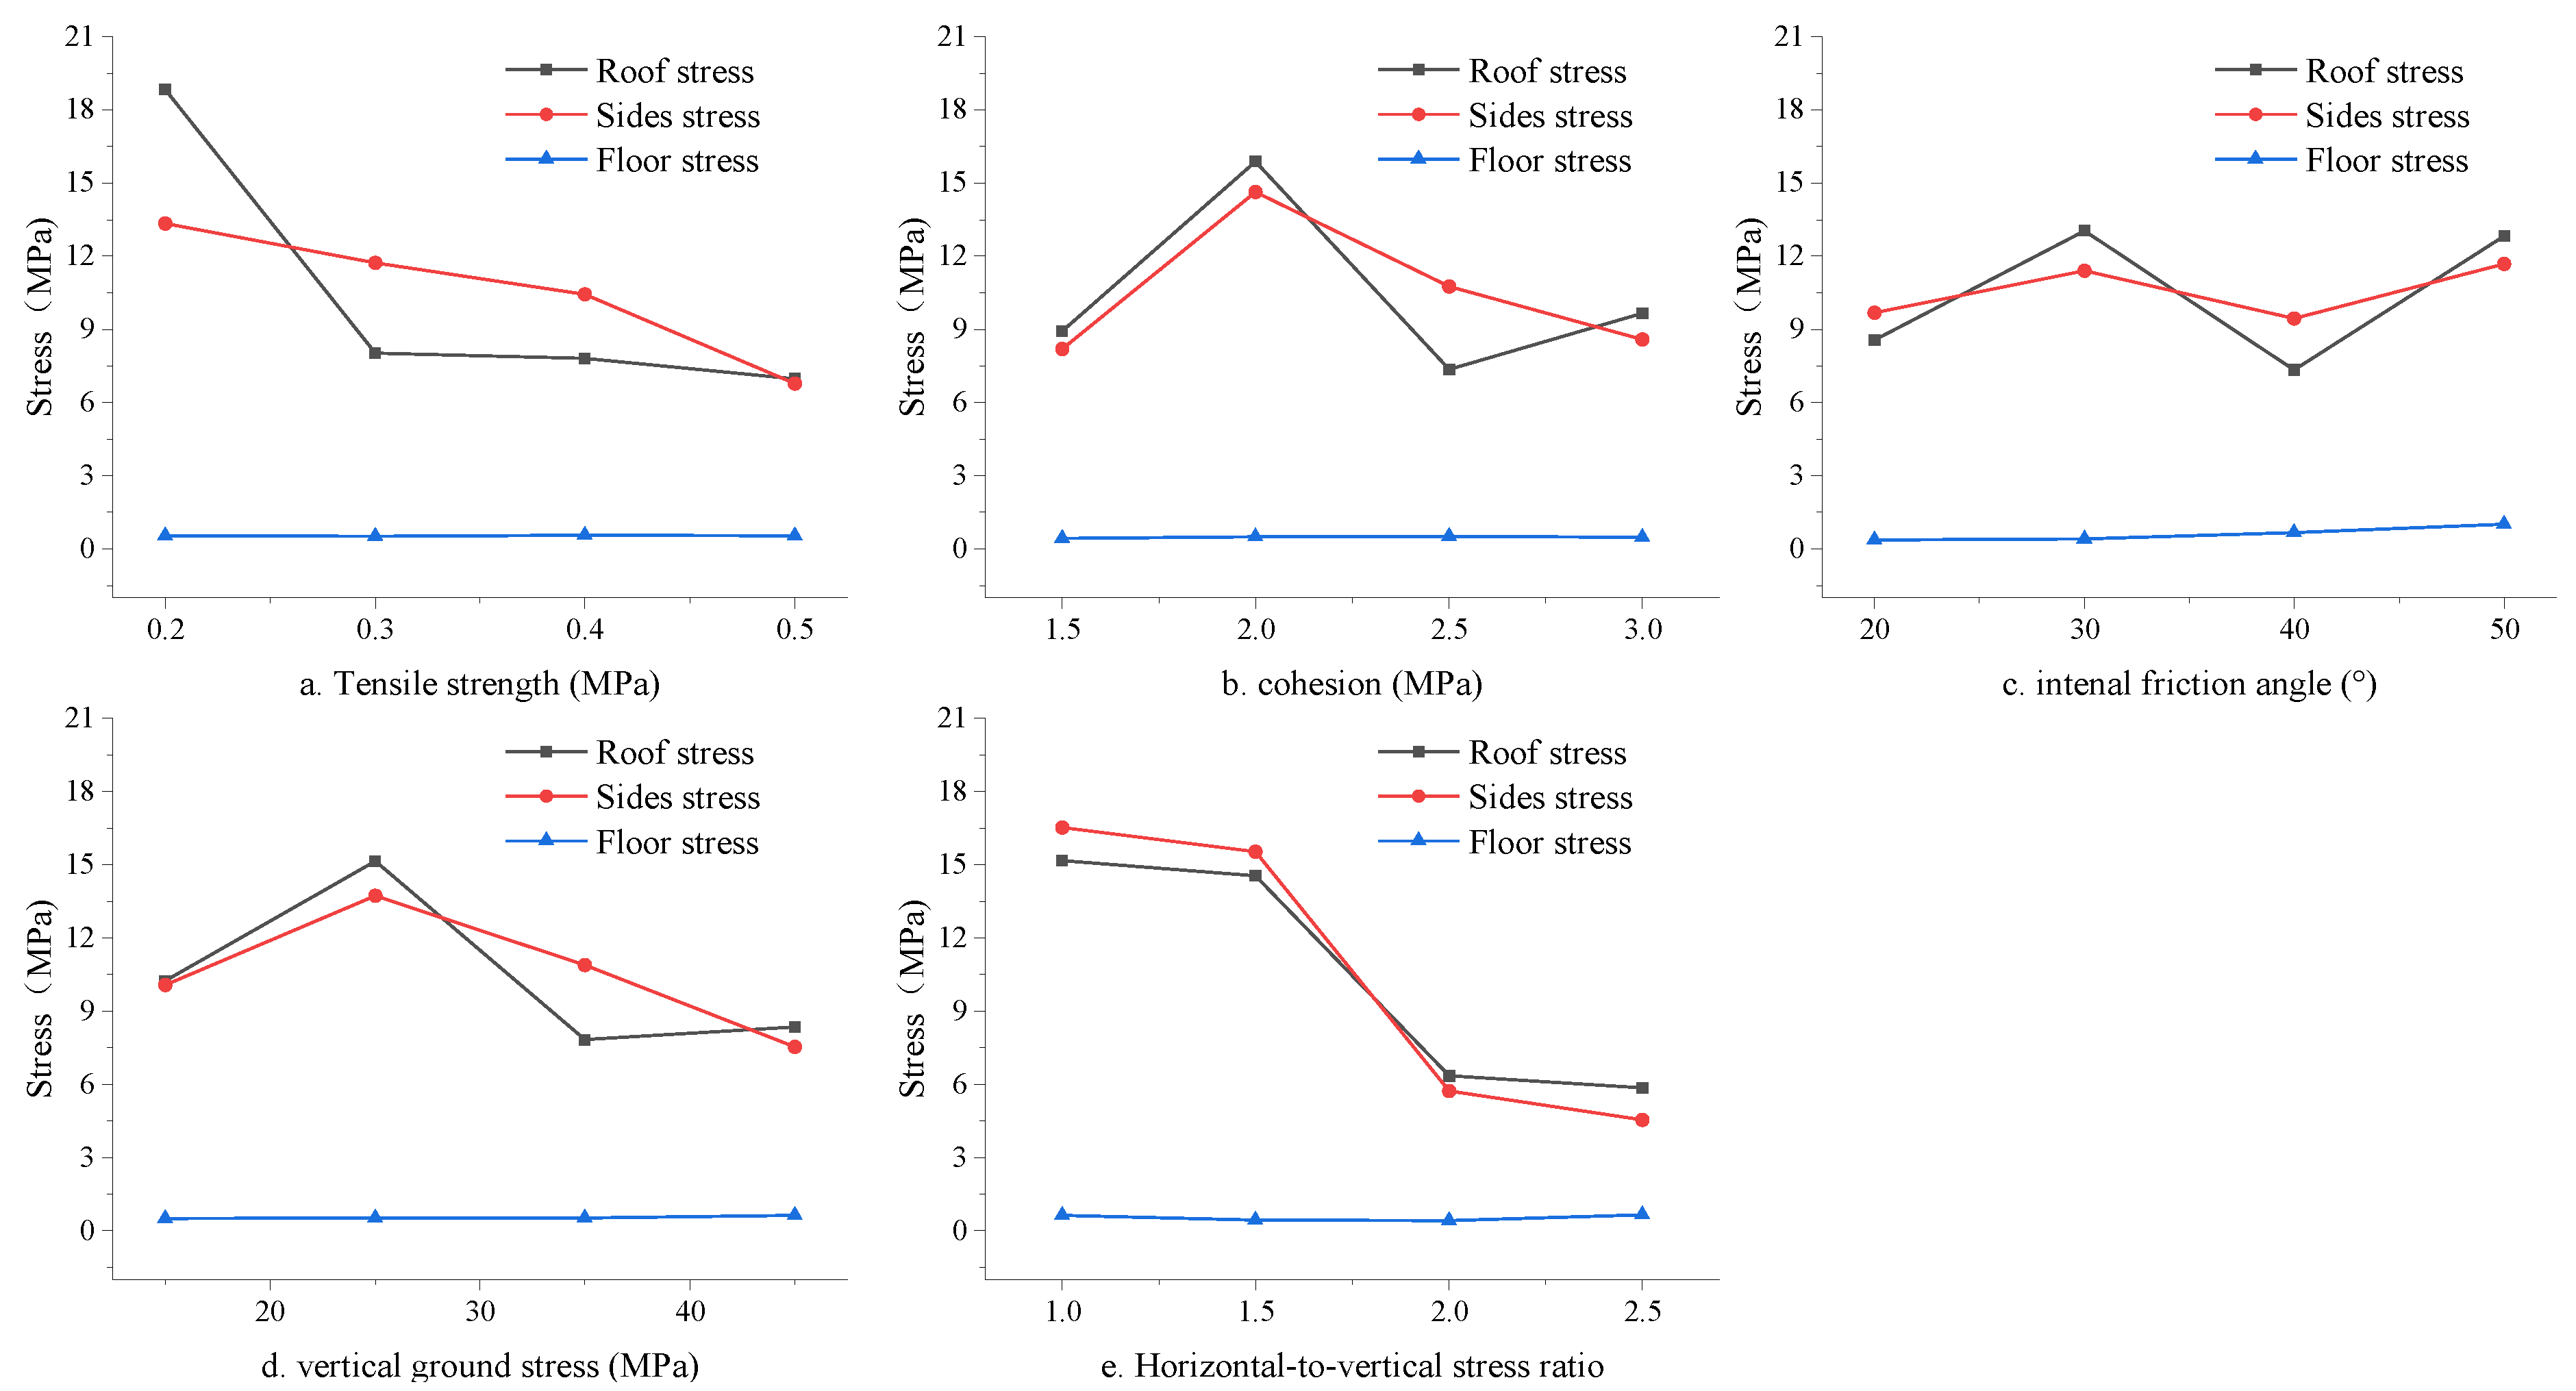
4.3. Characteristics of Roadway Stress

Stress change is an inherent dynamic cause of the deformation and failure of deep-buried roadways. Analyzing the stress trend under different factors is helpful for studying the characteristics of roadway deformation [52,53,54]. In this study, the maximum vertical stress on the roof and floor, and the maximum horizontal stress on the two sides of the roadway, were analyzed. The results are shown in Figure 6.
For the vertical stress on the floor, the internal friction angle φ responds more obviously to the floor stress: the floor stress increases with an increase in the internal friction angle. The changing trend of the other factors presents a horizontal straight line with no obvious change. The tensile strength σ t has the greatest impact on the roof for the vertical stress of the roadway roof. The tensile strength σ t increases from 0.2 to 0.3 MPa and the stress decreases from 18.89 to 8.02 MPa—a decrease of 57.5%. The cohesion c and internal friction angle φ have similar influence trends on roof stress. The roof stress presents an “N-shaped” change trend that first increases, then decreases, and finally increases. The horizontal-to-vertical stress ratio λ has a significant impact on the vertical stress of the roof of the roadway and has the greatest impact on the horizontal stress of the two sides: the two curves are relatively consistent. When the horizontal-to-vertical stress ratio λ changes from 1.5 to 2, the stress on the two sides decreases from 15.58 to 5.82 MPa—a decrease of 62.6%. When the cohesion c and the vertical ground stress p increase, the stresses of the two sides show an inverted-V-shaped change trend: it first increases and then decreases. In comparison, when the cohesion c changes, the degree and range of the stress on the two sides of the roadway are relatively large and the internal friction angle φ has little effect on the stress value of the two sides of the roadway. As the internal friction angle φ increases from 20 to 50°, the stress on the two sides of the roadway is maintained at approximately 11 MPa.

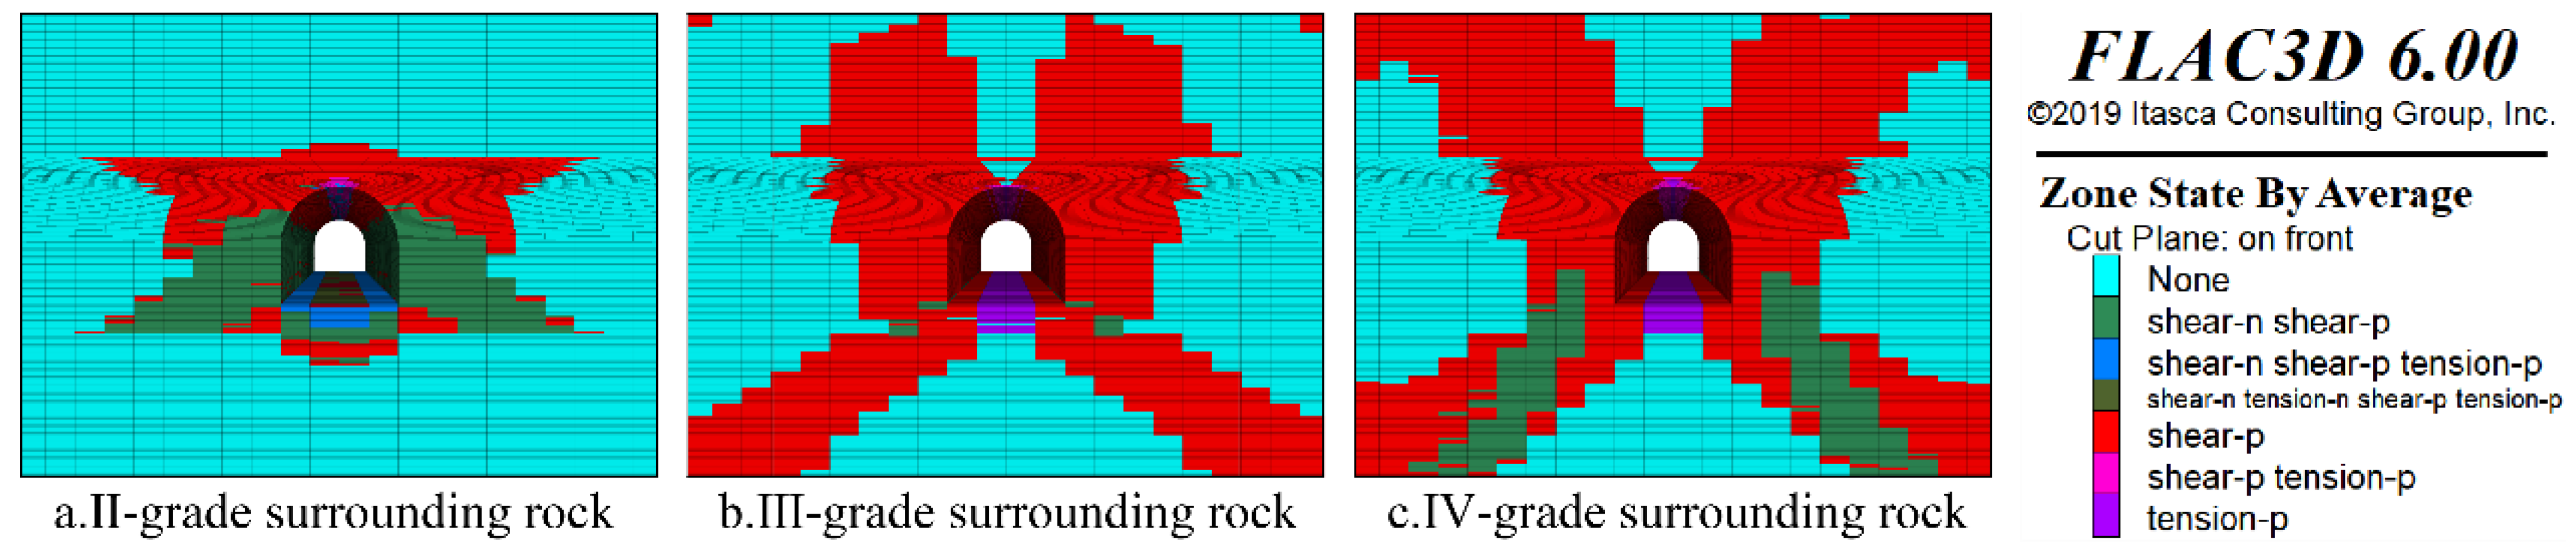
4.4. Analysis of Roadway Plastic Zone during Mining

The plastic zone of the roadway refers to the yield zone, where the load exceeds the ultimate bearing capacity of coal and rock, causing a local irreversible deformation [55,56,57]. On completion of the calculation with the FLAC3D software, the unique stress state of the element could be determined. When the stress state reaches the strength envelope, it is considered that the element enters the plastic state and a plastic zone is generated in the model. Otherwise, no plastic zone is generated. With the plastic potential surface used to represent the shear plastic flow ( g s ) and tensile plastic flow ( g t ), it is determined whether the unit is in the shear plastic zone or the tensile failure zone.
To study the deformation and failure of the roadway during the mining of the straight wall semicircular arch roadway, the plastic zone cloud diagrams of the five stages, viz., mining to 10, 20, 30, 40, and 50 m, were selected for analysis, as shown in Figure 7. The plastic zone is mainly centered on the roadway and extends in an “X” shape. The deformation of the roadway is mainly due to the influence of shear damage. Among them, the shoulders and floor of the two sides of the roadway are sensitive areas that are extremely vulnerable to damage, and the plastic zone first appears and concentrates here. The two shoulders of the straight wall semicircular arch roadway first exhibited shear failure. With the progress of excavation, the shear failure of the roof of the roadway gradually expanded, while the shear failure and tensile failure on the two sides evolved simultaneously. Finally, because the two sides of the roof are mainly subjected to shear stress, the roof sinks and the two sides move inward; the surrounding rock withstands shear failure, while the floor is mainly subjected to a horizontal pulling force, the bottom heave swells, and the floor undergoes tensile failure.

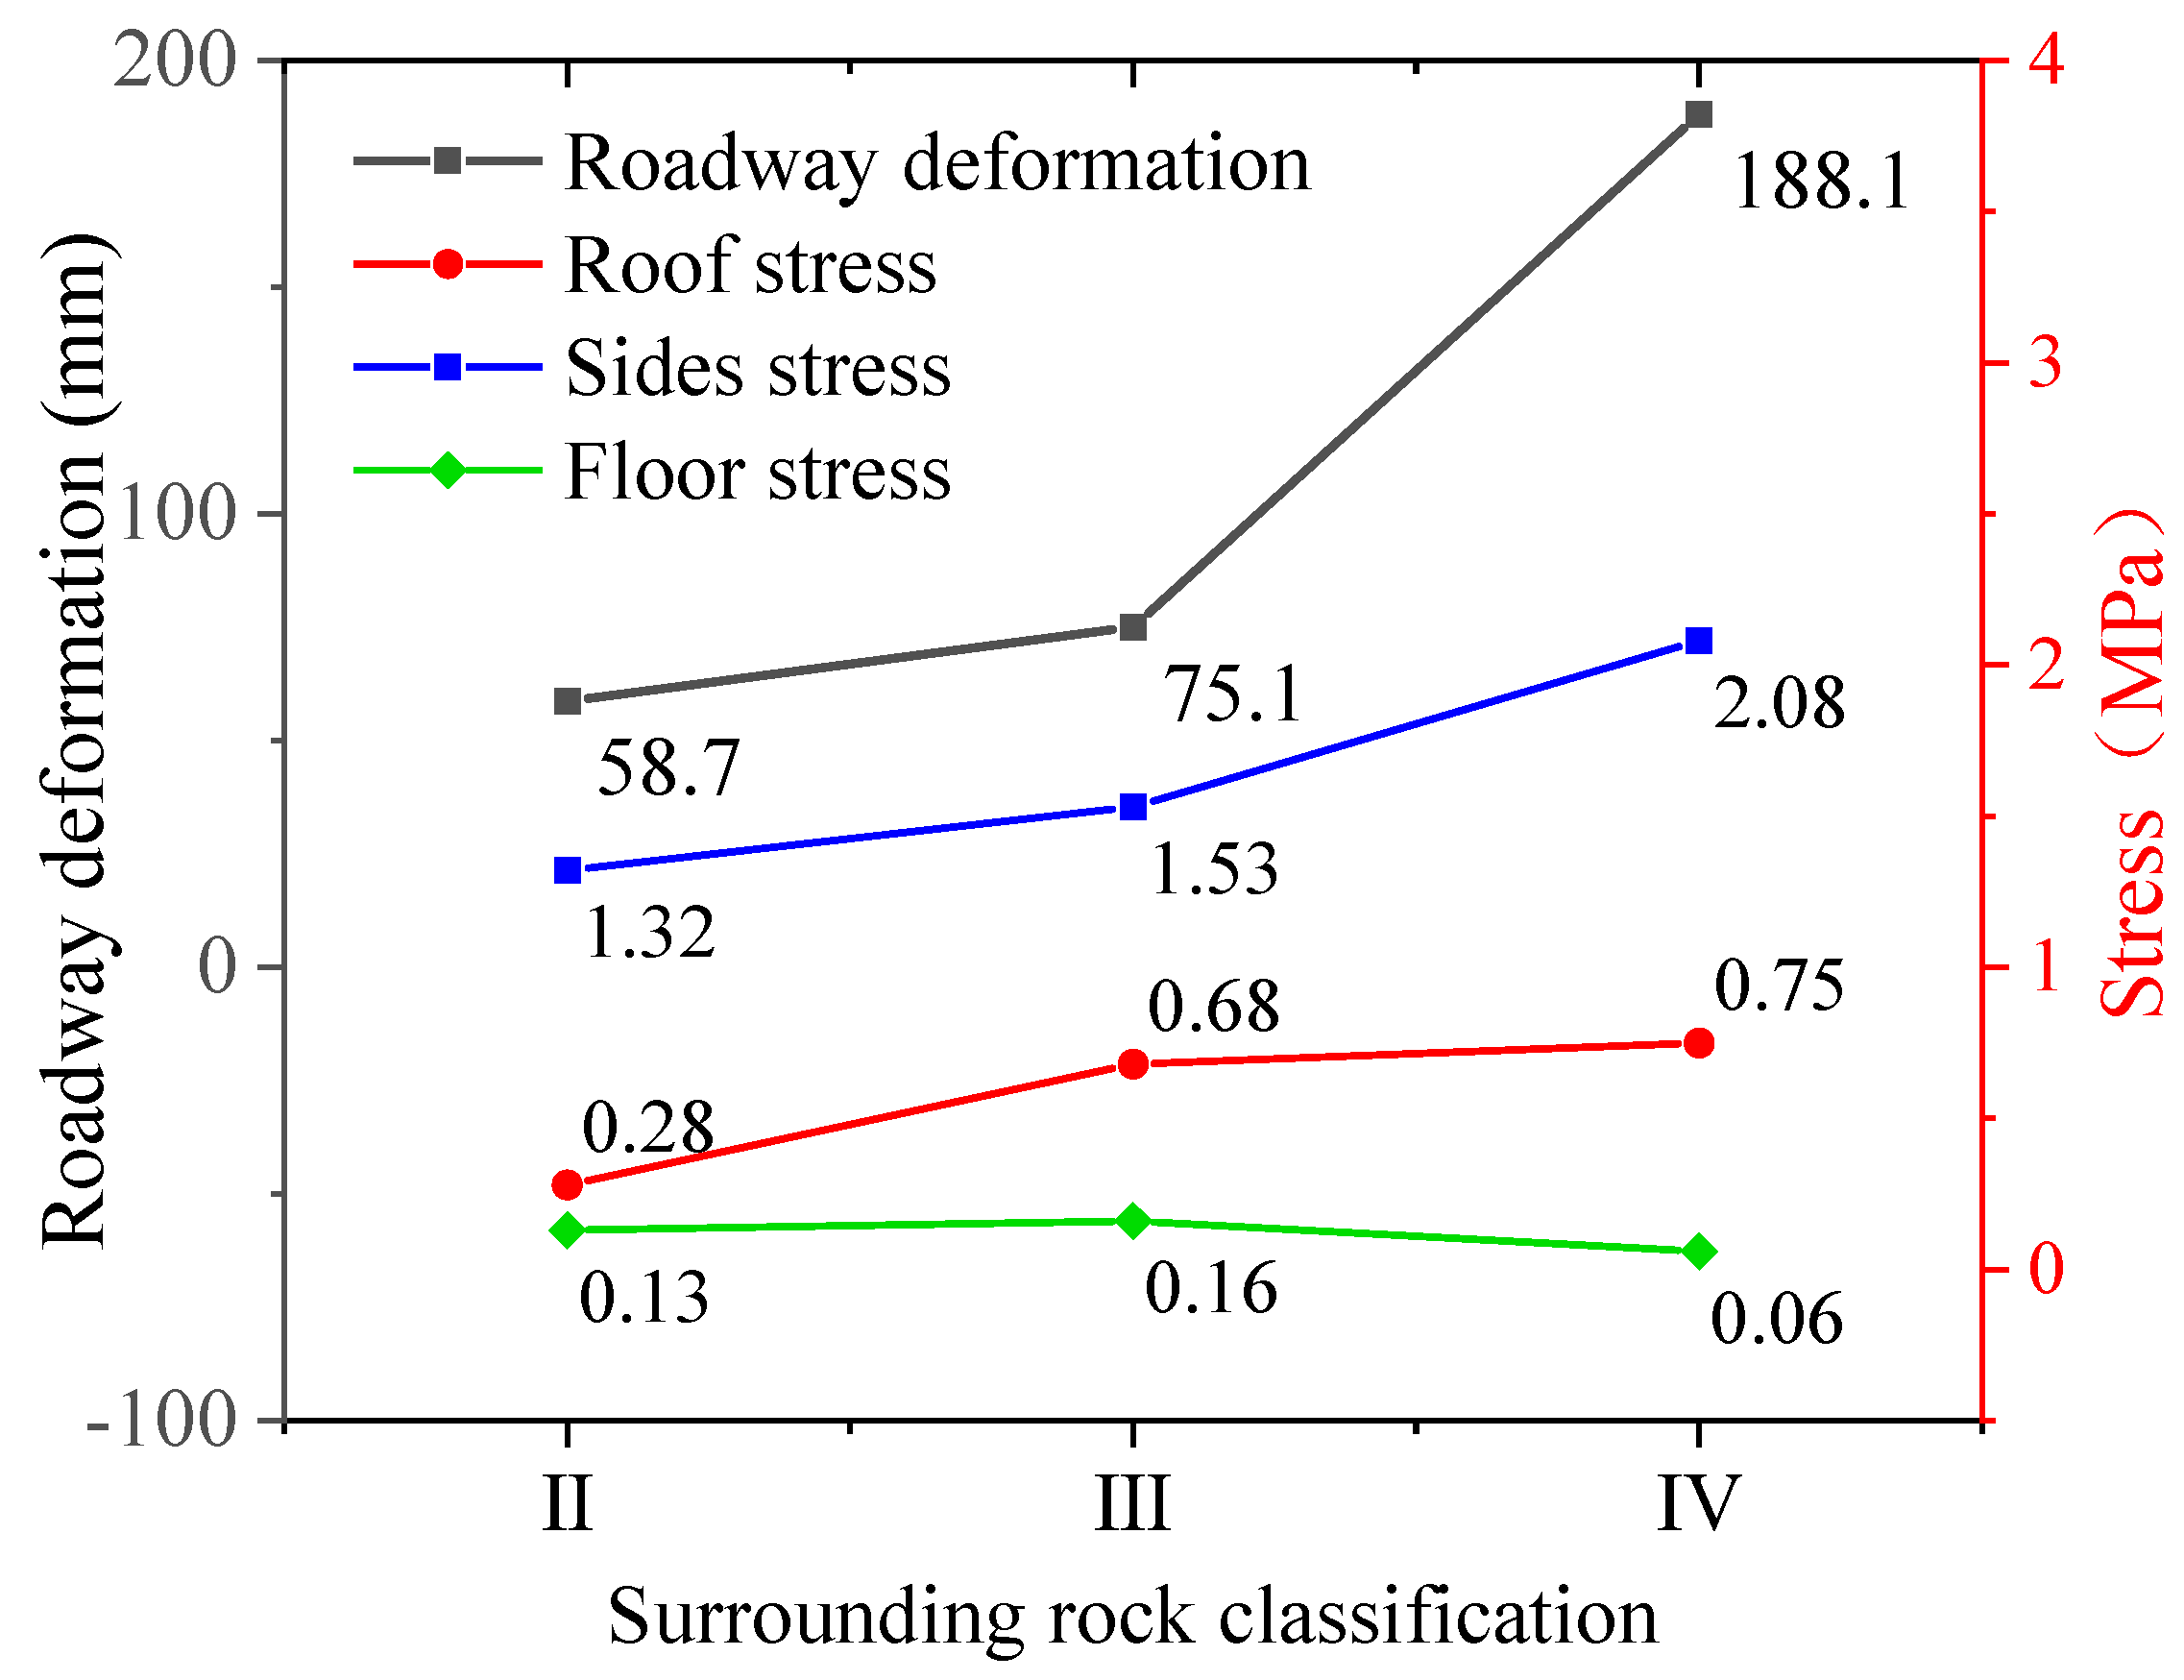
4.5. Comprehensive Analysis of Surrounding Rock Classification

The composition parameters of the strength of the surrounding rock were complex. The main parameters include cohesion, internal friction angle, and tensile strength. These different surrounding rock mechanical parameters do not exist in isolation, and they are interrelated and mutually restricted. The influence of various parameters on the strength of the surrounding rock was determined in a previous study [58,59,60,61,62]. Taking into consideration the findings and results of the above research in combination with the characteristics of surrounding rock grades, this article discusses the deformation of roadways under common surrounding rock grades II–IV. The relevant parameters are listed in Table 7 and the simulation results are shown in Figure 7 and Figure 8.
It can be observed from Figure 8 that with a continuous increase of the level of the surrounding rock, the growth rate of roadway deformation gradually increases and the deformation deterioration becomes more serious. Additionally, the horizontal stress on the two sides is significantly higher than the vertical stress on the roof and both gradually increase with the grade of the surrounding rock, whereas the vertical stress on the floor does not change significantly and remains nearly constant at approximately 0.1 MPa. It can be seen from Figure 9 that the plastic zone is still dominated by shear failure and the roadway floor mainly exhibits tensile failure. Evidently, the distribution area of the plastic zone continues to expand with the grade of the surrounding rock, and the shear plastic zone continues to extend in an “X” shape. The plastic zone of the grade II surrounding rock has the smallest area and is also the most stable, whereas the plastic zone of the grade IV surrounding rock has the widest distribution area, a loose structure, and poor resistance to deformation. Furthermore, as the level of the surrounding rock increases, its stability worsens and greater is the impact on the degraded deformation of the roadway.

4.6. On-Site Verification

During the stopping period, the evolutionary process of mine pressure is shown as a cycle of “accumulation–transformation–release.” In this process, a part of the energy is released in the form of electromagnetic waves [63,64,65]. Therefore, analyzing the distribution characteristics of the electromagnetic radiation energy in the mining process plays an important role in revealing the roadway deformation characteristics and evolution process. In this study, a KJ550 stress-monitoring system, resistance monitoring system of hydraulic support, and KBD5 portable electromagnetic radiation instrument were used to analyze the fracture characteristics of coal and rock in front of the working face, and the data of the transportation along the channel before the occurrence of the “6 August rockburst accident” at the 2233 working face of the Fuxin Hengda Coal Mine was selected for analysis. After the rockburst accident occurred on 6 August, three impact damage sections appeared and the section with a distance of 68 m was the most severe impact damage section. The electromagnetic radiation data were received at 20 measuring points in front of the working face on 9 August, with a test interval of 10 m (Figure 9).
The stress and electromagnetic radiation intensity can reflect the local stress level. High-stress areas will significantly reduce the physical and mechanical properties of coal and rock mass, which promotes roadway damage and sudden instability [66,67,68]. It can be seen from Figure 10 that before the rockburst accident the deep coal seam stress in front of the working face increased sharply from 9.2 to 19 MPa, leading to the occurrence of the rockburst: the stress dropped linearly to approximately 3 MPa after the impact. Simultaneously, the resistance of the corresponding hydraulic support also increased sharply before dropping significantly after the impact, because it did not cause any major damage and can still play a supporting role later. Concurrently, the electromagnetic radiation intensity showed an inverted-N-shaped fluctuation trend, i.e., down-up-down, in the monitoring interval. It reached its lowest value on 5 August when the impact risk was the greatest, according to literature records: this is a typical strong shock signal law. On 6 August, the roadway experienced rockbursts and the site survey revealed that the main damage area of the roadway was 68 m outside the front of the working face because of the impact. This corresponds to the relatively high value of the electromagnetic radiation in the early stage, which is a good precursor phenomenon, and the other two damaged areas correspond to relatively low points of electromagnetic radiation. After the impact, the stress dropped sharply and the electromagnetic radiation intensity presented a relatively stable wave-like distribution in the direction of the working surface. There was no obvious high-value concentration area, indicating that after the impact the coal in the broken zone is completely unstable and the plastic zone and elastic zone are again affected by the supporting stress. Accurate identification of the high-stress zone of the roadway is of great significance for strengthening the support to prevent roadway deformation, as well as roadway pressure shock.

4.7. Limitations and Perspectives

The limitations of this paper are mainly reflected by these points:
(1) For the plastic zones, qualitative analysis is only carried out on the distribution area of shear failure and tensile failure. In the future, the volume of the plastic zones of tensile stress and shear stress failure can be further obtained for quantitative analysis;
(2) In this paper, the internal friction angle is used because the FLAC3D software simulation needs to input the internal friction angle, but the Mohr–Coulomb modular configuration is to calculate the tangent of the internal friction angle, that is, the friction coefficient. The internal friction angle simulated in this paper increases linearly, while the corresponding friction coefficient changes nonlinearly;
(3) The orthogonal test has the characteristics of high efficiency, convenience, and few tests, but the method obtained by orthogonality is only a series of combinations of representative test level parameters, and the results will not exceed the range of the selected level.
The suggestion for future work is to continue to improve the model and reduce the limitations, so that the model can more accurately describe the deformation and deterioration characteristics of the surrounding rock in the deep roadway [69].
(1) In a future model, we aim to simulate a more realistic deep mine environment, improve the geological conditions models (stratigraphic dip, fault occurrence, etc.), simulate the optimization of roadway support (bolt length, row spacing, and pre-tightening force, etc.), and determine the best way of support control to keep the roadway in a stable state;
(2) The evaluation index of the stability of the surrounding rock of the roadway is not only limited to the displacement and deformation of the roadway, but also should integrate many factors, such as the extensive damage-depth of the surrounding rock caused by the deterioration of the roadway; the volume of the plastic zones; and the accumulation, dissipation, and release of elastic energy, etc.;
(3) It is better to check the accuracy of the results of the orthogonal test through a comprehensive test. In this way, the modelling results can make up for the limitations of the small amount of data in the orthogonal test, obtain a larger quantity and wider range of information, and more accurately describe the influence of the surrounding rock under different parameters.

5. Conclusions

In this study, the FLAC3D software and orthogonal experiment method were used to analyze the influence of multiple factors, such as cohesion c, tensile strength σ t , internal friction angle φ , vertical ground stress p, and horizontal-to-vertical stress ratio λ , on the deformation of a deeply buried roadway. Simultaneously, the characteristics of the temporal and spatial evolution of roadway deformation during the stopping period are discussed through the characteristics of the displacement, stress, and plastic zone. Research results show that:
(1) The physical and mechanical parameters of a rock mass play a major role in the roadway deformation. The order of influence degree under different parameters is: φ > p > σ t > λ > c . The changes in the internal friction angle φ and vertical ground stress p have the most significant effects. The internal friction angle is negatively correlated with roadway deformation, but the vertical ground stress is positively correlated;
(2) The tensile strengt σ t and horizontal-to-vertical stress ratio λ are most sensitive to the stress on the roof and the two sides, respectively, and both have a negative correlation. When cohesion c and vertical ground stress p increase, the stress on the two sides first increases and then decreases. The vertical stress on the floor changes very little;
(3) The tensile failure zones are distributed on the two sides and floor on the roadway, extending inward in the direction of excavation. Besides this, the scope of shear failure is most widely distributed and concentrated on the shoulders of the two sides and roof, and shear failure gradually extends from the roof in the left and right directions;
(4) With the increase of the surrounding rock grade, the deformation and the stress of the two sides and roof rise, whereas the stress acting on the floor is not obvious; the stability continues to weaken, the deterioration and deformation are more serious, the distribution of the plastic zone is wider, and more shear failure extends in the “X” shape;
(5) On-site electromagnetic radiation can effectively characterize the stress distribution in the roadway; when the electromagnetic radiation detected the overall high-intensity area, it reflects the distribution of the high-stress concentration area and the strength reduction area, which strongly supports the characteristics of coal and rock failure.

Author Contributions

Conceptualization, X.F. and Z.D.; methodology, X.F.; software, Z.D.; validation, Q.H., X.Z. and M.A.; formal analysis, Q.H.; investigation, X.F.; resources, X.Z.; data curation, M.A.; writing—original draft preparation, Z.D.; writing—review and editing, X.F.; visualization, Z.D.; supervision, J.T.B.; project administration, X.F.; funding acquisition, X.F. All authors have read and agreed to the published version of the manuscript.

Funding

This research was funded by the National Natural Science Foundation of China (52004267), National Science Foundation for Young Scientists of Jiangsu Province (BK20180644), and the China Postdoctoral Science Foundation (2020M672235). Elsevier Language Editing Services is warmly thanked for English edits.

Data Availability Statement

Not applicable.

Acknowledgments

This project is supported by the National Science Foundation for Young Scientists of Jiangsu Province, National Natural Science Foundation of China, and the China Postdoctoral Science Foundation.

Conflicts of Interest

The authors declare no conflict of interest.

References

  1. Frith, R.; Reed, G.; Jones, A. A Causation Mechanism for Coal Bursts during Roadway Development Based on the Major Horizontal Stress in Coal: Very Specific Structural Geology Causing a Localised Loss of Effective Coal Confinement and Newton’s Second Law. Int. J. Min. Sci. Technol. 2020, 30, 39–47. [Google Scholar] [CrossRef]
  2. Gale, W.J. A Review of Energy Associated with Coal Bursts. Int. J. Min. Sci. Technol. 2018, 28, 755–761. [Google Scholar] [CrossRef]
  3. Wojtecki, Ł.; Konicek, P. Estimation of Active Rockburst Prevention Effectiveness during Longwall Mining under Disadvantageous Geological and Mining Conditions. J. Sustain. Min. 2016, 15, 1–7. [Google Scholar] [CrossRef] [Green Version]
  4. Hosseini, N. Evaluation of the Rockburst Potential in Longwall Coal Mining Using Passive Seismic Velocity Tomography and Image Subtraction Technique. J. Seism. 2017, 21, 1101–1110. [Google Scholar] [CrossRef]
  5. Li, Z.; Zhang, X.; Wei, Y.; Ali, M. Experimental Study of Electric Potential Response Characteristics of Different Lithological Samples Subject to Uniaxial Loading. Rock Mech. Rock Eng. 2021, 54, 397–408. [Google Scholar] [CrossRef]
  6. Jia, Z.; Xie, H.; Zhang, R.; Li, C.; Wang, M.; Gao, M.; Zhang, Z.; Zhang, Z. Acoustic Emission Characteristics and Damage Evolution of Coal at Different Depths Under Triaxial Compression. Rock Mech. Rock Eng. 2020, 53, 2063–2076. [Google Scholar] [CrossRef]
  7. Xu, J.; Wang, E.; Zhou, R. Real-Time Measuring and Warning of Surrounding Rock Dynamic Deformation and Failure in Deep Roadway Based on Machine Vision Method. Measurement 2020, 149, 107028. [Google Scholar] [CrossRef]
  8. Chen, X.; Li, L.; Wang, L.; Qi, L. The Current Situation and Prevention and Control Countermeasures for Typical Dynamic Disasters in Kilometer-Deep Mines in China. Saf. Sci. 2019, 115, 229–236. [Google Scholar] [CrossRef]
  9. Khalymendyk, I.; Baryshnikov, A. The Mechanism of Roadway Deformation in Conditions of Laminated Rocks. J. Sustain. Min. 2018, 17, 41–47. [Google Scholar] [CrossRef]
  10. Feng, X.; Zhang, Q. The Effect of Backfilling Materials on the Deformation of Coal and Rock Strata Containing Multiple Goaf: A Numerical Study. Minerals 2018, 8, 224. [Google Scholar] [CrossRef] [Green Version]
  11. Wang, K.; Du, F. Coal-Gas Compound Dynamic Disasters in China: A Review. Process Saf. Environ. Prot. 2020, 133, 1–17. [Google Scholar] [CrossRef]
  12. Zhang, W.; He, Z.; Zhang, D.; Qi, D.; Zhang, W. Surrounding Rock Deformation Control of Asymmetrical Roadway in Deep Three-Soft Coal Seam: A Case Study. J. Geophys. Eng. 2018, 15, 1917. [Google Scholar] [CrossRef] [Green Version]
  13. Pan, C.; Xia, B.; Yu, B.; Yu, P.; Luo, Y.; Gao, Y. Determination of the Key Parameters of High-Position Hard Roofs for Vertical-Well Stratified Fracturing to Release Strong Ground Pressure Behavior in Extra-Thick Coal Seam Mining. Energy Sci. Eng. 2020, 8, 2216–2238. [Google Scholar] [CrossRef] [Green Version]
  14. Zhao, W.; Fu, H.; Song, Y.; Ma, H.; Li, X. Failure Mechanism and support Optimization of Surrounding Rock in Fault Crossing Roadway. Min. Res. Dev. 2021, 41, 129–134. [Google Scholar]
  15. Ding, M.; Guo, P.; Peng, Y. Simulation study on slip failure of roadway surrounding rocks containing weak layer. Saf. Coal Mines 2021, 52, 237–244. [Google Scholar]
  16. Sun, Y.; Li, G.; Zhang, J.; Qian, D. Experimental and Numerical Investigation on a Novel Support System for Controlling Roadway Deformation in Underground Coal Mines. Energy Sci. Eng. 2020, 8, 490–500. [Google Scholar] [CrossRef] [Green Version]
  17. Jia, H.; Pan, K.; Liu, S.; Zhang, L.; Fan, K.; Niu, Z.; Zhuo, J.; Wang, Q. Mechanism and Prediction Method of Rock Layer Separation Failure of Composite Roof in Mining Roadway. J. Min. Strat. Control Eng. 2021, 38, 518–527. [Google Scholar]
  18. Kabwe, E. Confining Stress Effect on the Elastoplastic Ground Reaction Considering the Lode Angle Dependence. Int. J. Min. Sci. Technol. 2020, 30, 431–440. [Google Scholar] [CrossRef]
  19. Al Hattamleh, O.; Muhunthan, B. Evolution of Strain Gradient Formulation in Capturing Localization Phenomena in Granular Materials. J. Eng. Mater. Technol.-Trans. ASME 2022, 144, 011003. [Google Scholar] [CrossRef]
  20. Ding, F. Research on Fracture Mechanism of High Ground Stress Fracture Rock Tunnel and Auxiliary Construction Measures. AIP Conf. Proc. 2018, 2036, 030058. [Google Scholar] [CrossRef]
  21. Sikora, P.; Wesolowski, M. Numerical Assessment of the Influence of Former Mining Activities and Plasticity of Rock Mass on Deformations of Terrain Surface. Int. J. Min. Sci. Technol. 2021, 31, 209–214. [Google Scholar] [CrossRef]
  22. Tuncay, D.; Tulu, I.B.; Klemetti, T. Verification of 3D Numerical Modeling Approach for Longwall Mines with a Case Study Mine from the Northern Appalachian Coal Fields. Min. Metall. Explor. 2021, 38, 447–456. [Google Scholar] [CrossRef]
  23. Sinha, S.; Walton, G. Investigation of Pillar Damage Mechanisms and Rock-Support Interaction Using Bonded Block Models. Int. J. Rock Mech. Min. Sci. 2021, 138, 104652. [Google Scholar] [CrossRef]
  24. Feng, X.; Zhang, Q.; Wang, E.; Ali, M.; Dong, Z.; Zhang, G. 3D Modeling of the Influence of a Splay Fault on Controlling the Propagation of Nonlinear Stress Waves Induced by Blast Loading. Soil Dyn. Earthq. Eng. 2020, 138, 106335. [Google Scholar] [CrossRef]
  25. Feng, X.; Zhang, Q.; Ali, M. 3D Modelling of the Strength Effect of Backfill-Rocks on Controlling Rockburst Risk: A Case Study. Arab. J. Geosci. 2020, 13, 128. [Google Scholar] [CrossRef]
  26. Darvishi, A.; Ataei, M.; Rafiee, R. Investigating the Effect of Simultaneous Extraction of Two Longwall Panels on a Maingate Gateroad Stability Using Numerical Modeling. Int. J. Rock Mech. Min. Sci. 2020, 126, 104172. [Google Scholar] [CrossRef]
  27. Mahdevari, S. Prediction of Tailgate Stability in Mechanized Longwall Mines Using an Improved Support Vector Regression Model. Arab. J. Geosci. 2021, 14, 216. [Google Scholar] [CrossRef]
  28. Liao, Z. Analysis of Influence Factors on Deformation and Failure of Straight Wall Semi-circular Arched Tunnel. Saf. Coal Mines 2018, 49, 187–189. [Google Scholar]
  29. Yu, Y.; Qin, Z.; Wang, X.; Zhang, L.; Chen, D.; Zhu, S. Development of Modified Grouting Material and Its Application in Roadway Repair Engineering. Geofluids 2021, 1–15. [Google Scholar] [CrossRef]
  30. Sobczyk, E.J.; Kopacz, M. Assessing Geological and Mining Condition Nuisance and Its Impact on the Cost of Exploitation in Hard Coal Mines with the Use of a Multi-Criterion Method. Arch. Min. Sci. 2018, 63, 665–686. [Google Scholar] [CrossRef]
  31. Sobczyki, E.J.; Sokolowski, A.; Kopacz, M.; Fijorek, K.; Denkowska, S. The Analysis of Dependence of the Level of Operational Costs and Production Outputs upon Geological and Mining Conditions in Selected Hard Coal Mines in Poland. Gospod. Surowcami. Miner. 2020, 36, 75–95. [Google Scholar] [CrossRef]
  32. Yu, K.; Ren, F.; Puscasu, R.; Lin, P.; Meng, Q. Optimization of Combined Support in Soft-Rock Roadway. Tunn. Undergr. Space Technol. 2020, 103, 103502. [Google Scholar] [CrossRef]
  33. Canto-Perello, J.; Luis Morera-Escrich, J.; Martin-Utrillas, M.; Curiel-Esparza, J. Restoration Prioritization Framework for Roadway High Cut Slopes to Reverse Land Degradation and Fragmentation. Land Use Pol. 2018, 71, 470–479. [Google Scholar] [CrossRef]
  34. Wang, C.; Zhang, C.; Li, Y.; Zheng, C. Numerical Investigation of the Mechanical Properties of Coal Masses with T-Junctions Cleat Networks under Uniaxial Compression. Int. J. Coal Geol. 2019, 202, 128–146. [Google Scholar] [CrossRef]
  35. Korkmaz, A.A. Modeling of the Effect of Falcon Concentrator Parameters on Lignite Deashing with Taguchi Orthogonal Design. Int. J. Coal Prep. Util. 2021, 41, 767–775. [Google Scholar] [CrossRef]
  36. Farkas, B.; Hrastov, A. Multi-Criteria Analysis for the Selection of the Optimal Mining Design Solution-A Case Study on Quarry “Tambura”. Energies 2021, 14, 3200. [Google Scholar] [CrossRef]
  37. Paul, A.; Deshamukhya, T.; Pal, J. Investigation and Utilization of Indian Peat in the Energy Industry with Optimal Site-Selection Using Analytic Hierarchy Process: A Case Study in North-Eastern India. Energy 2022, 239, 122169. [Google Scholar] [CrossRef]
  38. Sun, Z.; Wu, Y.; Lu, Z.; Feng, Y.; Chu, X.; Yi, K. Stability Analysis and Derived Control Measures for Rock Surrounding a Roadway in a Lower Coal Seam under Concentrated Stress of a Coal Pillar. Shock Vib. 2020, 2020, e6624983. [Google Scholar] [CrossRef]
  39. Yuan, C.; Wang, W.; Fan, L. Study on Distribution Law and Influencing Factors of Surrounding Rock Plastic Zone in Mining Roadway. J. Vibroeng. 2019, 21, 1127–1138. [Google Scholar] [CrossRef]
  40. Qin, D.; Wang, X.; Zhang, D.; Chen, X. Study on Surrounding Rock-Bearing Structure and Associated Control Mechanism of Deep Soft Rock Roadway Under Dynamic Pressure. Sustainability 2019, 11, 1892. [Google Scholar] [CrossRef] [Green Version]
  41. Yuan, C.; Cao, L.; Fan, L.; Guo, J. Theoretical Analysis on Distribution Pattern of Plastic Zone in Surrounding Rock of High-Gas-Coal Roadway. Adv. Civ. Eng. 2021, 2021, e6684243. [Google Scholar] [CrossRef]
  42. Yang, L.; Chen, S.; Dong, P.; Wang, Q.; Huang, C. Orthogonal Analysis and Numerical Simulation of Rock Mechanics Parameters in Stress Field of Shaft Heading Face. Adv. Mater. Sci. Eng. 2020, 2020, e3107364. [Google Scholar] [CrossRef]
  43. Qin, Z.; Cao, B.; Li, T.; Yu, X.; Chen, G. Comprehensive Experimental Study of Affecting Factors on Rectangular Roadway Stability. Adv. Civ. Eng. 2020, 2020, e1934068. [Google Scholar] [CrossRef]
  44. Chen, Y.; Gao, M.; Li, L.; Shi, S.; Zhou, Z.; Zhang, M. Contributory Factors and Distribution Characteristics of Asymmetric Deformation in Deep Tunnel. Geotech. Geol. Eng. 2021, 39, 1223–1236. [Google Scholar] [CrossRef]
  45. Zhang, P.; Wang, J.; Jiang, L.; Zhou, T.; Yan, X.; Yuan, L.; Chen, W. Influence Analysis and Stepwise Regression of Coal Mechanical Parameters on Uniaxial Compressive Strength Based on Orthogonal Testing Method. Energies 2020, 13, 3640. [Google Scholar] [CrossRef]
  46. Nguyen, P.M.V.; Rotkegel, M.; Van, H.D. Analysis of Behaviour of the Steel Arch Support in the Geological and Mining Conditions of the Cam Pha Coal Basin, Vietnam. Arch. Min. Sci. 2020, 65, 551–567. [Google Scholar] [CrossRef]
  47. Ozdogan, M.V.; Yenice, H.; Gonen, A.; Karakus, D. Optimal Support Spacing for Steel Sets: Omerler Underground Coal Mine in Western Turkey. Int. J. Geomech. 2018, 18, 05017003. [Google Scholar] [CrossRef]
  48. Sahoo, B.R.; Palei, S.K. Study on New Type of Roadway Side Support Technology in Coal Mines. J. Min. Sci. 2020, 56, 616–630. [Google Scholar] [CrossRef]
  49. Das, A.J.; Mandal, P.K.; Sahu, S.P.; Kushwaha, A.; Bhattacharjee, R.; Tewari, S. Evaluation of the Effect of Fault on the Stability of Underground Workings of Coal Mine through DEM and Statistical Analysis. J. Geol. Soc. India 2018, 92, 732–742. [Google Scholar] [CrossRef]
  50. Mahdevari, S.; Hayati, M. Finite-Difference Based Response Surface Methodology to Optimize Tailgate Support Systems in Longwall Coal Mining. Sci. Rep. 2021, 11, 2321. [Google Scholar] [CrossRef]
  51. Baryshnikov, V.D.; Khmelinin, A.P.; Baryshnikov, D.V. Experimental Assessment of Stresses in Enclosing Rock Mass of Aikhal Mine. In Challenges for Development in Mining Science and Mining Industry; Kurlenya, M., Ed.; Iop Publishing Ltd.: Bristol, UK, 2019; Volume 262, p. 012008. [Google Scholar]
  52. Chen, D.; Zhang, Q.; Xie, S.; Jiang, Z.; Li, Y.; Gao, M.; Li, H.; Wu, X.; Wang, E.; Shi, S.; et al. Combined Support Technology for Main Roadway Passing through Goaf: A Case Study. Energy Sci. Eng. 2020, 8, e787. [Google Scholar] [CrossRef]
  53. Yan, S.; Guo, F.; Chen, F.; Cao, Y.; He, Z. Research on Low-Density Cross-Border Support Technology for Large-Section Coal Roadway in Shallow-Buried Thick Coal Seam. Geotech. Geol. Eng. 2021. [Google Scholar] [CrossRef]
  54. Bagde, M.N.; Sangode, A.G.; Jhanwar, J.C. Evaluation of Stoping Parameters through Instrumentation and Numerical Modelling in Manganese Mine in India: A Case Study. Procedia Eng. 2017, 191, 10–19. [Google Scholar] [CrossRef]
  55. Wang, J.; Ning, J.-G.; Tan, Y.-L.; Hu, S.-C.; Guo, W.-Y. Deformation and Failure Laws of Roadway Surrounding Rock and Support Optimization during Shallow-Buried Multi-Seam Mining. Geomat. Nat. Hazards Risk 2020, 11, 191–211. [Google Scholar] [CrossRef]
  56. Kong, P.; Jiang, L.; Jiang, J.; Wu, Y.; Chen, L.; Ning, J. Numerical Analysis of Roadway Rock-Burst Hazard under Superposed Dynamic and Static Loads. Energies 2019, 12, 3761. [Google Scholar] [CrossRef] [Green Version]
  57. Kang, Y.; Liu, Q.; Xi, H. Numerical Analysis of THM Coupling of a Deeply Buried Roadway Passing through Composite Strata and Dense Faults in a Coal Mine. Bull Eng. Geol. Environ. 2014, 73, 77–86. [Google Scholar] [CrossRef]
  58. Zhang, M.; Jiang, F. Rock Burst Criteria and Control Based on an Abutment-Stress-Transfer Model in Deep Coal Roadways. Energy Sci. Eng. 2020, 8, 2966–2975. [Google Scholar] [CrossRef]
  59. Maynard, J.J.; Salley, S.W.; Beaudette, D.E.; Herrick, J.E. Numerical Soil Classification Supports Soil Identification by Citizen Scientists Using Limited, Simple Soil Observations. Soil Sci. Soc. Am. J. 2020, 84, 1675–1692. [Google Scholar] [CrossRef]
  60. Rajabi, M.; Rahmannejad, R.; Rezaei, M. Studying the Deformation and Stability of Rock Mass Surrounding the Power Station Caverns Using NA and GEP Models. Struct. Eng. Mech. 2021, 79, 35–50. [Google Scholar] [CrossRef]
  61. Mazurek, K.; Szygula, M.; Figiel, A.; Filipowicz, K. Continuous Support for Roadways. Energies 2021, 14, 5801. [Google Scholar] [CrossRef]
  62. Gupta, N.; Mishra, B. Experimental Investigation of Time-Dependent Deformation in Brittle Marcellus Shale. Min. Metall. Explor. 2021, 38, 1943–1953. [Google Scholar] [CrossRef]
  63. Mydlikowski, R.; Maniak, K. Dynamics of Autonomous Rock Electromagnetic Radiation Measurement Instrumentation. Bull. Pol. Acad. Sci.-Tech. Sci. 2021, 69, e138567. [Google Scholar] [CrossRef]
  64. Wang, H.; Wang, E.; Li, Z.; Wang, X.; Li, D.; Ali, M.; Zhang, Q. Varying Characteristics of Electromagnetic Radiation from Coal Failure during Hydraulic Flushing in Coal Seam. Arab. J. Geosci. 2020, 13, 644. [Google Scholar] [CrossRef]
  65. Xu, X.; Wang, Q.; Liu, H.; Zhao, W.; Zhang, Y.; Wang, C. Experimental Investigation on the Characteristics of Transient Electromagnetic Radiation during the Dynamic Fracturing Progress of Gas-Bearing Coal. J. Geophys. Eng. 2020, 17, 799–812. [Google Scholar] [CrossRef]
  66. Zhang, Z.; Wang, E.; Liu, X.; Zhang, Y.; Li, S.; Khan, M.; Gao, Y. Anisotropic Characteristics of Ultrasonic Transmission Velocities and Stress Inversion during Uniaxial Compression Process. J. Appl. Geophys. 2021, 186, 104274. [Google Scholar] [CrossRef]
  67. Song, D.; Wang, E.; Song, X.; Jin, P.; Qiu, L. Changes in Frequency of Electromagnetic Radiation from Loaded Coal Rock. Rock Mech. Rock Eng. 2016, 49, 291–302. [Google Scholar] [CrossRef]
  68. Zhang, Z.; Wang, E.; Liu, X.; Khan, M.; He, M.; Zhang, Y. Research on Source Location Method of Failure Process in Complex Rock Environment. Env. Earth Sci. 2021, 80, 392. [Google Scholar] [CrossRef]
  69. Zhang, Z.; Liu, X.; Zhang, Y.; Qin, X.; Khan, M. Comparative Study on Fracture Characteristics of Coal and Rock Samples Based on Acoustic Emission Technology. Theor. Appl. Fract. Mech. 2021, 111, 102851. [Google Scholar] [CrossRef]
Figure 1. Large deformation area of the roadway in the Fuxin Hengda Coal Mine and the stress of the surrounding rock of the roadway. (a) The photo of roadway damage in the Fuxin Hengda Coal Mine, (b) the deterioration and instability model of surrounding rock. Where the annular region of radius r o ~ R S is plastic flow zone, R S ~ R P is plastic softening zone, R P ~ R c is plastic hardening zone.
Minerals 12 00185 g001
Figure 2. Layout of the 2233 working face of the Hengda Coal Mine.
Minerals 12 00185 g002
Figure 3. The comprehensive geological histogram of the 2233 working face of the Fuxin Hengda Coal Mine.
Minerals 12 00185 g003
Figure 4. Geological histogram and numerical simulation model of straight wall semicircular arch roadway.
Minerals 12 00185 g004
Figure 5. The influence of different mechanical factors on roadway displacement.
Minerals 12 00185 g005
Figure 6. The changing trend of the stress of the roof, the floor, and the two sides under the influence of different factors.
Minerals 12 00185 g006
Figure 7. The failure cloud map of the plastic zone of the surrounding rock of the roadway during the mining period.
Minerals 12 00185 g007
Figure 8. Roadway deformation and stress changes under different surrounding rock levels.
Minerals 12 00185 g008
Figure 9. Changes of plastic zone under different surrounding rock levels.
Minerals 12 00185 g009
Figure 10. Changes in roadway stress, hydraulic resistance, and electromagnetic radiation intensity at 2233 working face of the Fuxin Hengda Coal Mine. (a) Schematic diagram of the area where the rockburst damage accident occurred, (b) vertical stress change diagram, (c) maximum support resistance change diagram, (d) average electromagnetic radiation intensity change diagram.
Minerals 12 00185 g010
Table 1. Numerical simulation experiment parameters.
Lithology
Grouping
Bulk
Modulus
K /GPa
Shear
Modulus
G /GPa
Cohesion
c /MPa
Internal
Friction
Angle
φ
Tensile Strength
σ t /MPa
Thickness
h /m
Density
ρ /(kg/m3)
Siltstone c113.6510.698.32386.58152535
Sand shale c212.339.886.54354.692455
Fine sandstone c315.879.228.9365.3132645
Coarse sandstone c49.977.353.75381.8472500
Coal c5ding1.70.851.5300.231350
Coal c5hang1.70.851.5300.231350
Sandy mudstone c611.9612.553.2443.372525
Siltstone c712.2210.792.5423.6152600
Medium sandstone c812.729.753.24372.67122650
Fine sandstone c913.0511.652.4403.8132665
Table 2. RI random consistency parameters and values.
n123456789
RI000.520.891.121.261.361.411.46
Table 3. Orthogonal experiment factor level analysis.
Level/FactorTensile Strength
σ t /MPa
Cohesion
c /MPa
Internal Friction Angle
φ
Vertical Ground Stress
p /MPa
Horizontal-to-Vertical
Stress Ratio
λ
Level 10.21.520151.0
Level 20.3230251.5
Level 30.42.540352.0
Level 40.5350452.5
Table 4. Orthogonal experiment schemes.
Experiment
Number
FactorIndex
Tensile Strength
σ t /MPa
Cohesion
c /MPa
Internal Friction Angle
φ
Vertical Ground Stress
p /MPa
Horizontal-to-Vertical Stress Ratio
λ
Roadway
Deformation
D/mm
10.21.52015145.37
20.2230251.547.78
30.22.540352187.19
40.2350452.5174.23
50.31.530352.5639.78
60.32204521285.14
70.32.550151.528.66
80.334025155.17
90.41.540451.5265.30
100.425035174.53
110.42.520252.5506.31
120.433015256.06
130.51.55025268.78
140.5240152.572.90
150.52.530451231.78
160.5320351.5326.37
Table 5. Analysis of extreme difference of roadway deformation.
ProjectTensile
Strength
σ t
Cohesion
c
Internal
Friction Angle
φ
Vertical
Ground Stress
p
Horizontal-to-Vertical
Stress Ratio
λ
Mean 1603.64394.81540.8050.74101.71
Mean 2502.19370.09243.85169.51167.02
Mean 3225.55238.49145.14306.97399.29
Mean 4206.96152.9686.55489.11418.37
Range value396.68241.85454.25438.37316.66
Table 6. Analysis of variance of roadway deformation.
SourceType III
Sum of Squares
Degree of
Freedom
Mean SquareFSignificance
Corrected model5,363,577.24 15357,571.82436.2370.000
Tensile strength σ t 1,140,994.43 3380,331.48464.0030.000
Cohesion c 344,515.81 3114,838.60140.1030.000
Internal friction angle φ 1,637,231.16 3545,743.72665.8060.000
Vertical ground stress p 1,495,514.05 3498,504.68608.1740.000
Horizontal-to-vertical stress ratio λ 745,321.78 3248,440.59303.0970.000
Error26,229.57 32819.67
Corrected total8,812,399.74 48
Table 7. Deformation and stress analysis of graded surrounding rock.
Surrounding Rock GradeBulk
Modulus
K /GPa
Shear
Modulus
G /GPa
Cohesion
c /MPa
Internal
Friction
Angle
φ
Tensile Strength
σ t /MPa
Density
ρ /(kg/m3)
Roadway Deformation
(mm)
Roof Stress
(MPa)
Sides Stress
(MPa)
Floor Stress
(MPa)
II grade11.0810.641.78456.2280058.70.281.320.13
III grade4.563.941.53375.5245075.10.681.530.16
IV grade1.960.260.77333.12200188.10.752.080.06
Publisher’s Note: MDPI stays neutral with regard to jurisdictional claims in published maps and institutional affiliations.

