1. Introduction
The deep earth comprises huge energy resources that ultimately contribute towards economic significance. In this context, exploring and researching the deep earth has become an important concern for China’s scientific and technological innovation [
1]. However, with the increase of mining depth and mining intensity of coal and other resources, the stope structure is increasingly becoming complex, resulting in frequent disasters such as rock burst. These disasters generally lead to severe vibration, deformation or collapse damage of the roadway, failure or instantaneous destruction of the support system, resulting in displacement, overturning, damage of production facilities and casualties in the roadway, which seriously threatens the safety of miners and industrial production [
2,
3,
4,
5]. Such disasters have resulted in worldwide casualties and economic losses in the past. For example, on 27 November 2017, a coal mine in Minbu Town, Magway Province, Myanmar collapsed, killing eight people. On 11 September 2020, a gold mine in Kamituga City, South Kivu province, Congo collapsed, killing more than 50 people. On 4 November 2020, a coal and gas outburst accident occurred in a coal mine in Tongchuan City, Shaanxi Province, China, killing eight people.
Accurate and effective monitoring is an important guarantee for preventing dynamic disasters. With the joint efforts of worldwide researchers, various coal and rock dynamic disaster prediction indicators have been put forward. However, at present, the prevention and control of mine rock bursts and other disasters is still demanding [
6]. In the process of coal rock failure, elastic wave, electromagnetic radiation (EMR) and charge release are accompanied [
7,
8,
9,
10]. Among them, EMR is a type of energy released in the form of an electromagnetic wave during the deformation and fracture of coal and rock under load. EMR monitoring technology has been proved to be an effective nondestructive testing method, used to monitor the whole failure process of rock from micro cracks to macro failures under loading. Compared with other geotechnical engineering measurement methods, electromagnetism has the advantages of directionality, no contact and continuous monitoring. At present, it has been widely used in mine coal and rock dynamic disaster monitoring [
11]. Frid et al. [
12] studied the electromagnetic signal characteristics caused by rock crack propagation and proposed a disaster prediction method based on the number of electromagnetic pulses of coal rock fracture. He et al. [
13] developed mine EMR monitoring equipment for dynamic monitoring rock burst hazard in the coal mining face. Lichtenberger et al. [
14] considered that the intensity of the EMR pulse is directly proportional to the shear stress and evaluated the direction of the maximum principal stress in the tunnel through the developed monitoring equipment. Qiu et al. [
15] used the positive correlation between the stress state of coal and rock and electromagnetism to monitor coal and gas outburst, considering that the electromagnetic intensity in the risk area of coal and gas outburst was high, and considering that the sudden increase of electromagnetism was the precursor of the outburst. Gade et al. [
16] studied the acoustic and electrical phenomena during the fracture of epoxy resin materials and explored the determination of the crack surface direction of carbon fiber reinforced polymer materials by EMR. Greiling et al. [
17] studied the relationship between EMR and the direction of formation principal stress, and considered that the direction of EMR is parallel or perpendicular to the crack surface. Furthermore, on this basis, a method to determine the formation shear zone by using EMR is proposed.
Studying the generation mechanism of EMR from coal and rock is the basis of the application of this technology. Previously, extensive research has been done on the electromagnetic response mechanism of coal and rock under load, achieving fruitful results, and defining various EMR mechanisms. Ogawa et al. [
18] believed that the walls on both sides of the new surface during rock failure have different electrical charges, and the crack propagation process was equivalent to the charge and discharge process of a dipole; therefore, electromagnetism signals outward. Cress et al. [
19] believed that the rotation and vibration of newly charged fragments during rock failure could stimulate low-frequency electromagnetic signals. Zhu et al. [
20] believed that the electromagnetic signals in the process of rock failure were generated by the accelerated movement of the charge at the crack tip with the crack propagation. Rabinovitch et al. [
21] conducted experimental research on the stage characteristics of low-frequency electromagnetic signals in the process of coal and rock failure. They proposed a model of electromagnetic signals excited by dipole oscillation at the crack tip. Pan et al. [
22] believed that the crack propagation caused by tensile stress in the process of tensile failure of coal and rock, resulting in damage localization, was one of the critical reasons for the generation of free charge. Han et al. [
23] studied the electromagnetic effect of rock under high stress and considered that the complex changes of the electromagnetic signal spectrum and amplitude in different failure stages were caused by different types of electric dipole produced by crack propagation. It is evident from the earlier studies that the electromagnetic response mechanism of coal rock failure is generally related to the crack propagation during loading. However, to the best of the author’s knowledge, none of these studies focused on the charge movement and excitement of the electromagnetic signal.
Acoustic emission (AE) can also be induced during crack propagation. In the general case, AE may occur during the deformation and fracture process of the coal in two situations—growth and propagation of new cracks, and friction and collision between cracks—and the AE activity will be larger and more concentrated during the fracture [
24].
Interestingly, it was found that in the process of coal and rock destruction, AE often appears simultaneously with EMR [
6,
25,
26,
27,
28]. Therefore, many scholars have researched the relationship between them. Wang et al. [
26] found that the EMR and AE of coal and rock increased with stress and decrease with the decreased of stress. Sa et al. [
27] found that the EMR of coal and rock has a memory effect different from the Kaiser effect of AE. They believed that the EMR is related to the generation and propagation of cracks and is a comprehensive reflection of coal and rock’s damage, deformation, and damage degree. Zhang [
28] believed that AE and EMR did not belong to synchronous signals—AE is directly related to crack development, while EMR is an indirect product of crack development.
Previous research has shown that in the process of coal fracture, EMR and AE always appear simultaneously. Their generation is closely related to crack propagation. The intensity of crack vibration determines the intensity of EMR and AE. The two technologies are often used in conjunction with coal mine disaster monitoring. Since AE is a mechanical wave, it can directly characterize the crack propagation process. The simultaneous use of EMR and AE is conducive to revealing the refinement process of coal failure. However, most of the past research mainly focused on the time series of the characteristic parameters of EMR and AE, such as events rate, events amplitude, intensity and pulse, and less on the waveform characteristics. In fact, both EMR and AE signals exist in the form of waves, with obvious nonlinear characteristics. At present, the nonlinear characteristics of EMR and AE waveform are not still in-depth researched; subsequently, the correlations and differences of their fine characteristics, which hold an imperative meaning for clarifying the relationship between coal and rock EMR and fracture and revealing the mechanism of EMR generation, are also rarely reported.
With the above motives, this paper intends to study the fine characteristics of EMR during coal splitting failure by Hilbert Huang Transformation and multi-fractal theory, and to compare with those of AE to reveal the correlation and difference between the two signals. On this basis, the excitation mechanism of electromagnetic radiation in the process of coal splitting failure is studied. The research results have theoretical value for the application of EMR and AE monitoring technology.
2. Experimental Scheme and Data Processing Method
2.1. Experimental System and Test Scheme
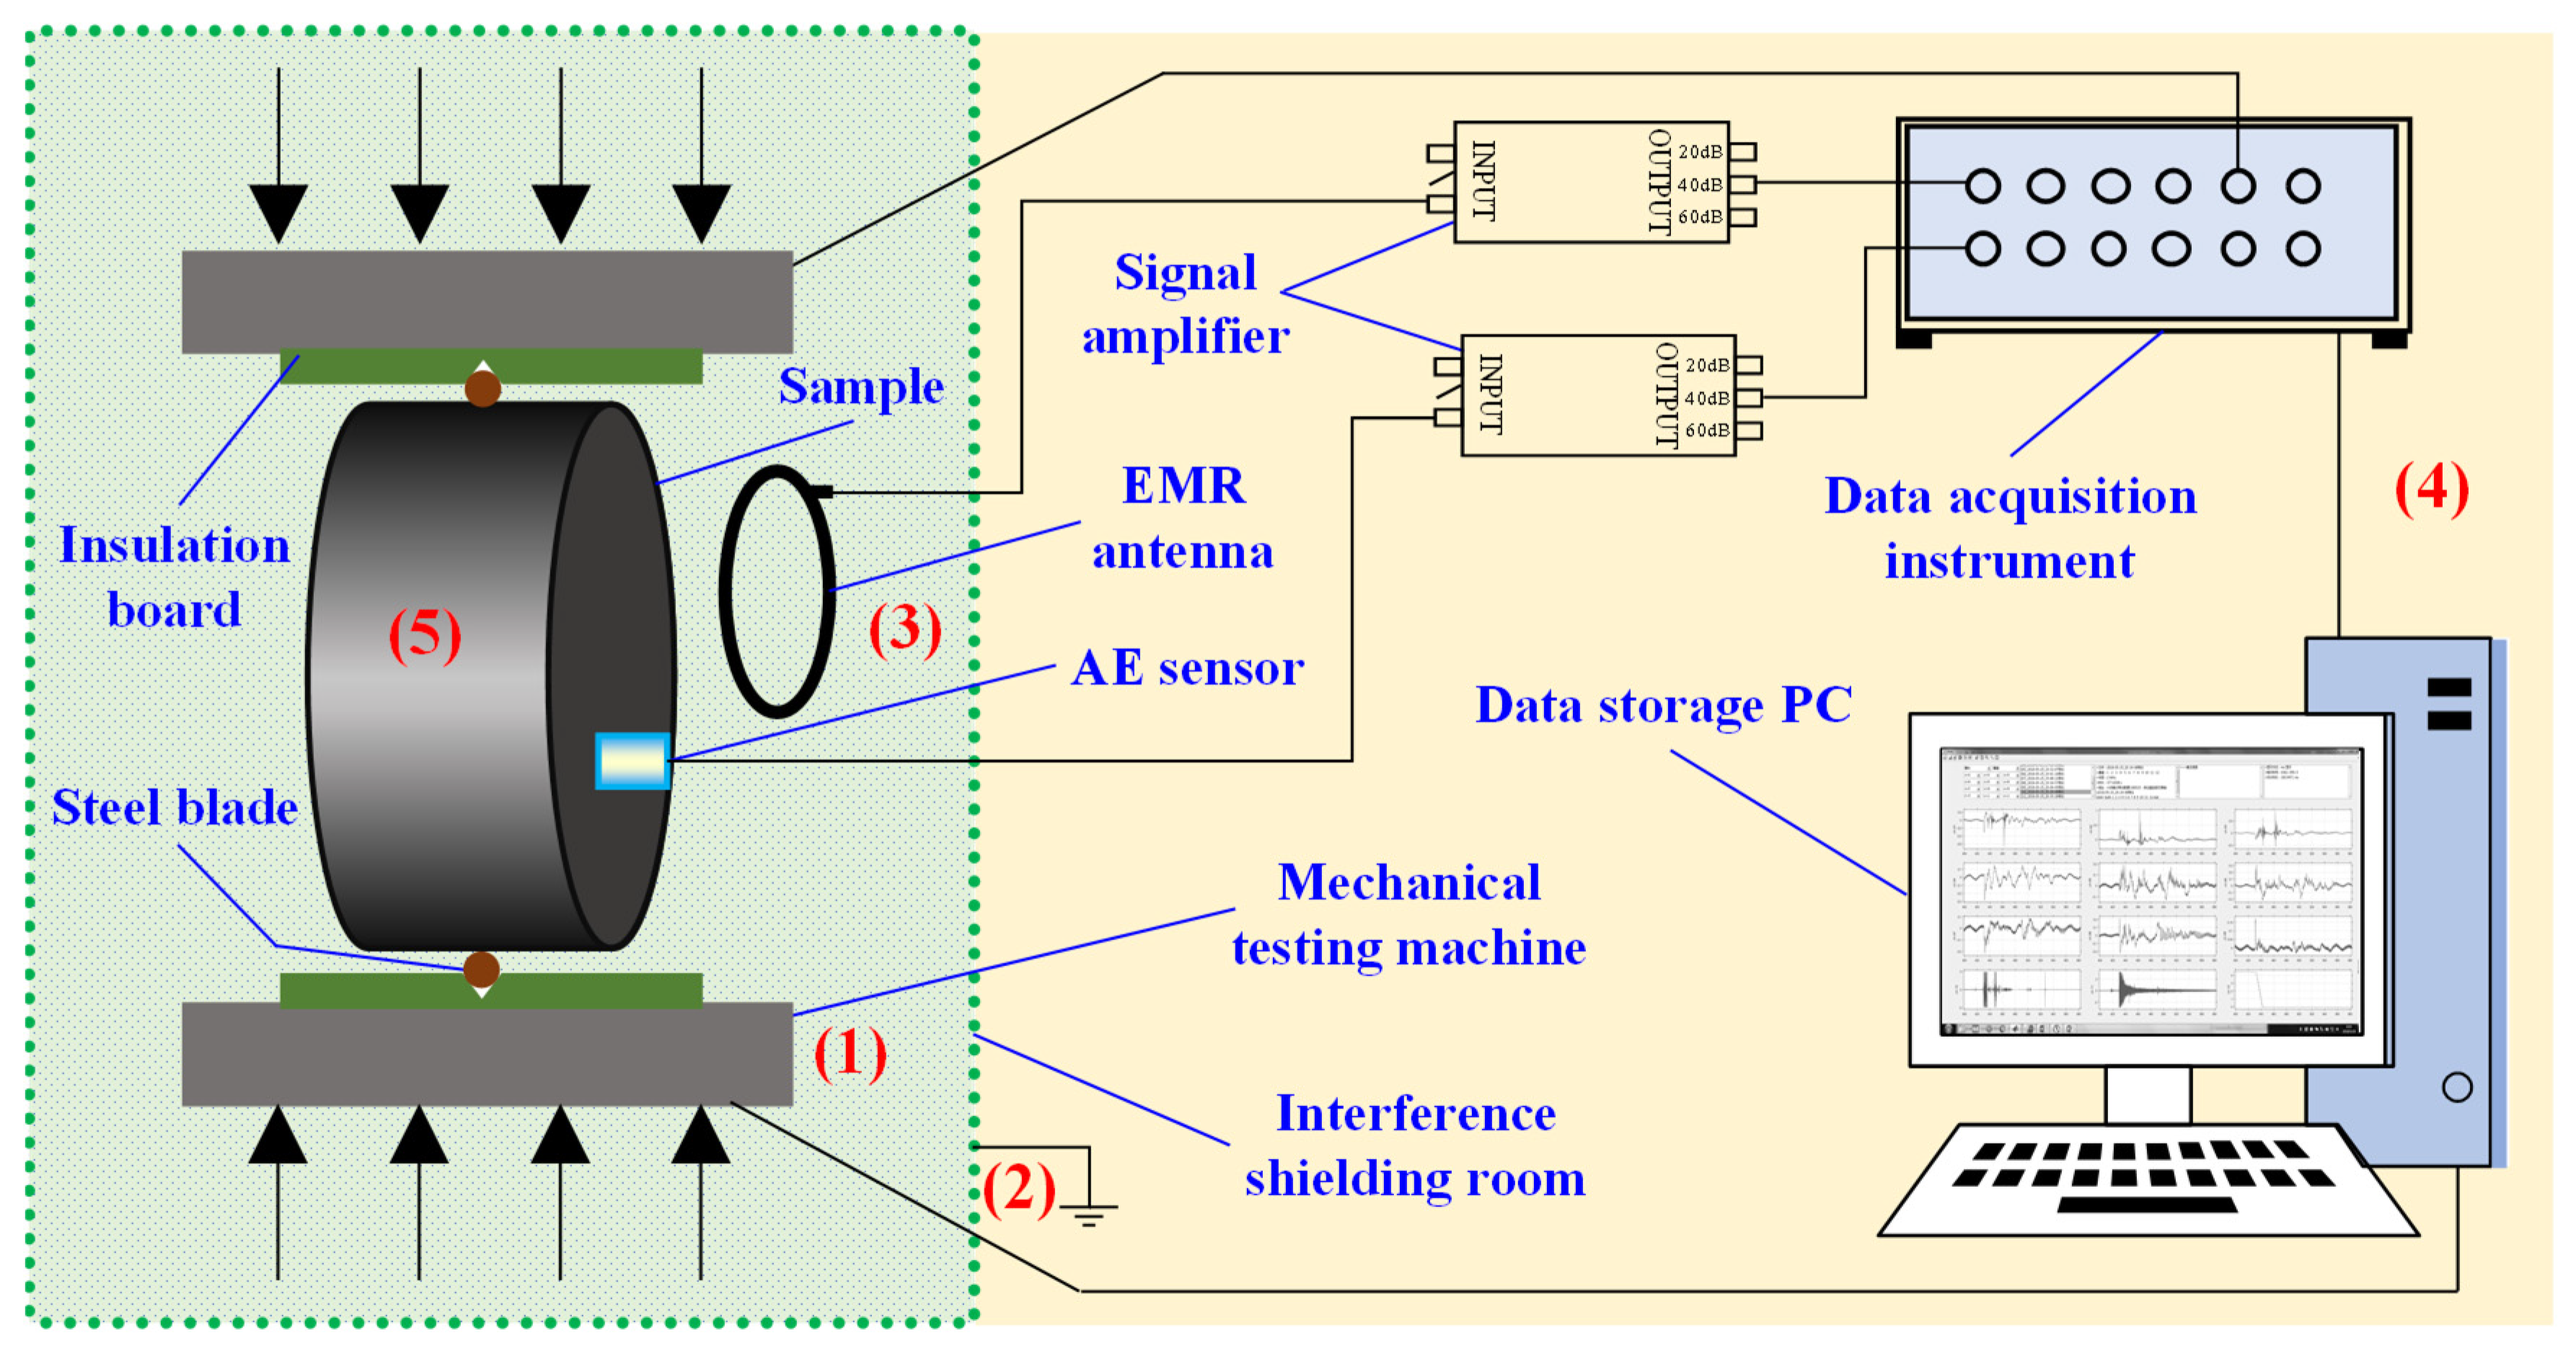
The schematic diagram of the coal load failure force acoustic–electric experimental system is shown in
Figure 1. The system consists of an electromagnetic shielding system, a loading and control system, an acoustic and electrical data acquisition system, etc. Among these, the comprehensive shielding efficiency of the shielding room is 75 dB, which can effectively reduce the interference of external electromagnetic field to the experimental results. YAW-600 type testing machine (Jilin Guangteng Automation Technology Co., Ltd., Changchun, China)is used as a loading system, the load resolution of which is 3 N and the displacement resolution is 0.3 μm. The acoustic and electrical data acquisition system is composed of SAS-560 type EMR ring antenna (Changzhou Leining Electromagnetic Shielding Equipment Co., Ltd, Changzhou, China), common AE sensor, signal amplifier, data acquisition instrument, data processing host, etc. Various sensors are connected to the same acquisition instrument to ensure the synchronization of data transmission. The high-speed data acquisition instrument has 12 data acquisition channels, synchronous signal trigger, maximum acquisition frequency of 10 MHz, A/D conversion accuracy of 16 bits, and input signal voltage range of ±5 V. The EMR ring is placed facing the sample, keeping a distance of about 5 cm parallel to the grinding plane of the sample. The response frequency range of the EMR antenna is 20 Hz~2 MHz, and the response is stable in the range of 20 Hz~200 kHz. The amplification factor of the amplifier is 40 dB, and the input and output impedance is 50 Ω. The response frequency of the AE sensor is 50 Hz~400 kHz, and the response is stable in the range of 50 Hz~200 kHz. The amplification factor of the amplifier is 40 dB, the input impedance is >10 MΩ and the output impedance is 50 Ω. EMR and AE signals analyzed in the work are the data after analog-to-digital conversion and amplification of original signals, characterized by the sensor’s voltage value. The measurement of the electromagnetic field tests the change of magnetic flux. As shown in
Figure 1, we use the induction coil to test the EMR signal generated by coal fracture. The electromagnetic field is measured in the horizontal direction. The acoustic and electrical data acquisition systems are located outside the shielding room. After loading, the coal fracture signal is received by the EMR antenna and AE sensor, amplified by the amplifier and transmitted to the acquisition system in the form of a digital signal for later analysis on the host.
2.2. Test Scheme
In this study, the coal sample used in the experiment was acquired from a coal mine in Shanxi Province, China. Firstly, a large coal sample was obtained, then coring, cutting and grinding were carried out to make a splitting sample with the size of ϕ 50 mm × 25 mm, the number of samples is 20, and the flatness of the end face of the sample shall be controlled within ±0.02 mm.
During the loading process of the splitting method, the upper and lower blades of the fixture are in contact with the sample. Under the load, the stress concentration occurs at the contact position between the upper and lower blades and the sample. When the concentrated stress exceeds the bearing limit of the coal rock sample, the sample is split by the blade. During splitting failure, the final collapse of the specimen usually shapes one fracture plane from the top to the bottom of the specimen, it is easier to obtain a relatively isolated signal than uniaxial compression experiment. This is also the reason why we take splitting experiments.
Before the experiment, set the sampling frequency of EMR and AE to 2 MHz to ensure sufficient resolution, and set the amplifiers of EMR and AE to 40 dB amplification.
Then, set the load parameters, apply 0.5 kN preload to the coal sample to ensure full contact between the blade and the sample, adopt the displacement control, and set the loading rate of 5 µm/s.
After ensuring that the experimental wiring was accurate and debugging was correct, we closed the door of the EMR shielding room and turned on the data acquisition system and the press of the acquisition instrument. After the data were stable, we recorded the data of EMR and AE.
After the sample broke, we stopped loading and saved the data for subsequent analysis.
2.3. Nonlinear Characteristic Analysis Method of Waveform
2.3.1. Analysis Method of Time-Frequency Fine Characteristics of the Waveform
At present, the main frequency analysis method is the Fourier transform. The amplitude–frequency spectrum of the EMR waveform can be obtained by Formula (1). In addition, based on Fourier transform, fast Fourier transform and other methods are developed [
26].
In practical applications, the Fourier transform is usually mainly suitable for nearly stationary signals, and it is impossible to extract the time-frequency characteristics of signals simultaneously. Moreover, the time resolution and frequency resolution of the Fourier transform are the same in the global range. The area of each time-frequency window is fixed, resulting in its time-frequency resolution not being very high at the same time.
In order to improve the resolution of nonlinear signal analysis in the time and frequency domain, scholars proposed the empirical mode decomposition method. This method first carries out empirical mode decomposition (EMD) and then Hilbert spectrum analysis. Firstly, the given signal is decomposed into several intrinsic mode functions (intrinsic mode functions IMF) by the EMD method. Then, each IMF is represented in the joint time-frequency domain by the Hilbert transform. Finally, the Hilbert spectrum of the original signal will be obtained by summing the Hilbert spectrum of all IMF. Compared with traditional signal or data processing methods, HHT can analyze nonlinear and non-stationary signals, and achieve high accuracy in time and frequency at the same time.
Assuming that the original waveform signal is a sequence, then the sequence can be represented by multiple components and a mean value [
29]:
where
ci(
t) is the
i-th component and
rn(
t) is the
n-th residuum of
x(
t).
According to the amplitude function and instantaneous frequency, the original EMR waveform signal can be expressed as:
The Hilbert transform of the IMF of each order is obtained by decomposing the EMR waveform signal, and the distribution of the signal amplitude on the plane of time and frequency is called Hilbert time spectrum, which can be expressed as:
By integrating the amplitude of the above Hilbert spectrum with time, the Hilbert energy spectrum and Hilbert instantaneous energy spectrum can be obtained as follows [
29]:
Equations (5) and (6), respectively, describe the energy of each unit frequency on the full-time domain and the accumulation of all frequency energy in unit time, showing the change of EMR energy with time.
EMR and AE excited during coal failure are transient non-stationary random signals [
30]. Moreover, the spectral composition of these two waves is complicated and there are many influencing factors. It is difficult to fully reveal their time-frequency characteristics by using ordinary spectrum analysis methods. HHT transformation can be well used in the analysis of EMR waveform and AE waveform with nonlinear and non-stationary characteristics, and can extract the primary characteristic information of the time history curve.
2.3.2. Analysis Method of Fractal Characteristics of the Waveform
The fractal dimension is used to describe unstable signals and objects. It is an effective tool to describe complicated and unstable signals.
For a time-series
x(
t), when calculating the multifractal dimension and multifractal spectrum, a partition function
Xq(
δ) is defined first [
30],
where
τ (
q) is the quality index, and
q is the weight factor, representing the probability density
Pi(
δ) of different sizes in the partition function
Xq(
δ), whose proportion can be changed.
The
q-order multifractal dimension
Dq of the sequence
x(
t) can be solved by the following formula [
30]:
The curve composed of multifractal dimension Dq and weight factor q is the generalized fractal dimension curve of sequence x(t). The greater the deviation between multifractal dimension Dq and 1, the greater the volatility of data and the stronger the multifractal characteristics.
Singularity constant
α and the subset fractal dimension
f(
α) can be calculated by the following formula [
31].
The curve composed by
α and
f(
α) is the multifractal spectrum of the sequence
x(
t), which can reflect the nature of uneven distribution in the sequence
x(
t). According to the multifractal characteristics [
32], the subset represented by
αmin corresponds to small signal, the subset represented by
αmax corresponds to large signal, and multifractal spectrum width Δ
α =
αmax −
αmin describes the non-uniformity of signal distribution on the sequence
x(
t) in the fractal structure, the larger Δ
α is, the greater the difference in signal distribution is, and the more intense the fluctuation is. Let Δ
f(
α) =
f(
αmax) −
f(
αmin), then Δ
f represents the ratio of the number of signals in the correlation sequence subset at the maximum and minimum, the smaller Δ
f(
α) is, the larger the proportion of large signal in the sequence is, and vice versa.
Through the above formula, the multiple information dimensions and multifractal spectra of EMR and AE excited by coal splitting failure can be obtained. By using the above characteristics to describe the nonlinear characteristics of acoustic and electrical signals, the relationship and difference between them can be compared.
5. Fractal Characteristics of Acoustic and Electrical Signals of Coal Splitting Failure
5.1. Generalized Information Dimension of Acoustic Signals
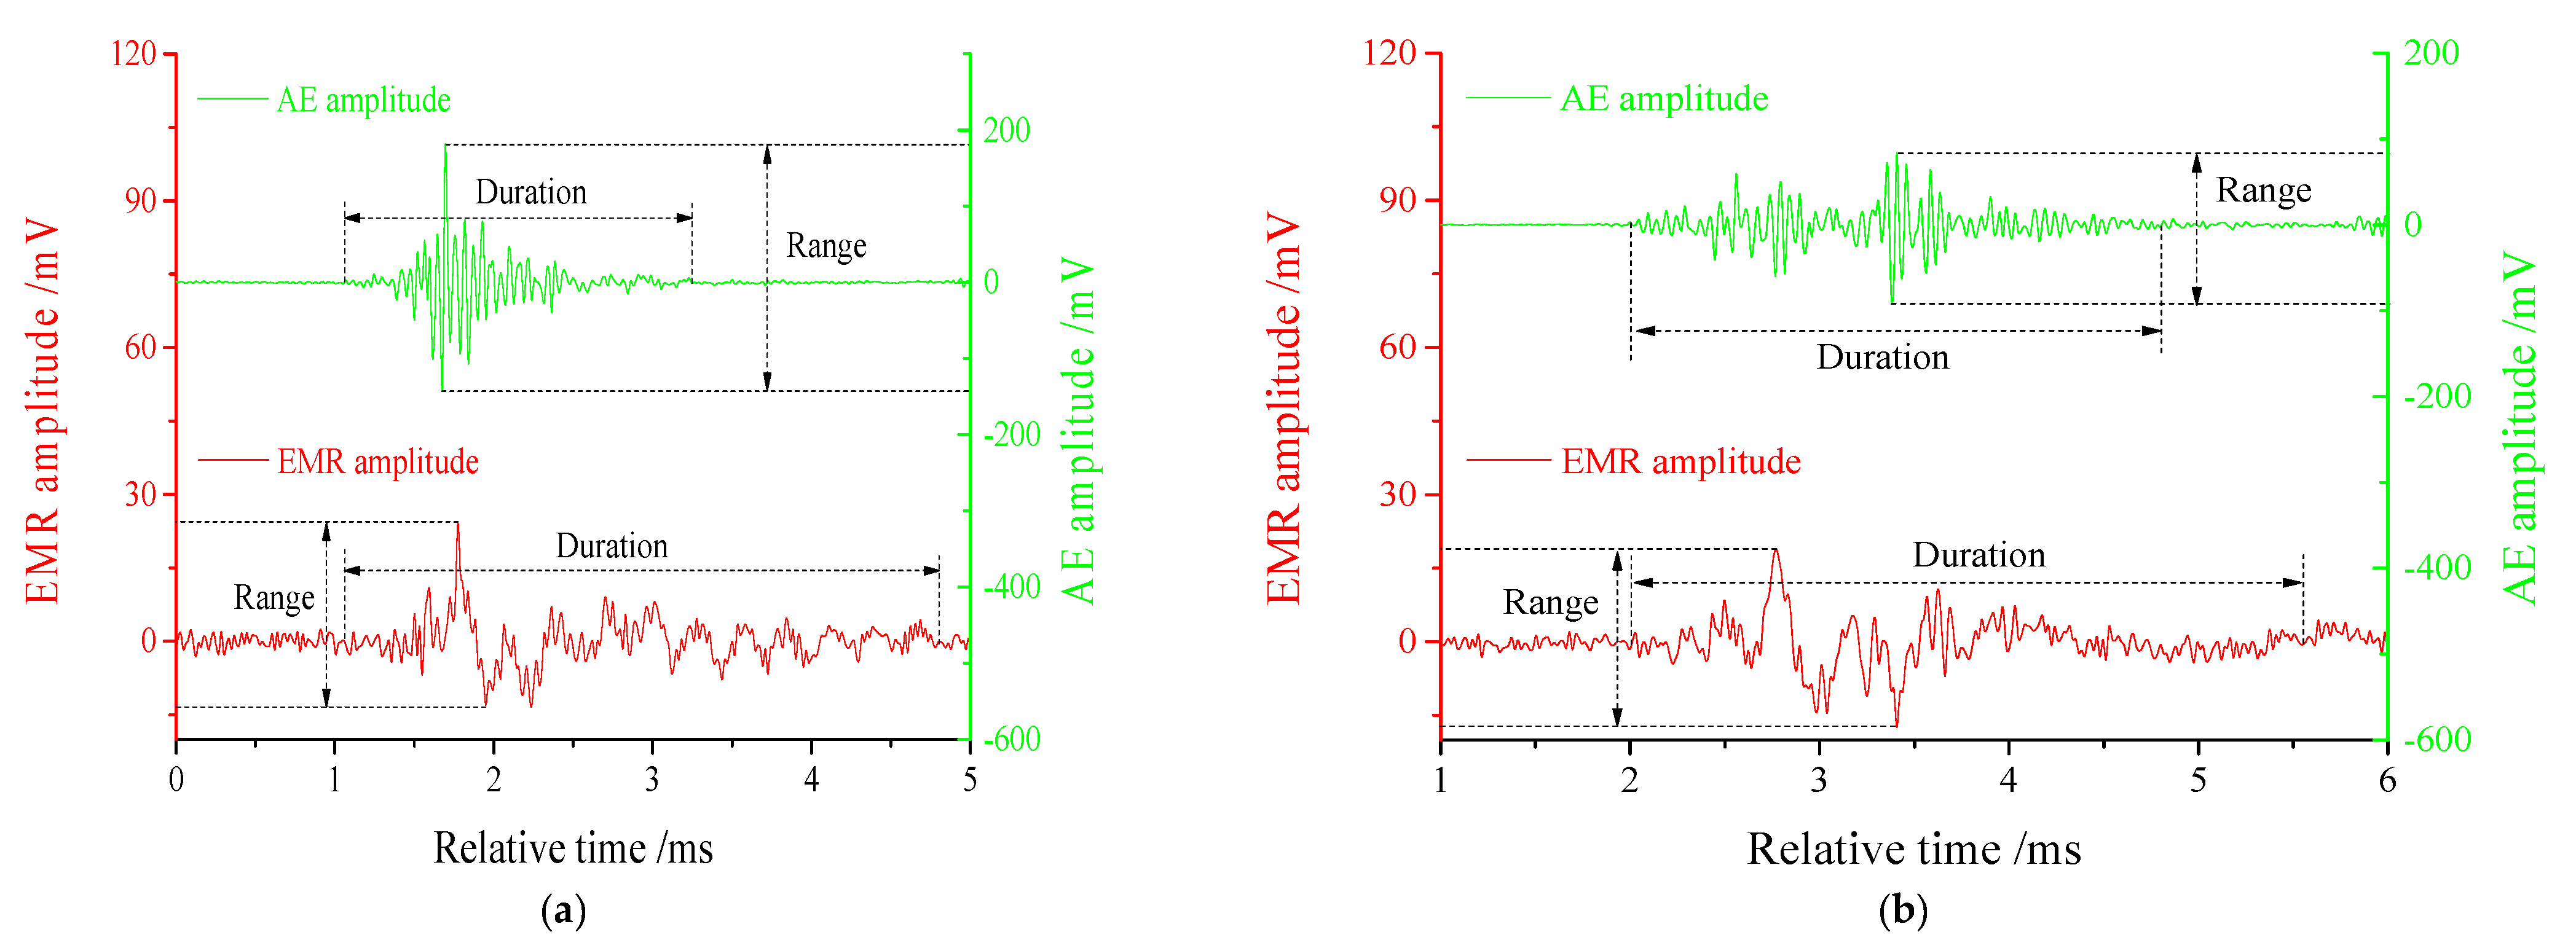
Fractal feature analysis is an effective means for signal nonlinear feature analysis. In order to study the nonlinear characteristics of the EMR and AE signals of coal splitting failure, the data from initiation to the end (within the duration) of EMR signal 1 and AE signal 1 in
Figure 3 are intercepted, and their fractal characteristics are analyzed by using the method described in
Section 2.3.2.
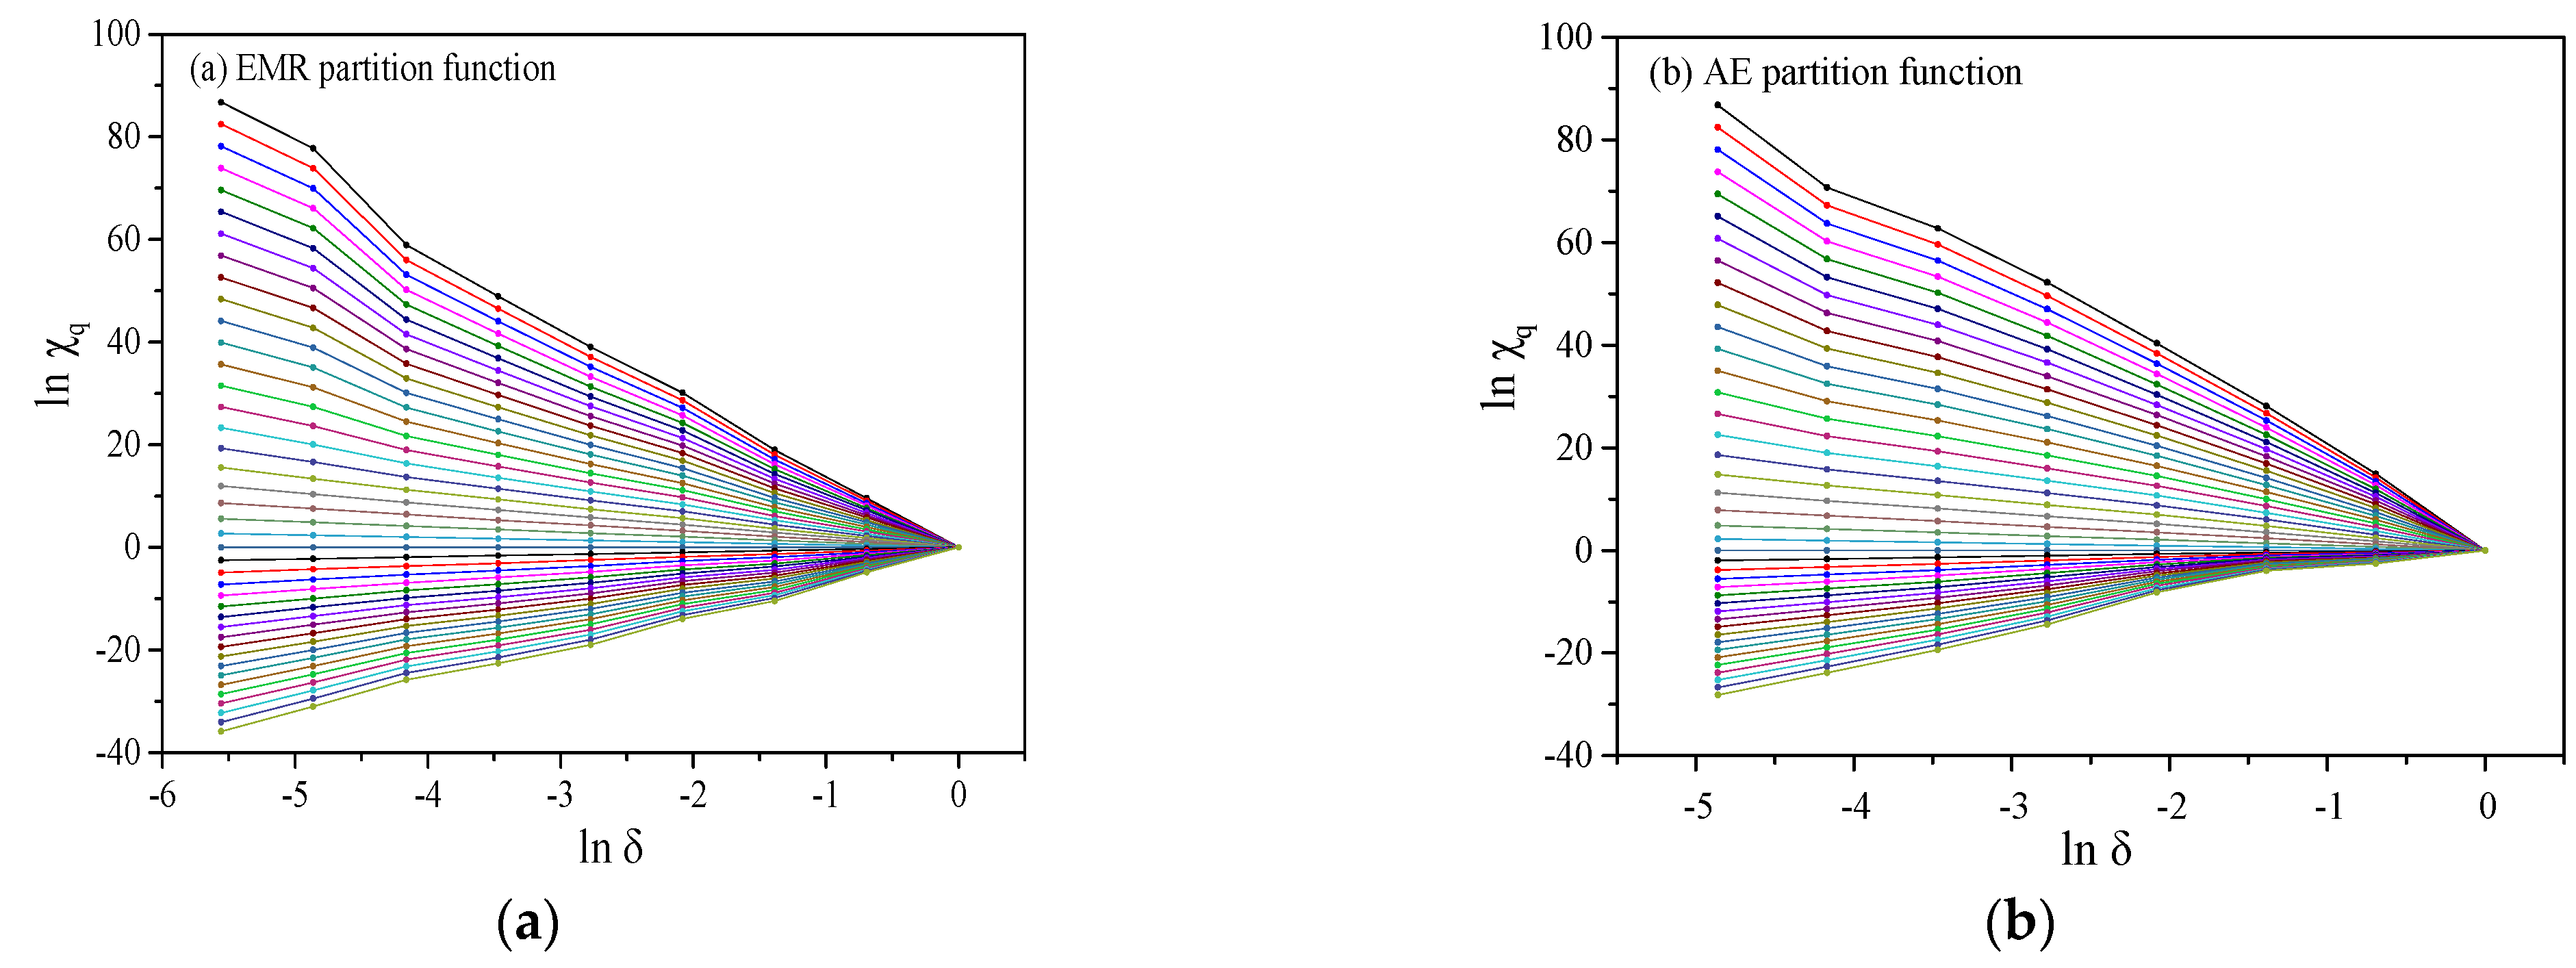
The partition functions of EMR and AE waveforms are obtained by Formula (7), as shown in
Figure 9. It can be seen from the figure that no partition function curves maintain the desired linear attenuation and converge at ln
δ = 0, indicating that the two waveforms have high scale invariance and belong to the category of multifractal. Therefore, the multifractal method can be used to study the difference and relationship between them.
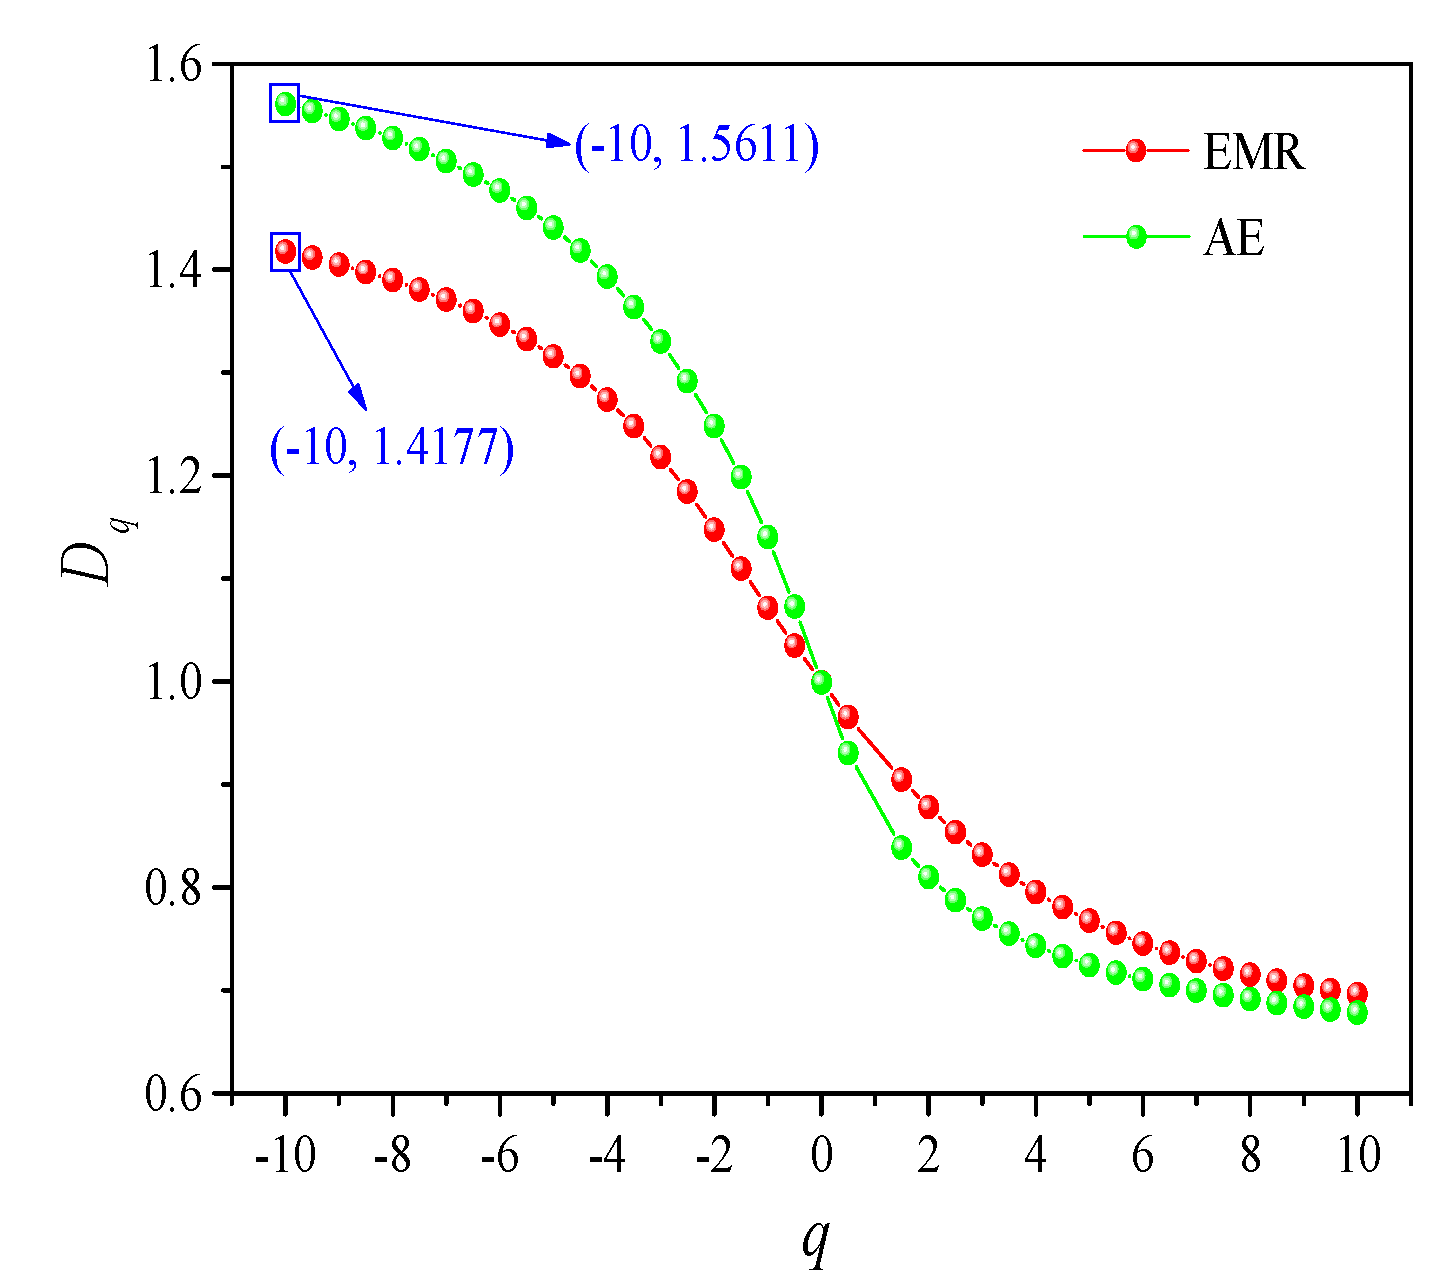
According to the calculation method of formula (8), the information dimension of the EMR and AE waveforms of coal splitting failure is calculated as shown in
Figure 10. It can be seen from the figure that the multifractal dimensionality
Dq of both EMR and AE induced by coal splitting failure is a monotonic decreasing function of
q. If a column of data has multifractal characteristics, the multifractal dimensional value
Dqmax corresponding to the minimum value
qmin of the weight factor can reflect the non-uniformity and multifractal characteristics of the data. The greater the maximum value of
Dq is, the more uneven the data is, and the stronger the multifractal characteristics are. In
Figure 10, the
Dqmax of EMR is 1.5611 and that of AE is 1.4177, indicating that the non-uniformity of EMR is higher than that of AE, and the multifractal characteristics are more obvious.
This result is consistent with the generation mechanism of the EMR and AE signals during coal fracture. The fracture process of coal is complicated, which leads to the nonlinearity of EMR and AE generated by the fracture event. According to the previous research results, the duration of the EMR signal is greater than that of the AE signal, indicating that the EMR contains the information of coal fracture events and the characteristics of charge dissipation after a fracture. This ultimately shows more complicated nonlinear characteristics than the AE. Therefore, it is reasonable to believe that the Dqmax size of EMR and AE waveform can reflect the information of coal rock fracture events.
5.2. Multifractal Spectrum of Electromagnetic Signal
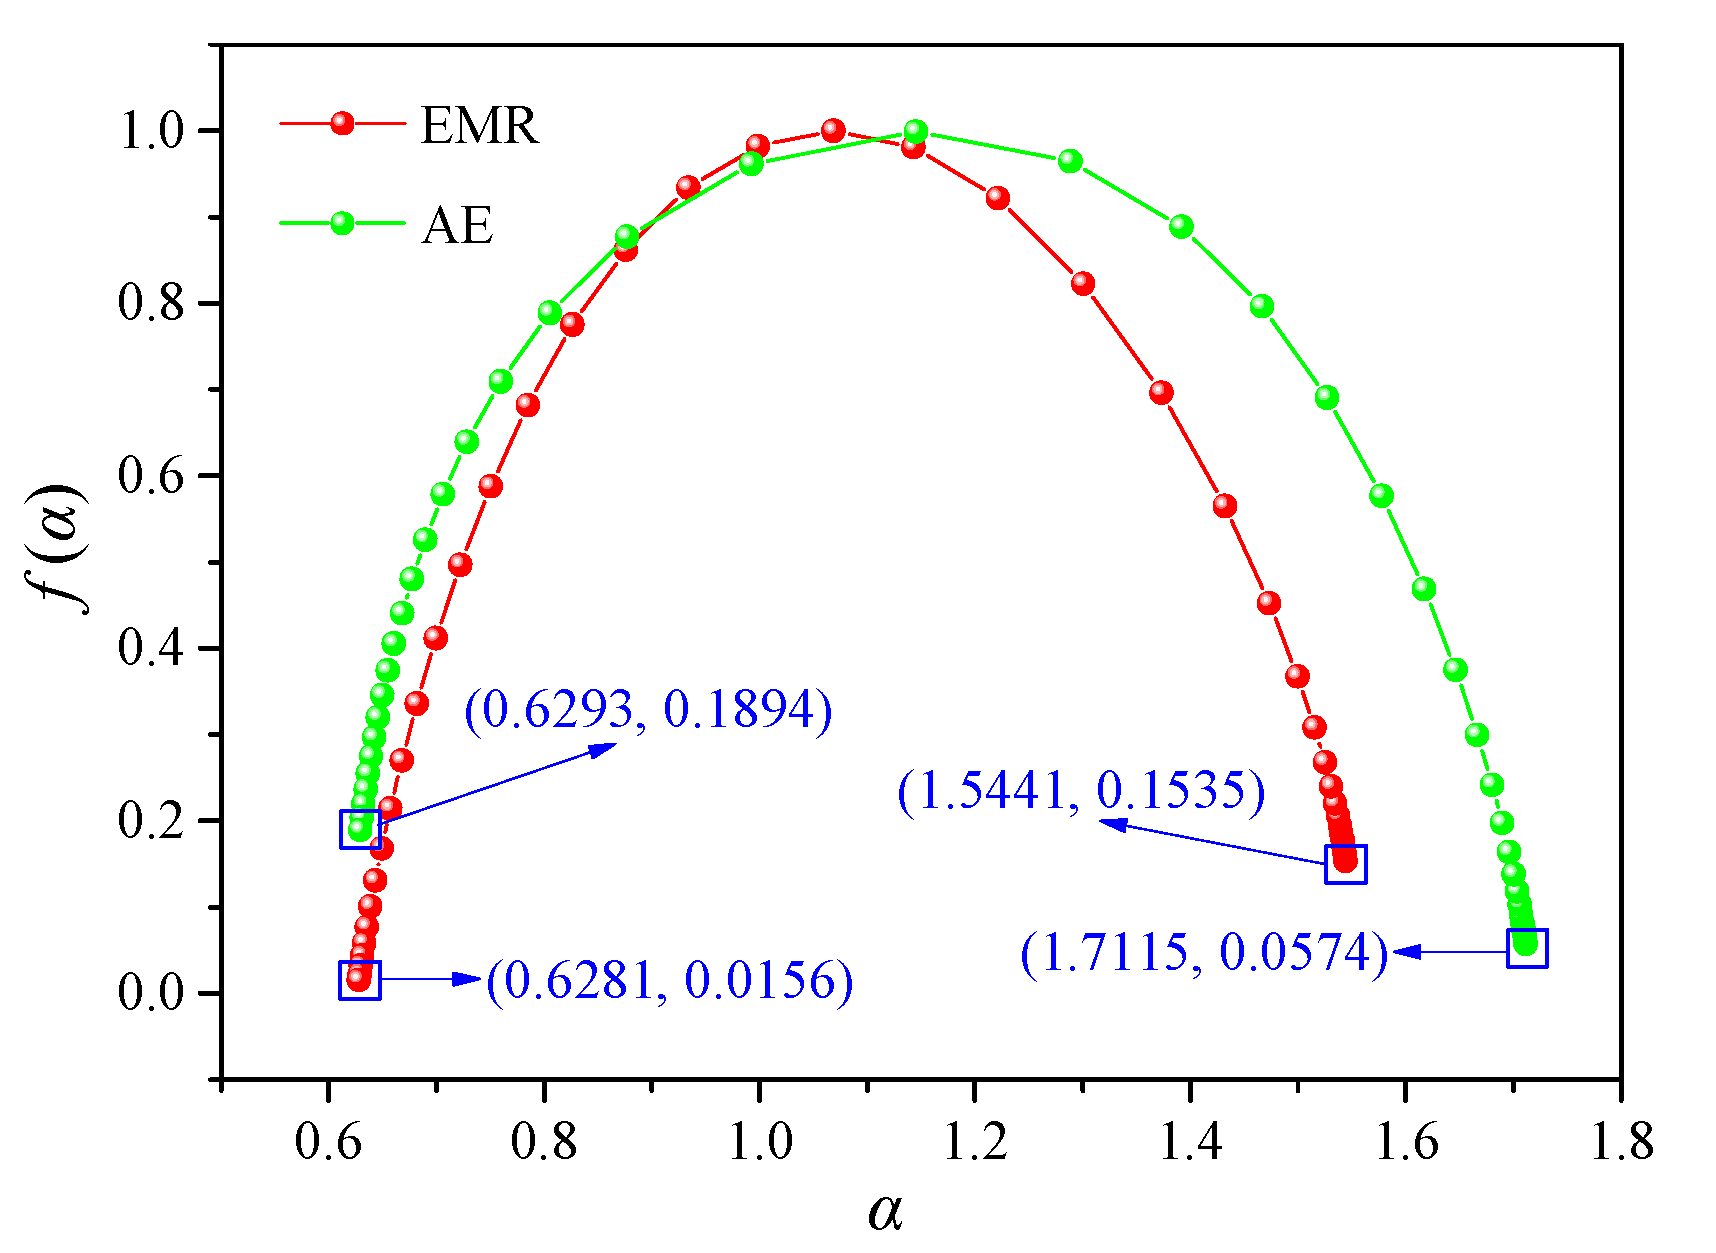
According to the calculation method of Formulas (9) and (10), the multifractal spectrums of EMR and AE waveforms are obtained, as shown in
Figure 11. It can be seen from the figure that the multifractal spectrums of EMR and AE induced by coal splitting failure are similar, showing a “∩” shape, both of them show good multifractal characteristics. The fractal dimension of the subset of waveform data series
f(
α) shows an increasing and then decreasing pattern with the increase of the singularity constant
α, which shows that they are similar in fractal characteristics.
The difference is that the minimum and maximum values of the singularity constant
α and the spectral width Δ
α are not the same for EMR and AE. The
αmin,
αmax, and Δ
α of EMR are 0.6281, 1.5441 and 0.9160, respectively, while the
αmin,
αmax, and Δ
α of AE are 0.6293, 1.7115 and 1.0822, respectively, which also verifies that they are not the same signal. The spectral width Δα characterizes the degree of inhomogeneity of the signal distribution on the fractal structure. The results show that the volatility of AE signal is greater than that of EMR, which is consistent with
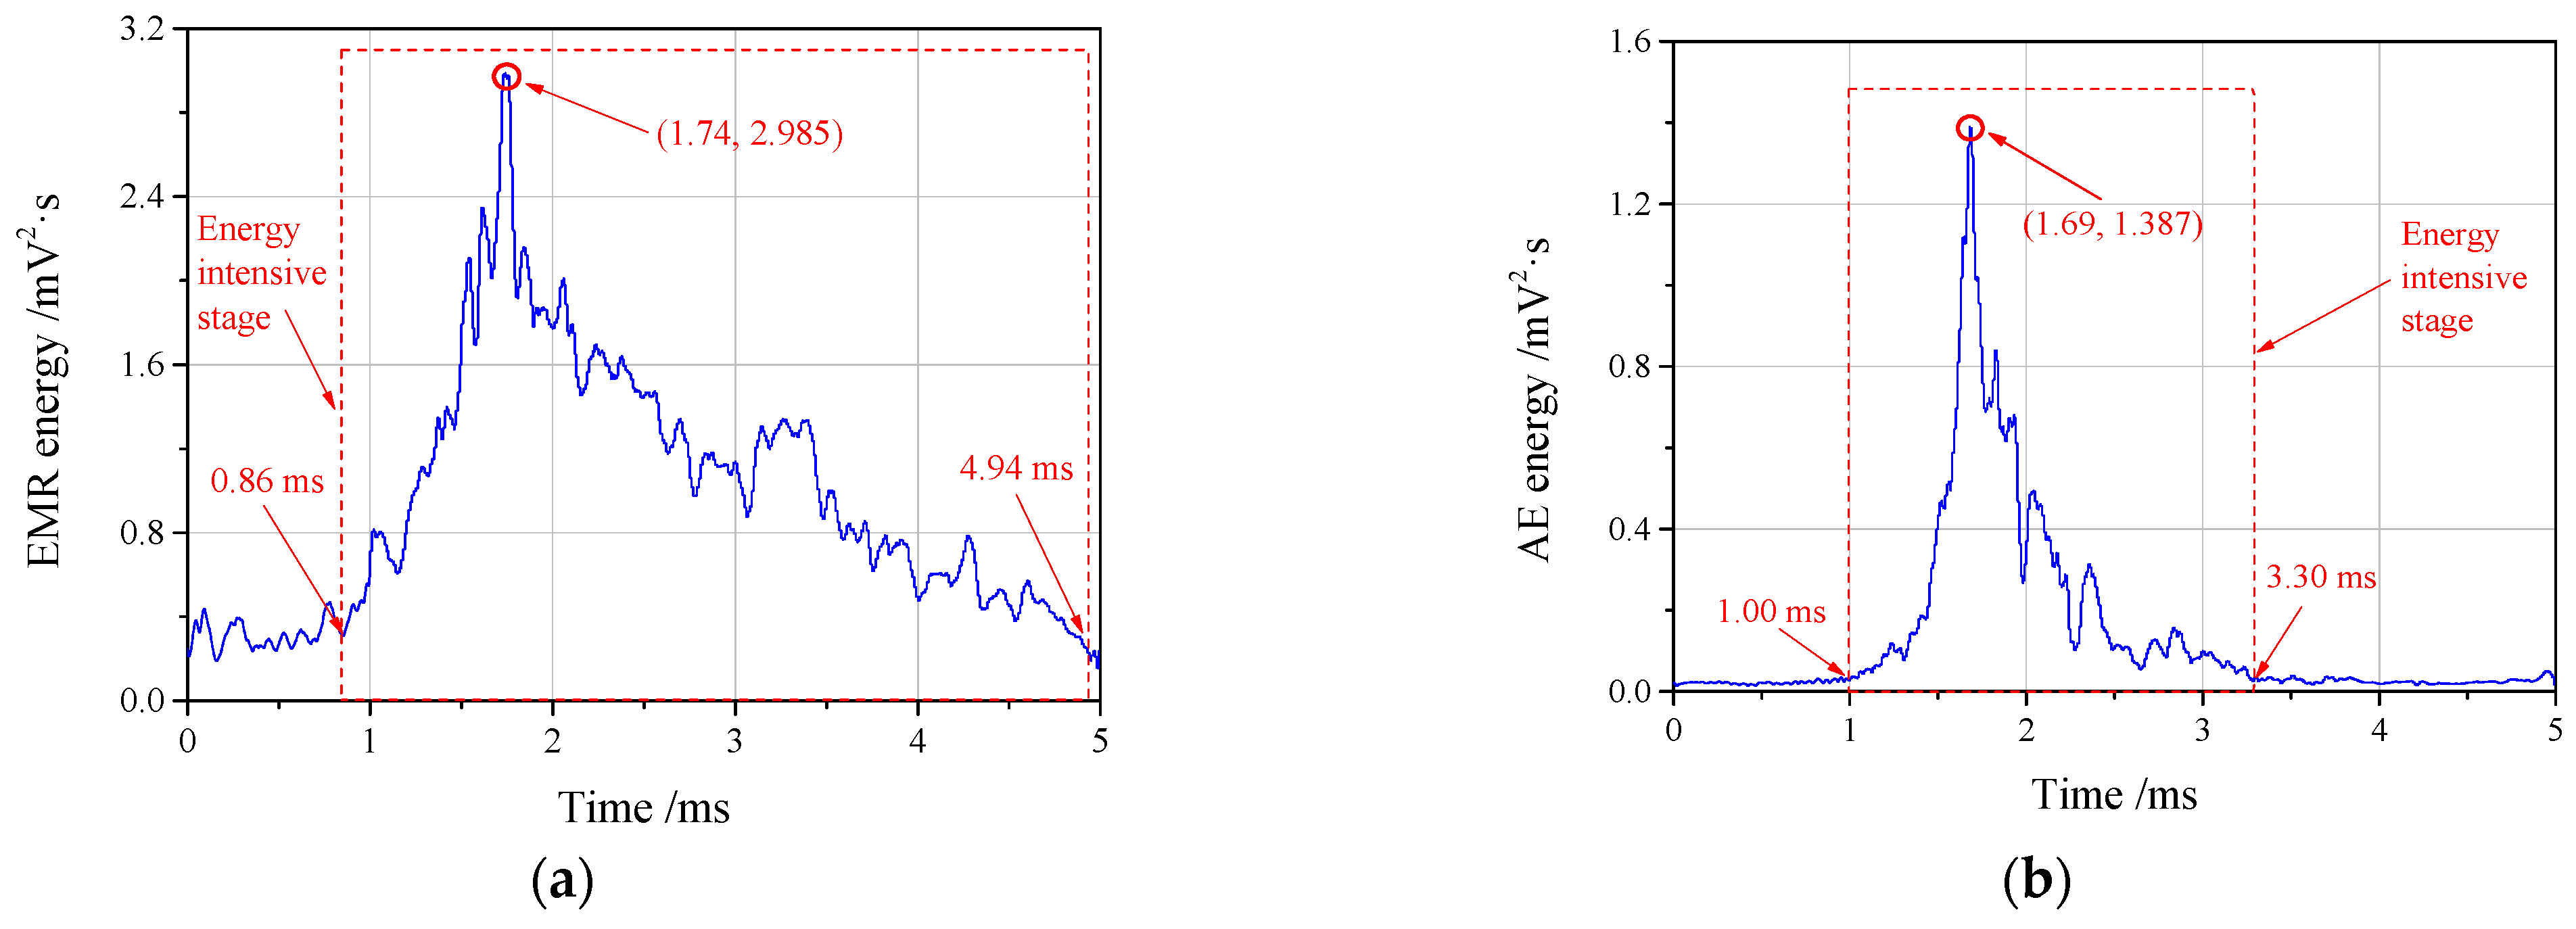
Figure 3, in which AE signal 1 increases rapidly after vibration initiation and decreases rapidly after reaching the peak value. The fluctuation amplitude is 323 mV in the duration of 2.19 ms, and the volatility of the signal is 147.49 mV/ms, while the EMR signal 1 fluctuates at 37.2 mV in 3.75 s. The fluctuation of signal duration is 9.92 mV/ms, which is far lower than that of AE. Meanwhile, the interval length of fluctuation of AE signal 2 in
Figure 3 is 62.2 mV/ms, while the interval length of fluctuation of EMR signal 2 is 10.15 mV/ms. The laws of the two groups of signals are consistent, that is, the interval length of fluctuation of AE signal generated by coal splitting is greater than that of EMR.
In addition, the fractal dimension f(α) of the sequence subset of EMR and AE have different f(α) dimensions. The f(αmin), f(αmax) and Δf(α) of EMR are 0.0156, 0.0574 and 0.0418, respectively. The f(αmin), f(αmax) and Δf(α) of AE are 0.1894, 0.0574 and −0.1320, respectively, where Δf represents the ratio of the number of signals in the correlation sequence subset at the maximum and minimum, Δf(α) is smaller, indicating that the proportion of large signals in the sequence is larger, and vice versa. The Δf(α) of EMR is positive and greater than that of AE, which indicates that in the EMR waveform within the duration (from shock initiation to attenuation to calm), the signal distribution is relatively uniform and the proportion of large signal is less. In contrast, the AE signal distribution is uneven. After the appearance of fracture, the signal rises rapidly to a higher level, and the proportion of strong signals is more in the duration.
The research results in this section show that EMR shows more complicated nonlinear characteristics than AE, and the information of EMR contained not only the coal failure process, but also the late charge dissipation process, which is likely to be crack closure or complete separation of the walls. Further research is expected to identify the scale and even location of the fracture, which has a certain value for the study of rock mechanics.
It should be noted that in this experiment, the maximum frequency of EMR and AE signals is lower than 50 kHz, and their sampling frequency is 2 MHz, which is more than 40 times the maximum signal frequency. Therefore, in the process of A/D conversion and data processing, the timing characteristics, frequency characteristics and fractal characteristics of signals are stable, ultimately supporting the reliability of the analyzed results.
6. Discussion of the Mechanism of EMR Generation during Coal Splitting
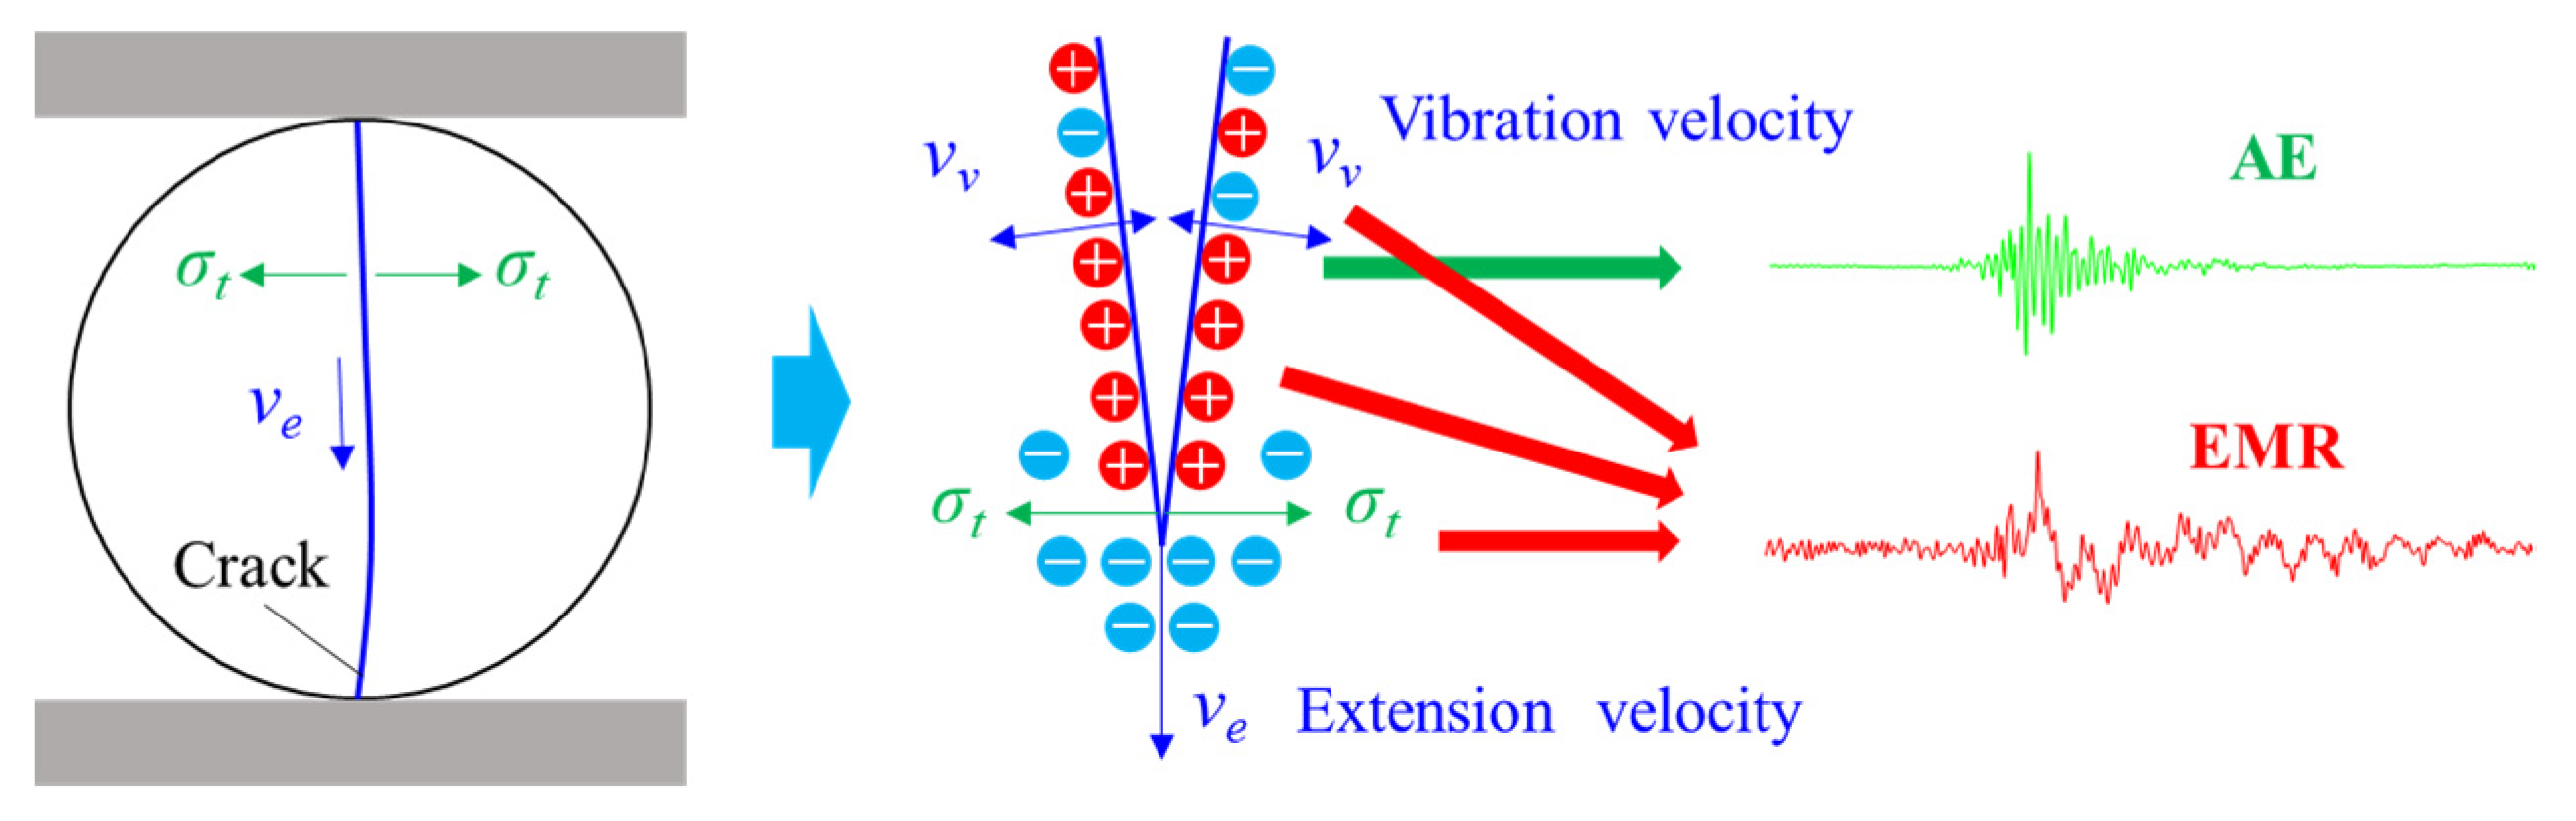
The crack propagation diagram of splitting failure is shown in
Figure 12. The coal sample breaks under the Brazilian Splitting, and then the crack expands downward along the vertical direction under tensile stress. According to the previous research results on coal micro morphology and fracture characteristics [
33,
34], due to the heterogeneity of coal, the direction and size of the propagation speed
are variable, and its size order is at the level of 10
2 m/s [
35]. During crack expansion, due to the tip effect, charge separation occurs in the area around the crack, negative charges are accumulated in front of the crack, and positive charges are accumulated on the crack wall. In this charge separation process, the electromagnetic induction field will be excited.
Since the moving direction of negative charge after charge separation is fixed (moving in front of the crack), the frequency fse of the electromagnetic induction field excited by charge separation at the crack tip is low.
The crack propagation process will drive the crack wall to vibrate. Due to the limited space around the crack, the wall vibration is cyclic and has a certain frequency. In general, its frequency is between a few Hz and a few MHz. In this coal splitting process, the frequency is between approximately 0 and 49 kHz, consistent with the previous test results [
36].
In addition, during the vibration of the crack wall, the positive charge around the crack moves with it, resulting in an electromagnetic induction field in the surrounding space. Due to the repulsion between the same polarity charges, the damping of charge motion is greater than that of wall vibration, resulting in a higher frequency attenuation. Therefore, the frequency few of electromagnetic induction field excited by wall vibration should be lower than the frequency fa of AE. It is consistent with the test results of this experiment.
After the crack propagation stops, the crack vibration stops gradually under the action of damping. The total time of crack vibration is the duration of AE in
Figure 3. After that, because no new crack is generated, the separated charges around the original crack combine the positive and negative charges again under the action of electric field force, and the frequency
fen of the electromagnetic induction field excited by this process is also low.
To sum up, the frequency of EMR is lower than that of AE in each stage of coal fracture, which is the mechanism of low-frequency EMR in the process of coal fracture.
Since crack propagation and wall vibration are almost the same, the excitation start time of the EMR induction field and AE is the same in the above process analysis. The research results in
Figure 3 also prove this, which shows that the sources of EMR and AE are the same, both from the coal crack surface. After the crack wall stops shaking, the AE intensity decreases to a low level, but the electromagnetic induction field excited by the charge neutralization process still exists for some time. Therefore, for the same rupture, the duration of EMR is longer than that of AE.
According to previous studies, the piezoelectric crystal inside the coal will induce an electromagnetic field during loading [
26,
37,
38]. Therefore, in the whole process of loading, the intensity of EMR is difficult to reduce to a low level, and the signal-to-noise ratio of the EMR signal is poor, which is consistent with the results in
Figure 3.
EMR of coal splitting failure has many sources, and the early stage of fracture is mainly due to the piezoelectric effect. In the process of crack propagation, there are both signals excited by charge separation and signals induced by crack wall vibration. The end of crack growth is mainly the signal of charge neutralization and excitation. This may be the reason why the complexity of EMR is greater than that of AE excited by the same fracture.
The non-linear nature of EMR signals is essentially the velocity variable motion of charge, and the reason for the velocity variable motion of the charge is the non-uniform distribution of charge around crack surface and the cracks complicated vibration during coal fracture.


