
Towards Understanding the Source of Brine Mineralization in Southeast Nigeria: Evidence from High-Resolution Airborne Magnetic and Gravity Data


Abstract
:1. Introduction
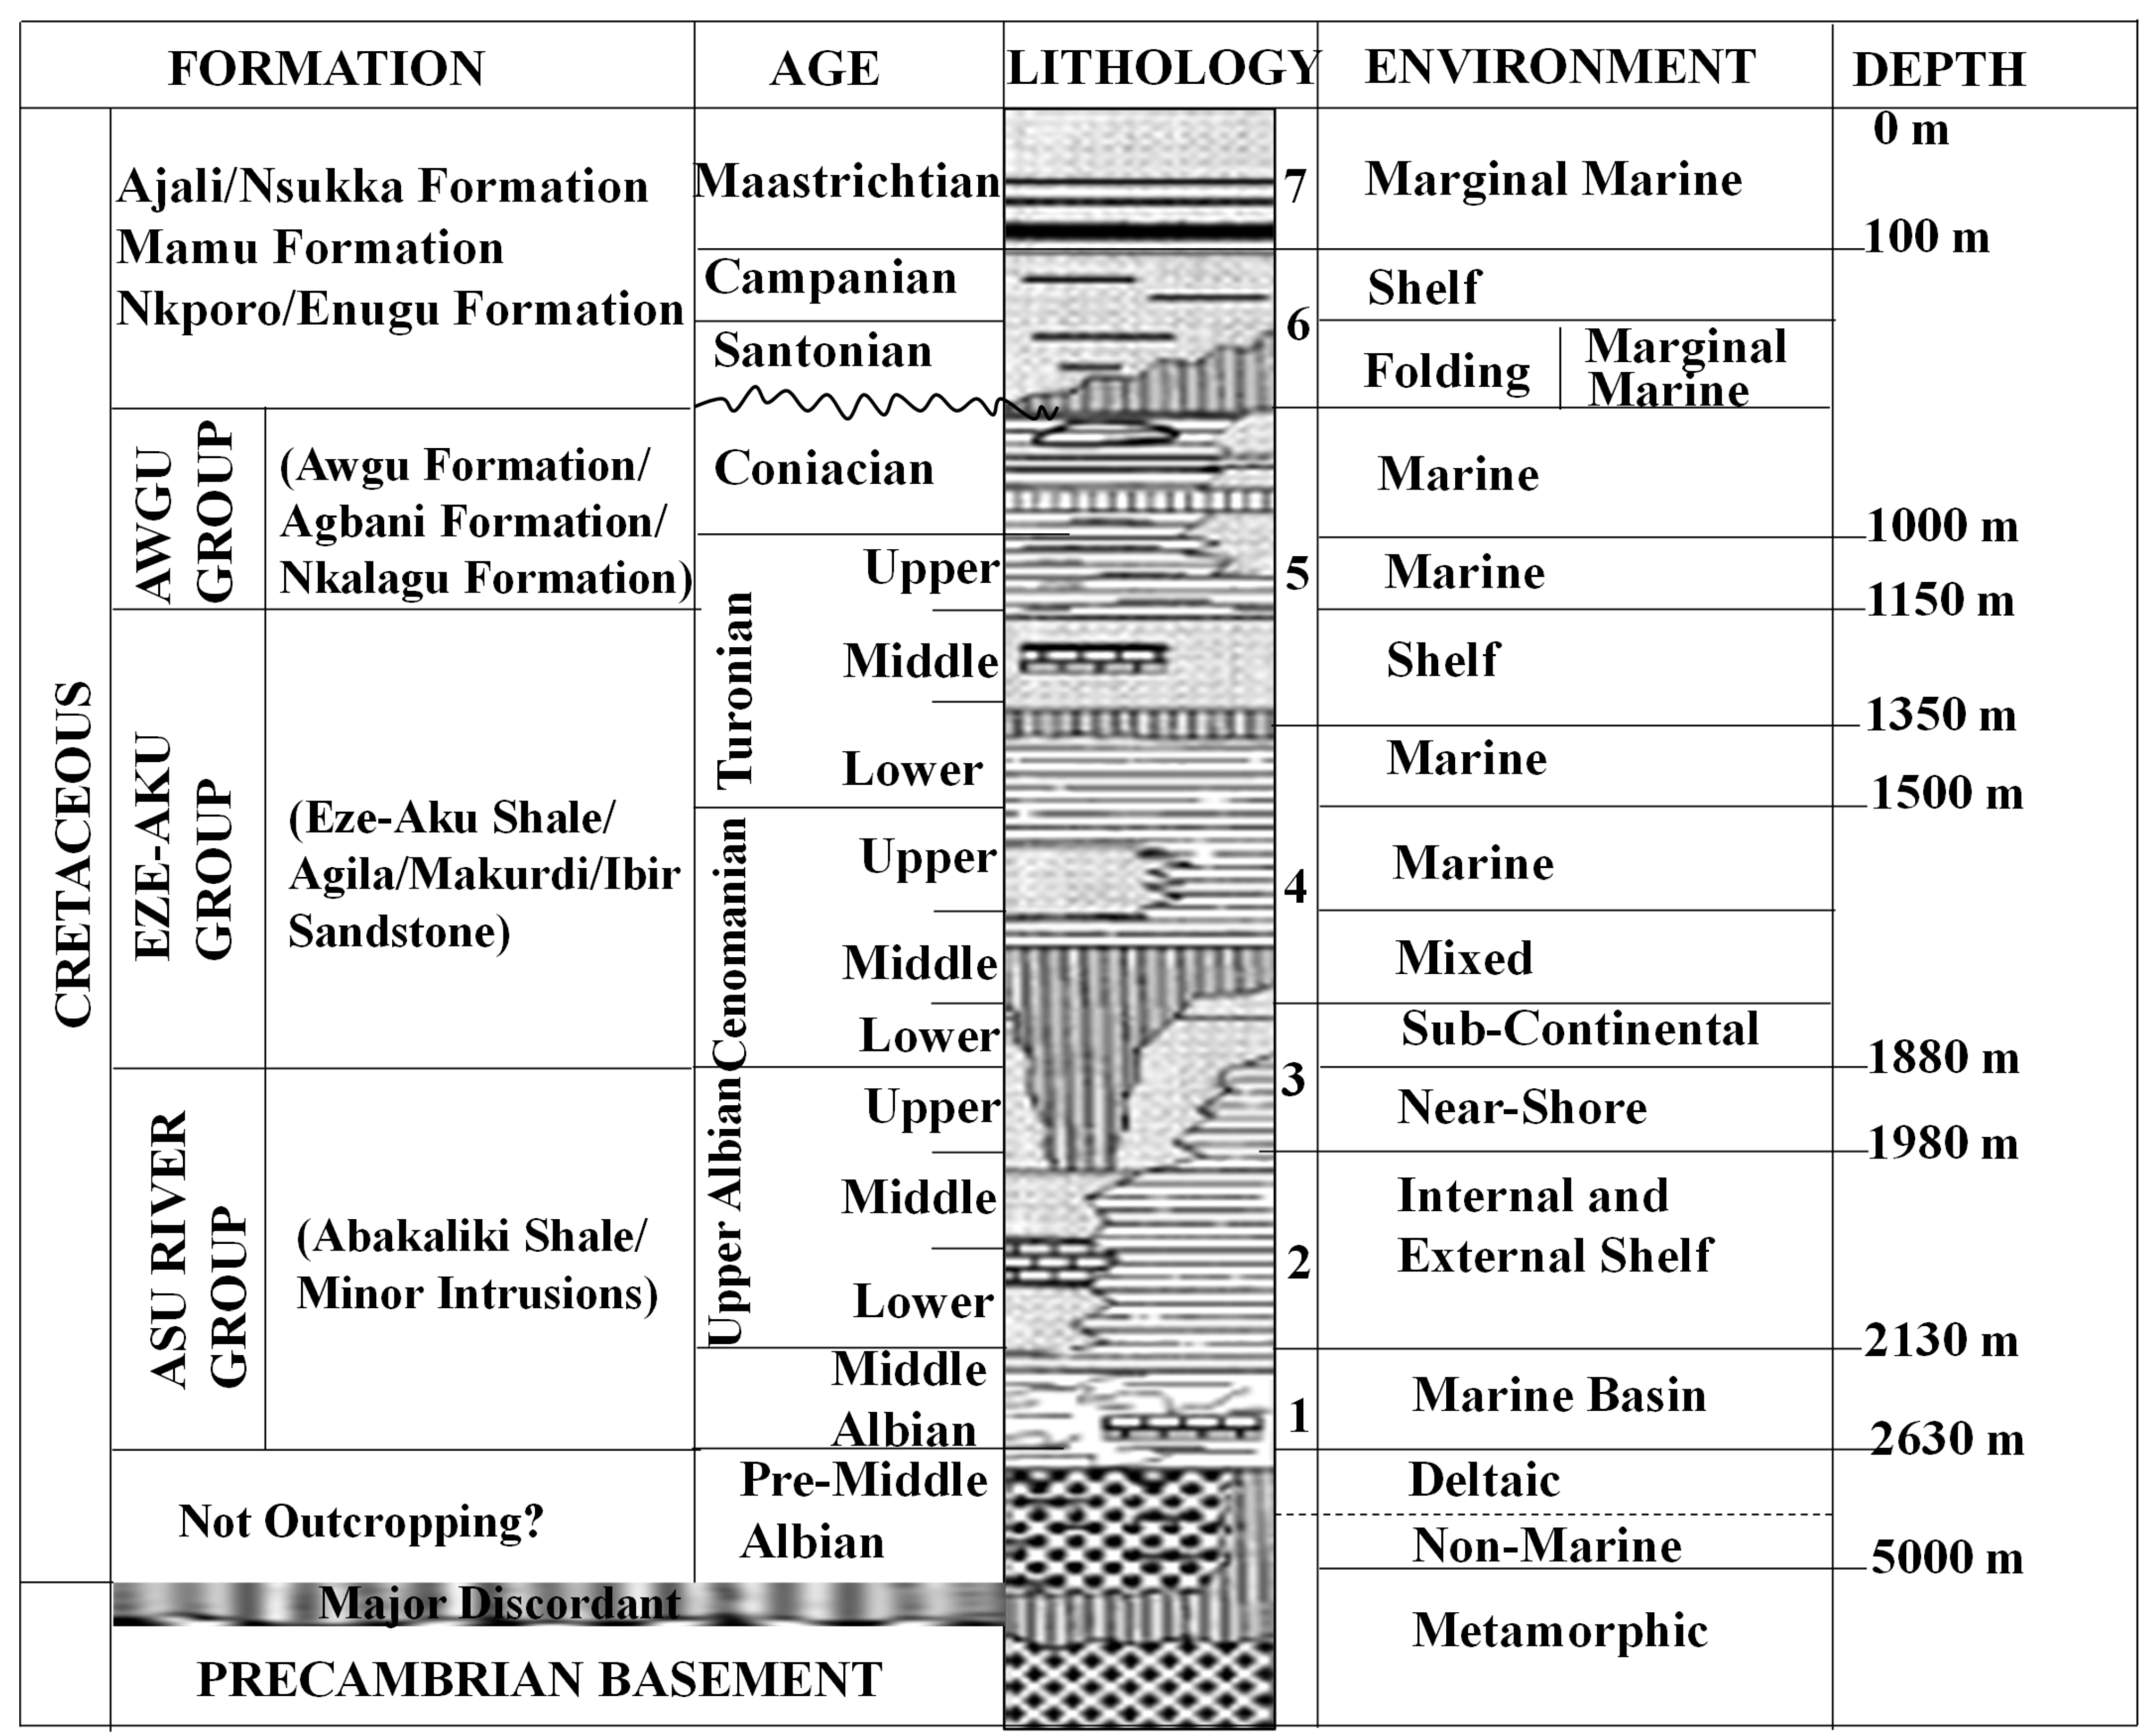
2. Geologic Setting of the Study Area
2.1. Location
2.2. Geology
3. Materials and Method
3.1. Data Acquisition
3.2. Methodology
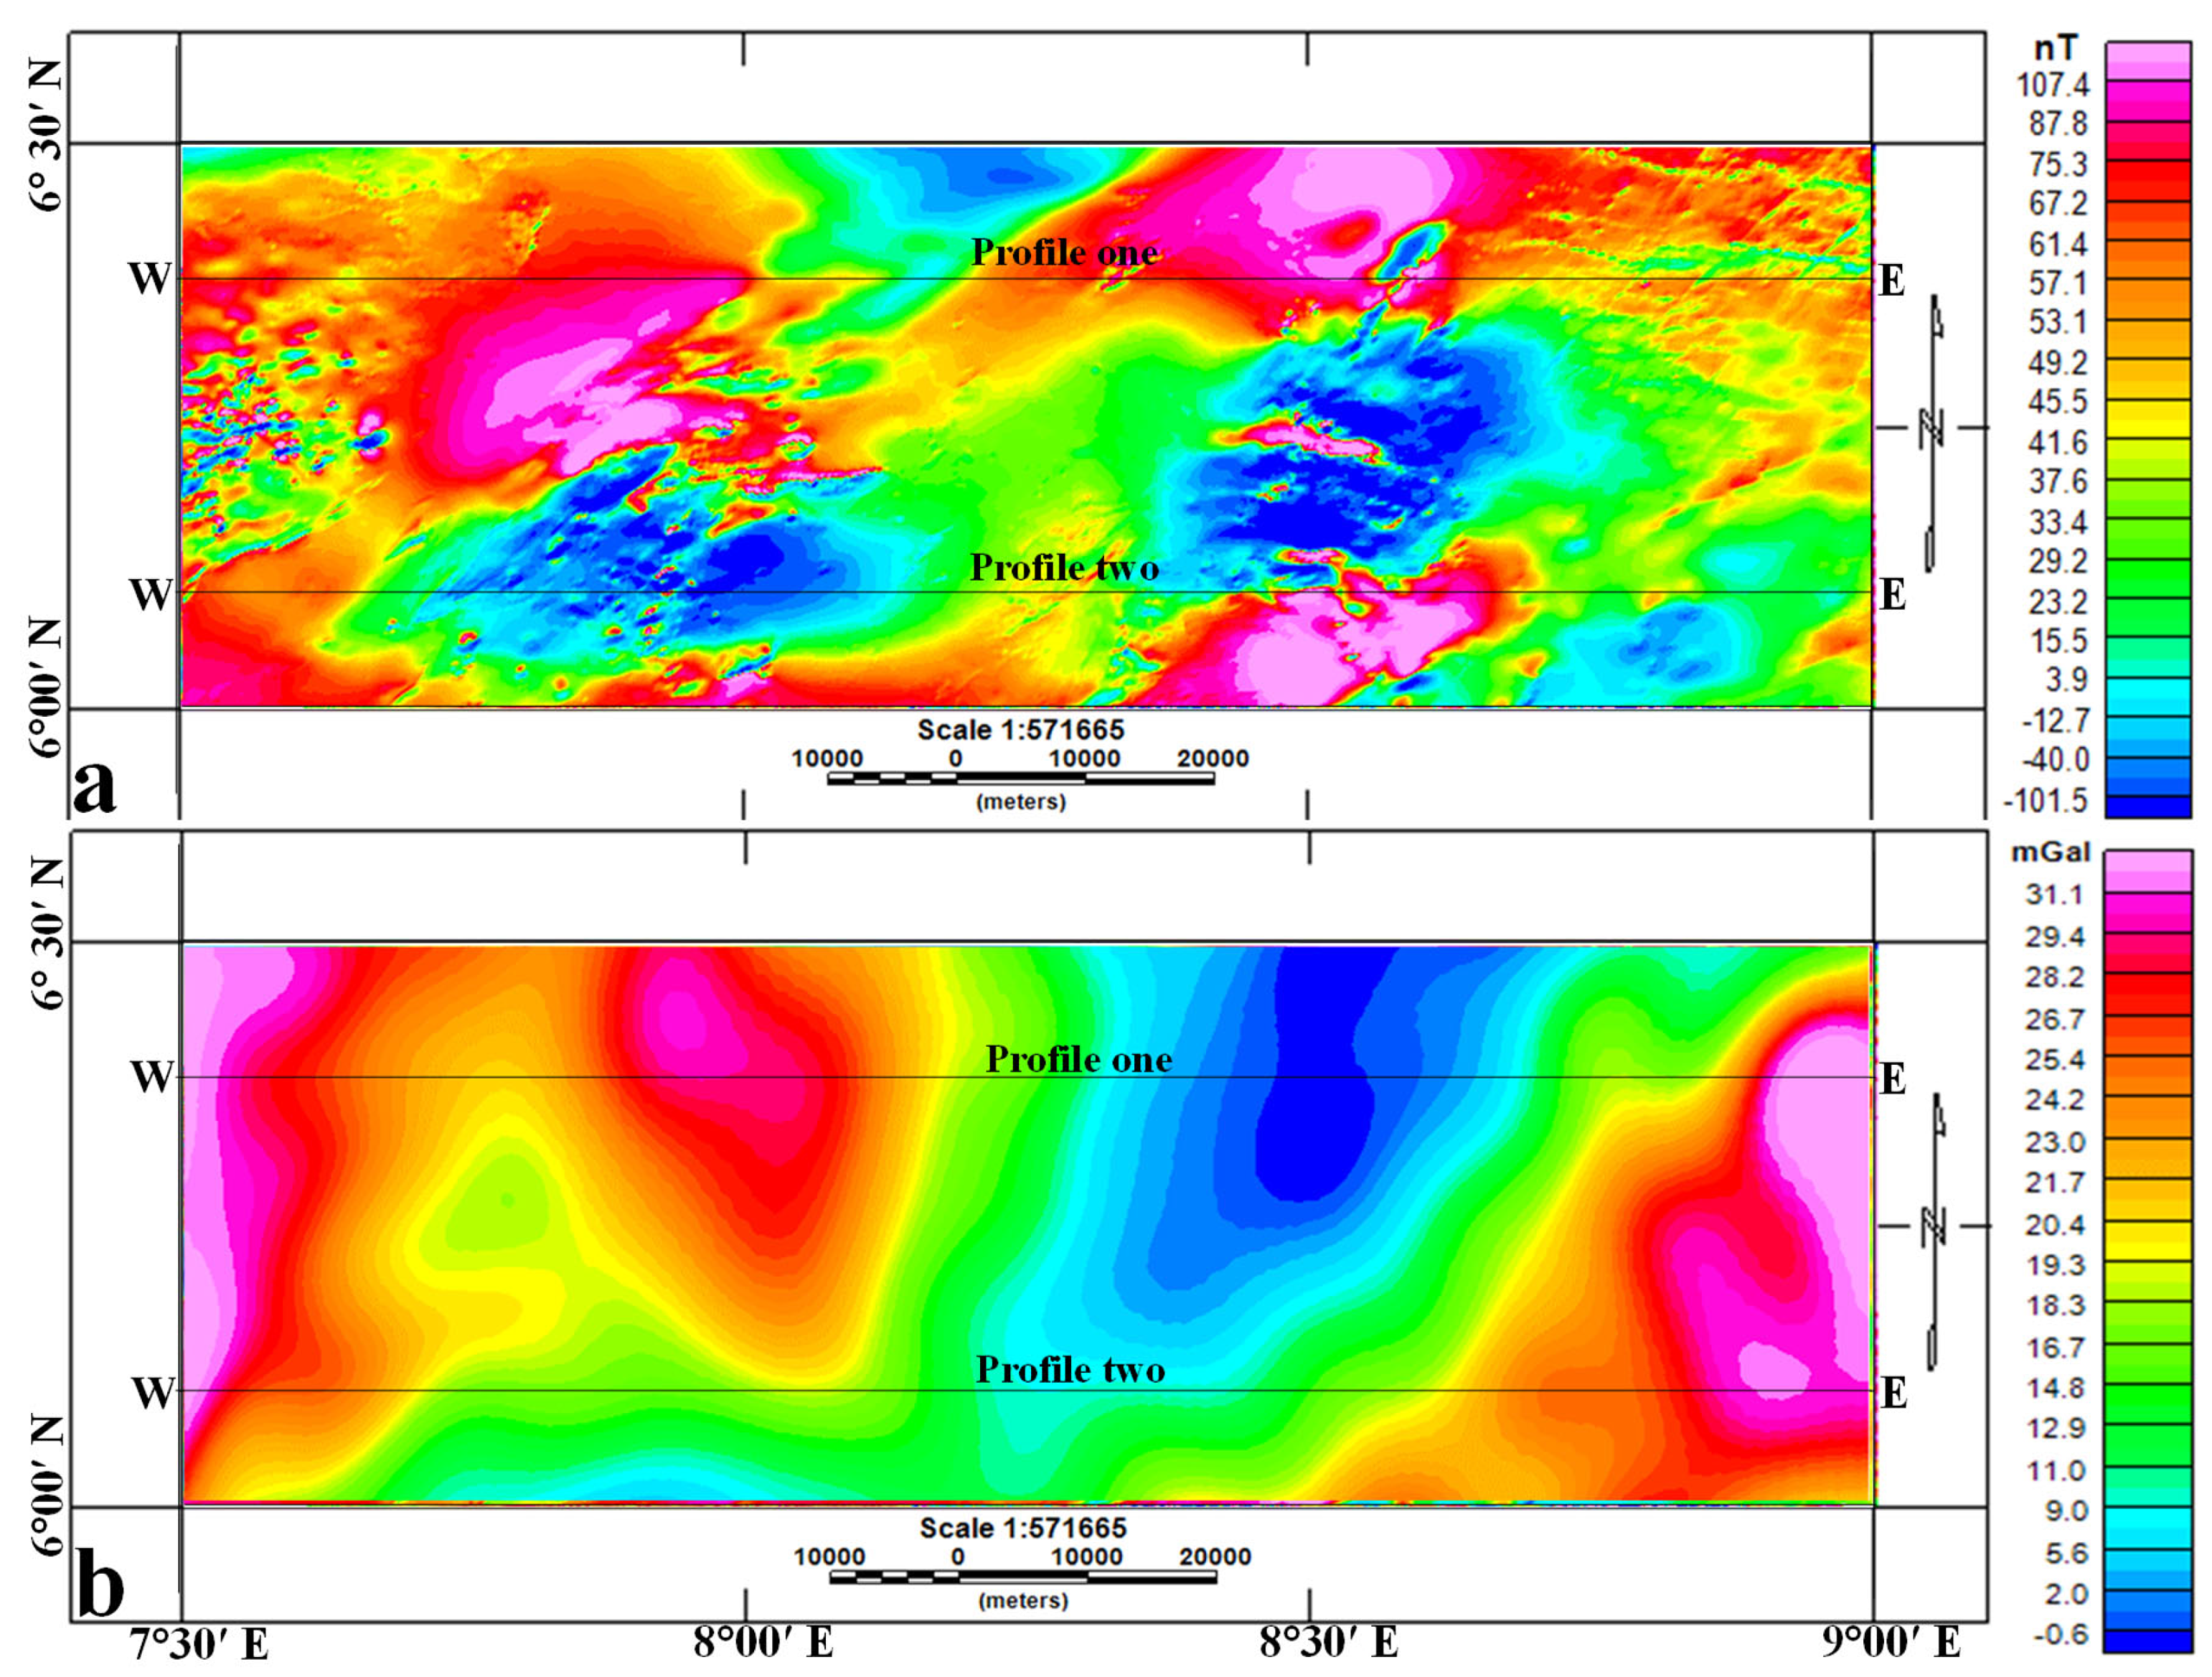
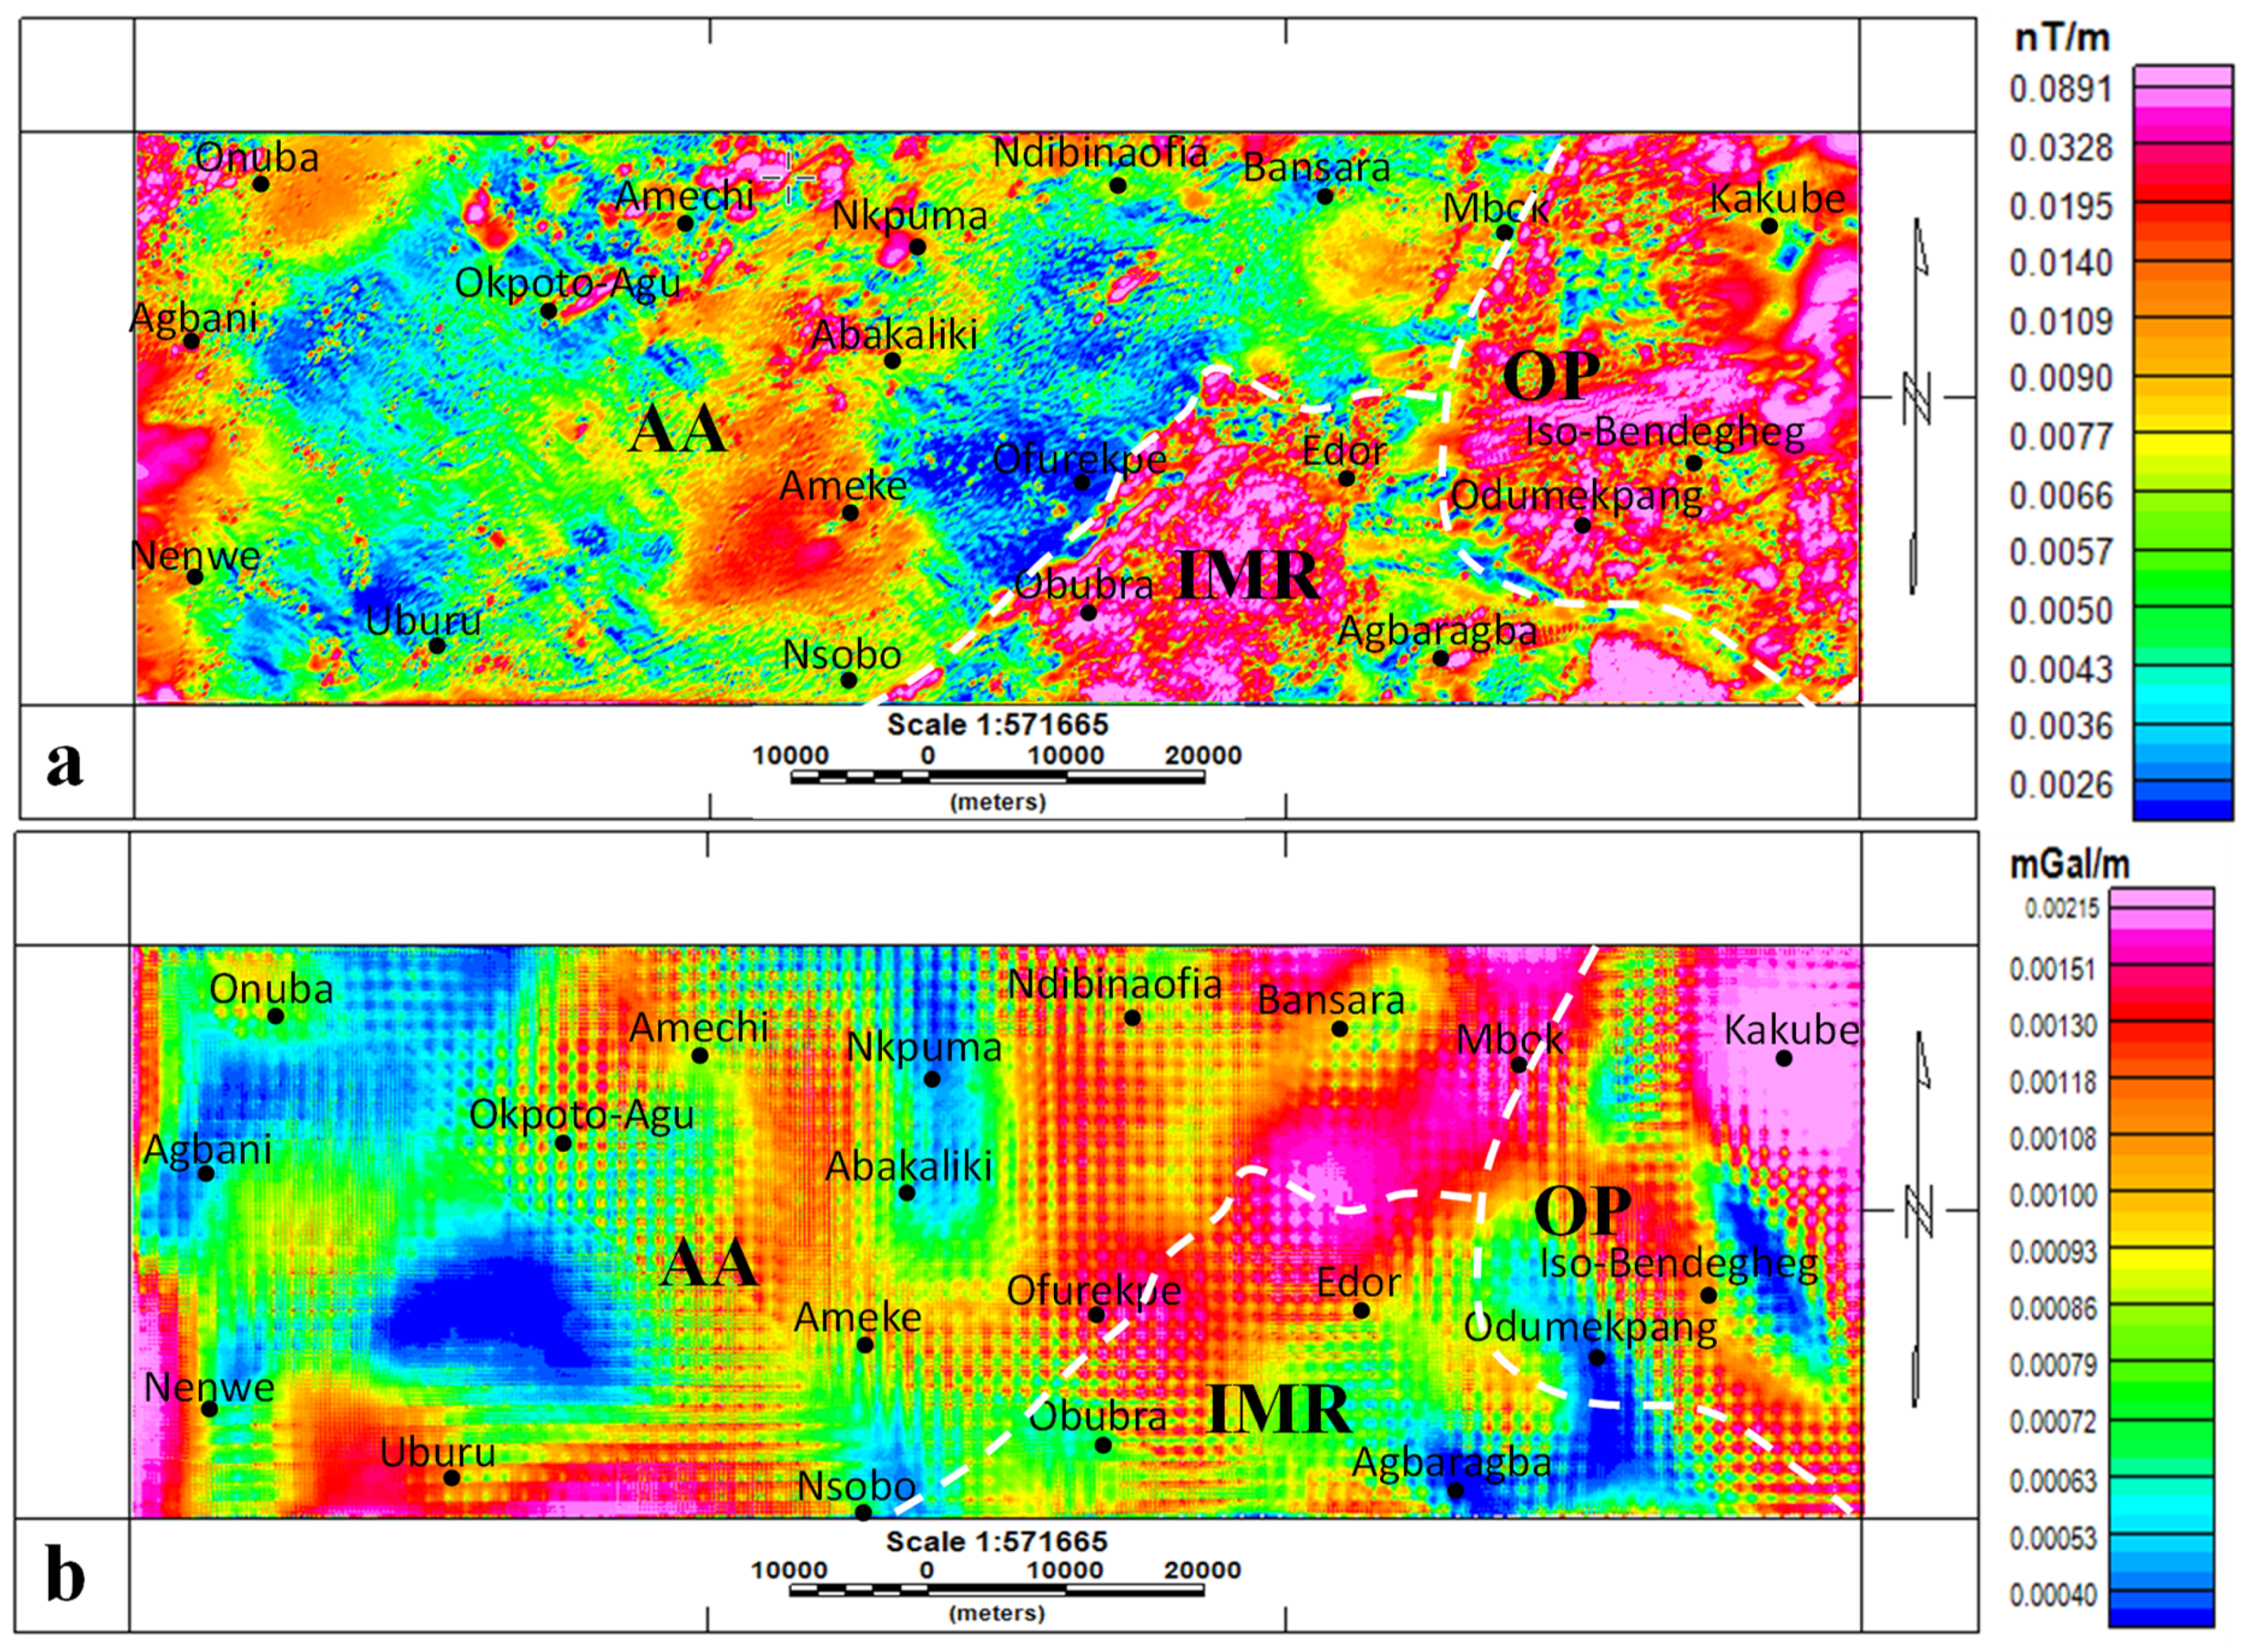
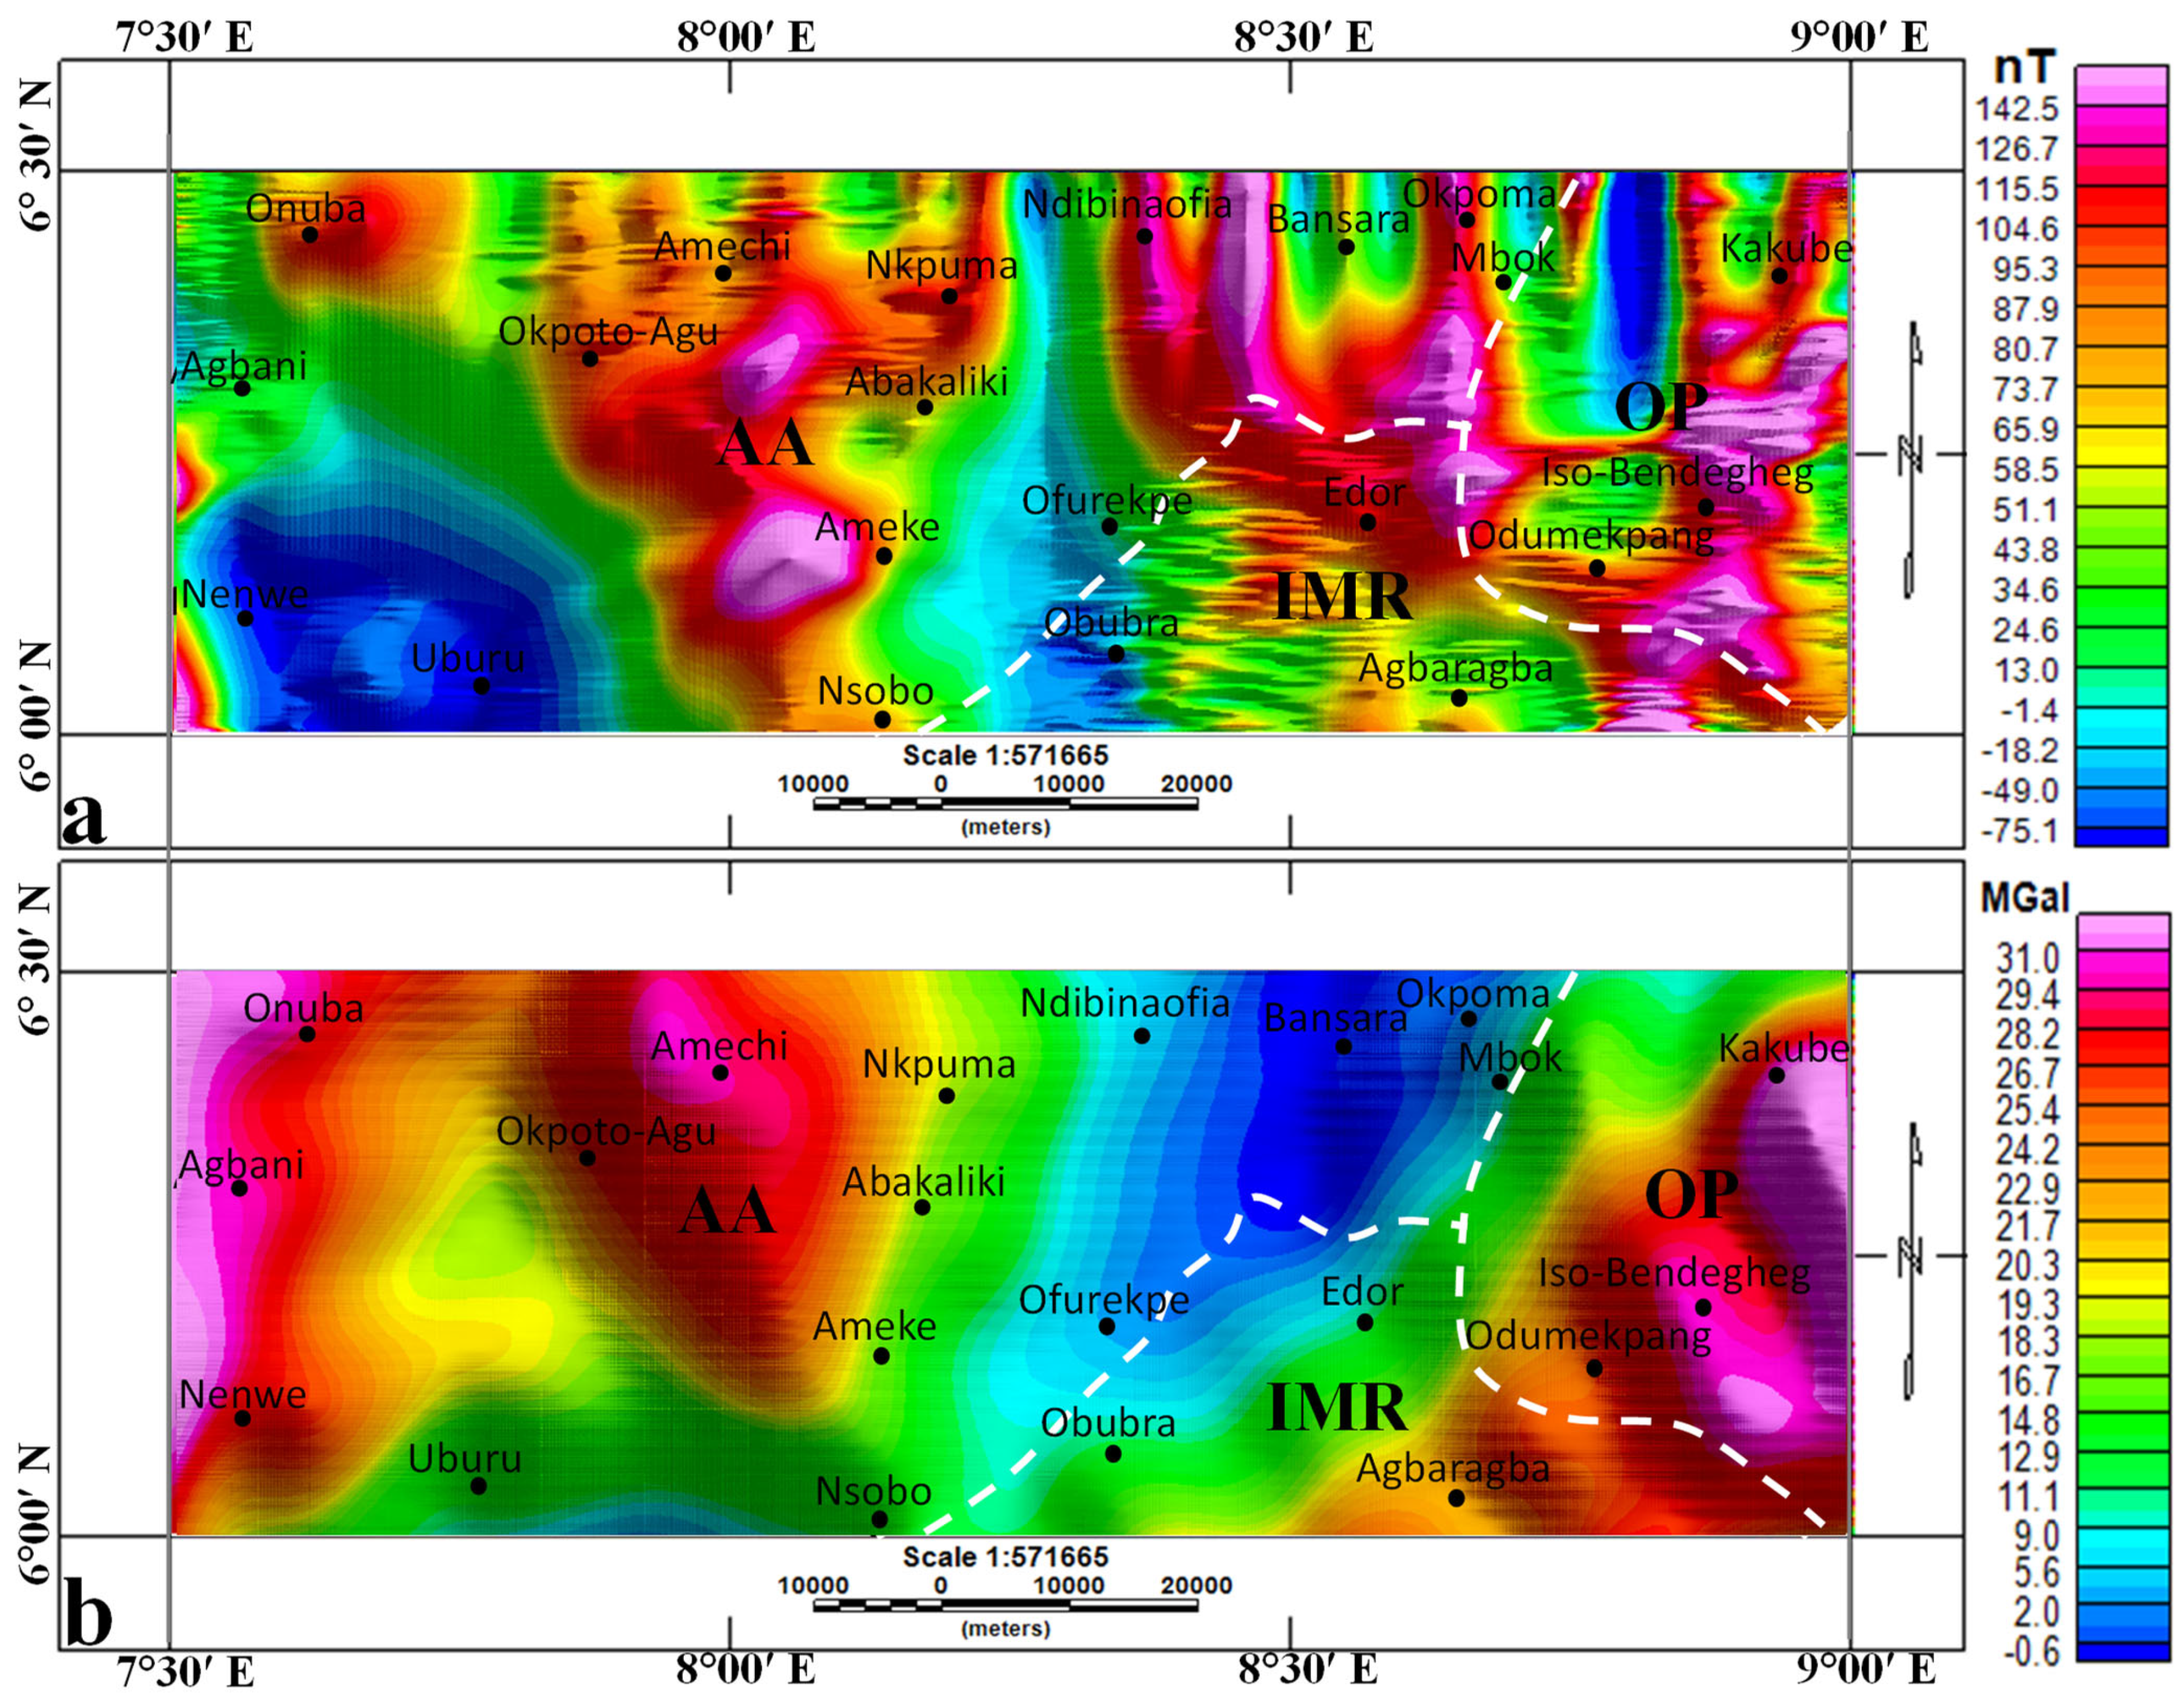
4. Results
5. Discussion of Results
6. Conclusions
Author Contributions
Funding
Acknowledgments
Conflicts of Interest
References
- Eseme, E.; Agyingi, C.M.; Foba-Tendo, J. Geochemistry and genesis of brine emanations from Cretaceous strata of the Mamfe Basin, Cameroon. J. Afr. Earth Sci. 2002, 35, 467–476. [Google Scholar] [CrossRef]
- Toteu, S.F.; Penaye, J.; Djomani, Y.P. Geodynamic evolution of the Pan-African belt in Central Africa with special reference to Cameroon. Can. J. Earth Sci. 2004, 41, 73–85. [Google Scholar] [CrossRef]
- Uma, K.O. The brine fields of the Benue Trough, Nigeria: A comparative study of geomorphic, tectonic and hydrochemical properties. J. Afr. Earth Sci. 1998, 26, 261–275. [Google Scholar] [CrossRef]
- Tijani, M.N. Evolution of saline waters and brines in the Benue-Trough, Nigeria. Appl. Geochem. 2004, 19, 1355–1365. [Google Scholar] [CrossRef]
- Offodile, M.E. The geology of the Middle Benue, Nigeria. Ph.D. Thesis, University of Upsala, Uppsala, Sweden, 1976; 166p. [Google Scholar]
- Tattam, C.H. Preliminary report on the salt industry in Nigena. Geol. Surv. Niger. Rep. 1943, 778. [Google Scholar]
- Uzuakpunwa, A.B. The geochemistry and origin of the evaporite deposits in the southern half of the Benue Trough. Earth Evol. Sci. 1981, 2, 136–139. [Google Scholar]
- Egboka, B.C.E.; Uma, K.O. Hydrochemistry, contaminant transport and their tectonic effects in the Okposi-Uburu salt lake area, Imo State, Nigeria. Hydrol. Sci. J. 1986, 31, 205–221. [Google Scholar] [CrossRef]
- Ford, S.O. The economic mrneral resources of the Benue Trough. Earth Evol. Sci. 1980, 1, 154–163. [Google Scholar]
- Orajaka, S.O. Salt water resources of East Central State of Nigeria. J. Min. Geol. 1972, 7, 35–41. [Google Scholar]
- Akande, S.O.; Horn, E.E.; Reutel, C. Mineralogy, fluid inclusion and genesis of the Arufu and Akwana Pb-Zn-F mineralizabon, Middle Benue Trough, Nigeria. J. Afr. Earth Sci. 1988, 7, 167–180. [Google Scholar] [CrossRef]
- Farrington, I.L. A preliminary description of the Nigerian Lead-Zinc field. Econ. Geol. 1952, 7, 483–608. [Google Scholar] [CrossRef]
- McConnel, R.B. Notes on the Lead-Zinc deposits of Nigeria and Cretaceous stratigraphy of the Benue and Cross River Valleys. Geological Survey of Nigeria Report. No. 752. Niger. Geol. Surv. Rep. 1949; unpublished. [Google Scholar]
- Olade, M.A. Evolution of Nrgeria’s Benue Trough of Nigeria (aulacogen): A tectonic model. Geol. Mag. 1975, 112, 575–583. [Google Scholar] [CrossRef]
- Tijani, M.N.; Loehnert, E.P.; Uma, K.O. Origin of saline groundwaters in the Ogoja area, Lower Benue Trough, Nigeria. J. Afr. Earth Sci. 1996, 23, 237–252. [Google Scholar] [CrossRef]
- Ushie, F.; Eminue, O.; Nwankwoala, H. Occurrence of Brines (NaCl) and their effect on the Groundwater of Okpoma and Environs, Southeastern Nigeria. Int. J. Adv. Sci. Tech. Res. 2014, 4, 2249–9954. [Google Scholar]
- Umar, N.D.; Idris, I.G.; Abdullahi, A.I. Hydrogeophysical investigation of the aquifers of brine field of awe and environs, Central Benue Trough, Nigeria. Int. J. Sci. Eng. Res. 2018, 9, 1852–1868. [Google Scholar]
- Fan, Q.; Ma, H.; Lai, Z.; Tan, H.; Li, T. Origin and evolution of oilfield brines from Tertiary strata in western Qaidam Basin: Constraints from 87Sr/86Sr, δD, δ18O, δ34S and water chemistry. Chin. J. Geochem. 2010, 29, 446–454. [Google Scholar] [CrossRef]
- Xun, Z.; Cijun, L.; Xiumin, J.; Qiang, D.; Lihong, T. Origin of subsurface brines in the Sichuan basin. Ground Water 1996, 35, 53–58. [Google Scholar] [CrossRef]
- Blundy, J.; Mavrogenes, J.; Tattitch, B.; Sparks, S.; Gilmer, A. Generation of porphyry copper deposits by gas–brine reaction in volcanic arcs. Nat. Geosci. 2015, 8, 235–240. [Google Scholar] [CrossRef]
- Dill, H.G.; Botz, R.; Berner, Z.; Hamad, A.B.A. The origin of pre- and synrift, hypogene Fe-P mineralization during the Cenozoic along the Dead Sea Transform Fault, Northwest Jordan. Econ. Geol. 2010, 105, 1301–1319. [Google Scholar] [CrossRef]
- Mineral Resources of the Western US. The Teacher-Friendly Guide to the Earth Scientist of the Western US. 2017. Available online: http://geology.Teacherfriendlyguide.Org/index.php/mineral-w (accessed on 1 December 2021).
- Risacher, F.; Alonsob, H.; Salazar, C. The origin of brines and salts in Chilean salars: A hydrochemical review. Earth-Sci. Rev. 2003, 63, 249–293. [Google Scholar] [CrossRef]
- Sharma, R.; Srivastava, P.K. Hydrothermal fluids of magmatic origin. In Modelling of Magmatic and Allied Processes; Society of Earth Scientists Series; Springer: Berling/Heidelberg, Germany, 2014. [Google Scholar] [CrossRef]
- Xu, K.; Yu, B.; Gong, H.; Ruan, Z.; Pan, Y.; Ren, Y. Carbonate reservoirs modified by magmatic intrusions in the Bachu area, Tarim Basin, NW China. Geosci. Front. 2015, 6, 779–790. [Google Scholar] [CrossRef] [Green Version]
- Ekwok, S.E.; Akpan AEKudamnya, E.A.; Ebong, D.E. Assessment of groundwater potential using geophysical data: A case study in parts of Cross River State, south-eastern Nigeria. Appl. Water Sci. 2020, 10, 144. [Google Scholar] [CrossRef]
- Ekwok, S.E.; Akpan, A.E.; Ebong, D.E. Enhancement and modelling of aeromagnetic data of some inland basins, southeastern Nigeria. J. Afr. Earth Sci. 2019, 155, 43–53. [Google Scholar] [CrossRef]
- Akande, S.O.; Muecke, A. Co-existing copper sulphides and sulphosalts in the Abakaliki Pb–Zn deposits, lower Benue-Trough (Nigeria) and their genetic significance. Miner. Pet. 1993, 47, 183–192. [Google Scholar] [CrossRef]
- Nwachukwu, S.O. The tectonic evolution of the southern portion of the Benue Trough, Nigeria. Geol. Mag. 1972, 109, 411–419. [Google Scholar] [CrossRef]
- Olade, M.A.; Morton, R.D. Origin of lead–zinc mineralization in the southern Benue-Trough, Nigeria: Fluid inclusion and trace element studies. Mineral. Dep. 1985, 20, 76–80. [Google Scholar] [CrossRef]
- Ekwok, S.E.; Akpan, A.E.; Kudamnya, E.A. Exploratory mapping of structures controlling mineralization in Southeast Nigeria using high resolution airborne magnetic data. J. Afr. Earth Sci. 2020, 162, 103700. [Google Scholar] [CrossRef]
- Ekwok, S.E.; Akpan, A.E.; Achadu, O.I.M.; Eze, O.E. Structural and lithological interpretation of aero-geophysical data in parts of the Lower Benue Trough and Obudu Plateau, Southeast Nigeria. Adv. Space Res. 2021, 68, 2841–2854. [Google Scholar] [CrossRef]
- Ekinci, Y.L.; Balkaya, Ç.; Göktürkler, G. Parameter estimations from gravity and magnetic anomalies due to deep-seated faults: Differential evolution versus particle swarm optimization. Turk. J. Earth Sci. 2019, 28, 860–881. [Google Scholar]
- Mehanee, S. A new scheme for gravity data interpretation by a faulted 2-D horizontal thin block: Theory, numerical examples and real data investigation. In IEEE Transactions on Geoscience and Remote Sensing; IEEE: Piscataway, NJ, USA, 2022. [Google Scholar] [CrossRef]
- Ekwok, S.E.; Akpan, A.E.; Ebong, E.D. Assessment of crustal structures by gravity and magnetic methods in the Calabar Flank and adjoining areas of Southeastern Nigeria-a case study. Arab. J. Geosci. 2021, 14, 1–10. [Google Scholar] [CrossRef]
- Ekinci, Y.L.; Balkaya, Ç.; Göktürkler, G.; Özyalın, Ş. Gravity data inversion for the basement relief delineation through global optimization: A case study from the Aegean Graben System, western Anatolia, Turkey. Geophys. J. Int. 2021, 224, 923–944. [Google Scholar] [CrossRef]
- Ekwok, S.E.; Akpan, A.E.; Achadu, O.I.M.; Ulem, C.A. Implications of tectonic anomalies from potential feld data in some parts of Southeast Nigeria. Environ. Earth Sci. 2022, 81, 6. [Google Scholar] [CrossRef]
- Balkaya, Ç.; Ekinci, Y.L.; Göktürkler, G.; Turan, S. 3D non-linear inversion of magnetic anomalies caused by prismatic bodies using differential evolution algorithm. J. Appl. Geophys. 2017, 136, 372–386. [Google Scholar] [CrossRef]
- Balkaya, Ç.; Göktürkler, G.; Erhan, Z.; Ekinci, Y.L. Exploration for a cave by magnetic and electrical resistivity surveys: Ayvacık Sinkhole example, Bozdağ, İzmir (western Turkey). Geophysics 2012, 77, 135–146. [Google Scholar] [CrossRef]
- United States Geological Survey (USGS). Setting and Origin of Iron Oxide-Copper-Cobalt-Gold-Rare Earth Element Deposits of Southeast Missouri. 2013. Available online: http://minerals.usgs.gov/east/semissouri/index.html (accessed on 23 January 2022).
- Telford, W.M.; Geldart, L.P.; Sheriff, R.E. Applied Geophysics, 2nd ed.; Cambridge University Press: Cambridge, UK, 1990. [Google Scholar]
- Eldosouky, A.M.; Sehsah, H.; Elkhateeb, S.O.; Pour, A.B. Integrating aeromagnetic data and Landsat-8 imagery for detection of post-accretionary shear zones controlling hydrothermal alterations: The Allaqi-Heiani Suture zone, South Eastern Desert, Egypt. Adv. Space Res. 2020, 65, 1008–1024. [Google Scholar] [CrossRef]
- Eldosouky, A.M.; Elkhateeb, S.O. Texture analysis of aeromagnetic data for enhancing geologic features using co-occurrence matrices in Elallaqi area, South Eastern Desert of Egypt. NRIAG J. Astron. Geophys. 2018, 7, 155–161. [Google Scholar] [CrossRef]
- Eldosouky, A.M.; Abdelkareem, M.; Elkhateeb, S.O. Integration of remote sensing and aeromagnetic data for mapping structural features and hydrothermal alteration zones in Wadi Allaqi area, South Eastern Desert of Egypt. J. Afr. Earth Sci. 2017, 130, 28–37. [Google Scholar] [CrossRef]
- Eldosouky, A.M.; Mohamed, H. Edge detection of aeromagnetic data as effective tools for structural imaging at Shilman area, South Eastern Desert, Egypt. Arab. J. Geosci. 2021, 14, 13. [Google Scholar] [CrossRef]
- Elkhateeb, S.O.; Eldosouky, A.M.; Khalifa, M.O.; Aboalhassan, M. Probability of mineral occurrence in the Southeast of Aswan area, Egypt, from the analysis of aeromagnetic data. Arab. J. Geosci. 2021, 14, 1514. [Google Scholar] [CrossRef]
- Pham, L.T.; Eldosouky, A.M.; Melouah, O.; Abdelrahman, K.; Alzahrani, H.; Oliveira, S.P.; Andráš, P. Mapping subsurface structural lineaments using the edge filters of gravity data. J. King Saud Univ.-Sci. 2021, 33, 101594. [Google Scholar] [CrossRef]
- Pham, L.T.; Nguyen, D.A.; Eldosouky, A.M.; Abdelrahman, K.; Vu, T.V.; Al-Otaibi, N.; Ibrahim, E.; Kharbish, S. Subsurface structural mapping from high-resolution gravity data using advanced processing methods. J. King Saud Univ. Sci. 2021, 33, 101488. [Google Scholar] [CrossRef]
- Pham, L.T.; Oksum, E.; Do, T.D.; Nguyen, D.V.; Eldosouky, A.M. On the performance of phase-based filters for enhancing lateral boundaries of magnetic and gravity sources: A case study of the Seattle uplift. Arab. J. Geosci. 2021, 14, 129. [Google Scholar] [CrossRef]
- Pham, L.T.; Eldosouky, A.M.; Oksum, E.; Saada, S.A. A new high resolution filter for source edge detection of potential data. Geocarto Int. 2020, 1–18. [Google Scholar] [CrossRef]
- Saada, A.S.; Eldosouky, A.M.; Kamal, A.; Al-Otaibi, N.; Ibrahim, E.; Ibrahim, A. New insights into the contribution of gravity data for mapping the lithospheric architecture. J. King Saud Univ.-Sci. 2021, 33, 101400. [Google Scholar] [CrossRef]
- Saada, A.S.; Mickus, K.; Eldosouky, A.M.; Ibrahim, A. Insights on the tectonic styles of the Red Sea rift using gravity and magnetic data. Mar. Pet. Geol. 2021, 133, 105253. [Google Scholar] [CrossRef]
- Sehsah, H.; Eldosouky, A.M. Neoproterozoic hybrid forearc—MOR ophiolite belts in the northern Arabian-Nubian Shield: No evidence for back-arc tectonic setting. Int. Geol. Rev. 2020, 1–13. [Google Scholar] [CrossRef]
- Elkhateeb, S.O.; Eldosouky, A.M. Detection of porphyry intrusions using analytic signal (AS), Euler Deconvolution, and Centre for Exploration Targeting (CET) Technique Porphyry Analysis at Wadi Allaqi Area, South Eastern Desert, Egypt. Int. J. Eng. Res. 2016, 7, 471–477. [Google Scholar]
- Essa, K.S.; Mehanee, S.; Soliman, K.; Diab, Z.E. Gravity profile interpretation using the R-parameter imaging technique with application to ore exploration. Ore Geol. Rev. 2020, 126, 103695. [Google Scholar] [CrossRef]
- Kearey, P.; Brooks, M.; Hill, I. An Introduction to Geophysical Exploration, 3rd ed.; Blackwell Science Ltd Editorial Offices: New York, NY, USA, 2002. [Google Scholar]
- Abu El-Magd, S.A.; Eldosouky, A.M. An improved approach for predicting the groundwater potentiality in the low desert lands; El-Marashda area, Northwest Qena City, Egypt. J. Afr. Earth Sci. 2021, 179, 104200. [Google Scholar] [CrossRef]
- Ekwok, S.E.; Akpan, A.E.; Ebong, E.D.; Eze, O.E. Assessment of depth to magnetic sources using high resolution aeromagnetic data of some parts of the Lower Benue Trough and adjoining areas, Southeast Nigeria. Adv. Space Res. 2021, 67, 2104–2119. [Google Scholar] [CrossRef]
- Mehanee, S. Simultaneous joint inversion of residual gravity and self-potential data measured along profile: Theory, numerical examples and a case study from mineral exploration with cross validation from electromagnetic data. IEEE Trans. Geosci. Remote Sens. 2022, 60, 1–20. [Google Scholar] [CrossRef]
- Cherkashov, G.; Poroshina, I.; Stepanova, T.; Ivanov, V.; Bel’tenev, V.; Lazareva, L.; Rozhdestvenskaya, I.; Samovarov, M.; Shilov, V.; Glasby, G.P.; et al. Seafloor Massive Sulfides from the Northern Equatorial Mid-Atlantic Ridge: New Discoveries and Perspectives. Mar. Georesources Geotechnol. 2010, 28, 222–239. [Google Scholar] [CrossRef] [Green Version]
- Gunn, P.J.; Dentith, M.C. Magnetic responses associated with mineral deposits. AGSO J. Aust. Geol. Geophys. 1997, 17, 145–158. [Google Scholar]
- Correia, A.; Jones, F.W. On the existence of a geothermal anomaly in southern Portugal. Tectonophysics 1997, 271, 123–134. [Google Scholar] [CrossRef]
- Akpan, A.E.; Ebong, D.E.; Ekwok, S.E.; Joseph, S. Geophysical and Geological Studies of the Spread and Industrial Quality of Okurike Barite Deposit. Am. J. Environ. Sci. 2014, 10, 566–574. [Google Scholar] [CrossRef]
- Mbah, V.O.; Onwuemesi, A.G.; Aniwetalu, E.U. Exploration of lead-zinc (Pb-Zn) mineralization using very low frequency electromanetic (VLF-EM) in Ishiagu, Ebonyi State. J. Geol. Geophys. 2015, 4, 1–7. [Google Scholar]
- Mbipom, E.W.; Okon-Umoren, O.E.; Umoh, J.U. Geophysical investigations of salt ponds in Okpoma area south-eastern Nigeria. J. Min. Geol. Niger. 1990, 26, 285–290. [Google Scholar]
- Okoyeh, E.I.; Akpan, A.E.; Egboka, B.C.E.; Okolo, M.C.; Okeke, H.C. Geophysical delineation of subsurface fracture associated with Okposi-Uburu Salt Lake Southeastern, Nigeria. Int. Res. J. Environ. Sci. 2015, 4, 1–6. [Google Scholar]
- Ugbor, D.O.; Okeke, F.N. Geophysical investigation in the Lower Benue trough of Nigeria using gravity method. Int. J. Phys. Sci. 2010, 5, 1757–1769. [Google Scholar]
- Agbi, I.; Ekwueme, B.N. Preliminary review of the geology of the hornblende biotite gneisses of Obudu Plateau Southeastern Nigeria. Glob. J. Geol. Sci. 2018, 17, 75–83. [Google Scholar] [CrossRef]
- Dada, S.S. Crust-forming ages and Proterozoic crustal evolution in Nigeria: A reappraisal of current interpretations. Precambrian Res. 1998, 87, 65–74. [Google Scholar] [CrossRef]
- Ukwang, E.E.; Ekwueme, B.N.; Kröner, A. Single zircon evaporation ages: Evidence for the Mesoproterozoic crust in S.E. Nigerian basement complex. Chin. J. Geochem. 2012, 31, 48–54. [Google Scholar] [CrossRef]
- Haruna, I.V. Review of the Basement Geology and Mineral Belts of Nigeria. J. Appl. Geol. Geophys. 2017, 5, 37–45. [Google Scholar]
- Fairhead, J.D.; Okereke, C.S.; Nnange, J.M. Crustal Structure of the Mamfe basin, West Africa, based on gravity data. Tectonophysics 1991, 186, 351–358. [Google Scholar] [CrossRef]
- Dumort, J.C. Carte Géologique de Reconnaissance et Note Explicative sur la Feuille Douala-Ouest (1:500000); Direction des Mines et de la Géologie du Cameroun: Yaoundé, Cameroun, 1968. [Google Scholar]
- Ofoegbu, C.O.; Onuoha, K.M. Analysis of magnetic data over the Abakaliki Anticlinorium of the Lower Benue Trough, Nigeria. Mar. Pet. Geol. 1991, 8, 174–183. [Google Scholar] [CrossRef]
- Reyment, R.A. Aspects of the Geology of Nigeria; Ibadan University Press: Ibadan, Nigeria, 1965. [Google Scholar]
- Benkhelil, J. Structure et evolution geodynamique du Basin intracontinental de la Benoue (Nigeria). Bull. Cent. Rech. Explor. Prod. Elf-Aquitaine 1988, 12, 29–128. [Google Scholar]
- Milligan, P.; Gunn, P. Enhancement and presentation of airborne geophysical data. AGSO J. Aust. Geol. Geophys. 1997, 17, 63–75. [Google Scholar]
- Roest, W.R.; Verhoef, J.; Pilkington, M. Magnetic interpretation using the 3-D analytic signal. Geophysics 1992, 57, 116–125. [Google Scholar] [CrossRef]
- Essa, K.S.; Mehanee, S.; Elhussein, M. Magnetic data profiles interpretation for mineralized buried structures identification applying the variance analysis method. Pure Appl. Geophys. 2020, 178, 973–993. [Google Scholar] [CrossRef]
- Klingele, E.E.; Marson, I.; Kahle, H.G. Automatic interpretation of gravity gradiometric data in two dimensions: Vertical gradients. Geophys. Prospect. 1991, 39, 407–434. [Google Scholar] [CrossRef]
- Mehanee, S.; Essa, K.S.; Diab, Z.E. Magnetic data interpretation using a new R-parameter imaging method with application to mineral exploration. Nat. Resour. Res. 2020, 30, 77–95. [Google Scholar] [CrossRef]
- Fraser, D.C.; Fuller, B.D.; Ward, S.H. Some numerical techniques for application in mining exploration. Geophysics 1966, 31, 1066–1077. [Google Scholar] [CrossRef]
- Nabighian, M.N. The analytical signal of two dimensional magnetic bodies with polygon cross-section: Its properties and use for automated anomaly interpretation. Geophysics 1972, 37, 507–517. [Google Scholar] [CrossRef]
- Nabighian, M.N. Towards the three-dimensional automatic interpretation of potential field data via generalized Hilbert transforms: Fundamental relations. Geophysics 1984, 53, 957–966. [Google Scholar] [CrossRef]
- Zahra, H.S.; Oweis, H.T. Application of high-pass filtering techniques on gravity and magnetic data of the eastern Qattara Depression area, Western Desert, Egypt. NRIAG J. Astron. Geophys. 2016, 5, 106–123. [Google Scholar] [CrossRef] [Green Version]
- Allen, R.L.; Mills, D.W. Signal Analysis, Time, Frequency, Scale, and Structure; IEEE Press: Piscataway, NJ, USA, 2004. [Google Scholar]
- Reeves, C.; Reford, S.; Millingan, P. Airborne geophysics: Old methods, new images. In Proceedings of the Fourth Decennial. International Conference on Mineral Exploration; Gubins, A., Ed.; Prospectors and Developers Association of Canada: Toronto, ON, Canada, 1997; pp. 13–30. [Google Scholar]
- Talwani, M.; Hiertzler, J.R. Computation of magnetic anomalies caused by two dimensional bodes of arbitrary shape. Geol. Sci. 1964, 9, 464–480. [Google Scholar]
- Talwani, M.; Worzel, J.L.; Landisman, M. Rapid gravity computations for 2 dimensional bodies with application to the Mendocino submarine fracture zone. J. Geophys. Res. 1959, 64, 49–59. [Google Scholar] [CrossRef] [Green Version]
- Won, I.J.; Bevis, M. Computing the gravitational and magnetic anomalies due to a polygon: Algorithms and Fortran subroutines. Geophysics 1987, 52, 232–238. [Google Scholar] [CrossRef]
- Essa, K.S.; Elhussein, M. A new approach for the interpretation of magnetic data by a 2-D dipping dike. J. Appl. Geophys. 2017, 136, 431–443. [Google Scholar] [CrossRef]
- Essa, K.S.; Elhussein, M. PSO (particle swarm optimization) for interpretation of magnetic anomalies caused by simple geometrical structures. Pure Appl. Geophys. 2018, 175, 3539–3553. [Google Scholar] [CrossRef]
- Benkhelil, J. Cretaceous deformation, magmatism, and metamorphism in the Lower Benue Trough, Nigeria. Geol. J. 1987, 22, 467–493. [Google Scholar] [CrossRef]
- Kogbe, C.A. Geology of Nigeria: A Review; Elizabethan Publishing Co.: Lagos, Nigeria, 1976; pp. 436–468. [Google Scholar]
- Ofoegbu, C.O.; Mohan, N.L. Interpretation of aeromagnetic anomalies over part of southeastern Nigeria using three-dimensional Hilbert transformation. Pure Appl. Geophys. 1990, 134, 13–29. [Google Scholar] [CrossRef]
- Abolo, M.G. Geology and petroleum potential of the Mamfe basin, Cameroon, central Africa. Afr. Geosci. Rev. 2008, 12, 65–77. [Google Scholar]
- Ajonina, H.N.; Ajibola, O.A.; Bassey, C.E. The Mamfe Basin, SE Nigeria and SW Cameroon: A review of the basin filling model and tectonic evolution. J. Geosci. Soc. Cameroon 2002, 1, 24–25. [Google Scholar]
- Arinze, J.I.; Emedo, O.C.; Ngwaka, A.C. Analysis of aeromagnetic anomalies and structural lineaments for mineral and hydrocarbon exploration in Ikom and its environs southeastern Nigeria. J. Afr. Earth Sci. 2019, 151, 274–285. [Google Scholar]
- Lar, U.A.; Sallau, A.K. Trace element geochemistry of the Keana brines field, Middle Benue Trough. Environ. Geochem. Health 2005, 27, 331–339. [Google Scholar] [CrossRef]
- Barton, M.D.; Johnson, D.A. Alternative brine sources for Fe-Oxide (-Cu-Au) systems: Implications for hydrothermal alteration and metals. In Hydrothermal Iron Oxide Copper-Gold & Related Deposits: A Global Perspective; Porter, T.M., Ed.; Australian Mineral Foundation: Adelaide, Australia, 2000; pp. 43–60. [Google Scholar]
- Holford, S.P.; Schofield, N.; Jackson, C.A.L.; Magee, C.; Green, P.F.; Duddy, I.R. Impacts of igneous intrusions on source and reservoir potential in prospective sedimentary basins along the Western Australian continental margin. In Proceedings of the West Australian Basins Symposium, Perth, WA, Australia, 18–21 August 2013; pp. 1–12. [Google Scholar]
- Neupane, G.; Wendt, D.S. Assessment of Mineral Resources in Geothermal Brines in the US. In Proceedings of the 42nd Workshop on Geothermal Reservoir Engineering, Stanford, CA, USA, 13–15 February 2017; pp. 1–18. [Google Scholar]
- Vehling, F.; Hasenclever, J.; Rüpke, L. Brine formation and mobilization in submarine hydrothermal systems: Insights from a novel multiphase hydrothermal flow model in the system H2O–NaCl. Transp. Porous Media 2021, 136, 65–102. [Google Scholar] [CrossRef]
- Daubeny, C. A Description of Active and Extinct Volcanoes; Cambridge University Press: Cambridge, UK, 1826; pp. 168–172. [Google Scholar]
- Ballaert, W. Origin of Salt Deposits. Proc. Brit. Assoc. Adv. Sci. 1852, 2, 100. [Google Scholar]
- Darwin, C. The Structure and Distribution of Coral Reefs. Being the First Part of the Geology of the Voyage of the Beagle, under the Command of Capt. Fitzroy, R.N. during the Years 1832 to 1836; Smith Elder and Co. Geological Observations: London, UK, 1842; Volume 3, p. 235. [Google Scholar]
- Roy, A.B. Fundamentals of Geology; Narosa Publishing House Pvt. Ltd.: Oxford, UK, 2010; p. 149. [Google Scholar]
- Stober, I.; Bucher, K. Hydraulic conductivity of fractured upper crust: Insights from hydraulic tests in boreholes and fluid-rock interaction in crystalline basement rocks. Geofluids 2015, 15, 161–178. [Google Scholar] [CrossRef]
- Singh, H.; Cai, J. Permeability of fractured shale and two-phase relative permeability in fractures. In Encyclopedia of Electrochemical Power Sources; Elsevier: Amsterdam, The Netherlands, 2019. [Google Scholar]


Publisher’s Note: MDPI stays neutral with regard to jurisdictional claims in published maps and institutional affiliations. |
© 2022 by the authors. Licensee MDPI, Basel, Switzerland. This article is an open access article distributed under the terms and conditions of the Creative Commons Attribution (CC BY) license (https://creativecommons.org/licenses/by/4.0/).
Share and Cite
Ekwok, S.E.; Akpan, A.E.; Achadu, O.-I.M.; Thompson, C.E.; Eldosouky, A.M.; Abdelrahman, K.; Andráš, P. Towards Understanding the Source of Brine Mineralization in Southeast Nigeria: Evidence from High-Resolution Airborne Magnetic and Gravity Data. Minerals 2022, 12, 146. https://doi.org/10.3390/min12020146
Ekwok SE, Akpan AE, Achadu O-IM, Thompson CE, Eldosouky AM, Abdelrahman K, Andráš P. Towards Understanding the Source of Brine Mineralization in Southeast Nigeria: Evidence from High-Resolution Airborne Magnetic and Gravity Data. Minerals. 2022; 12(2):146. https://doi.org/10.3390/min12020146
Chicago/Turabian StyleEkwok, Stephen E., Anthony E. Akpan, Ogiji-Idaga M. Achadu, Cherish E. Thompson, Ahmed M. Eldosouky, Kamal Abdelrahman, and Peter Andráš. 2022. "Towards Understanding the Source of Brine Mineralization in Southeast Nigeria: Evidence from High-Resolution Airborne Magnetic and Gravity Data" Minerals 12, no. 2: 146. https://doi.org/10.3390/min12020146