Article

Use of the Far Infrared Spectroscopy for NaCl and KCl Minerals Characterization—A Case Study of Halides from Kłodawa in Poland

by
Katarzyna Chruszcz-Lipska
1,*,
Sylwia Zelek-Pogudz
2,
Urszula Solecka
3,
Marek Leszek Solecki
1,
Elżbieta Szostak
4,
Krzysztof Kazimierz Zborowski
4 and
Michał Zając
1
1
Faculty of Drilling, Oil and Gas, AGH University of Science and Technology, 30-059 Kraków, Poland
2
Faculty of Geology, Geophysics and Environmental Protection, AGH University of Science and Technology, 30-059 Kraków, Poland
3
Faculty of Environmental Engineering and Land Surveying, University of Agriculture in Krakow, 30-059 Kraków, Poland
4
Faculty of Chemistry, Jagiellonian University in Kraków, 30-387 Kraków, Poland
*
Author to whom correspondence should be addressed.
Minerals 2022, 12(12), 1561; https://doi.org/10.3390/min12121561
Submission received: 27 August 2022 / Revised: 22 November 2022 / Accepted: 29 November 2022 / Published: 3 December 2022
(This article belongs to the Topic Study of Minerals by Molecular Spectroscopy)

Abstract

:
The paper presents research on chloride minerals of natural origin from Kłodawa (Poland), i.e., colorless, blue and purple halite as well as colorless sylvite. Selected samples of minerals were studied by chemical analysis (ICP-OES, ICP-MS, titration methods) and crystallographic measurements. Then, for the tested halides, research was carried out using far-infrared spectroscopy. Spectroscopic studies confirmed the simple way of distinguishing NaCl and KCl minerals using far-infrared spectroscopy, known in the literature. The novelty is that the article presents for the first time the experimental far infrared spectra of natural blue and purple halite. It was observed that the blue (178 cm−1) and purple (176 cm−1) halites have the strongest infrared band slightly shifted towards higher wavenumbers compared to colorless halite (174 cm−1). As part of the work, the infrared spectra of the crystal structure models of sodium and potassium chloride were calculated for the first time using the density functional theory (with the B3LYP functional and the 6-31G* basis set, 125-atom model). The proposed approach can be used not only as a powerful method differentiating NaCl and KCl minerals, but it can also help with understanding of different defects in crystal lattices for naturally occurring halides and crystals of other minerals.

1. Introduction

The study on the mineralogical composition of the salt rocks in which salt caverns are leached was the impetus for the research presented in this paper. Large fuel reserves improve the country’s energy security as they stabilize seasonal demand and fluctuations in energy commodity prices. Reserves of liquid and gaseous energy resources are formed in salt caverns and in depleted reservoirs of hydrocarbons. Building underground gas storage in the salt cavern requires greater financial outlays than the adaptation of the depleted hydrocarbon reservoir. However, lower costs of gas consumption from salt caverns, the possibility of multiple injection and withdrawal cycles per year make the construction of this type of storage facility more profitable in the long term [1]. For this reason, most countries create new underground storages in salt caverns. In Europe, 35% of gas reserves (in underground gas storage) are stored in salt caverns [2]. In Poland, there are three underground storages of hydrocarbons in salt: Mogilno, Góra and Kosakowo (Figure 1).
Conditions suitable for the construction of underground salt storages exist in a large area of Poland, both in salt domes and layered salt deposits [3,4]. The lithological profile has a huge impact on the volume and shape of the caverns obtained [5]. Salt formations of undifferentiated mineral composition are best suited for this purpose. Salt rocks are aggregates of salt minerals originally formed in the process of chemical sedimentation through the evaporation of natural salt solutions. In terms of chemical composition, salt minerals are mainly sodium, potassium, calcium and magnesium chlorides and sulphates. These are halite (NaCl), sylvite (KCl), carnallite (KCl·MgCl2·6H2O), kieserite (MgSO4·H2O), anhydrite (CaSO4), gypsum (CaSO4·2H2O), langbeinite (K2SO4·2H2O), polyhalite (K2SO4·MgSO4·2CaSO4·2H2O) and kainite (KCl·MgSO4·3H2O) [5,6]. However, sodium chloride (halite) and potassium chloride (sylvite) are the basic salt rocks. The distinction between these minerals is very important from a practical point of view. As shown in Figure 2 [5], the rate of leaching of the sylvite-containing layers is higher than for halite, which adversely affects the shape of the cavern. The arrangement of rocks in the deposit, which is the result of its internal tectonics, has a great influence on the ability to control the development of the caverns. The most favorable situation is created by undisturbed, horizontal deposits of salt. Lithological variability in such deposits (variability of rock properties) is generally vertical. This direction is consistent with the direction of geological exploration in vertical boreholes and with the direction of development of the leaching chambers from the bottom to the top, which significantly facilitates the leaching design and construction of the chamber [5], as shown in Figure 2.
This is due to the difference in the solubility of halite and sylvite in water, which is the leaching medium during the formation of salt caverns. The difference in the solubility of halite and sylvite is especially visible at greater depths, where the temperature in the area of the salt chamber in the deposit is relatively high (approx. 70 °C). At the temperature of 25 °C, the solubility of NaCl and KCl is very similar and amounts to 26.483 and 26.476 g/100 g of H2O. On the other hand, at 70 °C, the solubility of NaCl and KCl is 27.338 and 32.582 g/100 g of H2O, respectively [7].
Halite and sylvite are one of the main components of chemical sedimentary rocks. They are readily dissolved in water, and therefore, the most common are formed by evaporation in the dry area [8,9]. Halite is chemically sodium chloride NaCl, which crystallizes in the cubic system and has low hardness (Mohs scale 2–3). Halite occurs widespread in the Earth’s crust [8,9,10]. It is usually colorless, but it is possible to occur in different colorful variants. The most common colors are: milky white, brownish, orange, red, purple, blue, pink and grayish. The color variations of the salt exist because of different reasons, most importantly: deformation of crystal lattice and occurrence of impurities or non-specifics ions inside of crystal structure [11]. Sylvite, chemically potassium chloride KCl, like halite, crystallizes into regular, cubic forms and has low hardness (Mohs scale 2). When sylvite is placed in a flame, the flame turns purple. Sylvite belongs to the minerals widespread only in certain parts of the Earth. The natural color of sylvite is colorless to white but it is possible to have colors due to inclusions, for instance yellowish red to red, purple, pale gray [9,11].
Halite and sylvite are difficult to distinguish only on the basis of the crystal’s morphology. The optical properties of these minerals are also similar to each other as both halite and sylvite are generally isotropic minerals. In a thin section, halite is colorless, pink, while sylvite is colorless, however, the much lower refractive index of sylvite allows for a distinction between both minerals. [12,13,14]. Halite and sylvite can also be distinguished by using the X-ray powder diffraction method and comparing peak positions of the experimental powder XRD patterns with patterns in databases [15,16]. Halite and sylvite do not exhibit first order Raman scattering because of the F-centers absence [10,17,18]. In the case of these minerals, Raman spectroscopy is mainly used to study inclusions and defects present inside them, especially in halite [10,18,19,20,21,22,23,24,25,26]. To detect inclusions in halite, the SEM-EDS (Scanning Electron Microscopy-Energy Dispersive Spectroscopy) method is also used [13,27]. Vibrational spectroscopy, like Raman, is used to study inclusions in alkali halides for example in sylvite [28]. Transparent halite induces faint absorption bands in the visible and near infrared [29,30]. In general, all the absorption properties for halide ions occur in the far infrared [30,31], however, there are studies where near infrared measurements have been used to study aqueous NaCl and KCl solutions [32,33].
In summary, halite and sylvite are the basic minerals of salt rocks. The detection and differentiation between these minerals are important for the salt cavern leaching process. The aim of the study was to check whether the DFT (Density Functional Theory) calculations for NaCl and KCl crystal models, which had not been used before, could be effective in the study of the structure and spectral properties of these salts. Another goal was to measure the far-infrared spectra of various naturally occurring halite and sylvite samples. To our knowledge, these spectra for the various colored halites are not yet reported in the literature.

2. Materials and Methods

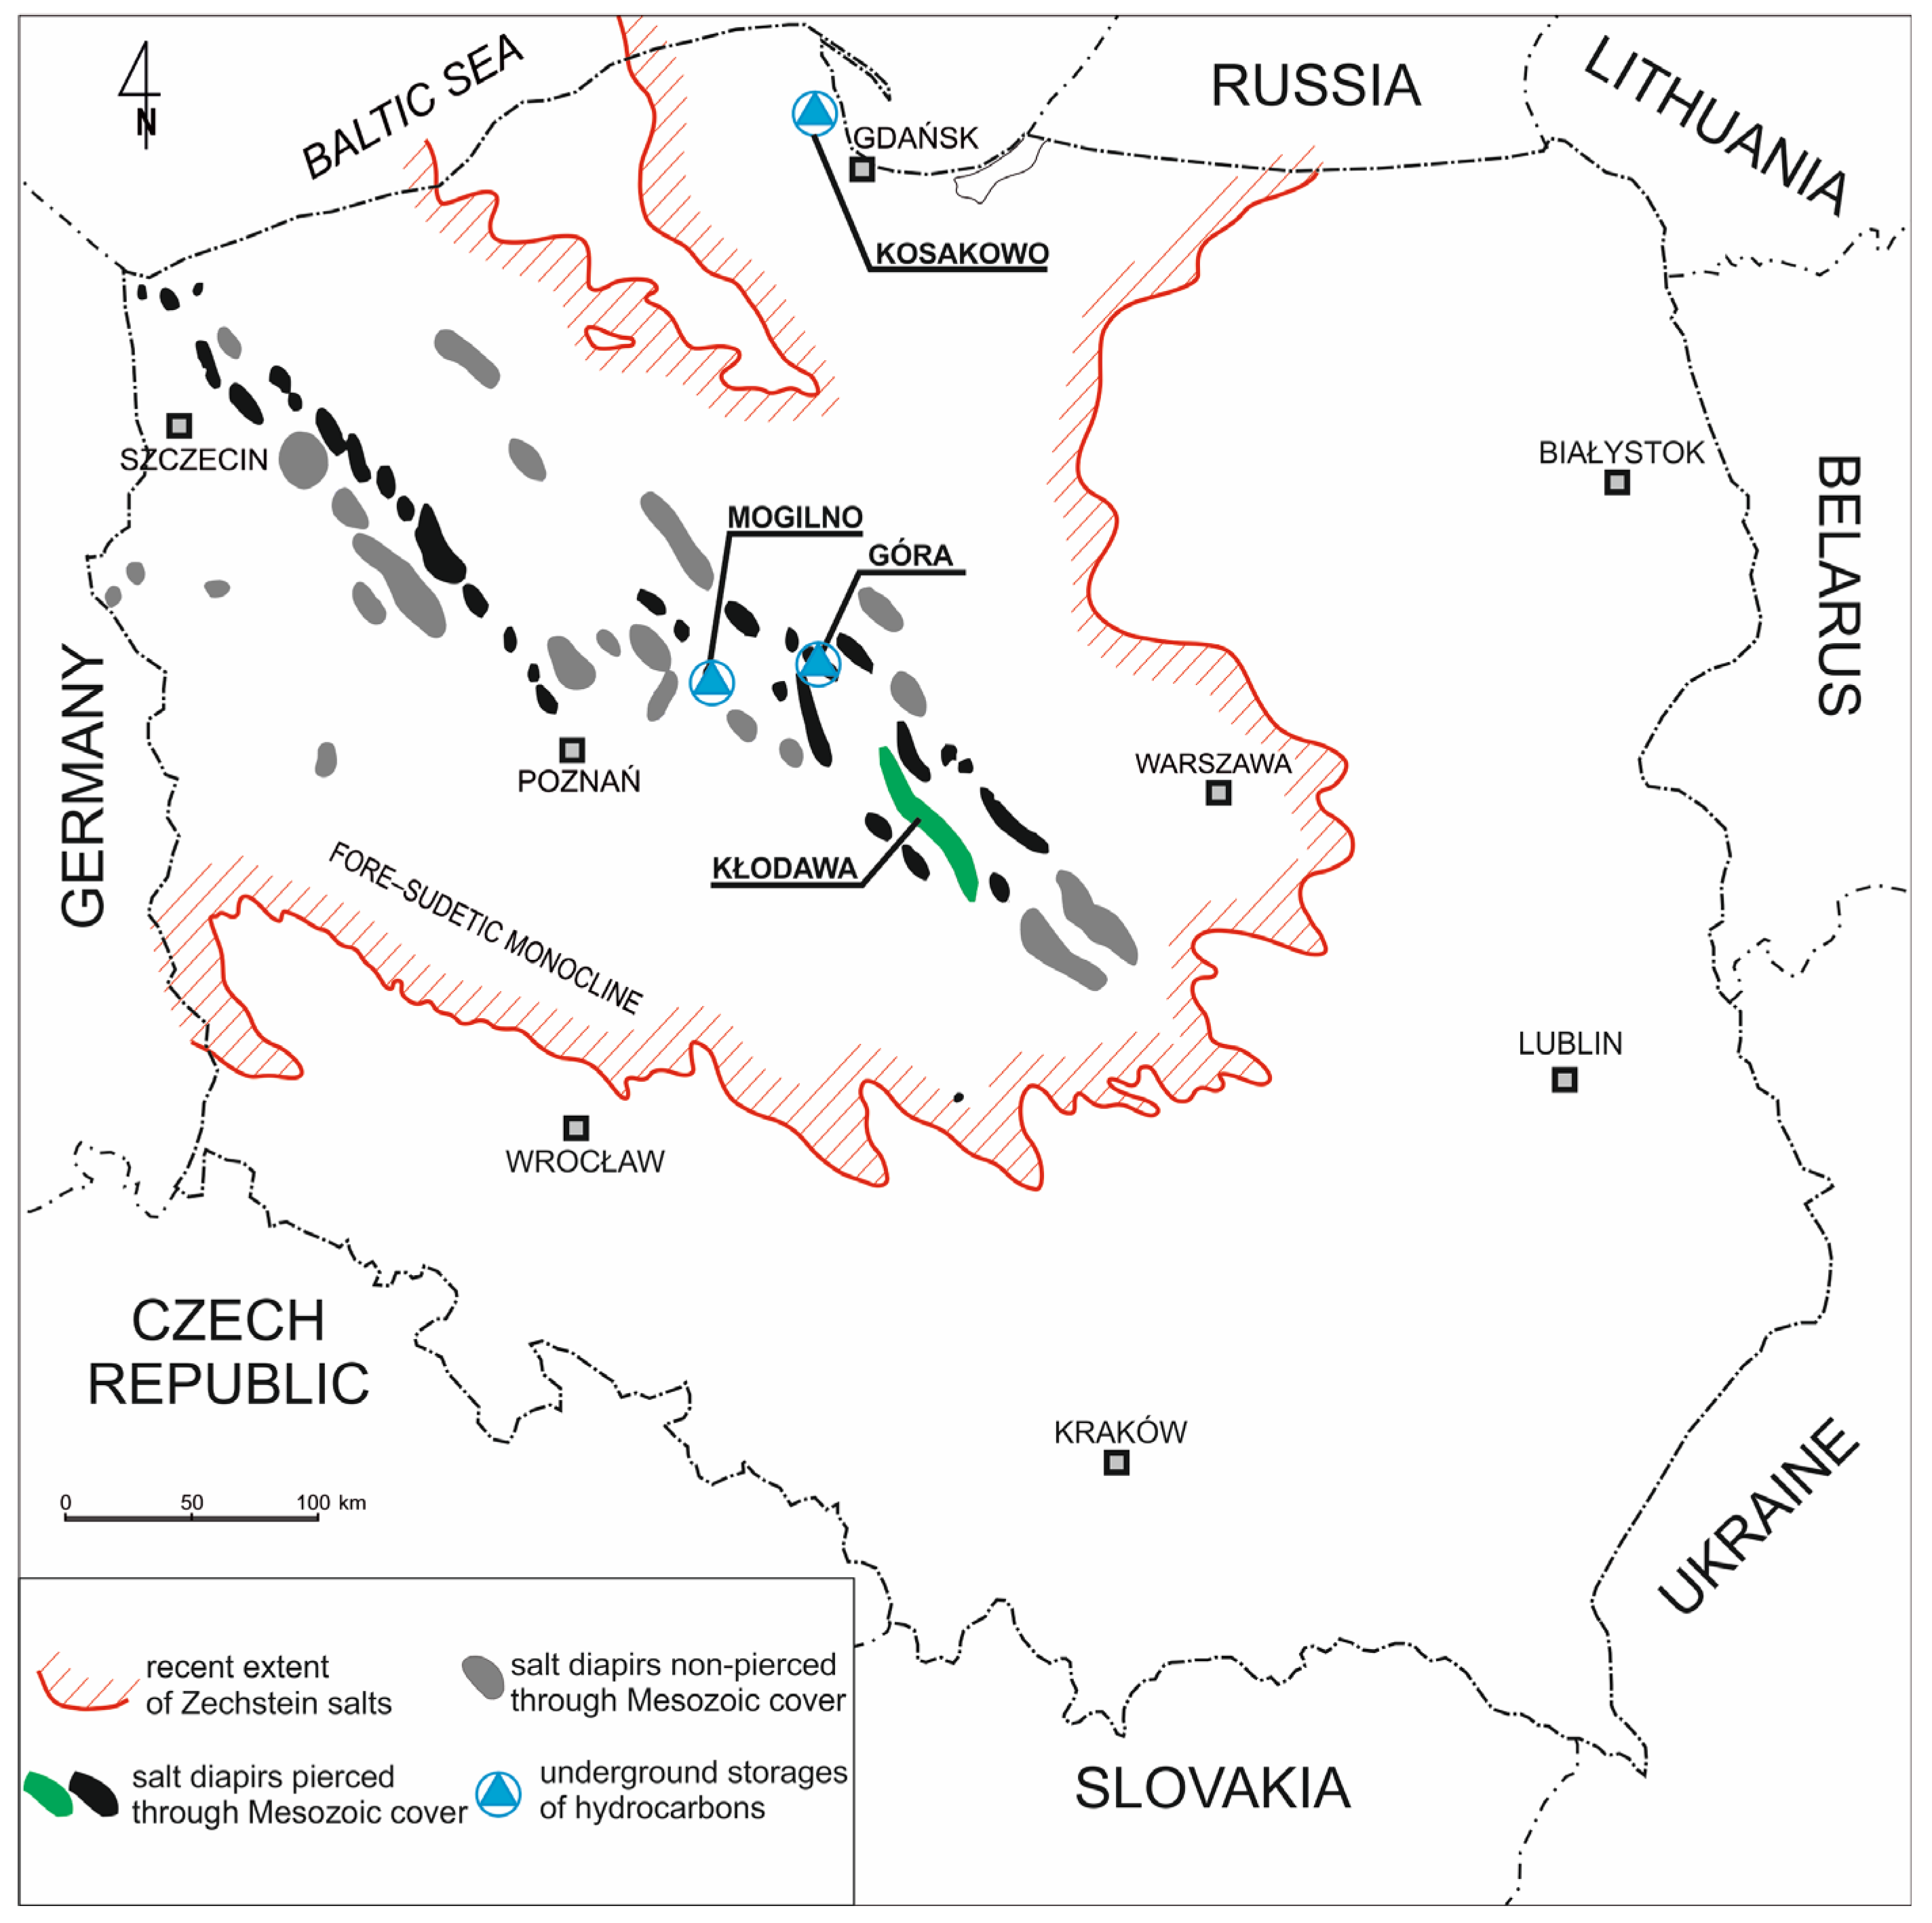
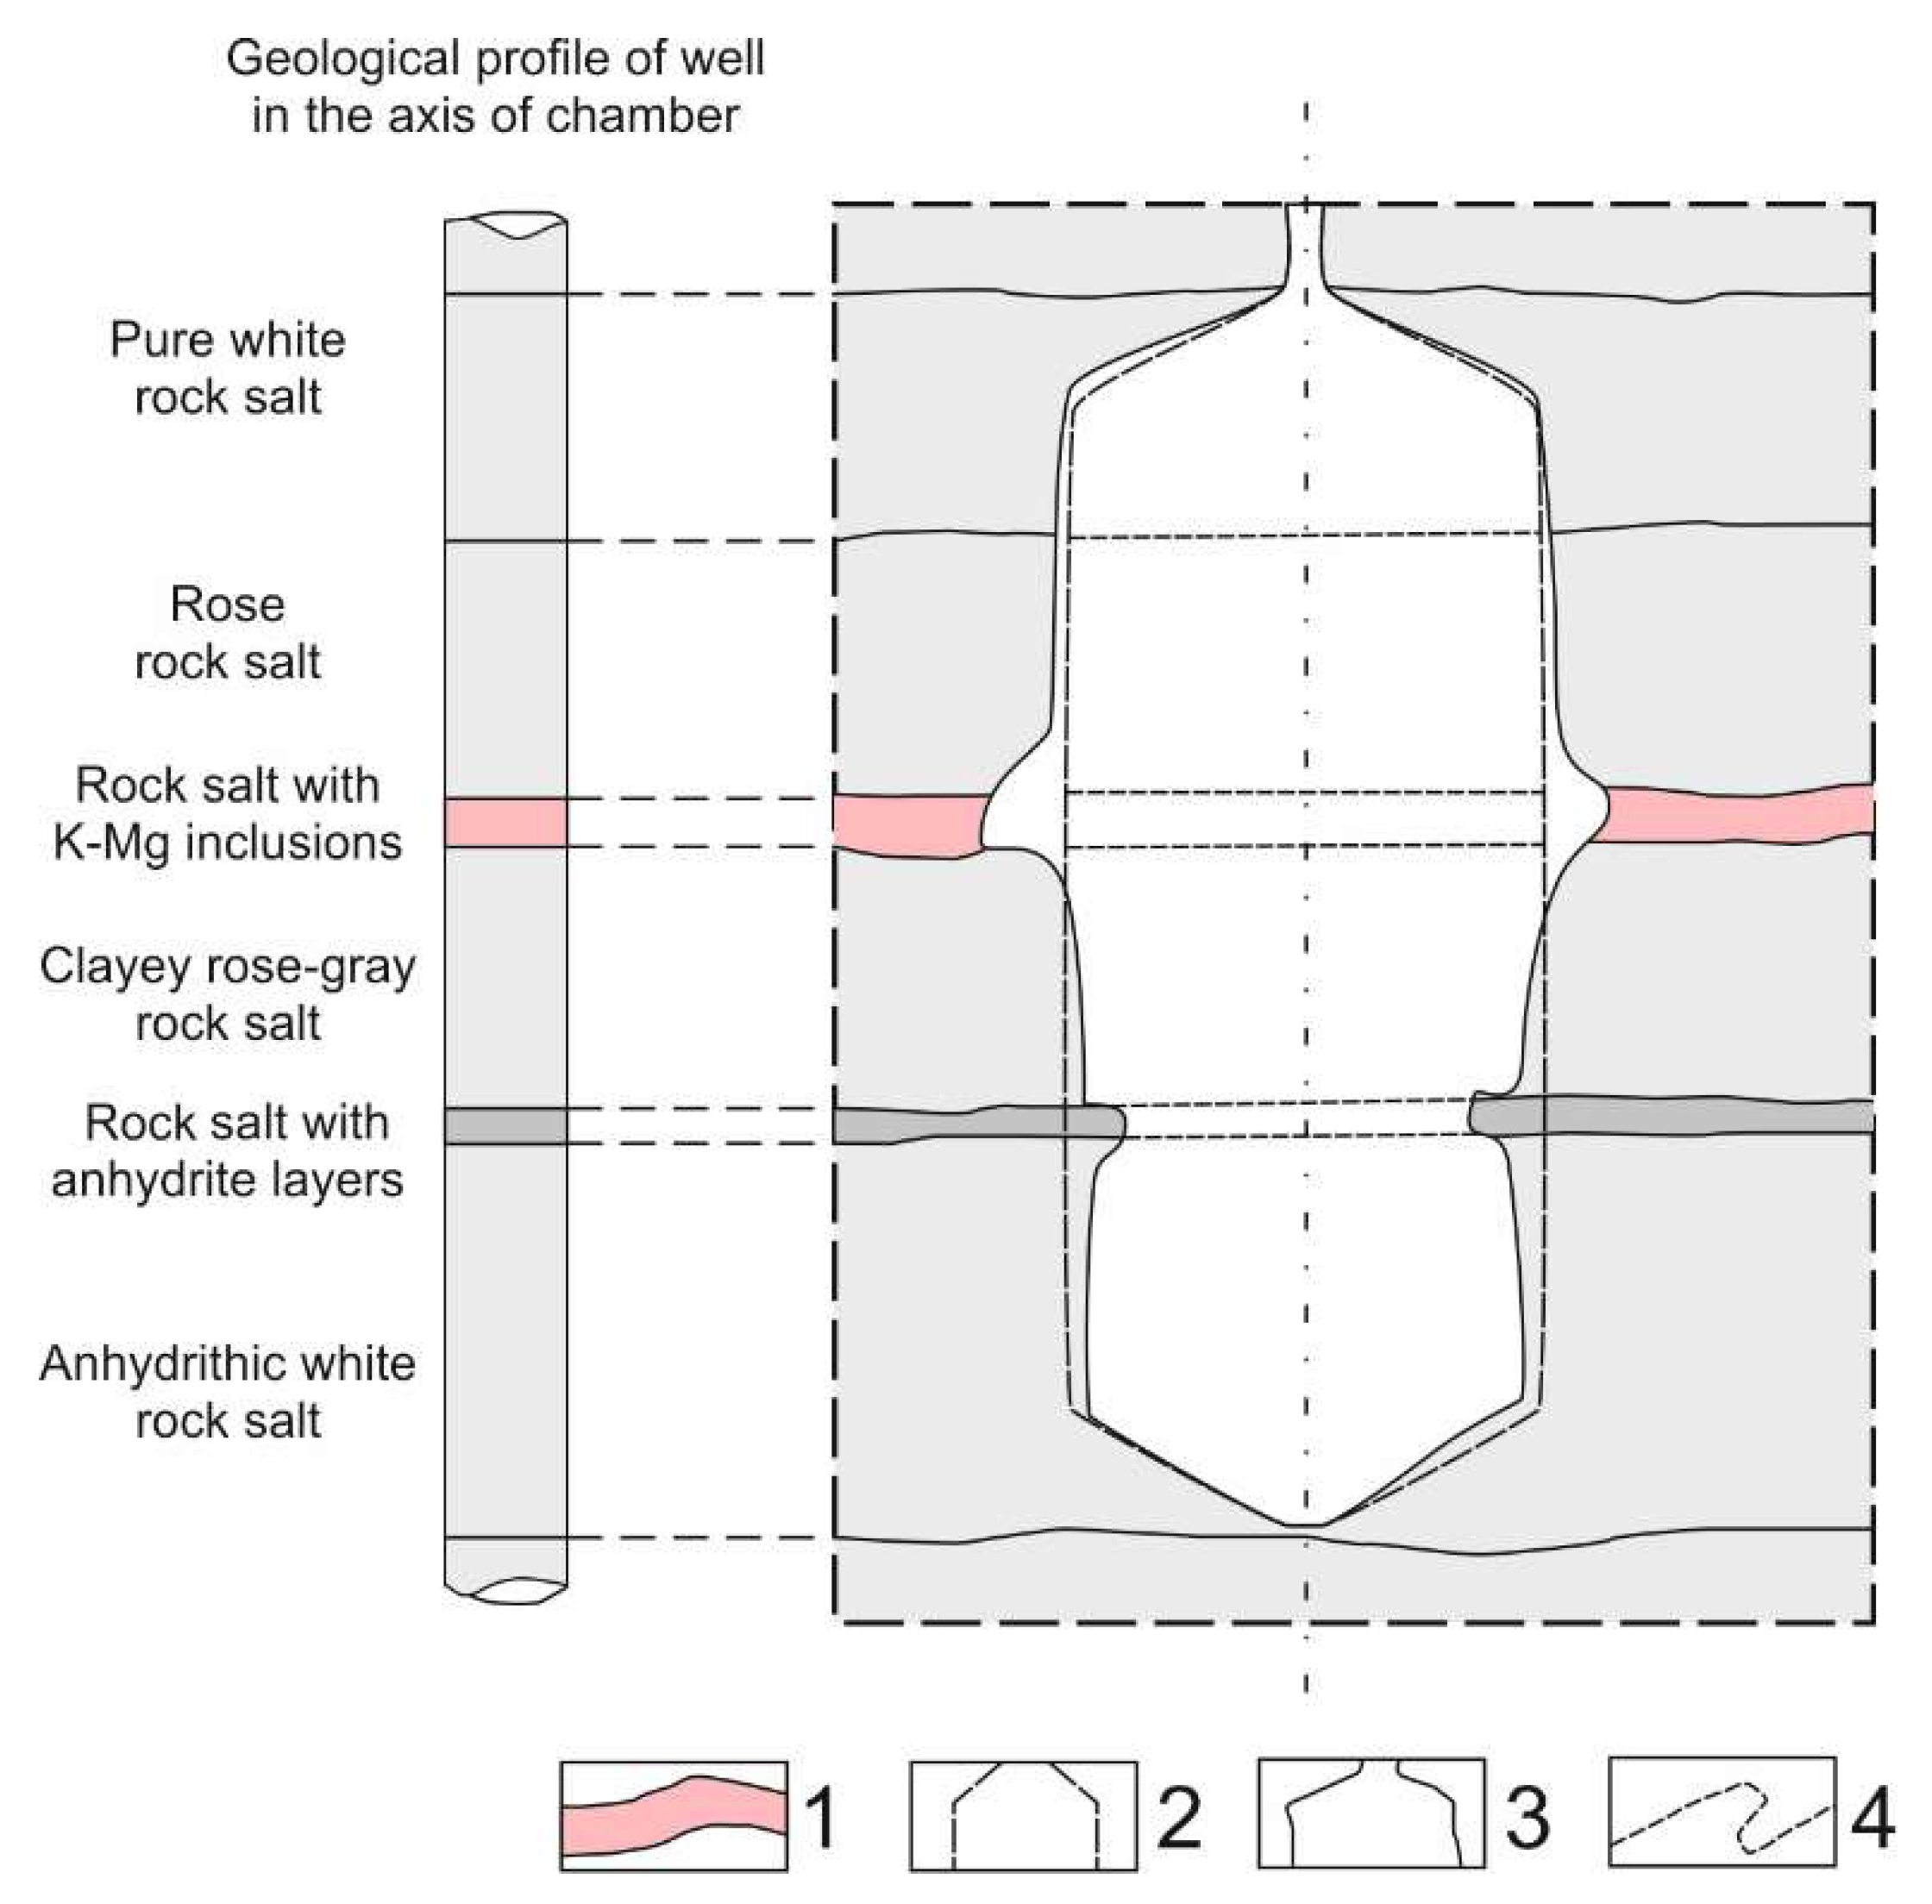
2.1. Geological Setting of Halite and Sylvite Samples
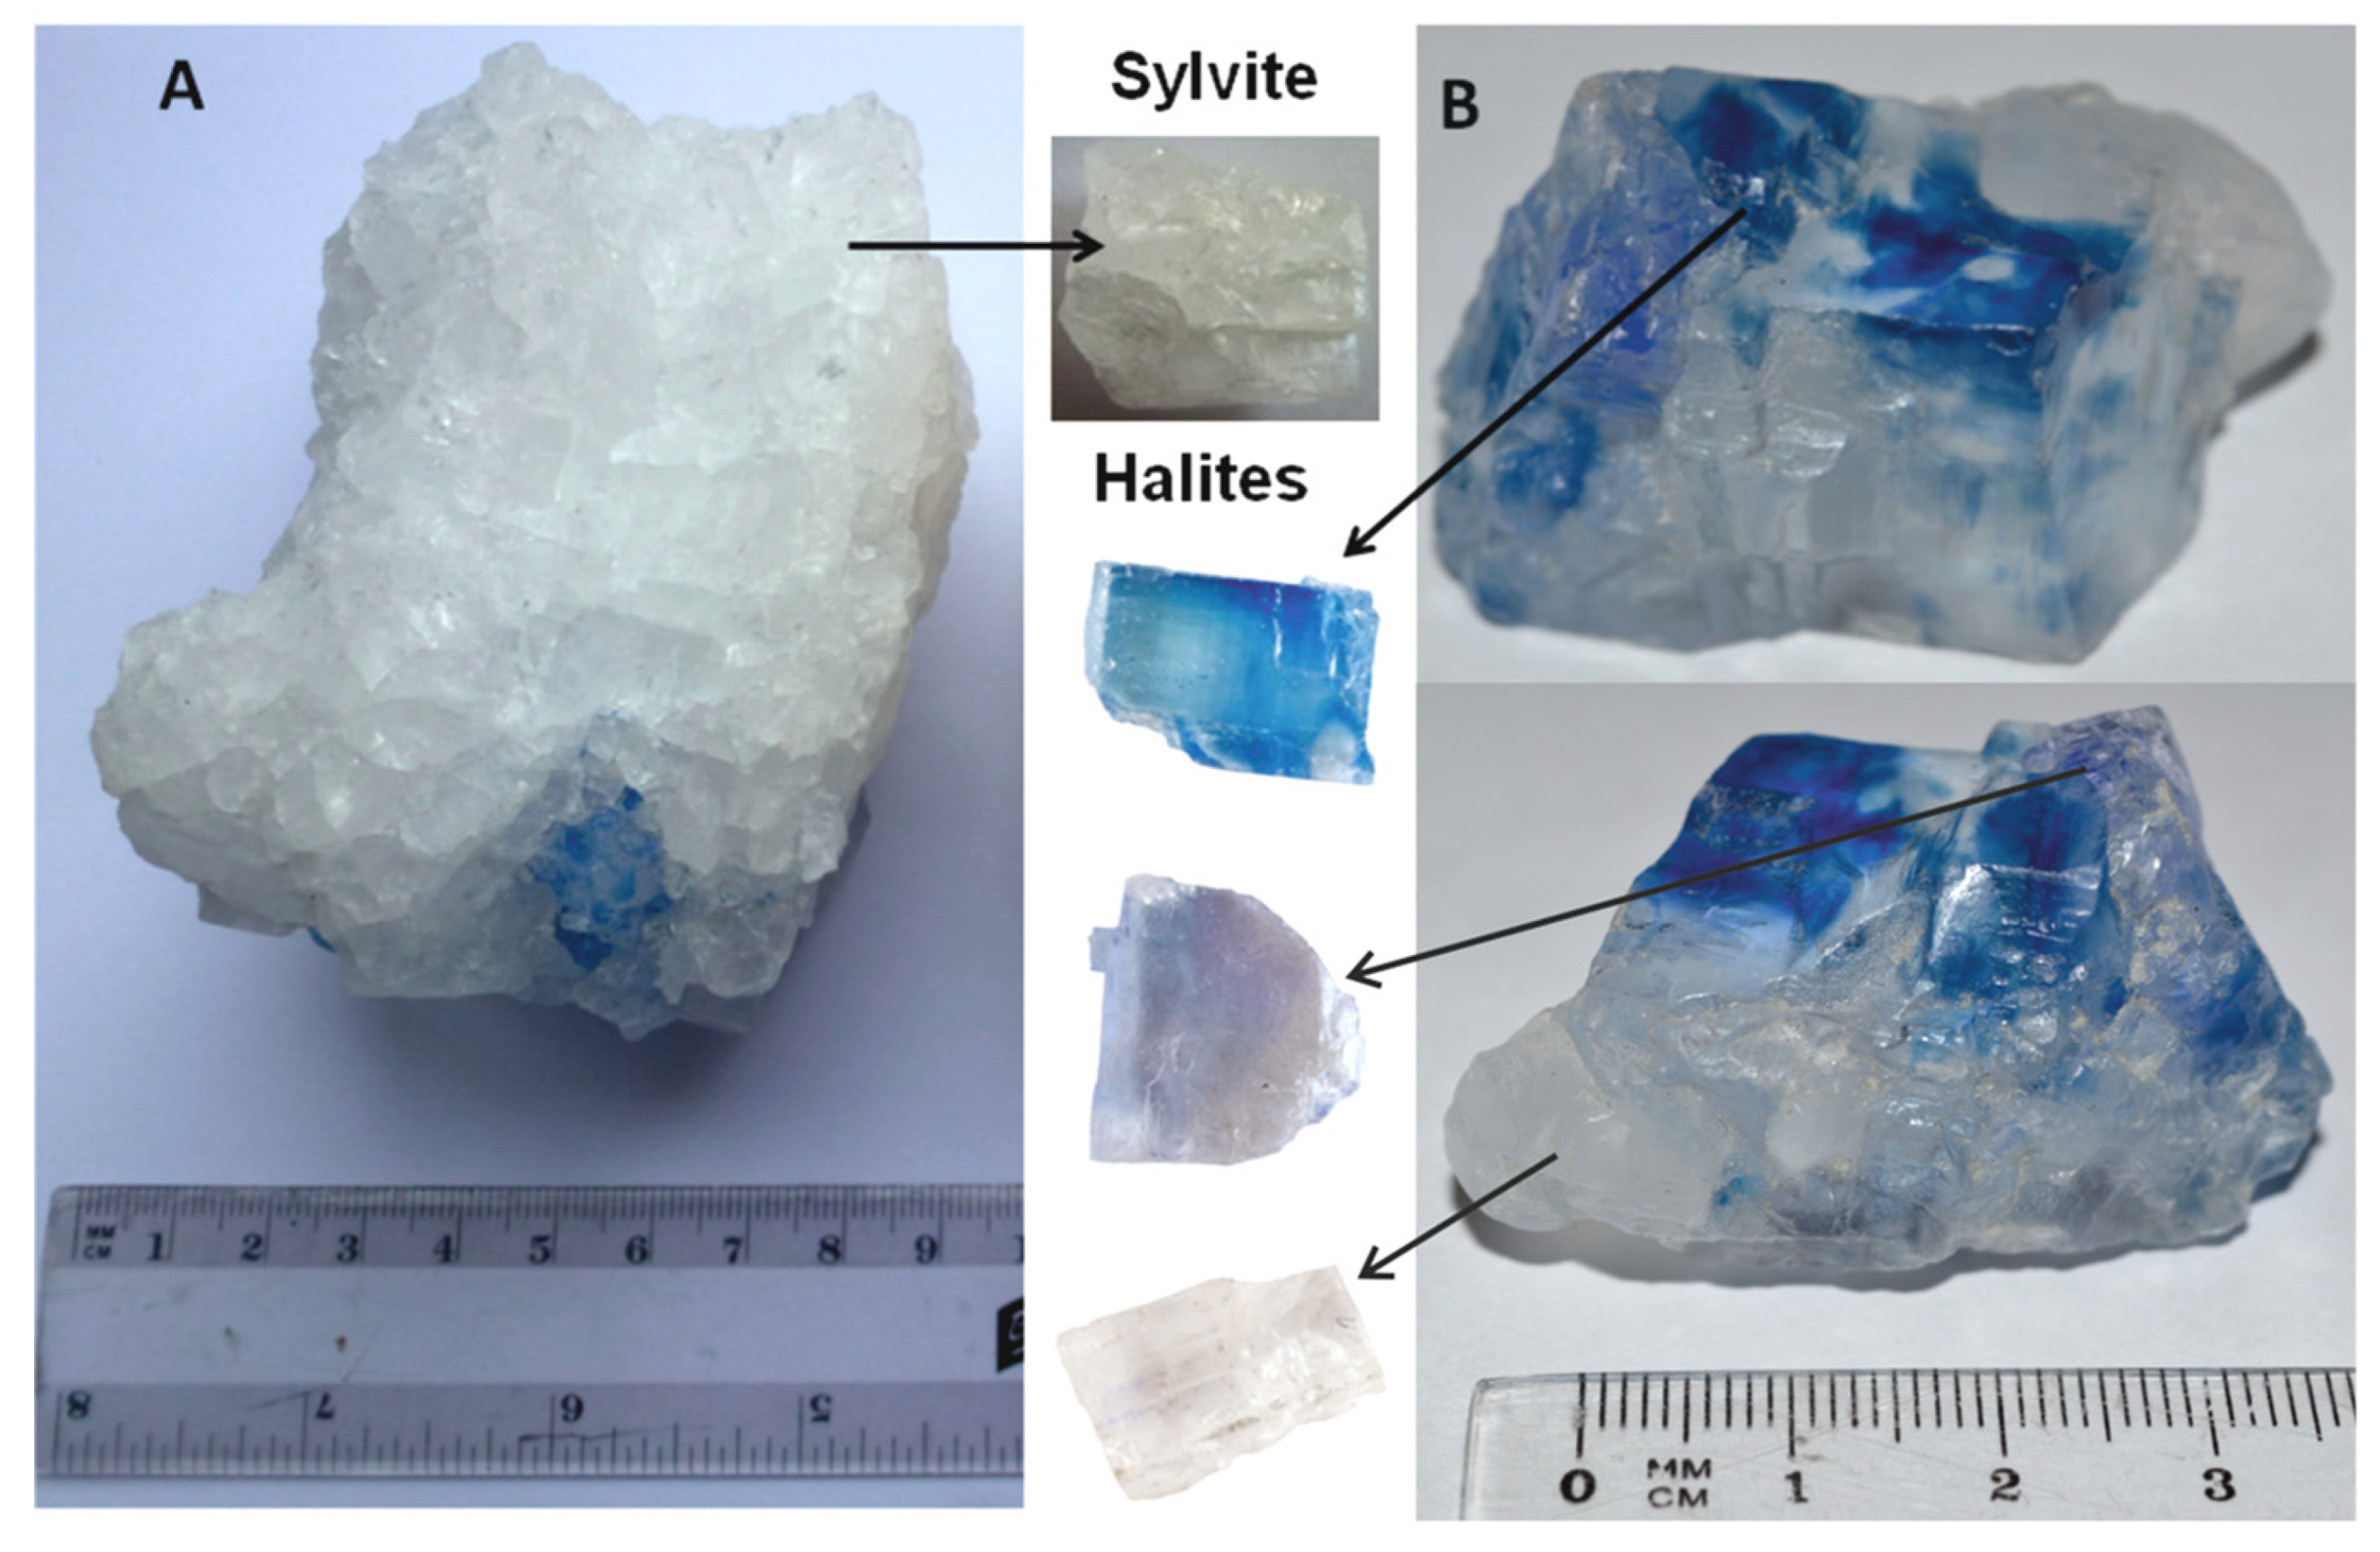
Salt domes are one of the structural elements of the Polish Zechstein Basin. This basin is an eastern part of the extensive Central European Basin. The axial zone of the Polish Basin has the NW-SE orientation [34,35,36]. The basin was created as a result of thermal subsidence impulses, which had created the continental basins of the Upper Rotliegendes [37].
For correlation within the Zechstein Basin, a lithostratigraphic division was made based on the cyclic sedimentation of evaporates, called cyclothems—from PZ1 (oldest) to PZ4 (youngest). Traditionally, the cyclothems have names: PZ1–Werra, PZ2–Stassfurt, PZ3–Leine, PZ4–Aller. The three oldest (PZ1, PZ2, PZ3) are made up of carbonate–evaporate sequences. The youngest are terrigenous–evaporitic. On the axis of the Zechstein Basin, about 1500 m of evaporates were deposited during a 5-to-7-million-year interval. Zechstein cyclothemic deposits are covered by sandy deposits of Lower Buntsandstein. The main structural features of the Zechstein Basin were formed at the beginning of the Upper Rotliegendes when subsidence began in the area of Upper Permian Basin [38].
Several tectonic units occur in the basement of Zechstein Basin. There are on the northeastern part–Precambrian Craton, and on the southwestern part–Palaeozoic-Caledonian and Variscan platforms. Salts used in this research originate from the specific zone, near the Teisseyre-Tornquist fractures (Kłodawa salt diapirs), where the thickness of the Zechstein formation reaches about 1500 m. Thus, this is Europe’s most complete Zechstein sequence.

2.2. Samples

The chemicals sodium chloride (NaCl) and potassium chloride (KCl) (analytical grade) were purchased from WarChem (Poland). Samples of minerals: halites (blue, purple and colorless) and sylvite came from the Kłodawa diapir (Poland). Photographs of the examples of examined minerals are presented in Figure 3. The blue- and purple-colored halite crystals occur in various forms of clusters of various sizes. Blue salts form zones or individual clusters ranging in size from several centimeters to several meters. They show a blue color with a varying degree of saturation from intense blue through light blue to white. Sometimes blue salts with varying degrees of saturation create irregular clusters that sharply stand out from the surrounding white salts. Light purple halite crystals are less common. This coloration is usually of a homogeneous character within a single crystal, in contrast to blue halites. The blue and purple salts are accompanied by colorless or white coarse crystalline salts, mainly composed of sylvite, accompanied by a small amount of halite [39].
The list of the study carried out on mineral samples in this work is presented in Table 1. Details of the research carried out are described in the individual subsections below.

2.3. Chemical Analysis of Halides

Four samples of halides were subjected to chemical analysis: halite (colorless, blue and purple) and sylvite. The samples were analyzed for Na+, K+, Li+, Ca2+, Mg2+, Ba2+, Sr2+, Fe2+, Mn2+, Zn2+, Al3+, SO42−, CO32- concentration using an Optima 7300 DV inductively coupled plasma optical emission spectrometer (ICP-OES) from PerkinElmer [40,41] in the Hydrogeochemical Laboratory of the Department of Hydrogeology and Engineering Geology at AGH University of Science and Technology. ICP-MS (iCAP RQ(C2), Thermo Scientific) was used for determination of Be2+, Ag+, Cu2+, Ni2+, Co2+, Pb2+, Hg2+, Cd2+, Se2+, Sb3+, Cr3+, Mo6+, V5+, Zr4+, Ti4+, As3+, Tl4+ and W6+ concentration [42,43,44,45]. The titration method was used for the determination of chlorides, according to the standards given in [46,47].

2.4. XRD Measurements

The preliminary characterization of natural samples was performed by X-ray powder diffraction. Natural samples differing in color were used for XRD analyses. The studied samples were separated under a binocular magnifier (Olympus SZX-9) in order to avoid mechanical impurities. The XRD patterns of phases were obtained with a Rigaku Smart Lab 9.0 kW diffractometer with Cu-Kα radiation. The XRD patterns were recorded in the range of 2–100°2θ with the step size 0.02°2θ, counting time at 1 s/step at a voltage of 45 kV and a current of 200 mA. The XRD patterns were evaluated by XRAYAN software (v. 4.2.2, KOMA Henryk Marciniak, Warszawa, Poland) [48] using a diffraction pattern database (Powder Diffraction File PDF-2) of the International Center for Diffraction Data (2018). Unit cell refinements were carried out using the EXPO2014 program (Institute of Crystallography-CNR, Bari, Italy) [49].

2.5. IR Spectra Measurements

The infrared absorption spectra measurements were taken at room temperature on a Bruker VERTEX 70v FT-IR spectrometer (Bruker, Ettlingen, Germany). Spectra were recorded in the spectral ranges of 600–30 cm−1, and 32 scans were averaged at a resolution of 2 cm−1. The sample of tested material was suspended in Apiezon grease and placed on a polyethylene window. The spectra were performed in triplicate and the same measurement result was obtained each time.

2.6. Calculations

Quantum-chemical calculations were carried out for the geometry optimization of model structures of the crystal lattice and simulation of infrared spectra of NaCl and KCl. Calculations were performed with the Gaussian’16 program packages [50]. The calculations were made at a temperature of 0 K (this is the default temperature for calculations using the Gaussian program (Gaussian Inc., Wallingford, CT, USA). The shape of the potential functions of the ionic crystals at the minima were studied at the DFT level with the B3LYP functional [51,52] and 6-31g*basis set. We employed the default convergence criteria of the Gaussian code. The crystallographic data were used to build the input geometries for models in the calculations. The calculations were made for the model containing 125 atoms. It is the smallest structure in which each of the 27 atoms of the conventional unit cell of NaCl (KCl) has a 6-fold coordination. The geometries of the model structures were fully optimized without any restriction and with the restriction for all angles 90°. Vibrational bands, IR frequency and intensity calculations were carried out within harmonic approximation as implemented in Gaussian’16 software [53]. No imaginary frequencies were obtained for any of the optimized model structures. The calculated harmonic frequencies were not scaled. Computed IR spectra were simulated by representing each band as a Lorentzian-shaped curve with half-bandwidths of 4 cm−1 to account for temperature broadening.

3. Results

3.1. Chemical Analysis of Halides

A chemical analysis of the solutions of studied minerals (for the content of Na+, K+, Li+, Ca2+, Mg2+, Ba2+, Sr2+, Fe2+, Mn2+, Zn2+, Al3+, Be2+, Ag+, Cu2+, Ni2+, Co2+, Pb2+, Hg2+, Cd2+, Se2+, Sb3+, Cr3+, Mo6+, V5+, Zr4+, Ti4+, As3+, Tl4+, W6+, SO42−, CO32− and Cl) was performed based on ICP-OES, ICP-MS and titration methods. Components whose content exceeded the quantification limit were shown in Table 2. The results of the chemical analysis indicate that the sylvite sample consists of pure KCl, while colorless, blue and purple halite samples consist of pure NaCl (Table 2). Probably, the sources of slight amounts of other elements are inclusions [13].

3.2. Crystallography Measurements of Selected Halite and Sylvite Samples from Kłodawa Salt Diapirs

Two natural halites from Kłodawa were identified by XRD: halites NaCl (colorless, blue and purple) and sylvite KCl (colorless). These minerals were identified by comparing peak positions of the experimental powder XRD patterns with the Inorganic Crystal Structure Database (ICSD), using the following PDF-2 cards: 05-0628 for halite and 41-1476 for sylvite. Figure S1 (Supplementary Materials) shows the diffraction patterns (over the angular range from 5 to 75°2ϴ) for investigated samples, which are pure halite and pure sylvite. The analysis did not yield any impurities within the detection limit of the method. Unit-cell parameters (in Å) refined with the Fm-3m space group symmetry are presented below: for a blue halite sample a = 5.6397(1) Å, for a purple halite sample a = 5.6375(1) Å, for a colorless halite sample a = 5.6375(1) Å, for a sylvite sample a = 6.2905(1) Å (Table 3).

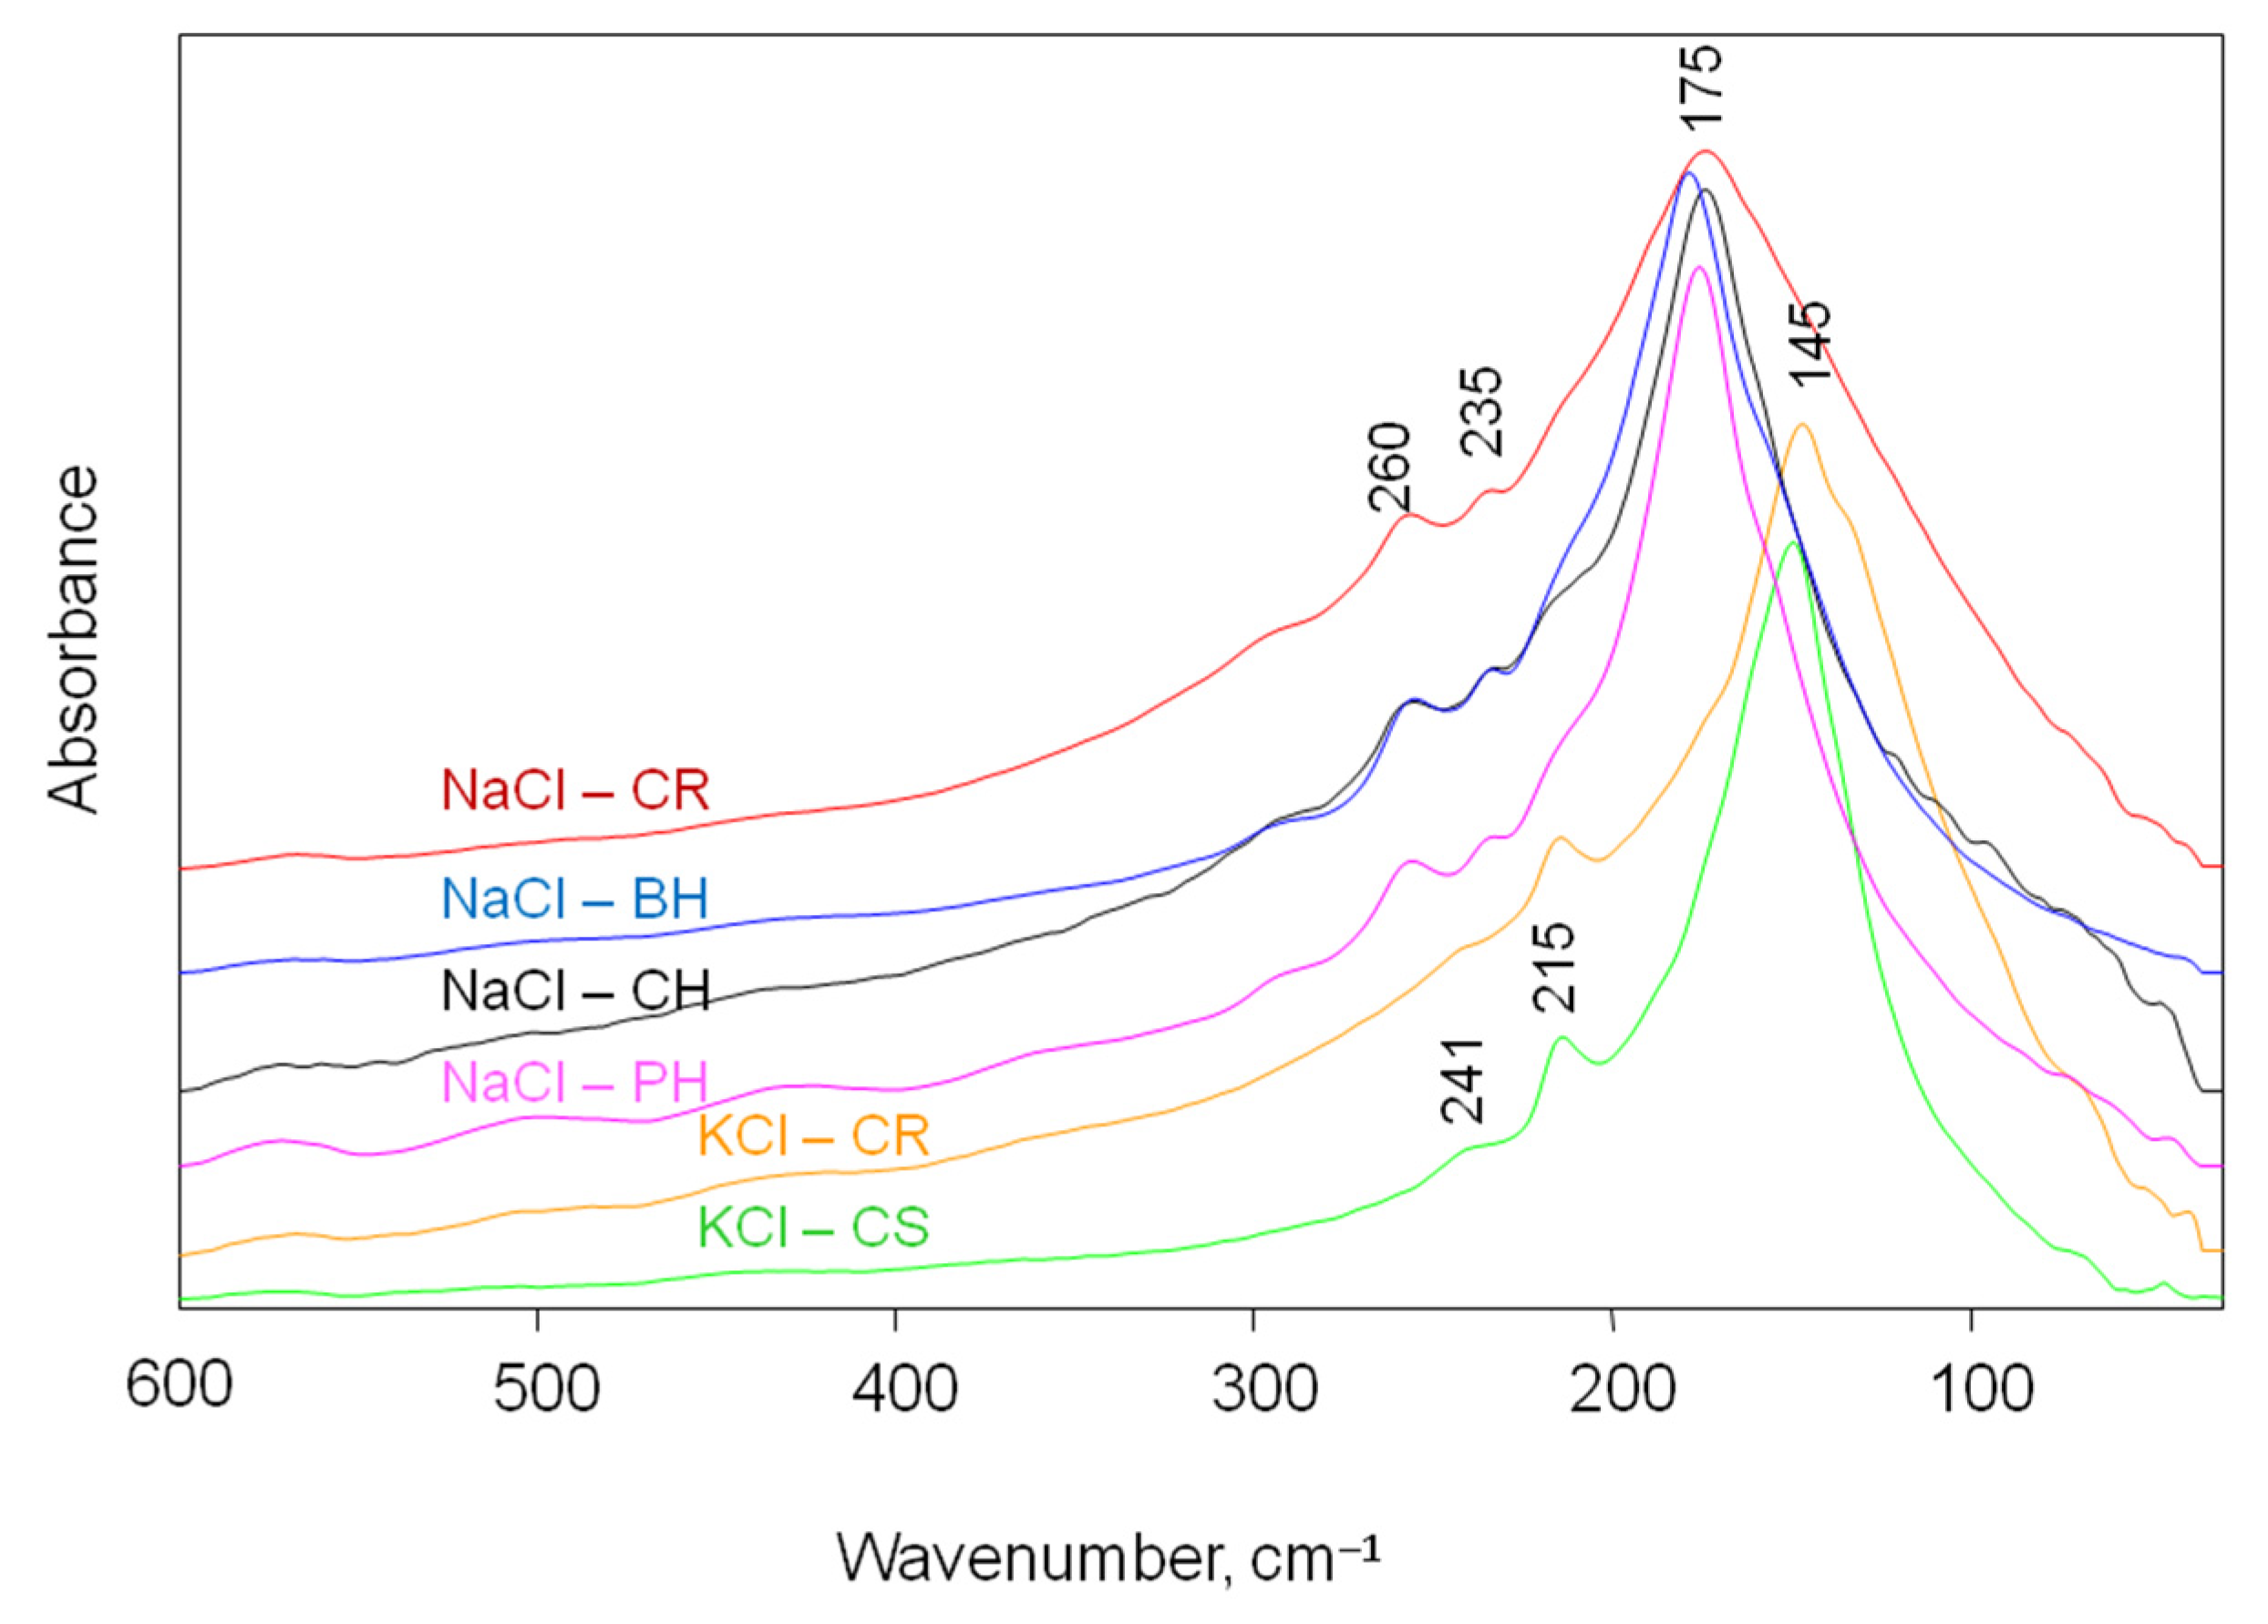
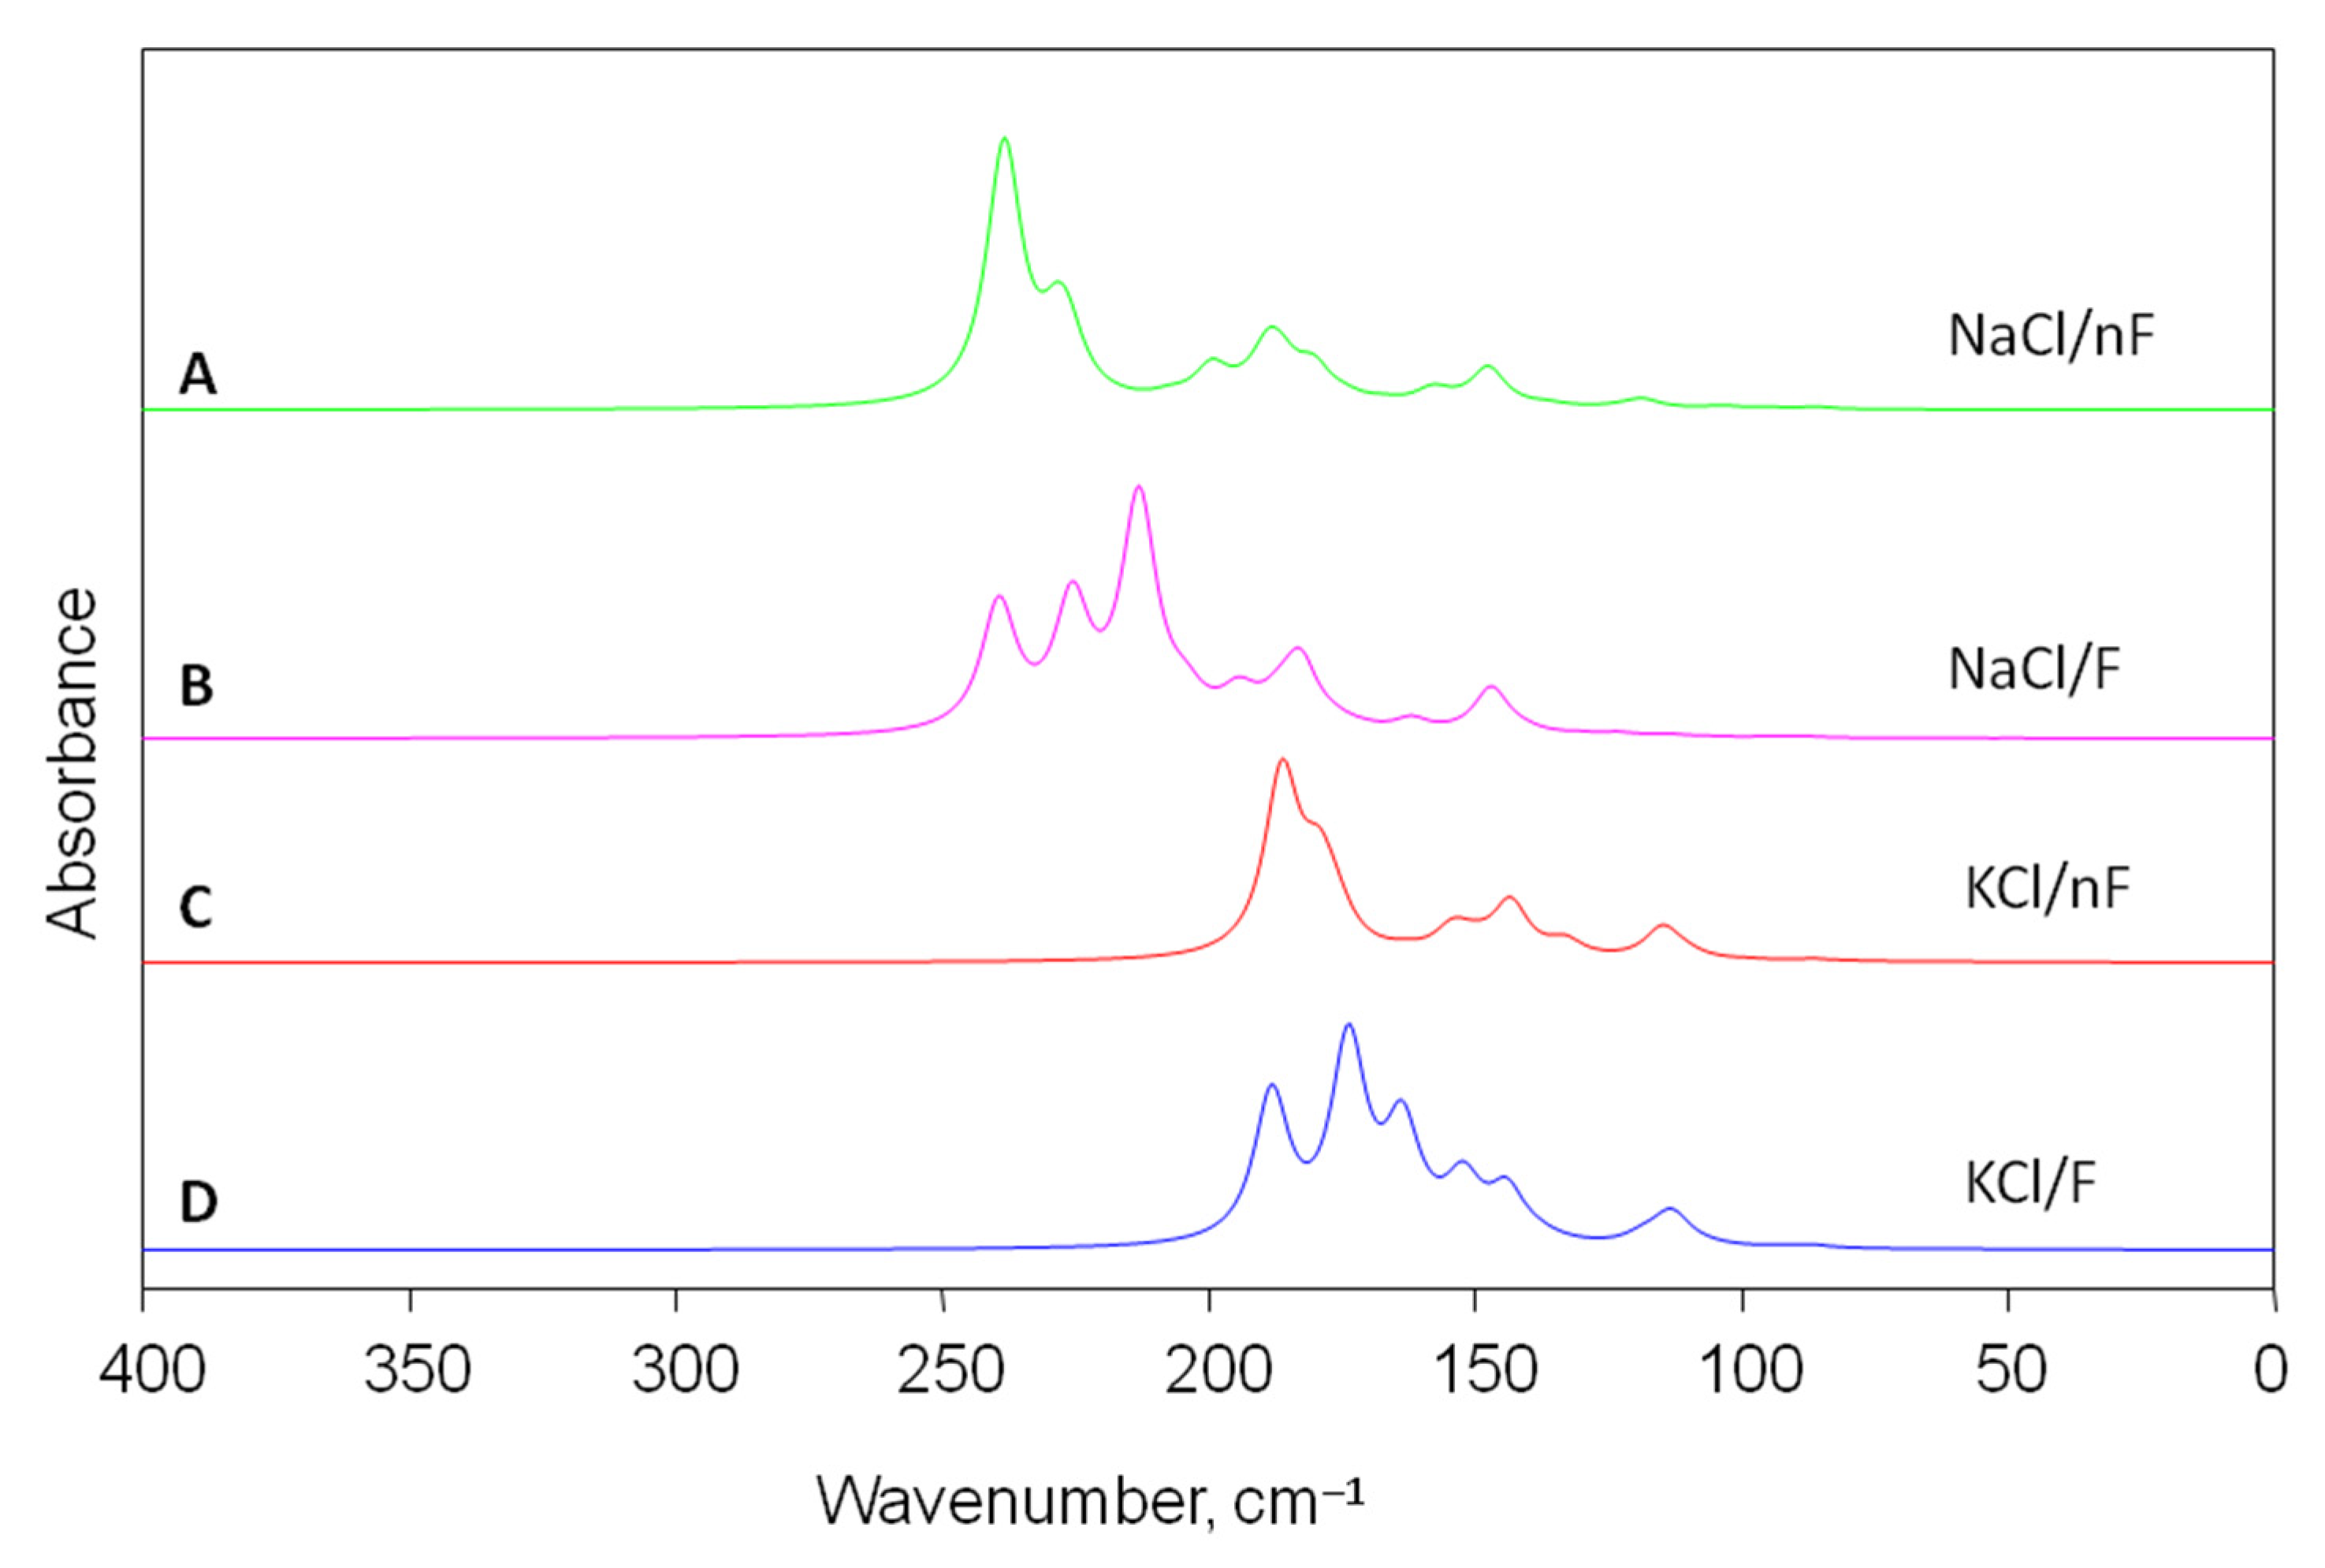
3.3. Experimental Spectra of Selected Halite and Sylvite Samples

The experimental far infrared spectra of halites (colorless, blue and purple) and colorless sylvite from the Kłodawa salt diapir (Poland), whose purity has been confirmed by chemical analysis and X-ray examinations (XRD), were presented in the range of 600–30 cm−1 in Figure 4. Additionally, the spectra of pure chemical reagents NaCl and KCl (WarChem, Poland) were shown in this spectral range (Figure 4).
Experimental vibrational spectra (IR, Raman) of NaCl, KCl and other halides have been known in the literature for several decades [54,55,56,57] and the results obtained by us are consistent with the literature data. As can be seen in Figure 4, the difference in frequency between major bands for NaCl and KCl is significant and amounts to ca. 30 cm−1. It is consistent with experimental data, which indicate that the greater the mass of the metal, the metal–halogen vibrations shift to lower frequencies [58]. Experimental spectra of NaCl show the maximum of absorption at ~175 cm−1 and the signals at about 235 and 260 cm−1. In the experimental spectra of KCl, the strongest band at ~150 cm−1 and the minor intensity bands at 215 and 241 cm−1 are observed. The center of the most intense band in the spectra of halites from Kłodawa and analytical pure NaCl is observed in the range from 179 to 173 cm−1. The position of the strongest band center in the spectra equal 178, 176 and 174 cm−1 for blue, purple and colorless halite. The location of this band in the spectrum of analytical pure NaCl is 175 cm−1. On the other hand, the most significant band in the spectrum of sylvite from Kłodawa and analytical pure KCl is able to be seen at 150 and 147 cm−1, respectively.
In summary, far infrared spectroscopy can certainly be helpful in studying and/or distinguishing naturally occurring halides (in particular KCl from NaCl). It should be emphasized that, to the best of our knowledge, this paper presents the far infrared spectra of blue and purple halite for the first time. The experiment indicates that the colored halites, blue (178 cm−1) and purple (176 cm−1), have the strongest infrared band slightly shifted towards higher wavenumbers compared to colorless halites (174 cm−1). Taking into account the resolution of the infrared spectra measurements (2 cm−1), it can be concluded that this method was able to distinguish blue from colorless halites. In order to confirm and generalize these observations, blue halite samples of other origins should be tested.

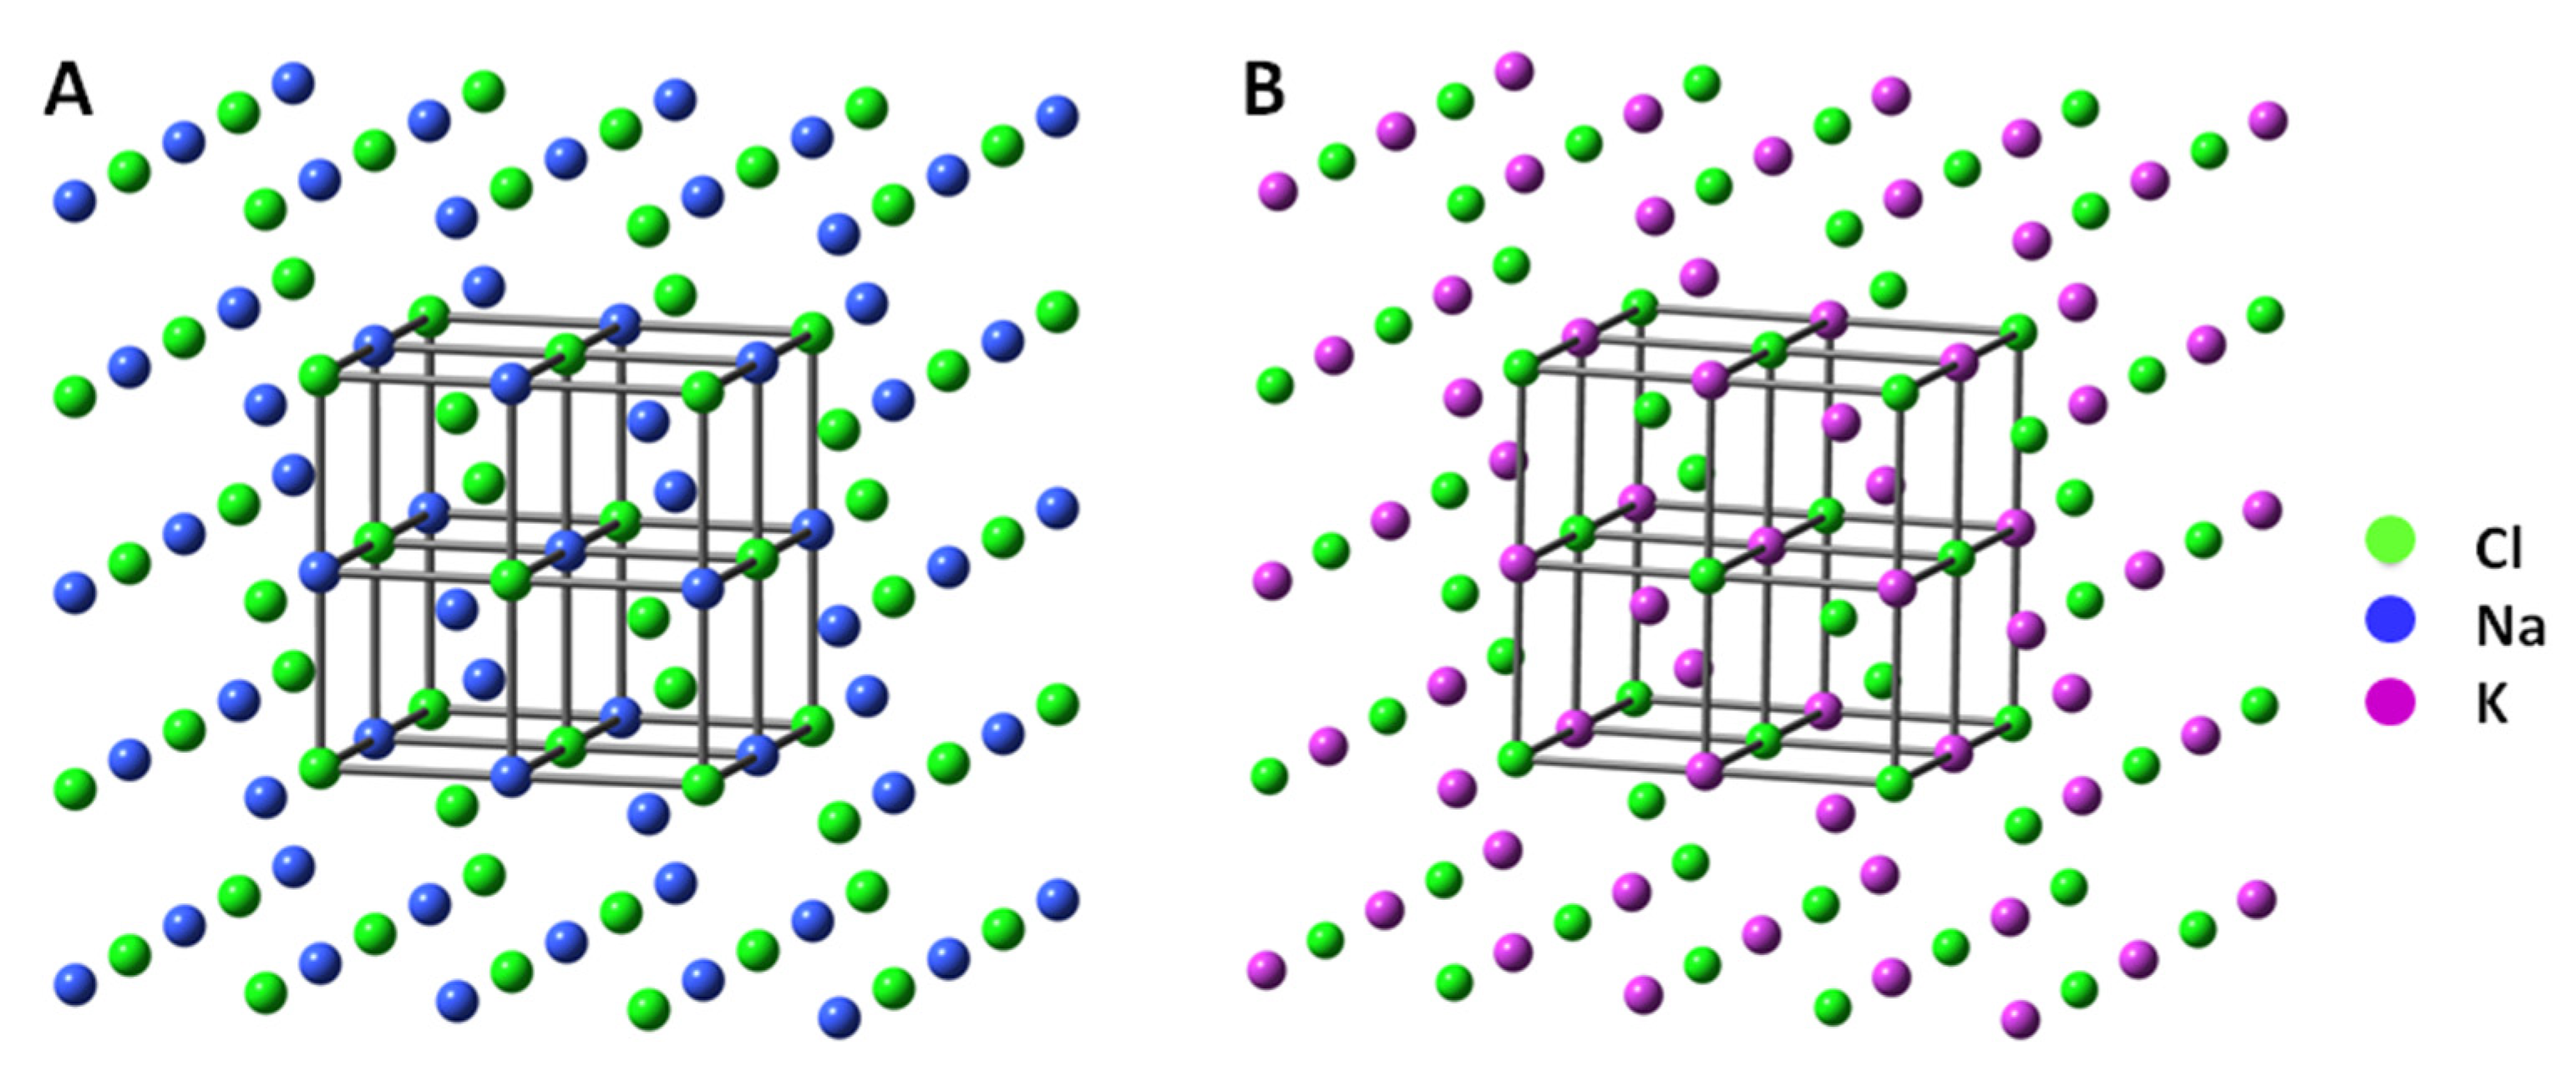
3.4. Calculated Infrared Spectra for Models of NaCl and KCl Crystals

The DFT calculations were previously used for NaCl studies, e.g., surface and lattice energy, geometry parameters or charge distribution in crystal [59,60]. However, to our knowledge, this is the first time that DFT calculations of the infrared spectra for the crystal structure model of KCl and NaCl are presented. The first step of quantum-chemical investigations was the lattice structure of crystal NaCl and KCl optimization. Calculations for structures containing 125 atoms were performed using B3LYP functional and 6-31g* basis set. The unit cell of a crystal is defined by the lengths of its three axes (a, b, c (x, y, z)) and the angles (α, β, and γ) between the axes. In the cubic unit cell, as is the case with both NaCl and KCl crystalline solids, a = b = c and α = β = γ = 90°. In the structure of minerals NaCl and KCl, the space group symmetry is Fm-3m (Oh point groups in the Schoenflies system). The initial model of the NaCl (KCl) unit cell taken for the calculations was a fragment of the crystal structure determined by our X-ray studies (the angles α = β = γ = 90°, and lattice parameter a = b = c = 5.64 Å for NaCl, and 6.29 for KCl). As a result of the optimization of the geometry of the models without any restrictions, the final structures still had Oh symmetry. However, the values of the angles between atoms varied within a large range (ca. 9° for KCl and 16° for NaCl, Table 4). Therefore, additional calculations were made for the same models, and the restriction was applied to all angles (90°) in the structure. In this calculation condition, the final structures also have Oh symmetry. The structures obtained without any restrictions were lower in energy compared to their counterparts in which the “freezing” of angles was used. For example, for the KCl model, the difference is 12.3 kcal/mol. The selected optimized structures are presented in Figure 5 and calculated geometrical parameters for NaCl and KCl unit cells are presented in Table 4.
The calculated (Table 4) metal–chlorine bond distance for the NaCl and KCl models are comparable with the experimental values. It indicates that the theory reflects the real electronic structure of the tested salts. Determined by us, the experimental bond distance equals 3.1453 Å for colorless sylvite and 2.8209, 2.8188 and 2.8199 Å for colorless, purple and blue halite, respectively (Table 3). For example, other literature data indicate that the bond length of K-Cl is 3.14 and Na-Cl is 2.81 Å [61].
Then, infrared spectra were simulated for previously optimized structures. According to the group theory, following a primitive cell (2 atoms), which we get after transformation from a conventional cell, we should expect 6 modes for NaCl (KCl). Three of these modes are acoustic vibration and three are lattice vibrations T1u. In fact, although the crystal has a regular structure and is theoretically at the gamma point (the center of the Brillouin zone), one triply degenerate vibration should be observed—this vibration is split. The LO-TO splitting in infrared appears for ionic chemical compounds and is associated with the appearance of an additional force acting on atoms vibrating longitudinally. The two transverse vibrations have a different energy (they are doubly degenerate) than the longitudinal one (not degenerate).
Calculations with the Gaussian program give more bands in the infrared spectrum than the results from theoretical considerations for an ideal NaCl (KCl) unit cell. According to calculations, 369 (3*125-6) internal vibrations with symmetry of A1g, A2g, Eg, T1g, T2g, A1u, A2u, Eu, T1u and T2u were predicted for the 125-atom model in the Oh point group. In infrared, only vibrations with symmetry T1u are active. Our calculations predict infrared spectra with 29 (triple degenerated) active T1u vibrations with different intensities (see Table S1). The frequencies of these vibrations appear at various wavenumbers and have different intensities for each of the 125-atom models because the structures differ in geometric parameters. Calculated infrared spectra for crystal structure models in the range of 400–0 cm−1 are presented in Figure 6. All calculations confirmed known experimental results and show that sodium and potassium chloride do not absorb infrared radiation in the broad spectral range. NaCl and KCl crystals are typical middle IR frequency materials for various applications. They are used for windows, lenses and prisms where transmission in the 0.25–16 µm and 0.3–20 µm range is desired. According to calculations (see Figure 6), IR absorption of NaCl and KCl appears only in the range from 243 to 34 cm−1 and from 190 to 24 cm−1, respectively.
The shift of the bands of the calculated spectrum towards higher frequencies in relation to the experimental spectrum can be explained by the limitations of the method, and the appropriate scaling factor proposed in the literature can be used [62]. When comparing the intensities of the bands on the calculated spectra, a discrepancy can be seen. As seen in Figure 6, only calculations for structures where all angles are 90 degrees reflect the experimental spectrum very well. The spectra obtained for 125 atomic models, without restrictions with the value of angles, despite the preserved Oh symmetry, differ significantly from the experimental spectra. Our calculations for models smaller than 125 atoms also did not provide good agreement between the calculated spectrum and the experimental one.
In summary, the DFT calculations show a clear difference in the IR spectra obtained for the crystal lattice models of pure NaCl and KCl salts. Calculations for 125-atom models with the restriction of geometry (all angles 90°) provide infrared spectra, which are in good agreement with the IR experimental spectra. DFT calculations are extremely versatile and can certainly be helpful in studying naturally occurring mineral crystals, most of which are not perfect crystals. Computations enable the simulation of any deformation of the crystal lattice caused by internal crystal disturbances, both with and without a change in the elemental composition. Calculations are possible for various temperature and pressure conditions. DFT calculations can also be made for different kinds of isotopes. Simulations taking into account the type of isotope of a given element in the crystalline lattice may be interesting because the presence of blue and purple forms of halite in Kłodawa is accompanied by the presence of a sylvite veins [63] with a high content of K-40 [13,64].

4. Conclusions

In this work, chloride minerals of natural origin, i.e., colorless, blue and purple halite as well as colorless sylvite, were studied. Samples of salts used in this research originate from the Kłodawa region, where the thickness of Zechstein formation can reach about 1500 m. Halite (NaCl) and sylvite (KCl) are the basic salt rocks and the identification and distinction between these minerals is important for the salt cavern leaching process.
Chemical analysis of the studied samples of chloride minerals (for the content of Na+, K+, Li+, Ca2+, Mg2+, Ba2+, Sr2+, Fe2+, Mn2+, Zn2+, Al3+, Be2+, Ag+, Cu2+, Ni2+, Co2+, Pb2+, Hg2+, Cd2+, Se2+, Sb3+, Cr3+, Mo6+, V5+, Zr4+, Ti4+, As3+, Tl4+, W6+, SO42-, CO32− and Cl) was performed based on ICP-OES, ICP-MS and titration methods. The investigated mineral samples were pure and contained slight impurities of Mg, Zn, Cu, Br and Na, K (Table 2). Crystallographic tests were carried out for the investigated samples of minerals, including both qualitative analysis and determination of the parameters of unit cells (Table 3).
Spectroscopic measurements confirmed previously known studies that the far infrared spectroscopy can be helpful in studying and/or distinguishing naturally occurring halides (in particular KCl and NaCl). In this paper, the far infrared spectra of blue and purple halite are presented for the first time. Analysis of the infrared spectra for halites (blue, purple and colorless) showed that that their spectra are almost identical. However, the strongest infrared band ca. 175 cm−1 slightly changes its position (blue—178 cm−1, purple—176 cm−1, colorless—174 cm−1).
In this work for the first time, DFT calculations (the B3LYP functional and the 6-31G* basis set) of the infrared spectra for the crystal structure model of KCl and NaCl were presented (Figure 6). The calculated far infrared spectra of the NaCl and KCl ionic crystals models were compared with the spectra measured experimentally for pure chemical reagents (NaCl and KCl) and for naturally occurring minerals (colorless sylvite as well as colorless, blue, and purple halites) from Kłodawa. The calculated infrared spectra indicate that pure crystals of these salts absorb infrared radiation in the range of 243 to 34 cm−1 (NaCl) and of 190 to 24 cm−1 (KCl), which leaves most of the spectral region transparent (Figure 6). This result is fully consistent with the experimental data. Calculations for the 125 atomic models with the assumption that all angles are 90 degrees lead to theoretical spectra that well reflect the experimental spectra also in terms of band intensity.
The proposed theoretical studies (structure calculations/spectral properties) are very multilateral and may be useful in predicting the spectra of other minerals (including chloride ones). Thanks to the increased computational power of computers in recent times, it is possible to calculate more complex electronic structures that were previously unattainable. It can be a helpful tool in solving many scientific and industrial problems. Our plans for further research concern the theoretical study of the solubility of salt minerals in various solvents, which could result in proposing a new composition of the salt leaching liquid.
Research on the properties of rock salt, e.g., in the context of the construction of salt caverns for the storage of various chemicals, is still relevant. Infrared spectroscopy enables a quick and qualitative identification/discrimination of the basic components of the salt rock. The identification of these ingredients can be used in a wide range of applications not only in the context of the solubility of individual minerals, but also the mechanical properties of rock salt which are also very important. The mechanical properties of the rock salt depend not only on its individual mineral composition but also depend on the crystal structure of each mineral, content and distribution of impurities or fluid inclusion [65,66,67,68].

Supplementary Materials

The following supporting information can be downloaded at: https://www.mdpi.com/article/10.3390/min12121561/s1, Figure S1: Experimental X-ray diffraction pattern of minerals: colorless sylvite (A), colorless halite (B), purple halite (C) and blue halite (D). Table S1: Calculated IR Fequency and Intensity of T1u vibrational modes for 125-atom NaCl and KCl models (B3LYP/6-31g*).

Author Contributions

Conceptualization, K.C.-L.; methodology, K.C.-L., S.Z.-P., U.S., E.S.; software, K.C.-L., S.Z.-P., U.S., E.S., K.K.Z.; validation, K.C.-L., S.Z.-P., U.S., E.S., K.K.Z.; formal analysis; K.C.-L.; K.K.Z.; investigation, K.C.-L., S.Z.-P., U.S., E.S.; resources, K.C.-L., K.K.Z.; data curation, K.C.-L.; writing—original draft preparation, K.C.-L., U.S., M.L.S.; writing—review and editing, K.C.-L., U.S., E.S., M.L.S., M.Z.; visualization, K.C.-L., S.Z.-P., U.S., M.L.S., M.Z.; supervision, K.C.-L. All authors have read and agreed to the published version of the manuscript.

Funding

This research was funded by AGH University of Science and Technology in Krakow, The Faculty of Drilling, Oil and Gas (No. 16.16.190.779).

Data Availability Statement

Not applicable.

Acknowledgments

The authors would like to thank Adam Gaweł for his strong commitment to XRD measurements, Grzegorz Rzepa for the possibility of using computer software for the identification of minerals and Tomasz Toboła for giving a sample for research. The paper was written within statutory research at the Faculty of Drilling, Oil and Gas at AGH University of Science and Technology in Krakow, Poland No. 16.16.190.779. Academic Computer Centre Cyfronet AGH (Krakow, Poland) is acknowledged for computing time. This research was supported in part by PL-Grid Infrastructure.

Conflicts of Interest

The authors declare no conflict of interest. The funders had no role in the design of the study; in the collection, analyses, or interpretation of data; in the writing of the manuscript, or in the decision to publish the results.

References

  1. Zeljaś, D. Magazyny gazu ziemnego w cechsztynskich formacjach solnych elementem bezpieczenstwa energetycznego Polski. Przegląd Geol. 2020, 68, 824–832. [Google Scholar]
  2. Cornot-Gandolphe, S. Underground Gas Storage in the World—2018 Status. Cedigaz Insights 2018, 31, 1–17. [Google Scholar]
  3. Czapowski, G.; Tomassi-Morawiec, H. Stan rozpoznania geologicznego struktur solnych regionu szczecińskiego pod katem oceny mozliwości budowy w ich obrebie kawernowych magazynów i składowisk. Biul. Panstw. Inst. Geol. 2012, 448, 145–156. [Google Scholar]
  4. Krzywiec, P. Geometria i ewolucja wybranych struktur solnych z obszaru niżu polskiego w świetle danych sejsmicznych. Przegląd Geol. 2009, 57, 812–818. [Google Scholar]
  5. Kunstman, A.; Poborska-Młynarska, K.; Urbańczyk, K. Zarys Otworowego Ługownictwa Solnego: Aktualne Kierunki Rozwoju; AGH [Akademia Górniczo-Hutnicza]; Uczelniane Wydawnictwa Naukowo-Dydaktyczne: Kraków, Poland, 2002; ISBN 8388408488. [Google Scholar]
  6. Pierce, W.G.; Rich, E.I. Summary of Rock Salt Deposits in the United States as Possible Storage Sites for Radioactive Waste Materials; US Government Printing Office: Washington, DC, USA,, 1962; Volume 1148.
  7. Pinho, S.P.; Macedo, E.A. Solubility of NaCl, NaBr, and KCl in water, methanol, ethanol, and their mixed solvents. J. Chem. Eng. Data 2005, 50, 29–32. [Google Scholar] [CrossRef]
  8. Aquilano, D.; Otálora, F.; Pastero, L.; García-Ruiz, J.M. Three study cases of growth morphology in minerals: Halite, calcite and gypsum. Prog. Cryst. Growth Charact. Mater. 2016, 62, 227–251. [Google Scholar] [CrossRef] [Green Version]
  9. Okrusch, M.; Frimmel, H.E. Halides. In Mineralogy; Springer: Berlin/Heidelberg, Germany, 2020; pp. 105–109. [Google Scholar]
  10. Mahadik, P.; Pathak, N.; Sengupta, P. Spectroscopic studies on blue halite. J. Lumin. 2018, 194, 327–333. [Google Scholar] [CrossRef]
  11. Sonnenfeld, P. The color of rock salt-A review. Sediment. Geol. 1995, 94, 267–276. [Google Scholar] [CrossRef]
  12. Stoiber, R.E.; Morse, S.A. Isotropic Crystal Identification. In Crystal Identification with the Polarizing Microscope; Springer: Berlin/Heidelberg, Germany, 1994; pp. 76–86. [Google Scholar]
  13. Zelek, S.M.; Stadnicka, K.M.; Toboła, T.; Natkaniec-Nowak, L. Lattice deformation of blue halite from Zechstein evaporite basin: Kłodawa Salt Mine, Central Poland. Mineral. Petrol. 2014, 108, 619–631. [Google Scholar] [CrossRef] [Green Version]
  14. Mees, F.; Tursina, T.V. Salt minerals in saline soils and salt crusts. In Interpretation of Micromorphological Features of Soils and Regoliths; Elsevier: Amsterdam, The Netherlands, 2018; Chapter 11; pp. 289–321. [Google Scholar]
  15. Yalçin, Ş.; Mutlu, I.H. Structural characterization of some table salt samples by XRD, ICP, FTIR and XRF techniques. Acta Phys. Pol. A Gen. Phys. 2012, 121, 50. [Google Scholar] [CrossRef]
  16. Rattanakawin, C.; Lakantha, W.; Kajai, I. Flotation of sylvinite from Thakhek, Lao, PDR. Songklanakarin J. Sci. Technol. 2019, 41, 545–550. [Google Scholar]
  17. Henry, C.H. Analysis of Raman scattering by F centers. Phys. Rev. 1966, 152, 699. [Google Scholar] [CrossRef]
  18. Frezzotti, M.L.; Tecce, F.; Casagli, A. Raman spectroscopy for fluid inclusion analysis. J. Geochem. Explor. 2012, 112, 1–20. [Google Scholar]
  19. Krishnamurthy, N.; Krishnan, R.S. Raman spectra of alkali halides. Z. Phys. 1965, 183, 130–139. [Google Scholar] [CrossRef]
  20. Ghomi, M.; Rzepka, E.; Taurel, L. Study of initial stages of F-centre aggregation in NaCl by Raman scattering. Phys. Status Solidi 1979, 92, 447–453. [Google Scholar] [CrossRef]
  21. Rzepka, E.; Lefrant, S.; Taurel, L. First-order Raman spectra of NaCl containing sodium colloids. Solid State Commun. 1979, 30, 795–796. [Google Scholar] [CrossRef]
  22. Wesełucha-Birczyńska, A.; Toboła, T.; Natkaniec-Nowak, L. Raman microscopy of inclusions in blue halites. Vib. Spectrosc. 2008, 48, 302–307. [Google Scholar] [CrossRef]
  23. Osterrothová, K.; Jehlička, J. Investigation of biomolecules trapped in fluid inclusions inside halite crystals by Raman spectroscopy. Spectrochim. Acta Part A Mol. Biomol. Spectrosc. 2011, 83, 288–296. [Google Scholar] [CrossRef]
  24. Wesełucha-Birczyńska, A.; Zelek, S.; Stadnicka, K. Blue halite colour centre aggregates studied by micro-Raman spectroscopy and X-ray diffraction. Vib. Spectrosc. 2012, 60, 124–128. [Google Scholar] [CrossRef]
  25. Zelek, S.M.; Wesełucha-Birczyńska, A.; Szklarzewicz, J.; Stadnicka, K.M. Spectroscopic properties of halite from Kłodawa salt mine, central Poland. Mineral. Petrol. 2015, 109, 45–51. [Google Scholar] [CrossRef] [Green Version]
  26. Toboła, T. Raman spectroscopy of organic, solid and fluid inclusions in the Oldest Halite of LGOM area (SW Poland). Spectrochim. Acta Part A Mol. Biomol. Spectrosc. 2018, 189, 381–392. [Google Scholar] [CrossRef] [PubMed]
  27. Toboła, T.; Natkaniec-Nowak, L. SEM-EDS investigation of solid state inclusion. In Blue Halite of the Kłodawa Salt; AGH University of Science and Technology Press: Kraków, Poland, 2008; pp. 70–80. [Google Scholar]
  28. Pironon, J.; Barres, O. Semi-quantitative FT-IR microanalysis limits: Evidence from synthetic hydrocarbon fluid inclusions in sylvite. Geochim. Cosmochim. Acta 1990, 54, 509–518. [Google Scholar] [CrossRef]
  29. Mougenot, B.; Pouget, M.; Epema, G.F. Remote sensing of salt affected soils. Remote Sens. Rev. 1993, 7, 241–259. [Google Scholar] [CrossRef]
  30. Howari, F. Spectroscopy of evaporites. Per. Miner. 2002, 71, 191–200. [Google Scholar]
  31. Hunt, G.R. Spectroscopic properties of rocks and minerals. In Handbook of Physical Properties of Rocks; CRC Press: Boca Raton, FL, USA, 2017; Volume 1, p. 295. [Google Scholar]
  32. Peters, R.D. Using Spectral Measurements to Differentiate between Aqueous NaCl and Aqueous KCl in Dual-Salt Solutions; University of Saskatchewan: Saskatoon, SK, Canada, 2016. [Google Scholar]
  33. Peters, R.D.; Noble, S.D. Using near infrared measurements to evaluate NaCl and KCl in water. J. Near Infrared Spectrosc. 2019, 27, 147–155. [Google Scholar] [CrossRef]
  34. Dadlez, R.; Narkiewicz, M.; Stephenson, R.A.; Visser, M.T.M.; van Wees, J.D. Tectonic evolution of the Mid-Polish Trough: Modelling implications and significance for central European geology. Tectonophysics 1995, 252, 179–195. [Google Scholar] [CrossRef]
  35. Krzywiec, P. Structural inversion of the Pomeranian and Kuiavian segments of the Mid-Polish Trough--lateral variations in timing and structural style. Geol. Q. 2006, 50, 151–168. [Google Scholar]
  36. Wachowiak, J.; Pawlikowski, M.; Wilkosz, P. Lithostratigraphy of Zechstein evaporites of the central and north-western parts of the Mogilno Salt Diapir, based on boreholes Z-9 and Z-17. Geol. Geophys. Environ. 2012, 38, 115–151. [Google Scholar] [CrossRef]
  37. Wagner, R. Stratigraphy and evolution of the Zechstein Basin in the Polish Lowland. Pr. Państwowego Inst. Geol. 1994, 156, 3–71. [Google Scholar]
  38. Wagner, R.; Peryt, T.M. Possibility of sequence stratigraphic subdivision of the Zechstein in the Polish Basin. Geol. Q. 1997, 41, 457–474. [Google Scholar]
  39. Natkaniec-Nowak, L.; Toboła, T. Występowanie soli niebieskich w Kłodawie. Przegląd Geol. 2003, 51, 435–438. [Google Scholar]
  40. Rusiniak, P.; Ruszczyńska, A.; Wątor, K.; Bulska, E.; Kmiecik, E. Methodological aspects concerning sampling and determination of total selenium and selenium species in geothermal waters. Bull. Geogr. Phys. Geogr. Ser. 2020, 18, 5–16. [Google Scholar] [CrossRef]
  41. ISO 11885:2007; Water Quality—Determination of Selected Elements by Inductively Coupled Plasma Optical Emission Spectrometry (ICP-OES). International Organization for Standarization: Geneva, Switzerland, 2007.
  42. Wątor, K.; Kmiecik, E.; Tomaszewska, B. Assessing medicinal qualities of groundwater from the Busko-Zdrój area (Poland) using the probabilistic method. Environ. Earth Sci. 2016, 75, 804. [Google Scholar] [CrossRef] [Green Version]
  43. Wątor, K.; Kmiecik, E.; Postawa, A.; Rusiniak, P. A probabilistic approach to assesment of the quality of drinking water. Geologos 2019, 25, 249–254. [Google Scholar] [CrossRef] [Green Version]
  44. Rusiniak, P.; Wątor, K.; Kmiecik, E. Inorganic Chromium Speciation in Geothermal Water of the Podhale Trough (Southern Poland) Used for Recreational Purpose. Energies 2020, 13, 3531. [Google Scholar] [CrossRef]
  45. ISO 17294:2016-2; Water Quality—Application of Inductively Coupled Plasma Mass Spectrometry (ICP-MS)—Part 2: Determination of Selected Elements Including Uranium Isotopes. International Organization for Standarization: Geneva, Switzerland, 2016.
  46. ISO 9297:1989; Water Quality—Determination of Chloride—Silver Nitrate Titration with Chromate Indicator (Mohr’s Method). International Organization for Standarization: Geneva, Switzerland, 1989.
  47. ISO 9963-1:1994; Water Quality—Determination of Alkalinity—Part 1: Determination of Total and Composite Alkalinity. International Organization for Standarization: Geneva, Switzerland, 1994.
  48. Marciniak, H.; Diduszko, R.; Kozak, M. XRayan, X-ray Phase Analysis Program, Version 4.2.2; Producer “KOMA” Henryk Marciniak: Warszawa, Poland, 2013. [Google Scholar]
  49. Altomare, A.; Cuocci, C.; Giacovazzo, C.; Moliterni, A.; Rizzi, R.; Corriero, N.; Falcicchio, A. EXPO2013: A kit of tools for phasing crystal structures from powder data. J. Appl. Cryst. 2013, 46, 1231–1235. [Google Scholar] [CrossRef]
  50. Frisch, M.J.; Trucks, G.W.; Schlegel, H.B.; Scuseria, G.E.; Robb, M.A.; Cheeseman, J.R.; Scalmani, G.; Barone, V.; Mennucci, B.; Petersson, G.A. Gaussian, Gaussian 09, Revision A. 1; Gaussian Inc.: Wallingford, CT, USA, 2009. [Google Scholar]
  51. Becke, A.D. Density-functional exchange-energy approximation with correct asymptotic behavior. Phys. Rev. A 1988, 38, 3098. [Google Scholar] [CrossRef]
  52. Lee, C.; Yang, W.; Parr, R.G. Development of the Colle-Salvetti correlation-energy formula into a functional of the electron density. Phys. Rev. B 1988, 37, 785. [Google Scholar] [CrossRef] [Green Version]
  53. Ochterski, J.W. Vibrational Analysis in Gaussian, White Papers and Technical Notes, 1999 (Minor Corrections 2018 and 2020). Available online: https://gaussian.com/white/ (accessed on 15 November 2022).
  54. Burstein, E.; Johnson, F.A.; Loudon, R. A Selection Rules for Second-Order Infrared and Raman Processes in the Rocksalt Structure and Interpretation of the Raman Spectra of NaCl, KBr, and NaI. Phys. Rev. A 1965, 139, A1239. [Google Scholar] [CrossRef]
  55. Krishnan, R.S. Raman spectra of alkali halides. In Essays in Structural Chemistry; Downs, A.J., Long, D.A., Staveley, L.A.K., Eds.; Springer: Boston, MA, USA, 1971. [Google Scholar]
  56. Clayman, B.P.; Nolt, I.G.; Sievers, A.J. Far-infrared absorption spectrum of NaI:NaCl. Solid State Commun. 1969, 7, 7–10. [Google Scholar] [CrossRef]
  57. Morioka, Y.; Nakagawa, I. Hyper-Raman spectra of some cubic crystals. Chem. Phys. Lett. 1985, 122, 150–152. [Google Scholar] [CrossRef]
  58. Ferraro, J.R. (Ed.) Metal halide vibrations. In Low-Frequency Vibration of Inorganic and Coordination Compounds; Springer: New York, NY, USA, 1971; pp. 111–189. [Google Scholar]
  59. Li, B.; Michaelides, A.; Scheffler, M. Density functional theory study of flat and stepped NaCl(001). Phys. Rev. B 2007, 76, 075401. [Google Scholar] [CrossRef] [Green Version]
  60. Jensen, T.L.; Moxnes, J.; Unneberg, E.A. Density Functional Theory Comparison Study of the Surface and Lattice Energy of Sodium Chloride. J. Comput. Theor. Nanosci. 2013, 10, 464–469. [Google Scholar] [CrossRef]
  61. Hirano, M. Friction at the Atomic Level: Atomistic Approaches in Tribology; John Wiley & Sons: Hoboken, NJ, USA, 2018; ISBN 3527411690. [Google Scholar]
  62. Available online: https://cccbdb.nist.gov/vibscalejust.asp (accessed on 15 November 2022).
  63. Toboła, T.; Natkaniec-Nowak, L.; Szybist, A.; Misiek, G.; Janiów, S. Blue salts in Kłodawa salt mine. Miner. Resour. Manag. IGSMiE PAN 2007, 23, 117–132. [Google Scholar]
  64. Zelek, S. Structural and Physical-Chemical Characteristics of Blue Halite from Kłodawa Salt Mine and Embedded Solid Inclusions. Ph.D. Thesis, Jagiellonian University, Kraków, Poland, 2012. [Google Scholar]
  65. Toboła, T.; Cyran, K.; Rembiś, M. Microhardness analysis of halite from different salt-bearing formations. Geol. Q. 2019, 63, 771–785. [Google Scholar] [CrossRef]
  66. Hunsche, U.; Hampel, A. Rock salt—the mechanical properties of the host rock material for a radioactive waste repository. Eng. Geol. 1999, 52, 271–291. [Google Scholar] [CrossRef]
  67. Liang, W.; Zhang, C.; Gao, H.; Yang, X.; Xu, S.; Zhao, Y. Experiments on mechanical properties of salt rocks under cyclingloading. J. Rock Mech. Geotech. Eng. 2012, 4, 54–61. [Google Scholar] [CrossRef] [Green Version]
  68. Carter, N.L.; Hansen, F.D. Creep of rock salt. Tectonophysics 1983, 92, 275–333. [Google Scholar] [CrossRef]
Figure 1. Location of underground hydrocarbon storages and Kłodawa salt mine at the map of salt diapirs in Poland [1,3].
Minerals 12 01561 g001
Figure 2. Influence of the arrangement of layers in the deposit on the development and shape of the leach chamber. 1—K-Mg salt layer, 2—projected shape of chamber, 3—obtained shape of chamber, 4—intersection lines of salt layers in the plane of the chamber [5]. Modified with permission from the publisher.
Minerals 12 01561 g002
Figure 3. Examples of samples of investigated minerals: (A) aggregates of the blue halite between sylvite vein, (B) aggregates of the blue, purple and colorless halite; Kłodawa diapir, Poland.
Minerals 12 01561 g003
Figure 4. The experimental far infrared spectra in the range of 600–30 cm−1 of NaCl and KCl: ――NaCl-CR—NaCl analytical pure chemical reagent, ――NaCl-BH—blue halite, ――NaCl-CH—colorless halite, ――NaCl-PH—purple halite, ――KCl-CR—KCl analytical pure chemical reagent, ――KCl-CS—colorless sylvite.
Minerals 12 01561 g004
Figure 5. Geometry of optimized lattice structures of crystals NaCl (A) and KCl (B) (DFT/B3LYP/6-31g*, all angles equal 90°, 125-atom model).
Minerals 12 01561 g005
Figure 6. Computed infrared spectra for 125-atom NaCl and KCl models of crystal in the spectral range of 400–0 cm−1: A—NaCl/nF/B3LYP/6-31g*, B—NaCl/F/B3LYP/6-31g*, C—KCl/nF/B3LYP/6-31g*, D—KCl/F/B3LYP/6-31g*. (Half-bandwidths 4 cm−1, no scaling factor, nF—calculation of geometry without any restriction, F—calculation of geometry with “frozen” all angles).
Minerals 12 01561 g006
Table 1. List of experimental and theoretical studies carried out in this work.
Structural and Spectroscopic Characteristic of Halites and Sylvite
ExperimentsTheoretical Calculations
  • Selection of samples of minerals
  • Selection of method/a model of crystals
  • Chemical analysis (ICP-OES, ICP-MS, titration)
  • Geometry optimization
  • XRD measurements
  • IR frequency calculation
  • FIR measurements
Table 2. Chemical analysis of the studied halides.
Name of SampleComponent
[% wt.]
Na+K+Mg2+Zn2+Cu2+ClBr
SYLVITE0.35651.196<0.0110.0030.00248.2420.201
WHITE HALITE38.5670.1690.0100.0040.00461.247<0.011
PURPLE HALITE38.2650.662<0.0110.0030.00261.068<0.011
BLUE HALITE39.0060.391<0.0110.0040.00260.5750.022
Table 3. Lattice parameters of minerals identified by the XRD method.
Name of SampleCrystal SystemsSymmetry Space GroupUnit Cell ParametersVolume
a = b = c [Å]α = β = γ [°]V [Å3]
COLORLESS SYLVITEisometricFm-3m6.2905(1)90.000248.920(5)
COLORLESS HALITEisometricFm-3m5.6418(1)90.000179.579(7)
PURPLE HALITEisometricFm-3m5.6375(1)90.000179.171(5)
BLUE HALITEisometricFm-3m5.6397(1)90.000179.379(6)
Table 4. Comparison of calculated geometric parameters for NaCl and KCl models of crystal structures (125 atoms) for calculation at the DFT/B3LYP level of theory with 6-31g* basis set.
HalideRestriction
for
Geometry
Optimiztion
Bond Distance [Å]
(Na-Cl, K-Cl)
Angle [°]
(Na-Cl-Na, Cl-Na-Cl, K-Cl-K,
Cl-K-Cl)
Mean ValueMaximum,
Minimum
Standard DeviationMean Value Maximum,
Minimum
Standard Deviation
NaClNone2.7862.875, 2.6530.05389.9699.90, 83.712.72
All angles 90°2.7842.790, 2.7780.00690.0090.00, 90.000.00
KClNone3.1673.229, 3.0520.04290.0095.75, 86.621.50
All angles 90°3.1643.176, 3.1520.01290.0090.00, 90.000.00
Publisher’s Note: MDPI stays neutral with regard to jurisdictional claims in published maps and institutional affiliations.

