Article

Geochemical Characteristics of Soils to the Impact of Diamond Mining in Siberia (Russia)

1
Diamond and Precious Metal Geology Institute, Siberian Branch, Russian Academy of Sciences, 67700 Yakutsk, Russia
2
Faculty of Geology and Survey, North-Eastern Federal University named after M.K. Ammosov, 677000 Yakutsk, Russia
3
Research Institute of Applied Ecology of the North named after D.D. Savvinov, North-Eastern Federal University Named after M.K. Ammosov, 677980 Yakutsk, Russia
4
Melnikov Permafrost Institute, Siberian Branch, Russian Academy of Sciences, 677000 Yakutsk, Russia
*
Author to whom correspondence should be addressed.
Minerals 2022, 12(12), 1518; https://doi.org/10.3390/min12121518
Submission received: 24 October 2022 / Revised: 21 November 2022 / Accepted: 24 November 2022 / Published: 27 November 2022
(This article belongs to the Special Issue Geochemistry, Environmental Impact and Remediation of Mining Areas)

Abstract

:
This article presents the results of long-term research and monitoring of the soil cover exposed to the impact of the mining and processing plant developing diamond deposits in the northeast of Siberia. The soil collection includes 436 samples of different types of Cryosols. Soil pH; soil organic carbon (SOC); granulometric composition; and mobile forms of Pb, Ni, Mn, Cd, Co, Cr, Zn, Cu, and As were identified in the samples. Multivariate statistics of the correlation matrix, clustering analysis (CA), and principal component analysis (PCA) were used to determine the sources of heavy metals. The intensity of the accumulation of chemical elements in the soil was assessed using calculated concentration coefficients (Kc) and the index of total contamination of the soil cover (Zc). In the study area, Cryosols are characterized by biogenic accumulation of Ni, Mn, and Cd in the upper soil layer and Cr, Ni, Co, Mn, and Cu in the suprapermafrost horizon. Correlation matrix, CA, and PCA revealed three distinct sources that could be considered for the investigated potentially toxic elements (PTEs): anthropogenic, lithogenic, and the source which comes from a mixed contribution of anthropogenic and lithogenic factors. The most anthropogenic contribution in the heavy metals in the study area appears in Zn, Cd, As, and Pb. The assessment interpreted that origin of Mn in the area is most likely to be a natural source. The content of Co, Cr, and Ni are controlled by both lithogenic control and anthropogenic sources. Active accumulation of mobile forms of Mn, Zn, and Ni with anomalously high concentration coefficients can be traced in the soils in the impact zone of mining operations. Anthropogenic soil contamination is spread over an area of 260 km2.

1. Introduction

The exploration of mineral deposits is inevitably accompanied by the uncontrolled ingress of chemical elements and their compounds into the soil layer from the earth’s interior (crust). According to the calculations of scientists from the Mining Institute of the Ural Branch of the Russian Academy of Sciences, more than 100 billion tons of ore, minerals, and construction materials are extracted from the earth’s interior annually [1]. As a result, technogenic pressure manifests itself in an increased concentration in certain components of the ecosystem, both during the period of exploration and development of deposits and after the place of its processing in the form of dumps, tailings, and solid and liquid wastes of different chemical composition [2,3,4]. In addition, various substances migrating in natural landscapes enter the environment from anthropogenic formations [5,6,7,8].
The intensity of the long-term technogenic impact and the spatial pattern of the distribution of pollutants in mining areas is determined by the chemical composition and geochemical properties of soils, which are relatively conservative components of the ecosystem. The specificity of any geosystems, including mining regions, is manifested in the fact that the soil cover, as the main depositing natural environment, to the greatest extent reflects the scale and nature of environmental changes in the anthropogenic period to a great extent [9,10,11,12].
Recently, a significant number of research papers have been published in Russia and other countries, the conclusions of which indicate that soils, as an essential ecosystem component, serves as a potential source of secondary contamination for the landscape components in the adjacent areas [13,14,15,16,17,18]. The most active pollutants are mobile forms of trace elements that can transfer from solid phases to soil solutions and be absorbed by plants [19].
One of the objectives of genetic soil science is to decipher the information recorded in soils, to use it to reconstruct past natural environment, and to develop scenarios for future changes in soils and landscapes [20]. Soils reflect natural geochemical anomalies due to ore occurrence [21]. Additionally, at the same time, soils develop anthropogenic geochemical anomalies that characterize zones of industrial contamination, where the concentration of pollutants often reaches dangerous levels for living organisms [22].
The article is a summary of the archival and published materials on the integrated environmental observation of the Khannya–Nakyn interfluve of Western Yakutia. It presents the results of the 11-year monitoring of the soil cover on the territory of the Nyurbinsky Mining and Processing Division (MPD) industrial site of ALROSA.
The aim of the research is an ecological and geochemical analysis of the state of Cryosols in the Khannya–Nakyn interfluve in Western Yakutia and their response to the impact of mining operations, as well as the determination of the level and degree of permafrost soils contamination under the technogenic effect of diamond mining.
The novelty of the study lies in the fact that regime (permanent) observations at the industrial site of the mining and processing division since the initial stage of development of the kimberlite field are unique factual material that allows for assess to the response of permafrost soils to the impact of mining operations.

2. Materials and Methods

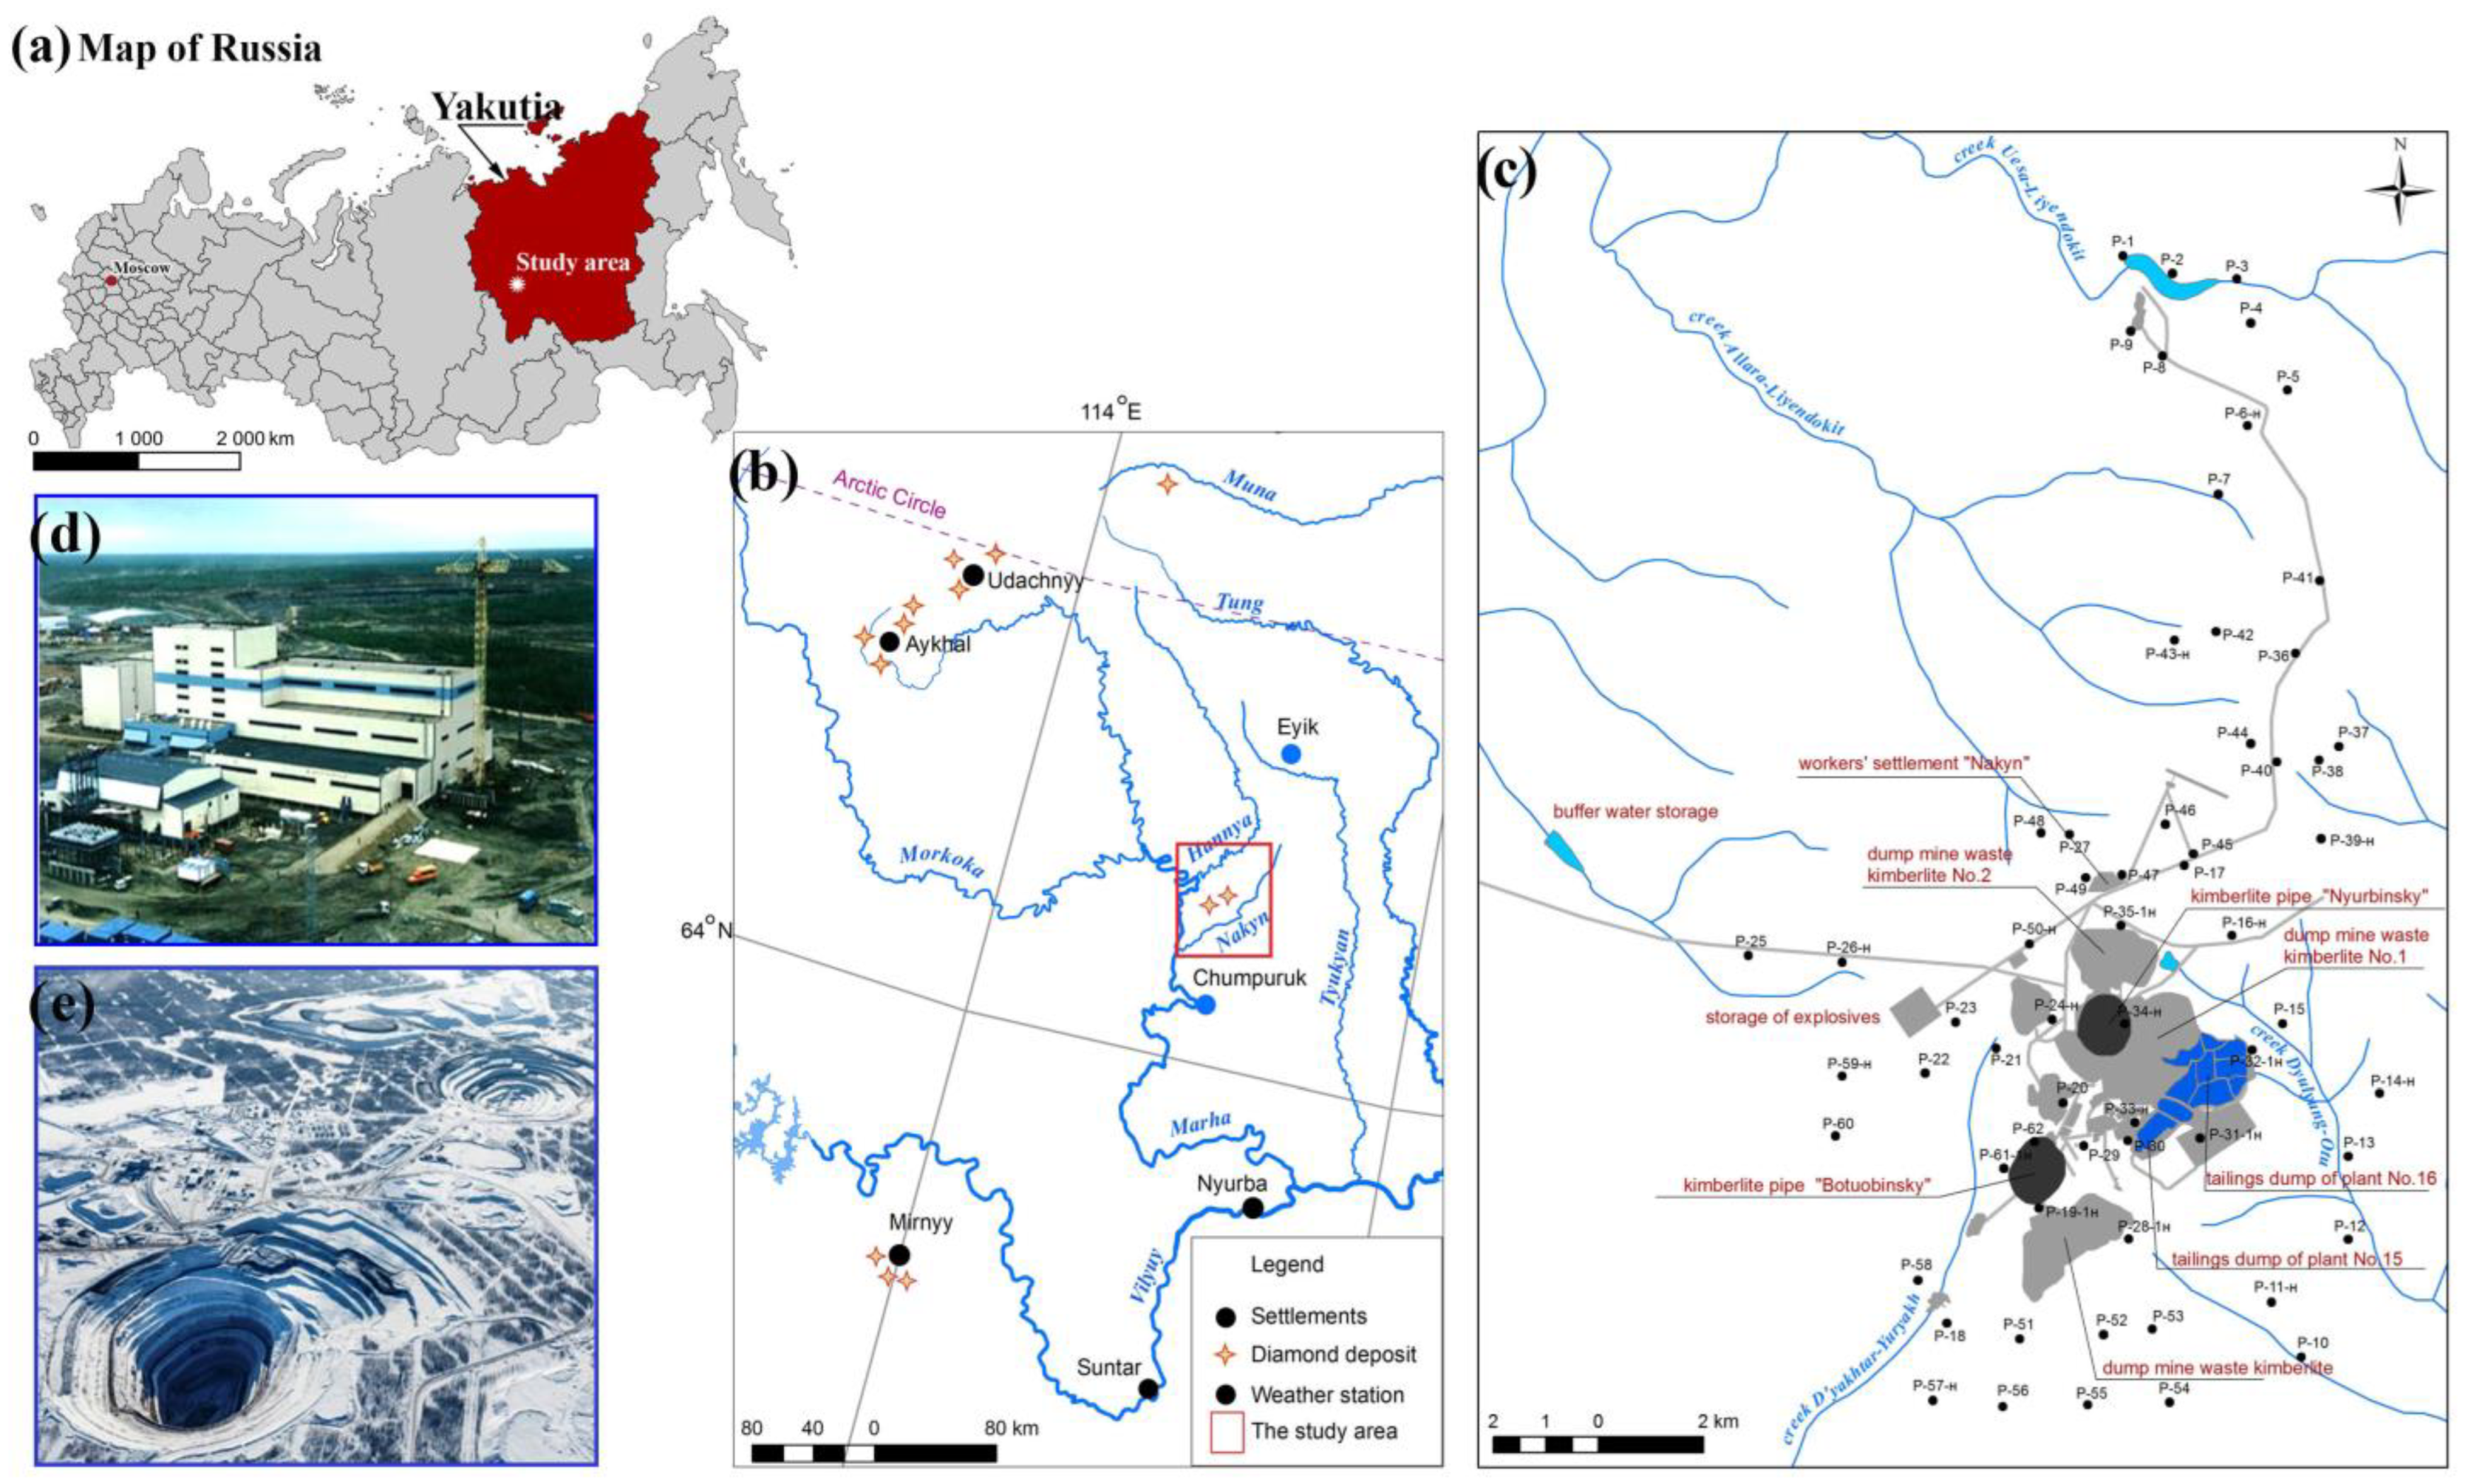
2.1. Research Area and Sampling Points

The research was conducted on the territory of the Nakyn kimberlite field within the Nyurbinsky MPD’s industrial site (65°01′31″ N, 117°04′53″ E). It is located in the northern taiga landscape in Western Yakutia in northeastern Siberia (Russia) (Figure 1a,b).
The Nakyn kimberlite field includes several highly diamondiferous kimberlite bodies, including the Botuobinsky (1994), Nyurbinsky (1996), Markhinsky (1999), and Maysky (2006) pipes, and the Botuobinsky and Nyurbinsky placer occurrences. The development of the deposits resulted in the creation of Nyurbinsky mining and processing Division (Nyurbinsky MPD) with an advanced infrastructure has been established, including the Nyurbinsky and Botuobinsky quarries for the extraction of kimberlite ore, processing plants №15 and №16, geological factory №17, a shift camp for 1000 people, airstrips, and an explosives warehouse [23]. In addition, ground-based storage of mining products, such as waste rock dumps, and enrichment facilities, including tailings dumps have been established.
The research area is located within the Vilyuy-Markha denudation plain, situated on the boundary of the Central Siberian Plateau and the Central Yakut Plain of Central Siberia (Russia), with absolute marks of the drainage divides varying from 213 to 269 m [24]. The relief is slightly dissected, with absolute elevations from 240 to 260 m and relative heights above the nearest streams from 15 to 35 m.
According to the geobotanical subdivision, the studied territory belongs to the to the Middle Taiga and Northern Taiga sub-zones of the boreal region. The vegetation is represented by mixed larch forests with an admixture of birch, and in the soil cover, there are cranberry, bearberry, and lichens. The dominant species of the tree layer consists of Gmelin larch (Larix gmelinii) and Cajander larch (Larix cajanderi).
The study area was evenly spaced across the entire site with a sampling interval of 2 km × 2 km on a scale of 1:100,000 km (Figure 1c). Sampling was conducted at the same points from the topsoil at a 0–20 cm depth in 2007, 2011, 2014, and 2018. In addition to Sampling from the topsoil, the soil sections were laid with a complete sampling of the soil sample from genetic horizons. A total of 436 soil samples were collected and analyzed. Classification of soil types was carried out on the basis of the World Reference Base [25]. Genetic horizons and soils were characterized according to the Russian Soil Classification [26]. A description of the vegetation cover was also performed in the study area.
All samples were air-dried at room temperature and sieved on a <1.0 mm screen to remove coarse waste. Then, the soil samples were pestled until all the particles passed through a 0.25 mm sieve. Next, 10 g (±0.1 g) of soil was ground in a mortar to powder [27].

2.2. Sample Analyses

The soil pH was measured in soil-water suspension (1:2.5) at room temperature using a pH meter (Mettler Toledo, Seven Compact Advanced) according to the state standard [28,29]. The photoelectric colorimetric method (KFK-2 UHL 4.2 Russia) was used to identify soil organic carbon (SOC) according to the state standard [30,31]. Total nitrogen (TN) was calculated using the spectrophotometric method (PE-5300VI Russia) according to state standards [32,33]. The granulometric composition of the soil was determined by sedimentation analysis using the pipette method [34].
The content of the mobile forms of potentially toxic elements (Pb, Ni, Mn, Cd, Co, Cr, Zn, Cu, and As) was determined using an atomic absorption spectrometer (MGA-915 GC Lumex, Saint Petersburg, Russia) following acid digestion and extraction by 1N HNO3 (soil to extractant ratio 1:10) [35]. The 1 N HNO3 extractant defines the most mobile-acid-soluble forms of elements that are more strongly bound to the soil, in contrast to H2O and 1 N HCl [36,37,38]. Therefore, elements extracted via 1 N HNO3 represent the maximum content of potentially accessible metals in plants (potentially accessible fraction) [39].

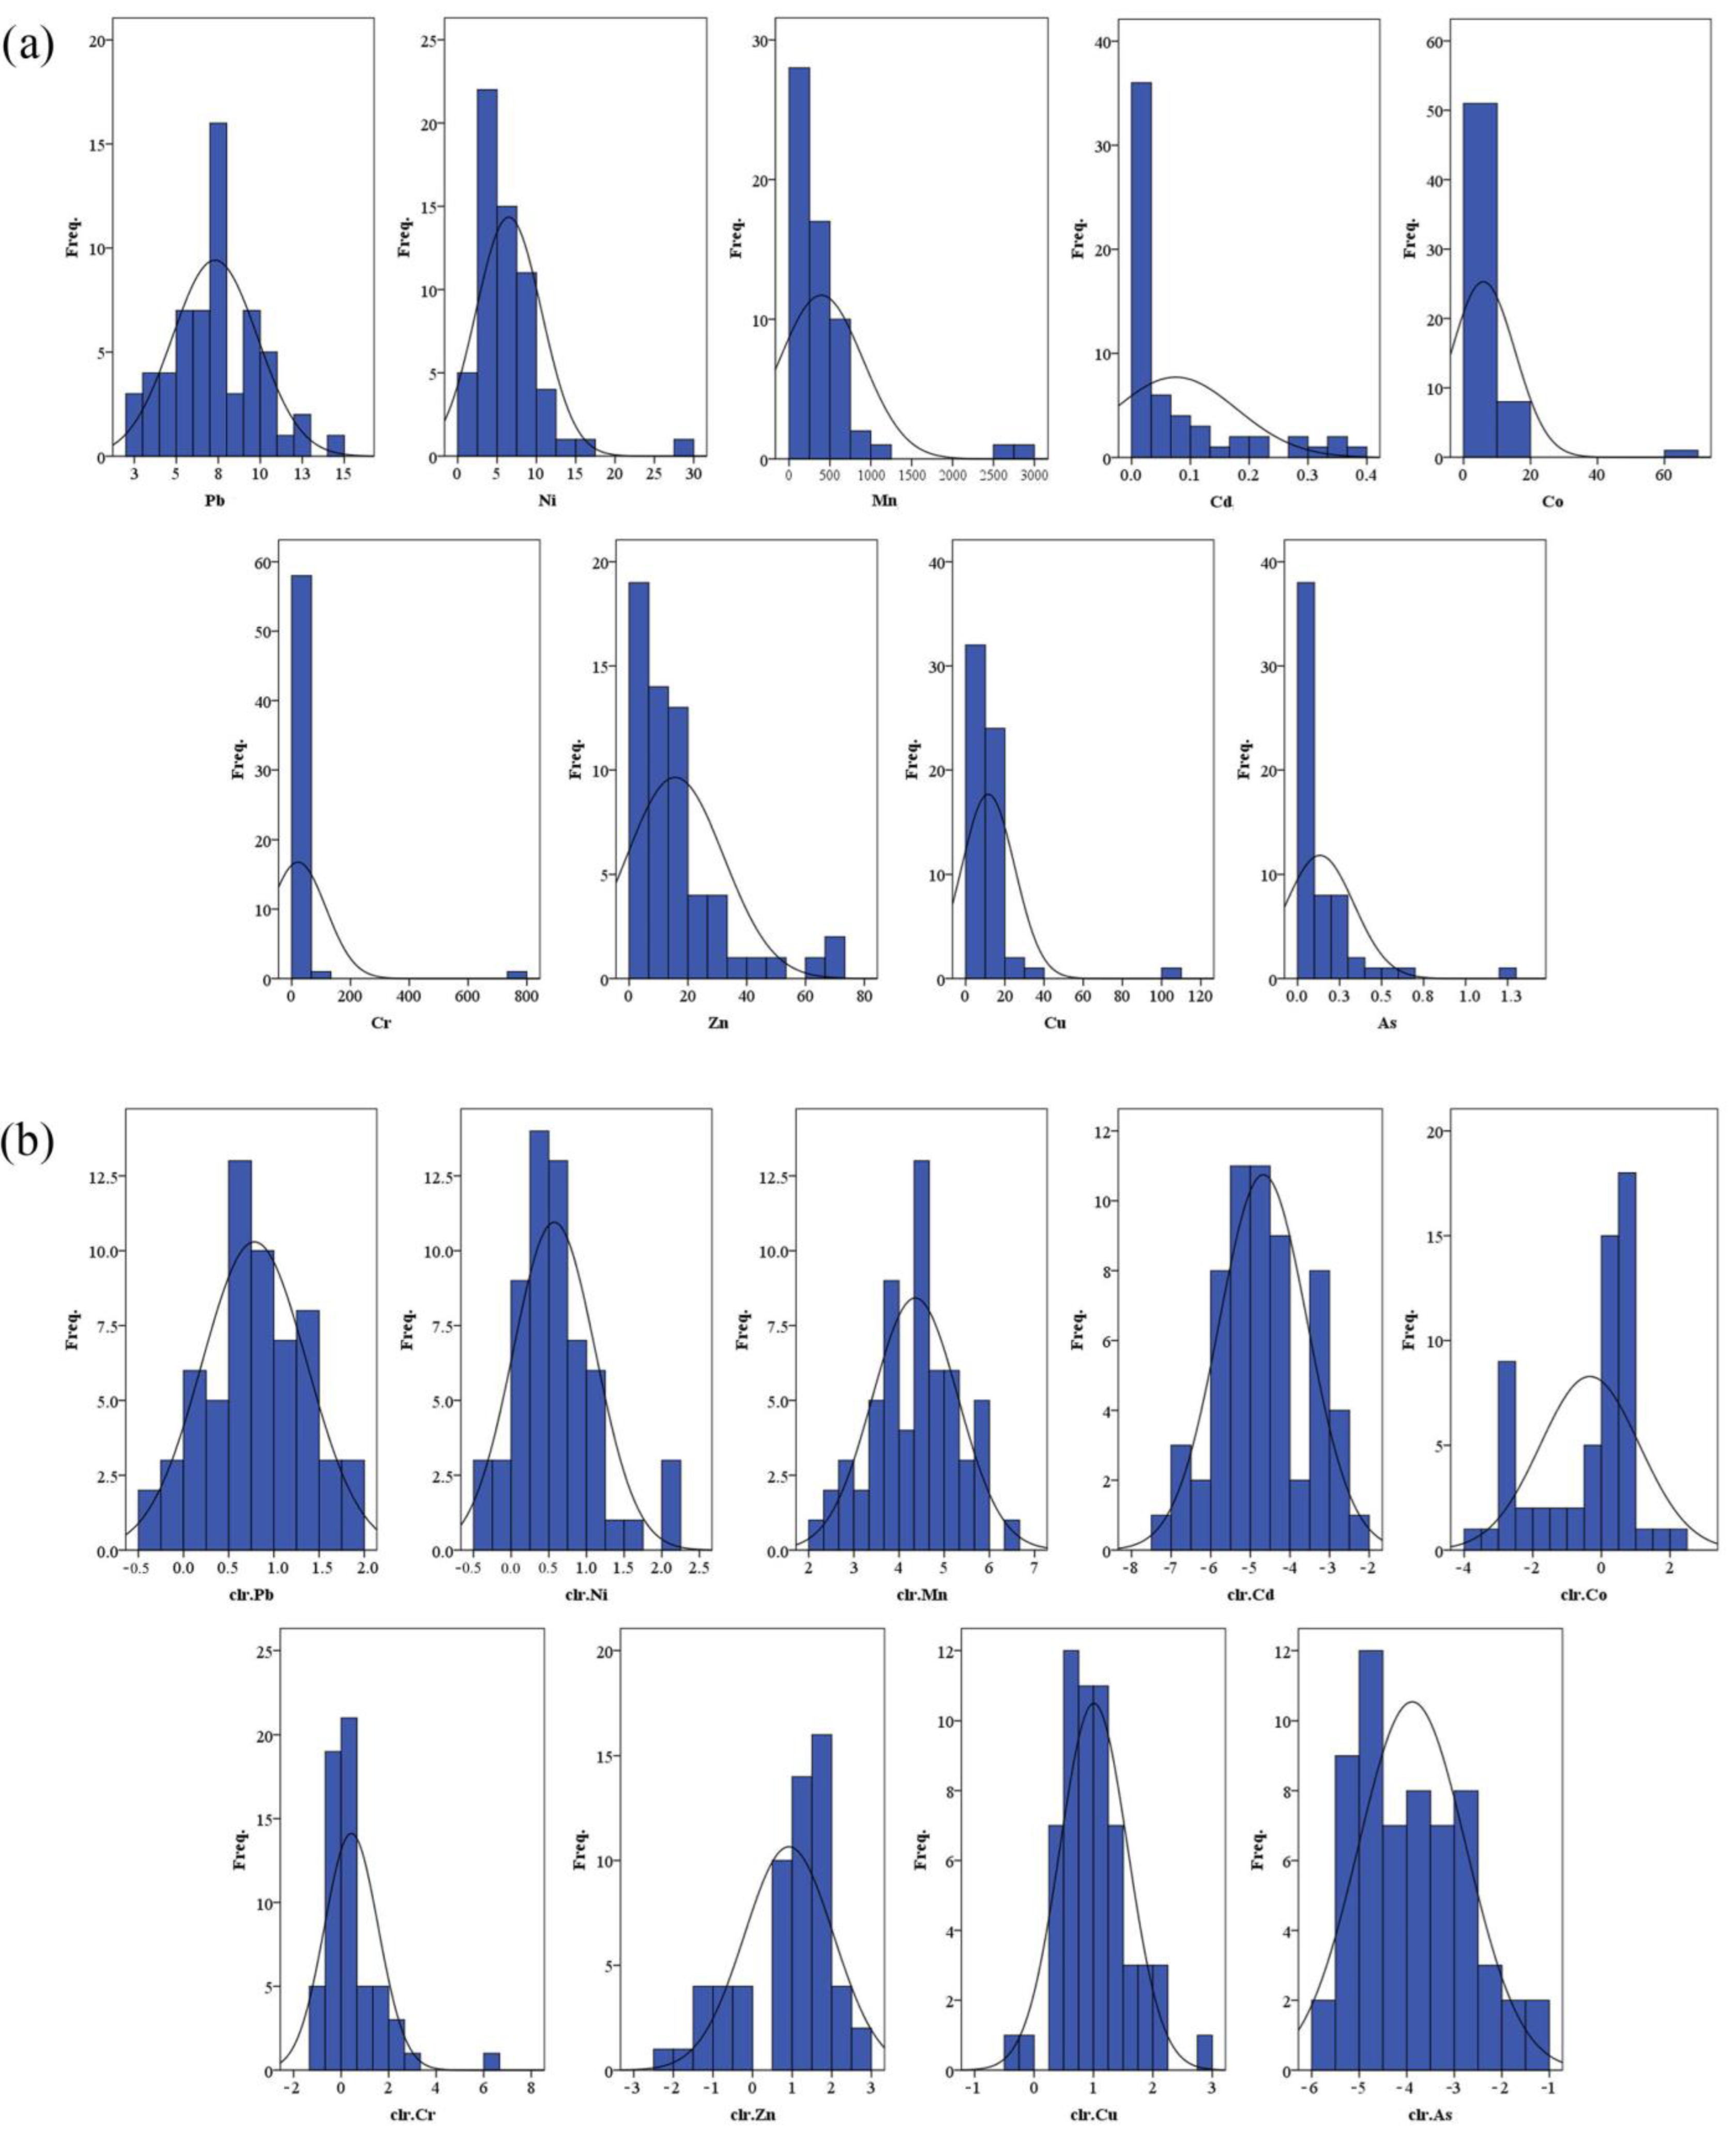
2.3. Data Processing

Prior to the statistical analysis, the distribution of the data set was evaluated using the Kolmogorov–Smirnov (p < 0.2) and Shapiro–Wilk’s (p < 0.05) methods; if the distribution value was not normal, the data were transformed according to the Compositional data analysis (CoDa) principles [40,41,42] using the centered log-ratio (clr) transformation, the approach that was proven to be appropriate recently [43,44,45,46]. Only the clr-transformed elemental concentration data were used for the construction of the model. The clr transformation is performed by normalizing (centering) the log-transformed parts for each sample by its geometric mean. The log-transformation transforms compositional data (relative values with a constant sum) into multi-dimensional real space [47,48], whereas normalizing to the geometric mean ensures that higher concentration elements are not over-emphasized in further statistical analysis. For transfer raw data to clr-transformation data, CoDaPack software (Version 2.03.01, University of Girona, Girona, Spain) was used (http://www.compositionaldata.com/codapack.php, accessed on 16 November 2022).
The Pearson correlation coefficient was applied to measure the ratio between two quantitative variables (elements and main soil properties (pH and SOC). The content data of PTEs were analyzed by cluster analysis (CA) and principal component analysis (PCA) to identify the sources. In this study, CA was performed to separate variables into several mutually exclusive clusters. PCA was adopted to identify the sources of PTE contamination in soil using varimax rotation with Kaiser Normalization. Statistical analysis was conducted using Statistica 13.0, SPSS Statistics and OriginPro 2021.

2.4. Contamination Indices

Ecological and geochemical characteristics of soil contamination were conducted by geochemical indicators that address to the distribution of separate metals and their associations with contamination due to the multi-element chemical composition of the polluting anthropogenic watercourses. These indicators are presented by concentration coefficients (Kc) and the index of total contamination (Zc) as calculation Formulas (1) and (2):
K c   = C i C f   ,
where Ci is the actual content of contaminants in soil, mg/kg, and Cf is the background content of pollutants in soil, mg/kg.
Z c     = i = 1 n K c ( n 1 ) ,
where Kc is the concentration coefficient of the i-th component of contamination with values Kc > 1.5, and n is the number of abnormal elements. Elements with very low background contents were not used.
Classification of the level of the soil cover contamination was conducted according to the Guidance Document 52.18.718−2008 [49]: Zc < 16 indicates allowable, 16–32 indicates moderately hazardous, 32–128 indicates hazardous, and ≥128 indicates extremely hazardous [50].
Regional background values regarding the content of mobile forms of trace elements are based on the geometric mean values of soil samples (n = 212) of the natural/undisturbed landscapes outside the impact zone of the mining and processing division [51,52].
Mapping was performed with the application of ArcGIS 9.0 software.

3. Results

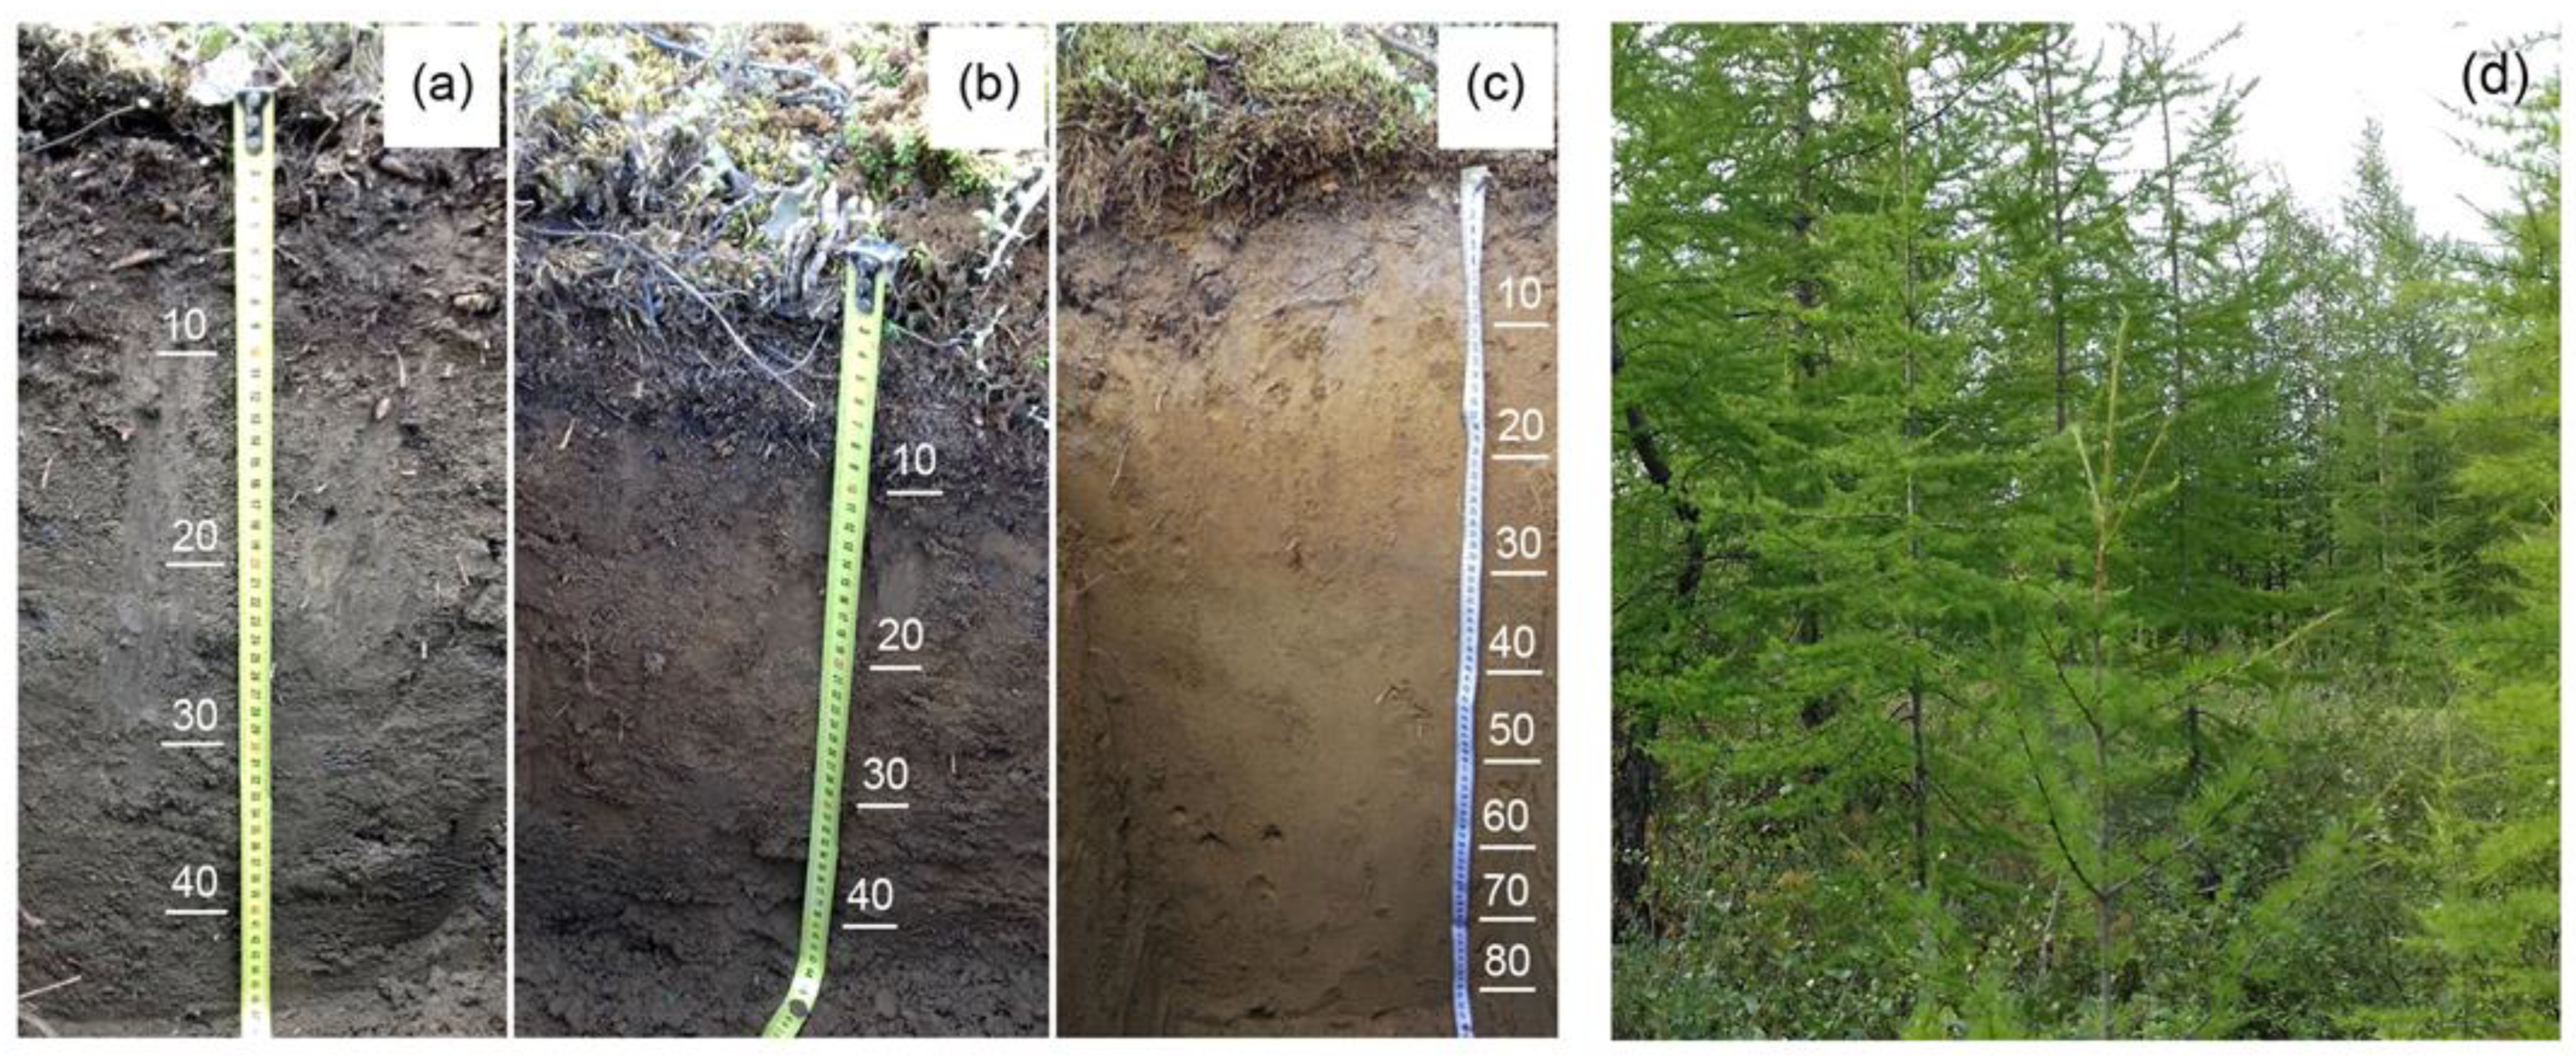
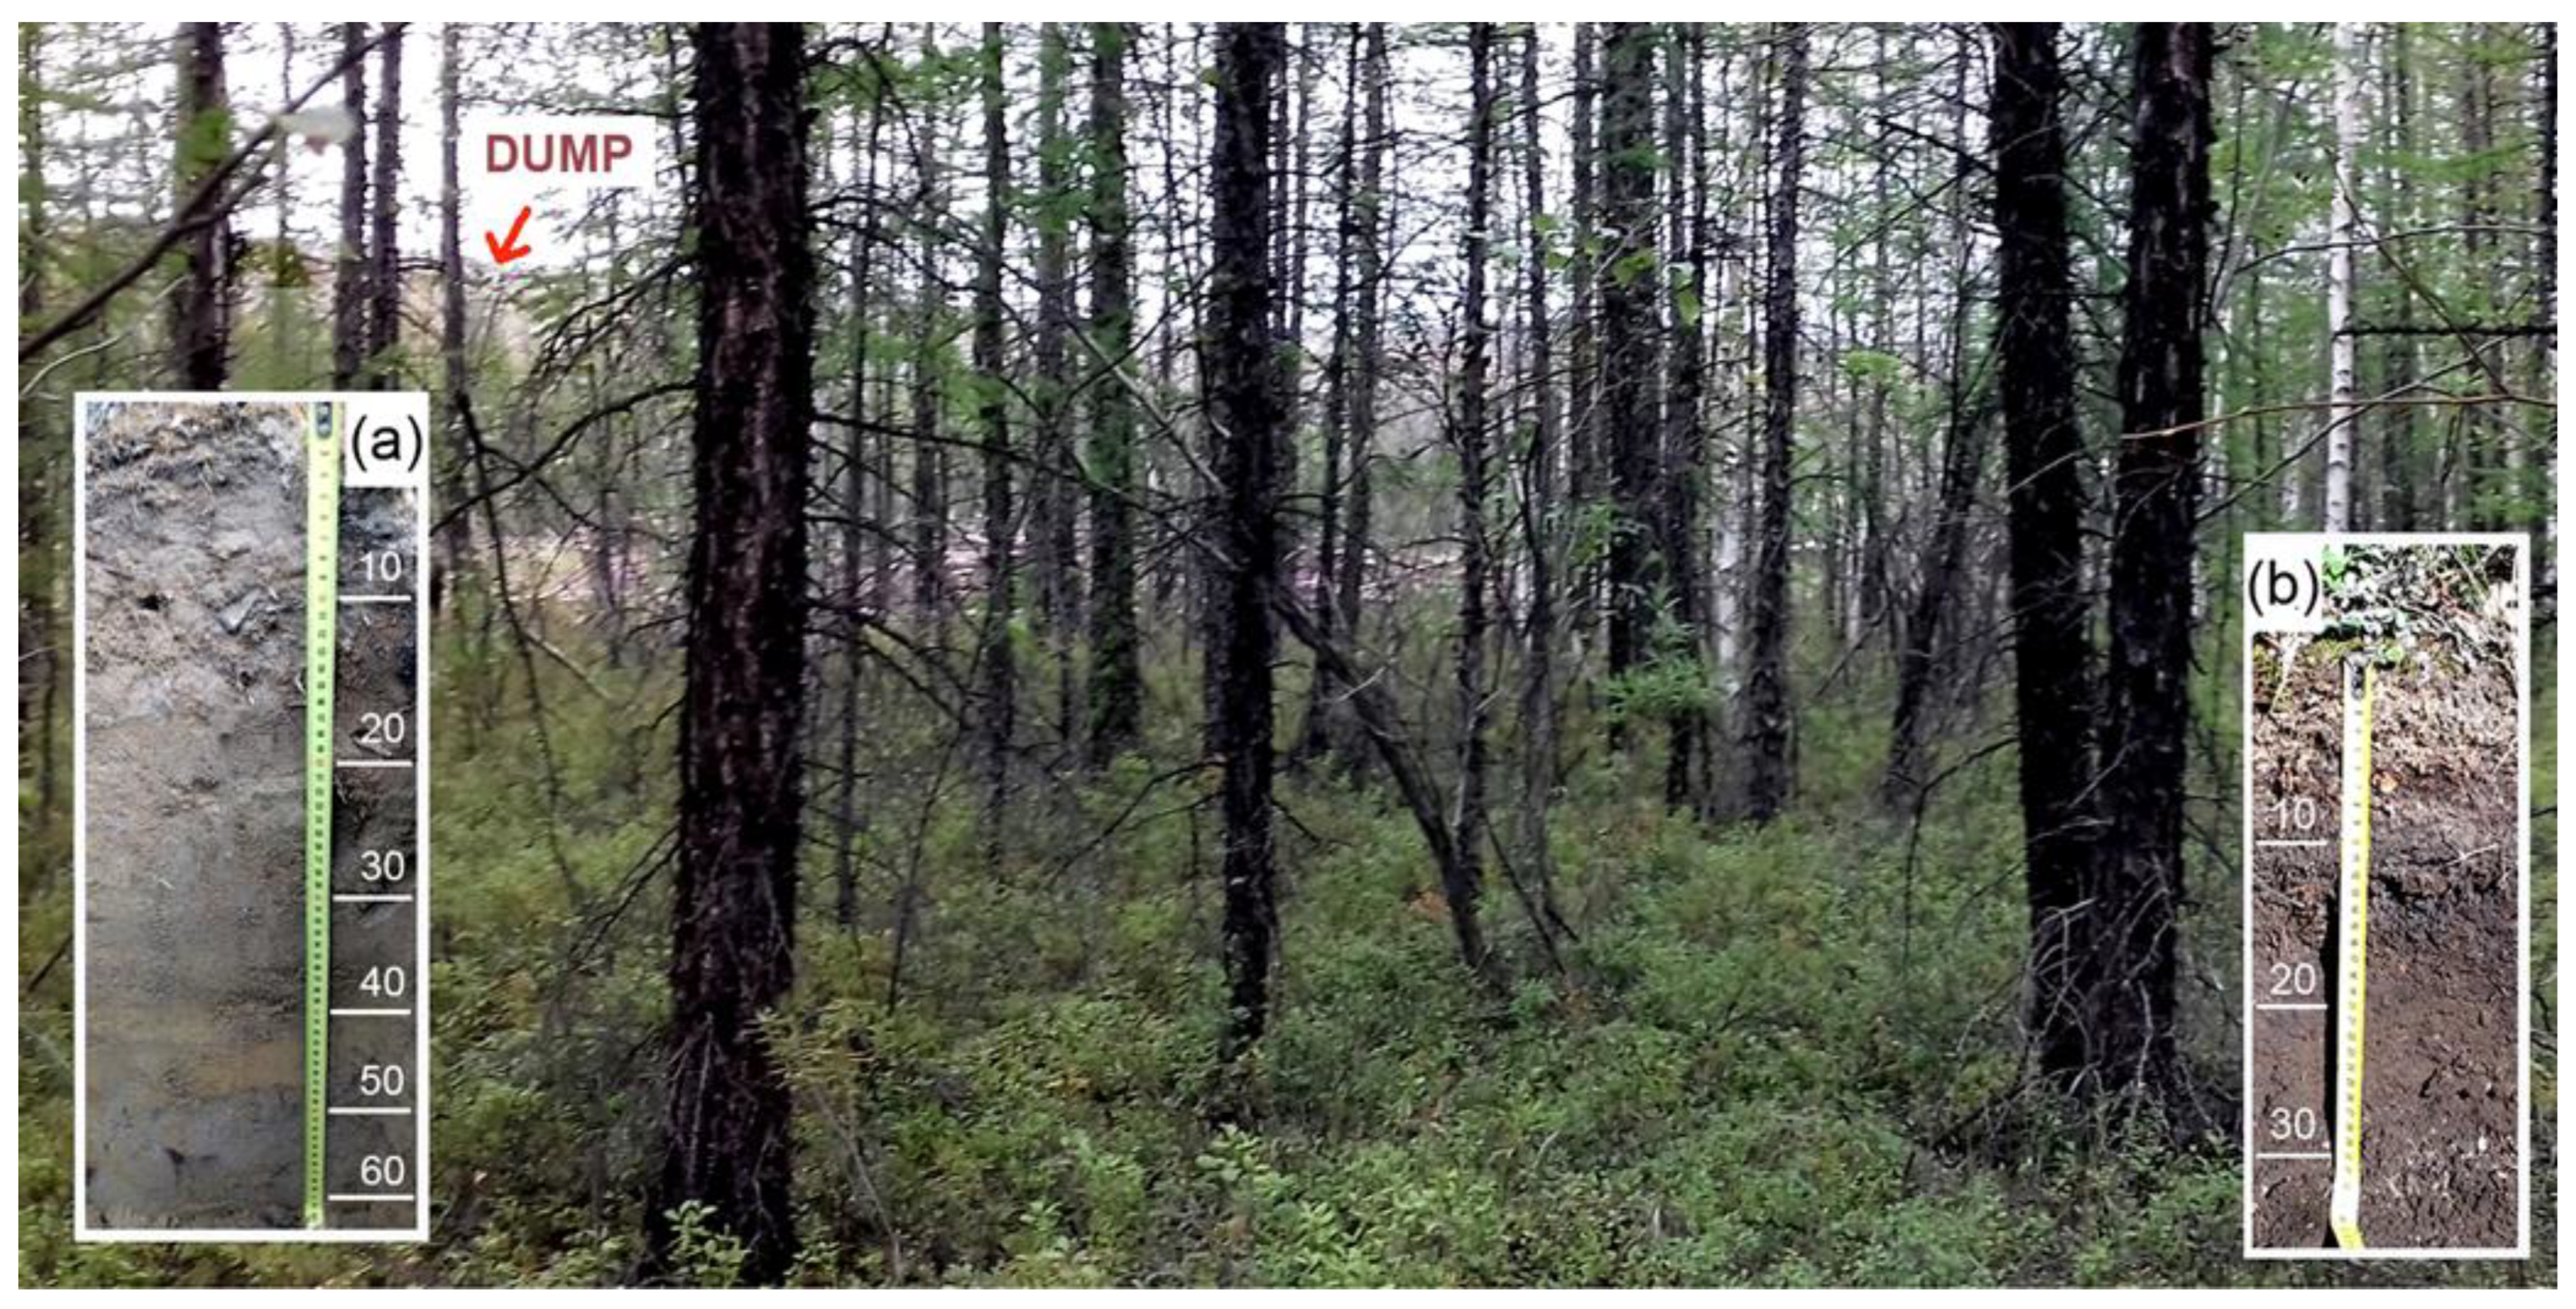
3.1. The Soil Characteristic

Cryogenic soils formed in the research area are attributed to the First Level of Reference Soil Groups of Cryosols, among which the dominant ones are Haplic Cryosols Reductaquic, Folic Cryosols Reductaquic, Cambic Turbic Cryosols, Turbic Glacic Cryosols, Histic Cryosols Reductaquic, Turbic Cryosols Dystric, and Spodic Cryosols Dystric. These soils are characterized by a thin profile with distinct cryoturbation processes that disturb the genetic integrity of horizons and the mixing of soil material. According to the morphological description, the profiles of the primary types of soils are characterized by the following structure (Figure 2):
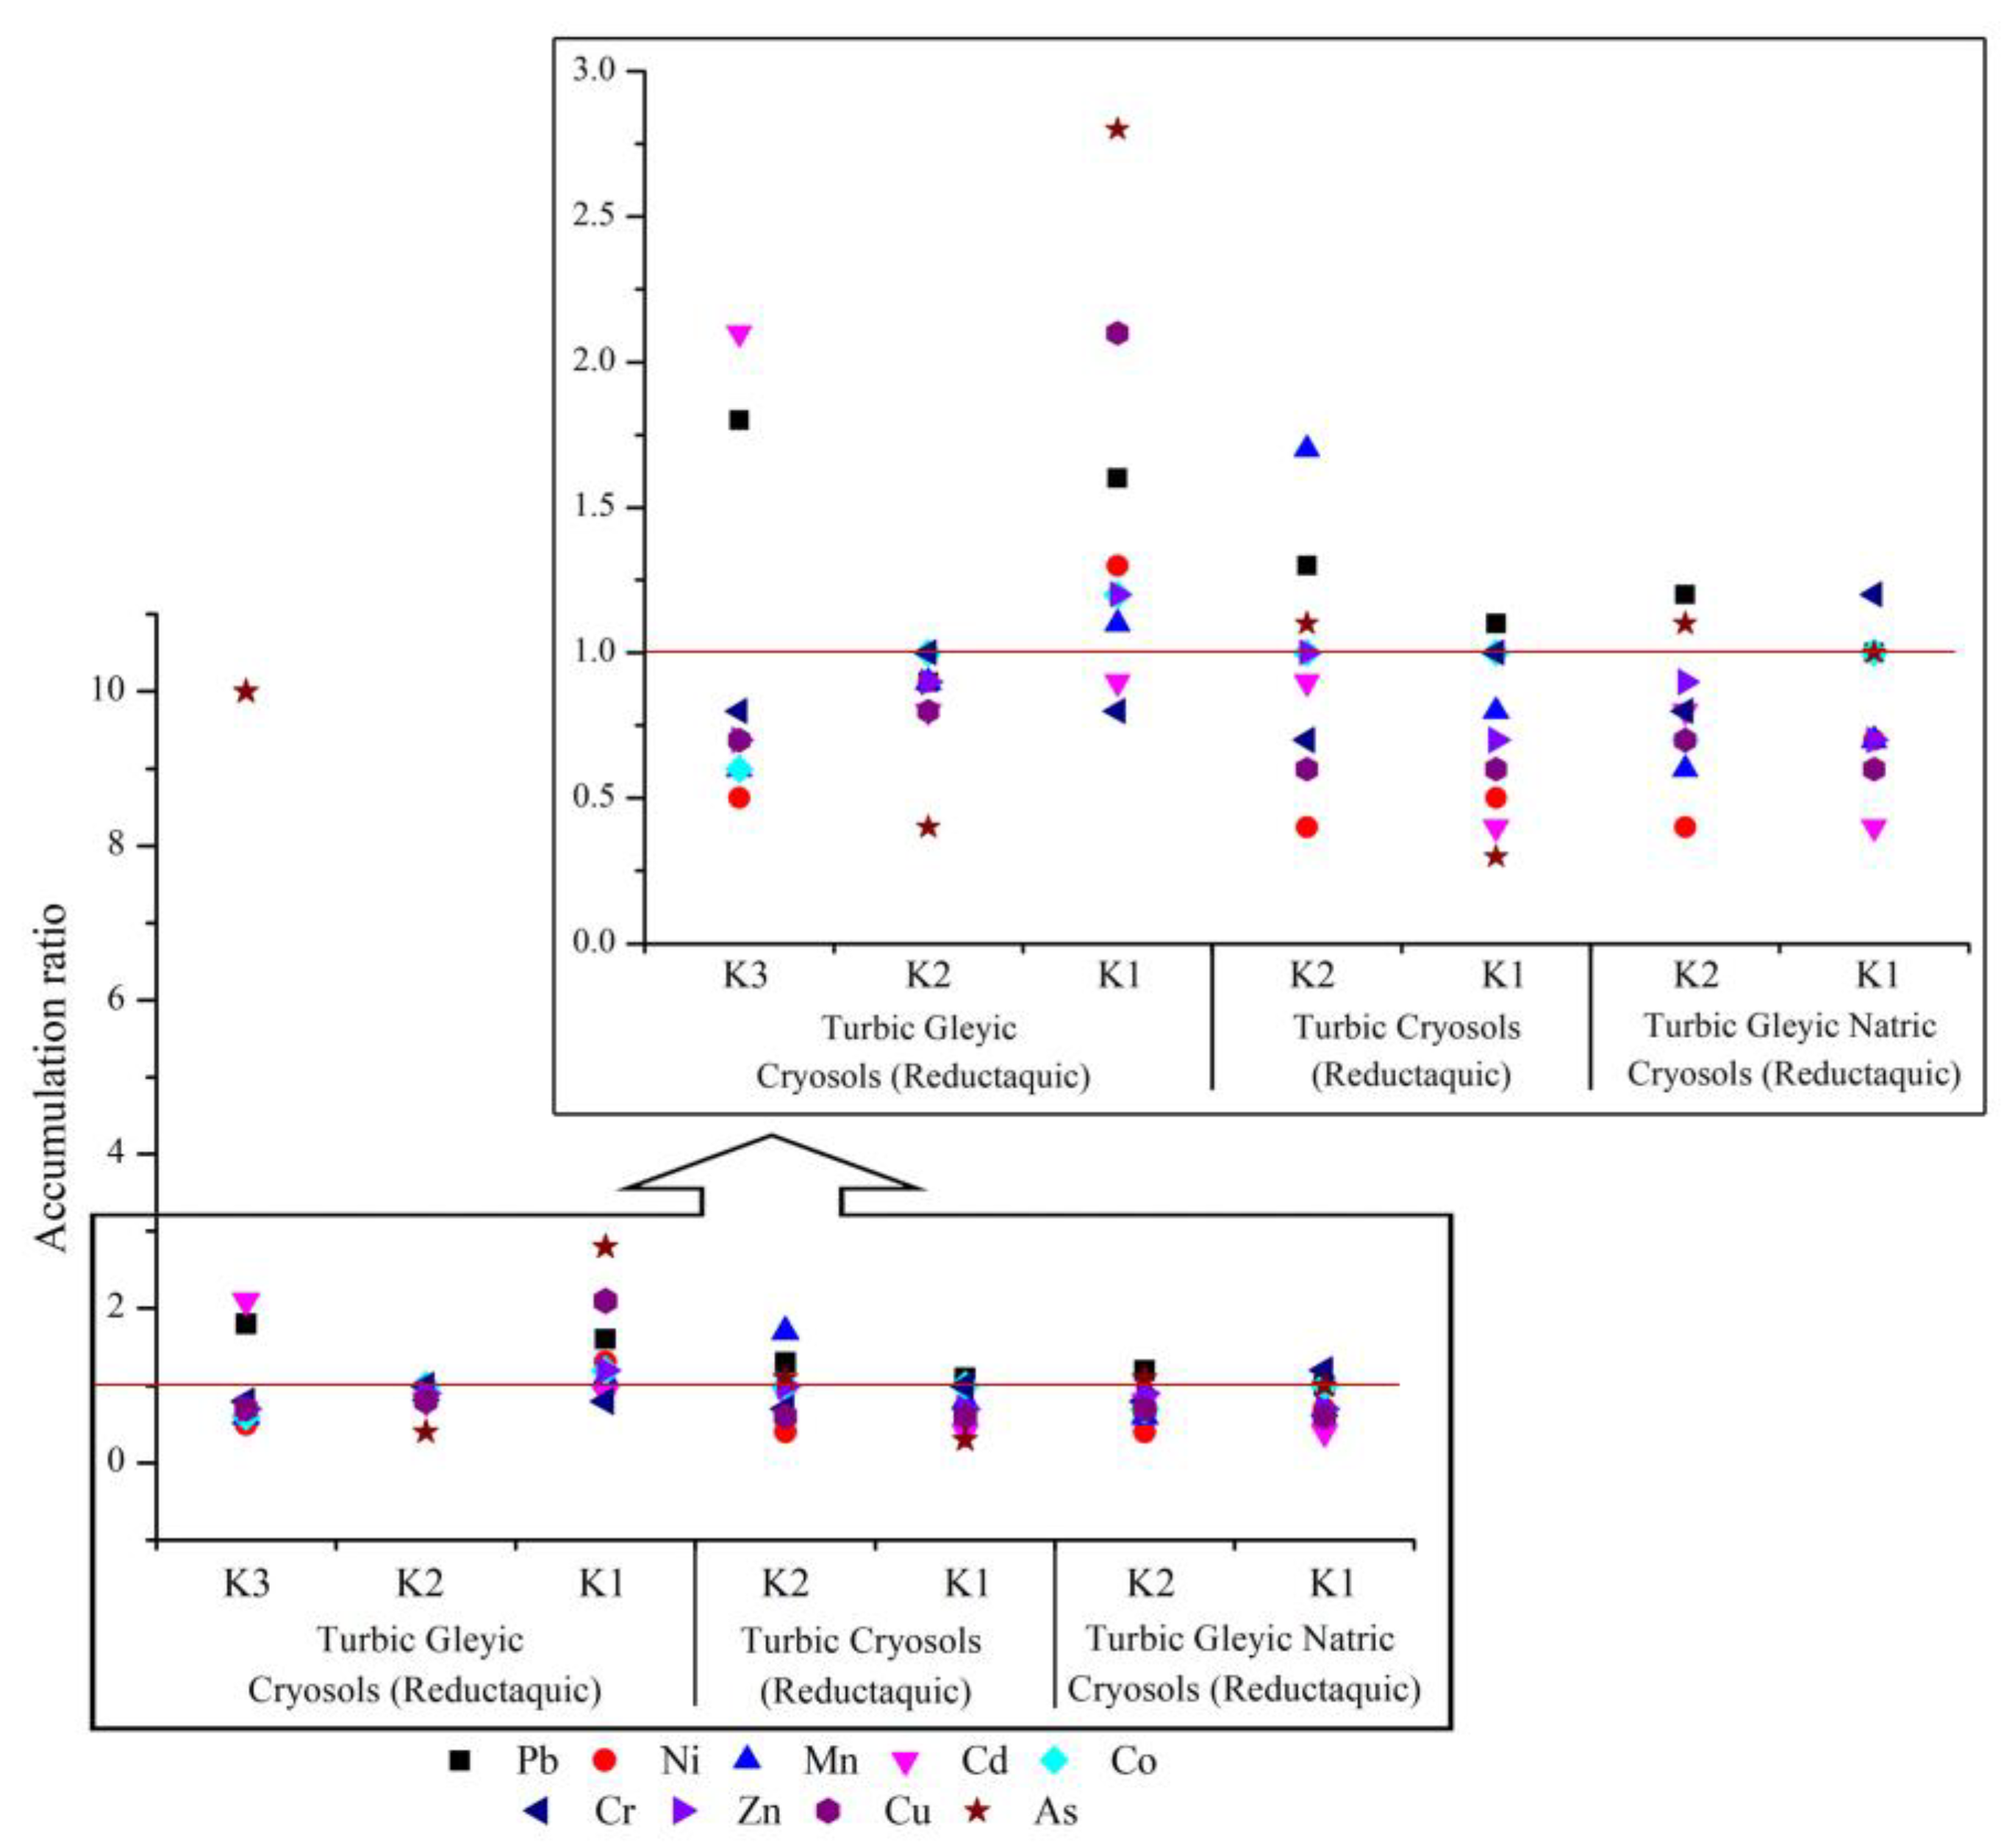
  • Turbic Gleyic Crysols (Reductaquic): AO–Acr–CR g–Cg┴;
  • Turbic Crysols (Reductaquic): AO–CR–C↓;
  • Turbic Gleyic Natric Crysols (Reductaquic): A–ELB–Cg┴.
In addition to the natural types of soils (Cryosols) on the territory of the industrial site, there is the presence of soils near the impact zone with detected surface contamination: technogenic surface formations (TSFs). Technogenic surface formations occur near sites or territories directly affected by mining operations and the development of new human-made landscapes (Figure 3).

3.2. Physicochemical Properties

Table 1 shows the physical and chemical characteristics of soils of the Khannya–Nakyn interfluve using the example of three soil sections of the most widespread subtypes Cryosols within the territory. The soil cover is mainly characterized by the acidic reaction of the soil environment in the upper organic horizons transitions to weakly alkalinity down the profile. High variability is observed in the humus content (V = 94%). High humus values determine the presence of moderate and weakly decomposed organic residues in soils, which is typical for the soils of the northern regions. The carbon-to-nitrogen ratio (C/N = 13) indicates a low decomposition of plant residues. The coarse-humus nature of soil organic matter in Cryosols is also noted by various authors [53,54].
It has been observed that Cryosols are characterized by a binomial structure of the soil profile according to the granulometric composition:
  • In Turbic Gleyic Crysols, a sharp decrease by up to 70% in the content of physical clay is observed down the soil profile due to an increase in the content of fractions with a diameter of 0.25–0.05 mm.
  • In Turbic Crysols, the content of physical clay increases down the profile due to an increase in the number of particles with a diameter of <0.01.
  • Turbic Gleyic Natric Crysols is distinguished by the lowest amount of physical clay. At the same time, there is an increase in its content down the soil profile as a result of a decrease in the content of granulometric fractions, with a size of 0.25–0.05 mm, to 56%.

3.3. Descriptive Statistics

The characteristics of soil PTEs concentrations in the Cryosols of the Khannya–Nakyn interfluve are described in Table 2. The mean values of the elements’ concentrations decreased in the following order Mn > Cr > Zn > Cu > Pb > Ni > Co > As > Cd. The coefficient of variation (CV) shows the degree of relative variability in PTE concentrations in all soil samples. If the CV is 0%–20%, it indicates low variability; CV 20%–50% is considered moderate variability; CV 50%–100% is observed as high variability; and a CV above 100% is considered exceptionally high variability [55]. The Mn, Cr, Zn, Cu, and Co had a high CV value, which indicated a high variability of the PTEs content between all sampling sites in the Cryosols of the Khannya–Nakyn interfluve. For the degree of variability in the remaining elements, Cd, As, Pb, and Ni, the CV value showed less than 20%, which means low variability. The average concentrations of all PTEs in the studied soils exceeded the background values.
Thus, the raw data revealed considerable variability for all elements and required its transformation. In this study, the clr-transformation method was used to analyze the combined data. Descriptive statistics for raw and clr-transformed data were computed (Table 2). The 5% trimmed mean allowed us to conclude that extreme values were concentrated mainly in the upper 2.5% intervals, as the remaining 97.5% can be approximated by the normal distribution. Once the clr-transformed data were applied, the associated standard deviation was clearly reduced, and the mean, median, and 5% trimmed mean tended to be similar. Indeed, the clr data showed a normal distribution as a result of diminishing the weight of outliers.
Based on a comparison of the histograms (Figure 4) of the raw and compositional datasets, it can be concluded that (a) when considering the raw dataset, asymmetric distributions are found for almost all PTEs, and these distributions are biased mainly by the presence of outliers; (b) the clr-transformed dataset shows an important feature because it suggests normality. Thus, it is concluded that the clr-transformed dataset and the compositional dataset have two principal advantages; namely, they allow us to work with proportions and to improve data normalization. Anomalous concentrations of study PTEs, which significantly exceeded the background values, are classic fingerprints of heavy industrial activity.

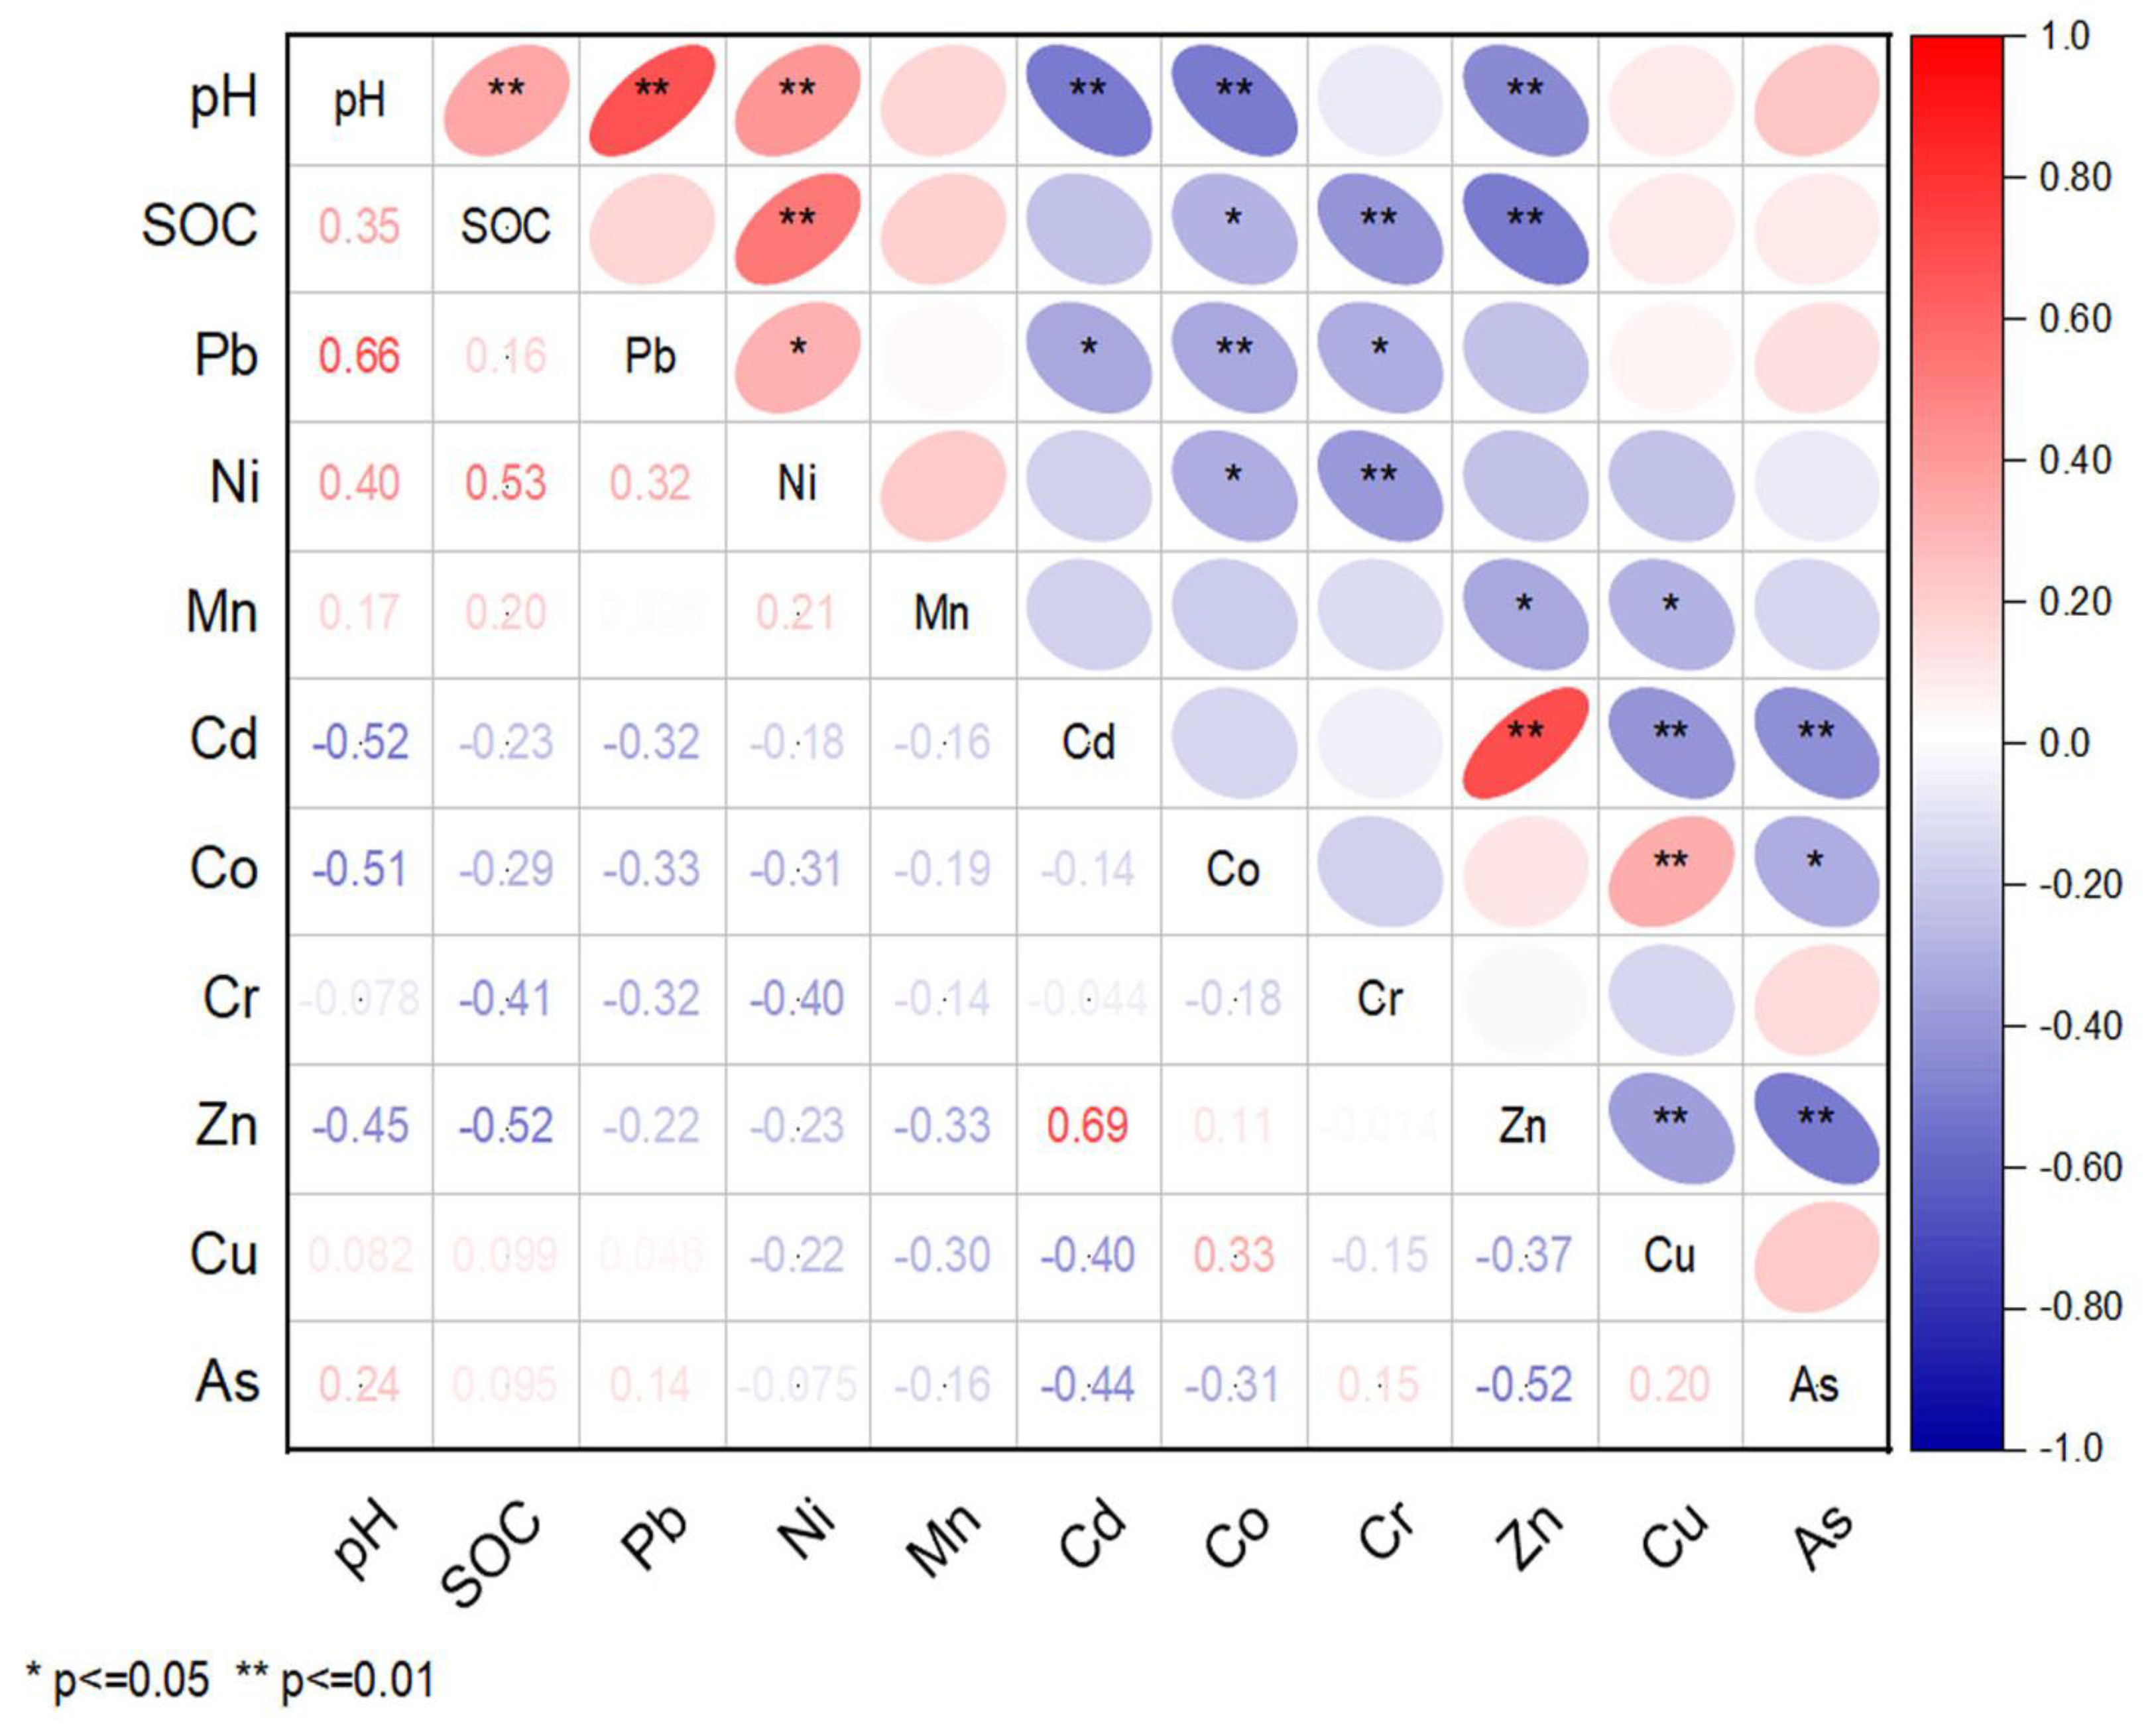
3.4. Correlation Analysis

Based on the correlation analysis (Figure 5), various dependency factors of the mobile forms of the elements on the soil organic carbon and pH values were revealed, with these factors characterizing the selectivity of the element (or group of elements) with the main components of the soil. A positive correlation was established between Pb (p < 0.01), Ni (p < 0.01) with pH, as well as between Ni (p < 0.01) with soil organic carbon; a negative correlation was found between Cd (p < 0.01), Co (p < 0.01), and Zn (p < 0.01) with pH, also between Zn (p < 0.01), Cr (p < 0.01), and Co (p < 0.05) with soil organic carbon. Among the elements, Pb-Ni (p < 0.05), Cd-Zn (p < 0.01), and Co-Cu (p < 0.01) were positively correlated.

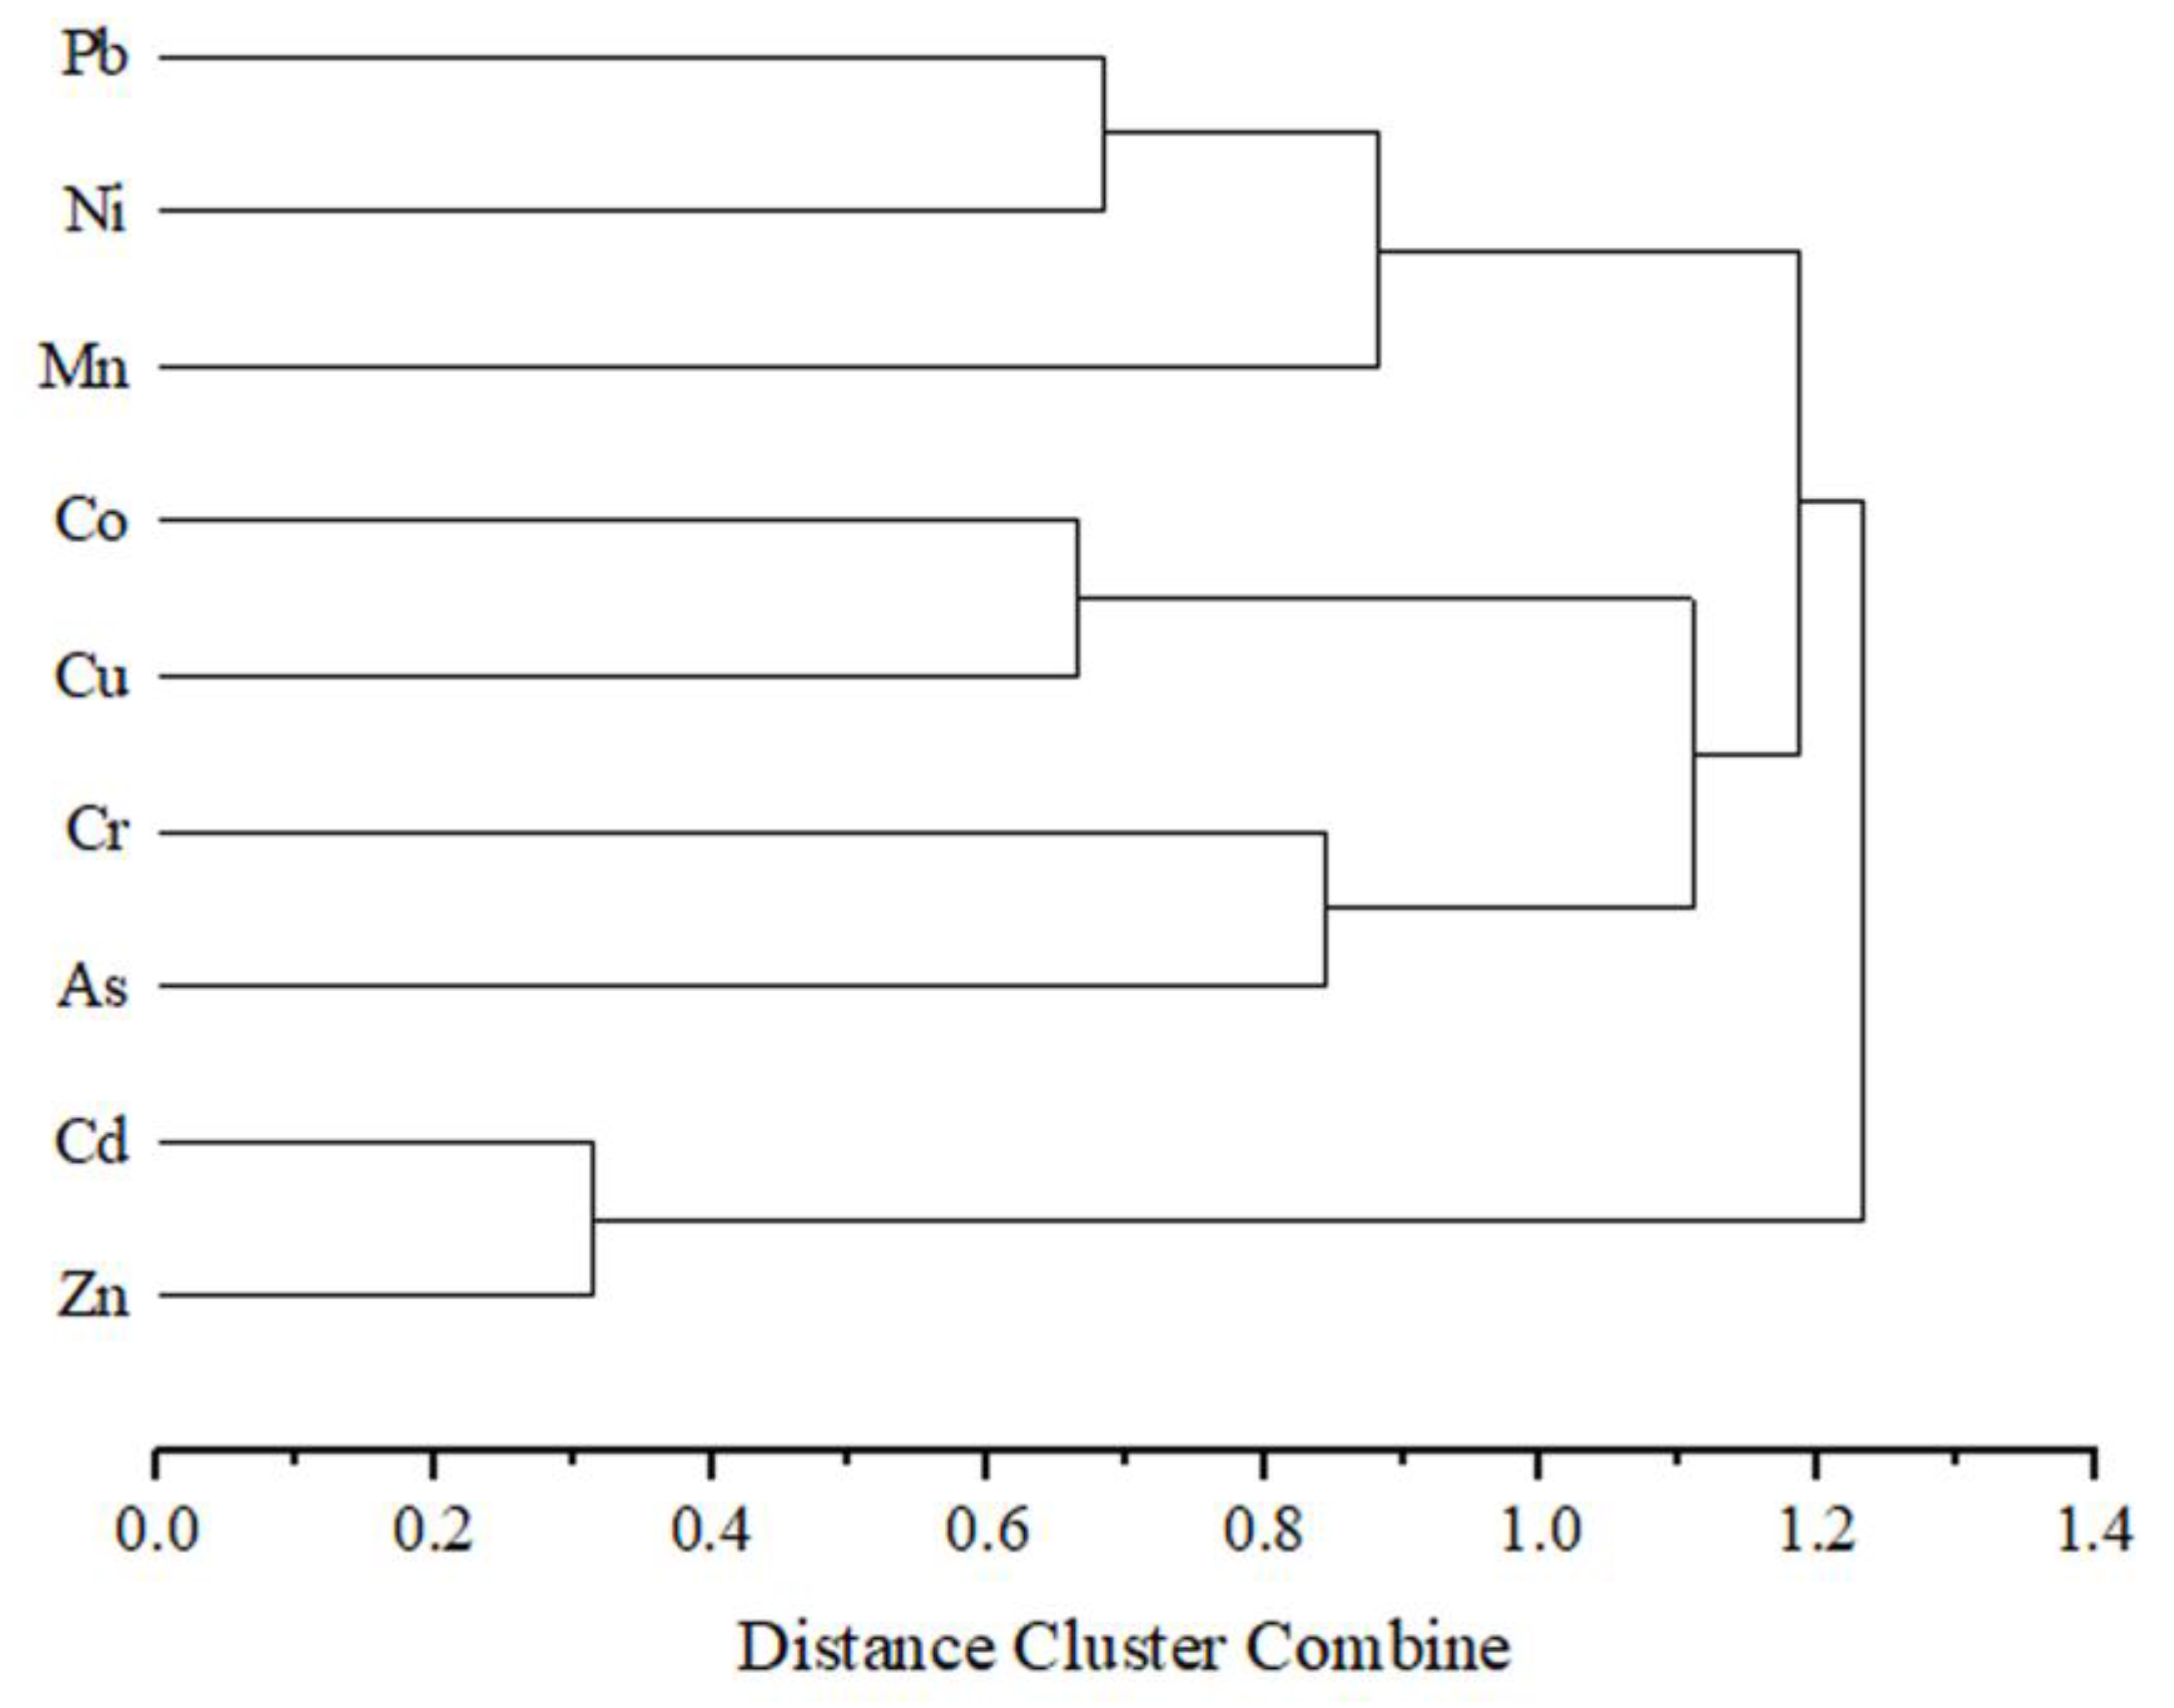
3.5. Cluster Analysis

To display the CA results, dendrograms were constructed (Figure 6), which can clearly reflect the distance between the elements and reveal the relationship between them. CA tree was created using a Pearson correlation as a measurement standard. The analysis results show four main clusters: Cd–Zn, Co–Cu, Cr–As, Pb–Ni–Mn. Cd and Zn were correlated with each other. Pb and Ni clustered with each other and composed another cluster with Mn. Co–Cu and Cr–As were isolated and joined to each other, and joined with the Pb–Ni–Mn cluster. Metals belonging to the same cluster usually have a common source [56].

3.6. Principal Component Analysis (PCA)

This analysis, applied to the autoscaled data matrix, shows a differentiation between the PTEs at the study sites. As shown in Table 3, four factors were identified, and varimax normalized rotation provided a factor loading that corresponded to the principal components. Eigenvalues greater than one were obtained by PCA, accounting for 78.84% of the total variance. The number of significant principal components is selected on the basis of the Kaiser criterion with an eigenvalue higher than 1 [57]. According to this criterion, only the first four principal components are retained because subsequent eigenvalues are all less than one. Hence, the reduced dimensionality of the descriptor space is four.
The first principal component 1 (PC1) explained 28.10% of the total variance. Cd and Zn had a high negative load, and Cu, As were a positive medium load. The second component (PC2) explained 21.44% of the total variance, and Pb, Ni, and Cr were the main loading elements. The third component (PC3) explained 16.59% of the variance of our results. The fourth component (PC4) was loaded by Mn and explains 12.70% of the total variance.

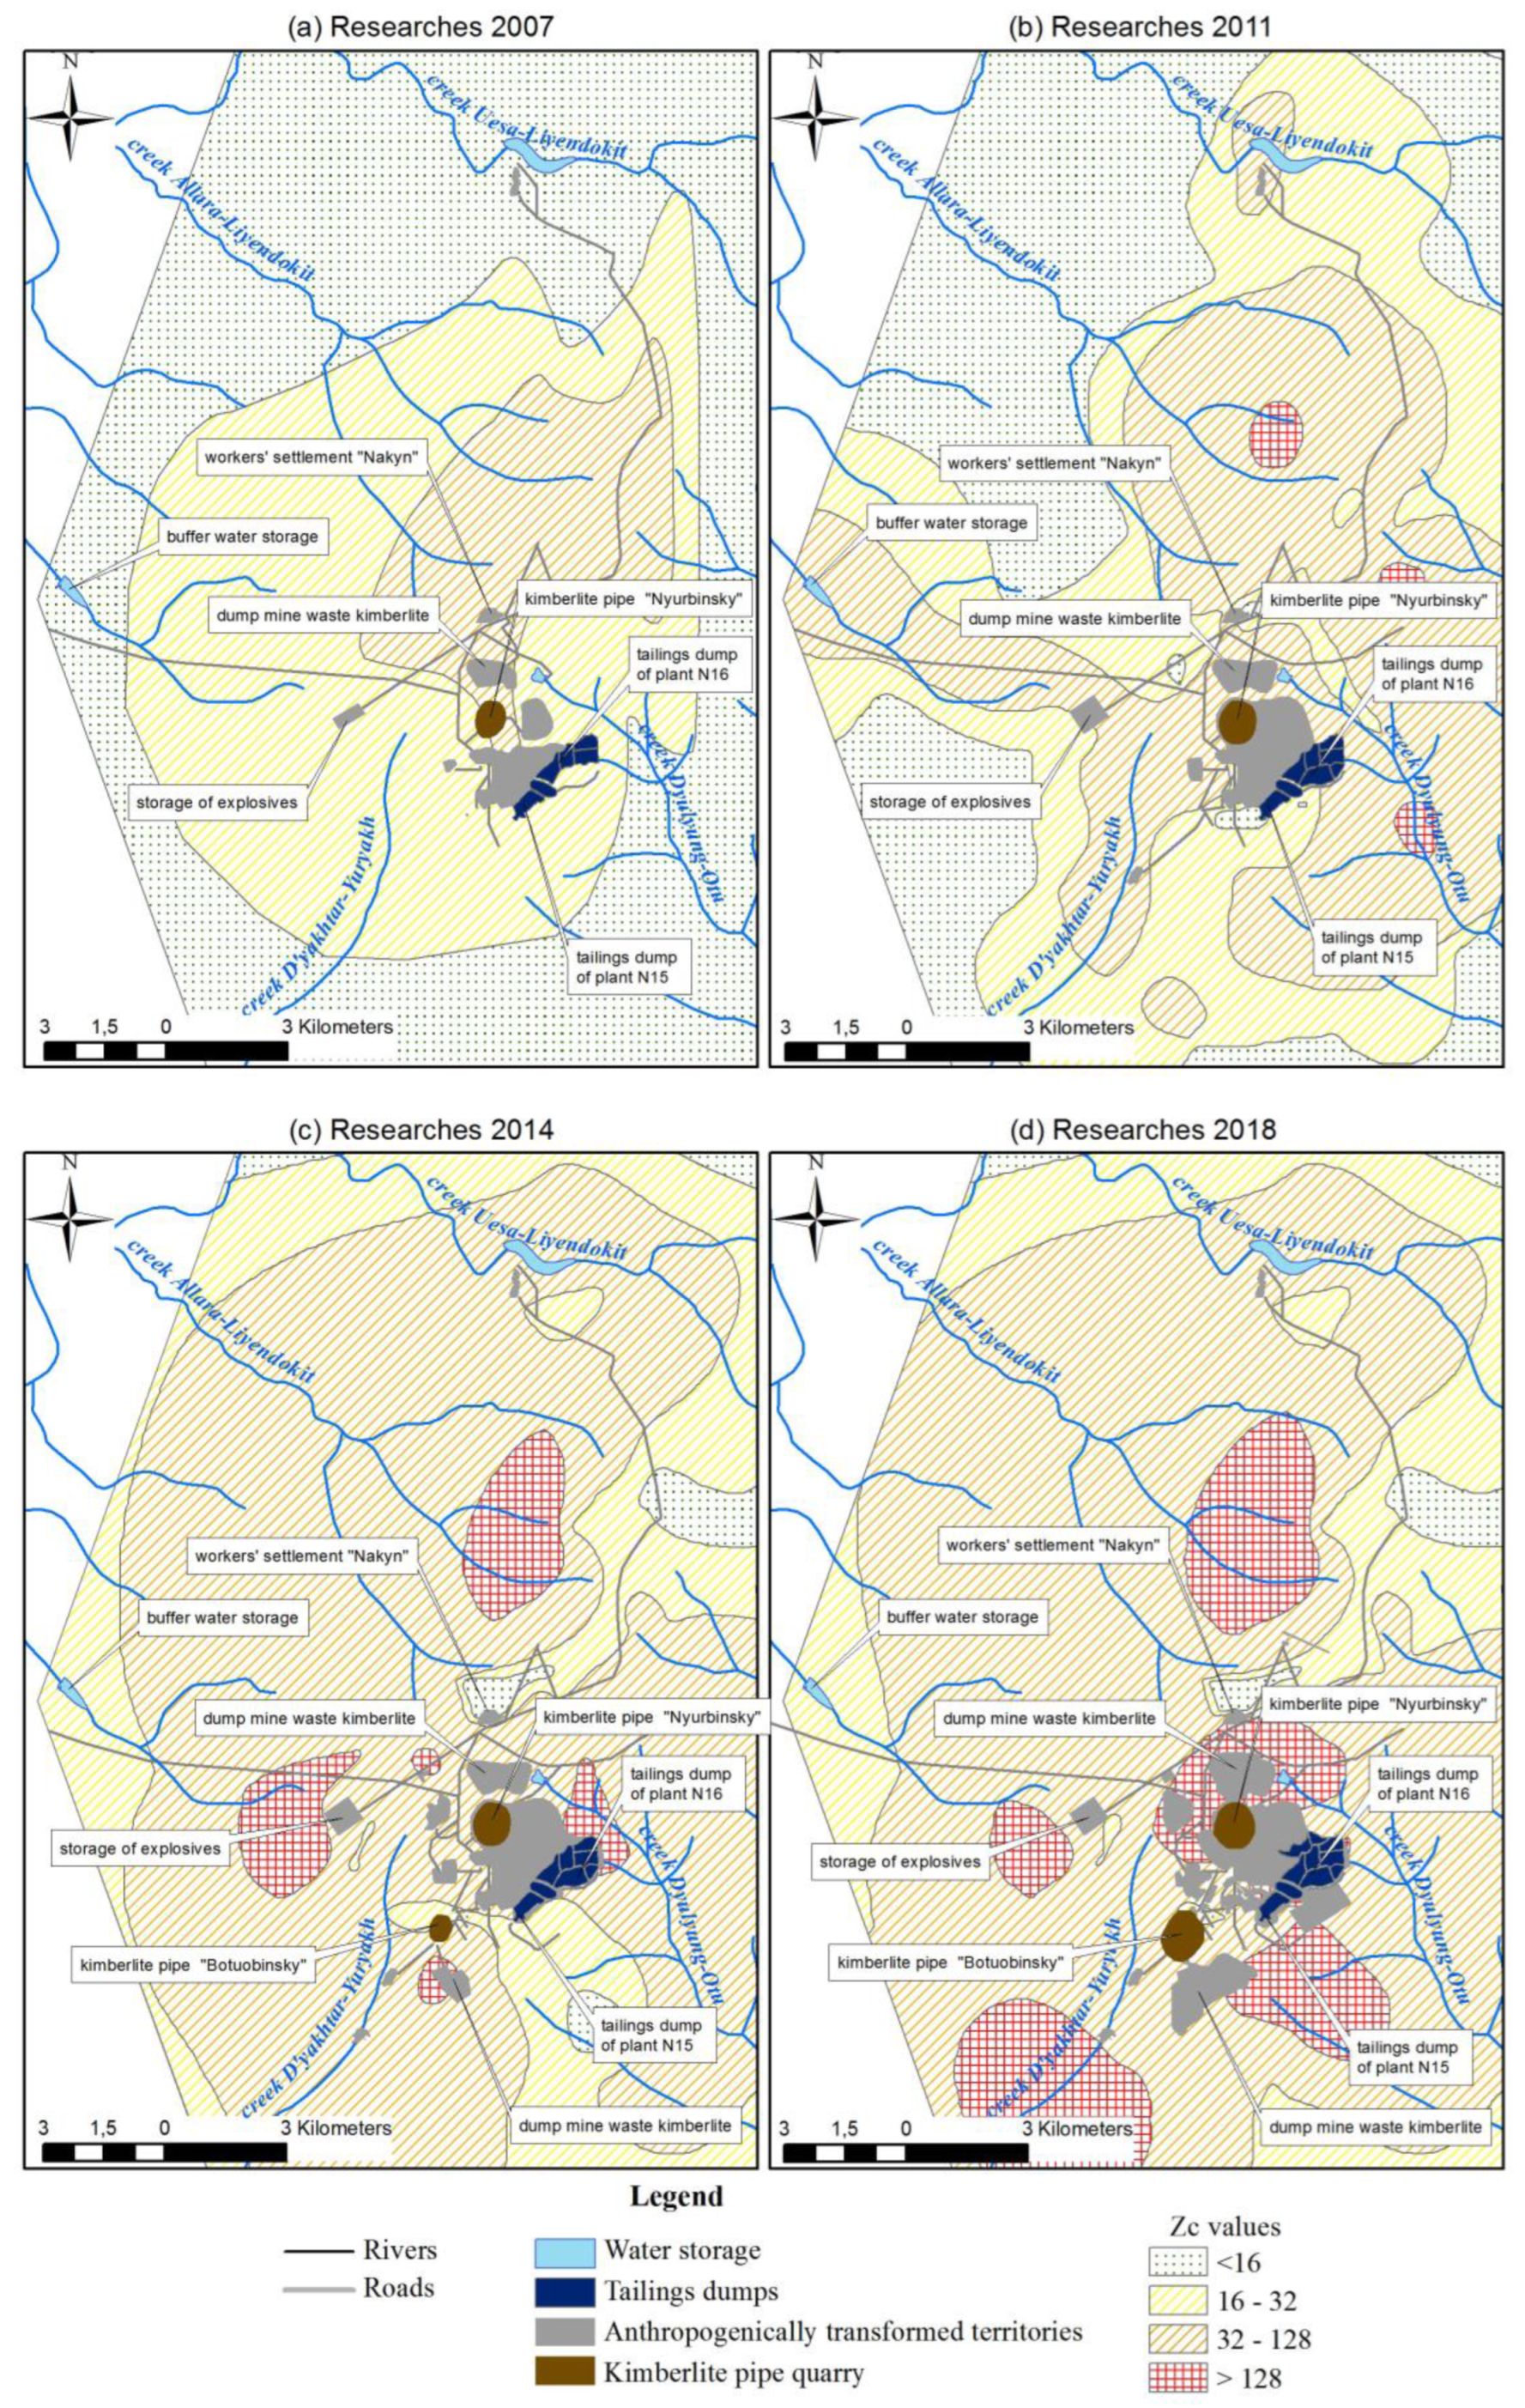
3.7. Contamination Indices

The analysis of trace element spectra during the years of research have showed a significant increase in the concentrations of mobile forms and the extension of the trace element series. By 2018, the trace element composition of the Nyurbinsky MPD industrial site’s soil cover shows an active accumulation of Mn, Zn, and Ni mobile forms with abnormally high concentration coefficients (Table 4). Geochemical spectra constructed based on concentration coefficients (Kc) revealed the transformation level of the elemental composition of soils observed throughout the study. The grounds of industrial landscapes (quarries, dumps, tailings, and spoil heaps of various uses) are characterized by the following trace element spectrum: Mn28,0→Zn8,0→Ni7,7→Cr6,8→Co4,2→As2,0.
Calculations of the total contamination of the soil cover (Zc) revealed a spatial increase in the contrast of anomalies (Figure 7). Contamination level increases in the north-western and south-eastern directions. By 2018, the ecological and geochemical setting had changed sufficiently, with the predominance of a highly hazardous level of soil cover contamination, occupying about 260.9 km2 (Table 5).

4. Discussion

The content of mobile forms of PTEs in Cryosols remains essentially the same in various types. Cryosols are generally characterized by two maxima of intra-profile distribution of mobile forms of trace elements. The first one is biogenic accumulation in the upper layer of the soil, followed by a decrease in the profile. The second maximum is located in the suprapermafrost horizon. Generally, biogenic accumulation in Cryosols is typical for mobile forms of Mn, Zn, Co, Ni, Cd, As, and partially Cu.
Outside the mining zone, Cryosols of the natural landscapes of the studied territory are characterized by biogenic accumulation of Ni, Mn, and Cd. Suprapermafrost horizons accumulate Cr, Ni, Co, Mn, and Cu (Figure 8). However, according to absolute values, the content of trace elements in the suprapermafrost horizons is higher than that of the upper organic horizons.
The Pearson correlation coefficients between elements provide valuable information about the sources of elements in the environment [58]. Positive correlations of Pb–Ni, Cd–Zn, and Co–Cu show that these metals tend to accumulate together, and the result is their co-occurrence and interdependence; they come from similar sources and migrate together [59,60].
The physicochemical properties of soils are considered to be the key factor regulating the behavior of PTEs in soil. There was an established positive relationship of pH with Pb and Ni, and a negative correlation with Cd, Co, and Zn. Harter [61] and other scientists have reported that soil pH is the main cause affecting PTEs in soil [62,63,64]. Soil pH is significant in soil processes responsible for PTEs solubility in soil and transportation [65,66]. At low pH, elements tend to be found as free ionic species or soluble organometals and are more bioavailable. Since low pH (acidic) PTEs are more soluble and more bioavailable in the soil solution, the range of pH values obtained in this study will favor plant uptake of PTEs [67]. Thus, the acidic and moderately acidic soil study area may increase in micronutrient solubility and mobility of Cd, Co, and Zn and may significantly increase their concentration in the soil. Hence, toxicity problems with these elements can be possible.
The content of organic matter in soil also affects the PTE content [68]. Organic matter content is one of the most important factors that control the accumulation, mobility, and bioavailability of PTEs in soils. An increase in soil organic matter content can lead to elevating the soil adsorption capacity by which the accumulation of PTEs will be enhanced [69]. Therefore, while pH has a significant effect on the adsorption and solubility of PTEs in soils [70], soil organic matter has a significant effect on the sorption and migration of PTEs in soils [71]. This fact suggests that pH and soil organic matter have a relationship and significant negative correlation with PTEs. The current research established a negative correlation of SOC with Zn, Cr, and Co, and a positive correlation of SOC with Ni. Previous studies have also shown that soil properties such as pH and soil organic matter are correlated with PTE concentrations in soil [72].
The correlation between PTEs has also been investigated using cluster analysis (CA). CA is usually implemented in such studies to identify sources of PTEs and to relate them as several main groups. The internal cluster homogeneity is determined according to the similarity among PTEs in soil samples [73]. Based on the results of CA, four clusters were identified: Cd–Zn, Co–Cu, Cr–As, and Pb–Ni–Mn. The close association of metals suggests that they have a common source. Mn, Co, Cr, and Ni are elements typomorphic to kimberlites, which representing the geochemical specifics of the Nakyn kimberlite field. These elements are well recognized by secondary scattering fluxes and characterize both natural and technogenic geochemical anomalies. Therefore, the elements of Mn, Co, Cu, Cr, Ni, Pb, and As may include in group of mixed anthropogenic and lithologic sources. The cluster formed by Cd and Zn may reflect anthropogenic contamination. Similar results were obtained in previous studies [74,75,76].
The PCA has been performed in this study to identify the variance of study soil samples in terms of PTE concentrations and originating sources. The calculated eigenvalues in such an analysis are usually referred to as the significance of established PCA factors, where the PCA factors of higher eigenvalues are considered to be the most significant factors [73]. Factor loading in PCA analysis shows that four factor were considered in the calculation, representing about 78,8% of PTEs variance in the obtained results.
PTEs of a substantial correlation coefficient value within the principal components is regarded as a significant parameter contributing to the variation in the results. The first principal component PC1, which accounts for 28.10% of dataset variance, exhibits a notable loadings on Zn and Cd (0.874 and 0.828, respectively), with negative loadings on As and Pb with a value of −0.623 and −0.529, respectively. The second principal component PC2, which represents 21.44% of the data set variance, has significant loadings on Ni and Mn (0.686 and 0.509, respectively), with negative loadings on Cu and Co with values of −0.676 and −0.575, respectively. Whilst, the third principal component PC3, which has 16.59 % of variability, shows considerable loading on Co (0.624) with negative loading on Cr (−0.791). The last component PC4, which represents 12.70 % of dataset variance, has significant negative loading on Mn (−0.746).
PC1 is mainly controlled by the influence of anthropogenic and industrial activities on the territory of the industrial site and vehicle emissions. These pollutants input study soils directly on the surface layer of soil in the form of re-suspended dust of soil material as a result of aerogenic spread from drilling and blasting, wind erosion of dumps, etc. According to several studies, Zn and Cd from technogenic sources were also noted in the area of activity of various industrial enterprises [77,78,79]. PC2 and PC3 include elements typomorphic to kimberlites, which are recognized by secondary scattering fluxes and characterize both natural and technogenic geochemical anomalies. Therefore, both lithogenic controls and anthropogenic sources may influence these factors. In the works of Sain R. [80], Rodriquez J. [81] obtained results where Co, Cr, and Ni were also grouped in one factor in the surface soil layer around a steel plant in China and a lead–zinc plant in Kosovo Mitrovica and, at the same time, had natural/pedogenic sources of intake. Additionally, PC4 is mainly controlled by geogenic and pedogenic sources. Many previous researches reported that Mn in soils may be controlled by the soil parent material [81,82,83].
As a result of modern anthropogenic processes, the soil cover of the Nyurbinsky MPD industrial site is currently characterized by multi-element contamination. At the present stage of studies on the territory of the Khannya–Nakyn interfluve, the ecological and geochemical condition is based on the cumulative influence of large-scale epigenetic processes of the tectonic and magmatic structure of the Nakyn kimberlite field and anthropogenic impact on the components of the ecosystem, i.e., the soil cover.
Earlier works have established [84] that the products of weathering of tholeiitic basalt rocks have a determining regional impact on the current eluvial–deluvial formations of the Khannya–Nakyn interfluve. This is reflected in the development of natural geochemical anomalies in the soil cover and is determined through the data of the secondary dispersion flows.
As discussed above, the intra-profile distribution of trace elements in Cryosols is characterized by the biogenic accumulation of Ni, Mn, and Cd. On the contrary, suprapermafrost accumulation of Cr, Ni, Co, Mn, and Cu is observed in natural unpolluted biotopes. Anthropogenic anomalies are characterized by the active accumulation of mobile forms of trace elements in the surface organic horizons of soils, with primary Zc-forming elements represented by Mn, Zn, and Ni. The formation of anthropogenic anomalies in an industrial site’s soil cover may occur due to atmospheric input of fine-grained dust products emerging during various mining operations, such as blasting workings, ore processing, and a dusting of waste dumps. Dispersion of the solid phase of dust emissions in the prevailing wind direction results in forming soils with abnormally high chemical elements. Similar conclusions were established by fellow scientists studying the soils of the Bashkir Trans-Urals based on the Uchaly geotechnical system located in the northeastern part of the Republic of Bashkortostan [4].
Therefore, the primary large-scale source of dust-scattering material lies within waste rock dumps. In short-term periods, a significant amount of the contaminant may concentrate outside the dumps. As a result, the entire area adjacent to the industrial site has been exposed to air contamination for a long period.

5. Conclusions

In this research, a study of PTE contamination in the soil of the Nakyn kimberlite field located within the Nyurbinsky MPD, Western Yakutia was conducted. The study included an assessment of multi-element contamination and source distribution. Contamination indices have been implemented and as well as multivariate statistical methods such as correlation matrix, CA, and PCA.
Correlation matrix, CA, and PCA revealed three distinct sources that could be considered for the investigated PTEs: anthropogenic, lithogenic, and the source comes from a mixed contribution of anthropogenic and lithogenic factors. The greatest anthropogenic contribution in PTEs in the study area appears in Zn, Cd, As, and Pb. According to the assessment, the origin of Mn in the area is most likely to be from a natural source. The content of Co, Cr, and Ni are controlled by both lithogenic control and anthropogenic sources.
The peculiarity of intraprofile distribution of mobile forms of trace elements of the studied types of Crysols in natural landscapes is presented by two maxima: the first peak belongs to the biogenic accumulation in the upper organic horizon, with a subsequent decrease down the profile, while the second peak lies in the suprapermafrost horizon. Biogenic accumulation is typical for mobile forms of Ni, Mn, and Cd, while mobile forms of Cr, Ni, Co, Mn, and Cu are characterized by suprapermafrost accumulation. There are no significant changes in the main geochemical parameters of the soil cover, provided that the morphology of the soil profile is preserved. However, there are exceptions to the sites that have been directly impacted during mining operations, such as land disturbances and landscape transformations.
The soil surface of the Nurbinsky MPD industrial site, at the time of the study, is characterized by a multi-element composition of natural and technogenic anomalies. Calculation of the total soil contamination index (Zc) revealed a spatial increase in areas with high and very high categories of contamination. The main Zc-forming elements included in the geochemical association are Mn, Zn, and Ni.

Author Contributions

Conceptualization, A.G. and Y.L.; methodology, Y.L. and V.P.; software, A.G. and V.M.; formal analysis, A.G. and V.M.; investigation, A.G.; data curation, O.S.; writing—original draft preparation, Y.L. and A.G.; writing—review and editing, A.G., O.S. and V.P.; validation, A.G.; visualization, V.M.; supervision, Y.L.; project administration, Y.L.; Resources, Y.L. and O.S. All authors have read and agreed to the published version of the manuscript.

Funding

Field research: chemical and analytical, and cartographic work was carried out within the framework of the project Ministry of education of the Russian Federation—FSRG-2020-0018 “Study of the peculiarities of the functioning of the Arctic and subarctic ecosystems of Yakutia under the conditions of increasing anthropogenic impact and global climate change”. The generalization and interpretation of all material were carried out according to the project Ministry of education of the Russian Federation FUEM-2019-0003 “Evolution of the earth’s crust of the North Asian craton, basic-ultrabasic and kimberlite magmatism, diamond content of the Yakutsk kimberlite province”.

Data Availability Statement

Not applicable.

Acknowledgments

Many thanks go to Vasiliy Boeskorov for the support during field work.

Conflicts of Interest

The authors declare no conflict of interest.

References

  1. Slavikovsky, O.V.; Slavikovsky, Y.V.; Valiev, N.N. The geotechnologies subsurface free space as a fundamental factor of the mining complex impact on the environment. News of the Higher Institutions. Mining J. 2011, 2, 70–75. [Google Scholar]
  2. Zenkov, I.V. Review of foreign researches in the field of mining ecology. Mining J. 2016, 10, 96–99. [Google Scholar] [CrossRef]
  3. Aklambetova, K.M. Environmental consequences of mining operations and their impact on the environment. In Proceedings of the International Conference Proceedings. Current Problems of Human Health and the Formation of the Environment, Karaganda, Russia, 22 May 2002; pp. 23–27. [Google Scholar]
  4. Shafigulina, G.T.; Udachin, V.N.; Filippova, K.A.; Aminov, P.G. Geochemical characteristics of technogenic soils of the Southern Ural mining landscapes. Her. ASRB 20 2015, 4, 93–101. [Google Scholar]
  5. Sarapulova, G.I. Environmental Geochemical Assessment of Technogenic Soils. J. Mining Inst. 2018, 234, 658–662. [Google Scholar] [CrossRef] [Green Version]
  6. Loska, K.; Wiechula, D.; Korus, I. Metal contamination of farming soils affected by industry. Environ. Int. 2004, 30, 159–165. [Google Scholar] [CrossRef] [PubMed]
  7. Freytag, K.; Pulz, K. The New Federal Nature Conservation Act from the perspective of mining projects. World Min. Surf. Undergr. 2010, 62, 214–221. [Google Scholar]
  8. Kulik, L.; Stemann, H. Ecology and biodiversity protection in the Rhenish lignite mining area. World Min. Surf. Undergr. 2014, 66, 143–152. [Google Scholar]
  9. Basova, I.A.; Ioina, M.A.; Glukhova, E.N. Geoecological state of soil cover in mining regions. Izv. TulGU Earth Sci. 2010, 1, 16–20. [Google Scholar]
  10. Naeth, M.A.; Wilkinson, S.R. Establishment of Restoration Trajectories for Upland Tundra Communities on Diamond Mine Wastes in the Canadian Arctic. Restor. Ecol. 2014, 22, 534–543. [Google Scholar] [CrossRef]
  11. Sena, K.; Barton, C.; Hall, S.; Angel, P.; Agouridis, C.; Warner, R. Influence of spoil type on afforestation success and natural vegetative recolonization on a surface coal mine in Appalachia, United States. Restor. Ecol. 2015, 23, 131–138. [Google Scholar] [CrossRef]
  12. Niu, F.; Gao, Z.; Lin, Z.; Luo, J.; Fan, X. Vegetation influence on the soil hydrological regime in permafrost regions of the Qinghai–Tibet Plaeau, China. Geoderma 2019, 354, 113892. [Google Scholar] [CrossRef]
  13. Lark, R.M.; Bellamy, P.H.; Rawlins, B.G. Spatio-temporal variability of some metal concentrations in the soil of eastern England, and implications for soil monitoring. Geoderma 2006, 133, 363–379. [Google Scholar] [CrossRef]
  14. Gowd, S.S.; Reddy, M.R.; Govil, P.K. Assessment of heavy metal contamination in soils at Jajmau (Kanpur) and Unnao industrial areas of the Ganga Plain, Uttar Pradesh, India. J. Hazard. Mater. 2010, 174, 113–121. [Google Scholar] [CrossRef] [PubMed]
  15. Fonseca, B.; Figueiredo, H.; Rodrigues, J.; Queiroz, A.; Tavares, T. Mobility of Cr, Pb, Cd, Cu and Zn in a loamy sand soil: A comparative study. Geoderma 2011, 164, 232–237. [Google Scholar] [CrossRef] [Green Version]
  16. Ribas, C.R.; Schoereder, J.H.; Schmidt, F.A.; Solar, R.R.C.; Valentim, C.L.; Campos, R.B.F. Ants as indicators of the success of rehabilitation efforts in deposits of gold mining ailings. Restor. Ecol. 2012, 20, 712–720. [Google Scholar] [CrossRef]
  17. Myga-Pigte, K.U. Landscape Management on post-Exploitation Land using the Example of the Silesian Region, Poland. Environ. Socio-Econ. Stud. 2014, 2, 1–8. [Google Scholar] [CrossRef] [Green Version]
  18. Prach, K.; Karesova, P.; Jírova, A.; Dvo Kova, H.; Konvalinkova, P.; Ehounková, K. Do not neglect surroundings in restoration of disturbed sites. Restor. Ecol. 2015, 23, 310–314. [Google Scholar] [CrossRef]
  19. Mikhalchuk, N.V. Mobile forms of heavy metals and trace elements in soils of the carbonate range of the south-west Belarus. In Proceedings of the National Academy of Sciences of Belarus: Chemical Series; National Academy of Sciences of Belarus: Minsk, Belarus, 2017; 3, pp. 90–97. [Google Scholar]
  20. Targulian, V.O.; Goryachkina, S.V. Soil Memory: Soil as the Memory of Biosphere–Geosphere–Anthropogenic Interactions; Russian Academy of Sciences: Moscow, Russia, 2008; p. 692. [Google Scholar]
  21. Kloet, S.P.V.; Avery, T.S.; Kloe, P.J.V.; Milton, R. Restoration ecology: Aiding and abetting secondary succession on abandoned peat mines in Nova Scotia and New Bruns-wick Canada. Mires Peat 2012, 10, 1–20. [Google Scholar]
  22. Yanin, E.P. Chemical composition and ecological and geochemical features of urban soils. Analytical review. Probl. Environ. Nat. Resour. 2020, 2, 40–73. [Google Scholar]
  23. Mitrofanov, A.; Zayats, D. The largest industry of the largest federal subject in the largest economic region. Geography 2008, 11, 1–9. [Google Scholar]
  24. Gorev, N.I.; Gerasimchuk, A.V.; Protsenko, E.V.; Tolstov, A.V. Tectonic aspects of the Vilyui-Markha structure and their use in kimberlite fieldsforecasting. Educ. Sci. J. 2011, 3, 5–10. [Google Scholar]
  25. WRB. World Reference Base for Soil Resources 2014 (Updated in 2015). In International Soil Classification System for Naming Soils and Creating Legends for Soil Maps; World Soil Resources Reports No. 106; FAO: Rome, Italy, 2015. [Google Scholar]
  26. Ostrikova, K.T. Field Guide to Soils; Soil Institute in Name of V.V. Dokuchaev: Moscow, Russia, 2008; p. 182. [Google Scholar]
  27. ISO 11464-2015; Soil Quality. Pretreatment of Samples for Physico-Chemical Analysis. Inter-Governmental Council on Standardization, Metrology and Certification 77-Π: Moscow, Russia, 2015.
  28. GOST-26483-85; Soils. Preparation of Salt Extract and Determination of Its pH by CINAO Method. State Standard of the Union of SSR. GOST: Moscow, Russia, 1985.
  29. NF X-31-103; Determination du pH dans l’eau—Methode Electrometrique; Qualite des Sols. Association Française de Normalization: Paris, France, 1998.
  30. GOST-26213-91; Soils. Methods for Determination of Organic Matter. State Standard of the Union of SSR. GOST: Moscow, Russia, 1991.
  31. NF X-31-109; Determination du Carbone Organique par Oxidation Sulfochromique; Qualite des Sols. Association Française de Normalization: Paris, France, 1993.
  32. GOST R 58596-2019; Soils. Methods for Determining Total Nitrogen. National standard of the Russian Federation. GOST: Moscow, Russia, 2019.
  33. NF ISO 11261; Dosage de L’azote Total—Methode de Kjeldahl Modifiee; Qualite des Sols. Association Française de Normalization: Paris, France, 1995.
  34. Avery, B.W.; Bascomb, C.L. Soil Survey Laboratory Methods. Technical Monograph (Soil Survey of England and Wales), 6; Rothamsted Experimental Station: Harpenden, UK, 1974; p. 83. [Google Scholar]
  35. Method M 03-07-2014; Measurement of the Mass Fraction of Elements (As, Cd, Co, Cr, Cu, Hg, Mn, Ni, Pb, V, Zn) in Samples of Soil, Subsoil, Bottom Sediments and Sewage Sludge, FER 16.1:2:2.2:2.3.63-09. 2014. FGU “Federal Center for Analysis and Evaluation Technogenic Impact”: Moscow, Russia, 2009; p. 22.
  36. Ilyin, V.B. Heavy Metals in the Soil-Plant System; Nauka: Novosibirsk, Russia, 1991; p. 150. [Google Scholar]
  37. Ladonin, D.V. Compounds of heavy metals in soils—Problems and methods of study. Soil Sci. 2002, 6, 682–692. [Google Scholar]
  38. Syso, A.I. Mechanisms of Distribution of Chemical Elements in Soil-Forming Rocks and Soils of the Western Siberia; SB RAS: Novosibirsk, Russia, 2007; p. 227. [Google Scholar]
  39. Šmejkalová, M.; Mikanová, O.; Borůvka, L. Effects of heavy metal concentrations on biological activity of soil micro-organisms. Plant Soil Environ. 2003, 49, 321–326. [Google Scholar] [CrossRef] [Green Version]
  40. Aitchison, J. The Statistical Analysis of Compositional Data; Chapman and Hall: London, UK, 1986; p. 416. [Google Scholar]
  41. Aitchison, J. The Statistical Analysis of Compositional Data; Blackburn Press: Caldwell, NJ, USA, 2003; p. 460. [Google Scholar]
  42. Pawlowsky-Glahn, V.; Buccianti, A. Compositional Data Analysis: Theory and Applications; Wiley: Chichester, UK; West Sussex, UK, 2011. [Google Scholar]
  43. Motyka, O.; Pavlíková, I.; Bitta, J.; Frontasyeva, M.; Jančík, P. Moss Biomonitoring and Air Pollution Modelling on a Regional Scale: Delayed Reflection of Industrial Pollution in Moss in a Heavily Polluted Region? Environ. Sci. Pollut. Res. 2020, 27, 32569–32578. [Google Scholar] [CrossRef]
  44. Hristozova, G.; Marinova, S.; Motyka, O.; Svozilík, V.; Zinicovscaia, I. Multivariate Assessment of Atmospheric Deposition Studies in Bulgaria Based on Moss Biomonitors: Trends between the 2005/2006 and 2015/2016 Surveys. Environ. Sci. Pollut. Res. 2020, 27, 39330–39342. [Google Scholar] [CrossRef]
  45. Mullineaux, S.T.; McKinley, J.M.; Marks, N.J.; Scantlebury, D.M.; Doherty, R. Heavy Metal (PTE) Ecotoxicology, Data Review: Traditional vs. a Compositional Approach. Sci. Total Environ. 2021, 769, 145246. [Google Scholar] [CrossRef] [PubMed]
  46. Reimann, C.; Filzmoser, P.; Fabian, K.; Hron, K.; Birke, M.; Demetriades, A.; Dinelli, E.; Ladenberger, A.; Gemas Project Team. The concept of compositional data analysis in practice—Total major element concentrations in agricultural and grazing land soils of Europe. Sci. Total Environ. 2012, 426, 196–210. [Google Scholar] [CrossRef]
  47. Aitchison, J. The statistical analysis of compositional data. J. R. Stat. Soc. Ser. B 1982, 44, 139–160. [Google Scholar] [CrossRef]
  48. Lawley, C. Compositional symmetry between Earth’s crustal building blocks. Geochem. Perspect. Lett. 2016, 2, 117–126. [Google Scholar] [CrossRef] [Green Version]
  49. RD 52.18.718-2008; Organization and Procedure for Monitoring Soil Pollution by Toxicants of Industrial Origin. Roshydromet: Obniinsk, Russia, 2008; p. 77.
  50. Saet, Y.E.; Revich, B.A.; Yanin, E.P. Geochemistry of the Environment; Nedra: Moscow, Russia, 1990; p. 335. [Google Scholar]
  51. Legostaeva, Y.B.; Ksenofontova, M.I.; Dyagileva, A.G. Ecological and geochemical monitoring of soil cover in the impact zone of the Nyurbinsky MPD. Mining J. 2014, 4, 117–121. [Google Scholar]
  52. Gololobova, A.G.; Legostaeva, Y.B. Heavy metals in cryozems of Western Yakutia. In Proceedings of the 9th International Multidisciplinary Scientific GeoConference on Water Resources—Forest, Marine and Ocean Ecosystems, Sofia, Bulgaria, 30 June–6 July 2019; pp. 239–246. [Google Scholar] [CrossRef]
  53. Goryachkin, S.V. Soil Cover of the North (Structure, Genesis, Ecology, Evolution); GEOS: Moscow, Russia, 2010; p. 414. [Google Scholar]
  54. Lessovaia, S.N.; Goryachkin, S.V.; Desyatkin, R.V.; Okoneshnikova, M.V. Pedoweathering and Mineralogical Change in Cryosols in an Ultracontinental Climate (Central Yakutia, Russia). Acta Geodyn. Geomater. 2013, 10, 465–473. [Google Scholar] [CrossRef] [Green Version]
  55. Karimi, N.; Mohammad, T.; Tabatabaii, S.M.; Gholami, A. Geochemical assessment of steel smelter-impacted urban soils, Ahvaz, Iran. J. Geochem. Explor. 2015, 152, 91–109. [Google Scholar] [CrossRef]
  56. Pan, H.; Lu, X.; Lei, K. A comprehensive analysis of heavy metals in urban road dust of Xi’an, China: Contamination, source apportionment and spatial distribution. Sci. Total Environ. 2017, 609, 1361–1369. [Google Scholar] [CrossRef]
  57. Kaiser, H.F. The application of electronic computers to factor analysis. Edu. Psychol. Meas. 1960, 20, 141–151. [Google Scholar] [CrossRef]
  58. Gopal, V.; Krishnakumar, S.; Simon Peter, T.; Nethaji, S.; Suresh Kumar, K.; Jayaprakash, M.; Magesh, N.S. Assessment of trace element accumulation in surface sediments off Chennai coast after a major flood event. Mar. Pollut. Bull. 2017, 114, 1063–1071. [Google Scholar] [CrossRef] [PubMed]
  59. Robertson, D.J.; Taylor, K.G.; Hoon, S.R. Geochemical and mineral magnetic characterisation of urban sediment particulates, Manchester, UK. Appl. Geochem. 2003, 18, 269–282. [Google Scholar] [CrossRef]
  60. Bhuiyan, M.A.H.; Parvez, L.; Islam, M.A.; Dampare, S.B.; Suzuki, S. Heavy metal pollution of coal mine-affected agricultural soils in the northern part of Bangladesh. J. Hazard. Mater. 2010, 173, 384–392. [Google Scholar] [CrossRef] [PubMed]
  61. Harter, R.D. Effect of Soil pH on Adsorption of Lead, Copper, Zinc, and Nickel. Soil Sci. Soc. Am. J. 1983, 47, 47–51. [Google Scholar] [CrossRef]
  62. Levi, M.R.; Shaw, J.N.; Wood, C.W.; Hermann, S.M.; Carter, E.A.; Feng, Y. Land Management Effects on Near-Surface Soil Properties of Southeastern U.S. Coastal Plain Kandiudults. Soil Sci. Soc. Am. J. 2010, 74, 258–271. [Google Scholar] [CrossRef] [Green Version]
  63. Schipper, L.A.; Sparling, G.P. Performance of soil condition indicators across taxonomic groups and land uses. Soil Sci. Soc. Am. J. 2000, 64, 300–311. [Google Scholar] [CrossRef]
  64. Korkanc, S.Y.; Ozyuvac, N.; Hizal, A. Impacts of land use conversion on soil properties and soil erodibility. J. Environ. Biol. 2008, 29, 363–370. [Google Scholar] [PubMed]
  65. Fijałkowski, K.; Kacprzak, M.; Grobelak, A.; Placek, A. The influence of selected soil parameters on the mobility of heavy metals in soils. Inżynieria Ochr. Sr. 2012, 5, 81–92. [Google Scholar]
  66. Rodriguez, J.A.; Nanos, N.; Grau, J.M.; Gil, L.; Lopez-Arias, M. Multiscale analysis of heavy metal contents in Spanish agricultural topsoils. Chemosphere 2008, 70, 1085–1096. [Google Scholar] [CrossRef] [Green Version]
  67. Amos-Tautua, B.M.; Onigbinde, A.O.; Ere, D. Assessment of some heavy metals and physicochemical properties in surface soils of municipal open waste dumpsite in Yenagoa, Nigeria. Afr. J. Environ. Sci. Technol. 2014, 8, 41–47. [Google Scholar] [CrossRef]
  68. Xiao, R.; Zhang, M.; Yao, X.; Ma, Z.; Yu, F.; Bai, J. Heavy metal distribution in different soil aggregate size classes from restored brackish marsh, oil exploitation zone, and tidal mud flat of the Yellow River Delta. J. Soils Sediments 2015, 16, 821–830. [Google Scholar] [CrossRef]
  69. Qishlaqi, A.; Moore, F. Statistical Analysis of Accumulation and Sources of Heavy Metals Occurrence in Agricultural Soils of Khoshk River Banks, Shiraz, Iran. Am.-Eurasian J. Agric. Environ. Sci. 2007, 2, 565–573. [Google Scholar]
  70. Khan, S.; Cao, Q.; Zheng, Y.M.; Huang, Y.Z.; Zhu, Y.G. Health risks of heavy metals in contaminated soils and food crops irrigated with wastewater in Beijing, China. Environ. Pollut. 2008, 152, 686–692. [Google Scholar] [CrossRef] [PubMed]
  71. Pontoni, L.; van Hullebusch, E.; Pechaud, Y.; Fabbricino, M.; Esposito, G.; Pirozzi, F. Colloidal Mobilization and Fate of Trace Heavy Metals in Semi-Saturated Artificial Soil (OECD) Irrigated with Treated Wastewater. Sustainability 2016, 8, 1257. [Google Scholar] [CrossRef] [Green Version]
  72. Martin, H.W.; Kaplan, D.I. Temporal changes in cadmium, thallium, and vanadium mobility in soil and phytoavailability under field conditions. Water Air Soil Pollut. 1998, 101, 399–410. [Google Scholar] [CrossRef]
  73. Issa, H.M.; Alshatteri, A.H. Heavy Metals Contamination in Agricultural Soils of Middle Basin of Sirwan (Diyala) River, East Iraq: Multivariate Analysis, Risk Assessment, Source Apportionment, and Spatial Distribution. J. Mater. Environ. Sci. 2021, 12, 391–405. [Google Scholar]
  74. Zamani, A.; Yaftian, M.R.; Parizanganeh, A. Statistical evaluation of topsoil heavy metal pollution around a lead and zinc production plant in Zanjan province, Iran. Caspian J. Environ. Sci. 2015, 13, 349–361. [Google Scholar]
  75. Li, D.; Wu, D.; Xu, F.; Lai, J.; Li, S. Assessment of soil and maize contamination by TE near a coal gangue–fired thermal power plant. Environ. Monit. Assess. 2020, 192, 541. [Google Scholar] [CrossRef]
  76. Sohrabizadeh, Z.; Sodaeizadeh, H.; Hakimzadeh, M.A.; Taghizadeh-Mehrjardi, R.; Ghanei Bafghi, M.J. A statistical approach to study the spatial heavy metal distribution in soils in the Kushk Mine, Iran. Geosci. Data J. 2022, 1–13. [Google Scholar] [CrossRef]
  77. Huang, S.; Tu, J.; Liu, H.; Hua, M.; Liao, Q.; Feng, J.; Weng, Z.; Huang, G. Multivariate analysis of trace element concentrations in atmospheric deposition in the Yangtze River Delta, East China. Atmos. Environ. 2009, 43, 5781–5790. [Google Scholar] [CrossRef]
  78. Kabata-Pendias, A. Trace Elements in Soils and Plants, 4th ed.; CRS Press: Boca Raton, FL, USA, 2011; p. 548. [Google Scholar]
  79. Li, S.; Yang, L.; Chen, L.; Zhao, F.; Sun, L. Spatial distribution of heavy metal concentrations in peri-urban soils in eastern China. Environ. Sci. Pollut. Res. 2019, 26, 1615–1627. [Google Scholar] [CrossRef] [PubMed]
  80. Šajn, R.; Aliu, M.; Stafilov, T.; Alijagić, J. Heavy metal contamination of topsoil around a lead and zinc smelter in Kosovska Mitrovica/Mitrovicë, Kosovo/Kosovë. J. Geochem. Explor. 2013, 134, 1–16. [Google Scholar] [CrossRef]
  81. Rodríguez Martín, J.A.; Arias, M.L.; Grau Corbí, J.M. Heavy metals contents in agricultural topsoils in the Ebro basin (Spain). Application of the multivariate geoestatistical methods to study spatial variations. Environ. Pollut. 2007, 144, 1001–1012. [Google Scholar] [CrossRef]
  82. Yuan, Y.; Zhang, C.; Zeng, G.; Liang, J.; Guo, S.; Huang, L.; Wu, H.; Hua, S. Quantitative assessment of the contribution of climate variability and human activity to streamflow alteration in Dongting Lake, China. Hydrol. Process. 2016, 30, 1929–1939. [Google Scholar] [CrossRef]
  83. Zeng, G.; Liang, J.; Guo, S.; Shi, L.; Xiang, L.; Li, X.; Du, C. Spatial analysis of human health risk associated with ingesting manganese in Huangxing Town, Middle China. Chemosphere 2009, 77, 368–375. [Google Scholar] [CrossRef]
  84. Yagnyshev, B.S.; Yagnysheva, T.A.; Zinchuk, M.N.; Legostaeva, Y.B. Ecology of Western Yakutia (Geochemistry of Geosystems: State and Problems); YSC SB RAS: Yakutsk, Russia, 2005; p. 432. [Google Scholar]
Figure 1. Location of the study area: (a) location of the study area on the map of Russia, (b) photo of the Nyurbinsky mining and processing division territory, (c) soil sampling scheme, (d) photo of plant no. 16, and (e) Nurbinsky and Botuobinsky open pits.
Minerals 12 01518 g001
Figure 2. Soil profiles of the dominant types of Cryosols in the The Khannya–Nakyn interfluve (photo by V. Boeskorov, A. Gololobova; date of photo: 16.08.2018): (a) Turbic Cryosols (Reductaquic), P-33-H, 65°00′33.1″ N, 117°05′35.0″ E; (b) Turbic Gleyic Cryosols (Reductaquic), P-28-H, 64°59′51.5″ N, 117°05′03.2″ E; (c) Turbic Gleyic Natric Cryosols (Reductaquic), P-34-H, 65°01′48.6″ N, 117°05′20.1″ E; (d) Larch-tree with birch, ledum-blueberry.
Minerals 12 01518 g002
Figure 3. Sites of soil sections in the waste rock impact zone of the Botuobinsky tube quarry (photo by V. Boeskorov; date of photo: 17.08.2018): arrow—location of the waste dumpsite: (a) 50 m to West from the spoil dump—TSFs, H-61, 65°00′08.9″ N, 117°02′35.2″ E; (b) 100 m to the west from the spoil dump—chemically contaminated Turbic Cryosols, H-62, 65°00′26.2″ N; 117°03′01.6″ E.
Minerals 12 01518 g003
Figure 4. PTE histograms for raw data (a) and clr-transformed data (b).
Minerals 12 01518 g004
Figure 5. Correlation plot of the soil PTE contents with main physicochemical properties. * Correlation is significant at the 0.05 level, ** correlation is significant at the 0.01 level. SOC—soil organic carbon.
Minerals 12 01518 g005
Figure 6. Dendrogram results of cluster analysis for PTEs in the study area.
Minerals 12 01518 g006
Figure 7. Dynamics of the index of total soil contamination (Zc), 2007–2018: (a) 2007; (b) 2011; (c) 2014; (d) 2018.
Minerals 12 01518 g007
Figure 8. The nature of the accumulation of trace elements in the soil profile of the dominant subtypes of Cryosols of the Khannya–Nakyn interfluve.
Minerals 12 01518 g008
Table 1. Physicochemical and mobile forms of PTE characteristics of dominant subtypes of soils of the Khannya–Nakyn interfluve.
IndexSubtypes of Cryosols, Depth (cm)
Turbic Gleyic Cryosols (Reductaquic)Turbic Cryosols (Reductaquic)Turbic Gleyic Natric Cryosols (Reductaquic)
0–6(14)6(14)–43(50)43(50)–80(83)80(83)–∞0–5(10)5(10)–35(45)35(45)–∞0–40(42)40(42)–61(72)61(72)–∞
Physicochemical propertiespH5.0 ± 0.16.2 ± 0.17.0 ± 0.17.0 ± 0.15.5 ± 0.16.5 ± 0.16.3 ± 0.15.3 ± 0.16.7 ± 0.17.0 ± 0.1
Humus, %6.8 ± 0.71.4 ± 0.11.9 ± 0.20.9 ± 0.12.7 ± 0.31.3 ± 0.12.7 ± 0.34.9 ± 0.50.9 ± 0.10.7 ± 0.1
SOC, %3.9 ± 0.40.8 ± 0.11.1 ± 0.10.5 ± 0.11.6 ± 0.20.8 ± 0.11.6 ± 0.20.5 ± 0.10.4 ± 0.11.1 ± 0.1
TN, %0.20 ± 0.010.16 ± 0.010.13 ± 0.010.13 ± 0.010.16 ± 0.010.16 ± 0.010.17 ± 0.010.16 ± 0.010.16 ± 0.010.17 ± 0.01
Exchangeable Ca, meq/100 g15.0 ± 0.819.3 ± 0.923.1 ± 1.218.8 ± 0.910.1 ± 0.512.5 ± 0.614.6 ± 0.78.4 ± 0.415.6 ± 0.814.8 ± 0.7
Exchangeable Mg, meq/100 g7.8 ± 0.410.3 ± 0.55.3 ± 0.37.5 ± 0.44.9 ± 0.26.6 ± 0.35.3 ± 0.34.3 ± 0.27.0 ± 0.47.9 ± 0.4
SOC/TN19.55.18.84104.89.332.26.6
Granulometric fractions1–0.25 mm9.953.514.4311.4116.629.227.653.011.911.11
0.25–0.05 mm57.8158.5155.5370.9362.1060.6664.5569.2776.3556.17
0.05–0.01 mm9.0011.8411.886.684.864.905.7814.248.3222.18
0.01–0.005 mm3.544.887.583.163.385.004.681.661.705.32
0.005–0.001 mm8.326.888.683.366.169.049.663.724.529.60
<0.001 mm11.3814.3811.904.466.888.147.688.107.205.62
<0.01 mm23.226.128.21116.425.22213.513.421
>0.01 mm76.873.971.88983.674.87886.586.679
Potentially toxic
elements (PTEs)
Pb, mg/kg3.84 ± 0.922.12 ± 0.512.25 ± 0.541.42 ± 0.344.21 * ± 1.012.81 ± 0.672.96 ± 0.712.62 ± 0.632.2 ± 0.532.21 ± 0.53
Ni, mg/kg2.55 ± 0.615.25 * ± 1.265.02 * ± 1.203.78 ± 0.914.52 * ± 1.084.24 * ± 1.025.12 * ± 1.231.49 ± 0.363.38 ± 0.814.68 ± 1.12
Mn, mg/kg22.87 * ± 5.4941.75 * ± 10.0246.5 * ± 11.1643.81 * ± 10.5155.78 * ± 13.3938.88 * ± 9.3339.43 * ± 9.0515.23 ± 3.3627.35 * ± 6.5639.55 * ± 9.49
Cd, mg/kg0.023 * ± 0.0060.011 ± 0.0030.014 * ± 0.0030.016 * ± 0.0040.022 ± 0.0050.008 * ± 0.0020.015 * ± 0.0040.006 ± 0.0010.008 ± 0.0020.019 ± 0.005
Co, mg/kg1.51 ± 0.362.42 ± 0.582.54 ± 0.612.2 ± 0.532.3 ± 0.551.96 ± 0.472.27 ± 0.541.53 ± 0.372.16 ± 0.522.49 ± 0.60
Cr, mg/kg2.18 ± 0.522.61 ± 0.632.49 ± 0.603.3 ± 0.792.25 ± 0.542.21 ± 0.532.12 ± 0.511.71 ± 0.412.11 ± 0.511.84 ± 0.44
Zn, mg/kg4.46 ± 1.076.76 ± 1.627.48 ± 1.86.21 ± 1.493.74 ± 0.96.35 ± 1.526.92 ± 1.564.55 ± 1.095.14 ± 1.237.06 ± 1.69
Cu, mg/kg4.83 ± 0.0166.65 ± 1.68.12 ± 1.953.86 ± 0.937.69 ± 1.857.89 ± 1.8910.44 ± 2.512.1± 0.502.86 ± 0.694.67 ± 1.12
As, mg/kg0.25 ± 0.06<0.050.07 ± 0.02<0.050.22 ± 0.05<0.05<0.05<0.05<0.05<0.05
Note: SOC—soil organic carbon; TN—total nitrogen; * indicates values exceeding background levels.
Table 2. Descriptive statistics for PTEs.
PTE, mg/kgBackground Values, mg/kgRaw DataClr-Transformed Data
MeanMedianMinMaxCVSDT.Mean 5%MeanMedianCVSDT.Mean 5%
Pb2.887.307.352.1514.36.462.547.250.780.790.340.580.78
Ni1.776.495.210.8528.117.44.176.040.570.520.300.550.54
Mn13.2394.9261.915.92983260,897510.8311.84.364.400.900.954.36
Cd0.030.070.020.000.380.010.100.06−4.67−4.811.241.114.66
Co2.145.904.200.0469.689.69.464.60−0.340.232.091.440.28
Cr4.7021.44.260.28734.0905695.27.070.430.171.281.130.33
Zn6.3115.712.20.5073.127416.513.60.921.251.261.120.97
Cu11.511.59.911.15104.0183.613.69.701.010.900.320.570.99
As0.220.130.030.031.250.040.200.10−3.89−4.021.291.133.93
Note: CV—coefficient variation; SD—Standard Deviation; T.Mean 5%—Trimmed Mean.
Table 3. The result of principal component analysis.
PTEFactor Load after Rotat
PC1PC2PC3PC4
Pb−0.529 *0.3780.1670.498
Ni−0.3650.686 *0.2430.066
Mn−0.2340.509 *−0.004−0.746 *
Cd0.828 *0.258−0.0820.201
Co0.226−0.575 *0.624 *−0.297
Cr0.144−0.338−0.791 *−0.182
Zn0.874 *0.1090.0770.294
Cu−0.392−0.676 *0.3840.146
As−0.623 *−0.281−0.4810.256
Eigenvalue2.5291.9291.4931.143
% Total variance28.1021.4416.5912.70
Cumulative %28.1049.5566.1478.84
Note: * PCA loadings N ≥ 0.5.
Table 4. Concentrations of mobile forms of metals and background values (mg/kg) in soil cover of the Nyurbinsky MPD in 2014 and 2018.
Background Values, n = 212 MinimumMaximumMeanGeometric MeanStandard DeviationVariance
Pb2.88 0.60 0.29 31.6 12.7 2.87 1.74 2.34 1.48 3.80 1.59 14.4 2.53
Ni1.77 1.63 1.46 47.5 28.5 9.99 7.40 7.38 5.78 9.87 6.00 97.5 35.9
Mn13.19 66.3 12.5   4482.4 1087.0 692.1 1298.2 426.3 349.6 776.4 2239.5 602,720 5,015,310
Cd0.03 0.01 0.01 0.18 0.25 0.04 0.06 0.04 0.04 0.03 0.06 0 0
Co2.14 1.31 0.55 27.6 19.9 5.84 4.69 4.93 3.57 4.38 3.82 19.2 14.5
Cr4.70 0.54 0.78 9.6 48.7 3.03 7.05 2.69 4.67 1.64 9.21 2.69 84.8
Zn6.31 1.93 3.63 24.4 76.8 9.22 21.7 8.28 17.4 4.31 15.9 18.6 251.9
Cu11.50 1.61 1.55 29.3 15.9 6.29 5.89 5.24 5.09 4.44 3.14 19.7 9.8
As0.22 0.05 0.03 1.44 0.70 0.32 0.14 0.25 0.09 0.24 0.15 0.06 0.02
Note: over the line—2014 year, (n = 56); below the line—2018 year (n = 62).
Table 5. Changes in the levels of multi-element contamination of the soil cover on the study territory over the years of research.
Contamination Category
(Level of Index of Total Contamination)
Area, km2
2007201120142018
Allowable (Zc ˃ 16)---61.0
Moderately hazardous (Zc = 16–32)210.0305.0-104.9
Highly hazardous (Zc = 32–128)45.01.44122.0260.9
Extremely hazardous (Zc < 128)--18.251.6
Publisher’s Note: MDPI stays neutral with regard to jurisdictional claims in published maps and institutional affiliations.

