Article

Study on Characteristics of Coal Spontaneous Combustion in Kerjian Mining Area, Xinjiang, China

1
School of Ecology and Environment, Xinjiang University, Urumqi 830017, China
2
Key Laboratory of Oasis Ecology of Ministry of Education, Xinjiang University, Urumqi 830017, China
*
Author to whom correspondence should be addressed.
Minerals 2022, 12(12), 1508; https://doi.org/10.3390/min12121508
Submission received: 25 October 2022 / Revised: 16 November 2022 / Accepted: 19 November 2022 / Published: 25 November 2022
(This article belongs to the Special Issue Characterization, Processing and Utilization of Coal)

Abstract

:
The spontaneous combustion of coal is a disaster associated with coal mining. In this study, the authors investigated the characteristics of spontaneous combustion of coal at different temperatures (room temperature, 50–500 °C with 50 °C interval) using Fourier transform infrared spectroscopy (FTIR), high-resolution transmission electron microscopy (HRTEM), etc. The results showed the aromatic structure was mainly naphthalene. The aliphatic hydrocarbons were long chain. Oxygen, nitrogen, and sulphur existed as C-O, pyridine, pyrrole nitrogen, aliphatic sulphur, and sulfone. The molecular structural formula is C142H112N2O22. The stable 3D structural was obtained through optimization. Thermogravimetric analysis results showed the critical and dry-cracking temperatures of coal samples showed downward trends overall, whereas the acceleration and thermal-decomposition temperatures varied greatly with increase in oxidation temperature. The activation energy change pattern of 4 stages is not obvious. The FTIR results showed the contents of self-associated OH changed greatly. The aliphatic hydrocarbons changed greatly at 30–150 °C and 300–500 °C. The C-O showed increasing trends, whereas the C=O decreased consistently. The HRTEM results showed the aromatic fringes in coal samples were dominated by 1 × 1 and 2 × 2, the contents of which accounted for more than 80% of the total fringes.

1. Introduction

Coal is not only the major energy source, but also is one source of pollution during utilization of it. A clear understanding of the molecular structure and oxidation combustion characteristics of coal is highly important for the clean utilization, efficient conversion, and comprehensive utilization of coal as well as for the prevention of the spontaneous combustion of coal. Presently, methods used by scholars mainly include physics (instrumental analysis), chemistry, and molecular simulation [1,2,3]. Physical methods include Fourier transform infrared spectroscopy (FTIR), X-ray photoelectron spectroscopy (XPS), and carbon nuclear magnetic resonance (13C-NMR) spectroscopy. Chemical methods mainly measure the content changes in coal structure using chemical experiments. Molecular simulation is based on molecular structural models. Domestic and foreign scholars have constructed molecular structural models of different coal samples. Among them, the earliest and most commonly used models [4,5,6,7,8] include the Given, Shinn, and Wiser models. With the development of science and technology, a large number of scholars have combined physical, chemical, and computer-based methods to build molecular structural models of coal [9,10,11]. Chai et al. [12] used 13C-NMR, XPS, and X-ray diffraction spectroscopy (XRD) to build the molecular structure model of Wucaiwan coal in Zhundong and studied the structural characteristics of coal samples under different temperatures. Ma et al. [13] used 13C-NMR and XPS to construct the molecular structure model of high-grade coal (Fengxian coal in Shaanxi Province). Wu et al. [14] constructed the molecular model of coal and studied the adsorption characteristics of different components in power plant flue gas using molecular simulation. Wei et al. [15] constructed the molecular structural model of Jincheng anthracite using 13C-NMR and high-resolution transmission electron microscopy (HRTEM). Xiang et al. [16] studied the molecular characteristic structure of Yanzhou coal using 13C-NMR. Ren et al. [17] studied the microcrystalline structure of Zhangjiamao coal based on HRTEM and obtained the molecular formula and molecular mass of the coal. Sun et al. [18] used XPS and 13C-NMR to construct the molecular structure of Zhundong coal. Hong et al. [19] constructed the molecular model of Wucaiwan coal and studied the pyrolysis characteristics of the coal under different conditions using molecular simulation. Zhu et al. [20] constructed the molecular structure model of lignite using XPS, 13C-NMR, and elemental analysis, and they obtained the stable molecular model after optimization. Wornat et al. [21] analyzed the structural changes in biochar during combustion using HRTEM. Jia et al. [22] investigated the functional group types, material composition, and the element valences of biochar using FTIR, XRD, and XPS. The removal characteristics and synergistic mechanism of iron-based modified biochar with multiple metals on Hg0 generated from coal during oxidative combustion were also investigated. Xiao et al. [23] studied the evolution of functional groups during the process of secondary oxidation using TG and FTIR. Li et al. [24] used HRTEM to study changes in the coal structure and ultra-micropore of Xinjiang Zhundong coal under different oxidation temperatures. Wang et al. [25] and Yi et al. [26] investigated the thermokinetic characteristics of the combustion of 1/3 coking coal and coal samples under high temperatures and oxygen-limited atmospheres, respectively. The above scholars built molecular models for more characteristic regional and metamorphic coal samples and studied the structural characteristics changes of coal samples under different oxidation conditions. Relatively more studies have been conducted on high metamorphic coal samples, while low metamorphic coal samples have been less studied. Meanwhile, the methods used for studying coal molecules as well as oxidation and combustion characteristics are relatively simple, and fewer studies integrate more methods together. This makes the studied structural properties, model construction, and oxidative combustion properties of coal limited and relatively weakly persuasive. The coal samples selected in this paper are low metamorphic coals and few people have studied the properties of coal samples from this region. In this paper, a large number of test methods and experimental data are used to make the molecular structure model of coal more convincing. Meanwhile, this paper does not simply study the molecular structure of coal but also delves into the characteristic changes of coal samples during the combustion process. More knowledge about the combustion of coal samples was obtained.
In view of the above problems, the present study took Kerjian coal as the research object. FTIR, XRD, XPS, HRTEM, and 13C-NMR were used in the experiments, and combined proximate and ultimate analyses were used to study the molecular structure of raw coal. ChemDraw was used to draw the 2D structure of the coal molecules, and Materials Studio was used to optimize the geometry and minimum energy of the coal structure. FTIR, TG, and HRTEM were used to study the evolution of the structural characteristics of Kerjian coal samples under different oxidation conditions (raw coal, 50 °C, 100 °C, 150 °C, 200 °C, 250 °C, 300 °C, 350 °C, 400 °C, 450 °C, and 500 °C). This study preliminarily constructed the molecular structure of Kerjian coal and provides a comprehensive understanding of the coal structure, thus providing a model basis for the molecular simulation and oxidation characteristics of the coal at the molecular scale.

2. Materials and Method

2.1. Coal Samples

The experimental coal samples were collected from the Kerjian mining area. Through crushing and sieving, 80–100-μm mesh coal samples were selected for experiments. A muffle furnace (SRJX-4-13, Beijing Yong Guangming Medical Instrument Factory, Beijing, China) was used to oxidize the coal samples to 50 °C, 100 °C, 150 °C, 200 °C, 250 °C, 300 °C, 350 °C, 400 °C, 450 °C, and 500 °C. After oxidation to a specific temperature, the furnace was cooled to room temperature, and the samples were loaded. The proximate analysis was based on proximate analysis methods for coal (GB/T212-2008) [27]. The ultimate analysis was based on the CHNS elemental analyzer (Vario EL cube, Elementar, Langenselbold, Germany). The atomic ratio was calculated using normalization. The results are shown in Table 1.

2.2. Nuclear Magnetic Resonance Carbon Spectrum (13C-NMR)

A Swiss Bruker Advance III fully digital superconducting NMR spectrometer (Zurich, Switzerland) was used for the measurement. The resolution was 4.0 mm. The rotating speed was 10 kHz. The contact time was 2 ms.

2.3. X-ray Photoelectron Spectroscopy (XPS)

An ESCALAB 250Xi X-ray photoelectron spectrometer produced by Thermo Fisher Scientific (Waltham, MA, USA), was used for the measurement. The passing energy was from 1 to 400 eV, the step length was 1 eV, the counting rate was 700,000 cps, and the incident angle was 45°.

2.4. High-Resolution Transmission Electron Microscope (HRTEM)

The JEM-2100 high-resolution transmission electron microscope produced by Japan Electronics (Tokyo, Japan) was used for the measurement. The line resolution and point resolution were 0.14 nm and 0.23 nm, respectively.

2.5. Fourier Transform Infrared Spectroscopy (FTIR)

A VERTEX 70v FTIR spectrometer from Bruker (Billerica, MA, USA) was used for the measurement. The resolution was 2.0 cm−1. The temperature control range was from room temperature to 600 °C, and the wavelength was 400 to 4000 cm−1.

2.6. X-ray Diffraction Spectrum (XRD)

A D8 Advance X-ray powder diffractometer produced by Bruker (AXS GmbH, Karlsruhe, Germany) was used for the measurement. The Voltage was 60 kV. The current was 50 mA, and the scanning speed was 1500/min.

2.7. Thermogravimetric Analysis (TG)

The thermogravimetry differential thermal synchronous analyzer STA7300 produced by Hitachi electronics (Tokyo, Japan) was used for the measurement. The measurement temperature range was from room temperature to 1200 °C. The airflow rate was approximately 0–1000 mL/min, and the temperature rise rate was approximately 0.01–100 °C/min.

2.8. Characteristic Temperature and Kinetic Parameters

According to the characteristics of coal oxidation combustion and spontaneous combustion, the coal samples were divided into seven characteristic temperature points: T1 (critical temperature), T2 (dry-cracking temperature), T3 (acceleration temperature), T4 (thermal-decomposition temperature), T5 (ignition-point temperature), T6 (maximum weight-loss-rate temperature), and T7 (burnout temperature). The oxidative combustion process of the coal sample was divided into five stages based on characteristic temperature points: the moisture volatilization and desorption stage (start–T2), oxygen absorption and weight-gain stage (T2–T4), thermal-decomposition stage (T4–T5), combustion stage (T5–T7), and burnout stage (T7–end). The critical temperature (T1) is the temperature point on the TG curve corresponding to the maximum weight loss of the coal sample and is the first minimum peak point on the DTG curve. The dry cracking temperature (T2) is the point at which the temperature rises; the oxygen absorption weight gain is in dynamic equilibrium with water evaporation and gas escape, which is expressed as the temperature at which the coal sample first reaches its lowest mass on the TG curve and the DTG is zero for the first time. Acceleration temperature (T3) refers to the temperature point where the mass rate of the coal sample is at its maximum and is the first peak point on the DTG curve. The thermal decomposition temperature (T4) indicates that the coal sample growth rate decreased to 0, the coal sample volume reaches a large value before combustion, and the oxygen absorption weight gain ends, which is also when the DTG reaches 0 for the second time. The ignition point temperature (T5) refers to the temperature at which the coal sample begins to burn and enters the rapid oxidation stage. The maximum weight loss rate temperature (T6) refers to the temperature point at which the rate of mass change of the coal sample reaches a minimum, which is the minimum peak point of the DTG curve. The burnout temperature (T7) refers to the temperature at which the coal sample is completely consumed, and the mass is almost constant. The DTG curve is close to 0.
Stage 1 (30 °C–T2): The coal samples absorbed gases from the environment through molecular interactions and showed a brief weight gain. As the temperature increased, water volatilized, gases desorbed, hydrogen bonds formed, small molecules in the coal broke up, the mass of the coal started to decrease, and weight loss began. Stage 2 (T2–T4): With increasing temperature of the coal samples, the oxygen absorption capacity far exceeded the gas desorption capacity of the coal surface, making the coal sample briefly increase in mass. Chemisorption of the coal samples occurred during this stage, which was mainly the fracture and oxygen adsorption of aliphatic hydrocarbons and the reduction in the content of both. Stages 3 (T4–T5) and 4 (T5–T7): The coal samples entered a rapid weight loss stage, and a large number of functional groups (aromatic hydrocarbons) in the coal samples were broken. Aliphatic hydrocarbons reacted with oxygen to produce a series of gaseous products, including H2O, CO2, and CO, making the coal samples burn out completely.
The Coats-Redfern method [28] was used to solve the activation energy, and the coal oxidation reaction was a level-1 reaction [29]. Taking 1/T as the horizontal coordinate and ln (−ln (1 − a)/T2) as the axial coordinate, a linear fit to the scatter plot was performed for each stage.

3. Construction of Coal Molecular Structure

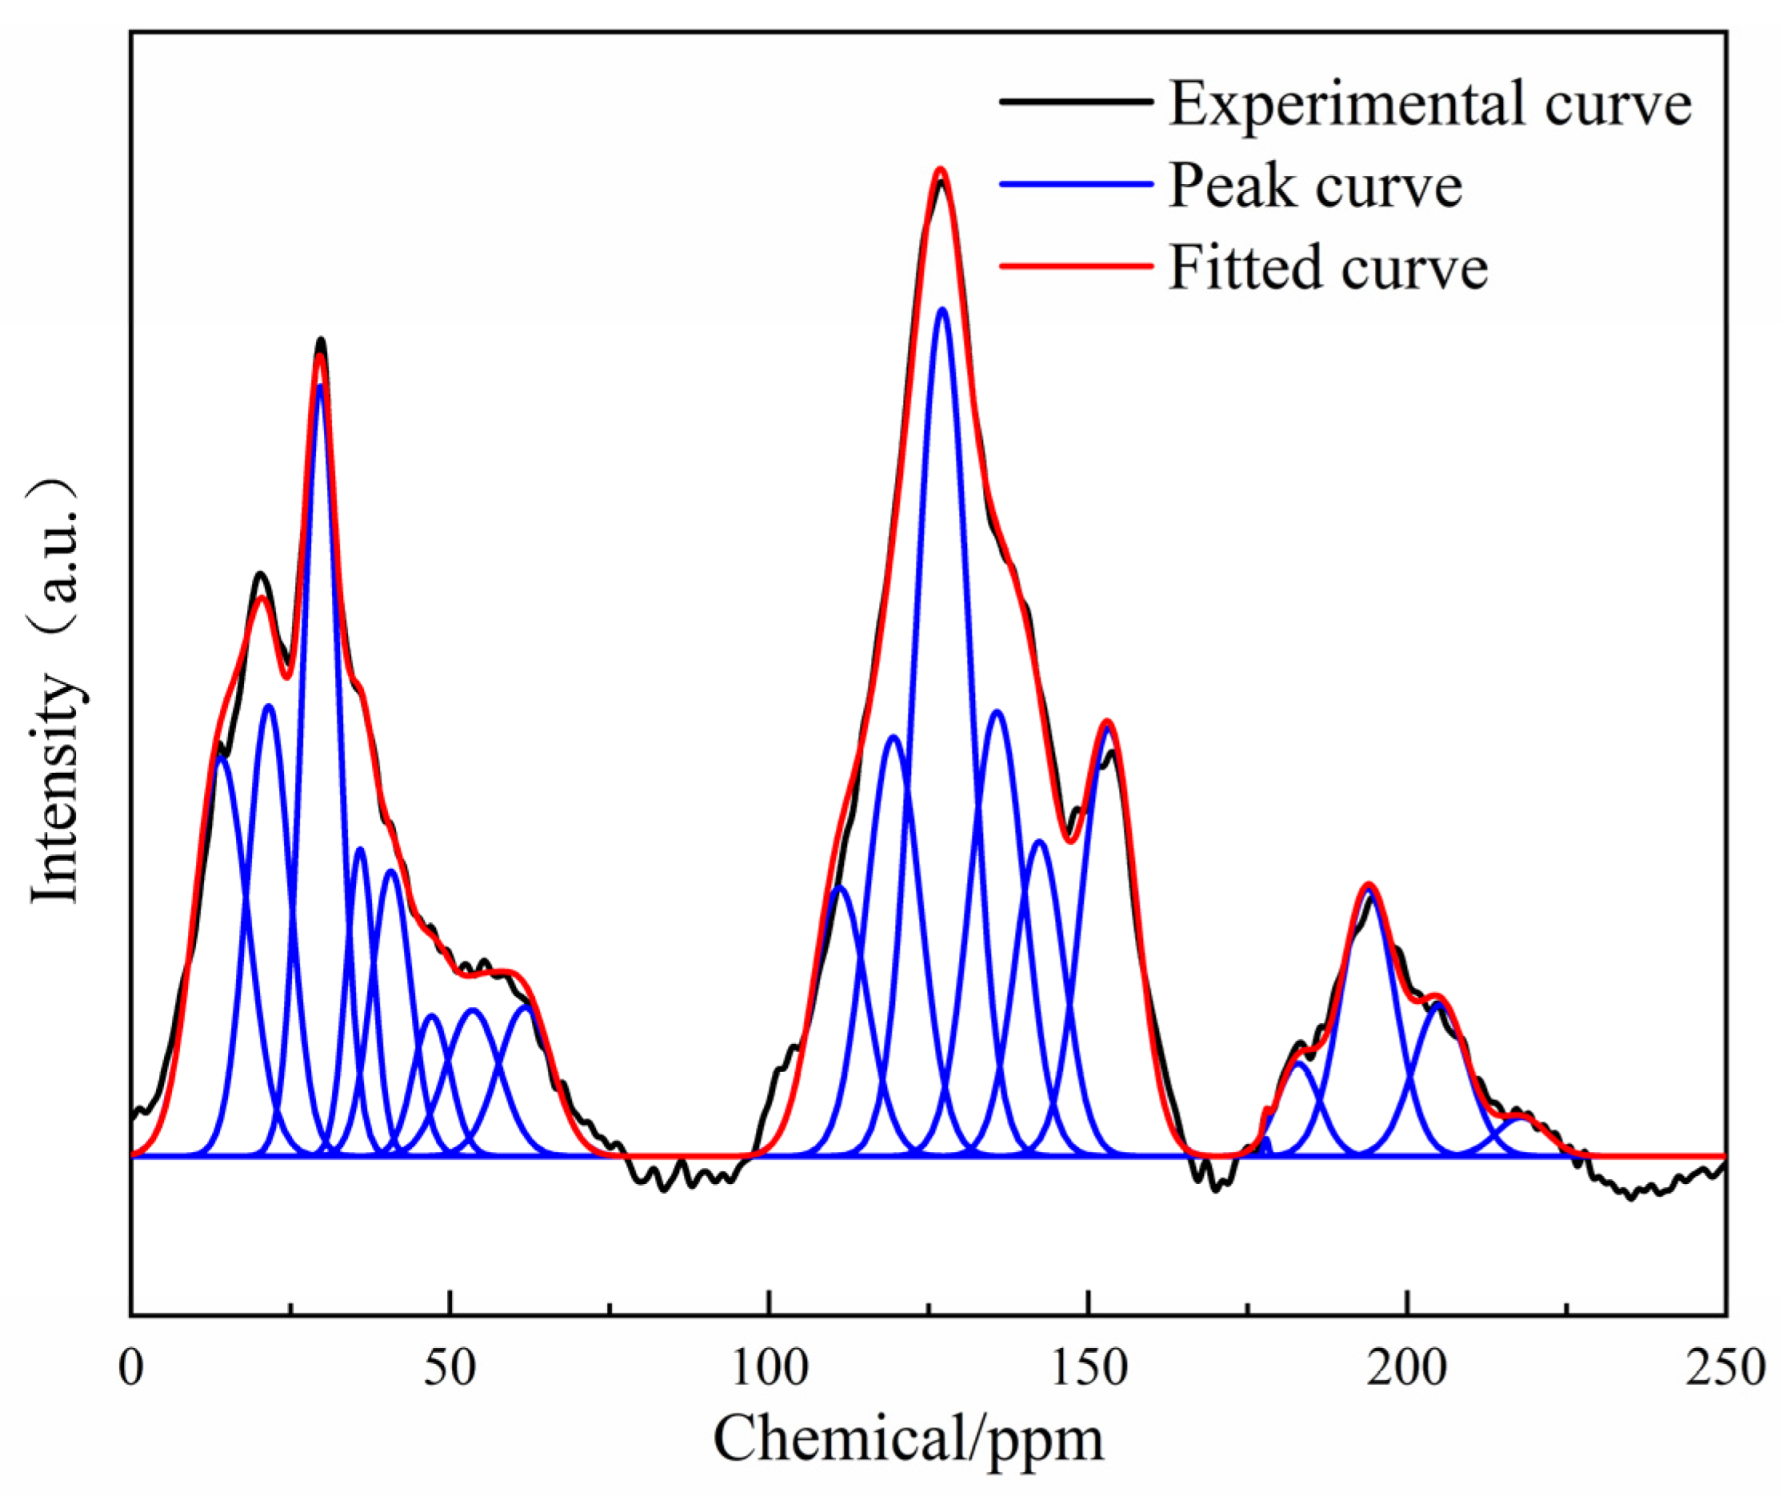
3.1. 13C-NMR Test Results and Analysis

The NMR spectra of Kerjian coal are divided into four main intervals [30]: 0–60 ppm (aliphatic carbon), 60–90 ppm (ether oxygen), 90–165 ppm (aromatic carbon), and approximately 200 ppm (carbonyl carbon). The absorption peaks of aromatic hydrocarbons are the strongest in the spectrum. The aliphatic hydrocarbons are closely second to aromatic hydrocarbons. This indicates that the coal samples from the Kerjian mine have a low degree of metamorphism and consist of both aliphatic and aromatic hydrocarbons. Due to the complexity of technology and the coal structures, Origin (10.0.0.154 version, OriginLab Cooperation, Northampton, MA, USA) was used for peak fitting to obtain more information. During the process of peak fitting, the minimum value was taken as the baseline, the peak attribution of carbon atom was used to control the fitting, Gaussian was selected, the parameters (half-peak width, peak height, etc.) were fine-tuned, and the process was repeated to obtain the best fit with an R2 of more than 99%. The result is shown in Figure 1.
The peak positions and parameters in 13C-NMR are shown in Table 2. The relative content in the Table refers to the percentage of each peak area relative to the total area (sum of each peak area). The values of the structural parameters in the coal sample were obtained from Table 2 and are shown in Table 3. It can be seen from Table 2 and Table 3 that the aromatic carbon in Kerjian coal accounts for the highest proportion (51.26%) of the carbon structural parameters, followed by aliphatic hydrocarbons (38.68%), which also contains a small amount of carbonyl carbon and carboxyl carbon.
The ratio of bridged carbon to the per carbon number ( X B P ) was calculated from Table 3: X B P = f a B / ( f a H + f a P + f a S ) =0.197. It reflects the average value of the condensation degree of aromatics in coal, and the size of aromatic clusters was calculated [31]. The content of f a l * was lower than that of f a l H , indicating that the amount of methyl carbon in the coal samples was lower than that of methylene or hypomethyl.

3.2. XPS Test Results and Analysis

The existing forms and relative contents of C, O, S, and N in coal can be obtained from XPS spectra. Avantage [32] was used for C calibration, and different elements were fitted using peak splitting. The obtained data were plotted by Origin (Figure 2). The parameters are shown in Table 4.
The existing forms of C (1s) in coal are C-C, C-H (284.80 eV); C-O (285.67 eV); C=O (287.1 eV); and COO- (289.28 eV) [33,34]. Kerjian coal samples mainly consisted of C-C and C-H and also contained C-O, C=O, and COOH. The existing forms of O (1s) in coal are C=O (531.5 eV), C-O (532.8 eV), COO- (534 eV), and adsorbed oxygen (535.4 eV) (very low content) [34]. The existing forms of N (1s) in coal are pyridine nitrogen (N-6) (398.91 eV), pyrrole nitrogen (N-5) (400.29 eV), quaternary nitrogen (N-Q) (401.4 eV), and oxidized nitrogen (N-X) (403 eV) [34,35]. The Kerjian coal sample mainly consisted of N-6 and N-5. The occurrence forms of S (2p) are aliphatic sulphur (163.66 eV), Aromatic sulphur (164.92 eV), sulfone (168.48 eV), and inorganic sulphate (169.74 eV) [34,36,37]. According to the relative content in Table 4, aliphatic sulphur was the main occurrence form of sulphur, followed by the higher content of sulfone.

3.3. HRTEM Test Results and Analysis

The coal sample images were processed using ImageJ (1.53c version, National Institutes of Health, Bethesda, MD, USA), MATLAB (R2021a version, MathWorks, Natick, MA, USA), and Digital micrographs (3.11.2 version, Gatan Inc., Pleasanton, CA, USA). The analysis process is shown in Figure 3. The thicknesses of the images obtained using HRTEM were inconsistent. To reduce the influence of coal sample thickness on the experimental results, the edge images of the coal samples were cropped, and the average value was obtained to ensure the accuracy of the experiment.
Figure 3a shows the original image of the Kerjian coal samples. It can be seen from the Figure that the resolution of the top image is low, and layer fringes could not be identified, which is related to the low degree of metamorphism in the original coal sample. The coal sample with a low degree of metamorphism has a smaller lattice size and higher disorder. Figure 3b was obtained by performing Fourier transform on the original image. There is a bright concentric arc in the frequency domain image, indicating that the aggregated structures in the coal sample have the same trend. The image was then filtered within a certain frequency range (Figure 3b) to obtain the ring filter (Figure 3c), and the concentric arcs in the image were more distinct. Inverse Fourier Transform was then performed to obtain Figure 3d, in which the distribution of distinct lattice fringes is clearly visible. During the binarization process, Figure 3e was obtained by continuously adjusting the binarization threshold. The classification method of Niekerk et al. [38] was used to classify the aggregation structures of the coal samples. The distribution of the lattice fringes obtained using MATLAB was self-programmed as shown in Figure 3f.
The aromatic microcrystalline structures in the coal samples were mainly 1 × 1 and 2 × 2, accounting for more than 90% of the total lattice structures. The content of 1 × 1 fringes was the largest, exceeding 50% of the total stripes. This was followed by the 2 × 2 fringes, whereas the contents of 3 × 3–6 × 6 were rare and their frequencies were less than 5%. There were almost no 7 × 7 and 8 × 8 fringes in the coal samples, indicating that the Kerjian coal was less metamorphosed, with less condensation of aromatic structures and shorter lattice fringes. The aromatic structures were mainly benzene, naphthalene, and anthracene.

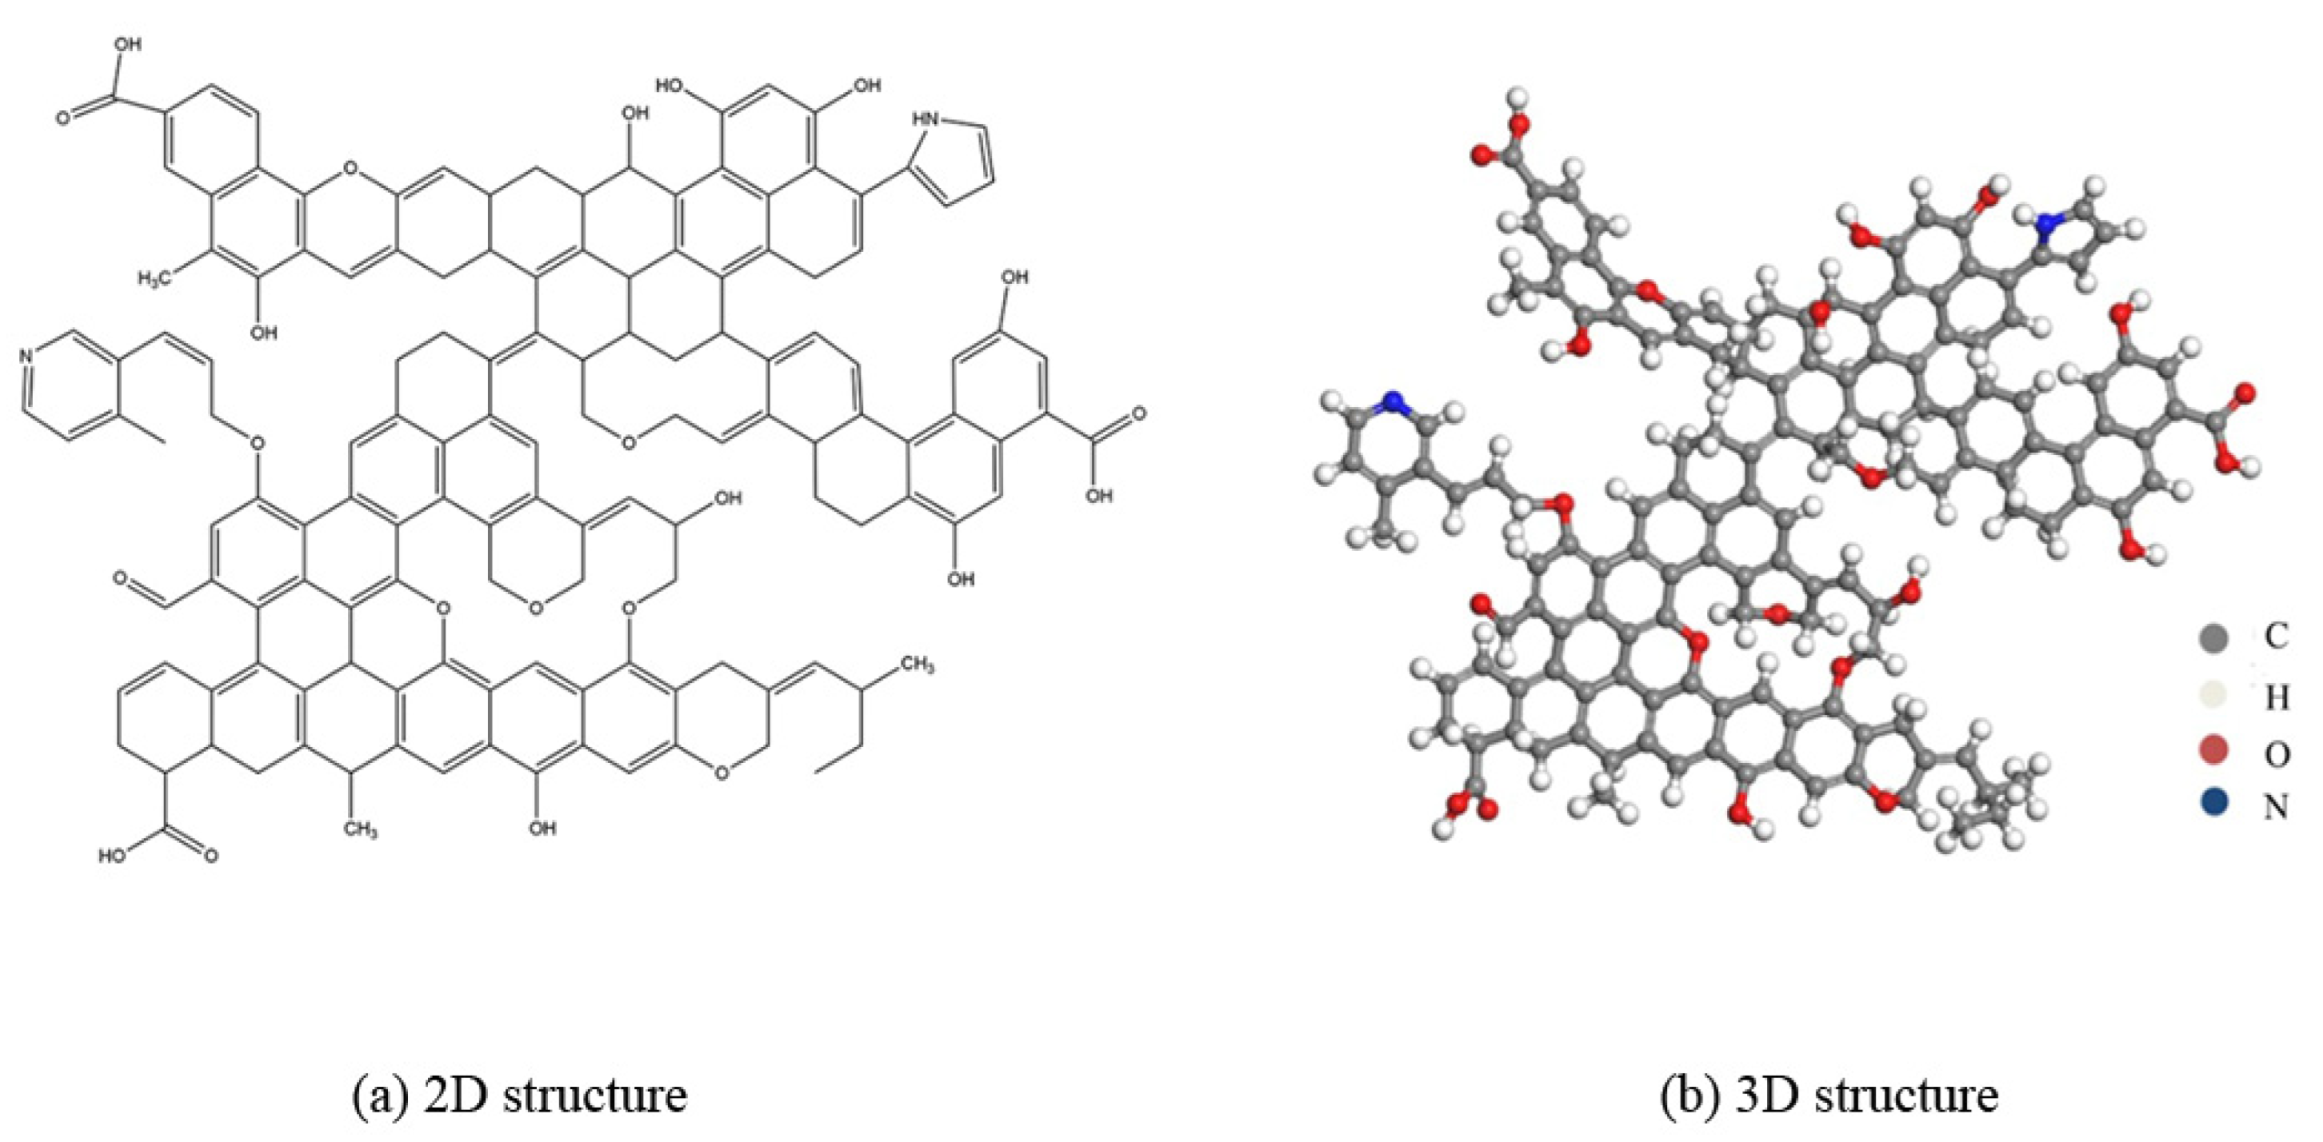
3.4. Coal Molecular Structural Model

3.4.1. Aromatic Structure

As shown by HRTEM, the aromatic structures in the kerogen coal samples were dominated by benzene, naphthalene, and anthracene. It was found that the X B P of benzene was 0, while those of naphthalene and anthracene were 0.25 and 0.4, respectively. From 13C-NMR, it was found that the X B P of the Kerjian coal structure was 0.197. The X B P (0.2) of the coal sample is made similar to the measured value by adjusting the number of each aromatic structure. The types and numbers of aromatic structures in the coal samples are shown in Table 5.

3.4.2. Aliphatic Hydrocarbon Carbon Structure

Aliphatic carbons exist as branched or attached aromatic structures, specifically as aliphatic side chains, hypomethylenes, methylenes, and cycloalkanes. The aliphatic hydrocarbons in the coal samples from the Kerjian mine were mainly dominated by long-chain alkyl side chains because of the long length of alkyl side chains in coal samples with low metamorphism. From the 13C-NMR, it can be seen that the samples had higher methylene and hypomethyl contents and lower methyl contents. The aromatic carbon proportion in the coal sample accounted for 51.26% of the carbon structural parameters. The total number of carbons was 142. The numbers of aromatic and aliphatic carbons were 73 and 55, respectively.

3.4.3. Heteroatoms

Comprehensive analysis of the elemental ratios from the analysis of the coal samples from the Kerjian mine and the total number of carbons in the model construction showed that the numbers of H, O, and N were 112, 22, and 2, respectively. 13C-NMR showed that oxygen-containing functional groups were present in the coal samples. XPS revealed that the content of C-O was the highest, followed by COO- and then C=O, with a ratio of 1.80:1:0.65. Combining the three determinations, it was found that numbers of OH, C=O, C-O, and COO- in the model were 8, 2, 6, and 3, respectively. The existing forms of nitrogen in the coal structures mainly included pyridine nitrogen, pyrrole nitrogen, and quaternary nitrogen. It can be seen from the experimental measurements that the nitrogen in the coal samples was mainly composed of pyrroles and pyridines; therefore, one pyrrole and one pyridine were inputted into the model. For the reason that the number of sulphurs was less than 1, sulphur was not considered in study paper.

3.4.4. Molecular Structural Model

For the type and number of coal molecular structures obtained from the above experiments, ChemDraw was used to construct the molecular structure of Kerjian coal. The chemical shifts in the 2D structure of the coal were calculated and compared according to the 13C-NMR spectra obtained from the experiments, which were continuously adjusted and optimized to obtain the final 2D structure (Figure 4a). The model parameters are shown in Table 6, and the 3D model is shown in Figure 4b.

3.4.5. Model Optimization

Materials Studio was used to optimize and anneal the structural model of the coal samples. The Dreiding stance and Smart algorithm were chosen for the geometric optimization. The energy was chosen to be 0.001 kcal/mol, the maximum number of iteration steps was 50,000, and the force was 0.1 kcal/(mol A ˙ ). The above only optimized the local structure in the model; therefore, based on the geometric optimization, further annealing was required to minimize the energy. Annealing was used, the NVT system was selected, the temperature was set to range from 26.85 °C to 326.85 °C, the annealing period was set to 10, and the number of cycle steps was set to 10,000 [39].
The geometry optimization and energy minimization models are shown in Figure 5. The geometry optimization distorted the model structure to a lesser extent, while the structural model underwent a greater change after the annealing treatment. The energy changes before and after optimization and after annealing treatment are shown in Table 7.
As can be seen from the Table 7, the total energy changed significantly before and after the geometric optimization; specifically, the bond stretching energy showed the largest energy change. After the annealing simulations, the structural twist and inversion changes were large, and the van der Waals energy was larger than the other energies and dominated the non-bonding energy, reflecting the π–π interactions between the aromatic lamellae [40].

4. Results and Analysis

4.1. Characteristics of Coal Molecular Structure

4.1.1. FTIR Test Results and Analysis

In the infrared spectrum of coal sample, the absorption peaks of functional groups mainly include four categories [41,42]: hydroxyl (approximately 3600–3000 cm−1), aliphatic hydrocarbons (approximately 3000–2800 cm−1), oxygen-containing functional groups (approximately 1800–1000 cm−1), and aromatics (900–700 cm−1). Origin was used to fit the functional groups of different bands according to peak (Figure 6), and after obtaining the fitted curve, the functional groups were sorted out and the attribution of the parameters was classified [43] (Table 8, Table 9, Table 10 and Table 11).
In the coal samples, self-associated OH was dominant with a relative content of 42.58%, followed by OH-OR2 and then OH-π with relative contents of 28.15% and 15.732% in that order. The content of the other three types of hydroxyl groups was relatively small. Aliphatic hydrocarbons were dominated by methylene, with a relative content of more than half of the total area (61.61%). The relative contents of methyl and methylene were relatively small, and the relative contents of both are about the same. The oxygen in the coal samples existed in the form of C-O, C=O, and COOH, and the relative contents were 19.51%, 29.98%, and 10.10% in order. Benzene substitution was mainly tri- and tetra-substituted benzene, and the relative contents were 25.7% and 50.97% in order. Penta-substituted benzene was 18.46%, and Di-substituted benzene was only 4.87%.

4.1.2. XRD Test Results and Analysis

There was ordered carbon in the coal samples, which were mainly stacked in aromatic structural units to varying degrees called microcrystals. The order degree of C arrangement in the coal samples was obtained from the XRD spectrum. Origin was used to plot the XRD spectrum of the data obtained from the experiment (Figure 7). By observing the spectrum, two distinct diffraction peaks are seen in the ranges of 20–30° and 40–50°, which were called the 002 and 100 peaks, respectively. In addition, a very distinct diffraction peak was observed on the left side of the 002 peak. This peak was called the γ peak and was mainly caused by the low degree of metamorphism of the coal samples, which is consistent with the low degree of metamorphism of the previous coal samples and the results obtained using 13C-NMR. Origin was used to fit the peaks ranging from 0–33° and 35–60°, and the obtained parameters are shown in Table 12. The Scherre formula and Bragg equation were used [44] to substitute relevant parameters to obtain aromatic structural parameters d002, La, Lc, and others, and the results are shown in Table 13.

4.2. TG Test Results and Analysis of Coal Samples at Different Temperatures

4.2.1. Raw Coal

(1) Characteristic temperature and stage division
The TG curve was obtained from the TGA experiment and was expressed as the ratio of the mass of coal at a certain temperature to the initial mass of coal during the oxidation process of the coal sample. The differential thermogravimetric analysis (DTG) curve of the coal samples (indicating the rate of change of the coal sample mass) was obtained by obtaining the derivative of the TG curve with respect to time (Figure 8). Each characteristic temperature during the oxidation of Kerjian coal is shown in Table 14.
(2) Reaction kinetic parameters
The kinetic parameters were obtained and shown as Table 15. With increasing temperature, the activation energies of the coal samples increase continuously from stages 1–4. The reason for this may be that, with increasing temperature, the easy-to-react functional groups in the coal samples decrease, and the more difficult-to-react functional groups increase. Both the reaction difficulty and the activation energy increased.
The activation energies in stages 1 and 2 were not considerably different and lower compared with the other two stages, indicating that the coal sample was more likely to be oxidized during these two stages and the coal contained more functional groups that were more likely to participate in the reaction.

4.2.2. Coal Samples at Different Temperatures

(1) Characteristic temperature and stage division of coal samples
Consistent with the characteristic temperature and division stages in the raw coal in the previous section, the different oxidized coal samples were divided into seven characteristic temperature points (Figure 9b) and five oxidation stages (Figure 9a). As can be seen from the Figure, the same characteristic temperature point values differed according to the oxidized coal samples. The characteristic temperatures that changed significantly were mainly T1–T4, and the temperatures of T5–T6 did not change considerably in different coal samples, which may be caused by the different water and active functional group contents in coal samples with the different degrees of oxidation. T1 was the lowest at 100 °C, and there was an inflection point; however, the overall trend was downward. The T2 temperature point also showed a decreasing trend and slightly increased after 400 °C in the coal samples; however, the change was not significant. The main reason for both of these may be that, as the oxidation temperature of the coal samples increased, the moisture in coal samples decreased, and the critical and dry-cracking temperatures shifted forward. The overall trends of T3 and T4 in the different coal samples were basically the same, both decreasing first and then increasing, and both had inflection points at 250 °C. The difference was that inflection points appeared again in that of T3 at 350 °C and 450 °C in the coal samples. The two may be related to the presence of active functional groups (e.g., aliphatic hydrocarbons) in coal. The inflection point of T3 in the coal samples at 350 °C and 450 °C may be due to the lower content of aliphatic hydrocarbons in the coal and the weakened ability to combine with oxygen, which leads to an increase in the temperature point. T5, T6, and T7 remained largely constant. This was mainly because, the more reactive aliphatic functional groups in the coal samples decrease with an increase in temperature and consume aromatic hydrocarbons, the more difficult it is for substances to react; thus, the substances are less active, resulting in a minor change in the overall temperature point.
(2) Kinetic parameters of coal samples
The method for calculating the activation energy in the previous section was used to determine the activation energy of the different oxidized coal samples. The activation energy results are shown in Figure 10. As can be seen from the Figure, the activation energy of stage 4 fluctuated with the progression of oxidation. The activation energy of this stage was the largest, indicating that it was more difficult for the different coal samples to react during stage 4. This may be caused by the presence of more aromatic hydrocarbons and less aliphatic hydrocarbons being more difficult to react with. An inflection point occurred in the coal samples at 250 °C during stage 3, which showed an overall trend of first decreasing and then increasing. It may be that the aliphatic hydrocarbons in the coal samples were basically consumed completely before 250 °C, and more energy was required for the reaction of aromatic hydrocarbons, resulting in an increase in the activation energy of the later coal samples. The activation energy increased in the coal sample before 100 °C during stage 2 and then decreased. There was another inflection point at 250 °C, and then a decreasing trend was found, followed by an increase after 450 °C. The possible reasons for this are the variation of moisture in the coal samples with temperature and the presence of aliphatic hydrocarbons in the coal samples. The activation energy in stage 1 fluctuated overall. The low-temperature stage may be related to the moisture in the coal samples, and the high-temperature stage may have been caused by the functional groups and oxygen absorption capacity.
The changes in mass and activation energy of coal samples are essentially a reflection of the reactions occurring in the microstructure functional groups. To further understand the changes in specific functional groups during the oxidation and combustion of coal, FTIR and HRTEM were used to measure the coal samples at different oxidation temperatures to study the change in microstructure.

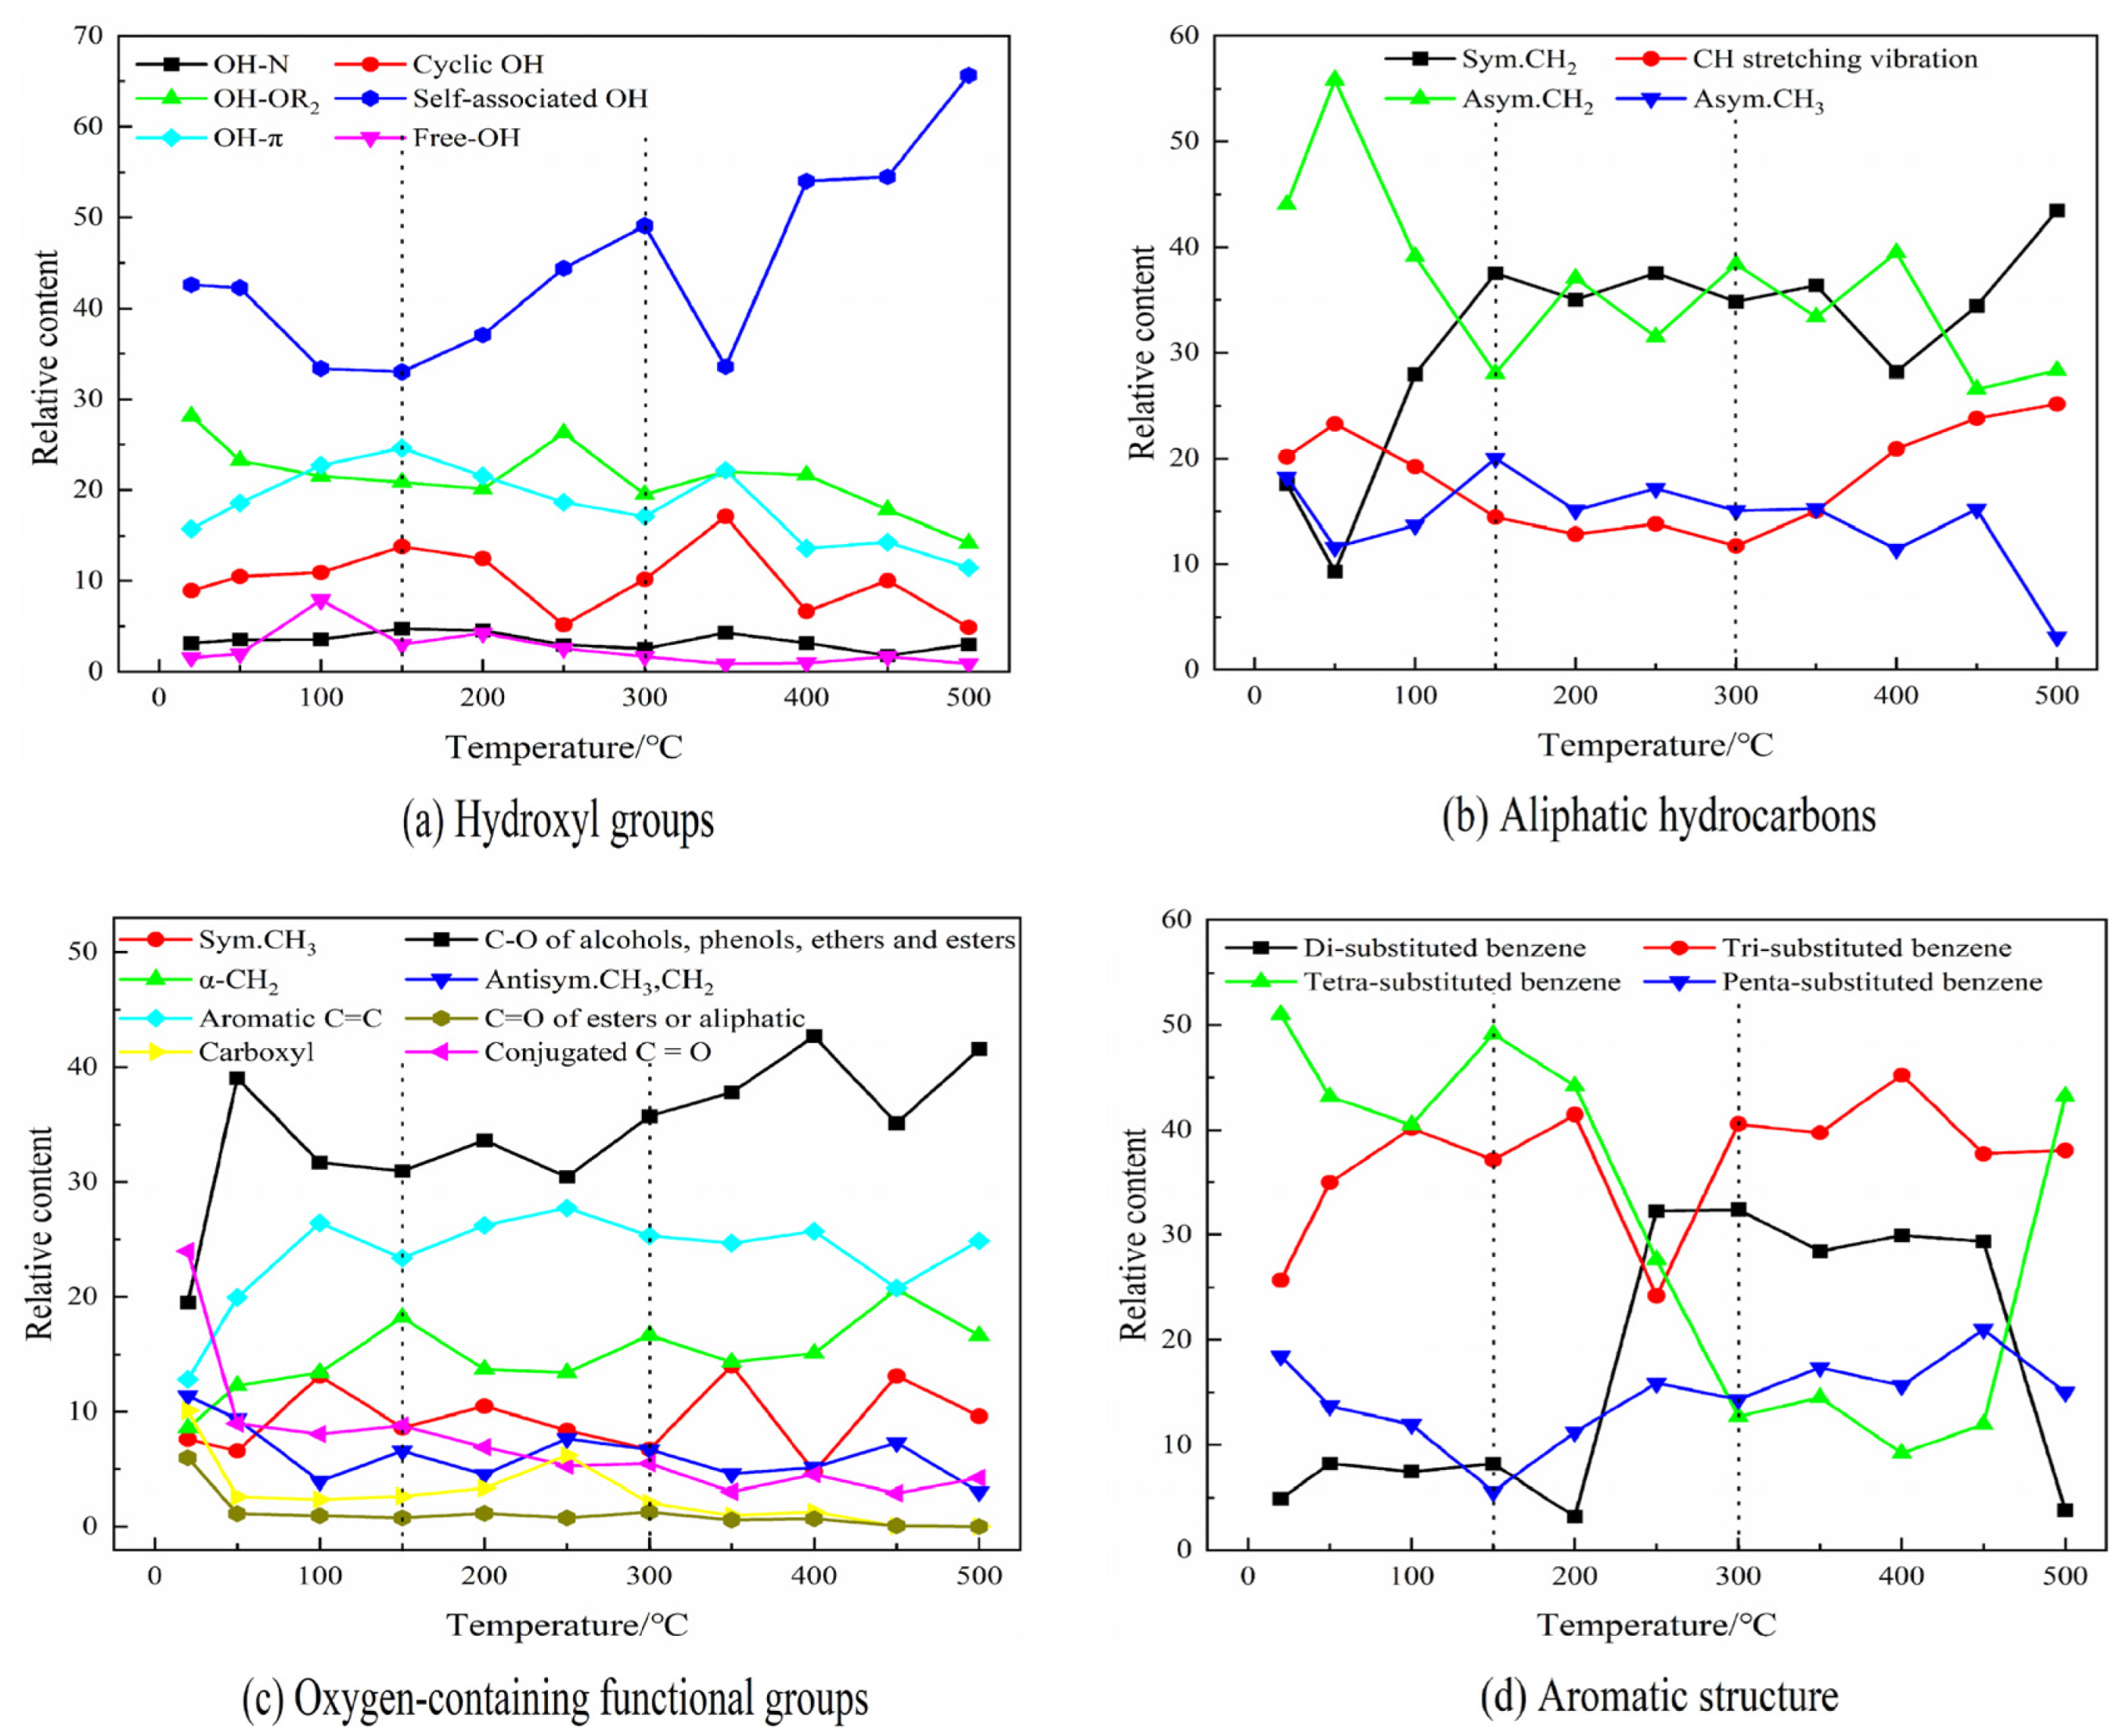
4.3. FTIR Test Results and Analysis of Coal Samples at Different Temperatures

The degree and rate of reaction of coal samples are mainly determined by the content of functional groups [45]. Figure 11 shows the infrared spectra and differential spectra of the coal samples at different oxidation temperatures. According to the characteristic temperature and stage division obtained using raw coal TG, the infrared spectra were divided into three intervals of 30–150 °C, 150–300 °C, and 300–500 °C, which mainly reflect the changes in each functional group during the first three stages. Based on the spectra, it can be seen that the functional groups involved in the reaction in the coal samples mainly contained hydroxyl groups, aliphatic hydrocarbons, oxygen-containing functional groups, and aromatic hydrocarbons. The functional groups contained in the different oxidized coal samples were basically the same, but the intensity of the absorption peaks differed.
It can be seen from Figure 12a that the contents of free OH and OH-N were the lowest and almost no change was observed throughout the reaction stage, indicating that the two did not participate in the coal-oxygen reaction. At 30–150 °C, self-associated OH and OH-OR2 were relatively reduced. They were mainly derived from water evaporation and oxygen adsorption in the coal at this stage, and the hydrogen bonds broke first. Moreover, small molecules also broke up at this stage, making the contents of cyclic hydroxyl hydrogen bonds and hydroxyl-π hydrogen bonds exhibit increasing trends. At 150–300 °C, the 1st-stage reaction was completed, and the aromatic hydrocarbons reacted with the more reactive cyclic hydroxyl groups and OH-π to produce COX and C=O, and other groups, decreasing the content of the cyclic hydroxyl groups and OH-π. Reactions of other substances also generated hydroxyl groups; the content of self-conjugated hydroxyl groups increased, and the hydroxyl ether-oxygen hydrogen bonds fluctuated. At 300–500 ℃, except for the self-associated OH content fluctuating considerably, and its overall trend increasing, other classes of hydroxyl groups finished reacting, with minor changes being observed, and their contents dropped to a minimum.
Figure 12b shows the relative contents of Sym.CH2 and Asym.CH2 changed in opposite directions to the CH stretching vibration and Asym.CH3 at 30–150 °C, and the two transformed each other. The total content of aliphatic hydrocarbon remained unchanged. With increasing temperature, aliphatic hydrocarbons combined and reacted with oxygen. The contents of CH and the Asym.CH3 class consistently decreased at 150–300 °C, and the Sym.CH2 and Asym.CH2 contents fluctuated. The overall aliphatic hydrocarbon content decreased, with minor changes. Although the aliphatic hydrocarbon content was relatively large in the coal samples, it was less active than other functional groups during the reaction of the coal samples. At 300–500 °C, aliphatic hydrocarbons reacted with oxygen in large quantities, producing gases that make them less abundant. Their contents decreased mainly for Asym.CH3, Asym.CH2 and Sym.CH2 (before 400 °C). The increase and decrease in the CH and Sym.CH2 contents. They may have been caused by a large amount of aromatic structure breakage.
Figure 12c shows that the oxygen-containing functional groups were the products of other substances or aliphatic hydrocarbons after the coal-oxygen reaction. Among them, Carboxyl, C=O, and CH3 antisymmetric vibrations as well as CH2 deformation vibrations (Antisym.CH3,CH2) accounted for a relatively small content and low change variation, and they were less active during throughout the reaction stage. The C-O of the alcohols, phenols, ethers, and esters and α-CH2 showed increasing trends with increasing oxidation temperature. The relative content of C=O decreased, while that of aromatic C=C slightly increased or decreased at 30–150 °C, and the changes were minor at the other stages. During the chemisorption stage of the coal samples, a large amount of oxygen was adsorbed on the coal surface and reacted, making the overall content of oxygen-containing functional groups increase; however, the overall change in each oxygen-containing functional group with increasing temperature was minor, and the activity was low.
Figure 12d shows that the benzene substituent changed less at 30–150 °C compared with the other stages, and the overall content remained constant. The main reason for this was that the benzene ring did not decompose at low temperatures and had weak reactivity, and only at higher temperatures did decomposition occurs, while its side chain structure was more reactive compared with the benzene ring itself. At 150–300 °C, the content of substituted benzene changes greatly, and when the temperature increased to 200 °C, the activity of a large number of functional groups became excited. The macromolecular structure decomposed continuously, the content of tetra-substituted benzene decreased by approximately 40%, and the content of tri-substituted benzene decreased accordingly, while that of di-substituted benzene fluctuated and that of penta-substituted benzene increased slightly or decreased. At 300–500 °C, the benzene substituents showed minor changes overall, except for the tetra-substituted benzene, which eventually showed a decreasing trend.

4.4. HRTEM Test Results and Analysis of Coal Samples at Different Temperatures

Origin was used to plot the distributions of aromatic fringes in the different oxidized coal samples (Figure 13). It can be seen that the aromatic lattice structures in the 11 coal samples were mainly 1 × 1 fringes (naphthalene), and their content values ranged from 40% to 60%. Second, the content of 2 × 2 fringes was higher. The two are the main components of aromatic lattice fringes in coal samples. Based on the TG stage division, the aromatic lattice fringes were divided into three stages: 30–150 °C, 150–300 °C, and 300–500 °C. During stage 1, a maximum (59%) of 1 × 1 fringe occurred when the oxidation temperature reached 100 °C. There was an overall decrease in 2 × 2 fringes, where the content of 2 × 2 in the raw coal and 50 °C coal samples were the same (approximately 40% similarity), and 32% of the content of 2 × 2 fringes in the coal samples oxidized to 100 °C and 150 °C, while the content of 3 × 3 fringes increases. This may be related to the decomposition of oxygen-containing functional groups and carboxyl groups, and a small amount of short aromatic lattice fringes formed during the production of gas. At 150–300 °C, the content of naphthalene decreased. The content of 2 × 2 fringes increased, and that of 3 × 3 fringes decreased. The decomposition of aliphatic hydrocarbons and hydroxyl groups in the side chains of the aromatic rings led to decreases in the contents of naphthalene and 3 × 3, while the removal of side chains and oxygen-containing functional groups facilitated the re-polymerization of aromatic sheets, thus increasing the content of 2 × 2 fringes. As the oxidation temperature increased (300–500 °C), the oxygen-containing heterocycles and ethers continued to decompose, increasing short fringes. The content of 1 × 1 fringes first increased, decreased, and then increased slightly at 500 °C. Both the contents of 2 × 2 and 3 × 3 fringes increased. The contents of all other lattice fringes were below 5%. The contents of 7 × 7 and 8 × 8 fringes were almost 0. This indicates that the coal samples had a low degree of metamorphism and were dominated by short aromatic fringes.

5. Conclusions

(1)
According to 13C-NMR and HRTEM, the aromatic structures of the Kerjian coal samples are dominated by naphthalene and supplemented by benzene and anthracene. The aliphatic hydrocarbons are dominated by alkyl side chains. The main forms of heteroatom oxygen, nitrogen, and sulphur were OH and C-O, N-5 and N-6, and aliphatic sulphur, in that order. The structural formula was C142H112N2O22. The most stable three-dimensional structure of the coal molecule was obtained using geometric optimization and energy minimization. Moreover, the final energy was mainly dominated by van der Waals energy.
(2)
The coal samples were divided into seven characteristic temperature points and five oxidation reaction stages. The temperatures of different coal samples from T5 to T6 did not change considerably. T1 and T2 showed decreasing trends overall in different oxidized coal samples, and there were inflection points in individual oxidized coal samples. T3 and T4 varied greatly, and their overall trends were basically the same, both decreased first and then increased, in which there are also individual inflection points. The value of the activation energy in stage was the largest and fluctuated with increasing oxidation temperature. An inflection point occurred in stage 3 in the 250 °C coal sample, decreasing first and then increasing. The activation energy of stage 2 showed an overall trend of increasing and then decreasing. The activation energy in stage 1 fluctuated, and the activation energy of stages 1 and 2 were the smallest among the coal samples.
(3)
At different oxidation temperatures, the self-associated OH content changes more and these compounds became more active. The contents of OH-OR2, cyclic OH, and OH-π changed less, and the main changes occurred at 250 °C and 350 °C. The content of aliphatic hydrocarbon varied remarkably in the ranges of 30–150 °C and 300–500 °C, and the main temperature points were 50 °C and 150 °C. The C-O content of the oxygen-contained functional group showed an increasing trend and high activity at each stage. The C=O consistently decreased in each stage. The content of benzene substituents was more variable, and changes mainly occurred at 150–300 °C.
(4)
The aromatic fringes in the 11 coal samples were dominated by naphthalene and 2 × 2 fringes, the contents of which accounted for more than 80% of the total fringes in the samples. The 1 × 1 fringe had a maximum value of 59% at 100 °C, and then decreases until the inflection point at 300 °C, where the content increased and decreased after 400 °C. The value of 2 × 2 fringes decreased with increasing oxidation temperature, increased slightly after 150 °C, reached 34% at 350 °C, and then increased again with a peak at 450 °C. The 3 × 3 fringe showed a trend of increasing, decreasing, and then increasing with an increase in the oxidation temperature.

Author Contributions

Q.Z.: Conceptualization, Funding acquisition, Writing-revision; L.D.: Analysis of data, Writing. All authors have read and agreed to the published version of the manuscript.

Funding

This study was supported by National Natural Science Foundation of China (grant no. 51974275) and the Xinjiang Department of Science and Technology of China (grant no. 2021D14018, Tianshan Innovative Team “Control of Coal Fire”).

Data Availability Statement

Data is available with reasonable demand.

Conflicts of Interest

The authors declare no competing interest.

References

  1. Chen, C.K.; Xian, X.F. Research on coal structure and its development. Coal Convers. 1998, 21, 7–13. [Google Scholar]
  2. Bhoi, S.; Banerjee, T.; Mohanty, K. Molecular dynamic simulation of spontaneous combustion and pyrolysis of brown coal using ReaxFF. Fuel 2014, 136, 326–333. [Google Scholar] [CrossRef]
  3. Zhang, R.; Xia, Y.C.; Tan, J.L.; Ding, S.; Xing, Y.; Gui, X. Analysis and study of molecular carbon structure of low-rank coal. China Coal 2018, 44, 88–94. [Google Scholar]
  4. Mathews, J.P.; Chaffee, A.L. The molecular representations of coal—A review. Fuel 2012, 96, 1–14. [Google Scholar] [CrossRef]
  5. Shinn, J.H. Towards an understanding of the coal structure. Fuel 1960, 39, 147. [Google Scholar]
  6. Wiser, W.H. Reported in division of fuel chemistry. Preprints 1975, 20, 122. [Google Scholar]
  7. Given, P.H. The distribution of hydroxyl in coal and its relation to coal structure. Fuel 1960, 39, 147–153. [Google Scholar]
  8. Solomon, P.R.; Blaustein, B.D.; Bockrath, B.C.; Friedman, S. Coal structure and thermal decomposition. ACS Symp. Ser. 1981, 169, 61–71. [Google Scholar] [CrossRef]
  9. Zhang, Z.; Kang, Q.; Wei, S.; Yun, T.; Yan, G.; Yan, K. Large scale molecular model construction of Xishan bituminous coal. Energy Fuels 2017, 2, 1310–1317. [Google Scholar] [CrossRef]
  10. Xue, F.J.; Hu, Y.; Zhang, Z.X. Structural model construction and quantum chemical analysis of Zhaotong lignite. Coal Chem. Ind. 2016, 39, 12–15. [Google Scholar]
  11. Zhang, S.; Ma, R.J.; Liu, L.; Zhang, H.; Liu, Q.F. Molecular structure characteristics and model construction of anthracite in Zhalute area. Coalf. Geol. Explor. 2020, 48, 62–69. [Google Scholar]
  12. Chai, S.Q.; Zeng, Q. Molecular model construction and structural characteristics analysis of Wucai-wan coal in Eastern Junggar Coalfeild based on quantum chemistry theory. J. China Coal Soc. 2022, 1–12. [Google Scholar]
  13. Ma, R.J.; Zhang, S.; Hou, D.D.; Liu, W.Y.; Yuan, L.; Liu, Q.F. Construction of molecular structure model and structure optimization of high-coal-grade coal in Fengxian, Shaanxi. J. China Coal Soc. 2019, 44, 1827–1835. [Google Scholar]
  14. Wu, S.; Jin, Z.; Deng, C. Molecular simulation of coal-fired plant flue gas competitive adsorption and diffusion on coal. Fuel 2019, 239, 87–96. [Google Scholar] [CrossRef]
  15. Wei, S.; Yan, G.C.; Zhang, Z.Q.; Liu, S.M.; Zhang, Y.F. Characterization of the molecular structure of Jincheng anthracite. J. China Coal Soc. 2018, 43, 555–562. [Google Scholar]
  16. Xiang, J.H.; Zeng, F.G.; Liang, H.Z.; Sun, P.L.; Zhang, L.; Li, M.F.; Jia, J.B. Structural modeling of Gunzhou coal macromolecules and its molecular simulation. J. Fuel Chem. 2011, 39, 481–488. [Google Scholar] [CrossRef]
  17. Ren, X.B.; Xin, W.H.; Zhang, Y.T.; Zhou, A.N. Study on the microcrystalline structure of low-order bituminous coal based on HRTEM. J. China Coal Soc. 2015, 40, 242–246. [Google Scholar]
  18. Sun, C.; Wei, X.; Kang, R.; Bin, F.; Li, S. Intrinsic sodium occurrence in Zhundong coal: Experimental observations and molecular modeling. Fuel 2021, 305, 121491. [Google Scholar] [CrossRef]
  19. Hong, D.K.; Liu, L.; Cao, Z.; Yang, C.M.; Guo, X. Molecular dynamics study of the reaction of Wucaiwan coal pyrolysis. J. China Coal Soc. 2019, 44, 271–277. [Google Scholar]
  20. Zhu, H.Q.; He, X.; Huo, Y.J.; Xie, Y.; Wang, W.; Fang, S. Molecular structure model construction and optimization of lignite. J. Min. Sci. 2021, 6, 429–437. [Google Scholar]
  21. Wornat, M.J.; Hurt, R.H.; Yang, N.Y.C.; Headley, T.J. Structural and Compositional Transformations of Biomass Chars during Combustion. Combust. Flame 1995, 100, 131–143. [Google Scholar] [CrossRef]
  22. Jia, L.; Yu, Y.; Li, Z.-P.; Qin, S.-N.; Guo, J.-R.; Zhang, Y.-Q.; Wang, J.-C.; Zhang, J.-C.; Fan, B.-G.; Jin, Y. Study on the Hg0 removal characteristics and synergistic mechanism of iron-based modified biochar doped with multiple metals. Bioresour. Technol. 2021, 332, 125086. [Google Scholar] [CrossRef]
  23. Xiao, Y.; Ye, X.X.; Liu, K.H. Study on the transformation of key functional groups in the spontaneous combustion of secondary oxidized coal. J. China Coal Soc. 2021, 46, 989–1000. [Google Scholar]
  24. Li, X.Q.; Zeng, Q. HRTEM analysis of the aggregate structure and ultrafine microporous characteristics of Xinjiang Zhundong coal under heat treatment. Sci. Rep. 2022, 12, 4994. [Google Scholar] [CrossRef]
  25. Wang, C.-P.; Duan, X.-D.; Xiao, Y.; Li, Q.-W.; Deng, J. Thermokinetic Characteristics of Coal Combustion under High Temperatures and Oxygen-Limited Atmospheres. Combust. Sci. Technol. 2022, 194, 1282–1300. [Google Scholar] [CrossRef]
  26. Yi, X.; Xiao, Y.; Lü, H.; Shu, C.M.; Deng, J.L. Thermokinetic Behavior and Microcharacterization during the Spontaneous Combustion of 1/3 Coking Coal. Combust. Sci. Technol. 2019, 191, 1769–1788. [Google Scholar] [CrossRef]
  27. GB/T212-2008; Proximate Analysis of Coal. Standardization Administration of China: Beijing, China, 2008.
  28. Zhu, H.Q.; Guo, A.D.; Qu, L.N. Experimental study on the relationship between coal thermodynamic parameters, characteristic temperature and volatile fraction. Chin. J. Saf. Sci. 2012, 22, 55–60. [Google Scholar]
  29. Liu, J.; Chen, W.S.; Qi, Q.J. Study on the propensity of spontaneous combustion of coal based on activation energy index. J. China Coal Soc. 2005, 30, 67–70. [Google Scholar]
  30. Trewhella, M.J.; Poplett, L.J.F.; Grint, A. Structure of Green River oil shale kerogen: Determination using solid state 13C n.m.r. spectroscopy. Fuel 1986, 65, 541–546. [Google Scholar] [CrossRef]
  31. Zheng, Y.H.; Dai, Z.S. Study of the effect of low temperature heat treatment on the chemical composition structure of low coalification coal by NMR. Coal Convers. 1997, 20, 54–59. [Google Scholar]
  32. Yin, Z.J.; Wang, T.; Xing, H.Z. Techniques of XPS data processing methods. Shandong Chem. Ind. 2017, 46, 89–91. [Google Scholar]
  33. Yao, M.Y.; Liu, Y.H.; Che, D.F. Study on the morphology of nitrogen in Yibin coal and its variation pattern. J. Xi’an Jiaotong Univ. 2003, 37, 759–763. [Google Scholar]
  34. Chang, H.Z.; Wang, C.H.; Zeng, F.G.; Li, J.; Li, W.Y.; Xie, K.C. Comparative XPS analysis of the surface structure of coal microfraction groups with different reduction levels. J. Fuel Chem. 2006, 34, 389–394. [Google Scholar]
  35. Grzybek, T.; Pietrzak, R.; Wachowska, H. X-ray photoelectron spectroscopy study of oxidized coals with different sulphur content. Fuel Process. Technol. 2002, 77, 1–7. [Google Scholar] [CrossRef]
  36. Yuegang, T.; Xuan, H.; Chunyuan, L.; Xu, M. Effects of Coal Rank and High Organic Sulphur on the Structure and Optical Properties of Coal-based Graphene Quantum Dots. Acta Geol. Sin. 2018, 92, 1218–1230. [Google Scholar]
  37. Kozłowski, M. XPS study of reductively and non-reductively modified coals. Fuel 2004, 83, 259–265. [Google Scholar] [CrossRef]
  38. Niekerk, D.V.; Mathews, J.P. Molecular representations of Permian-aged vitrinite-rich and inertinite-rich South African coals. Fuel 2010, 89, 73–82. [Google Scholar] [CrossRef]
  39. Nosé, S. A unified formulation of the constant temperature molecular dynamics methods. J. Chem. Phys. 1984, 81, 511–519. [Google Scholar] [CrossRef] [Green Version]
  40. Marzec, A. Intermolecular interactions of aromatic hydrocarbons in carbonaceous materials: A molecular and quantum mechanics. Carbon 2000, 38, 1863–1871. [Google Scholar] [CrossRef]
  41. Yu, H.Y.; Sun, X.G. Infrared spectroscopic study on the hydrocarbon formation mechanism of Late Permian coal in Leping, Jiangxi. Spectrosc. Spectr. Anal. 2007, 27, 858–862. [Google Scholar]
  42. Feng, L.; Zhao, G.; Zhao, Y.; Zhao, M.; Tang, J. Construction of the molecular structure model of the Shengli lignite using TG-GC/MS and FTIR spectrometry data. Fuel 2017, 203, 924–931. [Google Scholar] [CrossRef]
  43. Zhang, W.; Zeng, F.G. Infrared spectroscopic analysis of hydroxyl groups in moderately metamorphosed coal. J. Taiyuan Univ. Technol. 2005, 36, 545–548. [Google Scholar]
  44. Xiang, J.H.; Zeng, F.G.; Liang, H.Z.; Li, M.F.; Song, X.X.; Zhao, Y.Y. Carbon structure characteristics of coals with different degrees of metamorphism and their evolutionary mechanisms. J. China Coal Soc. 2016, 41, 1498–1506. [Google Scholar]
  45. Qi, X.Y. Oxidation and self-reaction processes of reactive groups in coal. J. China Coal Soc. 2011, 36, 2133–2134. [Google Scholar]
Figure 1. 13C-NMR spectrum of Kerjian coal.
Minerals 12 01508 g001
Figure 2. XPS spectra of Kerjian coal with C, O, N and S elements.
Minerals 12 01508 g002
Figure 3. Image analysis process (ae) and aromatic fringe distributions (f) of Kerjian coal.
Minerals 12 01508 g003
Figure 4. Two-dimensional structure (a) and initial 3D structural model (b) of Kerjian coal.
Minerals 12 01508 g004
Figure 5. Three-dimensional model of Kerjian coal molecule (a: Geometry optimized model, b: Energy optimized model).
Minerals 12 01508 g005
Figure 6. FTIR spectra of different functional groups of Kerjian coal (a: Hydroxyl groups, b: Aliphatic hydrocarbons, c: Oxygen-containing functional groups, d: Aromatic structure).
Minerals 12 01508 g006
Figure 7. XRD spectrum of Kerjian coal.
Minerals 12 01508 g007
Figure 8. TG/DTG curve of Kerman coal.
Minerals 12 01508 g008
Figure 9. TG/DTG curves (a) and characteristic temperatures changes (b) of coal samples.
Minerals 12 01508 g009
Figure 10. Activation energy change with different oxidized coal samples.
Minerals 12 01508 g010
Figure 11. Original FTIR spectra (a) and FTIR differences of spectra (b).
Minerals 12 01508 g011
Figure 12. Changes of different functional groups at different temperatures (a: Hydroxyl groups, b: Aliphatic hydrocarbons, c: Oxygen-containing functional groups, d: Aromatic structure).
Minerals 12 01508 g012
Figure 13. Distribution of aromatic fringes in coal samples.
Minerals 12 01508 g013
Table 1. Proximate and ultimate analyses of Kerjian coal.
Proximate Analysis/(mass)%Ultimate Analysis/(mass)%H/CO/CN/CS/C
MadAadVadFCadCadHadOadNadSt.d
2.593.7337.3356.3572.364.7315.121.340.140.7840.1570.0160.001
Table 2. Curve-fitted 13C-NMR of Kerjian coal.
PeakCentrePeak TypesAreaRelative Content/%Contribution
114.1Gaussian1 814.097.56R-CH3
221.6Gaussian1 633.306.81Ar-CH3
329.7Gaussian2 383.729.94CH2-CH2
435.9Gaussian720.893.01CH2
540.8Gaussian946.703.95C, CH
647.1Gaussian434.301.81C, CH
753.6Gaussian665.652.78O-CH3, O-CH2
861.8Gaussian679.152.83O-CH
9111.0Gaussian1 224.705.11Ar-H
10119.5Gaussian1 910.837.97Ar-H
11127.1Gaussian3 860.1116.09Ar-H
12135.7Gaussian2 026.588.45Bridgehead (C-C)
13142.4Gaussian1 321.315.51Ar-C
14153.2Gaussian1 951.878.14Ar-O
15177.9Gaussian7.070.03COOH
16182.9Gaussian331.231.38COOH
17193.8Gaussian1 219.875.09C=O
18205.2Gaussian690.992.88C=O
19217.9Gaussian162.380.68C=O
Table 3. Carbon structural parameters of Kerjian coal.
Parameters f a f a C f a f a N f a H f a P f a S f a B f a l f a l * f a l H f a l O
Percentage/%61.3210.0551.2622.1029.178.145.518.4538.6814.3718.75.61
Note: f a (aromatic), f a C (carbonyl), f a (in an aromatic ring), f a N (unprotonated and aromatic), f a H (aromatic and protonated), f a P (phenolic or phenolic ether), f a S (alkylated aromatic), f a B (aromatic bridgehead), f a l (aliphatic), f a l * (CH3 or unprotonated), f a l H (CH- or CH2), f a l O (bonded to oxygen).
Table 4. Curve-fitted XPS of Kerjian coal.
ElementBinging Energy/eVWidthRelative Content/%Contribution
C 1s284.801.3774.35C-C, C-H
285.671.4417.34C-O
287.11.435.57C=O
289.281.542.73COO-
O 1s531.51.5018.51C=O
532.81.4451.22C-O
5341.3628.52COO-
535.42.41.76Adsorbed oxygen
N 1s398.911.9231.85Pyridine nitrogen (N-6)
400.291.4444.73Pyrrole nitrogen (N-5)
401.41.5815.57Quaternary nitrogen (N-Q)
4032.407.85Oxidized nitrogen (N-X)
S 2p163.661.4436.83Aliphatic sulphur
164.921.4418.81Aromatic sulphur
168.481.4429.36Sulfone
169.741.4415.00Inorganic sulphate
Table 5. Aromatic structure of Kerjian coal.
TypeNumberTypeNumber
Minerals 12 01508 i0011Minerals 12 01508 i0024
Minerals 12 01508 i0031Minerals 12 01508 i0041
Minerals 12 01508 i0051
Table 6. Molecular structural parameters of Kerjian coal.
Molecular StructureMolecular MassElemental Analysis/%
CHON
C142H112N2O22219877.585.1416.011.27
Table 7. Energy changes of structural optimization of Kerjian coal (kcal/mol).
StateTotal EnergyValence EnergyNon-Bond Energy
EBEAETEIEHEvanEE
Initial condition6522.42181.587.8218.86.90.04055.3−27.9
Geometry optimization763.491.7117.4197.84.20.0385.0−32.8
Energy optimization669.382.0102.1184.84.8−5.0329.3−28.4
Table 8. Hydroxyl group parameters of Kerjian coal.
PeakCentrePeak TypesAreaRelative Content/%Contribution
13615.86 Gaussian0.471.52Free-OH
23541.91 Gaussian4.8315.72OH-π
33433.72 Gaussian13.0942.58Self-associated OH
43298.19 Gaussian8.6528.15OH-OR2
53178.91 Gaussian2.748.92Tightly bound OH tetramers (Cyclic OH)
63054.71 Gaussian0.963.12OH-N
Table 9. Aliphatic hydrocarbon parameters of Kerjian coal.
PeakCentrePeak
Types
AreaRelative
Content/%
Contribution
12963.13Gaussian2.1518.23Asymmetric stretching vibration of methyl (Asym.CH3)
22928.58Gaussian5.2044.03Asymmetric stretching vibration of methylene (Asym.CH2)
32885.27Gaussian2.3820.15CH stretching vibration
42854.77Gaussian2.0817.58Symmetric stretching vibration of methylene (Sym.CH2)
Table 10. Oxygen-containing functional group parameters of Kerjian coal.
PeakCentrePeak TypesAreaRelative Content/%Contribution
11735.04Gaussian7.626.00Carbonyl stretching vibration of esters or aliphatic
21691.12Gaussian12.8210.10Carboxyl
31627.73Gaussian30.4423.98Conjugated C=O stretching vibration
41556.19Gaussian8.876.98Aromatic C=C stretching vibration (Aromatic C=C)
51505.35Gaussian7.415.83Aromatic C=C stretching vibration
61458.50Gaussian14.4111.35CH3 antisymmetric vibration, CH2 deformation vibration (Antisym.CH3, CH2)
71393.27Gaussian10.938.61a-CH2 variable angle vibration
81331.51Gaussian9.707.64CH3 symmetric deformation vibration (Sym.CH3)
91276.46Gaussian9.407.40C-O vibration of alcohol, phenol, ether, and ester
101223.11Gaussian5.794.56C-O vibration of alcohols, phenols, ethers, and esters
111179.02Gaussian4.143.26C-O vibration of alcohols, phenols, ethers, and esters
121135.96Gaussian2.521.98C-O vibration of alcohols, phenols, ethers, and esters
131090.31Gaussian2.281.79C-O vibration of alcohols, phenols, ethers, and esters
141045.47Gaussian0.660.52C-O vibration of alcohols, phenols, ethers, and esters
Table 11. Aromatic structural parameters of Kerjian coal.
PeakCentrePeak TypesAreaRelative Content/%Contribution
1886.02Gaussian0.155.10Penta-substituted benzene
2872.27Gaussian0.3813.36Penta-substituted benzene
3851.97Gaussian0.3712.86Tetra-substituted benzene
4831.32Gaussian0.7827.17Tetra-substituted benzene
5811.87Gaussian0.3110.94Tetra-substituted benzene
6788.16Gaussian0.124.17Tri-substituted benzene
7773.94Gaussian0.217.18Tri-substituted benzene
8758.16Gaussian0.4114.35Tri-substituted benzene
9740.30Gaussian0.144.87Di-substituted benzene
Table 12. Curve-fitted XRD of Kerjian coal.
Peak2θ/°Peak TypeFWHM
γ12.94Gaussian6.15
00223.63Gaussian7.72
10045.32Gaussian14.35
Table 13. Microcrystalline structural parameters of Kerjian coal samples.
d002d100LaLcNP
3.7612.0012.2710.982.920.34
Table 14. Characteristic temperature points of Kerjian coal.
T1/°CT2/°CT3/°CT4/°CT5/°CT6/°CT7/°C
85.4162229.4278.7461.4531.6668.8
Table 15. Reaction kinetic parameters of Kerjian coal.
ParametersStage 1Stage 2Stage 3Stage 4
E/kJ/mol55.75857.615133.693194.013
R20.950780.964080.930140.98407
Publisher’s Note: MDPI stays neutral with regard to jurisdictional claims in published maps and institutional affiliations.

