Article

Distribution of Mercury in the Water-Suspended Matter-Bottom Sediments System of the Lake Onego Water Area

1
V.S. Sobolev Institute of Geology and Mineralogy, Siberian Branch of the Russian Academy of Sciences (RAS), 3 Akad. Koptyug Ave., 630090 Novosibirsk, Russia
2
Department of Geography, Herzen State Pedagogical University of Russia, 48 Moika Emb., 191186 Saint-Petersburg, Russia
3
Northern Water Problems Institute, The Karelian Research Centre, Russian Academy of Sciences, 50 Alexander Nevsky Ave., 185030 Petrozavodsk, Russia
*
Author to whom correspondence should be addressed.
Minerals 2022, 12(11), 1410; https://doi.org/10.3390/min12111410
Submission received: 22 September 2022 / Revised: 3 November 2022 / Accepted: 4 November 2022 / Published: 6 November 2022
(This article belongs to the Special Issue Environment and Geochemistry of Sediments)

Abstract

:
This paper presents for the first time data on the lateral distribution of total mercury in the water-suspended matter-bottom sediments system for the entire water area of Lake Onego, the second largest lake in Europe. The patterns of the total mercury vertical distribution in two types of bottom sediments stratification, have been established. The total mercury content in the Lake Onego water averages 0.32 ± 0.07 μg/L. The most common form of mercury in water is dissolved+colloid, with the exception of water samples from the Kondopoga and Povenetsky Bays. In the material of the sedimentation traps, the mercury content is 0.5 ± 0.3 μg/g, and in the upper and lower parts of the bottom sediments section is 0.067 ± 0.003 and 0.041 ± 0.001 μg/g, respectively. The paper considers the factors responsible for the mercury content increasing from the bottom sediments up through the sections. These factors include anthropogenic pollution, migration of Hg and its redeposition at the geochemical barrier together with Fe and Mn.

1. Introduction

Mercury is a toxic element. According to the World Health Organization, Hg is among the ten most dangerous chemicals [1], due to its high mobility and bioaccumulative ability [2]. Mercury represents the greatest danger when it enters aquatic ecosystems, where it can be transformed into a more toxic form - methylmercury, which accumulates in aquatic food chains [3].
In aquatic ecosystems, most toxicants accumulate in the bottom sediments [4] and organisms living in close contact with these deposits are exposed to chemicals either directly or through food chains.
The formation of methylmercury (MeHg) is one of the main processes occurring in aquatic ecosystems. The methylation process takes place mainly in the water column, as well as in the sediments of fresh and marine waters, because of interrelated biochemical, chemical and photochemical processes. The methylation of Hg(II) under natural conditions is primarily a biological process, mediated by sulfate-reducing and iron-reducing bacteria [5].
Methylmercury easily accumulates in organisms and is bio-amplified in food chains to concentrations significantly higher than concentrations in surface waters [6].
Methylmercury is a widespread and neurotoxic pollutant that can cause a deficiency of essential elements as a result of competition for the active sites of biologically important molecules affecting the central nervous system of living organisms [7].
One of the main research objects of freshwater ecosystems are lakes, which play an important role in the processes of chemical elements concentration, as they are the final reservoirs of runoff, along with seas and oceans. In the large lakes of Europe, the processes of chemical elements redistribution are comparable to the inland seas. The transformation of inorganic mercury to monomethylmercury in the aquatic environment can lead to high concentrations of monomethylmercury in fish and have a negative impact on the health of wild animals and people who consume fish [8].
In freshwater ecosystems, the predominant sources of mercury are the direct atmospheric deposition, wastewater and river runoff. The atmospheric deposition of mercury is especially important in lakes with a large ratio of the water surface area to the volume of lake water and small catchment areas [9].
Mercury enters freshwater systems from various sources and undergoes complex transport pathways [10]. These pathways correspond to their characteristic processes of mercury form transformation. As a result, for each of its entering ways, the freshwater ecosystems, mercury can be in its own form, which, in turn, greatly affects its future condition in the freshwater ecosystem [11].
As is the case for almost all global trace element balances, there are uncertainties regarding the estimation of the anthropogenic and natural mercury amount “stored” in various environmental components, flows between mercury reservoirs and the rate of mercury removal from the biosphere. At the moment, there is a large number of studies devoted to this problem [10,12,13,14,15,16,17,18]. However, the interpolation of such data on unique objects will give a large number of errors in relation to estimates. This is due to the fact that when studying the ecosystem of a very large lake (water area >1000 km2), it is necessary to take into account the uneven development of the large- and small-scale hydrodynamic processes, as well as the mosaic nature of anthropogenic impact, which does not manifest itself immediately, often with a long time break. Such unique objects include Lake Onego.
The aim of this work is to assess the mercury distribution in the components of the water-suspended matter-bottom sediments system in the Lake Onego water area.

2. Materials and Methods
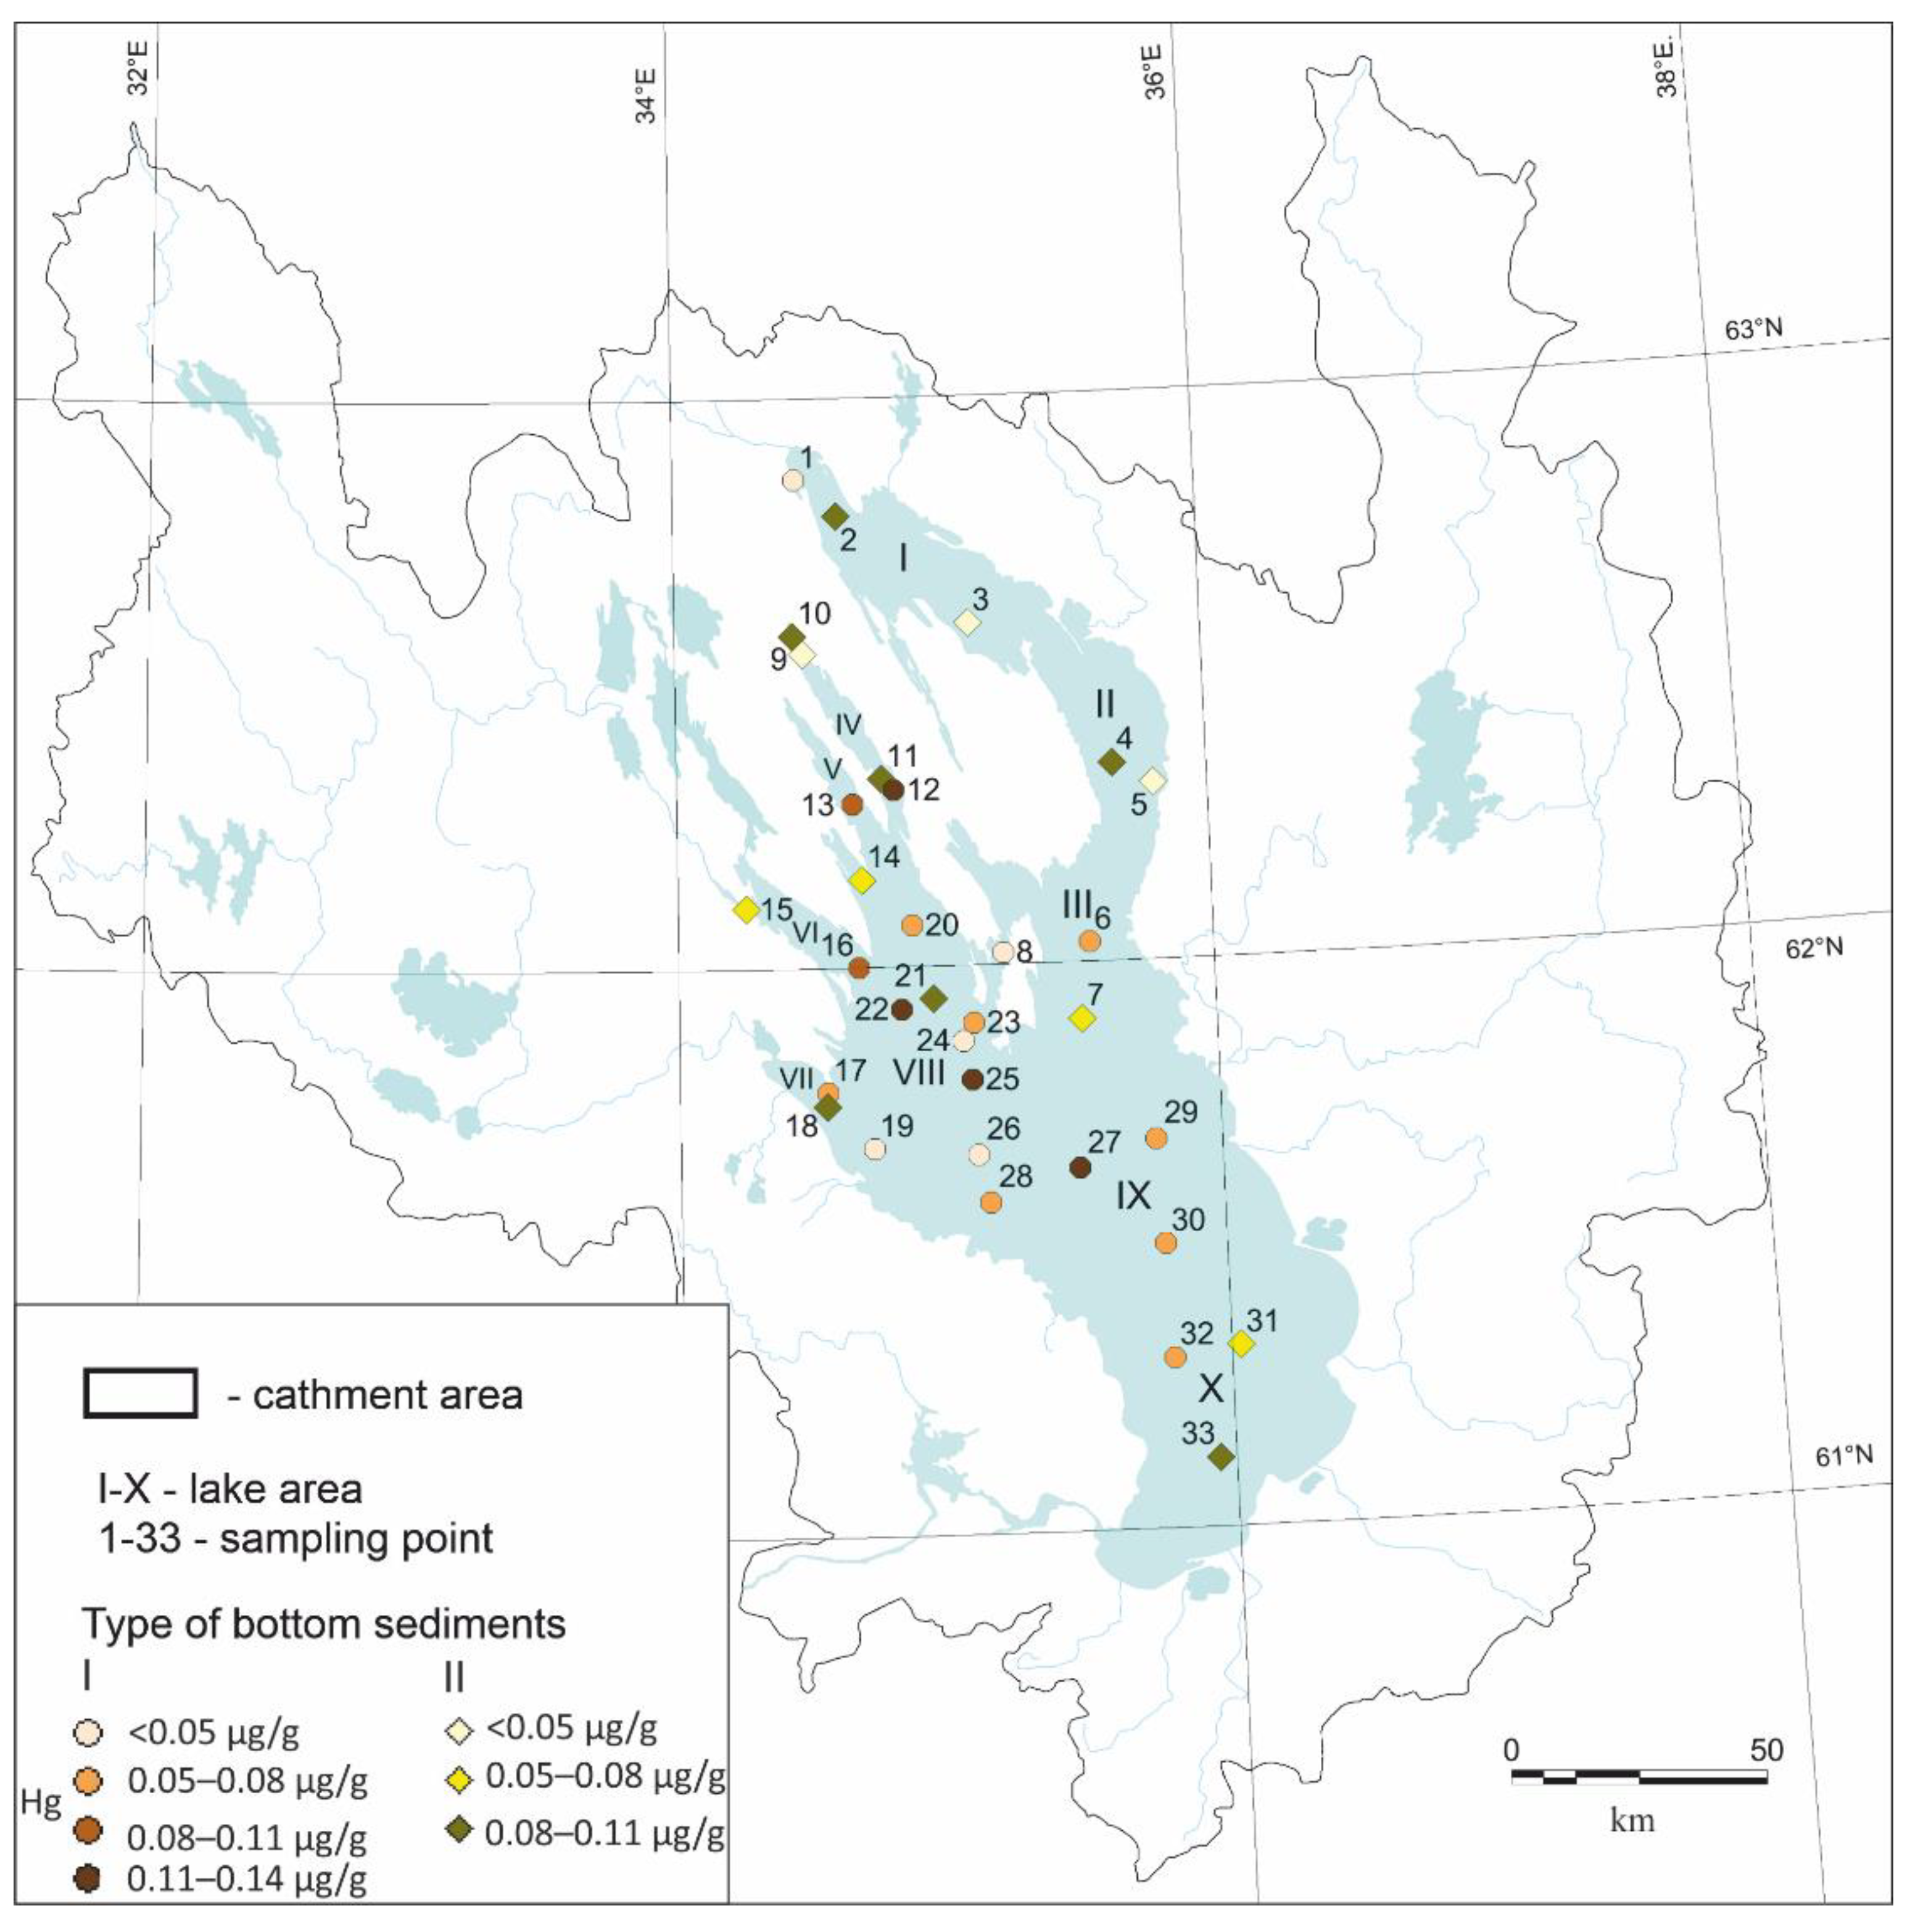
2.1. Study Area

The object of the study is Lake Onego. Lake Onego (61.69° north latitude, 35.66° east longitude, 33 m above sea level), with a catchment area of 62.8 × 10³ km2, a volume of water mass (291.7 km3) and water area (9720 km2) is the second largest waterbody in Europe. It is located in the area of the two large geological structures junction - the southeastern slope of the Baltic Crystal Shield and the Russian Platform. The lake basin was formed in the period between the Archean and Proterozoic and experienced a complex path of tectonic transformations in continental and marine environments. The last glaciation deepened the depression and blocked the relief with a cover of glacial, fluvio- and limnoglacial deposits. The lake basin has a complex structure, which determines the difference in the coastline outlines and the bottom relief form. A complex relief with large depth differences, an abundance of bays and islands, characterizes the northern part of the lake [19].
Lake Onego has 1152 tributaries of which 52 are more than 10 km long. The main tributaries are the Vodla, Shuya and Suna Rivers, the average annual flow rate which is 4.36, 3.1 and 2.5 km3/year, respectively. According to published data, the main source of mineral and organic substances entering Lake Onego is river runoff, which provides 60% of the runoff into the lake [19,20].
The territory of the Lake Onego basin is the most economically developed part of the Republic of Karelia, Russia. The main environmental risk factor is the anthropogenic impact of industrial centers located on the shores of the lake. Such centers include the cities of Petrozavodsk (mechanical engineering, construction, food industry, transport and utilities) and Kondopoga (pulp and paper mill).
In addition, the uniqueness of Lake Onego lies in the fact that shungite rocks come to the daytime surface in the catchment area. Shungite rocks (widespread in the northern part of the Lake Onego catchment area) are a complex of volcanogenic-sedimentary rocks of Precambrian age (~2 billion years) with a large amount of carbonaceous matter [21]. In a broader sense, they can be attributed to “black shales”, but taking into account that in this term for carbonaceous matter, there is no specificity of organic matter, both in composition and in genesis [22]. Black shales, and shungite-bearing rocks, are characterized by high concentrations of Hg and a number of other rare elements. For example, the Hg content in maksovites (a type of shungite-bearing rocks) is on average 0.79 ± 0.41 g/t [22], which significantly exceeds the Clarke number of mercury for crustal rocks—0.08 g/t [23].

2.2. Sampling

The actual material was sampled in 2016–2021 from the "Ecologist" research vessel, throughout the entire water area of Lake Onego: Povenetsky Bay, Zaonezhsky Bay, Small Onego, Lizhemskaya Bay, Unitskaya Bay, Kondopoga Bay, Petrozavodsk Bay, Big Onego, Central Onego, South Onego (Figure 1). A comprehensive sampling of the lake system components was made, water samples were taken in conjunction with the suspended matter, the sedimentary material from the sedimentation traps and samples of bottom sediments.
Water sampling was carried out using a Ruther RT bathometer (Hydrometpribor, Riga, Latvia). The separation of the suspended matter in the water was carried out by vacuum filtration on specially prepared pre-weighted membrane filters with a pore diameter of 0.45 μm. The aqueous filtrates were preserved with concentrated HNO3 at the rate of 1 mL of acid per 100 mL of the sample.
Since suspended matter from lake water entering the bottom sediments is complex, having a different particle size, multicomponent system of terrigenous, biogenic and chemical materials, its study required the installation of sedimentation traps at more than two dozen points in various areas of Lake Onego. For this purpose, a simplified version of the UST–100 sedimentation trap (ST) was made in the Laboratory of Paleolimnology, NWPI KarRS RAS, Petrozavodsk, Russia. The installation of the equipment was carried out, in accordance with the recommendations given in [24]. The exposure time of the sedimentation trap was one year. The detailed information about the sedimentation traps and the method of their installation is described in [25].
Bottom sediment cores were sampled using Limnos, GOIN, Perfiliev samplers and heavy gravity core samplers. In total, 34 cores of bottom sediments up to 3.2 m long and with sampling steps from 1 cm to 10 cm (260 samples) were sampled.

2.3. Analytical Methods

Analytical studies of the lake components were conducted in the Analytical Center for multi-elemental and isotope research SB RAS, Novosibirsk, Russia.
The suspended matter from the water surface horizon of Lake Onego was isolated by filtering a water sample through a 0.45 μm membrane filter before they it was clogged. The filters with suspended matter were dried in a drying cabinet at 105 °C to a constant mass. The decomposition of the filters was carried out in an acidic condition (in 10 mL of concentrated nitric acid) in a microwave system SpeedWave®four (Berghof, Berlin, Germany). Then, the resulting solution was brought to a volume of 20–25 mL. The Hg content in the obtained solutions and filtered water was determined by “cold vapor” atomic absorption spectroscopy on an analyzer (Perkin Elmer 3030B, Waltham, MA, USA). The detection limit is 0.02 μg/L; the relative measurement error is 20%.
The total mercury content in the sedimentary material samples of the sedimentation traps and bottom sediments was determined, in accordance with an accredited methodology М 03-09-2013 by the Russian Federal Environmental Regulations, using the analyzer “RA-915M” (Lumex, St. Petersburg, Russia) with the device “RP-91C” (Lumex, St. Petersburg, Russia). The detection limit is 1.0 μg/kg.
Major (Ca, Na, K, Al, Fe, Mg, Mn) and trace (Sb, Sr, Ba, Be, Cd, Co, Ni, Cr, Zn, Pb etc.) elements in the samples of the suspended matter, sedimentation traps material and bottom sediments were determined via atomic absorption using a Solaar M6 instrument, equipped with a Zeeman and deuterium background corrector (Thermo Electron, Waltham, MA, USA). Two versions of the atomic absorption were used: flame atomization (acetylene-air and nitrous oxide-acetylene) to quantify the content of a wide range of chemical elements, the content of which, in the samples was >0.0001 mass%, and the electrothermal atomization for the quantitative determination of the lower contents (less than 0.000001 mass%).
The laboratory has a set of more than 40 standard samples. Specifically, we used the Russian standard sample BIL1 (standard sample composition of the bottom silt of Lake Baikal) to control the reliability of the results. The standard samples of the appropriate composition were analyzed with each batch of samples, which allowed us to control the accuracy of the analysis. The laboratory regularly participates in Russian Interlaboratory comparison tests that confirmed a high quality assessment of the atomic absorption analysis.
The measurement range of the mass fraction of elements (µg/g) is presented in Table 1. The limits of the total relative measurement error (±δ at P = 0.95) are ±30%. The normalization of the error characteristics was carried out taking into account the possible dilution of the analyzed solution, but not more than 1000 times.

2.4. Data Analysis

To explore the correlations between the data, the concentration values of the chemical elements were subjected to a hierarchical cluster analysis. Based on the indexes of the correlation coefficients, similar paired groups of chemical elements were connected, then the next most similar paired groups, and so on, until all chemical elements were grouped on the dendrogram by averaging [26].
Analytical data processing was carried out using Microsoft Office Excel software package and Statistica 6.0 (6.0, Dell, Novosibirsk, Russian).

3. Results

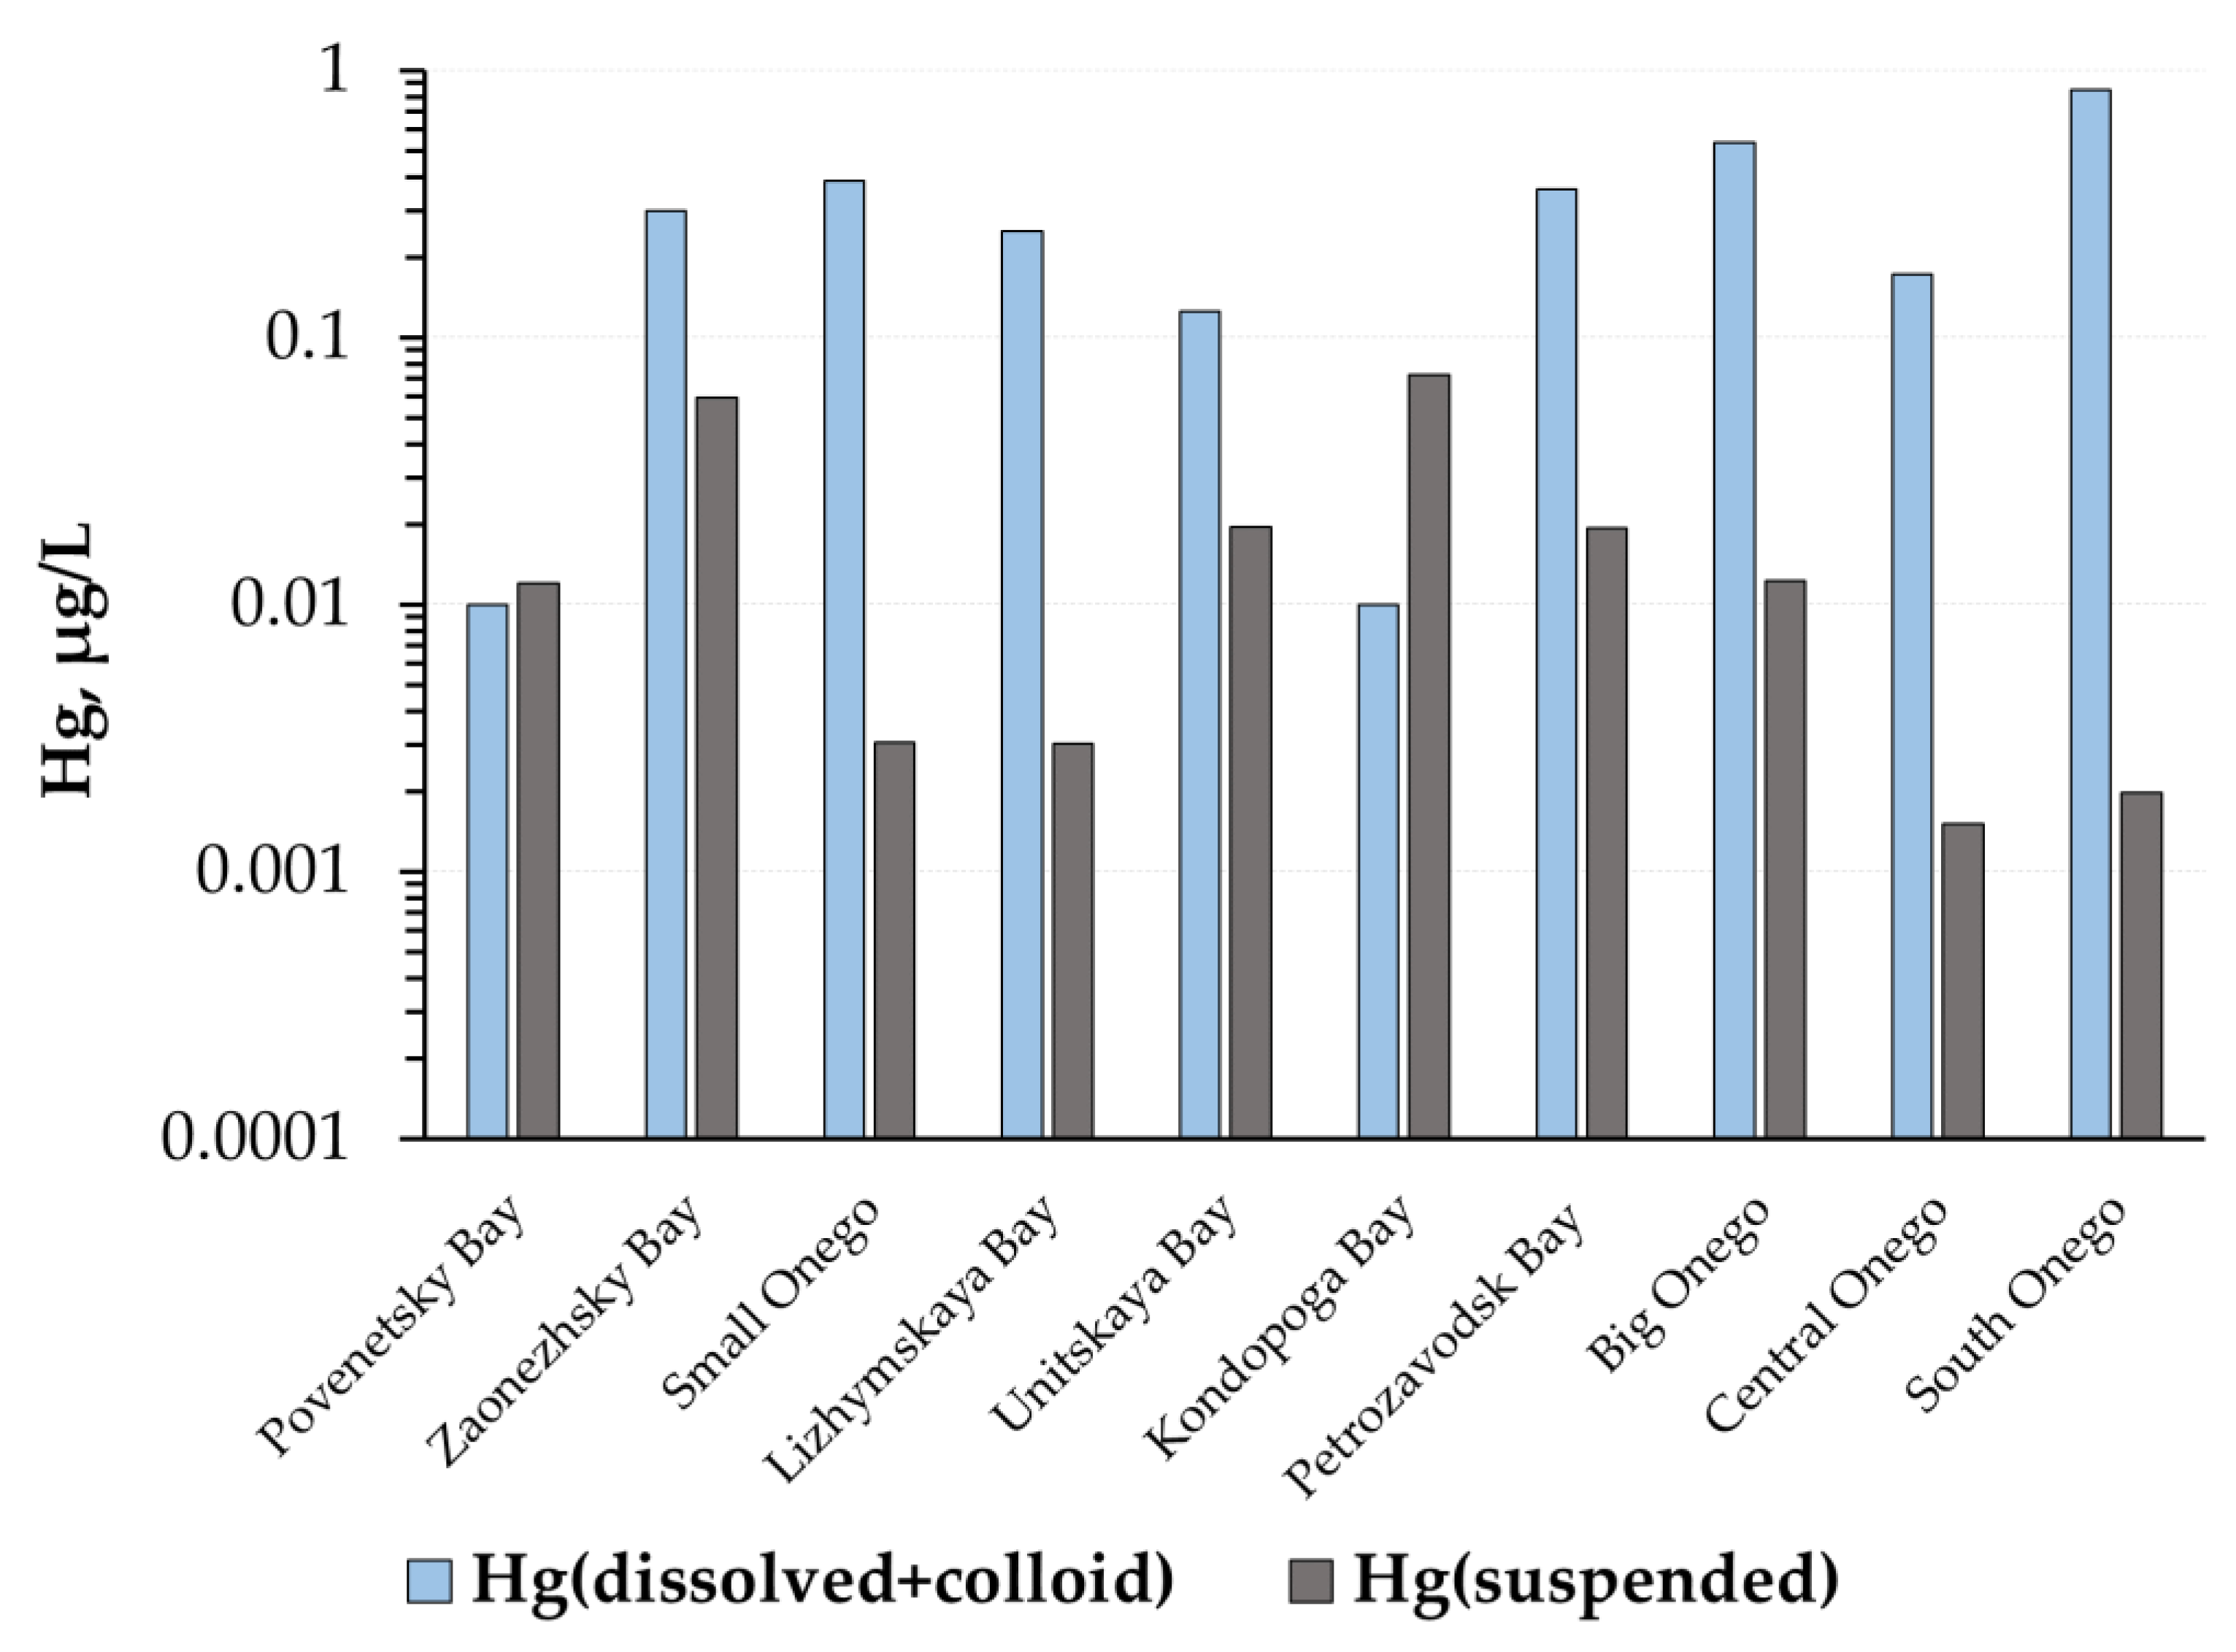
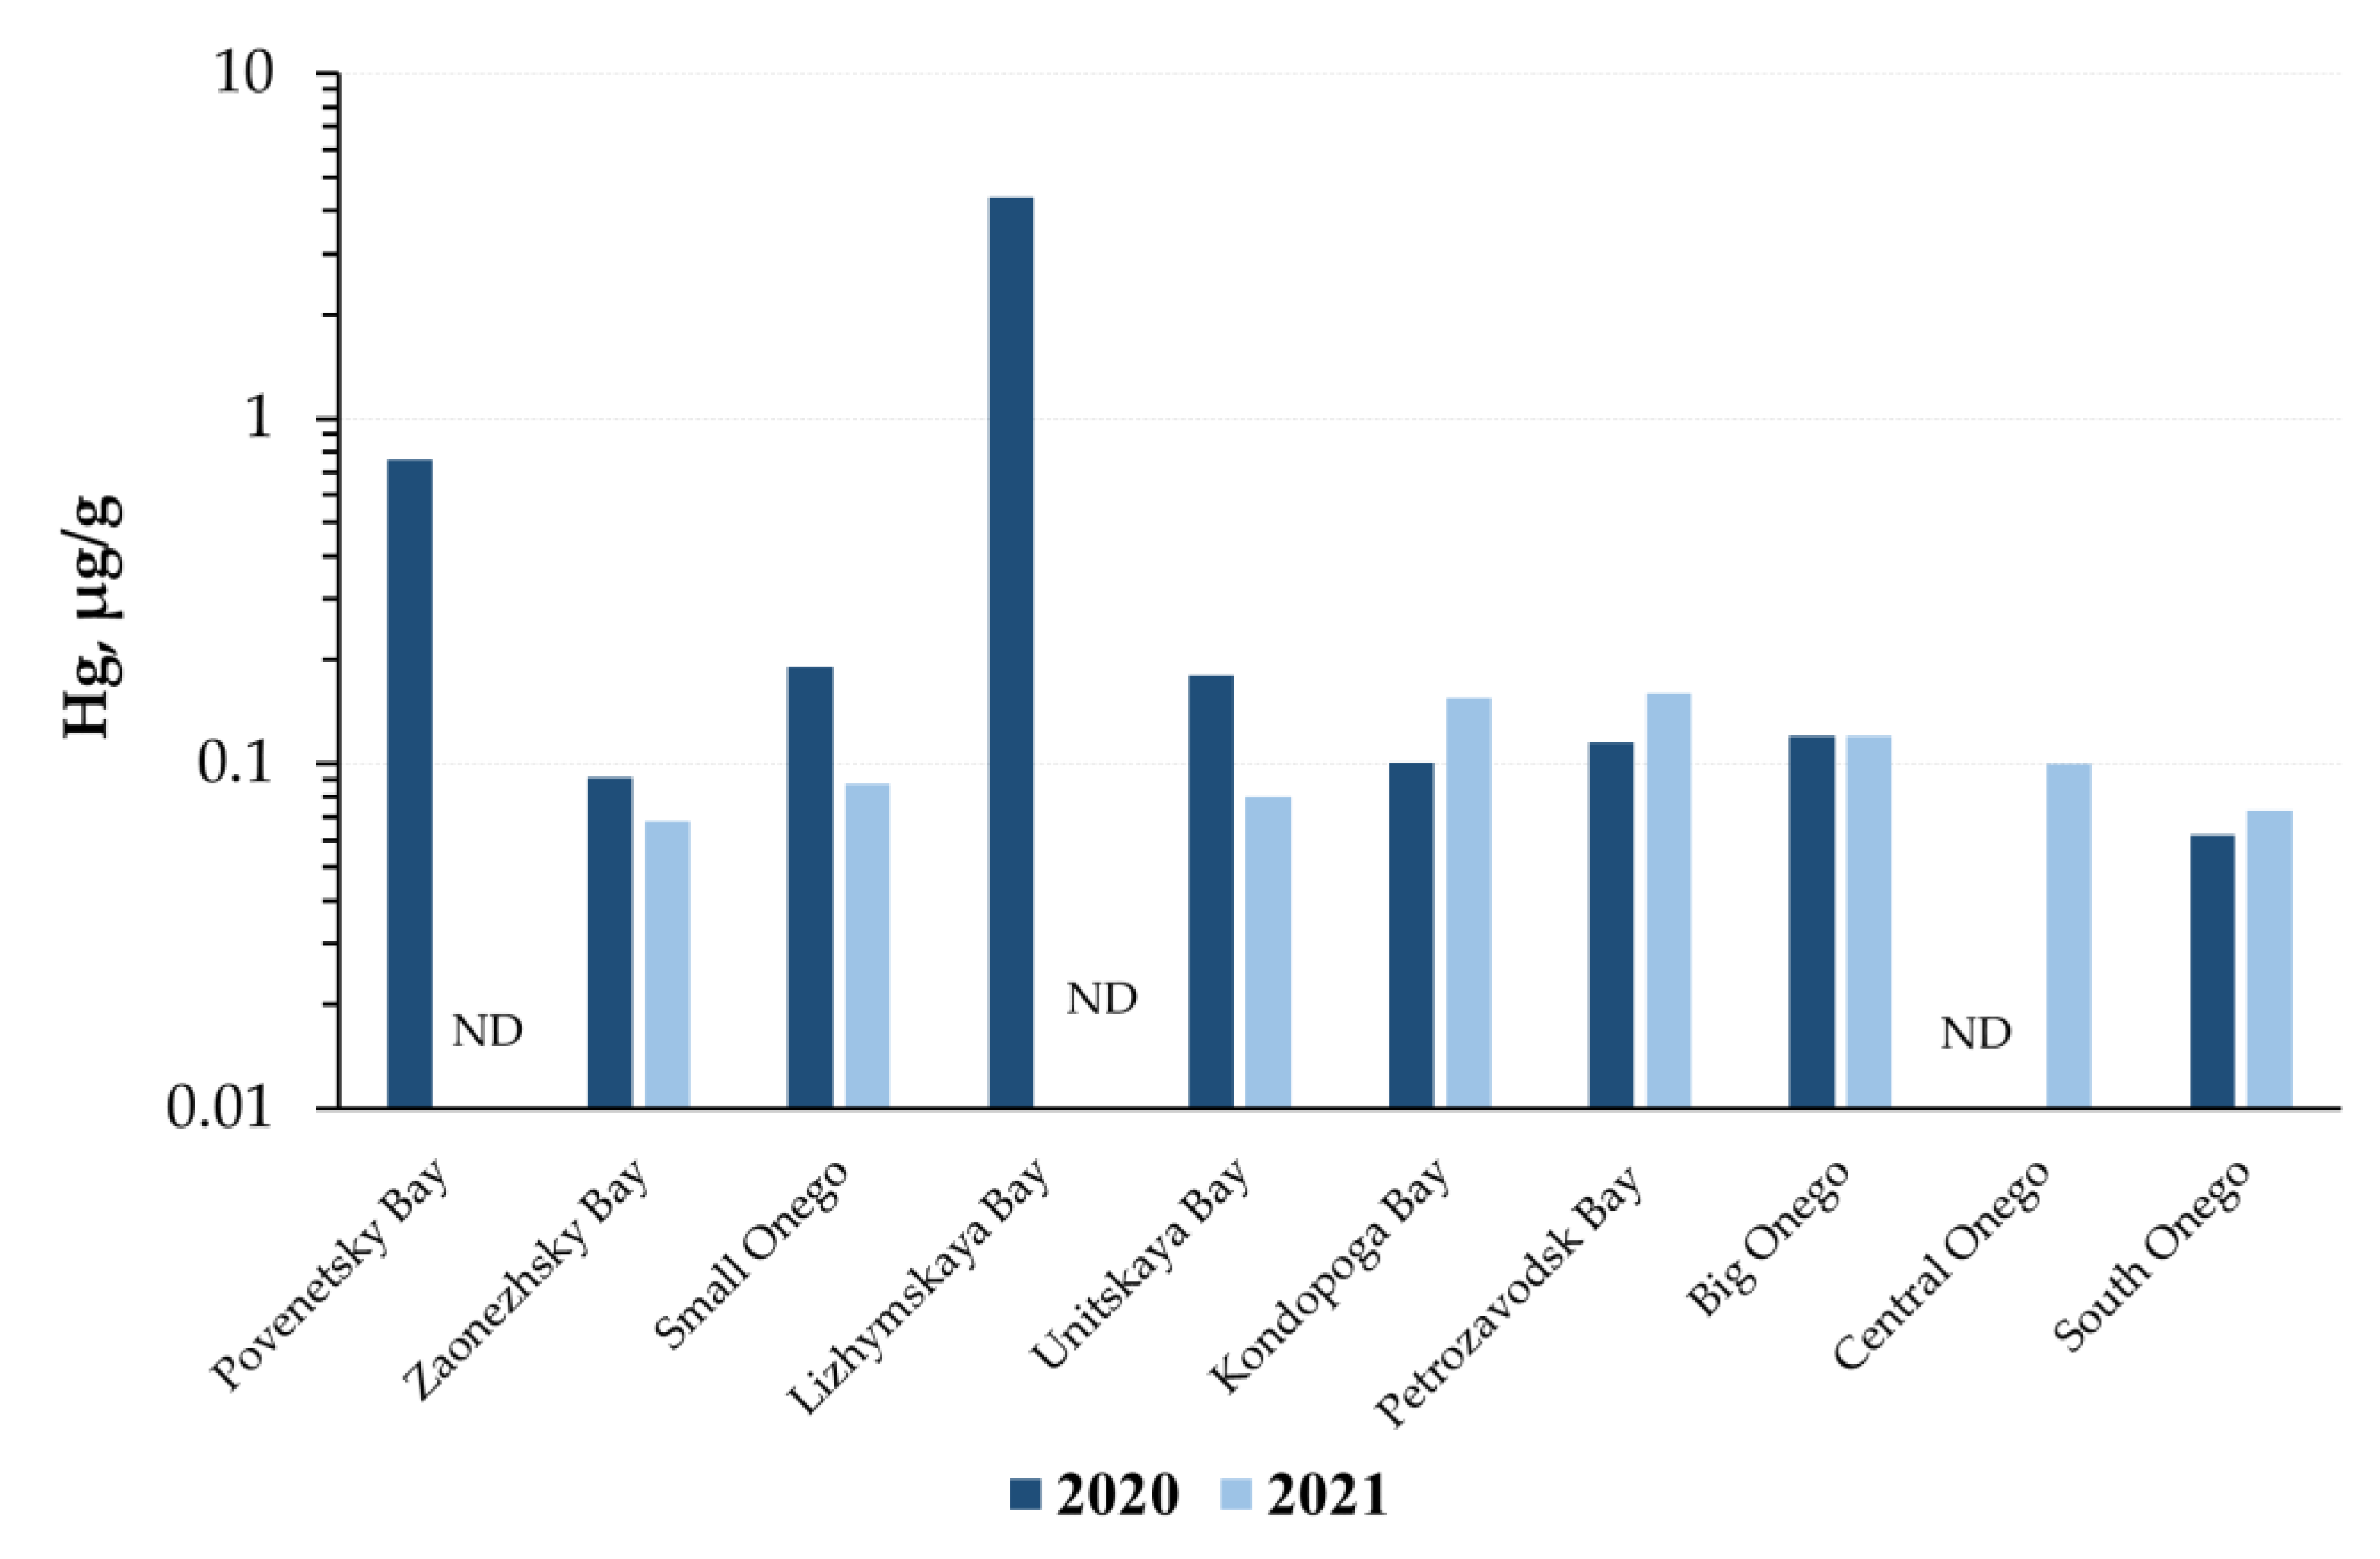
3.1. Mercury in the Water–Suspended Matter System

The total mercury content in the Lake Onego water averages 0.32 ± 0.07 μg/L. The minimum values were obtained in water samples of Povenetsky Bay (0.022 μg/L). The maximum values are typical for water samples taken in South Onego (0.852 μg/L) and Big Onego (0.552 μg/L). These values exceed the maximum permissible concentrations (0.5 μg/L) [27].
The values obtained earlier by other researchers, on average, are lower than those obtained by us and do not exceed the maximum permissible concentrations. For instance, the concentration of mercury in the water of Petrozavodsk Bay is similar to the concentrations of mercury for this area obtained in 2016 by [28]. Similar values were reported in [29]. According to these, the average mercury content in water is 0.028 μg/L (0.017–0.039 μg/L).
The mercury concentration in suspended matter in the Lake Onego water varies from 0.002 μg/L (Lizhemskaya Bay) to 0.073 μg/L (Zaonezhsky Bay), the average content is 0.024 ± 0.006 μg/L. The mercury content in the dissolved+colloid form is higher than the mercury content in the suspended form, and varies in a wide range: from 0.01 μg/L in Kondopoga Bay and Povenetsky Bay to 0.85 μg/L in South Onego. Thus, the predominant form of mercury in water is dissolved + colloid (Figure 2). Mercury, in suspended form prevails only in the Kondopoga and Povenetsky Bays.
We found that the mercury content in the sedimentation traps material varies over a wide range of 0.062–4.37 μg/g. It is worth noting that high values are observed only in two areas of Lake Onego: in the Lizhemskaya (4.37 μg/g) and in Povenetsky Bays (0.76 μg/g). The obtained values exceed the values of the maximum permissible concentration (0.5 μg/g) and require further study and identification of the mercury source [27]. For the remaining areas, the average mercury concentration in the sedimentation trap material is 0.12 μg/g.
To confirm the results obtained, sedimentation traps were re-installed in the same areas of the lake. In 2021, similar values of mercury concentrations were obtained in the material of the sedimentation traps (Table 2, Figure 3). The sedimentation traps located in the Lizhemskaya and Povenetsky Bays could not be recovered in 2021.

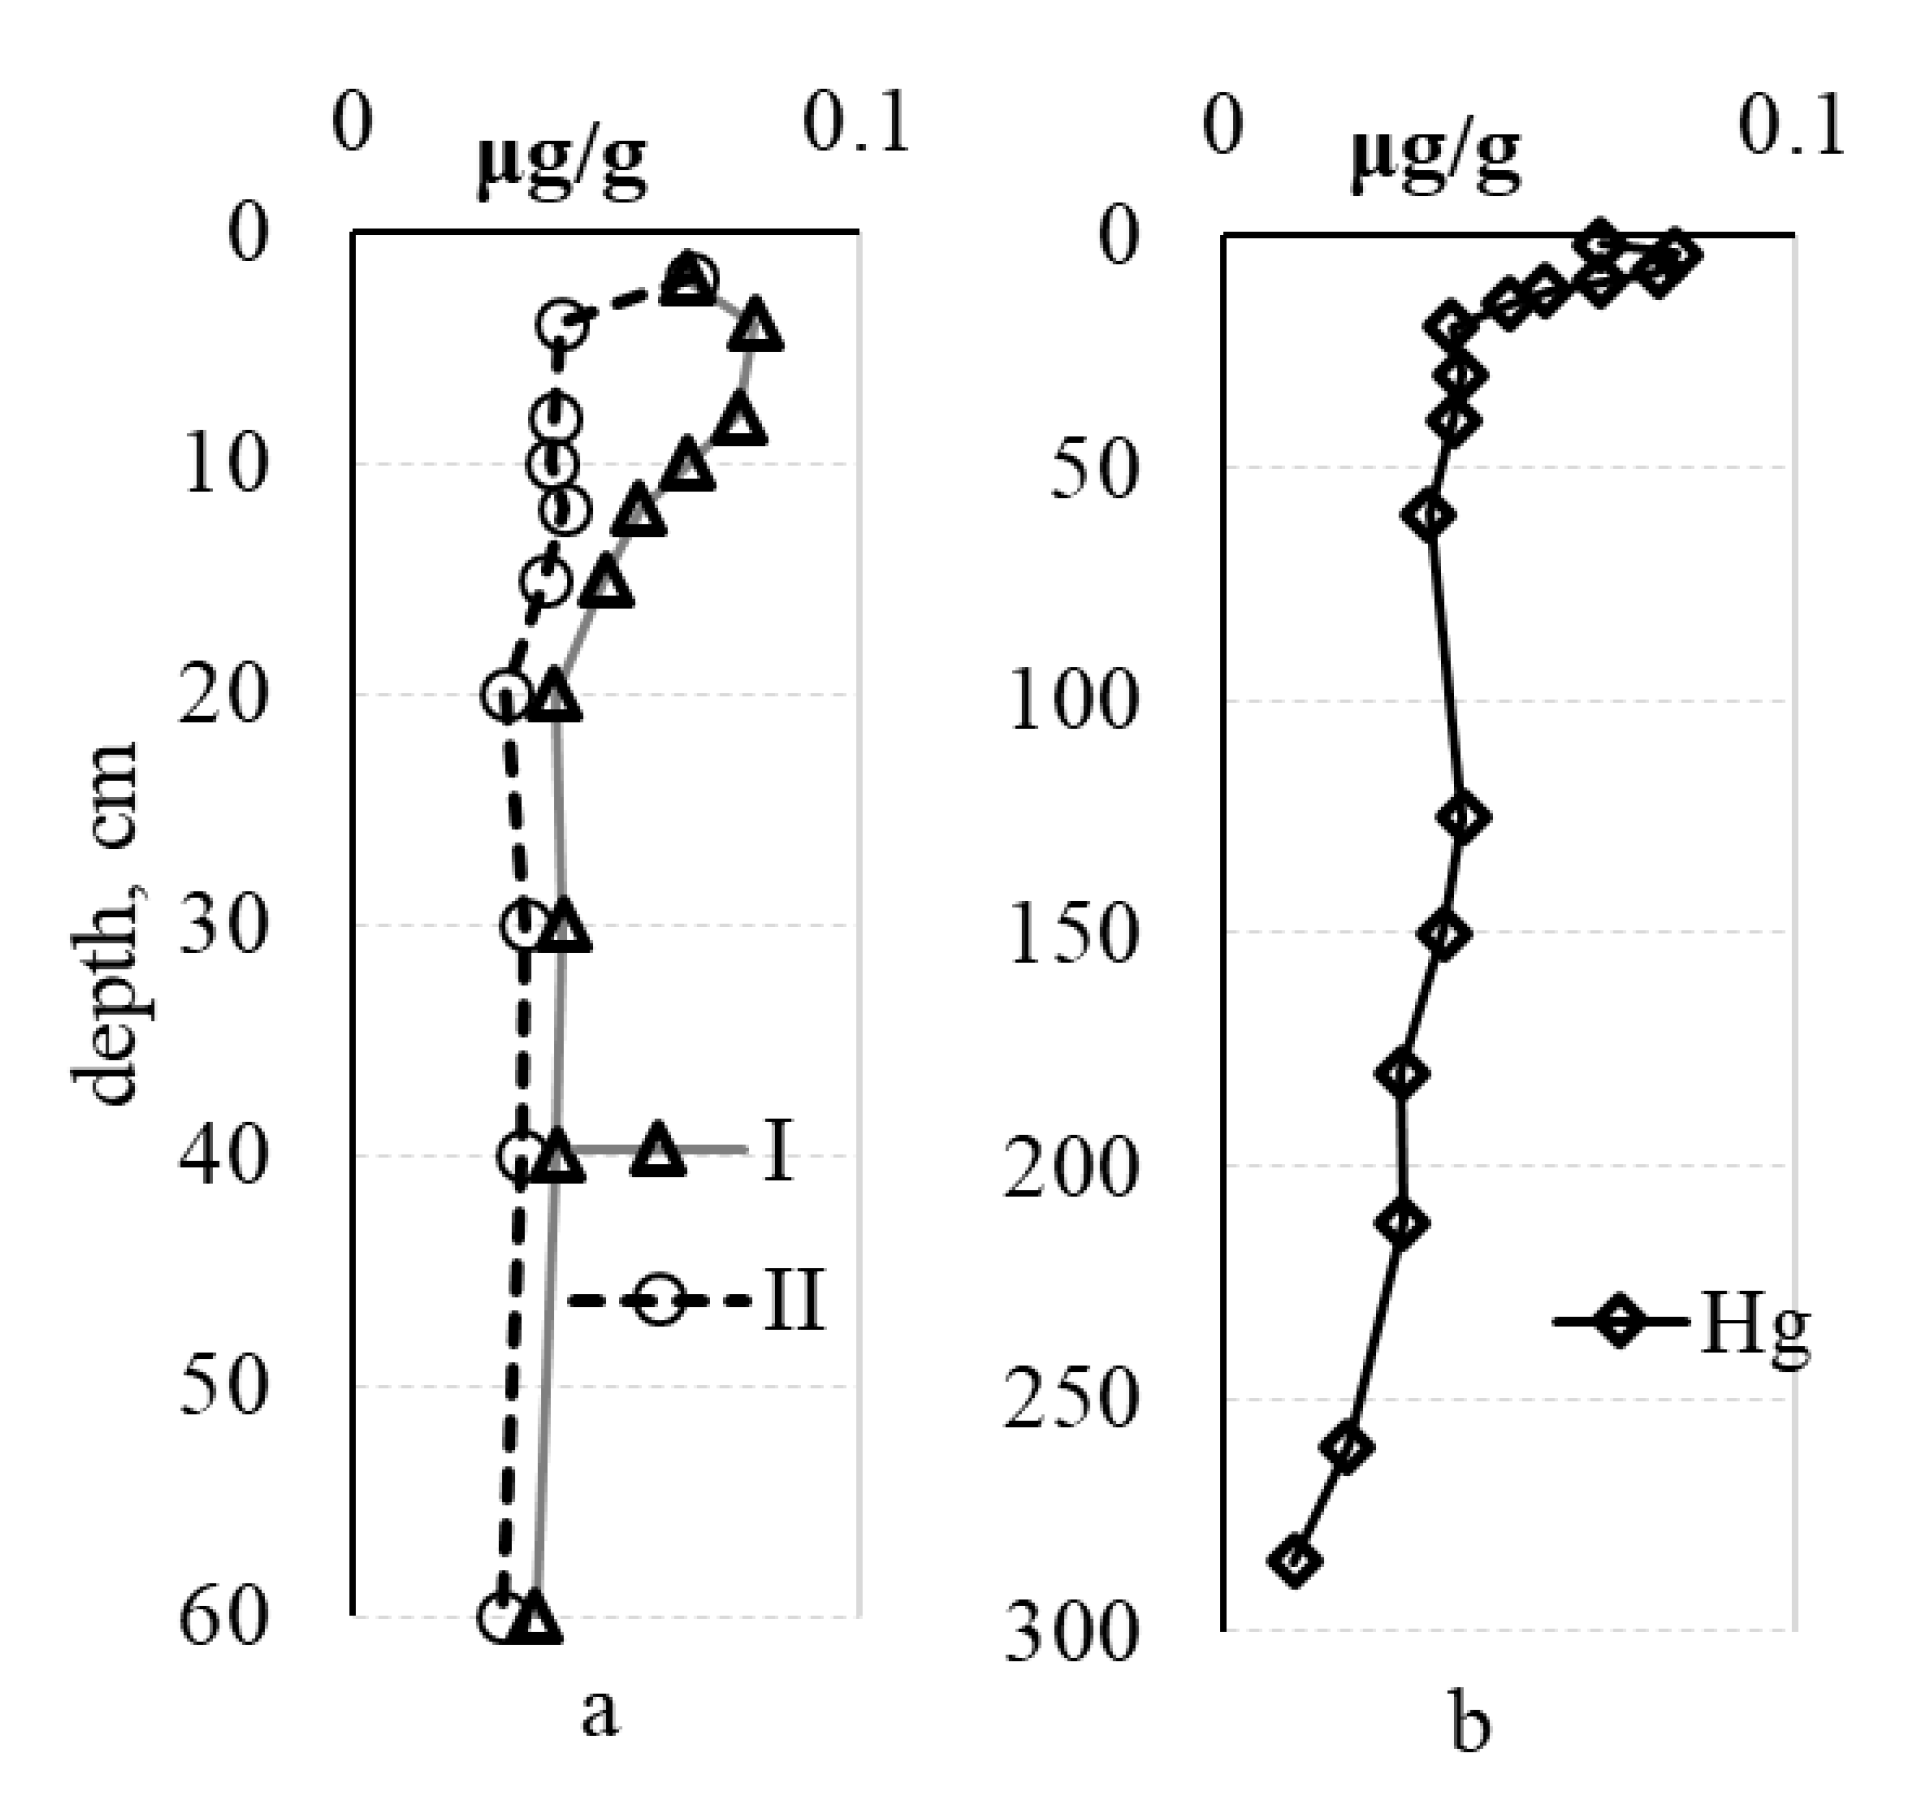
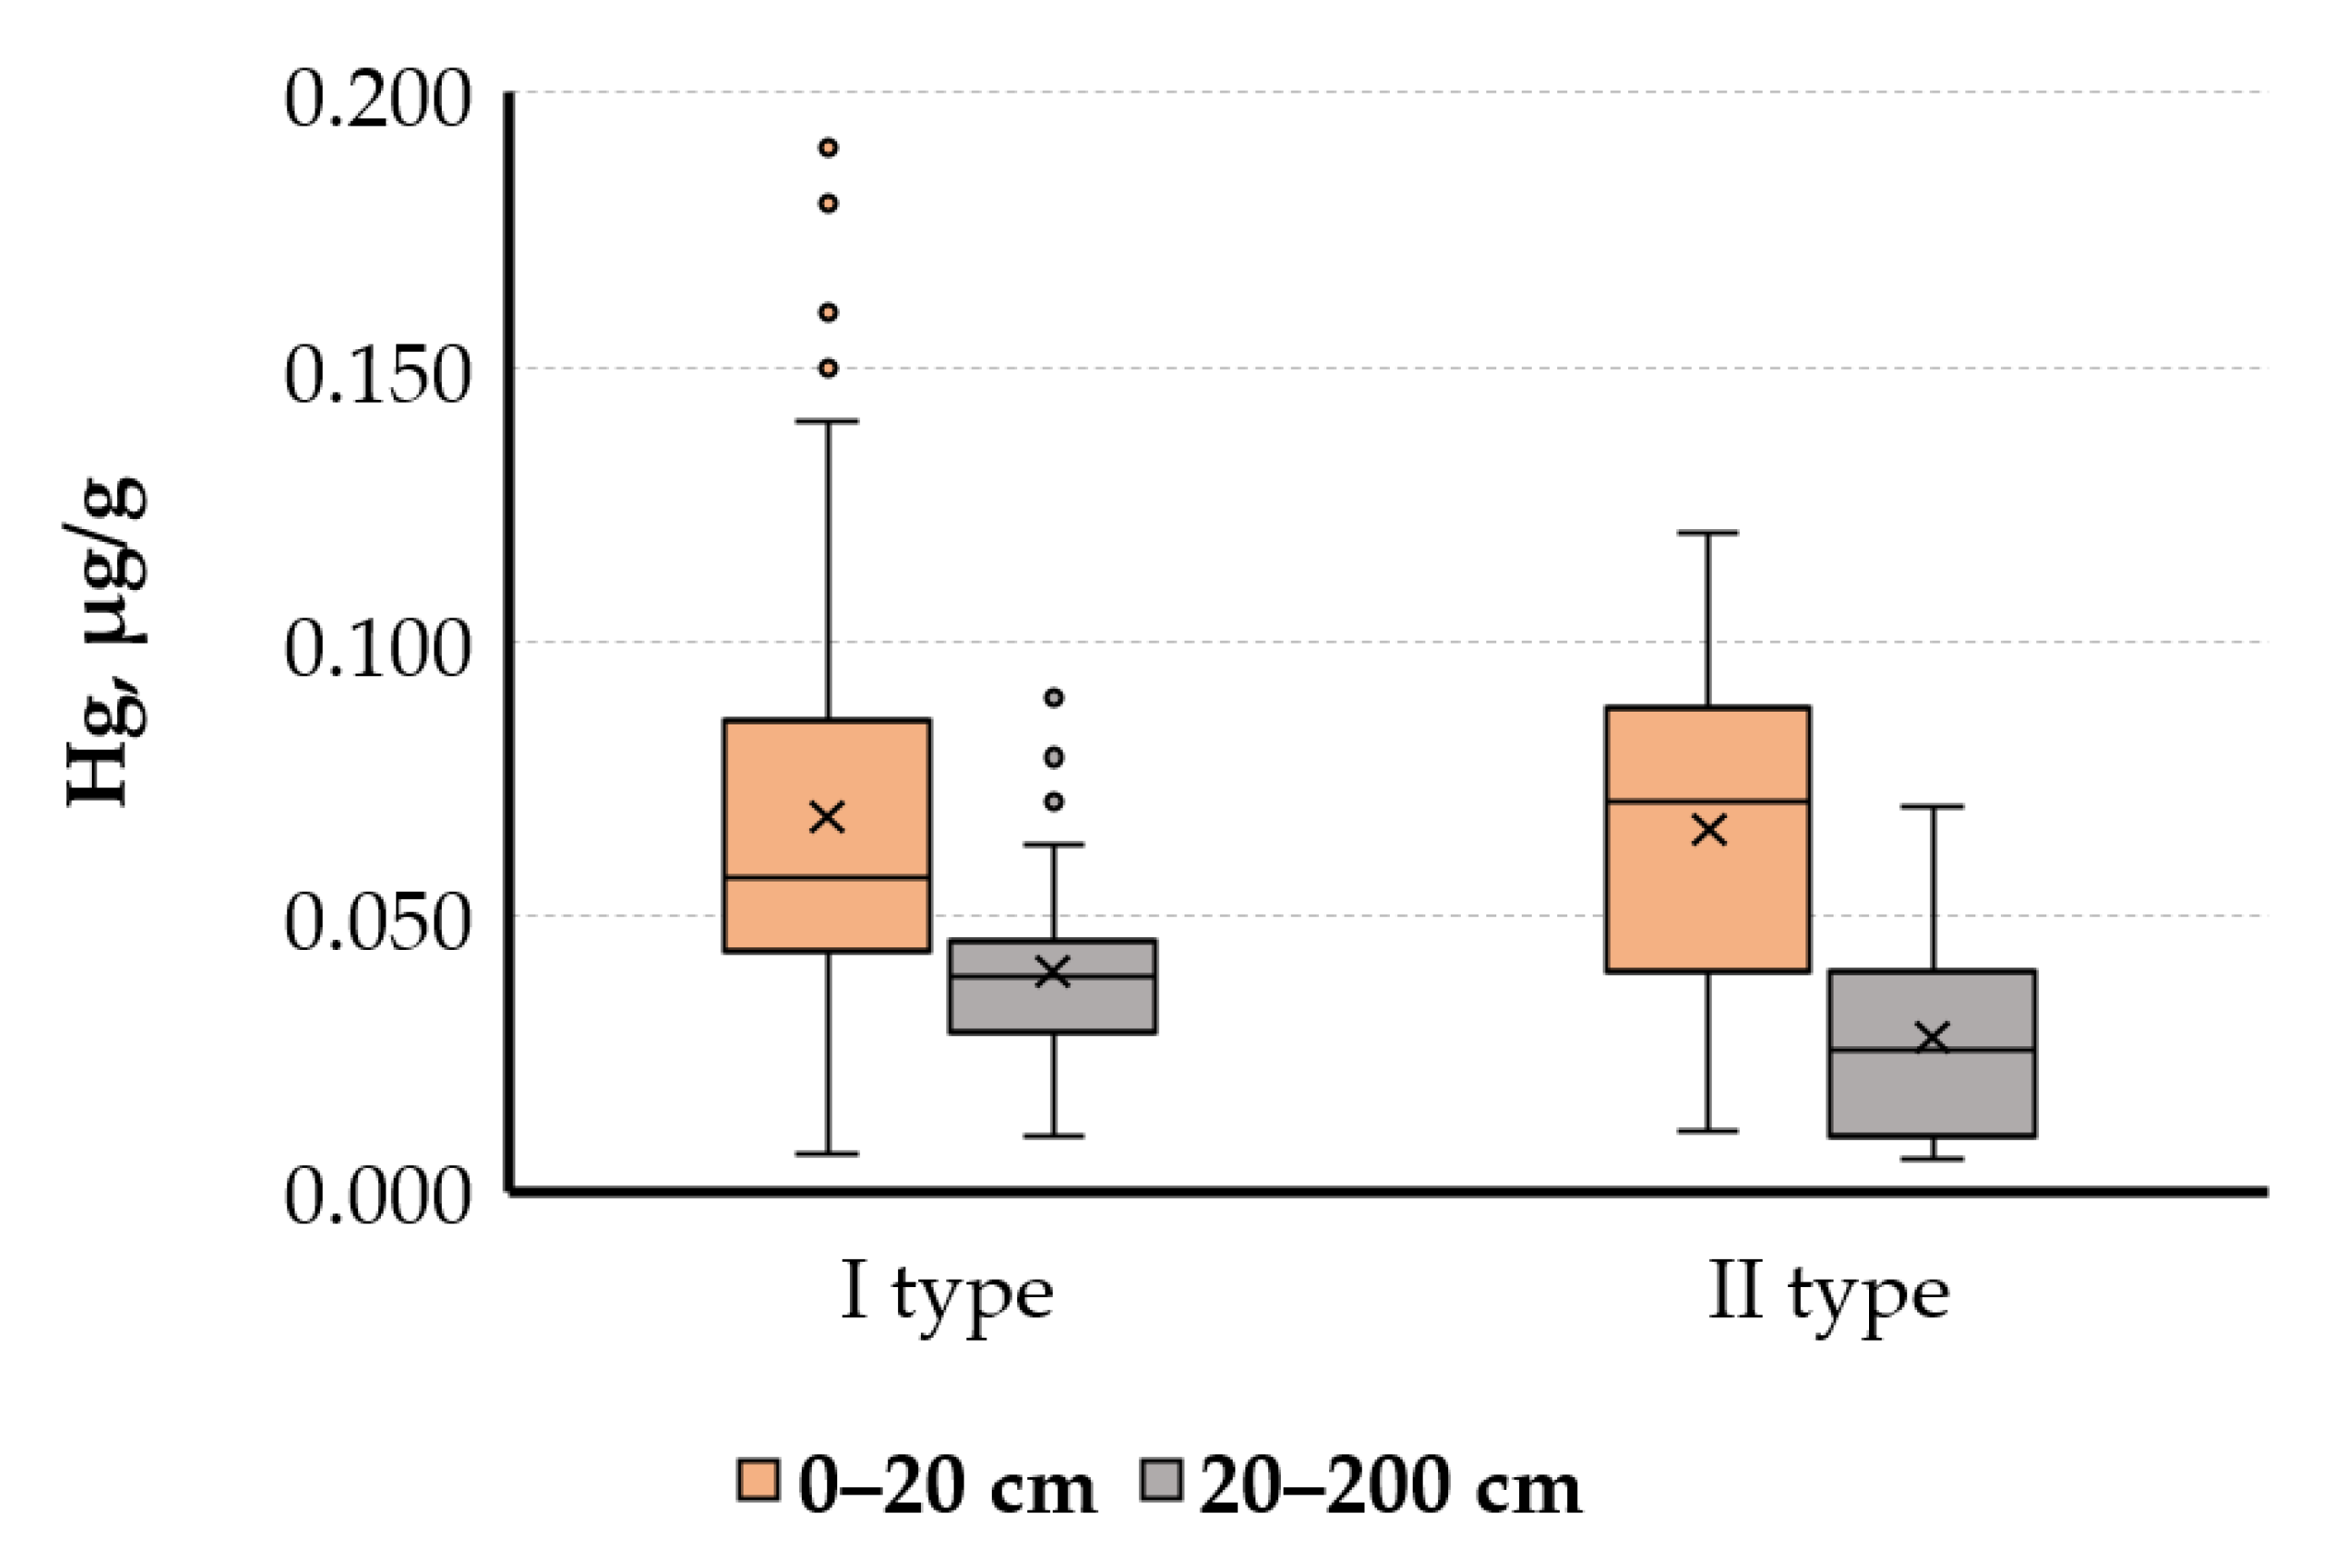
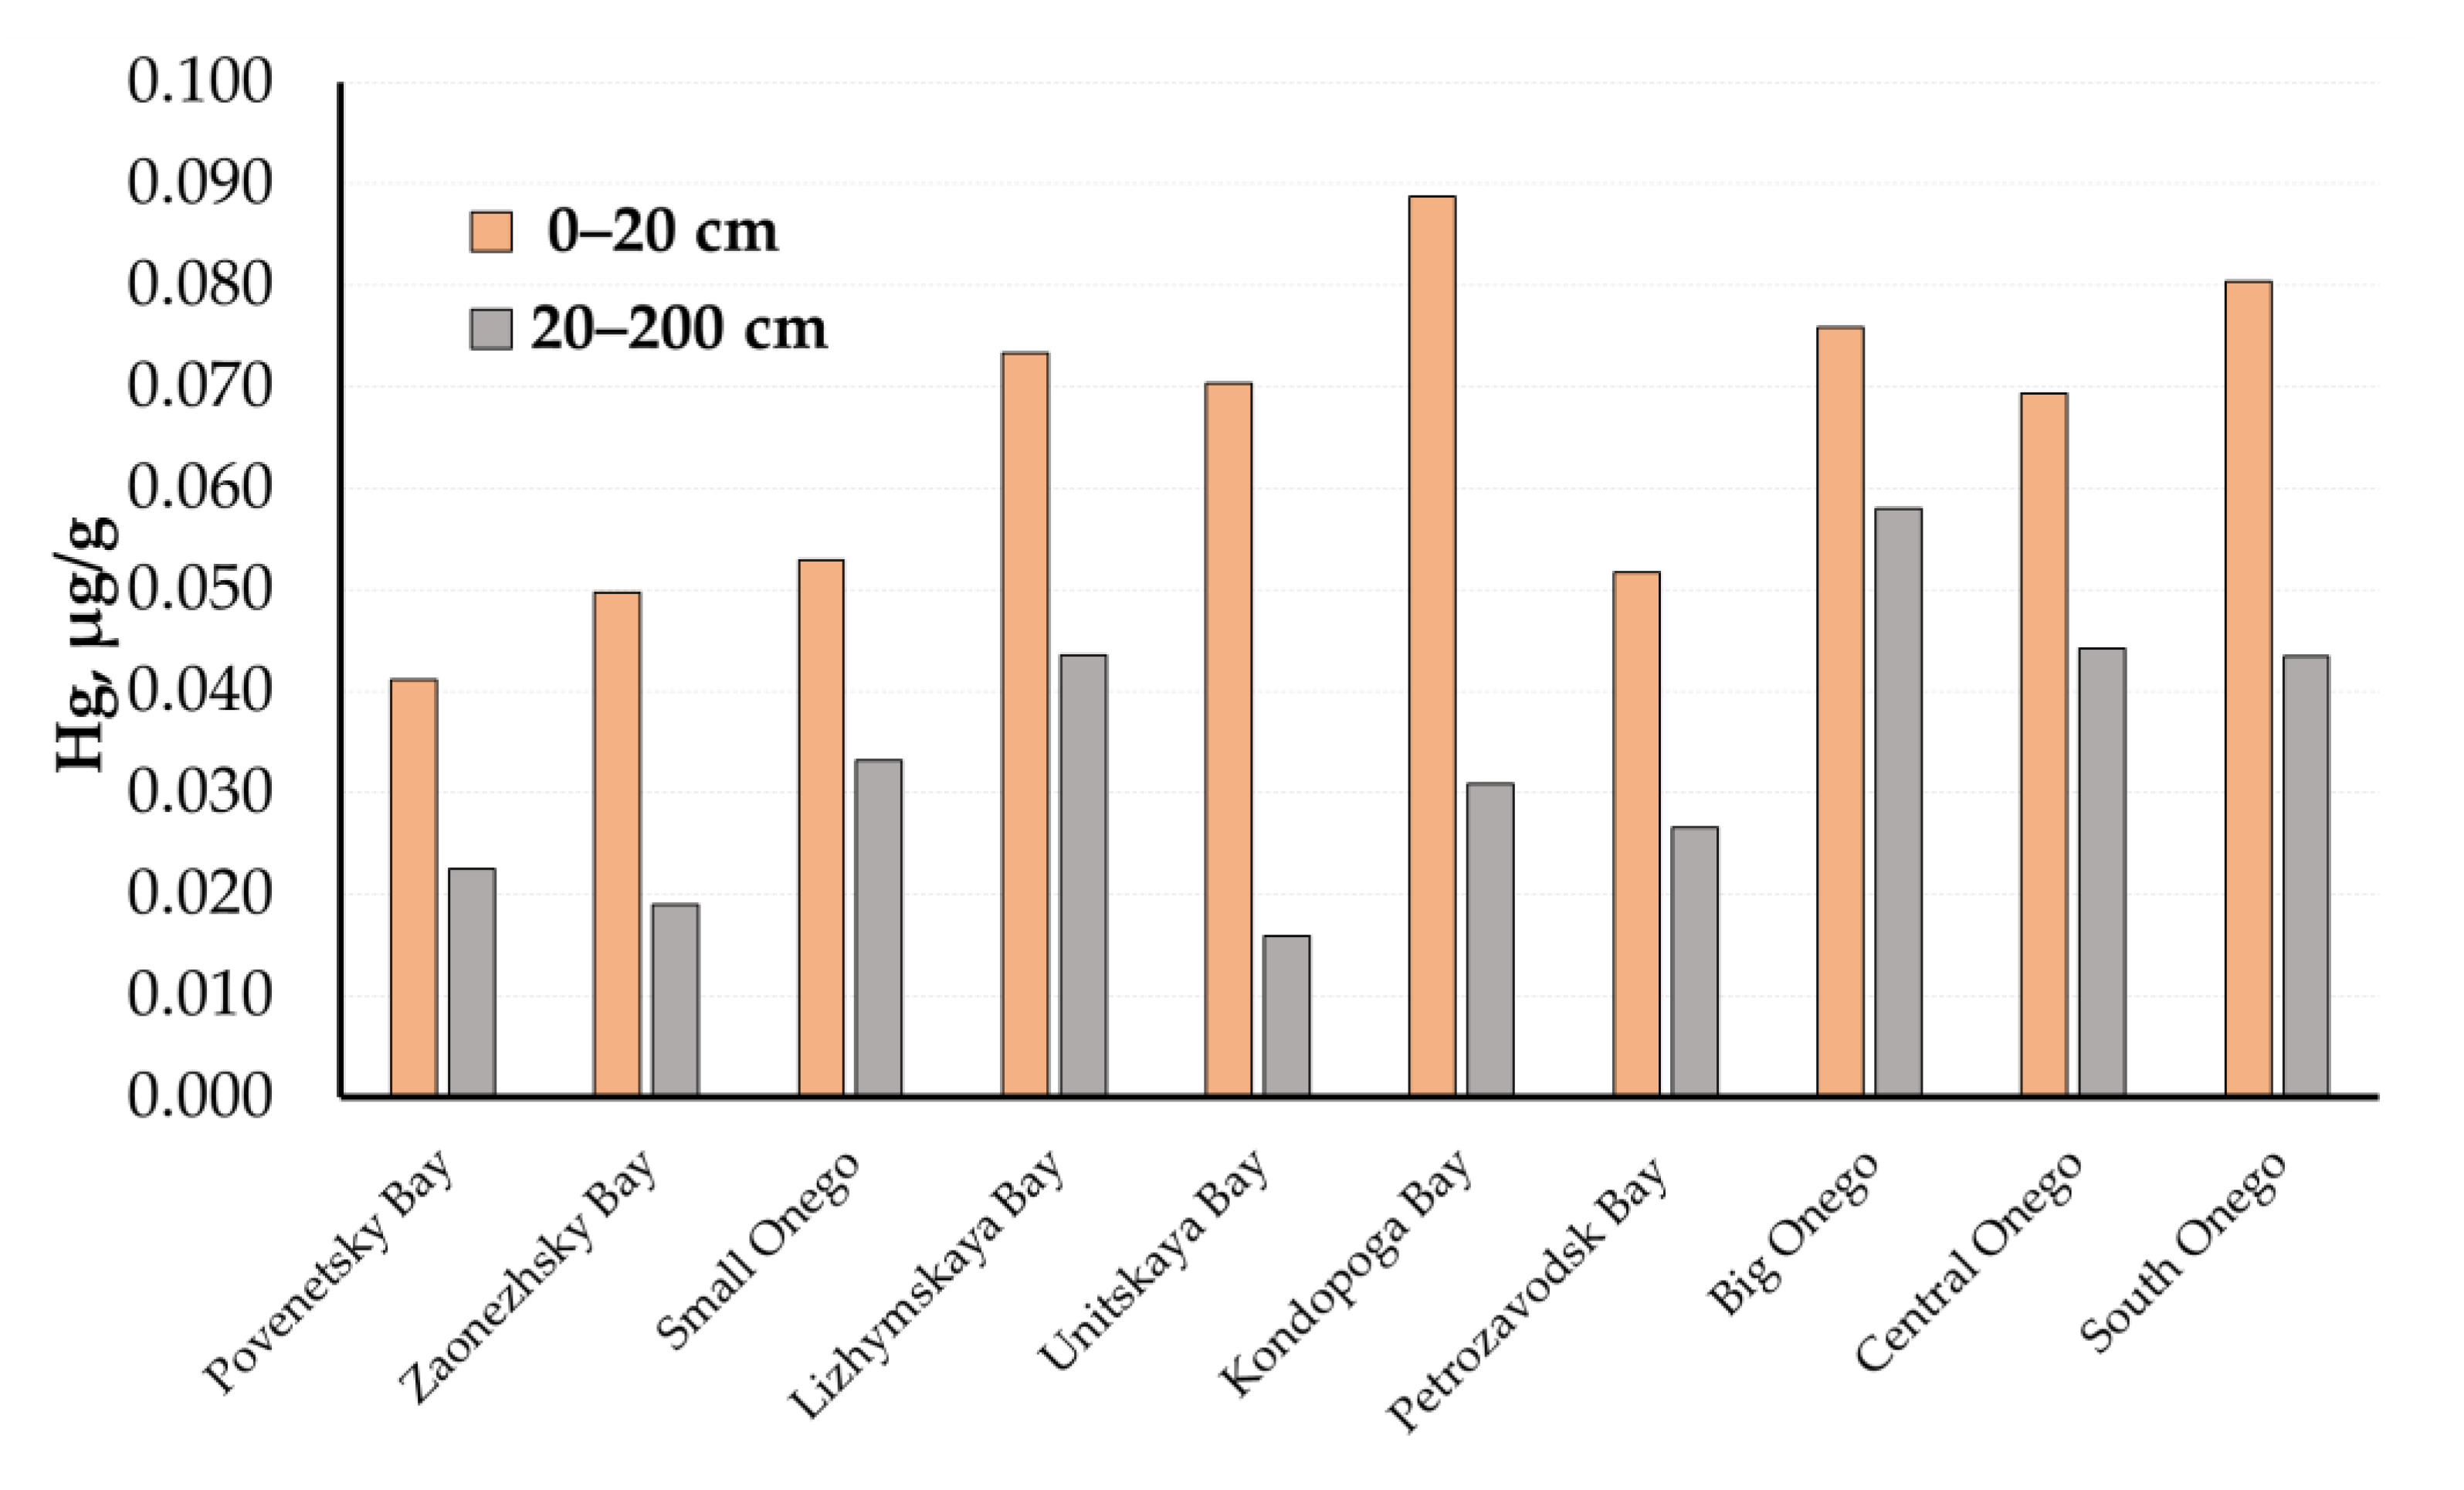
3.2. Mercury in the Bottom Sediments

According to [30], the lake bottom is composed (from top to bottom): Holocene lacustrine deposits—silt and sand (lH, where l is lacustrine), Upper Pleistocene deposits—varved clays (lgIII, where lg—limno-glacial), glacial and fluvial glacial deposits of the Upper Pleistocene—coarse sand with pebbles, clays with boulders, boulder loams (gIII; fIII, where g is glacial, f is fluvioglacial).
The geochemical and mineral compositions of the Lake Onego bottom sediments are described in detail in [31,32,33] The authors suggest that the upper part (0–20 cm) of the Holocene bottom sediments can be divided into two stratigraphic types, based on the mineralogical composition and geochemical features. The first type of bottom sediments is characterized by the presence of enriched Fe-Mn layers formed near the water-bottom sediment boundary. In the second type, such layers are absent, and the upper part of the bottom sediments is represented by a small zone of oxidized silts. Below the redox barrier, there are homogeneous grayish-green silts, which are present in both types of the Lake Onego bottom sediments.
From the analysis of mercury concentrations in the bottom sediments section, it was found that in the range of 20–200 cm, the distribution is uniform, does not change along the entire interval and averages 0.041 ± 0.001 μg/g (Figure 4).
In the upper part of the section (above 20 cm), a sharp increase in Hg concentrations is observed, the average value is 0.067 ± 0.003 μg/g. The highest concentrations are characteristic of oxidized layers and layers enriched with Fe-Mn.
If we consider the distribution of mercury by two types of bottom sediments stratification, we can conclude that the distribution of mercury in both types of bottom sediments sections are similar. The only difference is that the first type is characterized by higher extreme values, compared to the second type of sediments (0.19 µg/g for the first type and 0.12 µg/g for the second type of bottom sediments) (Figure 5).
In the course of the work, the lateral distribution of Hg in the bottom sediments over the entire Lake Onego water area was studied for the first time. For the upper part of the bottom sediments, it was found that the mercury content has a uniform distribution and varies in the range of 0.041–0.089 μg/g (Figure 1). At the same time, lower values are characteristic for the northeastern part of Lake Onego (Povenetsky and Zaonezhsky Bays, Small Onego) than for the rest of the Lake Onego water area. The maximum values of the Hg content in the upper part of the bottom sediments, were established in the Kondopoga Bay (0.089 μg/g) (Figure 2).
As already mentioned above, throughout the entire water area, the mercury content in the lower horizons of the bottom sediments has lower concentrations than in the upper ones (Figure 6). The lowest values in the bottom sediments lower part are observed in Unitskaya Bay—0.016 μg/g, with the maximum values (0.058 μg/g) in the area of Big Onego.
Higher concentrations of mercury in the upper part of the bottom sediments may indicate either an increase in the flow of mercury intake, or a redistribution of mercury contents in the bottom sediments during diagenesis (more details in the “Discussion”).

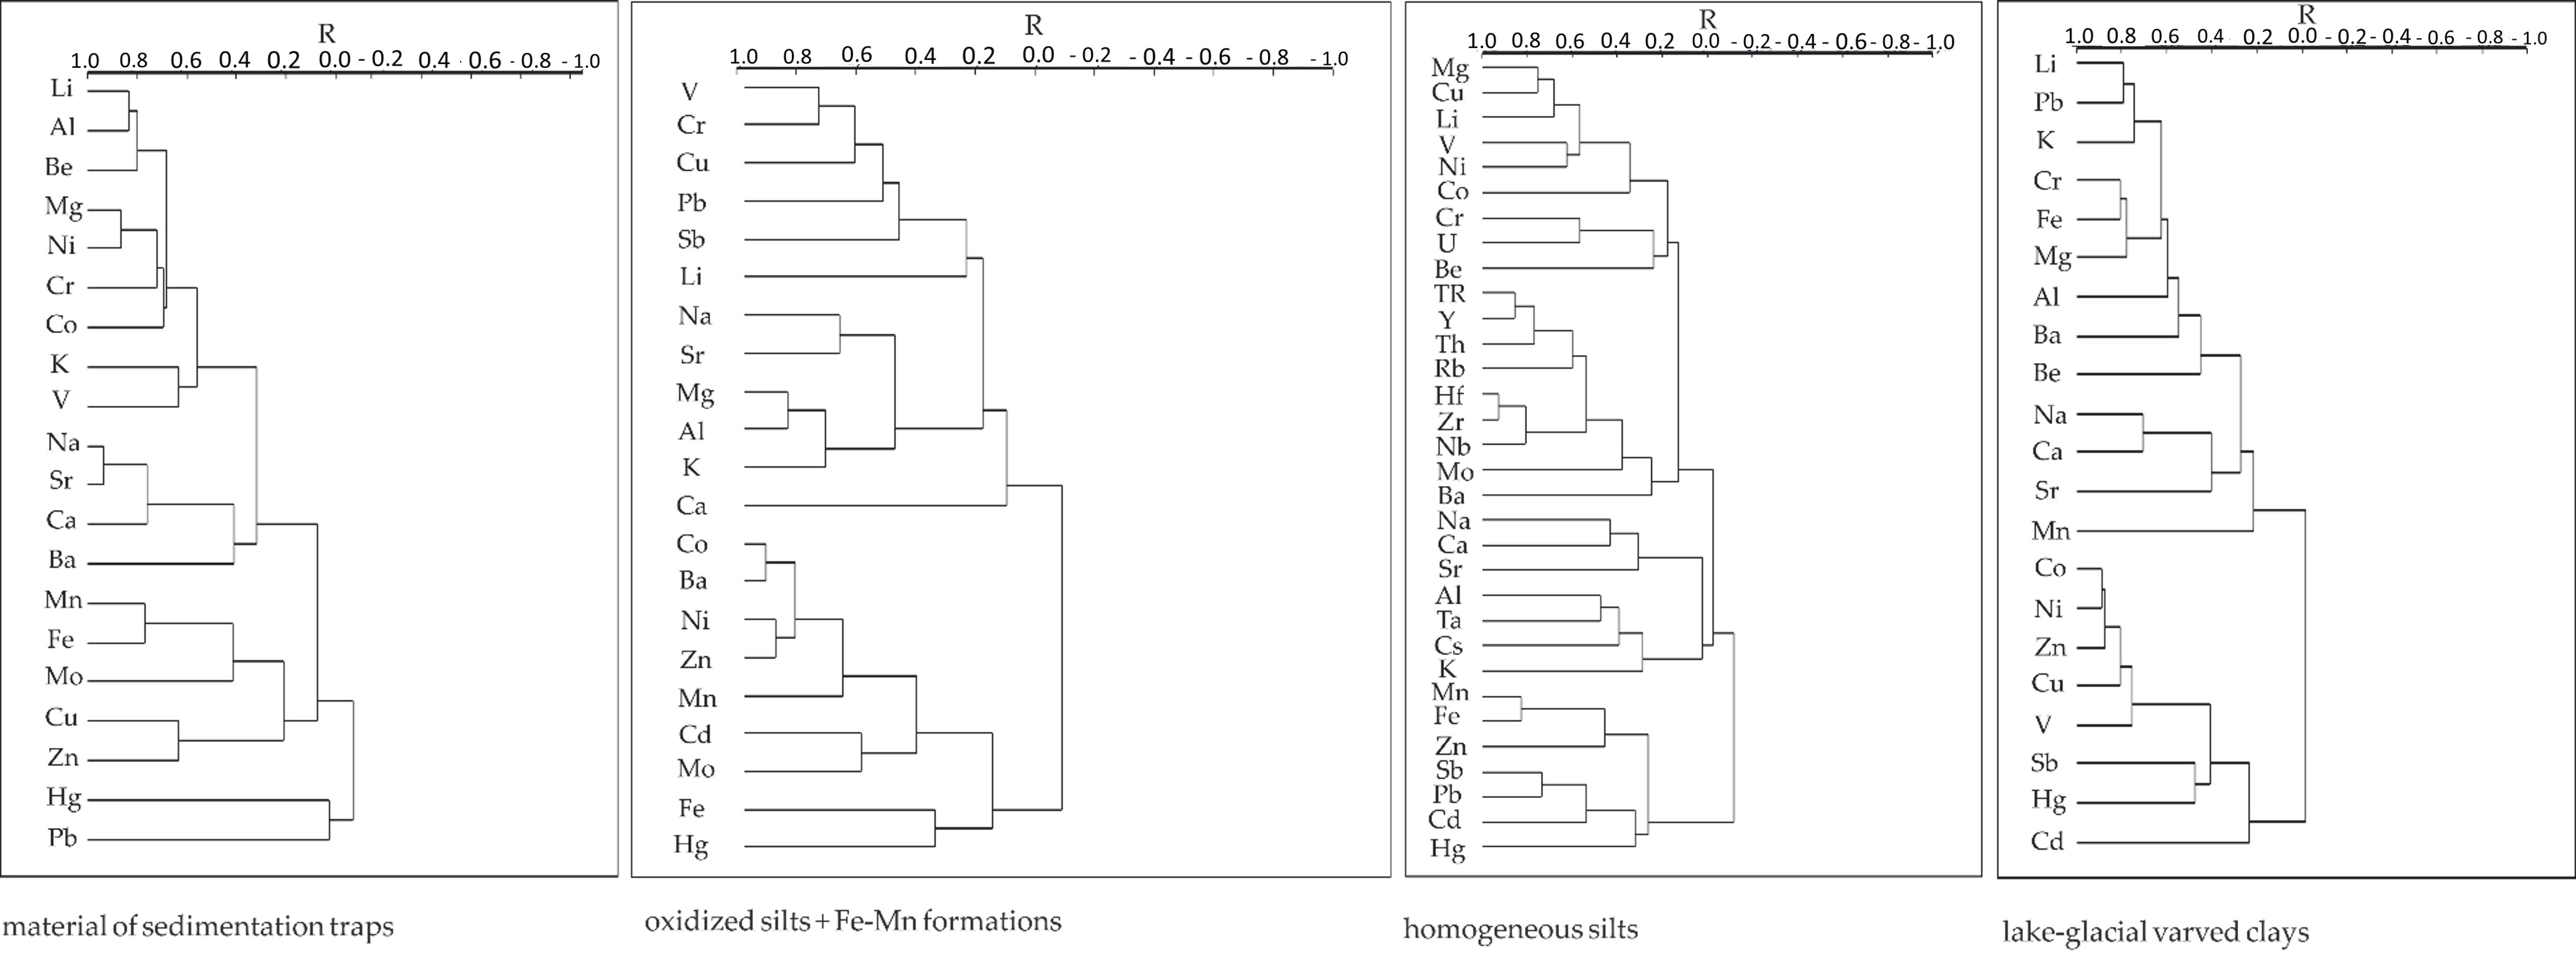
3.3. Results of the Cluster Analysis

The correlation between the chemical elements and their groups, calculated for the sedimentation trap material, water, and suspended material of Lake Onego, as well as for the bottom sediments divided into three groups, according to the depth and belonging to the first or second type of stratification (presence or absence of an oxidizing-reducing geochemical barrier in the bottom sediment), is shown on the dendrogram of the R-type cluster analysis (Figure 7).
The separation of the chemical element groups is determined by the presence of several main mineral phases, which act as their concentrators. Such mineral phases for the upper part of the bottom sediments (which include oxidized silts + Fe-Mn formations) are: quartz, feldspar, layered silicates (chlorite, illite, mica) and Fe and Mn hydroxides [34]. In our case, we determined that the lithophilic elements form their own group, the isolation of which is due to the entry of these elements into silicate minerals, and a group of minerals closely related to Fe and Mn hydroxides. It is important to note that mercury, for this part of the section, is included in the group of elements associated with Fe and Mn.
For the homogeneous silts below, the main mineral phases are the same, but their quantitative ratio is different. In the homogeneous silts, Mn hydroxides are present in smaller quantities, while Fe hydroxides are completely absent, because they are transformed into phosphates and carbonates of Fe in the diagenesis under reducing conditions [30]. The different ratio of the main mineral phases leads to various combinations of chemical elements by groups (Figure 7). It is important to note that mercury stands apart and, apparently, is not associated with certain mineral phases.
For the lower part of the bottom sediments, which are represented by lake-glacial varved clays, a different picture is observed. Unlike the upper part of the section, chalcophilic elements together with Hg form an independent group, and Fe and Mn form a group with lithophilic elements.
As for the bottom sediments, for the material of the sedimentation traps, the combination of elements into groups is determined by the presence of several main mineral phases. From the point of view of the material composition, the bottom sediments and the material of sedimentation traps are identical, with the exception of the cationic composition of illite and chlorite. As part of the bottom sediments, the main part of illite and chlorite is represented by ferruginous varieties that were formed directly in the lake [25,30]. On the dendrogram of the R-type cluster analysis for the sedimentation trap material, as well as for the bottom sediments, lithophilic elements form their own groups, the isolation of which is due to the occurrence of these elements in the silicate minerals. Fe and Mn form a separate group, due to the presence of Fe-Mn hydroxides in the sedimentation trap material. Mercury is not included in any of the groups and stands alone, as well as Pb.

4. Discussion

In the works of the predecessors, detections of mercury concentrations exceeding the maximum permissible concentration were reported [27]. For example, the article [34] provides data on the mercury concentration in the muscles of fish consumed by residents of the cities of Petrozavodsk and Medvezhegorsk. The maximum values of mercury concentration in the muscles of perch, walleye and pike caught in Lake Onego, either exceed the values of the maximum permissible concentration (0.5 µg/g), or are close to these values.
In [35], it is stated that mercury concentrations exceeding the maximum permissible concentration (0.01 µg/L) were detected in 2013, in the waters of the Shuya, Andoma, Svir (Svirstroy), Polist, Veronda, Volkhov, Morye rivers, as well as in the water of Lake Onego near the settlements of Kondopoga, Medvezhegorsk and Povenets (up to 0.048 µg/L). In 2014, the mercury content up to 0.060 µg/L at different observation periods was noted in Kondopoga Bay, near the village of Peschanoe, in the rivers of Vytegra, Pola, Lovat, Psizha, Perehoda, Shelon, Veronda, Volkhov, Vuoksa, Tulema, Vidlitsa, Oyat, Pasha, Syas, Lava and Lake Ilmen. At the same time, mercury was found in higher concentrations – 0.14–0.27 µg/L in the Lososinka River, Ilmen tributaries - Nisha, Polisti, Psizhe, Peregod, Sheloni, Veronda, Veryazh as well as in Sviritsa and Nazia.
According to [20] the main inflow of lithophilic elements and heavy metals into Lake Onego is associated with river runoff (68%–97% of the total intake of each element in the region). These data fully correspond to the materials published by [36]. However, the mercury content was not studied in these works.
However, Gorbunov et al. [34] show that the levels of mercury accumulation in soil and vegetation in the cities of Karelia do not exceed the standards approved in Russia and are close to the background.
As can be seen from the publications mentioned above, on the territory of Lake Onego, the increased concentrations of mercury are observed only in water and related environmental objects.
The atmospheric precipitation is the main source of mercury for the regions where there are no outcrops of mercury-containing rocks. Hydrology and mobility of soluble organic compounds are the main controlling factors of the Hg delivery to such aquatic ecosystems. The prevalence of mercury in suspended form in some areas indicates that there is at least one other source of mercury - anthropogenic activity. Most enterprises discharge wastewater containing trace elements, including mercury, directly into the water [37]. Chlorine-alkaline plants and pulp and paper mills were large industrial sources discharging mercury with wastewater into reservoirs [38,39]. This is consistent with the location of industrial plants on the shore of the Kondopoga and Povenetsky Bays, which may be the source of such mercury-containing particles.
The source of mercury can be the electrolysis process in the production of chlorine and caustic soda. Such production is geographically always located next to consumers, among which are manufacturers of pulp and paper products. The most dangerous production from the point of view of the impact on the Lake Onego ecosystem is the Kondopoga Pulp and Paper Mill. Over the 90 years of its existence, since 1929, the volumes (from 2.6 in 1948 to 64.5 million m3 in 1990) and the qualitative composition of the wastewater entering Kondopoga Bay have changed, in accordance with the technologies used. Currently, wastewater discharged by the Kondopoga Pulp and Paper Mill (~40 million m3 per year) carries a significant amount of pollutants into the reservoir. Therefore, on average, ~2500 tons of suspended solids enter the bay during the year: 50 tons of phosphorus, 60 tons of nitrogen, etc. [20]. It is in the bottom sediments of Kondopoga Bay that high concentrations of mercury in the bottom sediments (0.19 µg/g) were detected, which is an order of value higher than in other parts of the lake. High concentrations of mercury in the sedimentation traps material in almost all bays, for example, Povenetsky Bay (0.76 µg/g), and especially in Lizhemskaya Bay (4.3 µg/g), may indicate the wind dispersion of the polluted dust. Similar concentration ranges are typical for sedimentary material/bottom sediments bearing traces of anthropogenic pollution [40,41,42]. Dust may come from the sump pond (which may dry out) used by The Kondopoga Pulp and Paper Mill.
It was observed that in the entire water area of Lake Onego, the mercury concentrations in the sedimentation traps material are higher than the mercury content in the corresponding cores of the bottom sediments. The difference in mercury concentrations in the material of the sedimentation traps at different times is presumably due to single anthropogenic releases of mercury into the aquatic ecosystem of the lake.
The material composition of the sedimentation traps material is similar to the upper part of the bottom sediments, except for the presence of the same illites and chlorites for the bottom sediments and for much more organic remains in the sedimentation traps material. The second fact may also be associated with the higher mercury concentrations in the material of the sedimentation traps, since mercury has a high bioaccumulative ability.
According to the vertical distribution graphs of the mercury contents in the bottom sediments, it can be concluded that in the Late Pleistocene and Holocene, the flow of mercury into the bottom sediments was constant. Only in modern times (about 200 years) there has been an increase in mercury concentrations in the bottom sediments. At the same time, the highest concentrations are observed in the oxidized part of the bottom sediments. According to radiometric dating using nonequilibrium 210Pb [30], an increase in mercury concentrations is observed in the bottom sediments with an age up to 150 years ago, while a sharp increase has been observed since 80 years ago.
The close relationship of mercury with Fe and Mn, which is established for the upper part of the bottom sediments, is explained by the sorption of Hg by Fe and Mn hydroxides. Fe and Mn hydroxides play an important role in the circulation and transport of trace elements, due to their large surface area and high ability to sorb and co-deposit metals [43]. An increase in the intake of Fe and Mn hydroxides in the Holocene, caused by climate humidification may be the reason for an increase in the intake of mercury together with Fe and Mn hydroxides. The source of mercury in this case may be the shungite rocks, for which the predominance of physical weathering in the Late Pleistocene was replaced by chemical weathering in the Holocene. Atmospheric precipitation is also a source of mercury. The increase in mercury intake from the atmosphere is associated with a global increase in the mercury intake into the environment caused by human industrial activity [44].
Another explanation for the close connection of Fe and Mn can be the mechanism by which Fe-Mn crusts (layers) are formed. Such crusts are formed, according to the classical scheme, referred to in the literature as the "manganese trap" [45]. In post-sedimentation processes, organic matter reduces Fe and Mn. As a result of this process, soluble divalent ions of these metals are formed. These ions enter the pore water, and then migrate up the section to the previously formed oxidized layer, in which free O2 has not yet been used up for the oxidation of the organic matter. Here, the ions are oxidized, passing into insoluble forms and forming layers with increased concentrations of Fe and Mn. Apparently, at the time of the reduction of Fe and Mn and the dissolution of their hydroxides, Hg goes into pore solutions. Mercury migrates up the section together with Fe and Mn, where it is re-sorbed by newly formed Fe-Mn hydroxides.

5. Conclusions

For the first time concerning Lake Onego, the second largest freshwater lake in Europe, the lateral distribution of the total mercury in the water-suspended matter-bottom sediments system is considered. The analysis of the total mercury content distribution was carried out by taking into account two types of bottom sediment cores (determined by the presence or absence of an oxidation-reduction barrier) and various areas of the Lake Onego water area.
The study of the lateral mercury distribution in the bottom sediments over the entire Lake Onego area, showed that the mercury content in the bottom sediments does not significantly differ and varies in the range of 0.041–0.089 µg/g, with an average value in the upper and lower parts of the bottom sediments - 0.067 ± 0.003 and 0.041 ± 0.001 µg/g, respectively.
An increase in mercury content in the bottom sediments vertically to the water-bottom sediment boundary has been established, which is mainly due to two factors: an increase in the global background of mercury associated with anthropogenic activity; migration, redistribution and concentration of mercury in the bottom sediments on the geochemical barrier, jointly with Fe and Mn.
The total mercury content in the water of Lake Onego is on average 0.32 ± 0.07 µg/L. The predominant form of mercury in water is dissolved+colloid, with the exception of the water samples from the Kondopoga and Povenetsky Bays.
It was found that the mercury content in the sedimentation traps material varies in a wide range from 0.062 µg/g to 4.37 µg/g, which is significantly higher than the mercury content in the upper part of the corresponding bottom sediments cores. This difference may be due to the atmospheric input of contaminated dust from paper mills.

Author Contributions

Conceptualization, V.M., V.S. and D.S.; methodology, V.S.; software, V.M.; validation, N.B., V.S. and D.S.; formal analysis, V.M. and V.S.; investigation, V.M., V.S., D.S., E.O. and N.B.; resources, V.M., V.S., D.S., E.O. and N.B.; data curation, V.S., E.O. and D.S.; writing—original draft preparation, V.M. and V.S.; writing—review and editing, V.S., E.O. and D.S.; visualization, V.M.; supervision, V.S. and D.S.; project administration V.S. and D.S.; funding acquisition, V.S., N.B. and D.S. All authors have read and agreed to the published version of the manuscript.

Funding

The main part of the work, concerned with field research, sample preparation for the chemical analytical work and results interpretation, was financially supported by a grant from the Russian Science Foundation No. 18-17-00176; studies and analytical work and results interpretation were carried out with the financial support from the Russian Foundation for Basic Research, research project No. 19-05-50014.

Conflicts of Interest

The authors declare no conflict of interest.

References

  1. Raj, D.; Maiti, S.K. Sources, toxicity, and remediation of mercury: An essence review. Environ. Monit. Assess. 2019, 191, 1–22. [Google Scholar] [CrossRef] [PubMed]
  2. Selin, N. Global Biogeochemical Cycling of Mercury: A Review. Annu. Rev. Environ. Resour. 2009, 34, 43–63. [Google Scholar] [CrossRef] [Green Version]
  3. Hsu-Kim, H.; Kucharzyk, K.H.; Zhang, T.; Deshusses, M.A. Mechanisms Regulating Mercury Bioavailability for Methylating Microorganisms in the Aquatic Environment: A Critical Review. Environ. Sci. Technol. 2013, 47, 2441–2456. [Google Scholar] [CrossRef] [PubMed]
  4. Burton, G.A.; Landrum, P.F. Toxicity of sediments. In Encyclopedia of Sediments and Sedimentary Rocks; Kluwer Academic Publishers: Amsterdam, The Netherlands, 2003; pp. 748–751. [Google Scholar]
  5. Klapstein, S.; Nelson, J. Methylmercury biogeochemistry in freshwater ecosystems: A review focusing on DOM and photodemethylation. Bull. Environ. Contam. Toxicol. 2018, 100, 14–25. [Google Scholar] [CrossRef] [PubMed]
  6. Walters, D.; Jardine, T.; Cade, B.; Kidd, K.; Muir, D.; Leipzig-Scott, P. Trophic Magnification of Organic Chemicals: A Global Synthesis. Environ. Sci. Technol. 2016, 50, 4650–4658. [Google Scholar] [CrossRef] [PubMed]
  7. Wolfe, M.; Schwarzbach, S.; Sulaiman, R. Effects of mercury on wildlife: A comprehensive review. Environ. Toxicol. Chem. 1998, 17, 146–160. [Google Scholar] [CrossRef]
  8. Mergler, D.; Anderson, H.; Chan, L.; Mahaffey, K.; Murray, M.; Sakamoto, M.; Stern, A. Methylmercury Exposure and Health Effects in Humans: A Worldwide Concern. Ambio 2007, 36, 3–11. [Google Scholar] [CrossRef]
  9. Kocman, D.; Wilson, S.; Amos, H.; Telmer, K.; Steenhuisen, F.; Sunderland, E.; Mason, R.; Outridge, P.; Horvat, M. Toward an Assessment of the Global Inventory of Present-Day Mercury Releases to Freshwater Environments. Int. J. Environ. Res. Public Health 2017, 14, 138. [Google Scholar] [CrossRef] [Green Version]
  10. Driscoll, C.T.; Mason, R.P.; Chan, H.M.; Jacob, D.J.; Pirrone, N. Mercury as a global pollutant: Sources, pathways, and effects. Environ. Sci. Technol. 2013, 47, 4967–4983. [Google Scholar] [CrossRef]
  11. Obrist, D.; Kirk, J.; Zhang, L.; Sunderland, E.; Jiskra, M.; Selin, N. A review of global environmental mercury processes in response to human and natural perturbations: Changes of emissions, climate, and land use. Ambio 2018, 47, 116–140. [Google Scholar] [CrossRef]
  12. Streets, D.G.; Devane, M.K.; Lu, Z.; Bond, T.C.; Sunderland, E.M.; Jacob, D.J. All-time releases of mercury to the atmosphere from human activities. Environ. Sci. Technol. 2011, 45, 10485–10491. [Google Scholar] [CrossRef] [Green Version]
  13. Amos, H.M.; Jacob, D.J.; Streets, D.G.; Sunderland, E.M. Legacy impacts of all-time anthropogenic emissions on the global mercury cycle. Global Biogeochem. Cycles 2013, 27, 410–421. [Google Scholar] [CrossRef] [Green Version]
  14. Horowitz, H.M.; Jacob, D.J.; Amos, H.M.; Streets, D.G.; Sunderland, E.M. Historical mercury releases from commercial products: Global environmental implications. Environ. Sci. Technol. 2014, 48, 10242–10250. [Google Scholar] [CrossRef] [PubMed] [Green Version]
  15. Lamborg, C.H.; Hammerschmidt, C.R.; Bowman, K.L.; Swarr, G.J.; Munson, K.M.; Ohnemus, D.C.; Lam, P.J.; Heimbürger, L.-E.; Rijkenberg, M.J.A.; Saito, M.A. A global ocean inventory of anthropogenic mercury based on water column measurements. Nature 2014, 512, 65–68. [Google Scholar] [CrossRef] [PubMed]
  16. Zhang, Y.; Jaeglé, L.; Thompson, L. Natural biogeochemical cycle of mercury in a global three-dimensional ocean tracer model. Global Biogeochem. Cycles 2014, 28, 553–570. [Google Scholar] [CrossRef]
  17. Amos, H.M.; Sonke, J.E.; Obrist, D.; Robins, N.; Hagan, N.; Horowitz, H.M.; Mason, R.P.; Witt, M.; Hedgecock, I.M.; Corbitt, E.S.; et al. Observational and modeling constraints on global anthropogenic enrichment of mercury. Environ. Sci. Technol. 2015, 49, 4036–4047. [Google Scholar] [CrossRef] [PubMed]
  18. Streets, D.; Horowitz, H.; Jacob, D.; Lu, Z.; Levin, L.; ter Schure, A.; Sunderland, E. Total Mercury Released to the Environment by Human Activities. Environ. Sci. Technol. 2017, 51, 5969–5977. [Google Scholar] [CrossRef]
  19. Filatov, N. Onego Lake. Atlas; KarNTS RAN: Petrozavodsk, Russia, 2010; p. 151. [Google Scholar]
  20. Kulik, N.; Efremenko, N.; Belkina, N.; Strakhovenko, V.; Gatalskaya, E.; Orlov, A. Fe, Mn, Al, Cu, Zn, and Cr in the sedimentary matter of Lake Onego. Quat. Int. 2022. [Google Scholar] [CrossRef]
  21. Sokolov, V.; Kalinin, Y. Shungites of Karelia and Ways of their Complex Use; KarNTS RAN: Petrozavodsk, Russia, 1975; p. 240. [Google Scholar]
  22. Filippov, M. Shungitonosnye Porody Onezhskoi Structury; Fillipov, M.M., Ed.; KarNTS RAN: Petrozavodsk, Russia, 2002; p. 280. [Google Scholar]
  23. Taylor, S. Abundance of chemical elements in the continental crust: A new table. Geochim. Cosmochim. Acta 1964, 28, 1273–1285. [Google Scholar] [CrossRef]
  24. Lukashin, V.; Klyuvitkin, A.; Lisitzin, A.; Novigatsky, A. The MSL-110 small sediment trap. Oceanology 2011, 51, 699–703. [Google Scholar] [CrossRef]
  25. Strakhovenko, V.; Belkina, N.; Efremenko, N.; Potakhin, M.; Subetto, D.; Frolova, L.; Nigamatzyanova, G.; Ludikova, A.; Ovdina, E. The First Data on the Mineralogy and Geochemistry of the Suspension of Lake Onego. Russ. Geol. Geophys. 2022, 63, 55–71. [Google Scholar] [CrossRef]
  26. Davis, J.C.; Sampson, R.J. Statistics and Data Analysis in Geology, 3rd ed.; Wiley: New York, NY, USA, 1986; p. 646. [Google Scholar]
  27. Feng, C.; Wu, F.; Zhao, X.; Li, H.; Chang, H. Water quality criteria research and progress. Sci. China Earth Sci. 2012, 55, 882–891. [Google Scholar] [CrossRef]
  28. Efremova, T.; Sabylina, A.; Lozovik, P.; Slaveykova, V.; Zobkova, M.; Pasche, N. Seasonal and spatial variation in hydrochemical parameters of Lake Onego (Russia): Insights from 2016 field monitoring. Inland Waters 2019, 9, 227–238. [Google Scholar] [CrossRef] [Green Version]
  29. Gorbunov, A.; Lyapunov, S.; Ermolaev, B.; Okina, O.; Frontas′eva, M.; Pavlov, S. Macro- and microelements distribution in urbanized ecosystems of karelia. Hum. Ecol. 2020, 27, 4–14. [Google Scholar] [CrossRef]
  30. Subetto, D.; Rybalko, A.; Strakhovenko, V.; Belkina, N.; Tokarev, M.; Potakhin, M.; Aleshin, M.; Belyaev, P.; Dubois, N.; Kuznetzov, V.; et al. Structure of Late Pleistocene and Holocene Sediments in the Petrozavodsk Bay, Lake Onego (NW Russia). Minerals 2020, 10, 964. [Google Scholar] [CrossRef]
  31. Strakhovenko, V.; Subetto, D.; Ovdina, E.; Danilenko, I.; Belkina, N.; Efremenko, N.; Maslov, A. Mineralogical and geochemical composition of Late Holocene bottom sediments of Lake Onego. J. Great Lakes Res. 2020, 46, 443–455. [Google Scholar] [CrossRef]
  32. Strakhovenko, V.; Subetto, D.; Ovdina, E.; Belkina, N.; Efremenko, N. Distribution of Elements in Iron-Manganese Formations in Bottom Sediments of Lake Onego (NW Russia) and Small Lakes (Shotozero and Surgubskoe) of Adjacent Territories. Minerals 2020, 10, 440. [Google Scholar] [CrossRef]
  33. Strakhovenko, V.; Belkina, N.; Subetto, D.; Rybalko, A.; Efremenko, N.; Kulik, N.; Potakhin, M.; Zobkov, M.; Ovdina, E.; Ludikova, A. Distribution of rare earth elements and yttrium in water, suspended matter and bottom sediments in Lake Onego: Evidence of the watershed transformation in the Late Pleistocene. Quat. Int. 2021. [Google Scholar] [CrossRef]
  34. Gorbunov, A.; Lyapunov, S.; Ermolaev, B. Distribution of mercury in natural and urban environments of karelia, northwest russia. Hum. Ecol. 2019, 26, 10–17. [Google Scholar] [CrossRef] [Green Version]
  35. Ignatieva, N.; Petrova, T.; Guseva, M. Estimation of pollution of surface waters on the territory of the drainage basin of Lake Ladoga according to hydro-chemical indicators. Proc. Samara Sci. Cent. Russ. Acad. Sci. 2015, 17, 91–96. [Google Scholar]
  36. Sanin, A.; Strokov, A.; Terskii, P. Assessment of natural processes impact on content of heavy metals in water of Lake Onego. Vestnik of Saint Petersburg University. Earth Sci. 2020, 65, 146–171. [Google Scholar] [CrossRef]
  37. Nriagu, J.; Pacyna, J. Quantitative assessment of worldwide contamination of air, water and soils by trace metals. Nature 1988, 333, 134–139. [Google Scholar] [CrossRef] [PubMed]
  38. Clarkson, T. The three modern faces of mercury. Environ. Health Perspect 2002, 110, 11–23. [Google Scholar] [CrossRef] [PubMed] [Green Version]
  39. Hylander, L.; Meili, M. The Rise and Fall of Mercury: Converting a Resource to Refuse After 500 Years of Mining and Pollution. Crit. Rev. Environ. Sci. Technol. 2005, 35, 1–36. [Google Scholar] [CrossRef]
  40. Wu, T. Distribution of methylmercury in a mercury-contaminated ecosystem. Pract. Period. Hazard. Toxic Radioact. Waste Manag. 2006, 10, 192–197. [Google Scholar] [CrossRef] [Green Version]
  41. Yan, H.; Li, Q.; Meng, B.; Wang, C.; Feng, X.; He, T.; Dominik, J. Spatial distribution and methylation of mercury in a eutrophic reservoir heav-ily contaminated by mercury in Southwest China. Appl. Geochem. 2013, 33, 182–190. [Google Scholar] [CrossRef]
  42. Wang, Y.; Fang, M.; Chien, L.; Lin, C.; Hsi, H. Distribution of mercury and methylmercury in surface water and surface sediment of river, irrigation canal, reservoir, and wetland in Taiwan. Environ. Sci. Pollut. Res. 2019, 26, 17762–17773. [Google Scholar] [CrossRef]
  43. Nelson, Y.; Lion, L.; Shuler, M.; Ghiorse, W. Effect of Oxide Formation Mechanisms on Lead Adsorption by Biogenic Manganese (Hydr)oxides, Iron (Hydr)oxides, and Their Mixtures. Environ. Sci. Technol. 2002, 36, 421–425. [Google Scholar] [CrossRef]
  44. Beal, S.; Osterberg, E.; Zdanowicz, C.; Fisher, D. Ice Core Perspective on Mercury Pollution during the Past 600 Years. Environ. Sci. Technol. 2015, 49, 7641–7647. [Google Scholar] [CrossRef]
  45. Yudovich, Y. Geochemistry of Manganese; IG Komi NTs URO RAN: Syktyvkar, Russia, 2014; p. 540. [Google Scholar]
Figure 1. The Lake Onego ecosystem components sampling scheme: I—Povenetsky Bay; II—Zaonezhsky Bay; III—Small Onego; IV—Unitskaya Bay; V—Lizhemskaya Bay; VI—Kondopoga Bay; VII—Petrozavodsk Bay; VIII—Big Onego; IX—Central Onego; X—South Onego.
Minerals 12 01410 g001
Figure 2. The mercury form in the water in the different areas of Lake Onego.
Minerals 12 01410 g002
Figure 3. Mercury content in the sedimentation traps material from the different areas of Lake Onego in 2020 and 2021. ND—no data available.
Minerals 12 01410 g003
Figure 4. Distribution of mercury: (a) in the first (I) and second (II) type of the Lake Onego bottom sediments, (b) the average concentration in the Lake Onego bottom sediments.
Minerals 12 01410 g004
Figure 5. Mercury content in the first (I) and second (II) type of bottom sediments.
Minerals 12 01410 g005
Figure 6. Mercury content in the bottom sediments of the different areas of Lake Onego.
Minerals 12 01410 g006
Figure 7. Dendrogram of the R-type cluster analysis calculated, based on the chemical element concentrations in the material of the sedimentation traps and the bottom sediments.
Minerals 12 01410 g007
Table 1. Measurement range of the mass fraction of elements (μg/g).
ElementElectrothermal Atomization Flame Atomization
Al-5.0–5.0 × 10⁴
K-5.0–5.0 × 10⁵
Na-5.0–5.0 × 10⁵
Mg-5.0–5.0 × 10⁵
Ca-5.0–5.0 × 10³
Fe-5.0–5.0 × 10³
Be0.50–1.0 × 1035.0–1.0 × 10³
V-5.0–1.0 × 10³
Cr-1.0–5.0 × 10³
Mn-1.0–5.0 × 10³
Co0.5–1.0 × 1031.0–5.0 × 10³
Ni0.5–1.0 × 1031.0–5.0 × 10³
Cu-1.0–5.0 × 10³
Zn-1.0–5.0 × 10³
Sr-5.0–5.0 × 10³
Cd 0.05–1.0 × 1031.0–5.0 × 10³
Sb5.0–1.0 × 1031.0–5.0 × 10³
Ba-5.0–5.0 × 10³
Pb0.5–1.0 × 1031.0–5.0 × 10³
Note: “-” means that the method was not used to analyze the element.
Table 2. Mercury content in the components of the Lake Onego ecosystem.
Lake AreaHg in Sedimentation Traps Material (2020/2021), μg/gHg in WaterHg in Bottom Sediments
Hgdissolved, μg/LHgsuspended, μg/L0–20 cm, μg/g20–200 cm, μg/g
Povenetsky Bay0.76/ND0.010.0120.0410.023
Zaonezhsky Bay0.09/0.070.30.060.050.019
Small Onego0.19/0.090.3850.0030.0530.033
Lizhemskaya Bay4.37/ND0.250.0030.0730.044
Unitskaya Bay0.18/0.080.1250.020.070.016
Kondopoga Bay0.10/0.150.010.0730.0890.031
Petrozavodsk Bay0.11/0.160.360.0190.0520.027
Big Onego0.12/0.120.540.0120.0760.058
Central OnegoND/0.100.1730.0020.0690.044
South Onego0.06/0.070.850.0020.080.044
Note: ND—no data available.
Publisher’s Note: MDPI stays neutral with regard to jurisdictional claims in published maps and institutional affiliations.

