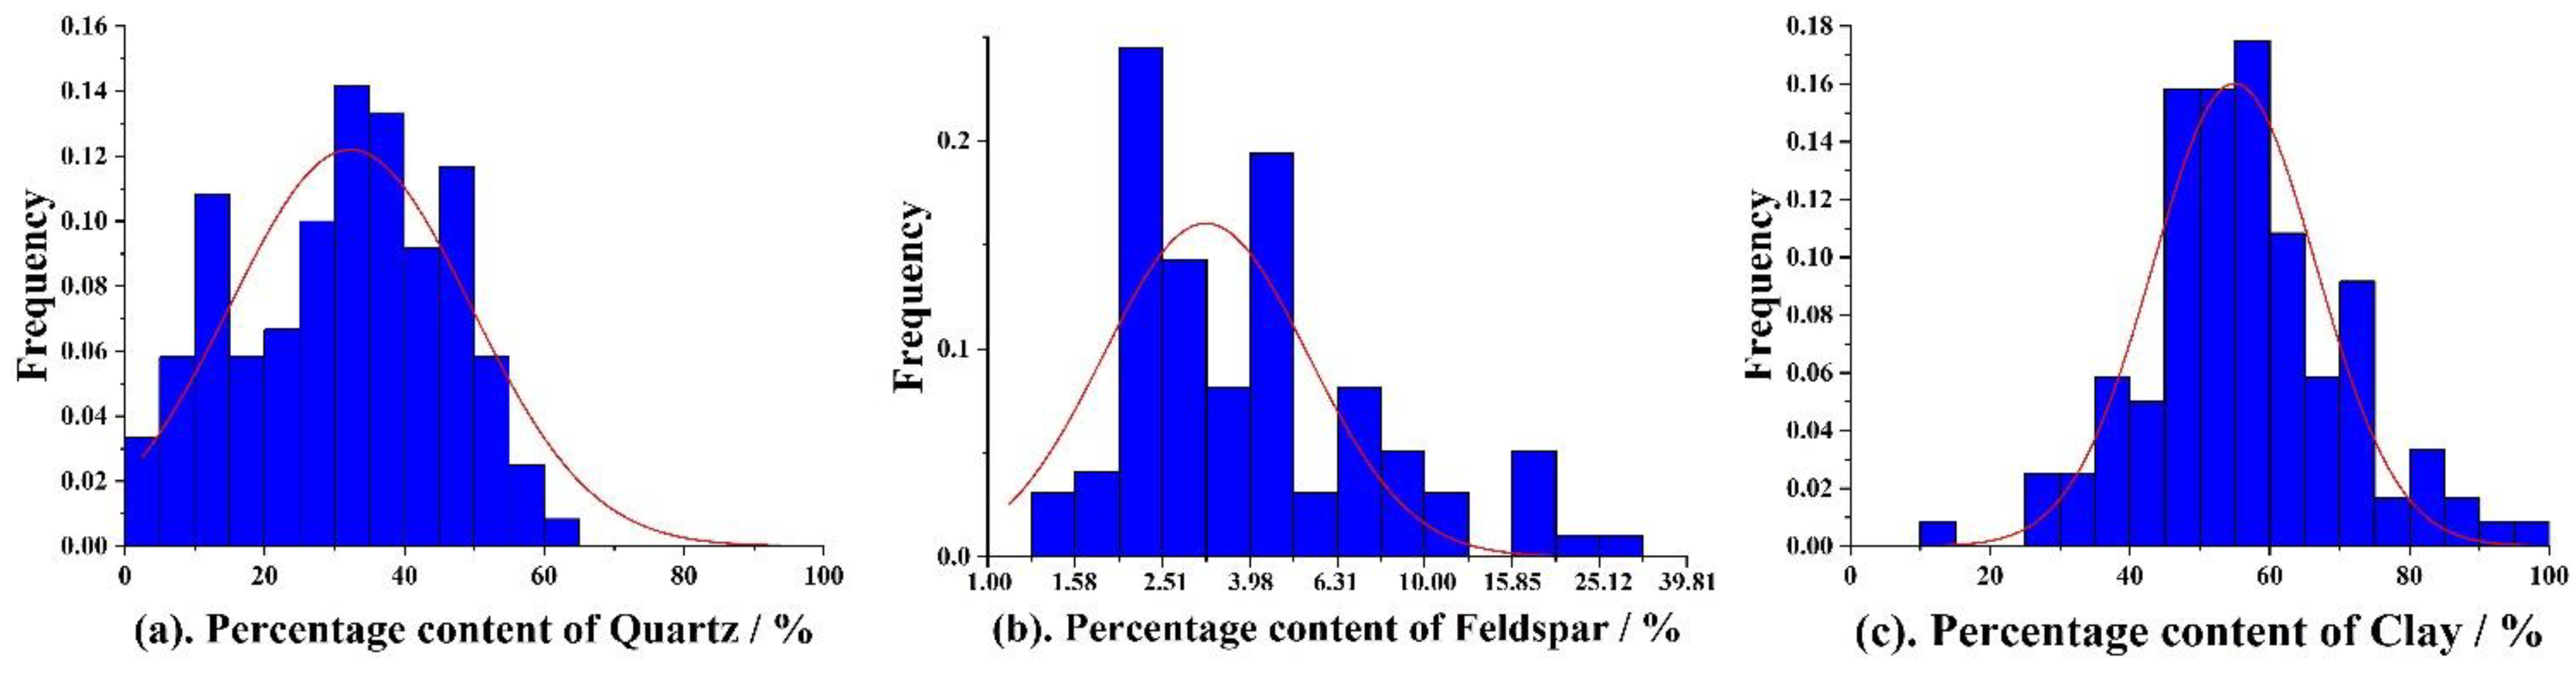
Article

Experimental Study on the Effect of Mineral Composition on Shrinkage Fractures: Implications for the Origin of the Diagenetic Shrinkage Fractures in Marine–Continental Transitional Shales

1
School of Energy Resources, China University of Geosciences, Beijing 100083, China
2
Key Laboratory of Strategy Evaluation for Shale Gas of Ministry of Land and Resources, China University of Geosciences, Beijing 100083, China
3
School of Resources and Materials, Northeastern University-Qinhuangdao Campus, Qinhuangdao 066004, China
*
Author to whom correspondence should be addressed.
Minerals 2022, 12(11), 1381; https://doi.org/10.3390/min12111381
Submission received: 22 August 2022 / Revised: 26 October 2022 / Accepted: 27 October 2022 / Published: 30 October 2022

Abstract

:
Natural fractures in shale have been commonly recognized as a vital factor in shale gas production. Diagenetic shrinkage fracture is an important type of natural fracture; however, its formation mechanism and prediction remain largely unexplored. Given the similarity between diagenetic shrinkage fractures and desiccation cracks, the influence of smectite, kaolin, quartz, and feldspar on shrinkage fractures were investigated using the physical simulation experiment of desiccation in this study. Here, water evaporation, surface cracks initiation and propagation processes were monitored during the whole desiccation. The morphological characteristics of cracks patterns were quantitatively described. Diagenetic shrinkage fractures of transitional shale with different minerals were observed using SEM. The results show that the development and morphology of cracks are affected by the mineral composition, and the sediments with higher clay content tend to form more complex fracture networks. We further propose a morphological prediction model for cracks and compare this model with diagenetic shrinkage fractures under SEM. We found that the effects of mineral composition on both were similar, with more well-developed diagenetic shrinkage fractures in those clay-rich samples. Taken together, this study implies the feasibility of using physical simulation experiment of desiccation cracks to invert diagenetic shrinkage fractures and provides new insights into the mechanism and development regularity of diagenetic shrinkage fractures.

1. Introduction

Shrinkage fractures are ubiquitous in nature, and their generation is a complex multi-physical dynamic process, involving water evaporation and volume shrinkage. Currently, it has been widely studied in construction materials [1], agricultural cultivation [2,3], environmental governance [4], paleoclimate reconstruction and hydrocarbon exploration [5,6,7,8,9,10]. The research in these fields is mostly limited to the shrinkage fractures formed in or near the surface under an open environment. Cleat formation in coal beds is presumed to be diagenetic process and/or tectonic process [11]. In shale, a series of diagenesis such as compaction, silica diagenesis [12], clay mineral transformation, and hydrocarbon generation leading to water loss and volume shrinkage form shrinkage fractures that include desiccation cracks formed in the near-surface open environment, polygonal fault systems caused by silica diagenesis [13,14], clay mineral transformation fractures, and organic matter shrinkage fractures formed in an underground closed environment. These shrinkage fractures in shale have not been studied extensively.
Fractures are the basis of shale gas accumulation [15]. The existence of natural fractures provides a space for the storage and migration of natural gas [16]. The partially closed natural fractures are reactivated during hydraulic fracturing, affecting the propagation and strength of artificial fractures [17,18]. The diagenetic shrinkage fracture is an important type of natural fracture and could be found in various facies shale [19]. Early research on shale gas mainly focuses on the marine environment [15,18,20,21]. With the diversified development of shale gas exploration and development, marine–continental transitional shale gas has gradually attracted widespread attention [22,23,24]. Owing to the changeable sedimentary environment of transitional shale, the continuous thickness of shale is small, and the single layer is limited, which means the geological theory of marine shale gas cannot be directly used in transitional shale gas [25,26]. This also makes the theoretical research of traditional shale relatively weak. Therefore, this paper focuses on the study of diagenetic shrinkage fractures in transitional shale.
The desiccation mechanism is mainly discussed from the changes of energy, stress state, or volume, and based on this, the development model of shrinkage cracks is divided into three categories: Model a is based on the theory of fracture mechanics to interpret cracking as the dissipation of elastic properties in terms of energy [27,28,29,30]; Model b explains the generation of shrinkage fractures with suction and tensile strength from the perspective of mechanics [31,32]; and Model c links the volume change index with crack formation [33,34]. The mineral is an important factor affecting shrinkage fractures. The higher percentage of smectite results in an increase in shrinkage [35], while silica reduces compressibility and swelling behavior affording the reduction in cracks [36,37]. However, research on desiccation focuses on experiments with a single mineral or natural samples; the restrictive effect of multiple mineral-mixed samples is neglected.
In this study, we conducted a physical simulation experiment of desiccation to explore the influence of smectite, kaolin, quartz, and feldspar content on shrinkage fractures. We further revealed the cracking conditions and established the morphological prediction model under different mineral compositions. Combining the unique formation environment of diagenetic shrinkage micro-fractures, the prediction model is applied to the prediction of micro-fractures under different mineral compositions. This is crucial for the understanding of the formation mechanism of shale oil and gas and identifying favorable reservoirs.

2. Methods

2.1. Data Collection and Experimental Design

A mass number of shrinkage fractures was formed in the early diagenetic stage. Later on, as the compaction effect becomes more significant, fractures may close. Consequently, the experimental parameters were primarily based on the early diagenetic stage parameters. In order to explore the shrinkage fractures in the early diagenetic stage of shale under different mineral compositions and contents, the mineral composition and content of 120 shale samples in transitional facies were collected from the Southern North Basin, Ordos Basin, Sichuan Basin, and Yangtze block [38,39,40,41,42,43,44], and counted.
Shale has a wide range of mineral compositions, including quartz, feldspar clay, organic matter, pyrite and carbonate minerals. Quartz and feldspar are two important brittle minerals of shale. Kaolin, smectite, chlorite, and illite are the four main types of clay minerals in shale [38,39,40,41,42,43,44], while kaolin and smectite will transform into illite or chlorite in the middle diagenesis stage [45]. Because of the low median content of mineral components such as organic matter and pyrite, they were ignored in this experiment. In aggregate, in order to better control variables and study the effect of variables, only quartz, feldspar, kaolin and smectite were considered in this set of experiments.
Then, Gaussian normal distribution was used to fit the mineral content and the Gaussian parameter values of minerals were obtained (Table 1). The quartz content of samples ranged from 0.9% to 62.7%, with a median of 32.24% ± 1.74% (Figure 1a), while excluding the samples without feldspar, the median value of feldspar was 3.16% ± 1.13% (Figure 1c). Additionally, clay mineral content ranged from 14.3% to 97.4%, with a median of 54.95% ± 1.03% (Figure 1b).
According to the properties of the Gaussian normal distribution, μ denotes the mineral concentration trend. Within the range of μ ± 2σ, 95.45% of the possible geological conditions were included (Table 1). Combined with the properties of the Gaussian distribution of mineral content and geological significance, the content of brittle minerals (including quartz and feldspar) in the experiment was designed to range from 10% to 70% while the corresponding clay mineral content ranged from 30% to 90%. Due to the variability of geological conditions and considering the extreme circumstances, the content ratio of quartz and feldspar was set as 8:2, 6:4, 4:6, and 2:8.
As shale is mainly composed of particles smaller than 62.5 μm, 15 μm quartz, 15 μm feldspar, 10 μm kaolin, and 10 μm smectite were selected for the experiment. The minerals in all the designed experiments were completely dissolved when water and minerals were added in a 2:1 ratio, according to our preliminary experiments. The heating temperature of experiments was 45 °C, which corresponds to a buried depth of 600 to 800 m in the early stage of diagenesis. The three groups of the designed experimental conditions were created by combining the above conditions (Table 2). The first group containing S1, S2, S3, and S4 mainly explored the influence of clay and brittle minerals on cracks, the second group (S1, S5, S6, and S7) showed solicitude for the effect of kaolin and smectite and the last group (S8, S9, S10, and S11) laid emphasis on the influence of the content of quartz and feldspar.

2.2. Desiccation Experiment

The desiccation experiment was carried out with a desiccation imitator. The simulation area was 100 × 100 cm and the imitator had 16 identical experimental heating plates with a diameter of 25 cm each. It also had cameras that could capture the moment the crack appeared, as well as lamps to reduce the shadows on the photos. Every two hours, the weight of the samples was recorded to determine the drying date and the exact time of the experimental results.
Minerals in various proportions were placed in circular containers with an inner diameter of 24 cm and thoroughly stirred and mixed, as per the above-mentioned design. Then, water was subsequently added to the vessel. To make slurry samples, the water and minerals were stirred and mixed with a glass rod until they were completely mixed. Later, the samples were placed on the imitator and heated at 45 °C after being placed in the slurry sample for 24 h. The ambient temperature in the laboratory ranged from 20 °C to 30 °C, with a relative humidity of 15%–30%.
After experiments were completed, pictures obtained from the experiments were processed. The number of fractures and joints and the length of each fracture were measured. Based on these data, total length, average length, crack density, area density and joints density were counted aiming to describe fracture development.

3. Results

3.1. Development Stage of Desiccation

Changes in water content versus time of experiment for the eleven specimens are plotted in Figure 2. The initial water content of all the samples was 66.67%. Then, with continuous heating, the water content of the samples decreased, and cracks developed. As can be seen, samples with different mineral compositions showed similar trends in moisture content reduction while their critical moisture content at cracking initiation were different. Thus, desiccation was divided into three stages based on the change rate of moisture content and the development of cracks:
  • Normal Stage: The water content of the sample decreased at a constant rate at this stage, while no cracks appeared (Figure 3a).
  • Acceleration Stage: The moisture loss rate increased after the initial appearance of cracks from the boundary (Figure 3b–f). The sample surface was spilt into several large aggregates by cracks and the cracking process accelerated (Figure 3f–o). These initial cracks were considered as the main cracks, as they were the widest cracks at the end, and they formed the main framework of the crack network. Simultaneously, new cracks appeared in large aggregates making the crack network more complex and the extension direction of new cracks in development was slightly changed due to the influence of other cracks. For example, it is found that a crack l first extended along the initial direction (Figure 4a) and during development its crack direction changed as it approached another crack m. Eventually, crack l intersected with m at nearly 90° (Figure 4b). Sometimes the extended ends of two parallel cracks changed when they were closed to each other and even contacted, forming en passant cracks (Figure 4c,d). The end of this stage was marked by the basic stability of crack network morphology (Figure 3o).
  • Deceleration Stage: When the heating time reached about 90 h, the slope of the moisture content curve decreased. The development of cracks was extremely slow in this stage and the width of the formed cracks increased slightly (Figure 3o–t). Some came to an end at the boundary due to the boundary’s limitation (Figure 5a,b) while most cracks continued to grow until they rejoined another existing crack (Figure 5c,d). Besides, several cracks suddenly abruptly stopped extending (Figure 5e,f).

3.2. Desiccation Cracks under Different Mineral Compositions

Desiccation occurred in all samples and the crack initiation time in rich-clay mineral samples was faster than others. Under different mineral ratios, the morphological characteristics of crack development were not exactly the same. For example, the intersection angles of cracks were usually 90°, 60° or 120° while cracks were more numerous and longer in clay-rich samples.
Figure 6 shows the morphology of cracks under different clay and brittle mineral ratios. With the decrease in clay content, cracks developed poorly. In S4 with 30% clay, cracks were fine and short, which only developed in a small range, and they formed a simple network with poor connectivity.
Figure 7 depicts the number of cracks of various lengths in samples with various BM:TC (BM: TC means the content ratio of brittle minerals to all clay minerals). As the clay content decreased from 90% to 30%, short cracks, less than 30 mm in length, accounted for the majority of the cracks and the proportion of 0–10-mm-long cracks increased. Additionally, in the rich-clay samples, cracks ranging from 10 to 40 mm widely developed, with several main cracks spanning more than 100 mm.
In S1, S5, S6, and S7, under similar experimental conditions, only the value of K:S increased (K:S refers to the ratio of kaolin to smectite minerals). More cracks developed in S1 and S6 while the cracks in S1 and S5 were wider (Figure 8). Smectite-rich samples had larger shrinkage and wider cracks. When K:S increased to 8:2, the connectivity between the cracks was poor and the network was simple (Figure 8d).
There were more cracks ranging in length from 10 to 30 mm in S1 and S6, with the same changing trend in length and number while most cracks were 40–50 mm and 100–200 mm in length in S7 (Figure 9). Cracks were all longer than 30 mm in S5 and only S1 developed long cracks exceeding 200 mm among the four groups of samples.
Quartz and feldspar are two common brittle minerals. From the visual observation of the desiccation results, the development degree of cracks was the same and cracks formed a simple crack network (Figure 10). There were no cracks longer than 200 mm in S8, S9, S10 and S11 and the number of cracks of various lengths was quite different from that of the other samples in S11. S11 had the most cracks under 10 mm while S8, S9, and S10 had more cracks between 10 and 20 mm and its crack length was typically 0–20 mm and 40–60 mm.

4. Discussion

4.1. Water Evaporation and Cracking

The formation of desiccation cracks is closely related to water evaporation, which shows the decrease in water content from the data. The particles in the sediment produce tensile stress due to capillary suction with the reduction in moisture content. When the tensile stress exceeds the tensile strength of the sediment, cracking begins [46,47]. The stress criterion for crack initiation is:
t + ( σ h μ a ) 0
The formula comes from [48], where t is the tensile strength of sediment; σ h μ a is the net horizontal stress; σ h is the total normal stress in the horizontal direction; and μ a is the pore air pressure.
The inequality means the condition for cracking is when the net horizontal stress ( σ h μ a ) exceeds the tensile strength ( t ). Sediments are affected by pore air pressure, pore water pressure, and the horizontal suction component and its suction is related to the amount of water in the sediments, which can be measured using the soil–water characteristic curve [49,50]. Sediment tensile strength is also affected by water content. These findings suggest that water content is linked to cracking closely.
Different sedimentary environments have diverse mineral composition sediments and different minerals have various crystal structures, implying a diversity of water absorption and evaporation, which is in agreement with our results. The water content at crack initiation is different under different mineral composition ratios, leading to changes in the development conditions of desiccation cracks. S1 with the highest smectite content has the maximum critical water content (CWC), while the CWC with the lowest smectite content (S7) is not the lowest. Thus, smectite can be considered as an important factor in the CWC. Smectite has a higher water absorption capacity than kaolin, quartz, and feldspar. Water is adsorbed not only on the outer surface of particles but also between crystals [51].
The experimental data show that the weight ratio of kaolin to smectite and the ratio of brittle minerals to clay has a linear relationship with the CWC, while the ratio of feldspar to quartz has a non-linear relationship with the CWC. The CWC gradually decreases along with the value of BM:TC increasing from 1:9 to 7:3 (Table 3, S1, S2, S3, S4) or the value of K:S increasing from 2:8 to 8:2 (Table 3, S1, S5, S6, S7), while it initially increases and subsequently decreases as the value of Q:F decreases from 8:2 to 2:8; when it is 6:4, the CWC is the highest (Table 3, S8, S9, S10, S11). Thus, a multiple regression model of the influence of mineral quality ratio on the CWC is established:
CWC =   β 0 + β 1 ( M K M S ) + β 2 ( M B M M T C ) + β 3 ( M Q M F )   β 4
where M Q ,   M F ,   M K ,   M S , M B M , M T C are the mass of quartz, feldspar, kaolin, smectite, brittle mineral, and total clay minerals, respectively;   β 0 ,   β 1 ,   β 2 ,   β 3 ,   β 4 are mineral-related parameters.
This formula could be used to predict the development conditions of desiccation cracks. With a large amount of data, this formula may predict the water content conditions when desiccation cracks occur under the same conditions and different mineral compositions.
Except for the water content, the tensile strength is affected by the mineral type and content, particle size, bulk density, stress state, etc. [52,53,54]. Such factors affecting cracking need to be studied further.

4.2. Effect of Mineral Composition on Desiccation Cracks

4.2.1. Brittle and Clay Minerals

When the clay weight content was reduced from 90% to 30%, our experiment showed that the number of cracks decreased from 29 to 18 and the number of joints decreased from 53 to 29 (Table 4). S4 had more joints and crack numbers than S3, but it had a shorter total and average length than S3. This can be attributable to the locally developed cracks of S4. The latter had a low average length and width of cracks as well as a low number of intersection joints, resulting in a network with poor connectivity, whereas S1, S2, and S3 had a more complex network.
To some extent, the joint number reflects the fracture network’s complexity. Joints are divided into three types: boundary, termination, and intersection. The boundary joint is caused by a boundary restriction under experimental conditions, which prevents cracks from developing continuously. In clay-poor samples, the cracks locally developed and are rarely connected with adjacent cracks. Consequently, it has a higher proportion of termination joints and fewer intersection joints. Multiple cracks intersect in clay-rich samples, forming a more dense and complex fracture network with more intersecting joints.
The main factors determining the degree of cracking are the expansibility, water absorption, and large shrinkage of clay minerals [51,55]. Clay-rich sediments shrink more; they have more cracks and intersection joints and better connectivity as well as a more complex fracture network. The content of clay decreases as the mass of brittle minerals increases, reducing sediment shrinkage [47,56]. The number of intersection joints decreases as the clay proportion decreases, and the fracture network becomes simpler. The connectivity between fractures becomes poor as the proportion of clay decreases, and only short fractures develop in a few small areas. This is in agreement with the results of the actual sediment experiment [35].

4.2.2. Kaolin and Smectite

The number of cracks and their average length, as well as the number of joints were not linearly related to the value of MK:MS (Table 5). When the MK:MS value was 2:8 or 6:4, the number of cracks and joints was higher. The overall length was a little longer, but the average length was a little shorter. The short cracks developed well and their parameter values were slightly lower than those of the long cracks. When the MK:MS value was 4:6 or 8:2, the number of cracks and joints was reduced. The total length was a little shorter, but the average length was longer. Long fractures had a higher degree of development. S1 and S6 had higher complexity cracks. The main difference between them is the average width of cracks. Cracks in S1 were significantly wider than that in S6.
The crack area of these four groups was measured to explore how kaolin and smectite affected shrinkage (Table 6). With the decrease in smectite quality, the crack area became increasingly smaller from 107.03 cm2 to 19.96 cm2. Smectite has a higher capacity for adsorption to water than kaolin. Rich smectite provides sediments with more shrinkage space during the water loss process, affording an increase in crack average width and area.
There were more boundary and intersection joints in the four samples, but fewer termination joints. When the value of MK: MS was less than 5:5, the expansion of the smectite had a significant effect on desiccation. The width of cracks decreased as the MK:MS value increased, the number of intersecting joints decreased and the proportion of cracks longer than 50 mm increased, reducing the crack network’s complexity (Figure 9). When the value of MK: MS was greater than 5:5, kaolin had a considerable influence on the proportion and crack shrinkage was minimal. The samples with more smectite had a larger shrinkage space, resulting in more cracks and a more complex network.
Compared with S1, the cracks in S6 were the most developed with 33 cracks and there were more cracks longer than 50 mm (Figure 9), as a result of the excessive shrinkage reduced the volume of the block and increased the crack width, which inhibited the formation of new cracks to a degree. As the smectite content decreased, the shrinkage space shrank, the number of intersection joints decreased, and some long cracks connected, forming a very simple crack network.
Therefore, extremely high quality of smectite means that the sediment had great shrinkage space and wide cracks and was not directly related to a complex network with excellent connectivity. A major difference between smectite-rich and kaolin-rich sediments was the discrepancy between crack width and overall shrinkage. The smaller the MK: MS value, the greater the crack width and overall shrinkage.

4.2.3. Quartz and Feldspar

Generally, desiccation cracks develop poorly when the quality of brittle minerals is high. There is little discussion on crack development morphology difference under various brittle mineral content. We carried out experiments on the two common brittle minerals, namely, quartz and feldspar.
According to quantitative test results, there was no significant difference in the number of cracks, average length, or joint number among S8, S9, and S10 (Table 7). The average length was about 4.5 cm, and there were 30–40 joints. However, in S11 (with 36% feldspar), the number of cracks increased, the average length decreased, and there were more joints, with the proportion of termination joints increasing to about 57%. This means that in S11, there were small cracks that were not connected to each other.
To further explore the differences between S11 and other samples, we statistically analyzed the number of cracks of various lengths under the ratio of four kinds of quartz to feldspar (Figure 11 and Figure 12). Figure 11 more prominently shows which length of cracks is more developed in different samples, while Figure 12 more clearly shows the different proportions of the number of cracks of different lengths in different samples. S11 had more cracks with length less than 30 mm. In addition, the width of the cracks in S11 was lower than that in the other three samples.
Observing the cracking process, it was found that several main cracks developed forming a simple crack network in the four samples in the early stage. Subsequently, the generated cracks continued to extend and became slightly wider in the first three samples. Simultaneously, in S11, new cracks, which were mostly less than 20 mm in length, appeared. This is also why the morphological parameters of S11 are different from those of the first three samples. We notice that the four samples had the same quality of smectite and kaolin, thus the same shrinkage. In this situation, S11 with rich feldspar tended to generate new cracks while others tended to widen original cracks. Therefore, we speculated that due to the ultra-high quality of feldspar, more stress concentration joints in S11 made sediments easier to crack. However, the specific reason needs further experimental verification.

4.3. Morphology Model of Desiccation Evolution

The morphology of desiccation cracks in nature has been observed. In the Huayuankou area of the Yellow River in Zhengzhou City, a large number of cracks has been found. Cracks have three remarkable morphological characteristics in shape:
  • Cracks do not develop in a straight line. Tiny cracks can be seen to zigzag;
  • Crack intersection angles in nature exceed 50°, with the majority being 90° (Figure 13);
  • The crack network is irregularly distributed on the plane.
According to the experimental results and the remarkable morphological characteristics, we gained a certain understanding of the morphological characteristics under various mineral compositions. Under different scales, the length, width, and other morphological parameters of cracks were different. Therefore, each sample’s crack number, length, and joint number per dm2 were measured (Table 8). Thus, a cracking prediction model with diverse mineral compositions under certain conditions was proposed (Figure 14). This morphology model restricted the basic development environment due to the influence of temperature, mineral particle size, and pressure conditions on crack morphology (Table 9).
In the case of clay-rich and brittle-poor minerals, desiccation cracks were abundant, with many intersection joints, forming a complex fracture network. With a total length of 15–30 cm and 5–11 joints, the complex network had approximately 2–7 complete cracks per dm2. Among them, the smectite-rich sediment had a larger shrinkage space and wider cracks. In addition, the sediment had a time when the aggregates shrink for a period to widen the initially formed cracks during cracking. In the case of poor-smectite and rich-kaolin minerals, owing to the smectite content decreasing greatly, the shrinkage decreased sharply, the number and joints of cracks decreased, and the fracture network became simple.
When the content of brittle and clay minerals were similar, sediments formed a simple fracture network with little intersection joints. It had about 1–2 joints per dm2 and about 1–2 cracks with a total length of about 10 cm. When the content of brittle minerals increased, shrinkage decreased and many small cracks were developed. There were about 3–4 cracks per dm2. The total length of the cracks was about 9 cm, with approximately 6–7 joints, most of which were termination joints.
Feldspar and quartz, two main brittle minerals, inhibited the development of cracks. Under the conventional content, there was little difference in cracking between them. When the quality ratio of quartz to feldspar was 2:8, that is, in the case of rich-feldspar, there were about 8–9 cracks per dm2 with a total length of approximately 23 cm and about 15–16 joints, with the proportion of termination joints increasing to about 57%. More tiny cracks appeared, with an average length of only 2.6 cm.

4.4. Shrinkage Fractures in Transitional Facies Shale

The formation lithology of transitional facies shale changes dramatically due to the unique sedimentary environment, and the shale interacts with sandstones. Both shale and sandstone contain shrinkage fractures. Fractures can be found in the surface layer of siltstone as well as in the inner layer (Figure 15). They zigzag and intersect with each other, in accordance with the morphological characteristics of desiccation cracks. They also propagate toward the inner layer. The surface layer and middle layer have more cracks, while the innermost layer has fewer. Grain shrinkage caused by a pore-pressure increase may cause extension fractures in tectonically extensional, neutral, or compressional settings [57]. However, it is easy to distinguish the two types of fractures in its morphology.
When exposed to the air, sandstone will be weathered under the effect of water, resulting in the decomposition of minerals and formation of shrinkage fractures. Primary minerals such as feldspar and calcite generate secondary minerals with small particle sizes under the action of water and CO2. For example, K, Ca, Na and other metal ions in feldspar dissolve to form clay minerals, such as kaolin and illite. The sandstone in the surface-shallow layer is greatly affected by the external environment and has a high degree of weathering. Moreover, rocks repeatedly crack due to multiple dry and wet cycles, resulting in more cracks on the sandstone surface, larger width, and an increased surface crack rate. Conversely, cracks in the inner sandstone are undeveloped [58].
According to the abovementioned physical simulation experiment of cracking, fractures are more prevalent clay-rich minerals. However, the total amount of clay minerals in the siltstone increases from the outside to inside, and only the innermost layer contains some feldspar (Table 10). This is because the secondary minerals with small particle sizes produced by shallow weathering enter the sandstone along cracks with rainwater infiltration, affording an upward trend in the total amount of clay minerals.
Due to the formation pressure and water loss path, the scale of shale diagenetic shrinkage fractures is much smaller than desiccation cracks, most of which are micro-fractures. However, the morphology of micro-fractures corresponds to the morphological characteristics of desiccation cracks. Diagenetic shrinkage fractures not only form primarily near clay minerals with no obvious direction, but also extend tortuously. These can be used to distinguish the micro-fractures under SEM.
Diagenetic shrinkage fractures include desiccation cracks, clay mineral transformation fractures, OM shrinkage fractures, etc. Due to compaction, pore water and excess interlayer water are discharged in the early diagenesis stage, accompanied by shrinkage cracks, such as desiccation cracks. With the increase in buried depth and temperature, smectite transforms into illite along with the loss of water and the shrinkage of volume, forming clay mineral transformation fractures. Initially, the residual interlayer water in smectite is removed and transformed into mixed-layer clay minerals as a result of the thermal action [59]. Subsequently, when the buried depth exceeds 2700 m, smectite removes the last residual interlayer water and becomes illite of the non-mixed layer [60]. This period is the massive development period of mineral transformation fractures. In the oil generation window, the volume of organic matter shrinks, generating organic matter pores and OM shrinkage fractures due to the differential heat transfer between organic matter and minerals in the rock matrix.
The relationship between the content of clay minerals and shale diagenetic shrinkage microfracture observed by us under SEM was consistent with the desiccation experiment. In the samples with a clay mineral content of 53.2%, interlayer fractures of clay can be seen. These fractures may be caused by interlayer dehydration during smectite–illite transformation [60]. No organic matter was found at the edge of the fracture. Many interlayer and shrinkage fractures were developed in the clay minerals in the samples with a clay mineral content of 64.2%. OM shrinkage fractures were observed at the edge of the OM. Shrinkage fractures formed a network in the samples with up to 82.2% clay mineral content. The polygonal network formed by shrinkage cracks was similar to the desiccation ones, with trigeminal points and a zigzag extension of cracks. The included angles of cracks were mostly 90° and 120° (Figure 16). This further confirms that the mineral content has a great influence on diagenetic shrinkage fractures. In addition, to a certain extent, this also reflects the reliability of the method of studying the underground diagenetic fractures by physical simulation experiment of desiccation cracks.
Shrinkage fractures are common in all types of lithology and soil. Its basic development conditions are due to the existence of clay minerals, especially smectite. The process of water absorption and loss of rock and soil will change, due to the water absorption and expansion of clay minerals, accompanied by cracks. By comparing the morphological prediction model obtained from the physical simulation experiment of desiccation with the morphology of shrinkage micro-fractures in transnational shale observed by the SEM, the development of the above-ground and underground shrinkage fractures is connected. The variation trend of geometric parameters obtained from the simulation experiment with mineral composition is similar to that of the real underground core, implying that the method of studying diagenetic shrinkage micro-fractures of shale through physical simulation experiments of aboveground desiccation cracks is reliable. The study of it can be used in the fields of energy and geology and in the fields of soil moisture conservation in agriculture, soil strength, and stability in engineering.
During the process of diagenesis, shale will also be affected by factors such as pressure and hydrocarbon generation, which have a significant impact on the formation and development of the micro-fractures. Due to the technological limitations, the physical experiment does not consider the impact of these, which will be examined in greater depth in the next step. In addition, hydrocarbon generation is a necessary condition for oil and gas generation. Therefore, it is necessary to study the influence of them more.

5. Conclusions

According to our experiments, we conclude that diagenetic shrinkage fractures have different shapes under various mineral ratios. Water content is an important index of shrinkage fractures. With the mass ratio of kaolin to smectite or brittle to clay minerals increases, the critical water content (CWC) decreases, while with the decrease of the content ratio of quartz to feldspar, the CWC initially increases and subsequently decreases. In addition, our work also shows the morphological characteristics of shrinkage fractures under different mineral ratios: under high clay mineral content, the fracture surface density was large, the connectivity was good, and the fracture network was complex; the fractures in rich-smectite sediments were wider; smaller cracks were more common in sediments with rich-feldspar. Through the observation of shale diagenetic shrinkage fractures under SEM, it was found that the development characteristics of diagenetic shrinkage fractures were highly consistent with each other in the case of high clay mineral content. Diagenetic shrinkage fractures were more developed in shale with high clay mineral content, and even fracture networks similar to macroscopic experiments appeared. This work provides a new direction for the basic mechanism research of diagenetic shrinkage fractures in shale and provides help for shale fracturing and shale gas exploration and development.

Author Contributions

Conceptualization, G.Z. and J.Z.; methodology, G.Z., J.Z. and Z.H.; formal analysis, G.Z.; investigation, G.Z.; resources, G.Z.; data curation, G.Z.; writing—original draft preparation, G.Z.; writing—review and editing, G.Z.; visualization, G.Z.; supervision, J.Z., Y.L., Z.H. and L.X.; project administration, J.Z. All authors have read and agreed to the published version of the manuscript.

Funding

This research was jointly funded by the National Natural Science Foundation of China (Grant No. 41927801) and 2021 Graduate Innovation Fund Project of China University of Geosciences, Beijing (Grant No. ZD2021YC043).

Acknowledgments

The authors thank the three anonymous reviewers for providing valuable comments and suggestions.

Conflicts of Interest

The authors declare no conflict of interest.

References

  1. Kayondo, M.; Combrinck, R.; Boshoff, W.P. State-of-the-art review on plastic cracking of concrete. Constr. Build. Mater. 2019, 225, 886–899. [Google Scholar] [CrossRef]
  2. Bordoloi, S.; Ni, J.; Ng, C.W.W. Soil desiccation cracking and its characterization in vegetated soil: A perspective review. Sci. Total Environ. 2020, 729, 138760. [Google Scholar] [CrossRef] [PubMed]
  3. Kurtzman, D.; Baram, S.; Dahan, O. Soil–aquifer phenomena affecting groundwater under vertisols: A review. Hydrol. Earth Syst. Sci. 2016, 20, 1–12. [Google Scholar] [CrossRef] [Green Version]
  4. Chen, Z.; Kamchoom, V.; Chen, R. Landfill gas emission through compacted clay considering effects of crack pathway and intensity. Waste Manag. 2022, 143, 215–222. [Google Scholar] [CrossRef]
  5. El Maarry, M.R.; Kodikara, J.; Wijessoriya, S.; Markiewicz, W.J.; Thomas, N. Desiccation mechanism for formation of giant polygons on Earth and intermediate-sized polygons on Mars: Results from a pre-fracture model. Earth Planet. Sci. Lett. 2012, 323–324, 19–26. [Google Scholar] [CrossRef]
  6. El-Maarry, M.R.; Pommerol, A.; Thomas, N. Analysis of polygonal cracking patterns in chloride-bearing terrains on Mars: Indicators of ancient playa settings. J. Geophys. Res.-Planets 2013, 118, 2263–2278. [Google Scholar] [CrossRef] [Green Version]
  7. El-Maarry, M.R.; Pommerol, A.; Thomas, N. Desiccation of phyllosilicate-bearing samples as analog for desiccation cracks on Mars: Experimental setup and initial results. Planet. Space Sci. 2015, 111, 134–143. [Google Scholar] [CrossRef]
  8. El-Maarry, M.R.; Watters, W.; McKeown, N.K.; Carter, J.; Dobrea, E.N.; Bishop, J.L.; Pommerol, A.; Thomas, N. Potential desiccation cracks on Mars: A synthesis from modeling, analogue-field studies, and global observations. Icarus 2014, 241, 248–268. [Google Scholar] [CrossRef]
  9. Bouchaala, F.; Guennou, C. Estimation of viscoelastic attenuation of real seismic data by use of ray tracing software: Application to the detection of gas hydrates and free gas. C. R. Geosci. 2012, 344, 57–66. [Google Scholar] [CrossRef]
  10. Bouchaala, F.; Ali, M.Y.; Matsushima, J.; Bouzidi, Y.; Takam Takougang, E.M.; Mohamed, A.A.; Sultan, A.J.G. Azimuthal investigation of compressional seismic-wave attenuation in a fractured reservoir. Geophysics 2019, 84, B437–B446. [Google Scholar] [CrossRef]
  11. Laubach, S.; Marrett, R.; Olson, J.; Scott, A. Characteristics and origins of coal cleat: A review. Int. J. Coal Geol. 1998, 35, 175–207. [Google Scholar] [CrossRef]
  12. Hooker, J.N.; Huggett, J.M.; Cartwright, J.; Ali Hussein, M.J.G. Geophysics, Geosystems, Regional-scale development of opening-mode calcite veins due to silica diagenesis. Geochem. Geophys. Geosyst. 2017, 18, 2580–2600. [Google Scholar] [CrossRef]
  13. Cartwright, J. Diagenetically induced shear failure of fine-grained sediments and the development of polygonal fault systems. Mar. Pet. Geol. 2011, 28, 1593–1610. [Google Scholar] [CrossRef]
  14. Cartwright, J.; James, D.; Bolton, A. The genesis of polygonal fault systems: A review. Geol. Soc. Lond. Spec. Publ. 2003, 216, 223–243. [Google Scholar] [CrossRef]
  15. Curtis, J.B. Fractured Shale-Gas Systems. AAPG Bull. 2002, 86, 1921–1938. [Google Scholar]
  16. Wei, Z.F.; Wang, G.; Wang, Y.L.; Ma, X.Y.; Zhang, T.; He, W.; Yu, X.L. Geochemical and Geological Characterization of Marine-Continental Transitional Shale: A Case Study in the Ordos Basin, NW China. Acta Geol. Sin.-Engl. Ed. 2020, 94, 809–821. [Google Scholar] [CrossRef]
  17. Gale, J.F.W.; Laubach, S.E.; Olson, J.E.; Eichhubl, P.; Fall, A. Natural fractures in shale: A review and new observations. AAPG Bull. 2014, 98, 2165–2216. [Google Scholar] [CrossRef]
  18. Gale, J.F.W.; Reed, R.M.; Holder, J. Natural fractures in the Barnett Shale and their importance for hydraulic fracture treatments. AAPG Bull. 2007, 91, 603–622. [Google Scholar] [CrossRef]
  19. Meng, Q.F.; Hao, F.; Tian, J.Q. Origins of non-tectonic fractures in shale. Earth Sci. Rev. 2021, 222, 103825. [Google Scholar] [CrossRef]
  20. Kinley, T.J.; Cook, L.W.; Breyer, J.A.; Jarvie, D.M.; Busbey, A.B. Hydrocarbon potential of the Barnett Shale (Mississippian), Delaware Basin, west Texas and southeastern New Mexico. AAPG Bull. 2008, 92, 967–991. [Google Scholar] [CrossRef]
  21. Tan, J.Q.; Weniger, P.; Krooss, B.; Merkel, A.; Horsfield, B.; Zhang, J.C.; Boreham, C.J.; van Graas, G.; Tocher, B.A. Shale gas potential of the major marine shale formations in the Upper Yangtze Platform, South China, Part II: Methane sorption capacity. Fuel 2014, 129, 204–218. [Google Scholar] [CrossRef]
  22. Dong, Z.; Zhang, J.C.; Tang, X.; Liu, G.X.; Dang, W.; Liu, Y.; Tao, J.; Su, Z.X. Origin and diffusion of the over-mature transitional natural gas in multiple lithologic reservoirs: A case study of Carboniferous-Permian strata in the southeastern margin of Ordos Basin. Int. J. Coal Geol. 2020, 219, 103380. [Google Scholar] [CrossRef]
  23. Zhang, J.; Shi, M.; Wang, D.; Tong, Z.; Hou, X.; Niu, J.; Li, X.; Li, Z.; Zhang, P.; Huang, Y. Fields and directions for shale gas exploration in China. Nat. Gas Ind. B 2022, 9, 20–32. [Google Scholar] [CrossRef]
  24. Zhang, S.H.; Liu, C.Y.; Liang, H.; Wang, J.Q.; Bai, J.K.; Yang, M.H.; Liu, G.H.; Huang, H.X.; Guan, Y.Z. Paleoenvironmental conditions, organic matter accumulation, and unconventional hydrocarbon potential for the Permian Lucaogou Formation organic-rich rocks in Santanghu Basin, NW China. Int. J. Coal Geol. 2018, 185, 44–60. [Google Scholar] [CrossRef]
  25. Chen, Y.H.; Wang, Y.B.; Guo, M.Q.; Wu, H.Y.; Li, J.; Wu, W.T.; Zhao, J.Z. Differential enrichment mechanism of organic matters in the marine-continental transitional shale in northeastern Ordos Basin, China: Control of sedimentary environments. J. Nat. Gas Sci. Eng. 2020, 83, 103625. [Google Scholar] [CrossRef]
  26. De Silva, P.N.K.; Simons, S.J.R.; Stevens, P.; Philip, L.M. A comparison of North American shale plays with emerging non-marine shale plays in Australia. Mar. Pet. Geol. 2015, 67, 16–29. [Google Scholar] [CrossRef] [Green Version]
  27. Hallett, P.D.; Newson, T.A. A simple fracture mechanics approach for assessing ductile crack growth in soil. Soil Sci. Soc. Am. J. 2001, 65, 1083–1088. [Google Scholar] [CrossRef]
  28. Hallett, P.D.; Newson, T.A. Describing soil crack formation using elastic–plastic fracture mechanics. Eur. J. Soil Sci. 2010, 56, 31–38. [Google Scholar] [CrossRef]
  29. Prat, P.C.; Ledesma, A.; Lakshmikantha, M.R.; Levatti, H.; Tapia, J. Fracture mechanics for crack propagation in drying soils. In Proceedings of the 12th International Conference on Computer Methods and Advances in Geomechanics, Leibniz Information Centre for Science and Technology University Library (TIB), Goa, India, 1–6 October 2008. [Google Scholar]
  30. Bouchaala, F.; Ali, M.Y.; Matsushima, J.J.G. Attenuation study of a clay-rich dense zone in fractured carbonate reservoirs Seismic attenuation of a dense zone. Geophysics 2019, 84, B205–B216. [Google Scholar] [CrossRef]
  31. Kodikara, J.K.; Choi, X. A Simplified Analytical Model for Desiccation Cracking of Clay Layers in Laboratory Tests. In Proceedings of the International Conference on Unsaturated Soils, Carefree, AZ, USA, 2–6 April 2006; pp. 2558–2569. [Google Scholar]
  32. Morris, P.H.; Graham, J.; Williams, D.J. Cracking in Drying Soils. Can. Geotech. J. 1992, 29, 263–277. [Google Scholar] [CrossRef]
  33. Chertkov, V.Y. An integrated approach to soil structure, shrinkage, and cracking in samples and layers. Geoderma 2012, 173–174, 258–273. [Google Scholar] [CrossRef]
  34. Stewart, R.D.; Rupp, D.E.; Abou Najm, M.R.; Selker, J.S. A Unified Model for Soil Shrinkage, Subsidence, and Cracking. Vadose Zone J. 2016, 15, 1–15. [Google Scholar] [CrossRef] [Green Version]
  35. Albrecht, B.A.; Benson, C.H. Effect of desiccation on compacted natural clays. J. Geotech. Geoenviron. Eng. 2001, 127, 67–75. [Google Scholar] [CrossRef]
  36. Kalkan, E. Influence of silica fume on the desiccation cracks of compacted clayey soils. Appl. Clay Sci. 2009, 43, 296–302. [Google Scholar] [CrossRef]
  37. Li, D.; Zhang, S.; Yi, H. The Influences of Sand Content and Particle Size on the Desiccation Cracks of Compacted Expansive Soil. Adv. Mater. Sci. Eng. 2021, 2021, 1–11. [Google Scholar] [CrossRef]
  38. Dang, W.; Jiang, S.; Zhang, J.C.; Wang, F.Q.; Tao, J.; Wei, X.L.; Tang, X.; Wang, C.H.; Chen, Q. Experimental and Modeling Study on the Effect of Shale Composition and Pressure on Methane Diffusivity. Energy Fuels 2019, 33, 714–726. [Google Scholar] [CrossRef]
  39. He, Q.; Dong, T.; He, S.; Zhai, G. Methane adsorption capacity of marine-continental transitional facies shales: The case study of the Upper Permian Longtan Formation, northern Guizhou Province, Southwest China. J. Pet. Sci. Eng. 2019, 183, 106406. [Google Scholar] [CrossRef]
  40. Huo, Z.P.; Zhang, J.C.; Li, P.; Tang, X.; Yang, X.; Qiu, Q.L.; Dong, Z.; Li, Z. An improved evaluation method for the brittleness index of shale and its application-A case study from the southern north China basin. J. Nat. Gas Sci. Eng. 2018, 59, 47–55. [Google Scholar] [CrossRef]
  41. Pan, L.; Xiao, X.M.; Tian, H.; Zhou, Q.; Chen, J.; Li, T.F.; Wei, Q. A preliminary study on the characterization and controlling factors of porosity and pore structure of the Permian shales in Lower Yangtze region, Eastern China. Int. J. Coal Geol. 2015, 146, 68–78. [Google Scholar] [CrossRef]
  42. Wang, F.T.; Guo, S.B. Shale gas content evolution in the Ordos Basin. Int. J. Coal Geol. 2019, 211, 103231. [Google Scholar] [CrossRef]
  43. Yang, C.; Zhang, J.C.; Tang, X.; Ding, J.H.; Zhao, Q.R.; Dang, W.; Chen, H.Y.; Su, Y.; Li, B.W.; Lu, D.F. Comparative study on micro-pore structure of marine, terrestrial, and transitional shales in key areas, China. Int. J. Coal Geol. 2017, 171, 76–92. [Google Scholar] [CrossRef]
  44. Zhang, J.; Li, X.; Zhang, X.; Zhang, M.; Cong, G.; Zhang, G.; Wang, F. Geochemical and geological characterization of marine–continental transitional shales from Longtan Formation in Yangtze area, South China. Mar. Pet. Geol. 2018, 96, 1–15. [Google Scholar] [CrossRef]
  45. Daniel, B.; Shaw, C.E.W. The Mineralogical Composition of Shales. SEPM J. Sediment. Res. 1965, 35, 213–222. [Google Scholar]
  46. Tang, C.S.; Shi, B.; Liu, C.; Suo, W.B.; Gao, L. Experimental characterization of shrinkage and desiccation cracking in thin clay layer. Appl. Clay Sci. 2011, 52, 69–77. [Google Scholar] [CrossRef]
  47. Tang, C.S.; Zhu, C.; Cheng, Q.; Zeng, H.; Xu, J.J.; Tian, B.G.; Shi, B. Desiccation cracking of soils: A review of investigation approaches, underlying mechanisms, and influencing factors. Earth Sci. Rev. 2021, 216, 103586. [Google Scholar] [CrossRef]
  48. Abu-Hejleh, A.N.; Znidarčić, D. Desiccation Theory for Soft Cohesive Soils. J. Geotech. Eng. 1995, 121, 493–502. [Google Scholar] [CrossRef]
  49. Fredlund, D.G.; Sheng, D.C.; Zhao, J.D. Estimation of soil suction from the soil-water characteristic curve. Can. Geotech. J. 2011, 48, 186–198. [Google Scholar] [CrossRef]
  50. Fredlund, D.G.; Xing, A. Equations for the soil-water characteristic curve. Can. Geotech. J. 1994, 31, 521–532. [Google Scholar] [CrossRef]
  51. Shepidchenko, T.; Zhang, J.C.; Tang, X.; Liu, T.; Dong, Z.; Zheng, G.; Yang, L. Experimental study of the main controlling factors of desiccation crack formation from mud to shale. J. Pet. Sci. Eng. 2020, 194, 107414. [Google Scholar] [CrossRef]
  52. Barzegar, A.R.; Oades, J.M.; Rengasamy, P.; Murray, R.S. Tensile strength of dry, remoulded soils as affected by properties of the clay fraction. Geoderma 1995, 65, 93–108. [Google Scholar] [CrossRef]
  53. Li, J.H.; Zhang, L.M. Study of desiccation crack initiation and development at ground surface. Eng. Geol. 2011, 123, 347–358. [Google Scholar] [CrossRef]
  54. Thusyanthan, N.I.; Take, W.A.; Madabhushi, S.P.G.; Bolton, M.D. Crack initiation in clay observed in beam bending. Geotechnique 2007, 57, 581–594. [Google Scholar] [CrossRef]
  55. Ko, L.T.; Ruppel, S.C.; Loucks, R.G.; Hackley, P.C.; Zhang, T.W.; Shao, D.Y. Pore-types and pore-network evolution in Upper Devonian-Lower Mississippian Woodford and Mississippian Barnett mudstones: Insights from laboratory thermal maturation and organic petrology. Int. J. Coal Geol. 2018, 190, 3–28. [Google Scholar] [CrossRef]
  56. Tang, C.S.; Shi, B.; Liu, C.; Zhao, L.Z.; Wang, B.J. Influencing factors of geometrical structure of surface shrinkage cracks in clayey soils. Eng. Geol. 2008, 101, 204–217. [Google Scholar] [CrossRef]
  57. Miller, T.W. New insights on natural hydraulic fractures induced by abnormally high pore pressures. AAPG Bull. 1995, 79, 1005–1018. [Google Scholar]
  58. Tang, C.S.; Cheng, Q.; Leng, T.; Shi, B.; Zeng, H.; Inyang, H.I. Effects of wetting-drying cycles and desiccation cracks on mechanical behavior of an unsaturated soil. CATENA 2020, 194, 104721. [Google Scholar] [CrossRef]
  59. Segonzac, G.D. The Transformation of Clay Minerals during Diagenesis and Low-Grade Metamorphism: A Review. Sedimentology 1970, 15, 281–346. [Google Scholar] [CrossRef]
  60. Burst, J.F. Diagenesis of Gulf Coast Clayey Sediments and Its Possible Relation to Petroleum Migration1. AAPG Bull. 1969, 53, 73–93. [Google Scholar]
Figure 1. Distribution of mineral content fitting with Gaussian normal distribution. (a). Quartz content ranged from 0.9% to 62.7% of the weight composition. (b). Feldspar content varied from 0.4% to 27.5%. (c) Clay minerals varied from 14.3% to 97.4%.
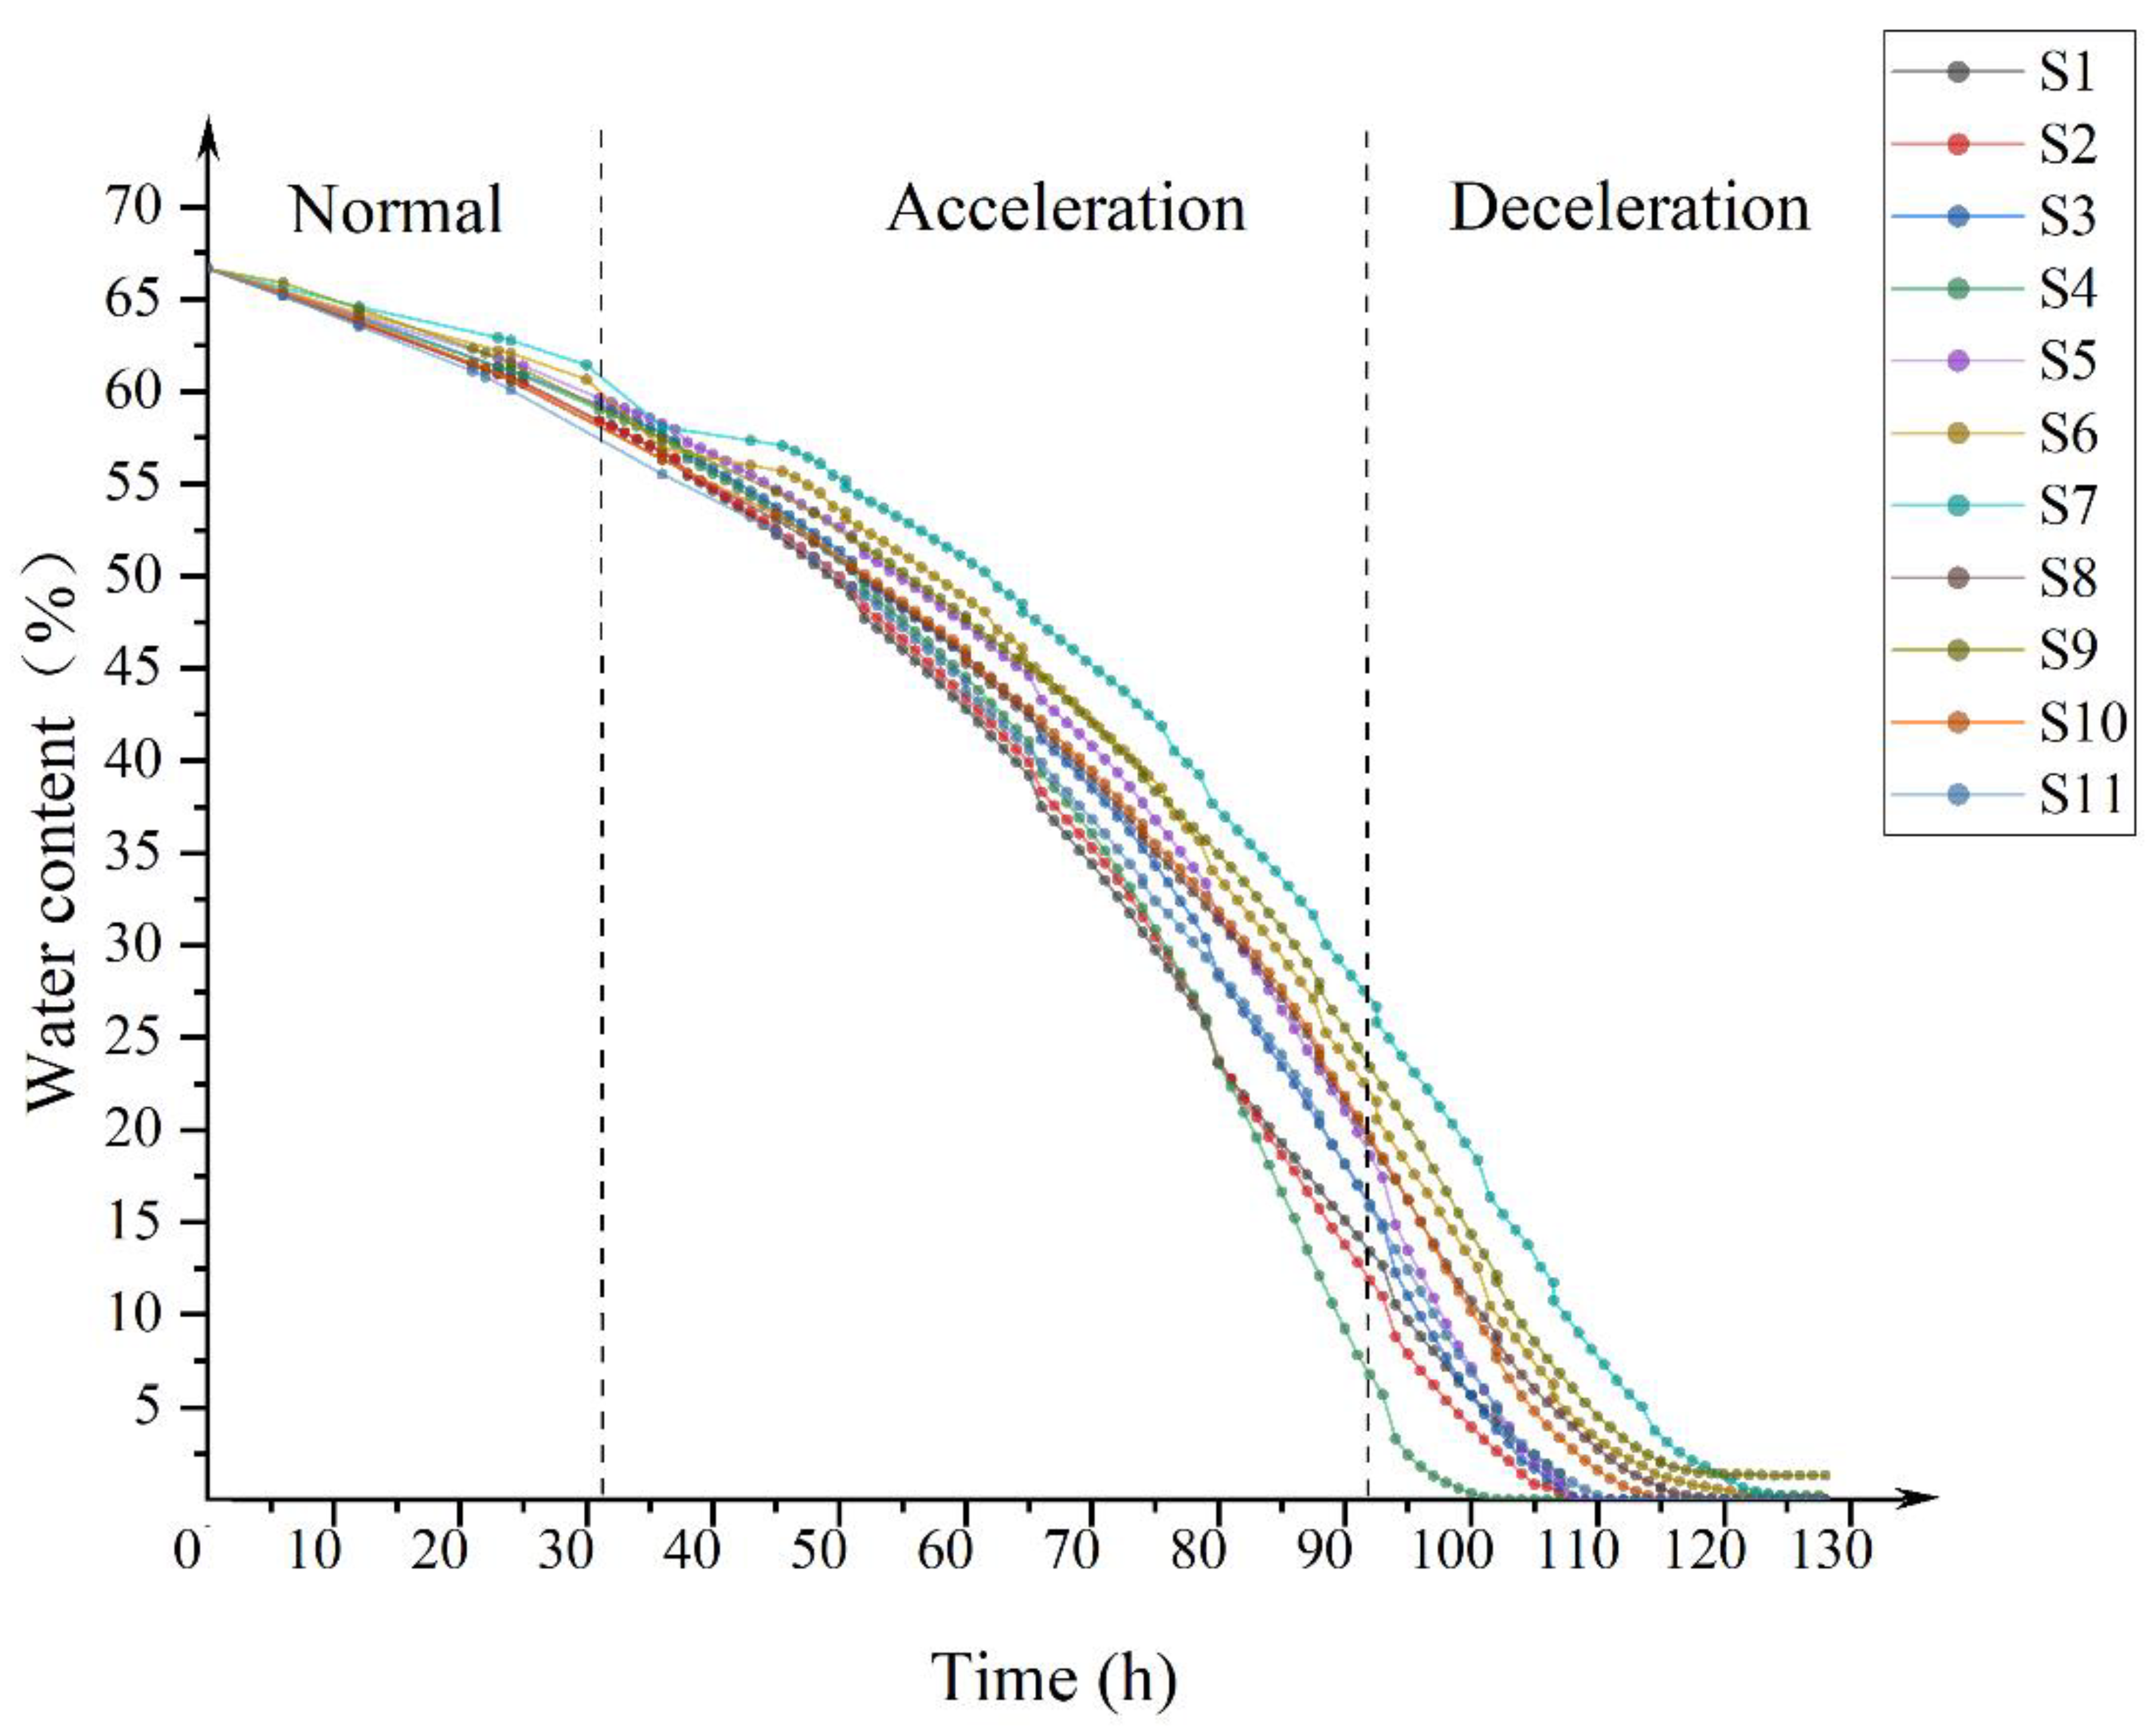
Minerals 12 01381 g001
Figure 2. Changes in water content versus time. According to the change rate of water content, it is divided into normal, acceleration and deceleration stages.
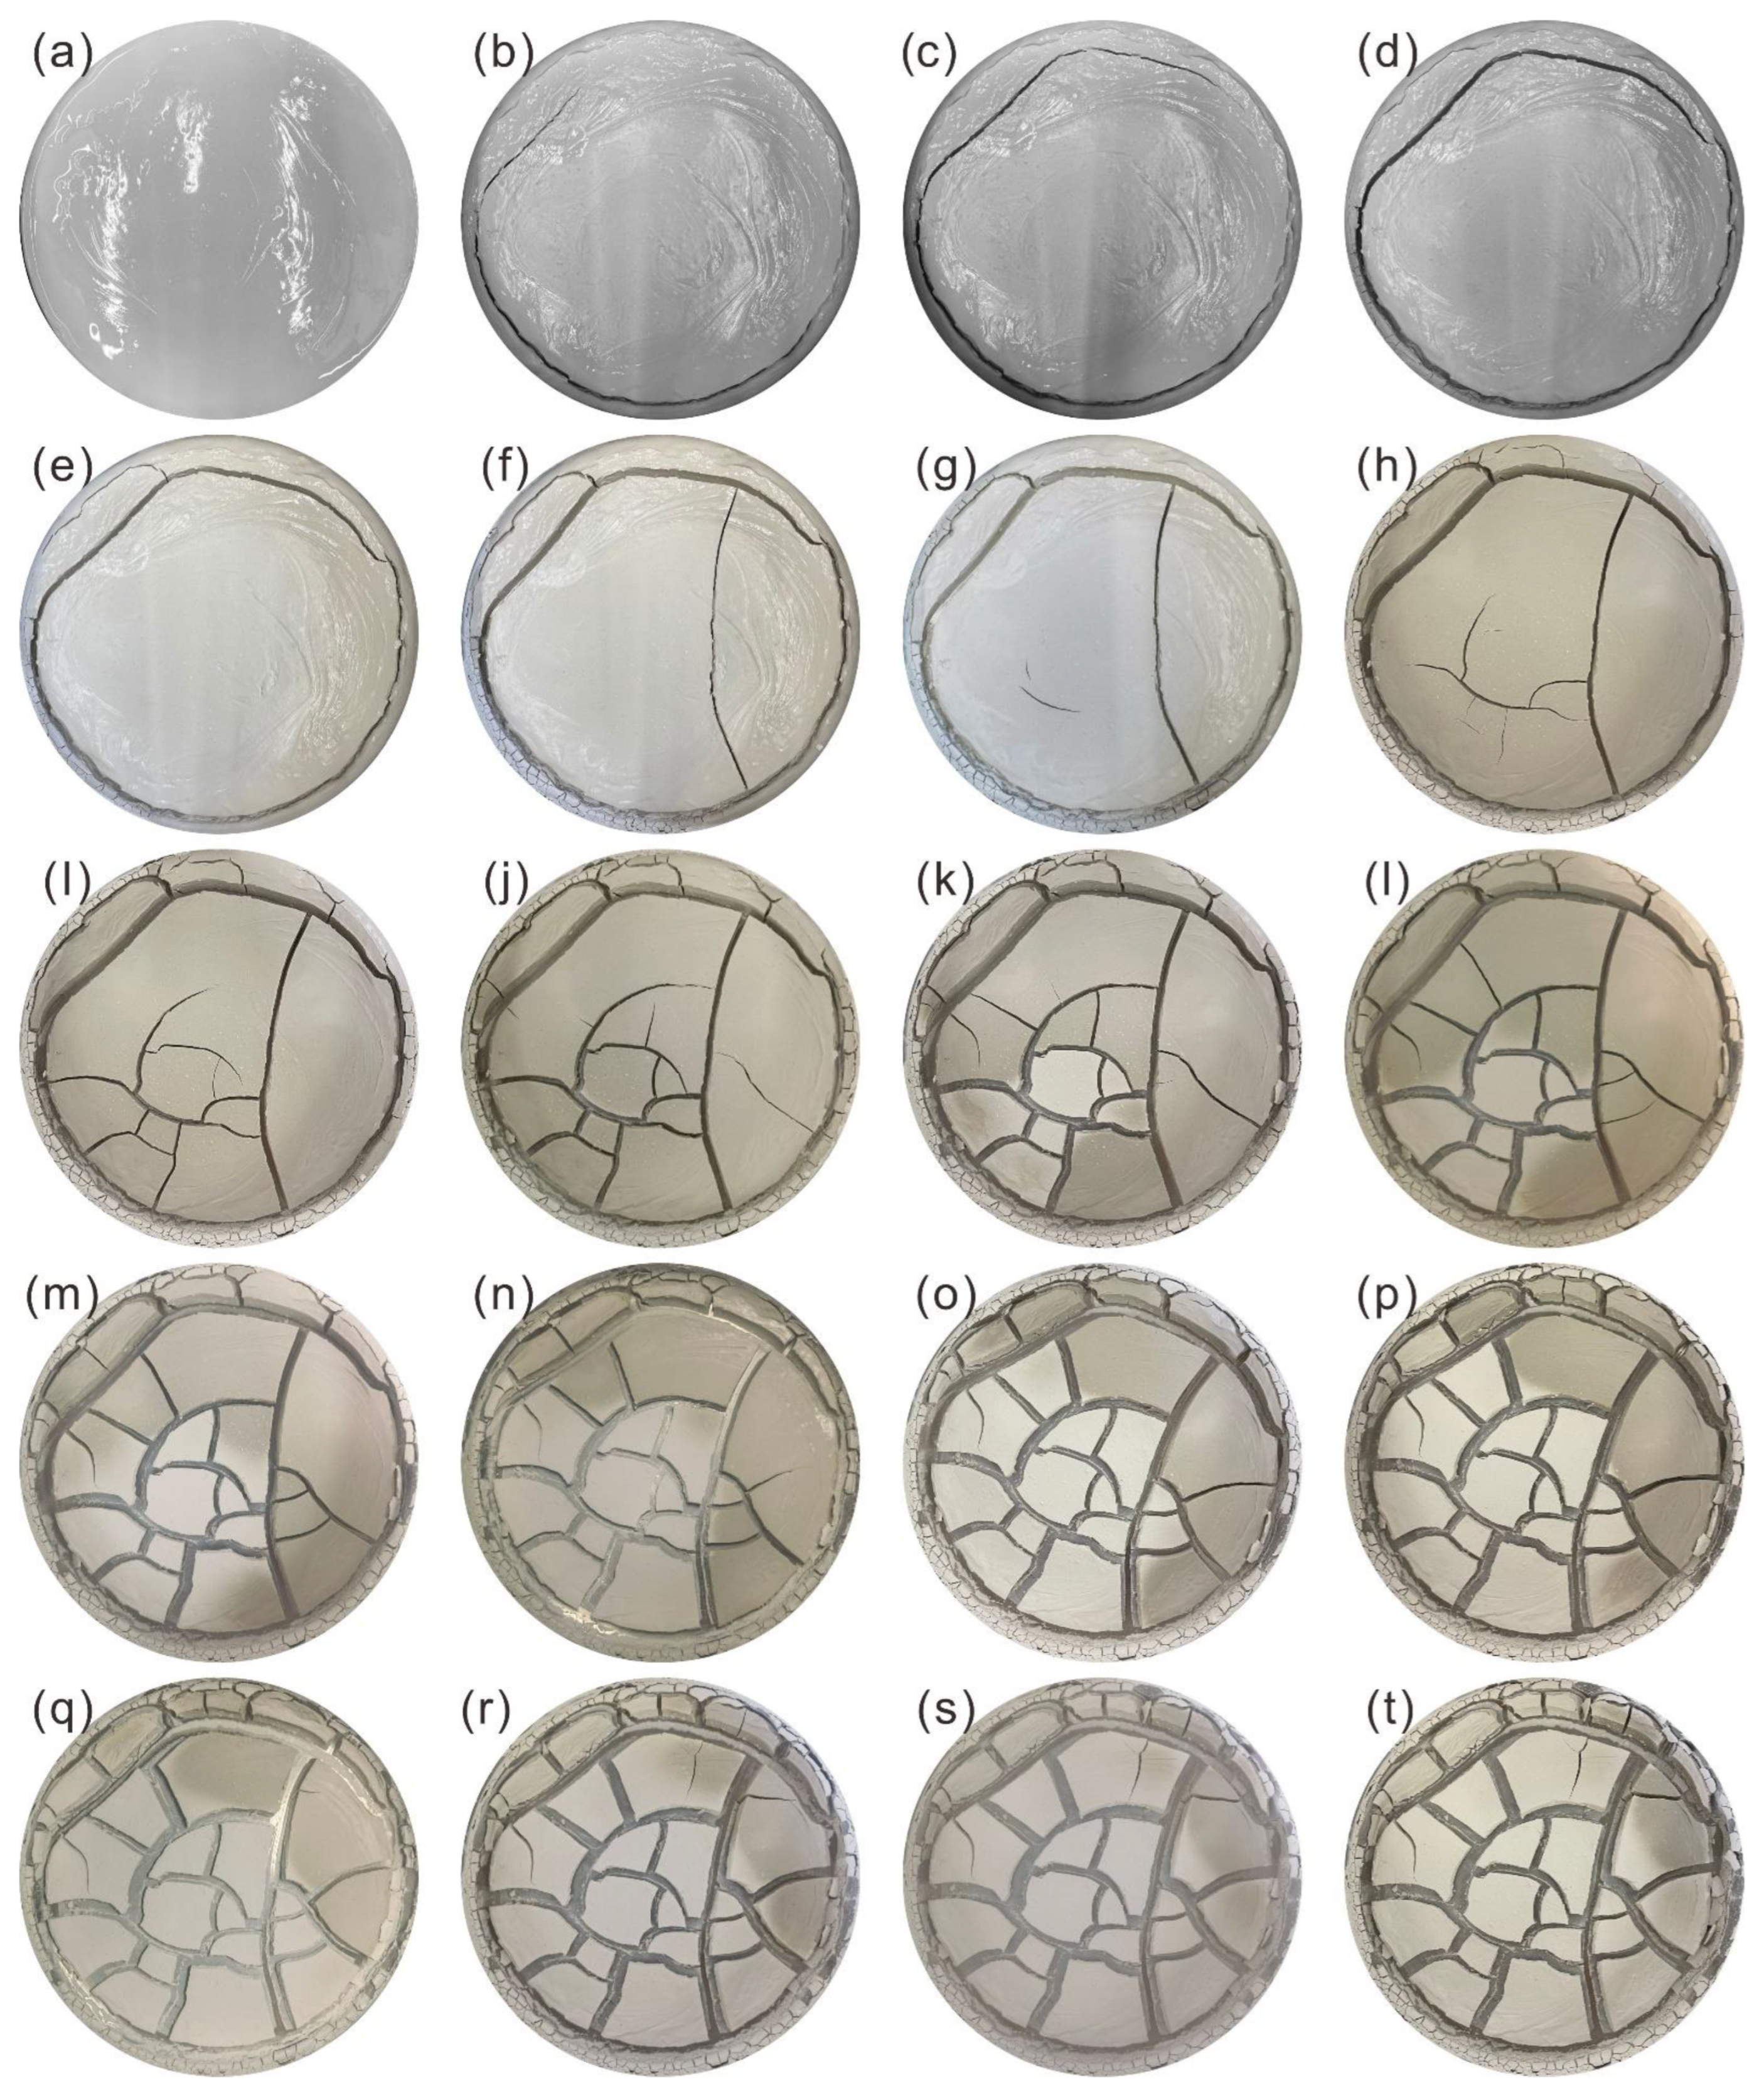
Minerals 12 01381 g002
Figure 3. Crack development process of S2. The time between (a) and (b) is 31 h. The time between adjacent pictures is 4 h. The diameter of the sample is 24 cm. After (t), cracks stopped developing (a)–(t).
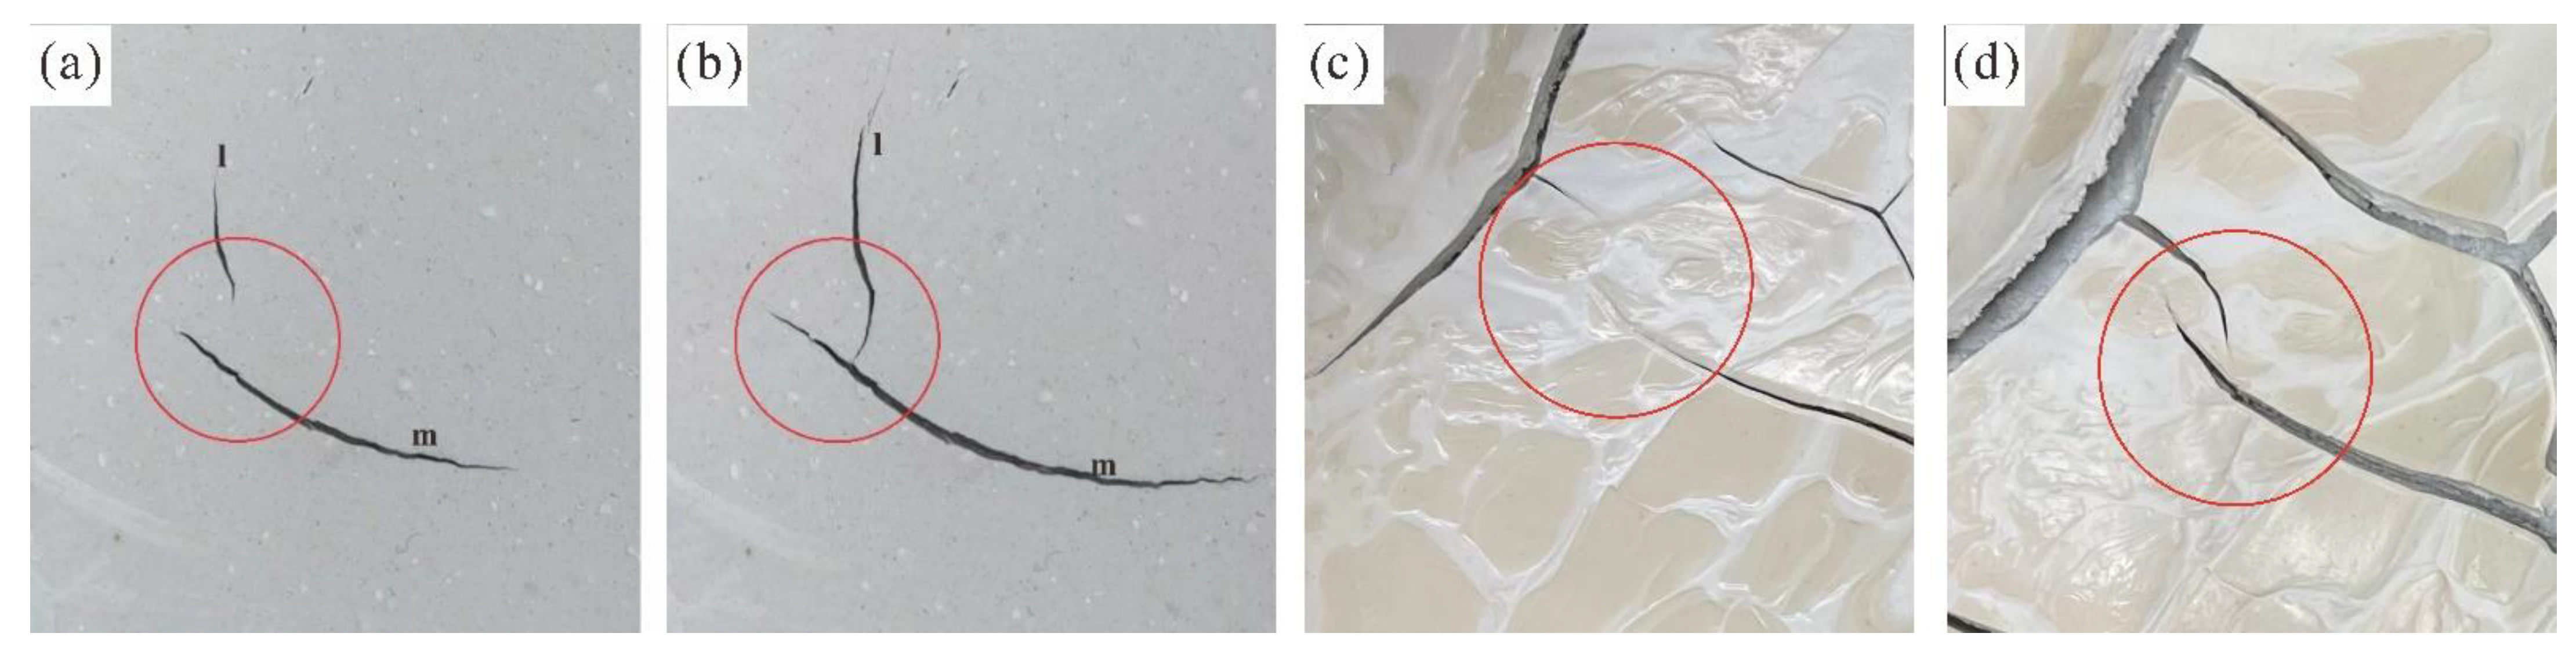
Minerals 12 01381 g003
Figure 4. The direction changed when cracks intersected. (a,b) The direction of crack l changed when it approached another crack m. (c,d) The extension direction changed when parallel cracks were close to each other.
Minerals 12 01381 g004
Figure 5. Cracks ended in a variety of places: a, b. Termination at the boundary; c, d. Termination at the intersection with another crack; e, f. They were unaffected by the boundary and other cracks and ended their extension on their own. (The diameter of the sample is 24 cm).
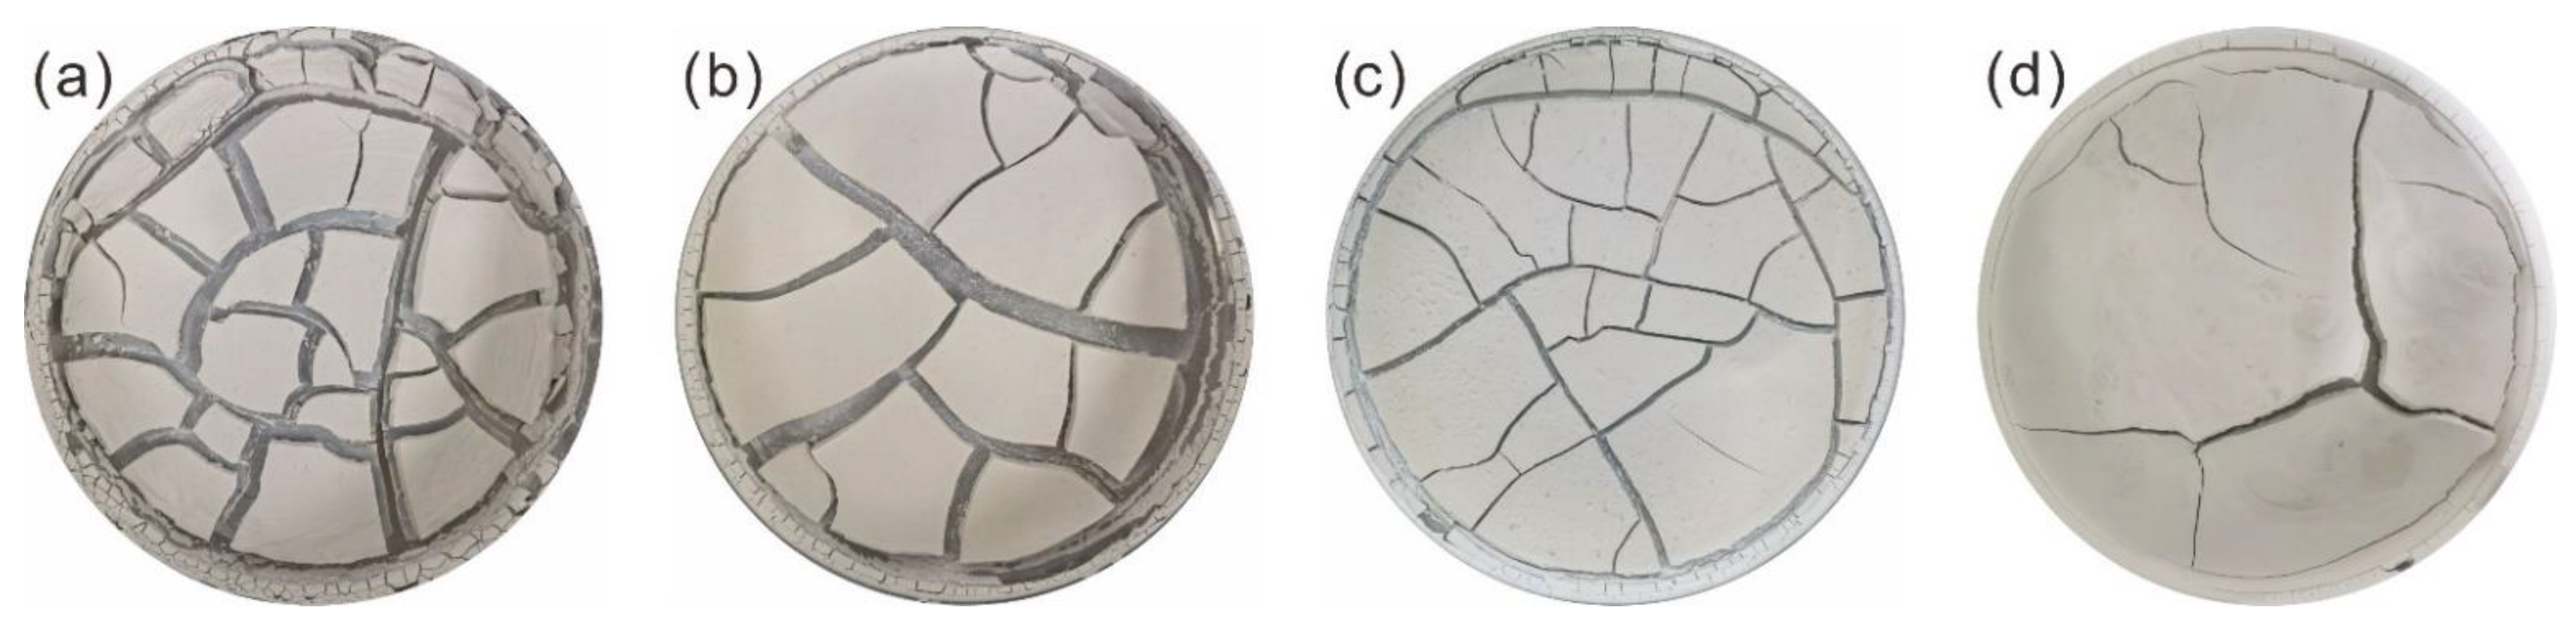
Minerals 12 01381 g005
Figure 6. Desiccation crack morphology under different BM:TC (BM:TC means the content ratio of brittle minerals to all clay minerals) conditions. From left to right in the figure are S1, S2, S3, and S4, respectively. (a) 10% brittle, 90% clay. (b) 30% brittle, 70% clay. (c) 50% brittle, 50% clay. (d) 70% brittle, 30% clay. (The diameter of the sample is 24 cm).
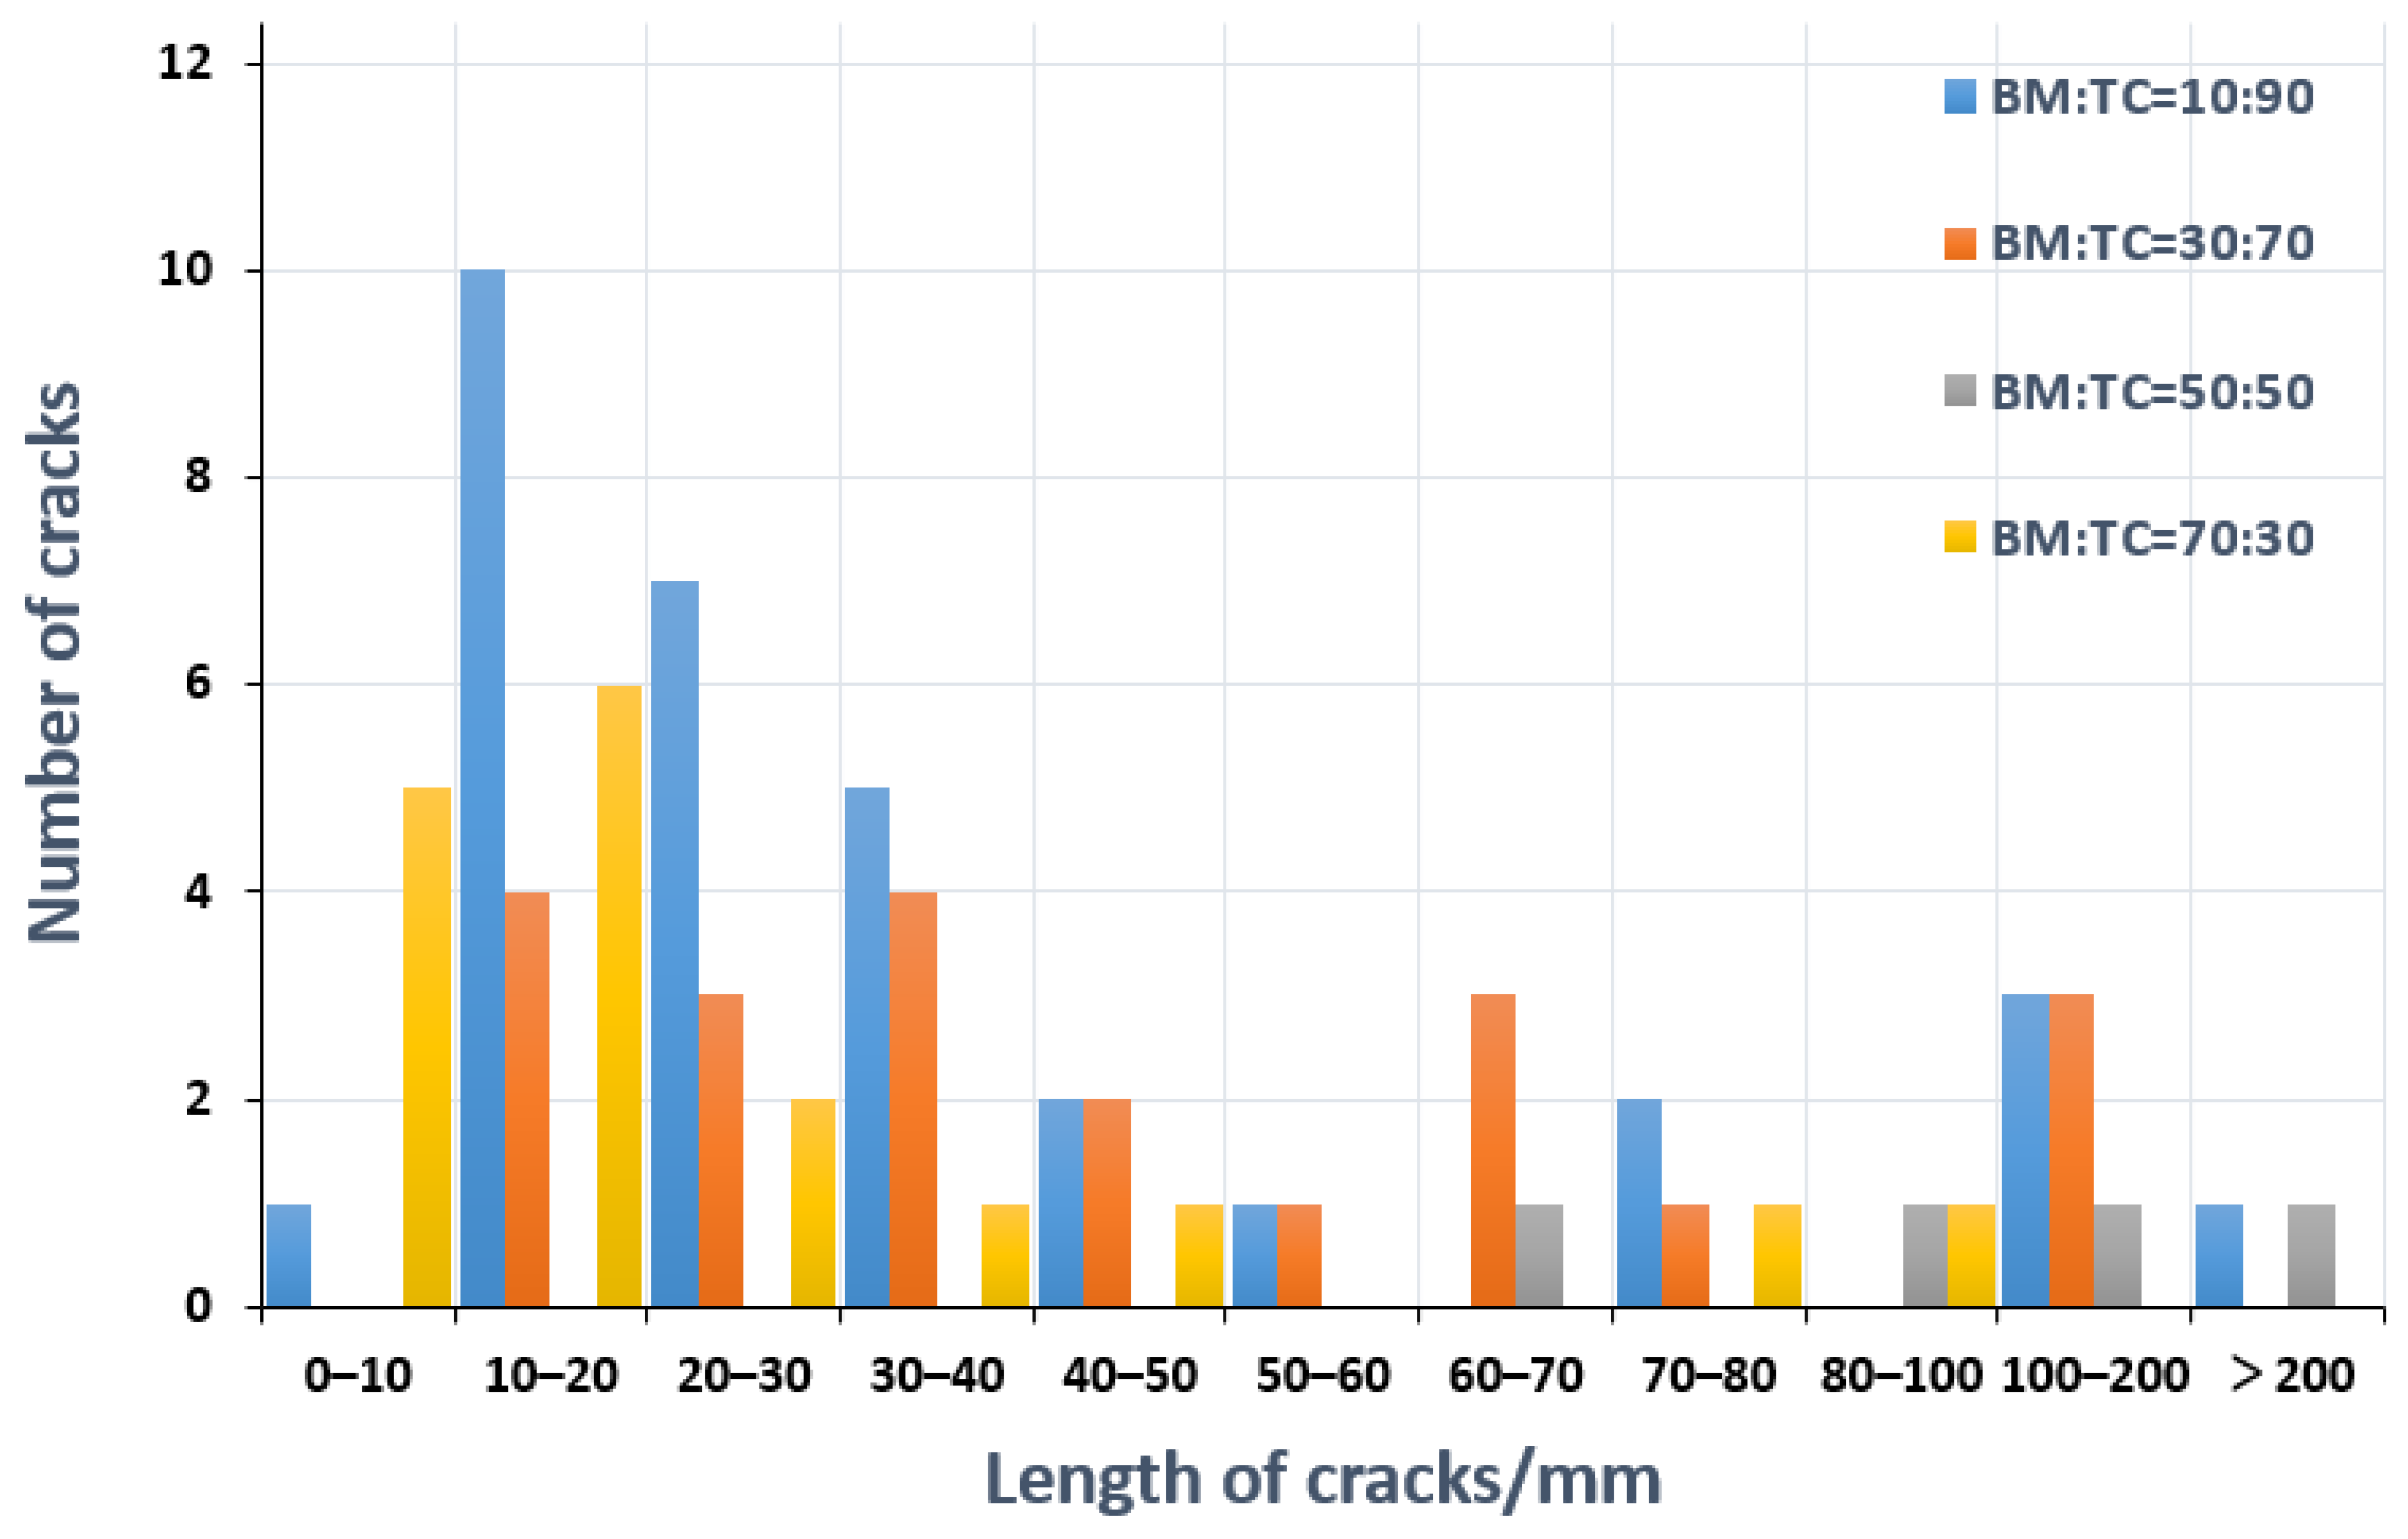
Minerals 12 01381 g006
Figure 7. Distribution of crack length in samples with different BM:TC.
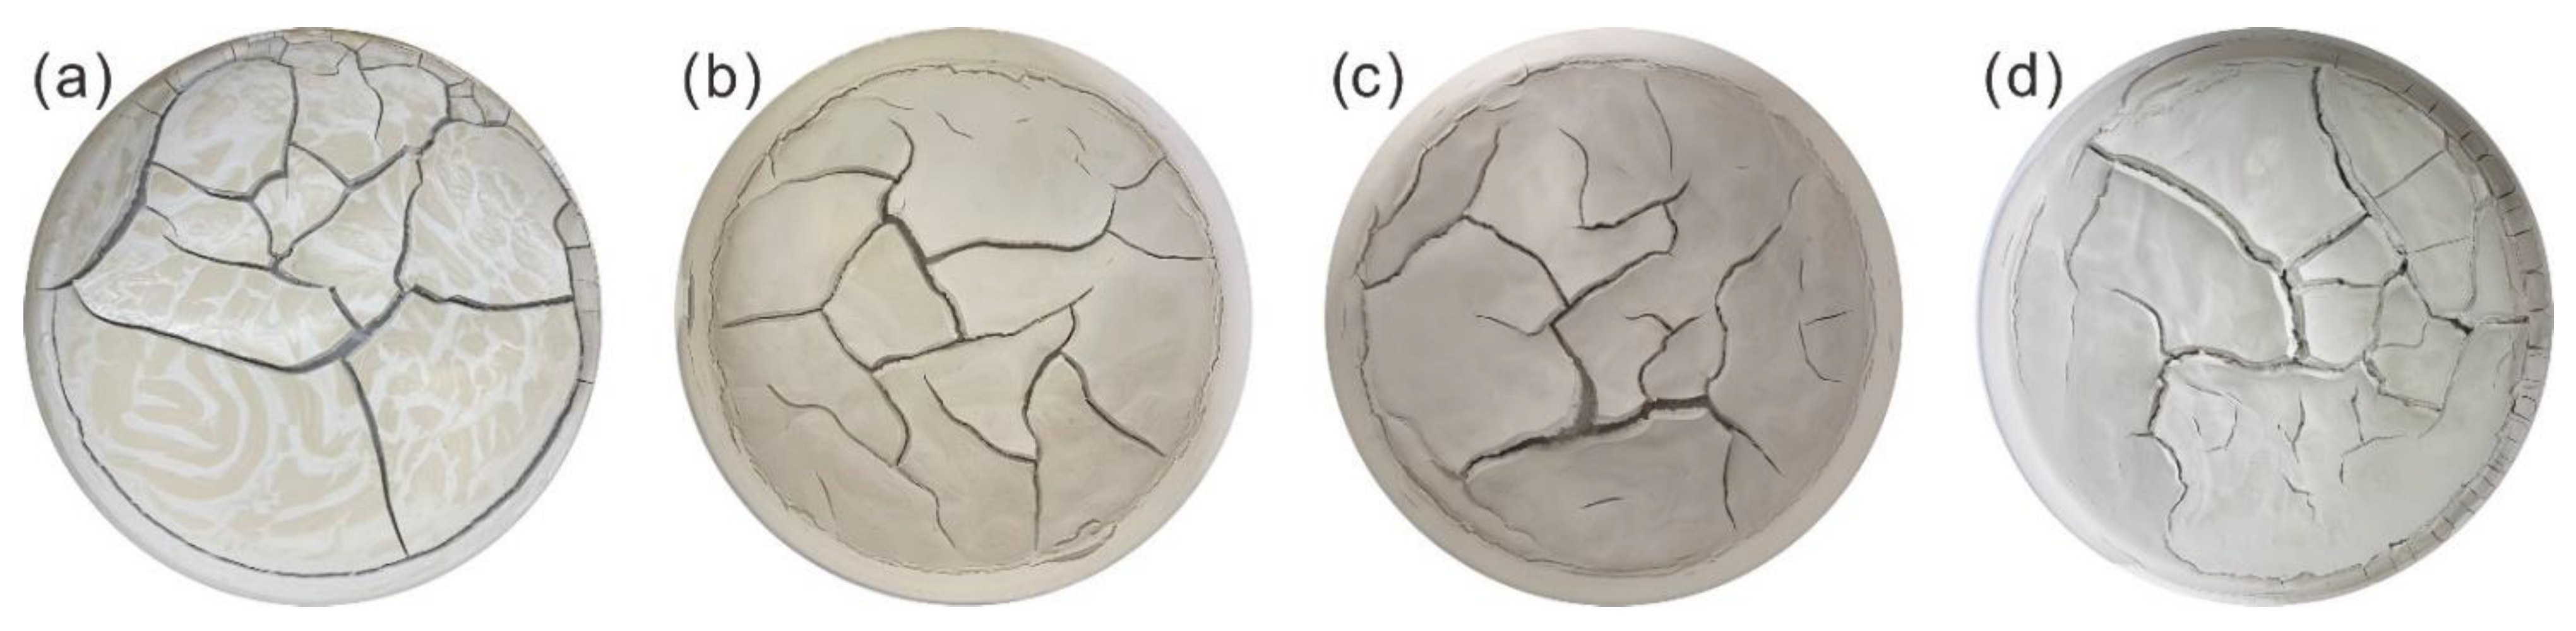
Minerals 12 01381 g007
Figure 8. Desiccation crack morphology under different K:S (K:S refers to the ratio of kaolin to smectite minerals) conditions. In the figure, from left to right are S1, S5, S6, and S7, respectively. (a) 20% kaolin, 80% smectite. (b) 40% kaolin, 60% smectite. (c) 60% kaolin, 40% smectite. (d) 80% kaolin, 20% smectite. (The diameter of the sample is 24 cm).
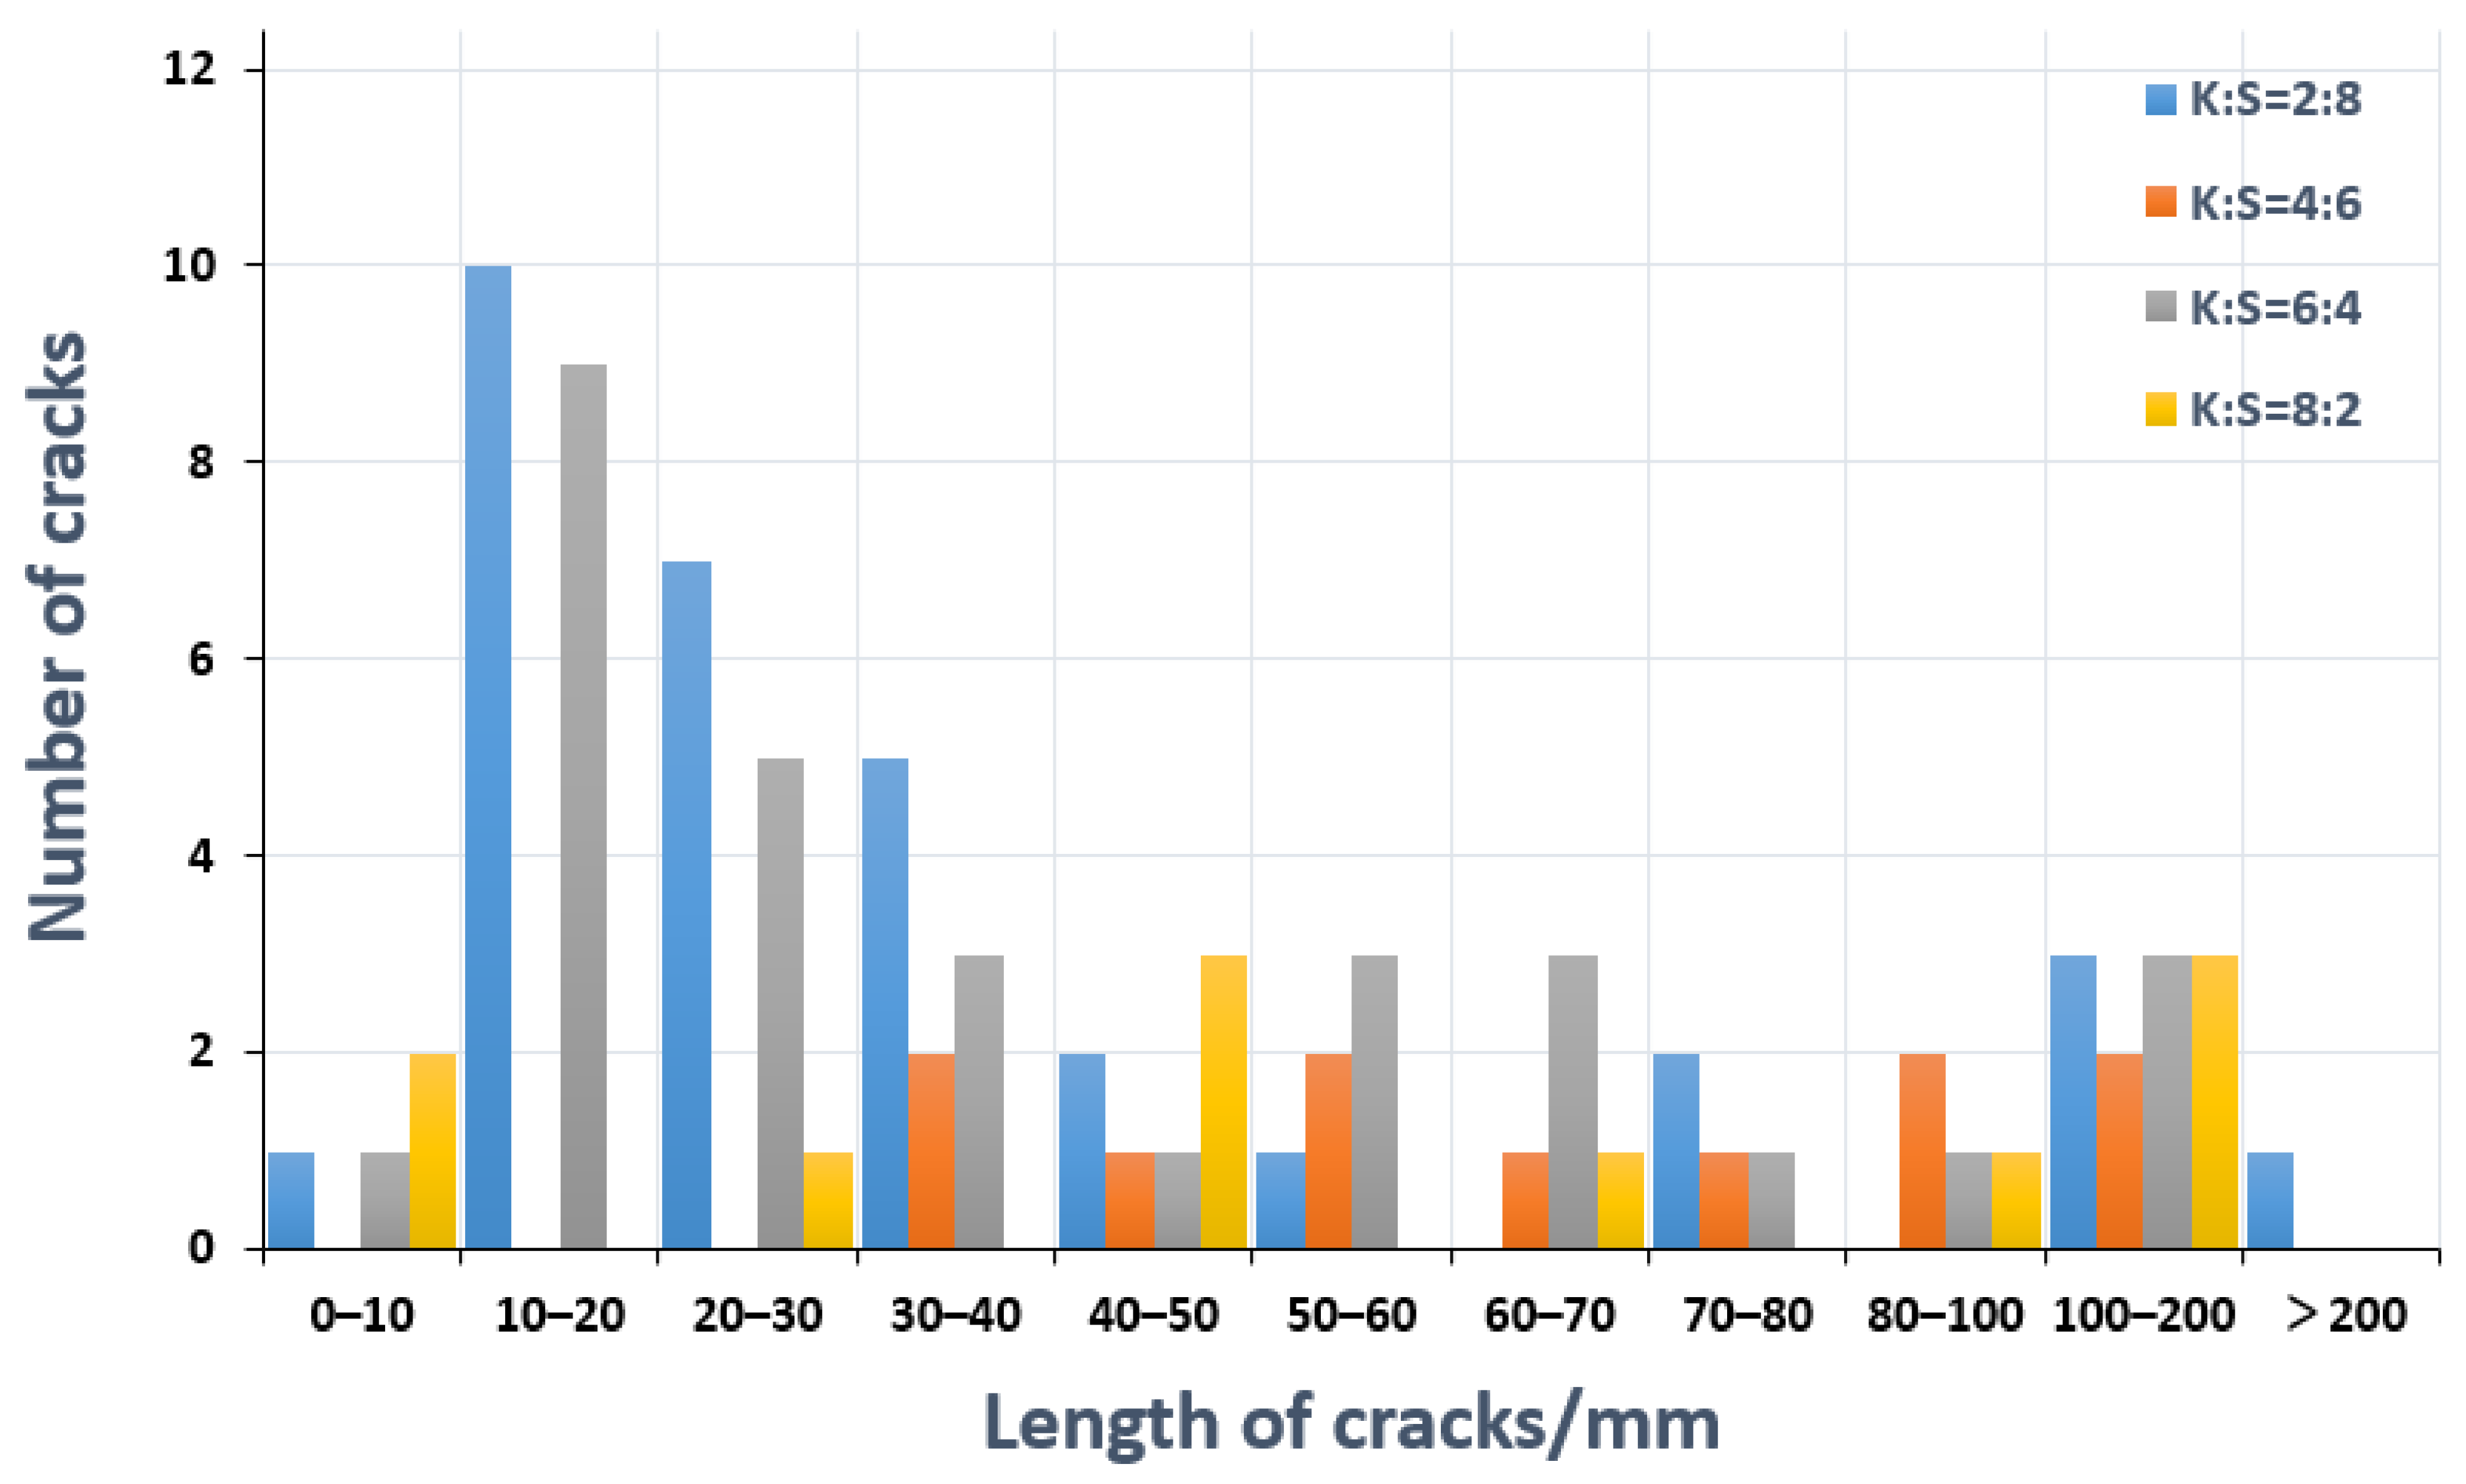
Minerals 12 01381 g008
Figure 9. Distribution of crack length in samples with different K:S.
Minerals 12 01381 g009
Figure 10. Desiccation crack morphology under different Q:F (Q:F refers to the ratio of quartz to feldspar minerals.) conditions. S8, S9, S10, and S11 are shown in the figure from left to right. (a) 20% quartz, 80% feldspar. (b) 40% quartz, 60% feldspar. (c) 60% quartz, 40% feldspar. (d) 80% quartz, 20% feldspar. (The diameter of the sample is 24 cm.).
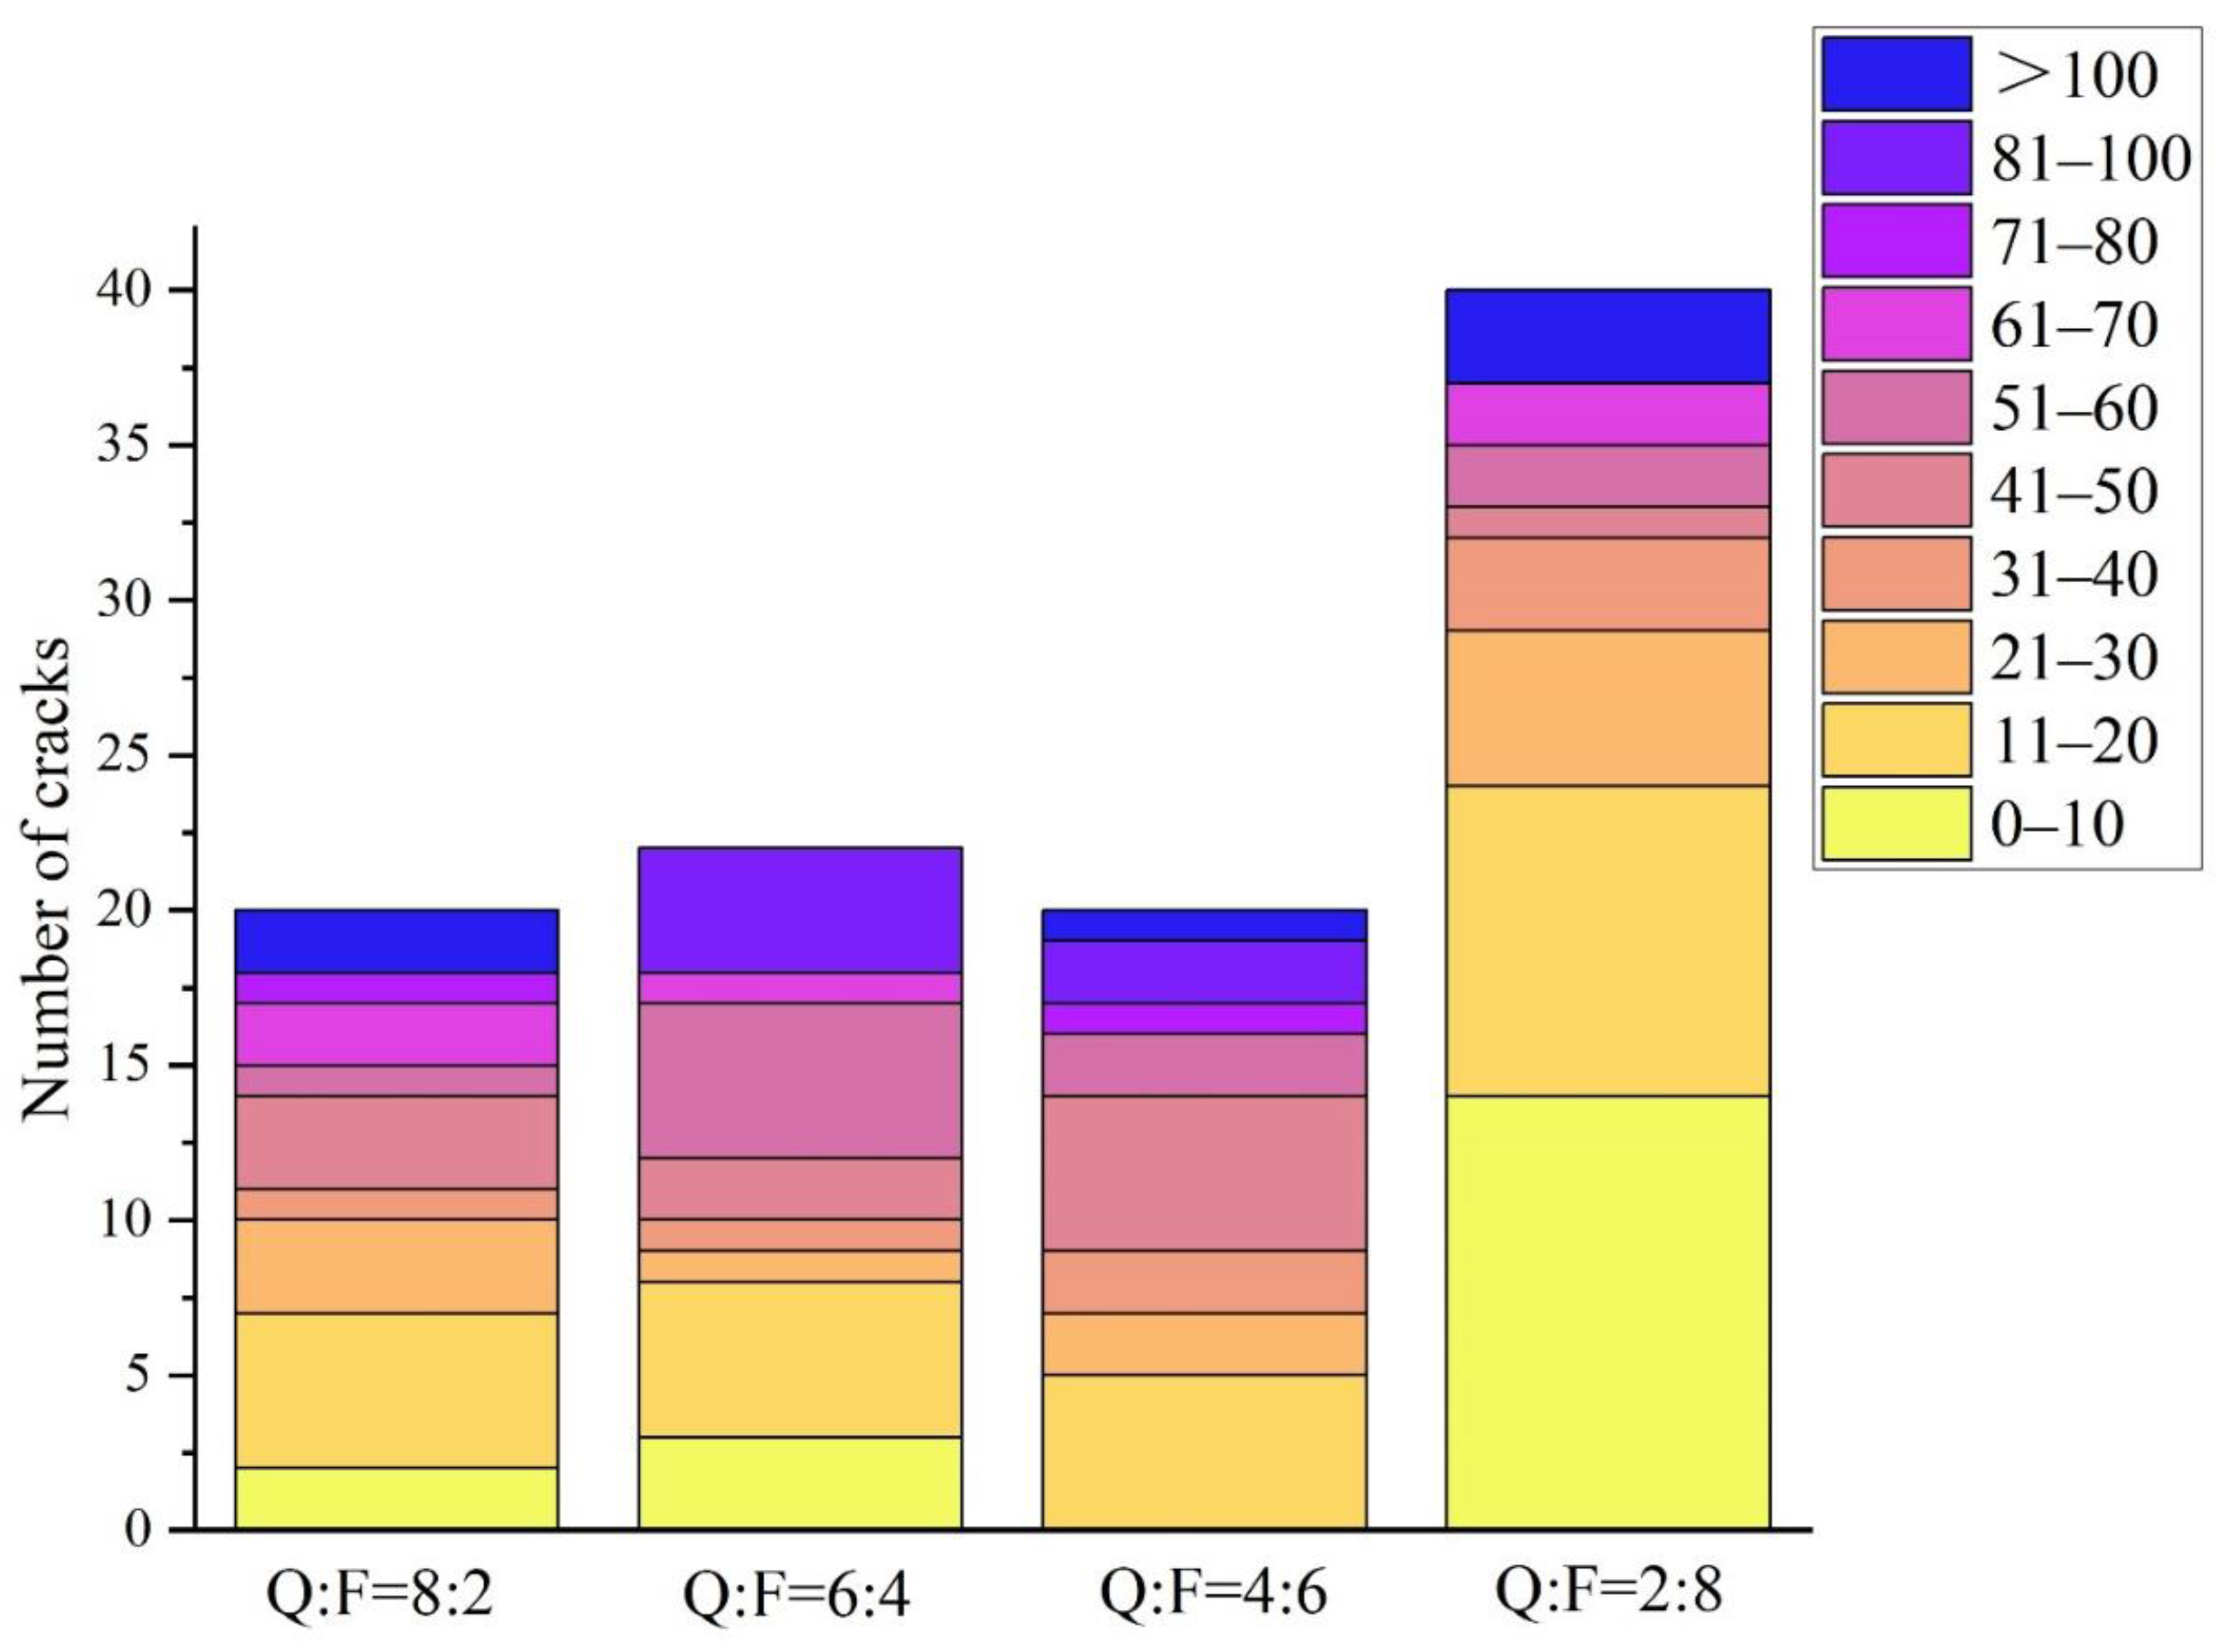
Minerals 12 01381 g010
Figure 11. Distribution of crack length in samples with different Q:F.
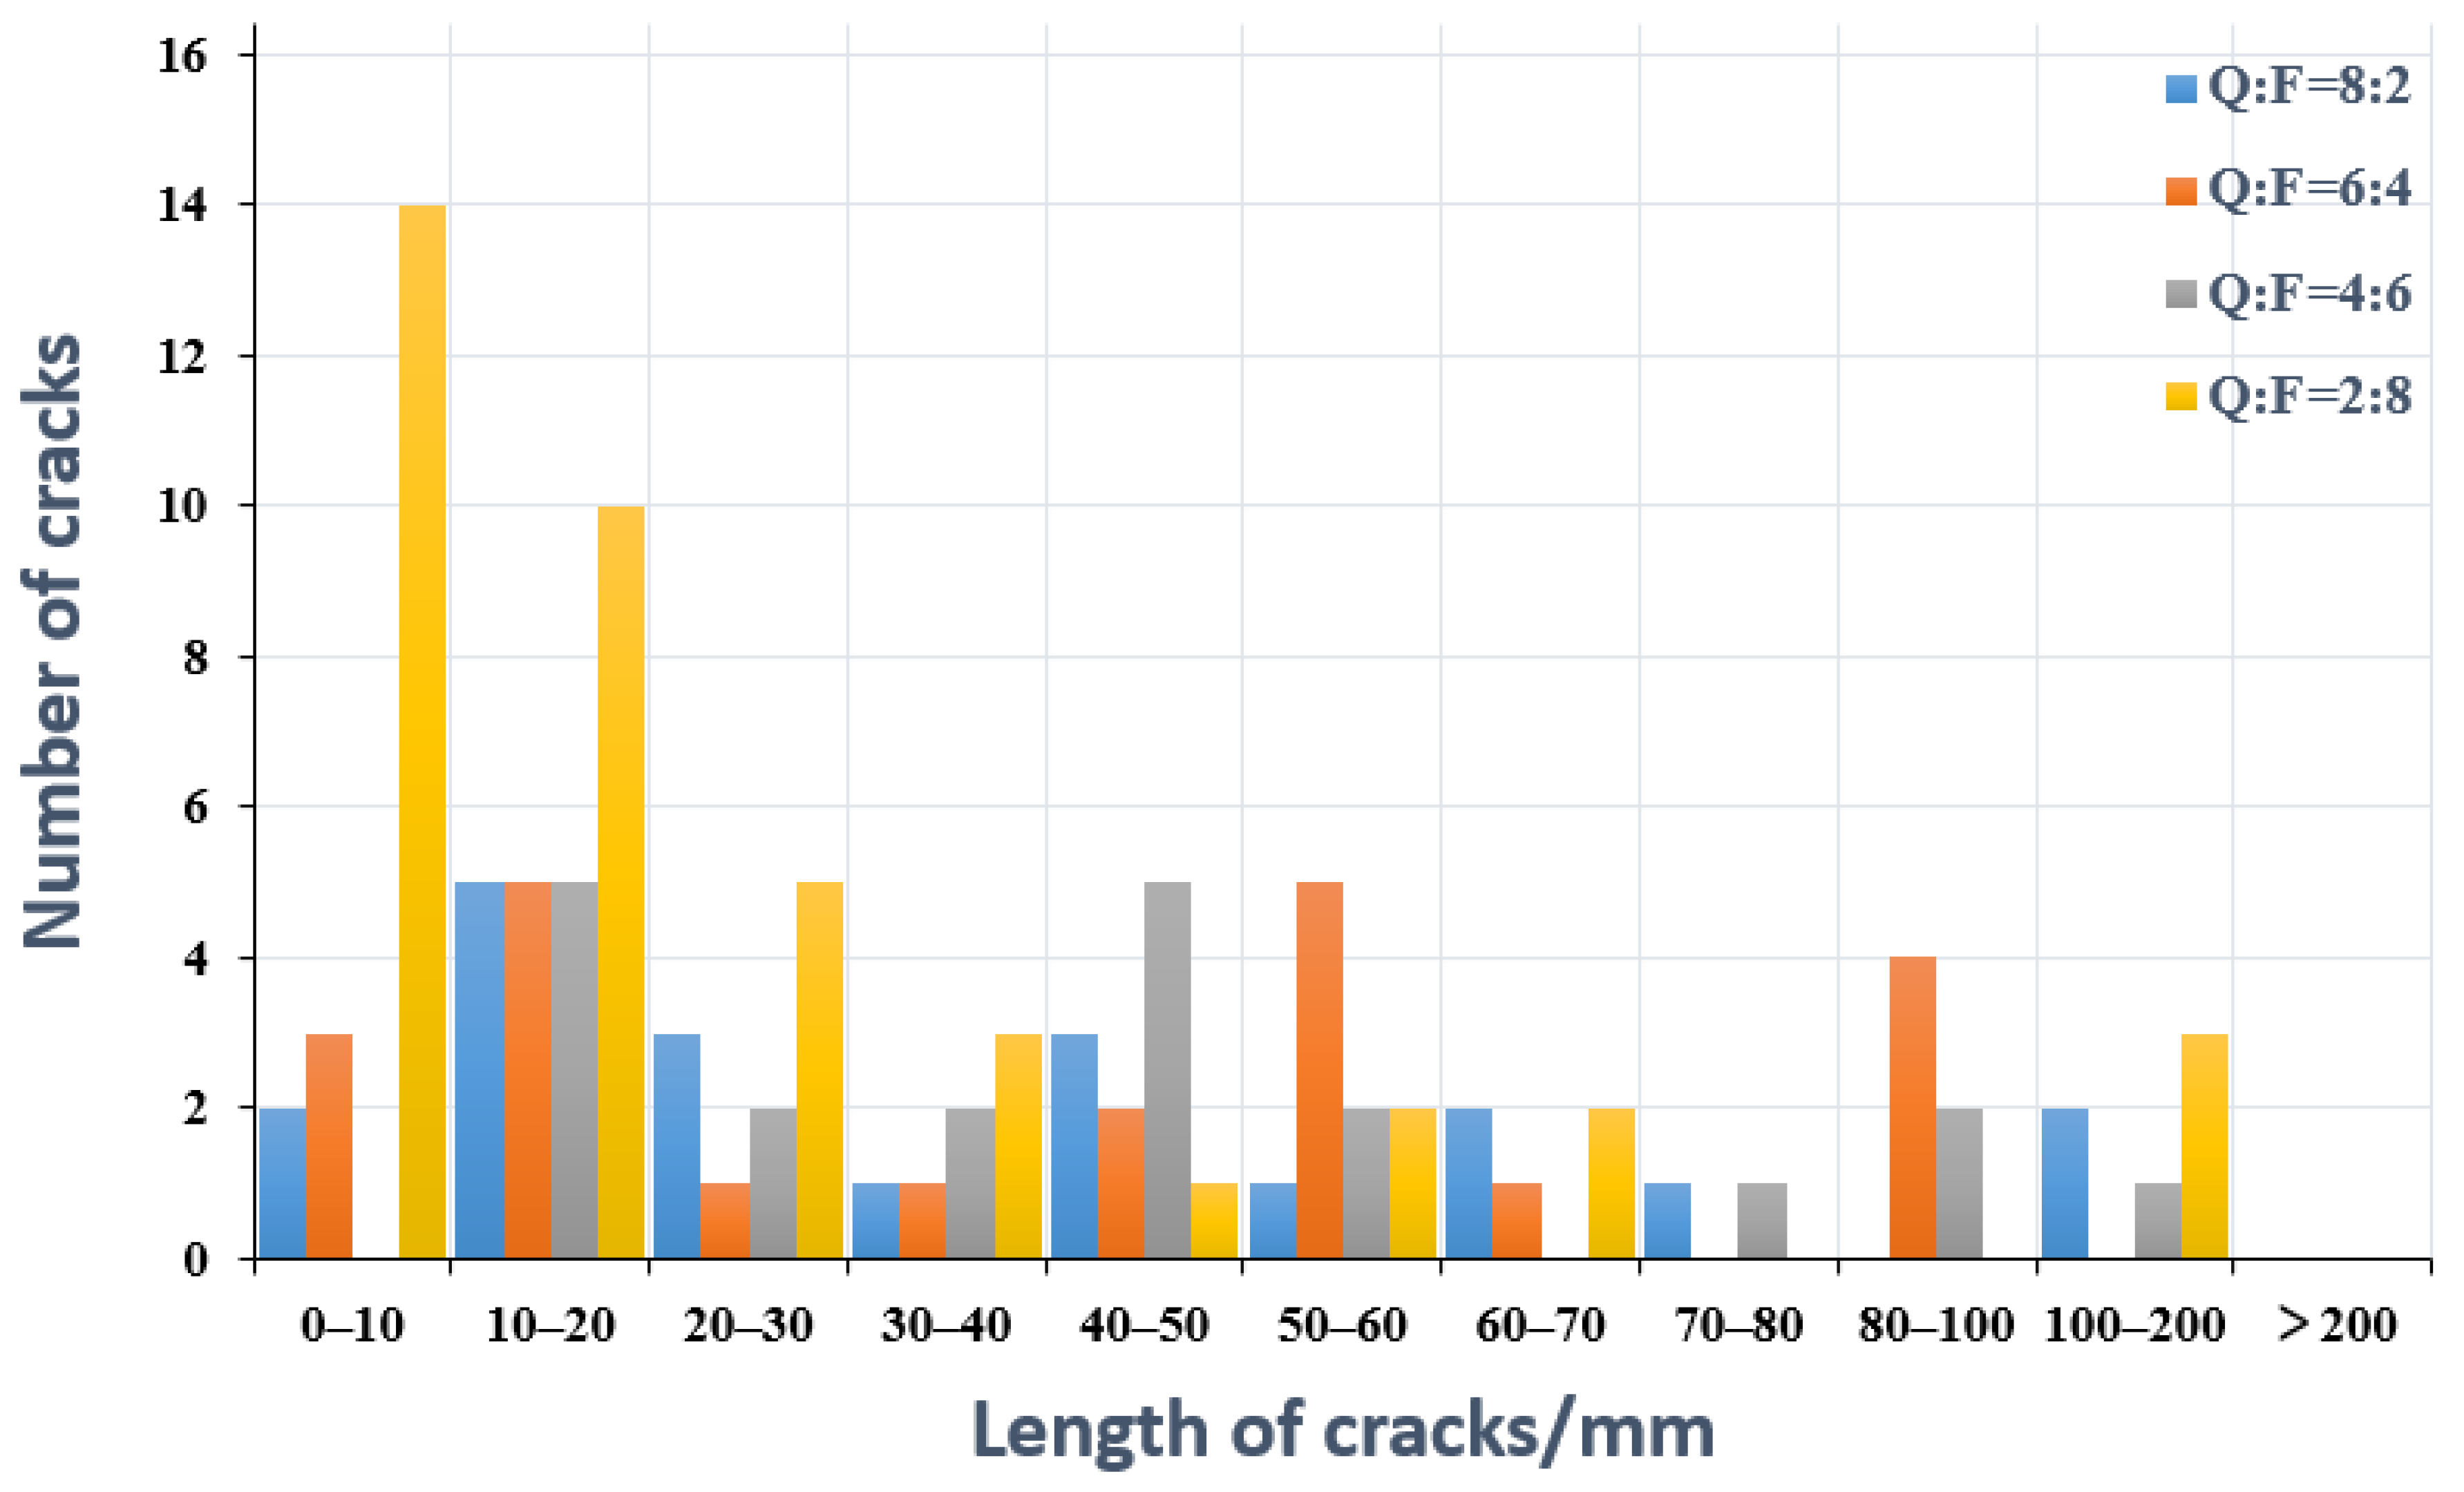
Minerals 12 01381 g011
Figure 12. Crack number with different lengths under various quality ratios of quartz to feldspar.
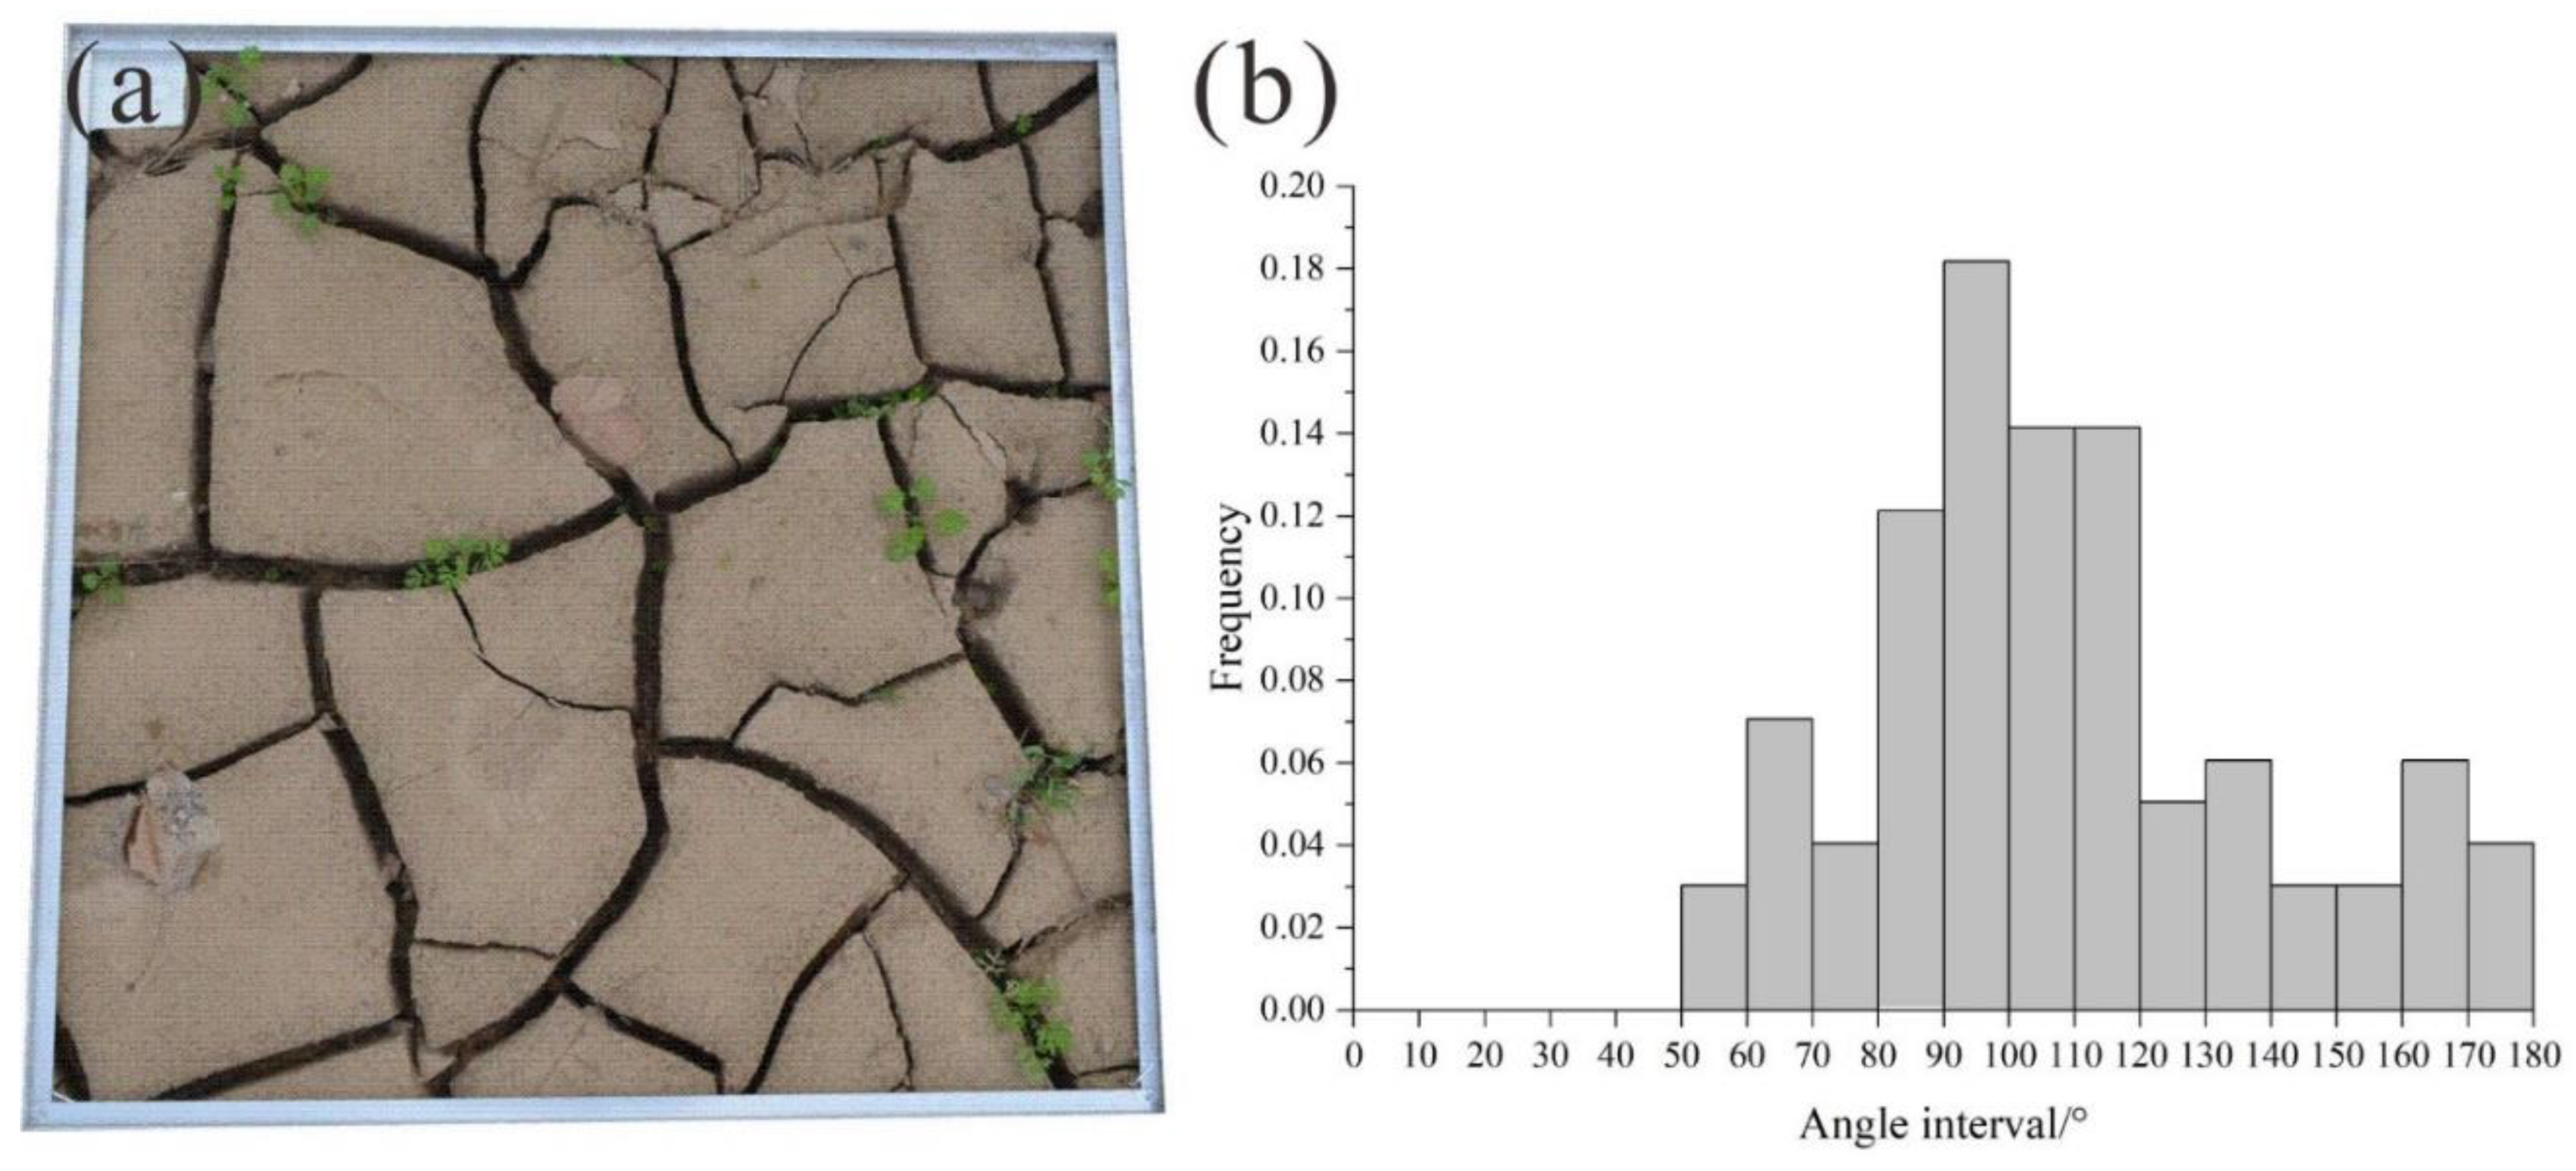
Minerals 12 01381 g012
Figure 13. Angel distribution of desiccation cracks in nature. (a). Desiccation cracks in the Yellow River of the Huayuankou area in Zhengzhou City. (The white frame is 1 × 1 m2). (b). statistical analysis of cracks angle.
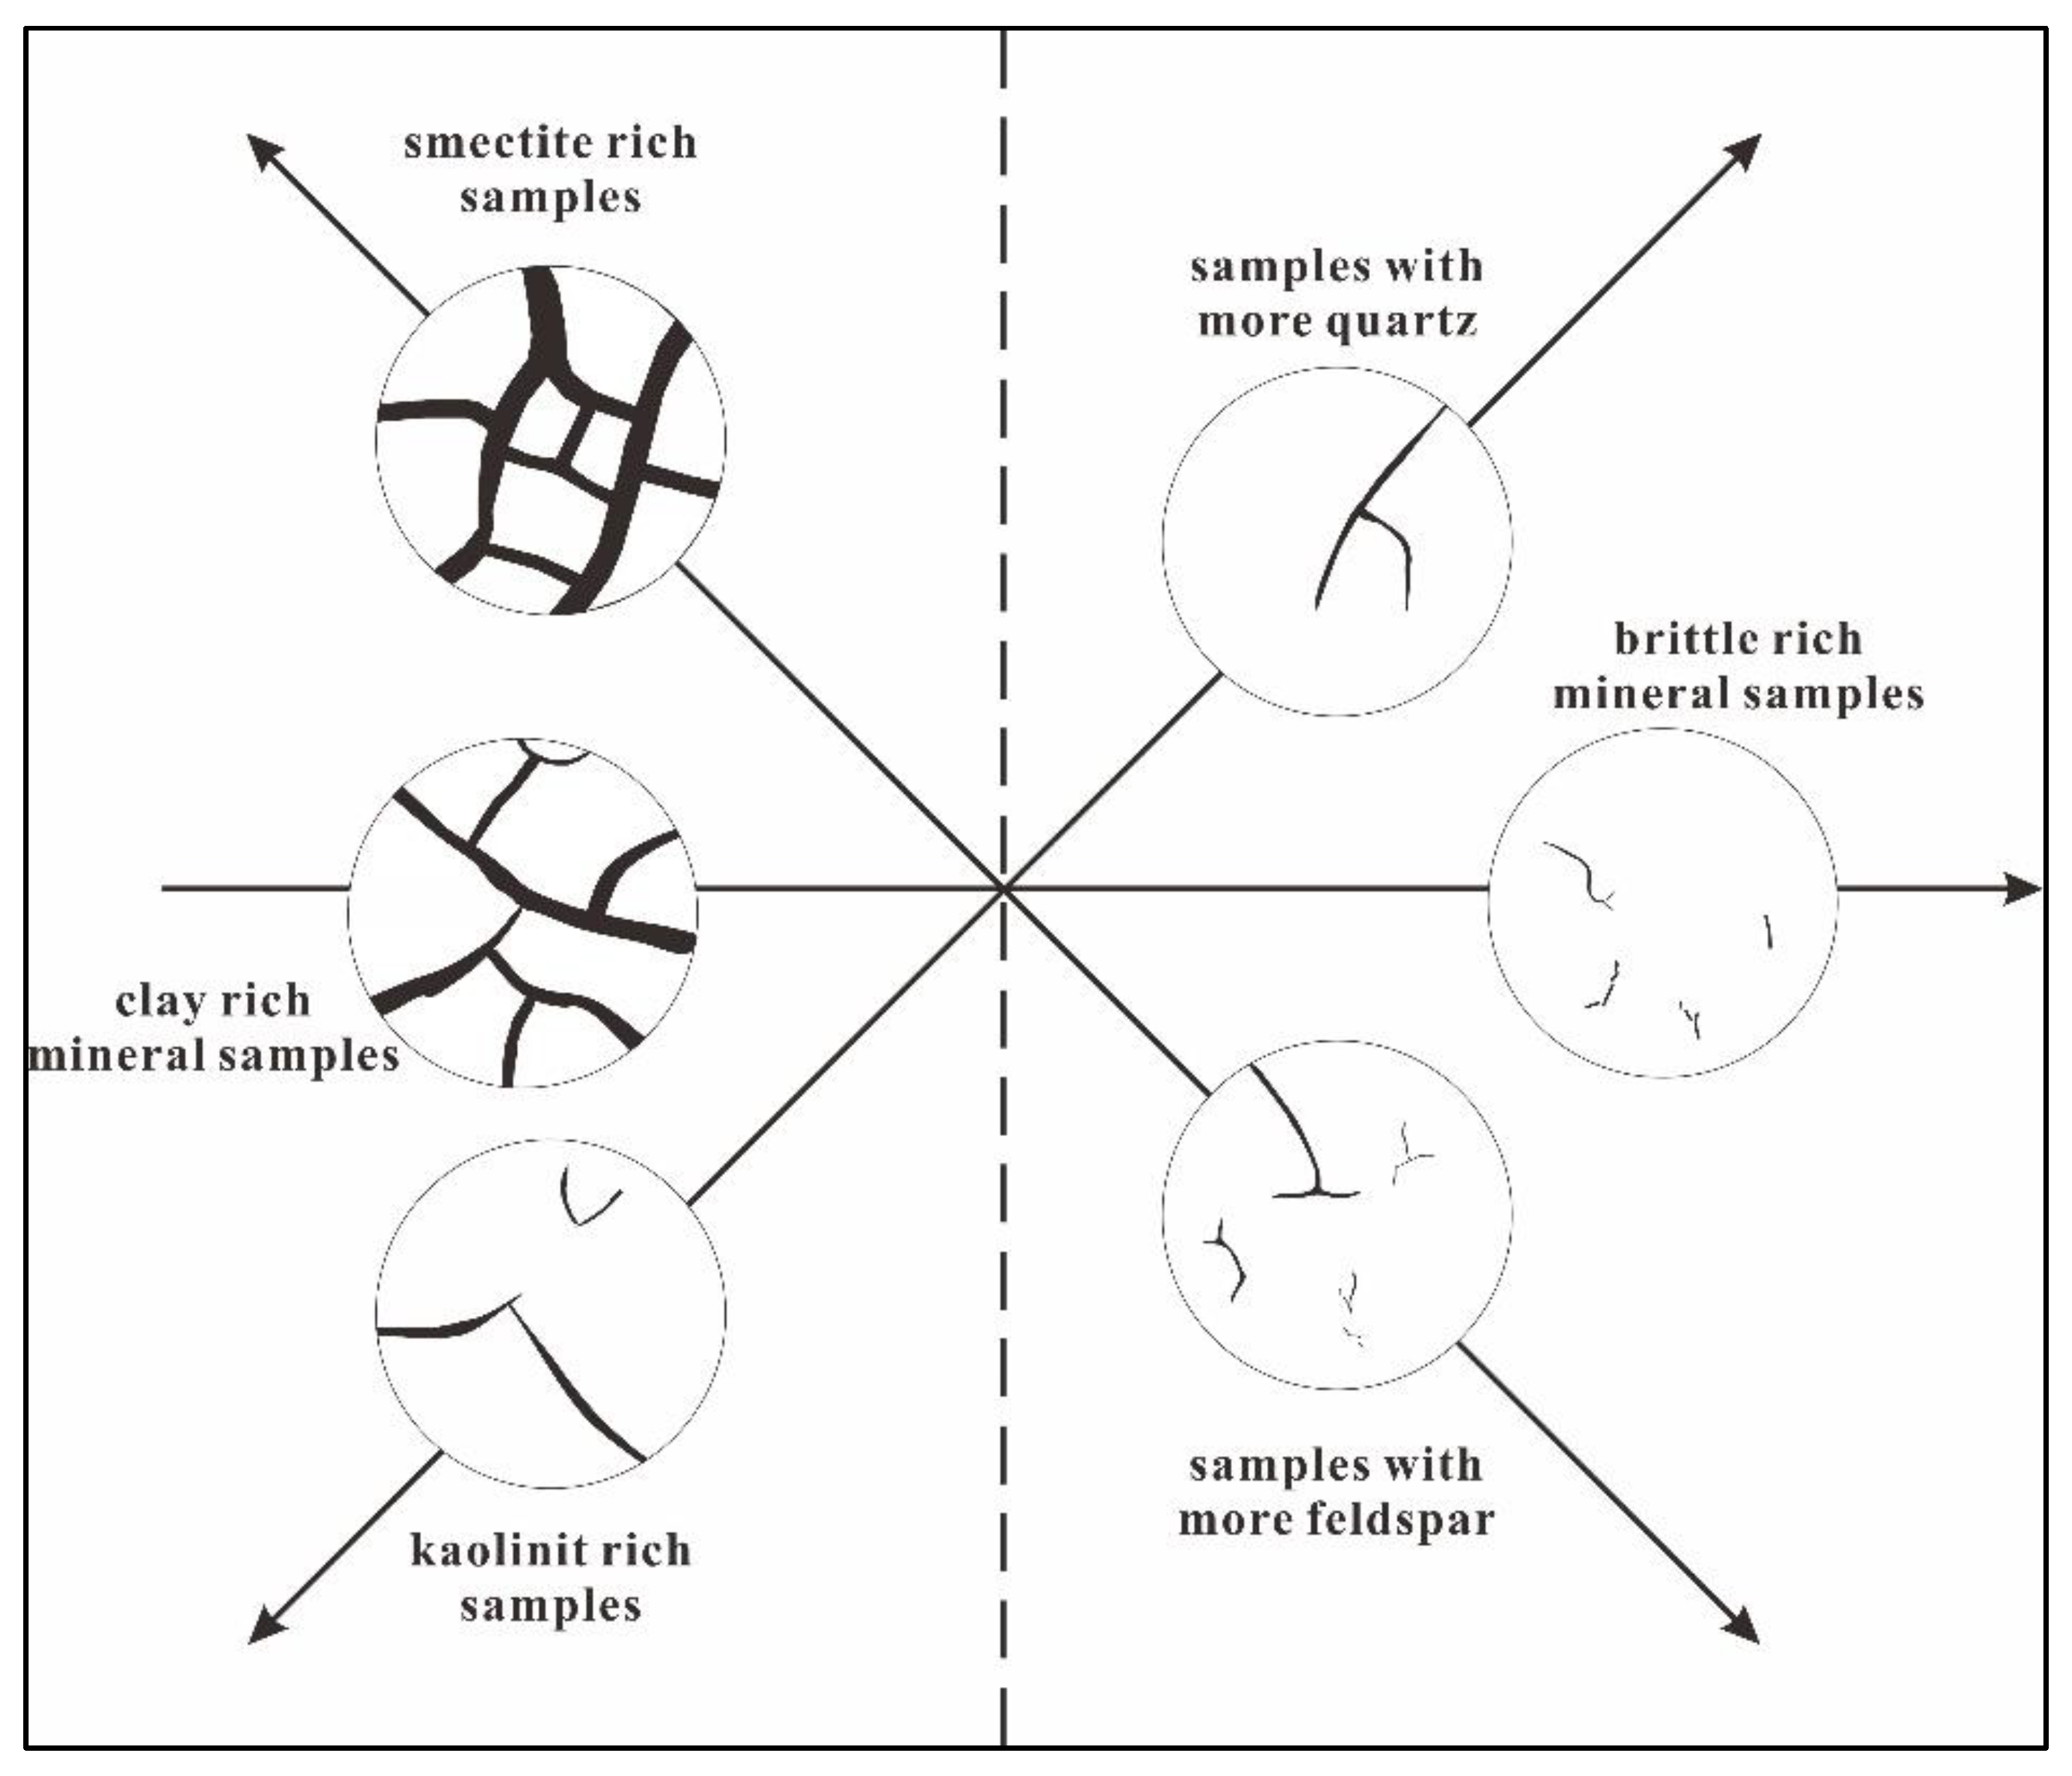
Minerals 12 01381 g013
Figure 14. Desiccation crack morphological prediction diagram for various mineral compositions. The arrows indicate that the mineral ratio is increasing. The x-axis is the content ratio of brittle minerals to clay minerals. In the negative half axis of the x-axis, the y-axis shows the content ratio of smectite to kaolin. In the positive half axis of the x-axis, the y-axis shows the content ratio of quartz to feldspar.
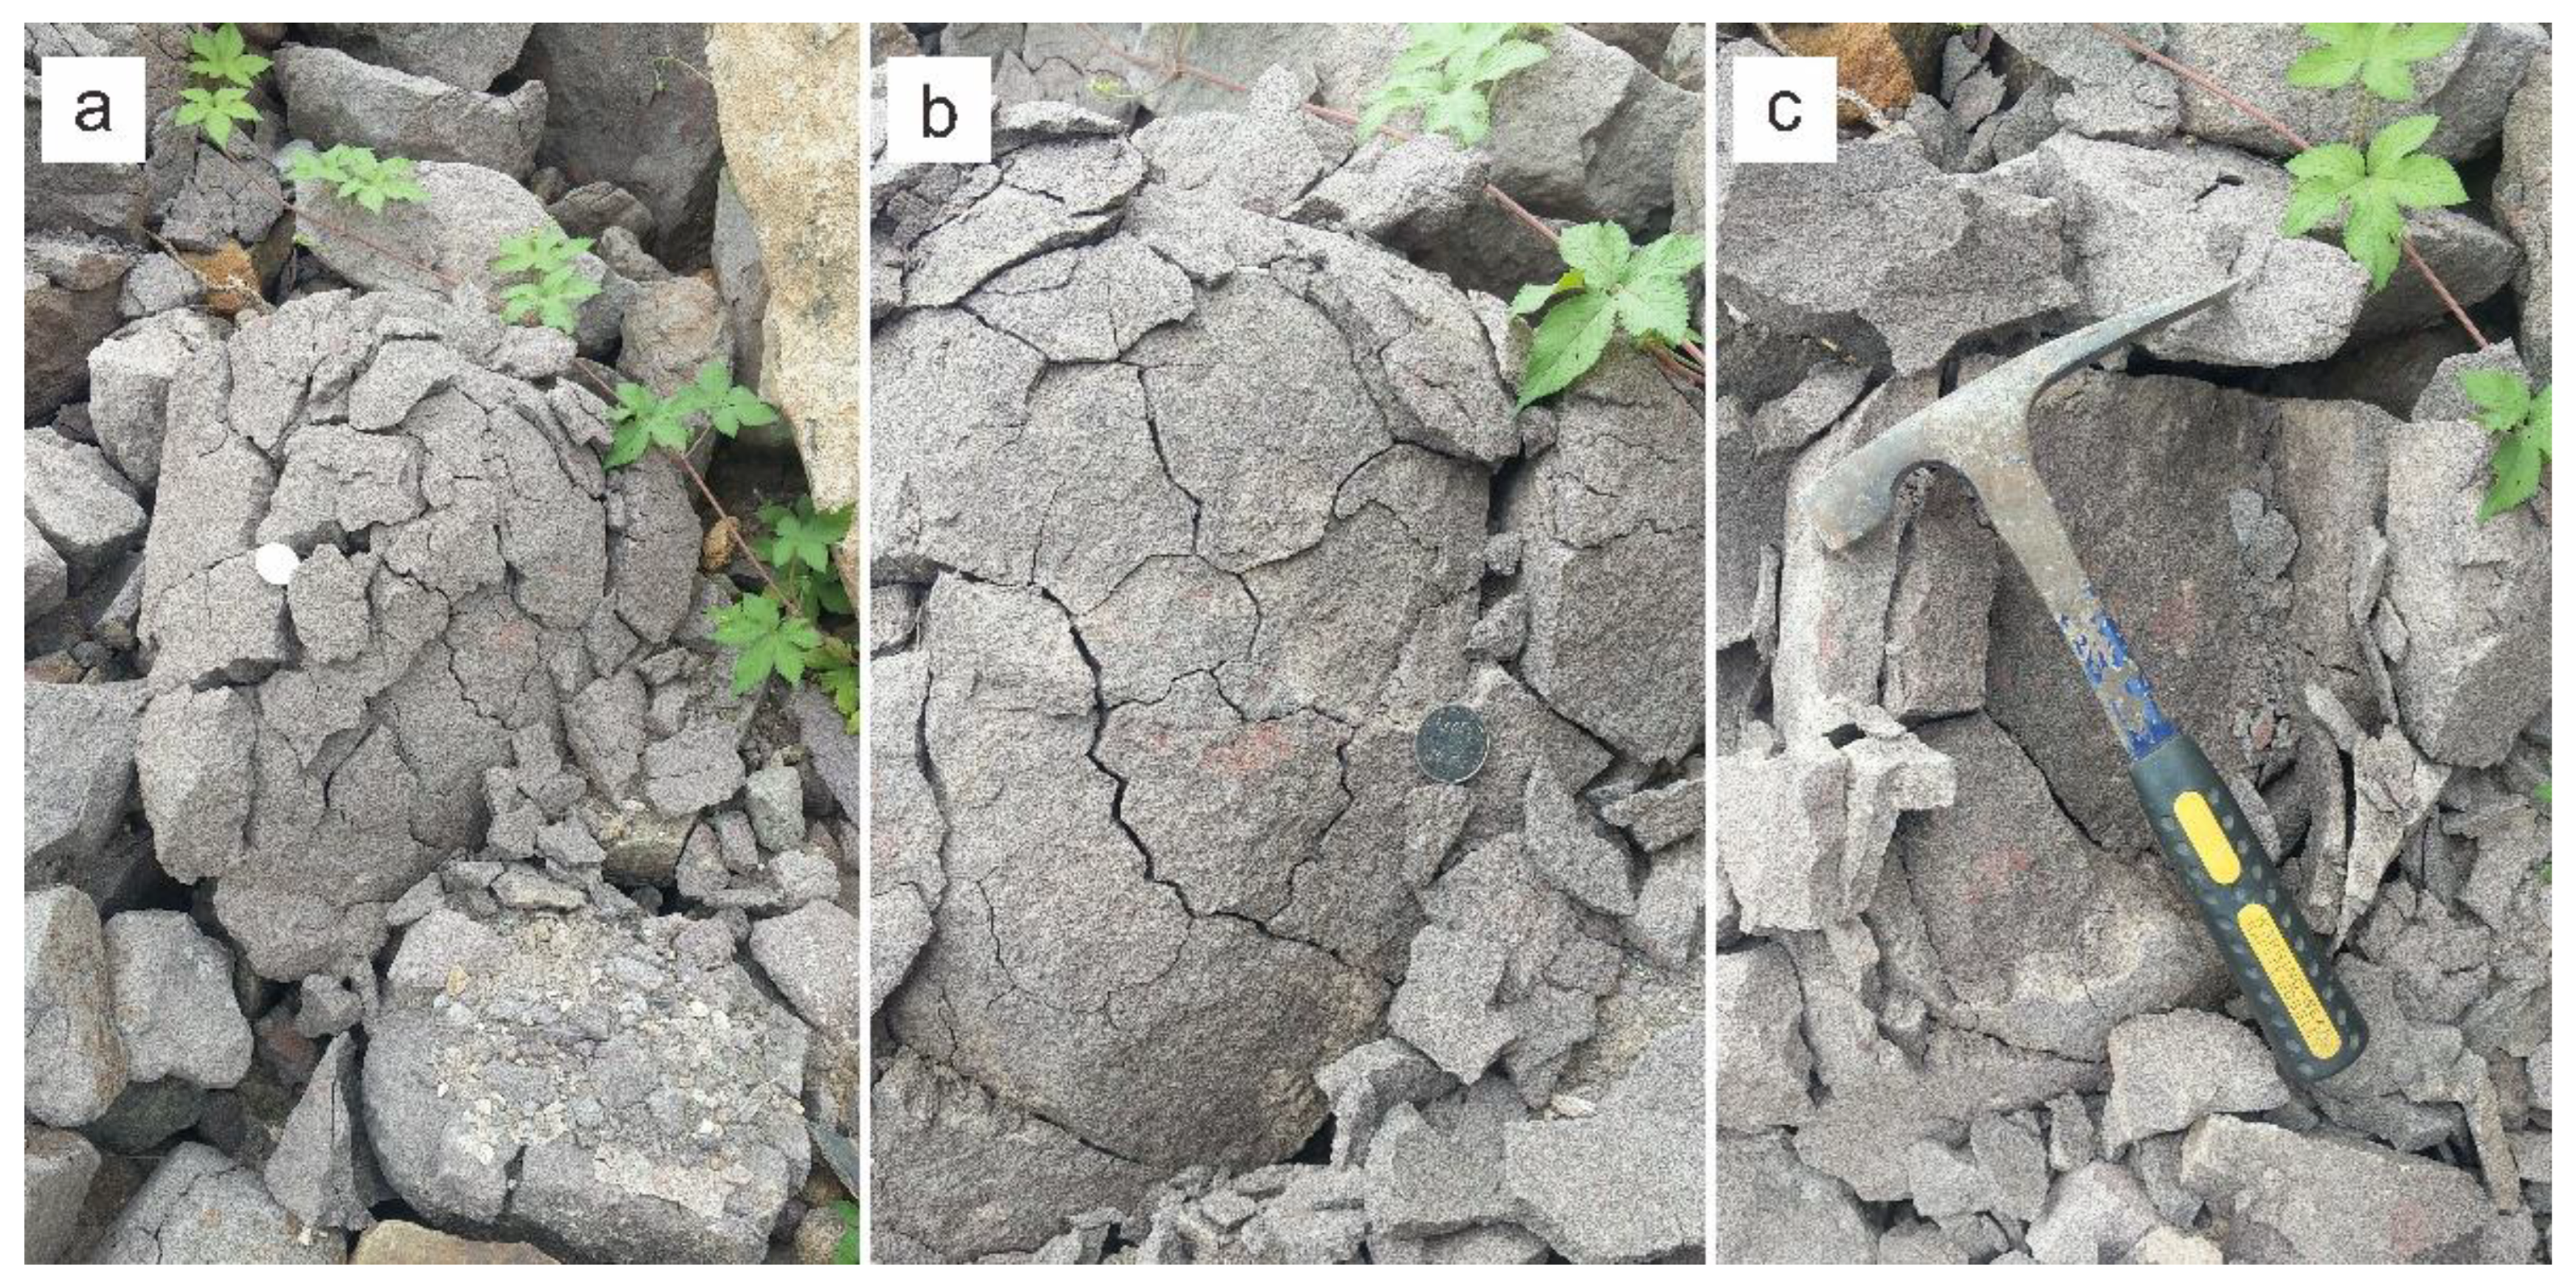
Minerals 12 01381 g014
Figure 15. Shrinkage cracks in sandstone at 35°15′52″ N and 113°8′15″ E in Jiaozuo city: (a) the surface; (b) middle surface; (c) innermost surface.
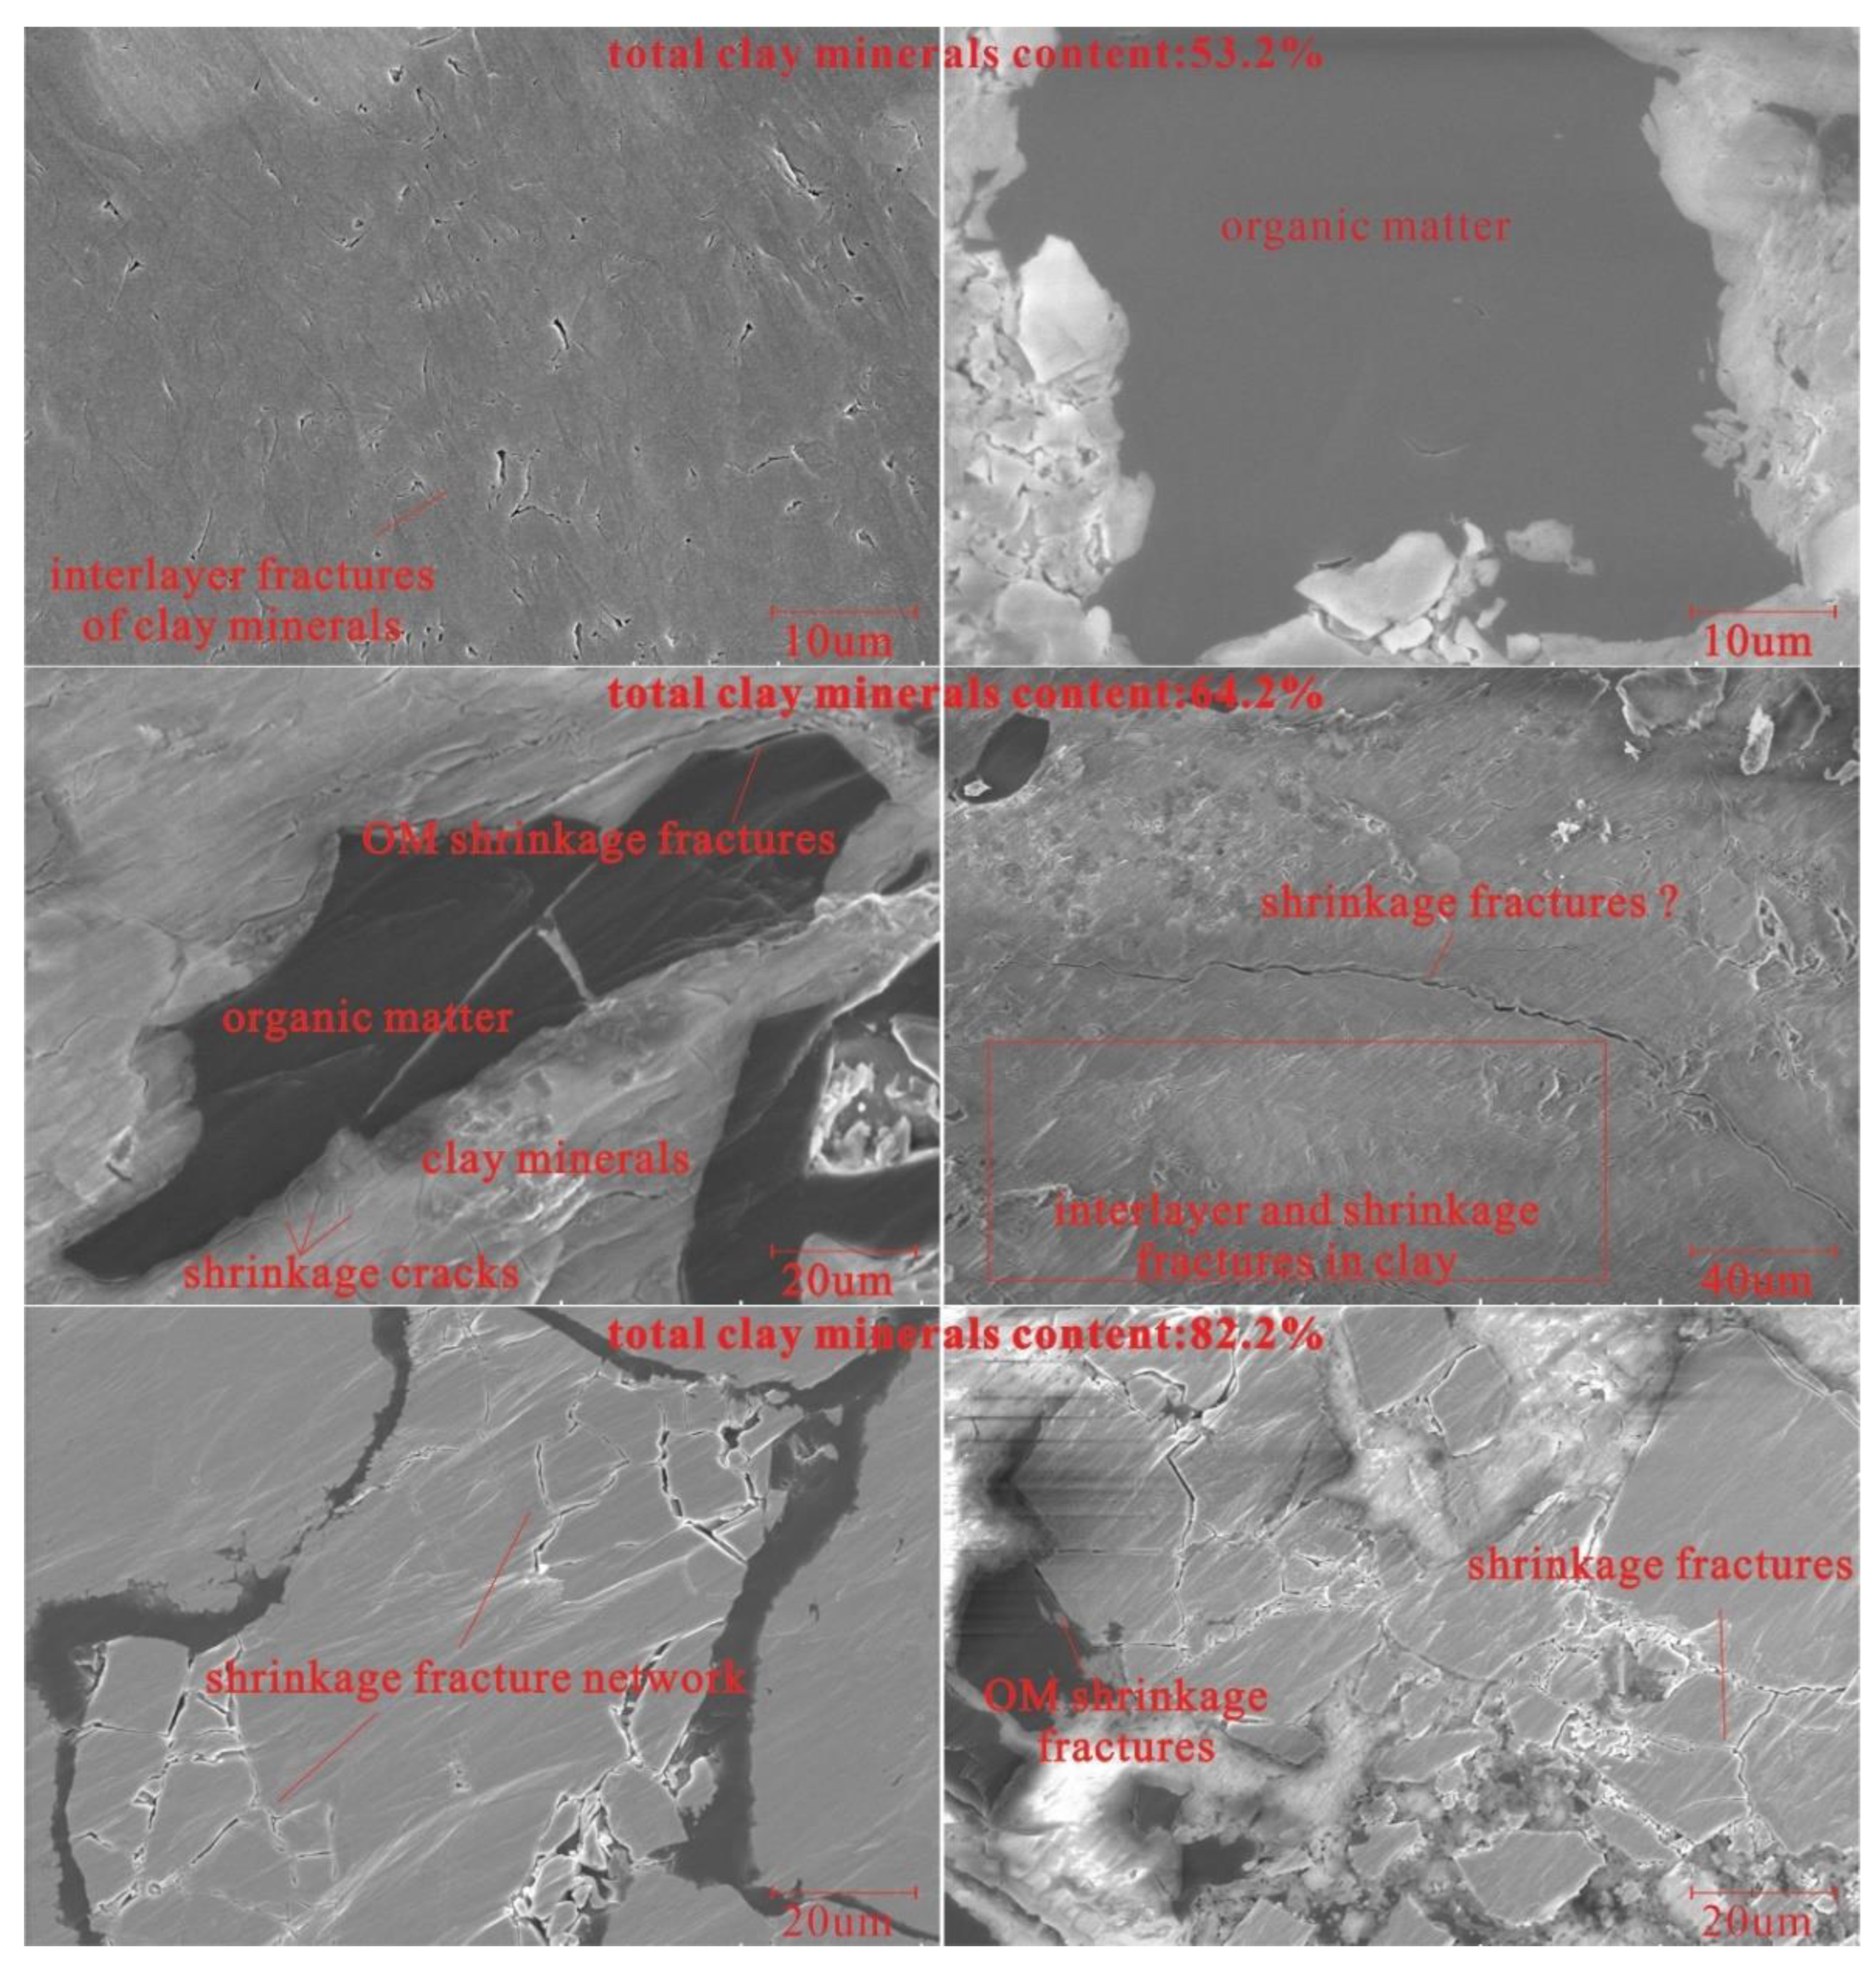
Minerals 12 01381 g015
Figure 16. SEM micrographs of diagenetic shrinkage micro-fractures in lLongtan formation shale with different content of clay.
Minerals 12 01381 g016
Table 1. Gaussian parameter values of mineral distribution.
Mineralμσμ ± 2σ
Clay5512(31, 79)
Quart3217(−2, 66)
Feldspar3.161.13(2.03, 4.29)
Table 2. Simulation experiments design.
SampleMQ:MFMK:MSMBM:MTCMW:MSMTemperature/°C
S132:32:81:92:145
S23:7
S25:5
S47:3
S59:14:61:9
S66:4
S78:2
S88:21:11:1
S96:4
S104:6
S112:8
MQ, MF, MK, MS, MBM, MTC, MW, MSM: represent the quality of quartz, feldspar, kaolin, smectite, brittle minerals, total clay, water, and solid matter, respectively.
Table 3. The CWC of samples with different minerals.
SampleMineral Content/%The CWC
QFKSBMTC
S1911872109058.43%
S22731456307055.20%
S34641040505046.73%
S4646624703045.80%
S5913654109048.38%
S6915436109046.12%
S7917218109041.89%
S836927.527.5455539.73%
S9271827.527.5455549.69%
S10182727.527.5455548.09%
S1193627.527.5455546.60%
Q: quartz; F: feldspar; K: kaolin; S: smectite; BM: brittle minerals; TC: total clay.
Table 4. Morphological parameters of samples with different values of MBM:MTC.
SampleMBM:MTCNumber of CracksTotal Length/cmAverage Length/cmNumber of Joints
Boundary JointTermination JointIntersection JointTotal Joint
S11:929120.264.11623553
S23:722131.126.01202941
S35:5447.2211.84048
S47:31841.732.3219829
Table 5. Morphological parameters of samples with different values of MK:MS.
SampleMK:MSNumber of CracksTotal length/cmAverage Length/cmNumber of Joints
Boundary JointTermination JointIntersection JointTotal Joint
S12:829120.264.11623553
S54:61296.408.01101223
S66:433150.384.61824161
S78:21269.895.867619
Table 6. Crack area and density under different quality ratios of kaolin to smectite.
SampleMK:MSSmectite Content/%Crack Area/cm2Crack Density/%
S12:872107.0323.67
S54:65461.1313.52
S66:43639.308.69
S78:21819.964.41
Table 7. Morphological parameters of samples with different values of MQ:MF.
SampleMQ:MFNumber of CracksTotal Length/cmAverage Length/cmNumber of Joints
Boundary JointTermination JointIntersection JointTotal Joint
S88:22089.144.5652031
S96:42295.614.36201642
S104:62092.954.66181135
S112:840104.512.64412671
Table 8. Morphological parameters of samples at the scale of per dm2.
SampleCrack Density (1/dm2)Area Density (1/dm)Boundary Joint Density (1/dm2)Termination Joint Density (1/dm2)Intersection Joint Density (1/dm2)Total Joint Density (1/dm2)
S16.41 2.66 3.5 0.4 7.7 11.7
S24.87 2.90 2.7 06.4 9.1
S30.88 1.04 0.9 0.0 0.9 1.8
S43.98 0.92 0.4 4.2 1.8 6.4
S52.65 2.13 2.4 02.7 5.1
S67.30 3.33 4.0 0.4 9.1 13.5
S72.65 1.55 1.3 1.5 1.3 4.2
S84.42 1.97 1.3 1.1 4.4 6.9
S94.87 2.11 1.3 4.4 3.5 9.3
S104.42 2.06 1.3 4.0 2.4 7.7
S118.85 2.31 0.9 9.1 5.8 15.7
Table 9. Applicable conditions of the morphology prediction model.
Temperature/°CMineral Particle Size/μmOverburden Pressure/MPa
45Q, F: 15
K, S: 10
0
Table 10. Mineral content of sandstones in each layer.
LayerMQ/%MF/%MCal/%MTC/%
surface87.60.00.012.4
middle layer80.70.05.214.1
innermost layer80.81.20.018.1
MQ, MF, MCal, MTC: represent the quality of quartz, feldspar, calcite, and total clay, respectively.
Publisher’s Note: MDPI stays neutral with regard to jurisdictional claims in published maps and institutional affiliations.

