Article

Investigation of the Distribution of Heavy Metals in the Soil of the Dahuangshan Mining Area of the Southern Junggar Coalfield, Xinjiang, China

1
School of Ecology and Environment, Xinjiang University, Urumqi 830046, China
2
Institute for Arid Ecology and Environment, Xinjiang University, Urumqi 830046, China
3
Key Laboratory of Oasis Ecology of Ministry of Education, Xinjiang University, Urumqi 830046, China
*
Author to whom correspondence should be addressed.
Minerals 2022, 12(10), 1332; https://doi.org/10.3390/min12101332
Submission received: 18 August 2022 / Revised: 30 September 2022 / Accepted: 11 October 2022 / Published: 20 October 2022
(This article belongs to the Special Issue Green Mining of Coal Mine in China)

Abstract

:
Coal mining activities have a series of impacts on the local eco-environment, such as air pollution due to the release of toxic gases, contamination of soil with heavy metals, disturbance and contamination of surface and subsurface water, and damage to land resources with surface subsidence and accumulation of solid waste materials. This study investigated the distribution of heavy metals in mining sites by analyzing the heavy metal content in soil samples from different sites in the Dahuangshan mining area of the southern Junggar coalfield (Xinjiang, China). The results show that area C has the highest Cu content; and area B has the highest Mn content, the highest Zn content, the highest As content, and the highest Cd content, which indicate that area B underwent potential multiple heavy metal contamination. It also shows that the Cd is the major heavy metal for all three areas. The different eco-environmental indices, including the Nemerow comprehensive pollution index, the geo-accumulation index, and the potential ecological risk index, all show the same results, i.e., that Cd is the major potential contaminant in all three types of soil.

1. Introduction

Soil is one of the most important substances that human beings are dependent upon for survival. With economic development, several eco-environmental problems have worsened due to the release of toxic matter, especially from industries involving metallurgy, manufacturing, and mining. Heavy metal pollution has attracted increasing attention since it represents a potential hazard to human health and the environment [1,2]). Coal mining activities (including open-pit and underground mining) have a series of impacts on the local eco-environment, such as air pollution with the release of toxic gases, contamination of soil with heavy metals, disturbance and contamination of surface and subsurface water, and damage to land resources with surface subsidence and the piling of solid waste materials [3]. It is well known that coal mining, grinding, transportation, and combustion processes release several heavy metals into the soil, leading to heavy metal pollution in mining areas [4]. Such pollution has caused several ecological and environmental problems, including the alteration of soil functions, vegetation degradation, and destruction of the reproductive capabilities of soil fauna [5]. Heavy metals in the soil also leach and migrate to the surrounding areas, affecting the ecological environment around them [6]. Furthermore, soil contamination due to heavy metals increases the likelihood of human cancers in affected areas [7]. Considering that soil contamination caused by heavy metals in mining areas is a global threat to the ecological environment and human health [8], it is vital to assess the extent of heavy metal contamination of soils in mining areas and to understand the factors that influence this.
Scholars have studied soils that are polluted by heavy metals from different perspectives. Turhan et al. and Liu et al. found that the heavy metal content in the soil of coal mining areas complies with the relevant standards of soil quality [9,10]. Zhuang and Raj used different methods to assess soil pollution levels and revealed the presence of heavy metal pollution and its potential harm to the environment and to humans [11,12]. The heavy metals in the topsoil samples (0–20 cm) were measured and monitored by sampling, testing, and statistical analysis, and their spatial distribution patterns were subsequently analyzed. The single factor pollution index (SFPI), the comprehensive pollution index (CPI), and the potential ecological hazard index (PEHI) methods were used to systematically calculate and analyze the soils [13]. Some scholars have used statistical and chemical methods to trace the sources of heavy metals in the soils of different types of coal mines. They discovered that all the sources were either artificial or natural [14]. The combination of biochar and other materials has been studied to reduce the heavy metal content in soils, enhance the nutritional value of crops, and positively impact human health [15,16]. Artificial sources include mining minerals during the accumulation of solid waste, fly ash, coal production, and transportation [17], while natural sources include soil parent materials, soil topography, vegetation enrichment, and atmospheric subsidence [18].
At present, there are several studies focusing on the intrinsic relationship between heavy metal pollution and the evolution of the ecological environment in mining areas [19]. During coal mining, heavy metals make direct contact with the ground and the air and are spread to the surroundings by the wind. Subsequently, with precipitation, heavy metals in the atmosphere and the soil surface go deeper into the ground, polluting the soil, groundwater, and surface runoff, thereby, affecting the living environments of vegetation, animals, and humans [20,21]. Such pollution is, however, irreversible owing to natural mechanisms [22]. This research review shows that the mechanisms of heavy metal pollution and contamination in the soil, as well as the changes in the ecological environment of coal mining areas have not been sufficiently investigated.
In this study, the authors investigate the distribution of heavy metals in the soil of the Dahuangshan mining area and evaluate their impact on the local environment using different methods, which will aid in further understanding the impact of mining activities on the local eco-environment of the arid Xinjiang region.

2. Materials and Methods

2.1. Study Area

The Dahuangshan mining area is located in the eastern part of the southern Junggar coalfield, which comprises the Dongfeng Fusheng Coal Mine (area A), the Xigou Coal Mine (area B), and the Jinta Coal Mine (area C). The geological structure of the mining area is an inverted syncline of Huangshan Street, where the Jinta and Xigou coal mines are located in the north wing and the Dongfeng Fusheng Coal Mine in the south wing. The coal seams were named A3 and A5, with average thicknesses of 4 and 25 m, respectively. The type of coal resource is attributed to weak–caking coal and gas coal. The inclination angles of the north and south wings are 25–42° and 50–87°, respectively, and the altitude range of the study area is +900 m to +1300 m. The local climate is continental arid with an average annual temperature of 6.7 °C, an average annual rainfall of approximately 205 mm, and a perennial northwest wind. The land use of the sampled sites may be categorized as a stockpile yard (A), a subsidence area with a caved gob (B), and an industrial square (C). All three sampling sites belong to the underground type of mining, i.e., shafts, including the convey shaft and the air-exhaust shaft, were constructed to reach the underground coal seam, and necessary roadways were constructed for ventilation and coal transportation. Coal was extracted and transported to ground, and it was prepared and transported away. An illustration of the study area and the sampling points are presented in Figure 1.

2.2. Sampling and Tests

A total of 31 random sampling points were selected from the Dahuangshan mining area, of which 11 were located in the abandoned stockpile yard of the Dongfeng Fusheng Coal Mine (A), 10 were located in the abandoned industrial square of the Jinta Coal Mine (B), and the remaining 10 were located in the subsidence area of the caved gob of the Xigou Coal Mine (C). In the arid Xinjiang region, it is common that the surface layer (0–30 cm) is sometimes fertilized and this affects the heavy metal transportation and distribution [23]. The soil samples were collected from the sites in July 2019 after removing the coal dust-covered surface at soil depths of 0–10 cm, 10–20 cm, and 20–30 cm. Three soil samples of 0.5 kg were collected at each sample site, and these were mixed using the quarter method and sampled at 500 g for the final tests.
The sample chamber was air-dried naturally, and the soil sample was sieved through a 150 mm sieve, followed by digestion with a mixture of nitric acid, hydrofluoric acid, and perchloric acid to leach the heavy metals. An atomic fluorescence spectrometer was used to measure the As and flame atomic absorption spectroscopy was used to measure the Cu, Mn, Zn, Cd, Pb, and Cr. The soil pH, soil organic matter (SOM), soil alkaline nitrogen (SAN), soil available phosphorus (SAP), and soil available potassium (SP) were also measured. The pH was obtained by leaching with pH glass electrodes and a water-soil ratio of 25:1 and the organic content was measured using potassium dichromate. Alkaline hydrolysis diffusion was used to quantify the nitrogen content, and SAP was measured using the molybdenum antimony colorimetric method after leaching the samples with sodium bicarbonate. The SP content was determined using a flame photometer after leaching the samples with ammonium acetate.

2.3. Soil Quality Assessments

The Soil Environmental Quality Standard (GB15618-199, China) was used to assess the soil quality. The methods of the Nemerow comprehensive pollution index, geo-accumulation index, and potential ecological risk index were included in this study. These methods are used to evaluate heavy metal pollution in the soil and potential ecological hazards. The classification standards of heavy metal pollution levels in the soil are described in Table 1.
The Nemerow comprehensive pollution index considers extreme values and reflects the impacts of the elements that are the most significant pollutants [24]. It is calculated using Equations (1) and (2), as follows:
P i = C i / S i
P N = P i max 2 + P i a v e 2 / 2
where Pi is the single factor index, Ci is the heavy metal content, Si is the background value, PN is the Nemerow comprehensive pollution index, and Pi(max) and Pi(ave) are the maximum and average Pi values, respectively.
The geo-accumulation pollution index is based on natural geological processes and reflects the impacts of natural changes and human activities on the heavy metal pollution of the soil. It is an important indicator of human impacts [25], and may be calculated using Equation (3):
I g e o = log 2 C n / K × S n
where Igeo is the geo-accumulation pollution index; Cn is the heavy metal content; Sn is the geochemical background content of heavy metal n; and K is the background value caused by diagenesis, which is 1.5 in this study.
Based on sedimentological findings, the potential ecological risk index integrates several factors, including the heavy metal content in the soil, the multi-element synergy, the toxicity level, the pollution concentration, and the environmental sensitivity to heavy metal pollution [8]. The index was calculated using Equation (4):
R I = i = 1 n E r i = i = 1 n T r i × P r i
where RI is the potential ecological risk index, Eir is the single element potential ecological risk coefficient, and Tir is the single element toxicity coefficient, which has been specified by Hakanson as 1 for Mn and Zn, 2 for Cr, 5 for Cu and Pb, 10 for As, and 30 for Cd, and Pir is a single factor index.

2.4. Data Sources of the Factors and Processing Methods

Six factors, including the normalized difference vegetation index (NDVI), the topographic position index (TPI), wind speed (WP), precipitation (P), atmospheric dustfall (D), and surface temperature (W), were considered to influence the heavy metal pollution of the soil in the mining areas. The NDVI and the land surface temperatures were calculated from the Landsat 8 images. The TPI was calculated using a 30 m resolution DEM. Remote sensing data were downloaded from the website of China Geospatial Data Cloud (http://www.gscloud.cn/), and information on WP and P were obtained from the meteorological station of the mining area. Atmospheric dust-fall data were acquired using an erected dust reduction tank, and the heavy metal content in the dust was calculated.
NDVI can be used to determine the vegetation coverage, which was obtained from the ratio of the difference value and the total value of both the near-infrared and the visible–infrared bands. This index may be calculated using the following equation [23]:
N D V I = N I R r e d N I R + r e d
where NDVI is the normalized difference vegetation index, NIR denotes the value of the near-infrared light, and red denotes the value of the visible infrared light.
The mono-window algorithm is a ground temperature inversion algorithm for TM data with only one thermal infrared band. The formula used is as follows [23]:
W = a × 1 C D + ( b × ( 1 C D ) + C + D ) × T s e n s o r D × T a / C
where W is the surface temperature, a and b are constants (a = −67.355351, b = 0.458606), C and D are intermediate variables, Ta is the average atmospheric action temperature, and Tsensor is the brightness temperature of the sensor.
The TPI is defined as the difference between the cell elevation and the average elevation of the cells within a predetermined radius. The calculation formula used is as follows [26]:
T P I = Z 0 1 n R i R Z i
where Z0 denotes the center point elevation, R denotes the predetermined neighborhood, Zi denotes the elevation in the neighborhood, and n denotes the number of elevation points in the neighborhood.

3. Results and Discussions

3.1. Statistical Analysis of the Physical and Chemical Properties, and Heavy Metal Contents of the Soil

3.1.1. General Physical and Chemical Properties of the Soil

The physical and chemical properties of the soil reflect the overall environment of the mining soil. The soil properties in the three sampling areas (pH, SOM, SAN, SAP, and SP) are presented in Figure 2.
The soil in all three areas was weakly alkaline, with mean pH values greater than 8.50. Area A exhibited the lowest average pH due to differences in coal quality and transportation issues. Area B was only affected by the soil parent materials and large variations occurred in areas up to a pH of 9.2, which may be explained as the result of the mining activities. Area C demonstrated a mean pH value of 8.83 and soil alkalinity, which may be a result of natural factors. In addition, among the three coal layers, the first layer exhibited the smallest change in the soil pH, whereas the second layer exhibited the maximum variation. Except for the surface soil, the SOM in all three areas changed significantly. The average SOM in areas A and C was 20 ± 1 g/Kg, changing to 13.7 g/Kg in area B. Such variance in the mined-out areas collapses at higher temperatures and this is not conducive to vegetation growth. In addition, these changes cannot be attributed to human impact [27]. The mean SAN of the three areas was 79 ± 1 mg/kg; however, different soil layers across areas varied significantly in their SANs. The SAP measurements revealed an abnormal value in the surface soil of Area B and the overall average number was 2.4 ± 0.5 mg/Kg. The average SP was135.8 mg/Kg, 171.3 mg/Kg, and 114.7 mg/Kg in areas A, B, and C, respectively. It may, therefore, be deduced that SAN, SAP, and SP are greatly affected by the natural element content in the soil parent materials and the coal, as well being affected by in different uses of the land.

3.1.2. General Contents of Soil Heavy Metals

When analyzing the general heavy metal content in the soil, the background value of the heavy metals in Xinjiang soil and the national standard of soil environmental quality, class I (GB 15618-1995) were used as references. The results of this analysis are presented in Table 2.
The average contents of Pb and Cr across 31 samples were 3.3 mg/Kg and 1.42 mg/Kg, respectively, and these were much lower than the background values of 18.6 mg/Kg and 49.30 mg/Kg (the soil quality standard, class I defines the contents as 35 mg/Kg and 90 mg/Kg, respectively). However, the contents of Mn, Cd, and As were 100%, 100%, and 94% higher than the standard, respectively. Mn, Cd, and As were, therefore, determined to be the major pollutants. In addition, area A was not polluted by Cu and Zn, while the remaining two areas were greatly affected by these two elements. The coefficients of variation ranged between 3% and 64%, indicating a significantly varied spatial dispersion. These results suggest that pollution is caused by structural and human factors and that the greater coefficient of variation implies that there are more influencing factors [28].

3.2. The Spatial Distribution of the Physical and Chemical Properties and the Heavy Metal Elements of the Soil in Different Directions

The ordinary kriging method may be used to predict the spatial characteristics of the physical and chemical properties of the soil and its heavy metal content [29]. The predicted results are presented in Figure 3 and Figure 4. Half of the points were selected as checkpoints by spatial interpolation with a confidence of 90%, and a greater contour line density indicated a higher frequency of numerical changes in the area. In addition, a larger color gap reflects greater spatial variation in the area.

3.2.1. The Spatial Distribution of the Physical and Chemical Properties of the Soil

Figure 3 shows that area B has the highest pH value, which increases with the increase in depth, compared to areas A and C, with area A having the lowest value. Area A has the highest SOM value, which decreases with the increase in depth, compared to areas B and C, with area C showing the lowest value. Area B has the highest SAN value, which decreases with the increase in depth, compared to areas A and C, with area C having the lowest value. Area C has the highest SAP value, which decreases with the increase in depth, compared to areas A and B, with area A having the lowest value. Area A has the highest SP value, which decreases with the increase in depth, compared to areas B and C, with area B having the lowest value. From the above analysis, it is certain that the type of land use is the main reason for the variation in the soil properties. The soil type in the industrial squares mining area (area B) was the most affected compared to the other two types (area A and area C).

3.2.2. Spatial Distribution of the Heavy Metal Content in the Soil

Heavy metals in soils of different land types are significantly different in their content, which reflects an enrichment effect and migration to the subsoil. As presented in Figure 4, area C has the highest Cu content, which changes little with the increase in depth, compared to areas A and B, with area A having the lowest value. Area B has the highest Mn value, which fluctuates with the increase in depth, compared to areas A and C, with area A having the lowest value. Area C has the highest Zn value, which fluctuates with the increase in depth, compared to areas A and B, with area A having the lowest value. Area B has the highest As value, which decreases with the increase of depth, compared to areas B and C, with area A having the lowest value. Area B has the highest Cd value, which increases with the decrease of depth, compared to areas A and C, with area C having the lowest value.
Area A exhibited a low heavy metal content, which may be explained by the enclosed mining method adopted in the area that impacts the environment [30]. The soil in area C contained more heavy metals which may be explained by the subsidence in the area being low, and the adjacent coking plant emitting tremendous amounts of waste and the area being primarily affected by gangue accumulation. Owing to the simultaneous action of wind, atmospheric deposition, and precipitation, pollution has converged in lower areas, increasing its severity [31]. As an industrial square, area B was found to be the most affected by human activities and is characterized by the small spatial heterogeneity and its large polluted area. The Industrial plaza soil is affected by vehicle transportation and coal dust deposition during coal resource mining.

3.3. Pollution Evaluation of Heavy Metal Elements in the Soil

Considering that the soil sampling depth was between 0 and 30 cm (topsoil), the pollution indices of heavy metals across the three soil layers were averaged. The pollution levels are listed in Table 2 and the calculation results are in Table 3.
According to the Nemerow Comprehensive Pollution Index, the top five heavy metal pollutants in Dahuangshan are cadmium, manganese, copper, arsenic, and zinc. Specifically, Cu pollution demonstrated different levels across the three areas, while all the other pollutants exhibited similar levels of contamination. The pollution levels reflect the effective factors, and the highly variable pollution levels suggest the role of random and human factors in causing the pollution by specific heavy metals. The pollution levels of Cd and Mn were found to be high, of which Cd is the more toxic. There is thus an urgent need for heavy metal control and remediation treatment to reduce their harmful effects on the surrounding environment and human health.
The geo-accumulation index may be used to effectively determine the extent of the deposition of heavy metal pollution. The pollution for Zn and As was 0 across the entire area. No Cu pollution was observed in area A, and moderate grade 1 Cu pollution was present in areas B and C, indicating that Cu pollution was influenced by the elemental content of coal. Moreover, the Mn pollution in area B was 0.65 times higher than in the other two areas, suggesting that mining operations (e.g., transportation and dust) may be considered more important for Mn pollution. The Cd pollution level in the Dahuangshan mining area was grade 2, indicating that Cd is the main heavy metal pollutant in the soil in the Dahuangshan mining area.
The potential ecological risk pollution index is advantageous because it can aid in understanding the overall risk posed by both a single pollutant and numerous pollutants in a real ecosystem. The top five heavy metal pollutants in the soil of the Dahuangshan mining areas demonstrated a total potential ecological risk index of 4860.23, reflecting an extremely high ecological risk. Specifically, the risk indices were 1379.61, 1537.56, and 1943.08 for areas A, B, and C, respectively; the indices of each element were 183.33, 66.65, 23.13, 336.03, and 4251.10 for Cu (medium-high risk), Mn (medium-low risk), Zn (low risk), As (high risk), and Cd (high risk), respectively. The area with the greatest ecological risk was found to be the industrial square, where human activity is the most frequent. More importantly, considering Cd and As are highly toxic elements, they are considered the main ecological risks to soils in mining areas. Relevant measures, therefore, need to be taken for the prevention and control of heavy metal contamination. Coal ash and its transport from industrial plazas may cause heavy metal contamination of surrounding crops and ultimately have a negative impact on human health [32,33].
In conclusion, it is clear from the above three analyses that the effect of Cd is the most serious in this area. Subsequent efforts may be made to carry out experimental research on Cd in the soil of this area to achieve soil remediation.

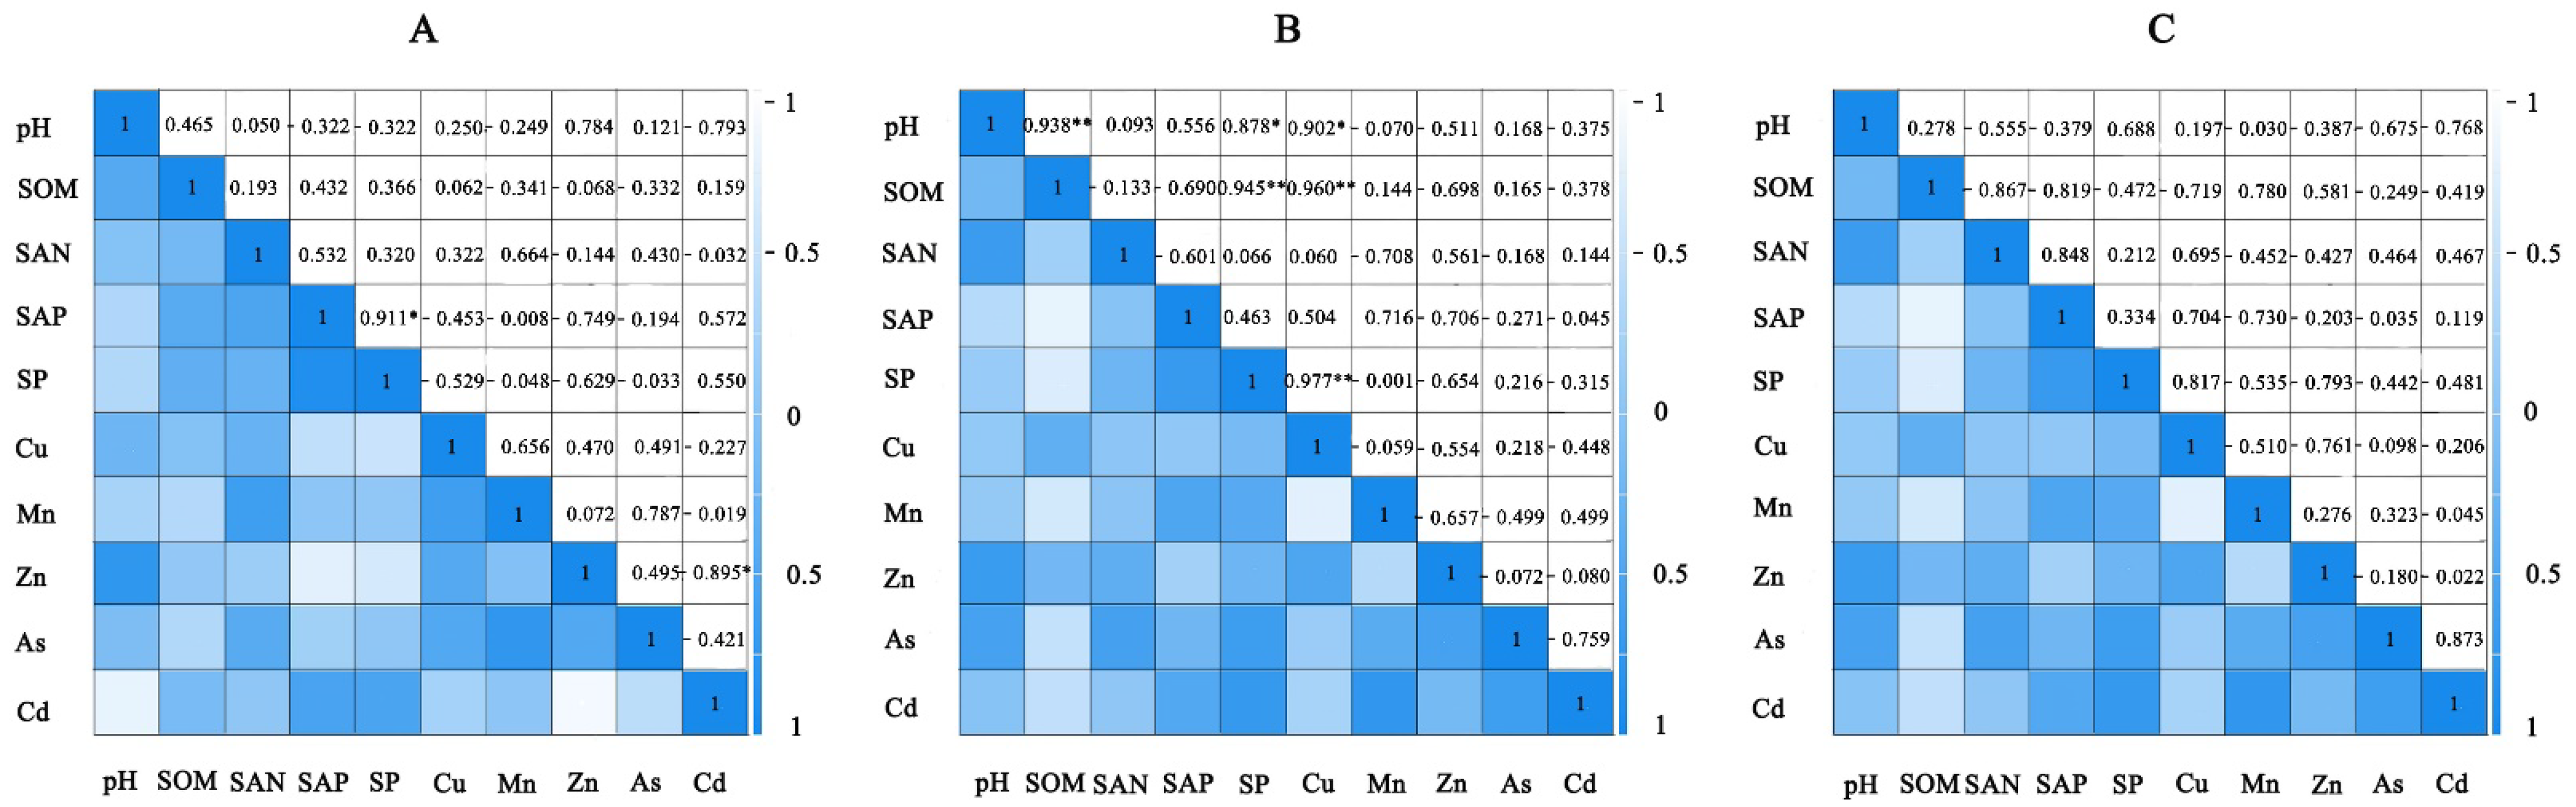
3.4. Correlation Analysis between Physical and Chemical Properties and Heavy Metal Elements of the Soil

Pearson correlation analysis was carried out on the physical and chemical properties and the heavy metal content of the soil across the three land types in the Dahuangshan mining area (Figure 5).
It may be inferred from Figure 5 that the pH and soil organic matter content were positively correlated, with the correlation coefficient in area B being as high as 0.93 **. In addition, according to the results of the descriptive statistical analysis, a higher soil pH suggests a stronger correlation with the soil organic matter content. However, a weak correlation was observed between the pH and the content of nutrient elements in the mining areas. Studies have shown that soil pH is less influenced by soil nitrogen, phosphorus, and potassium contents [34]. These effects differ for different land types in mining areas, indicating that mining activities have changed the soil environment and have affected the content of effective nutrients in the soil [35]. There is no correlation between the content of organic matter and nutrients in the soil, where the organic matter content may be affected by several external factors [36]. SAN, SAP, and SP were positively correlated in all three areas, with correlation coefficients as high as 0.34~0.91 (p < 0.05) for SAP and SP, indicating that these two variables may be affected by the same factors.
Further complex correlations among heavy metal contents across the different soil types were revealed. Notably, different correlations were observed between the heavy metal contaminants, which exhibited different sources and pathways of enrichment [37]. Cadmium was negatively correlated with other elements in area A, where the correlation coefficient with zinc was as low as −0.895 *, suggesting a special source of Cd pollution in the area. Low correlation coefficients were observed among the heavy metals in area B, indicating different and mutually independent sources of heavy metal pollution. In addition, it may be inferred from Figure 5 that different mining activities would lead to a varying extent of heavy metal pollution. The copper content in area C was negatively correlated with other elements, and the correlation coefficient with zinc was as low as −0.761, suggesting a more complicated mechanism of copper pollution in area C. It is worth noting that the correlation coefficient between the arsenic and cadmium content was 0.873 in area C, indicating that these two pollutants may share the same source.

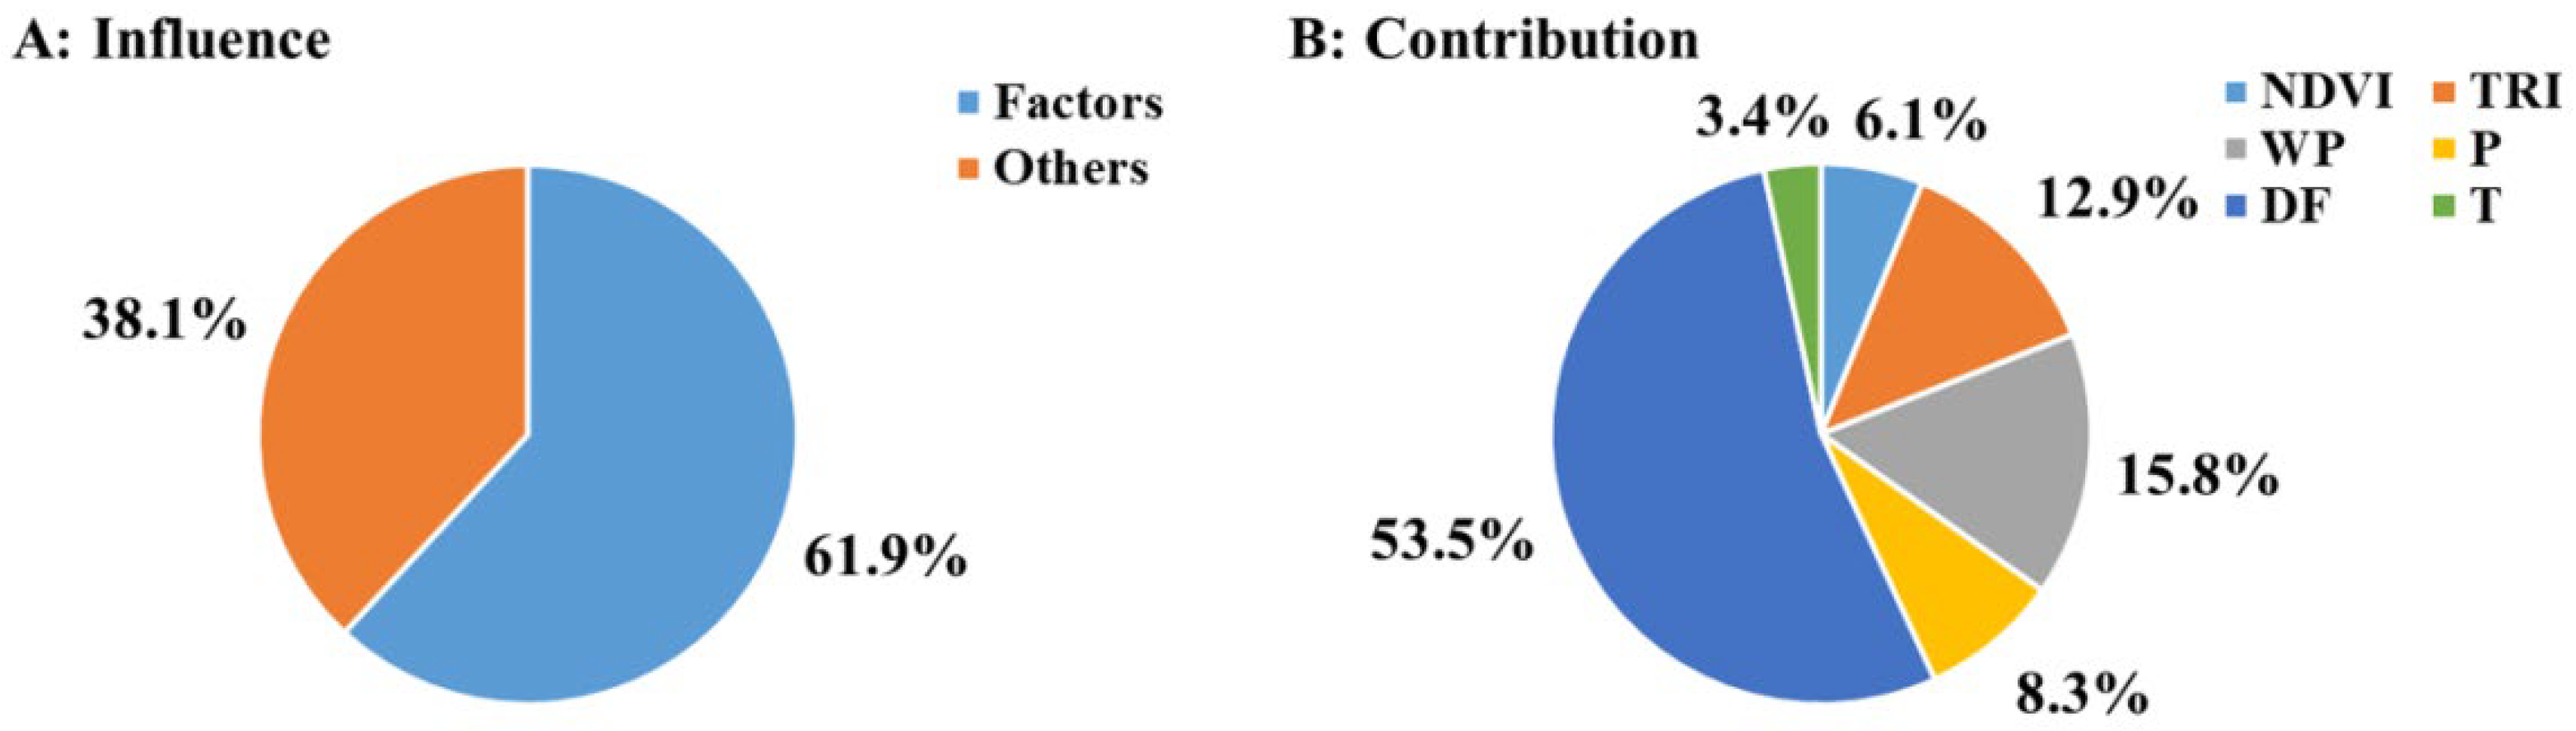
3.5. Other Factors Affecting Heavy Metal Pollution of the Soil in Mining Areas

Data for the seven heavy metal contents were subjected to numerical normalization to be considered as the dependent variable, and the six factors were considered as the independent variables. Regression analysis was used to ascertain the determinants of the heavy metal content in the soil using ordinary least squares (OLS) (Figure 6A) [38]. Hierarchical analysis was used to analyze the contribution of each of the influencing factors to the dependent variable (Figure 6B). Here, contribution is defined as the proportion of each independent variable in the goodness-of-fit measures for all the variables combined [39].
The results of the OLS regression analysis demonstrated that the six selected factors only influenced the heavy metal content of the soil by 61.9%, indicating the relevance of the other factors. Possible factors include locomotive exhaust from mineral transportation, the stacking of coal gangue and coal, and solid waste discharge from adjacent power plants. Vegetation accumulates heavy metals in its roots and alters the physical and chemical properties of the soil. However, in the Dahuangshan mining area, the contribution of NDVI to the heavy metal content in the soil was only 6.1%. This may be because there are no natural trees in the mining area, and only a small number of trees are planted in area C. Moreover, the vegetation of the shrubs and herbs is insufficient to cover the level reported by the statistics. The contribution of wind was found to be 15.8%, where the wind affected the scope, direction, and extent of pollution. Considering that the wind direction is a fixed vector pointing northwest, only the wind speed is analyzed here. The contribution of precipitation was found to be 8.3%. Precipitation brings heavy metals into the atmosphere and the ground surface, and thus they move deep underground through leaching and the pollution of groundwater. The TPI accounted for 12.9% of the contribution to the heavy metal content. However, the internal mechanism of this influence remains unclear. It is speculated that the leeward slope is less affected by wind, making it easier for atmospheric dust to accumulate. Simultaneously, depressions are more susceptible to precipitation and pollutant accumulation. Atmospheric dust contributed the most to the heavy metal concentrations in the soil. A large amount of dust is produced during coal mining and transportation, and the coal utilization results in a large amount of solid waste. Large concentrations of heavy metals are latent in the atmosphere, and several studies have shown that dust fall and the heavy metal content in the soil are highly correlated. The authors’ previous research on the Xinjiang Junggar coalfield found that coal fires can have a significant impact on the heavy metal content of the soil [40]. The surface temperature was therefore selected as an influencing factor.

4. Conclusions

This study used three indices to analyze the heavy metal pollution of the soil in the mining areas, and the main factors that affect the heavy metal content in the soil were investigated. The results demonstrated that land-use strategies can significantly impact the level and scope of heavy metal pollution in the soil. Cd was determined to be the main heavy metal pollutant in the Dahuangshan mining area, and Cd and As were identified as the two heavy metal elements with high ecological risks. Meanwhile, simple correlations were found to be insufficient in describing the relationship between the physical and chemical properties and heavy metal content of the soil, which requires further investigation. Finally, atmospheric dust was found to be the main factor affecting the heavy metal content in the soil, which was also influenced by wind speed and soil topography.

Author Contributions

Q.Z.: conceptualization, funding acquisition, writing, reviewing, and editing; L.S.: methodology; T.F.: investigation; R.H.: visualization. All authors have read and agreed to the published version of the manuscript.

Funding

This research was funded by Xinjiang Provincial Department of Science and Technology of China with the Tianshan Innovative Team Program: “Control of Coal Fire” (2021D14018).

Data Availability Statement

Data is contained within the article.

Acknowledgments

We acknowledge our team members, Longhui Zhao, Po Gao for collecting soil samples together with us; and present our appreciation to the editors and anonymous reviewers for their valuable comments to this paper.

Conflicts of Interest

The authors declare no conflict of interest.

References

  1. Turan, V. Potential of pistachio shell biochar and dicalcium phosphate combination to reduce Pb speciation in spinach, improved soil enzymatic activities, plant nutritional quality, and antioxidant defense system. Chemosphere 2020, 245, 125611. [Google Scholar] [CrossRef] [PubMed]
  2. Turan, V.; Ramzani, P.M.A.; Ali, Q.; Abbas, F.; Iqbal, M.; Irum, A.; Khan, W.-u.-D. Alleviation of nickel toxicity and an improvement in zinc bioavailability in sunflower seed with chitosan and biochar application in pH adjusted nickel contaminated soil. Arch. Agron. Soil Sci. 2018, 64, 1053–1067. [Google Scholar] [CrossRef]
  3. Zeng, Q.; Shen, L.; Yang, J. Potential impacts of mining of super-thick coal seam on the local environment in arid Eastern Junggar coalfield, Xinjiang region, China. Environ. Earth Sci. 2020, 79, 88. [Google Scholar] [CrossRef]
  4. Kang, Y.; Liu, G.; Chou, C.-L.; Wong, M.H.; Zheng, L.; Ding, R. Arsenic in Chinese coals: Distribution, modes of occurrence, and environmental effects. Sci. Total. Environ. 2011, 412–413, 1–13. [Google Scholar] [CrossRef] [PubMed]
  5. Nagajyoti, P.C.; Lee, K.D.; Sreekanth, T.V.M. Heavy metals, occurrence and toxicity for plants: A review. Environ. Chem. Lett. 2010, 8, 199–216. [Google Scholar] [CrossRef]
  6. Yoon, J.; Cao, X.; Zhou, Q.; Ma, L.Q. Accumulation of Pb, Cu, and Zn in native plants growing on a contaminated Florida site. Sci. Total Environ. 2006, 368, 456–464. [Google Scholar] [CrossRef] [PubMed]
  7. Duruibe, J.O.; Ogwuegbu, M.O.C.; Egwurugwu, J.N. Heavy metal pollution and human biotoxic effects. Int. J. Phys. Sci. 2007, 2, 112–118. [Google Scholar] [CrossRef]
  8. Li, Z.Y.; Ma, Z.W.; van der Kuijp, T.J.; Yuan, Z.W.; Huang, L. A review of soil heavy metal pollution from mines in China: Pollution and health risk assessment. Sci. Total Environ. 2014, 468–469, 843–853. [Google Scholar] [CrossRef]
  9. Turhan, Ş.; Garad, A.M.K.; Hanerlioullar, A.; Kurnaz, A.; Gören, E.; Duran, C.; Karataşlı, M.; Altıkulaç, A.; Savacı, G.; Aydın, A. Ecological assessment of heavy metals in soil around a coal-fired thermal power plant in Turkey. Environ. Earth Sci. 2020, 79, 134. [Google Scholar] [CrossRef]
  10. Liu, X.; Bai, Z.; Shi, H.; Zhou, W.; Liu, X. Heavy metal pollution of soils from coal mines in China. Nat. Hazards 2019, 99, 1163–1177. [Google Scholar] [CrossRef]
  11. Zhuang, P.; McBride, M.B.; Xia, H.; Li, N.; Li, Z. Health risk from heavy metals via consumption of food crops in the vicinity of Dabaoshan mine, South China. Sci. Total Environ. 2009, 407, 1551–1561. [Google Scholar] [CrossRef] [PubMed]
  12. Raj, D.; Chowdhury, A.; Maiti, S.K. Ecological risk assessment of mercury and other heavy metals in soils of coal mining area: A case study from the eastern part of a Jharia coal field, India. Hum. Ecol. Risk Assess. Int. J. 2017, 23, 767–787. [Google Scholar] [CrossRef]
  13. Yan, T.; Zhao, W.; Yu, X.; Li, H.; Gao, Z.; Ding, M.; Yue, J. Evaluating heavy metal pollution and potential risk of soil around a coal mining area of Tai’an City, China. Alex. Eng. J. 2022, 61, 2156–2165. [Google Scholar] [CrossRef]
  14. Facchinelli, A.; Sacchi, E.; Mallen, L. Multivariate statistical and GIS-based approach to identify heavy metal sources in soils. Environ. Pollut. 2001, 114, 313–324. [Google Scholar] [CrossRef]
  15. Turan, V. Confident performance of chitosan and pistachio shell biochar on reducing Ni bioavailability in soil and plant plus improved the soil enzymatic activities, antioxidant defense system and nutritional quality of lettuce. Ecotoxicol. Environ. Saf. 2019, 183, 109594. [Google Scholar] [CrossRef] [PubMed]
  16. Turan, V.; Khan, S.A.; Mahmood-ur-Rahman; Iqbal, M.; Ramzani, P.M.A.; Fatima, M. Promoting the productivity and quality of brinjal aligned with heavy metals immobilization in a wastewater irrigated heavy metal polluted soil with biochar and chitosan. Ecotoxicol. Environ. Saf. 2018, 161, 409–419. [Google Scholar] [CrossRef]
  17. Yang, J.; Wang, J.; Qiao, P.; Zheng, Y.; Yang, J.; Chen, T.; Lei, M.; Wan, X.; Zhou, X. Identifying factors that influence soil heavy metals by using categorical regression analysis: A case study in Beijing, China. Front. Environ. Sci. Eng. 2020, 14, 37. [Google Scholar] [CrossRef]
  18. Zhong, X.; Chen, Z.; Li, Y.; Ding, K.; Liu, W.; Liu, Y.; Yuan, Y.; Zhang, M.; Baker, A.J.M.; Yang, W.; et al. Factors influencing heavy metal availability and risk assessment of soils at typical metal mines in Eastern China. J. Hazard. Mater. 2020, 400, 123289. [Google Scholar] [CrossRef]
  19. Penido, E.S.; Martins, G.C.; Mendes, T.B.M.; Melo, L.C.A.; do Rosário Guimarães, I.; Guilherme, L.R.G. Combining biochar and sewage sludge for immobilization of heavy metals in mining soils. Ecotoxicol. Environ. Saf. 2019, 172, 326–333. [Google Scholar] [CrossRef]
  20. Luo, C.; Routh, J.; Dario, M.; Sarkar, S.; Wei, L.; Luo, D.; Liu, Y. Distribution and mobilization of heavy metals at an acid mine drainage affected region in South China, a post-remediation study. Sci. Total Environ. 2020, 724, 138122. [Google Scholar] [CrossRef]
  21. Dubé, J.-S.; Galvez-Cloutier, R. Applications of data on the mobility of heavy metals in contaminated soil to the definition of site-specific remediation criteria. J. Environ. Eng. Sci. 2005, 4, 399–411. [Google Scholar] [CrossRef]
  22. Karaca, O.; Cameselle, C.; Reddy, K.R. Mine tailing disposal sites: Contamination problems, remedial options and phytocaps for sustainable remediation. Rev. Environ. Sci. Bio/Technol. 2017, 17, 205–228. [Google Scholar] [CrossRef]
  23. Zeng, Q.; Dong, J.; Zhao, L. Investigation of the potential risk of coal fire to local environment: A case study of Daquanhu coal fire, Xinjiang region, China. Sci. Total Environ. 2018, 640–641, 1478–1488. [Google Scholar] [CrossRef] [PubMed]
  24. Liu, X.; Shi, H.; Bai, Z.; Zhou, W.; Liu, K.; Wang, M.; He, Y. Heavy metal concentrations of soils near the large opencast coal mine pits in China. Chemosphere 2019, 244, 125360. [Google Scholar] [CrossRef] [PubMed]
  25. Mazurek, R.; Kowalska, J.; Gąsiorek, M.; Zadrożny, P.; Józefowska, A.; Zaleski, T.; Kępka, W.; Tymczuk, M.; Orłowska, K. Assessment of heavy metals contamination in surface layers of Roztocze National Park forest soils (SE Poland) by indices of pollution. Chemosphere 2017, 168, 839–850. [Google Scholar] [CrossRef]
  26. De Reu, J.; Bourgeois, J.; Bats, M.; Zwertvaegher, A.; Gelorini, V.; De Smedt, P.; Chu, W.; Antrop, M.; De Maeyer, P.; Finke, P.; et al. Application of the topographic position index to heterogeneous landscapes. Geomorphology 2013, 186, 39–49. [Google Scholar] [CrossRef]
  27. Ke, X.; Gui, S.; Huang, H.; Zhang, H.; Wang, C.; Guo, W. Ecological risk assessment and source identification for heavy metals in surface sediment from the Liaohe River protected area, China. Chemosphere 2017, 175, 473–481. [Google Scholar] [CrossRef] [PubMed]
  28. Turan, V. Calcite in combination with olive pulp biochar reduces Ni mobility in soil and its distribution in chili plant. Int. J. Phytoremediat. 2021, 24, 166–176. [Google Scholar] [CrossRef]
  29. Pandey, B.; Mukherjee, A.; Agrawal, M.; Singh, S. Assessment of Seasonal and Site-Specific Variations in Soil Physical, Chemical and Biological Properties Around Opencast Coal Mines. Pedosphere 2019, 29, 642–655. [Google Scholar] [CrossRef]
  30. Lv, J.; Liu, Y.; Zhang, Z.; Dai, J. Factorial kriging and stepwise regression approach to identify environmental factors influencing spatial multi-scale variability of heavy metals in soils. J. Hazard. Mater. 2013, 261, 387–397. [Google Scholar] [CrossRef]
  31. Ding, Q.; Cheng, G.; Wang, Y.; Zhuang, D. Effects of natural factors on the spatial distribution of heavy metals in soils surrounding mining regions. Sci. Total Environ. 2017, 578, 577–585. [Google Scholar] [CrossRef] [PubMed]
  32. Rasool, B.; Mahmood-ur-Rahman; Zubair, M.; Khan, M.A.; Ramzani, P.M.A.; Dradrach, A.; Turan, V.; Iqbal, M.; Khan, S.A.; Tauqeer, H.M.; et al. Synergetic Efficacy of Amending Pb-Polluted Soil with P-Loaded Jujube (Ziziphus mauritiana) Twigs Biochar and Foliar Chitosan Application for Reducing Pb Distribution in Moringa Leaf Extract and Improving Its Anti-cancer Potential. Water Air Soil Pollut. 2022, 233, 344. [Google Scholar] [CrossRef]
  33. Turan, V. Arbuscular mycorrhizal fungi and pistachio husk biochar combination reduces Ni distribution in mungbean plant and improves plant antioxidants and soil enzymes. Physiol. Plant. 2021, 173, 418–429. [Google Scholar] [CrossRef]
  34. Huang, B.; Yuan, Z.; Li, D.; Zheng, M.; Nie, X.; Liao, Y. Effects of soil particle size on the adsorption, distribution, and migration behaviors of heavy metal(loid)s in soil: A review. Environ. Sci. Process. Impacts 2020, 22, 1596–1615. [Google Scholar] [CrossRef] [PubMed]
  35. Zhou, D.-m.; Hao, X.-z.; Tu, C.; Chen, H.-m.; Si, Y.-b. Speciation and fractionation of heavy metals in soil experimentally contaminated with Pb, Cd, Cu and Zn together and effects on soil negative surface charge. J. Environ. Sci. 2002, 14, 439–444. [Google Scholar] [CrossRef]
  36. Ai, S.; Liu, B.; Yang, Y.; Ding, J.; Yang, W.; Bai, X.; Naeem, S.; Zhang, Y. Temporal variations and spatial distributions of heavy metals in a wastewater-irrigated soil-eggplant system and associated influencing factors. Ecotoxicol. Environ. Saf. 2018, 153, 204–214. [Google Scholar] [CrossRef]
  37. You, M.; Huang, Y.; Lu, J.; Li, C. Fractionation characterizations and environmental implications of heavy metal in soil from coal mine in Huainan, China. Environ. Earth Sci. 2015, 75, 78. [Google Scholar] [CrossRef]
  38. Jiang, Y.; Gao, W.-W.; Zhao, J.-L.; Chen, Q.; Liang, N.; Xu, C.; Huang, L.-S.; Ruan, L.-M. Analysis of influencing factors on soil Zn content using generalized additive model. Sci. Rep. 2018, 8, 15567. [Google Scholar] [CrossRef] [Green Version]
  39. Li, X.; Yang, X.; Gong, L. Evaluating the influencing factors of urbanization in the Xinjiang Uygur Autonomous Region over the past 27 years based on VIIRS-DNB and DMSP/OLS nightlight imageries. PLoS ONE 2020, 15, e0235903. [Google Scholar] [CrossRef]
  40. Zeng, Q.; Nie, J.; Pu, Y. Characteristics of the distribution of typical heavy metals in the soils of underground coal fire. J. China Coal Soc. 2016, 41, 1989–1996. (In Chinese) [Google Scholar] [CrossRef]
Figure 1. Schematic diagram of the sampling points in the study area.
Minerals 12 01332 g001
Figure 2. A descriptive diagram of the physical and chemical properties of the soil.
Minerals 12 01332 g002
Figure 3. Spatial distribution of the physical and chemical properties of the soil.
Minerals 12 01332 g003
Figure 4. Spatial distribution of the heavy metal content in the soil.
Minerals 12 01332 g004
Figure 5. Correlation between the physical and chemical properties and the heavy metal content of the soil.
Minerals 12 01332 g005
Figure 6. Different factors’ influence (A) and contribution (B) to heavy metal content in soil.
Minerals 12 01332 g006
Table 1. Classification criteria of soil metal pollution indices.
Nemerow Comprehensive Pollution IndexGeo-Accumulation IndexPotential Ecological Risk Index
PiLevelPNLevelIgeoGradingLevelEirLevelRILevel
Pi ≤ 1Clean0 < PN ≤ 0.7CleanlyIgeo ≤ 00Unpolluted0 < Eir < 40Low0 < RI ≤ 150Low
1 < Pi ≤ 2Slightly0.7 < PN ≤ 1.0Cordon0 < Igeo ≤ 11Unpolluted to moderately polluted40 < Eir ≤ 80Medium-low150 < RI ≤ 300Medium
2 < Pi ≤3Moderately1.0 < PN ≤ 2.0Slightly1 < Igeo ≤ 22Moderately polluted80 < Eir ≤ 160Medium300 < RI ≤ 600Medium-high
Pi > 3Seriously2.0 < PN ≤ 3.0Moderately2 < Igeo ≤ 33Moderately to strongly polluted160 < Eir ≤ 320Medium-high600 < RIHigh
3.0 < PNSeriously3 < Igeo ≤ 44Strongly polluted320 < EirHigh
4 < Igeo ≤ 55Strongly to extremely strongly polluted
5 < Igeo6Extremely polluted
Table 2. Descriptive statistics of the soil heavy metal content in the study area.
ElementAreaThicknessMinimumMaximumMeanSDCV (%)BVIVESRA-ESR
CuA0–10 cm12.4438.2320.1511.515726.70353311
10–20 cm12.4325.3018.405.72310
20–30 cm8.5033.9717.4811.12640
B0–10 cm68.45146.00101.7232.0131100100
10–20 cm72.43141.86102.5932.2831100
20–30 cm71.93162.36111.0138.8535100
C0–10 cm29.4785.4257.6029.96524073
10–20 cm42.4664.9753.3912.6124100
20–30 cm12.4881.3452.3232.826380
MnA0–10 cm1447.372746.362153.98523.4024688.00No100100
10–20 cm1832.842895.832310.62380.6916100
20–30 cm1724.782224.781952.67196.1810100
B0–10 cm2534.502771.142623.6090.163100100
10–20 cm2474.533127.872737.95265.1510100
20–30 cm2354.522949.152633.19250.3710100
C0–10 cm2743.763474.033033.45310.6010100100
10–20 cm2821.574626.873703.94751.6220100
20–30 cm2721.563901.603141.55520.2217100
ZnA0–10 cm67.37106.9783.1117.962268.8010072
10–20 cm35.9390.4669.5120.45290
20–30 cm36.4667.2755.1313.32240
B0–10 cm80.00173.65121.0237.74316755
10–20 cm79.92126.8799.2017.681833
20–30 cm71.43105.7992.7116.90666
C0–10 cm98.00111.39103.206.14576060
10–20 cm17.45153.35106.3960.666280
20–30 cm45.91195.80103.2664.523240
AsA0–10 cm15.1632.8422.337.212011.201510094
10–20 cm10.9926.9418.516.622083
20–30 cm22.1237.4229.456.0046100
B0–10 cm15.1026.7220.894.151010094
10–20 cm7.2335.5622.8610.574283
20–30 cm16.6321.2018.211.7710100
C0–10 cm16.5342.1826.5411.154210093
10–20 cm18.4223.6421.302.1610100
20–30 cm14.2724.4519.284.182280
CdA0–10 cm0.371.090.750.28370.120.2100100
10–20 cm0.651.020.880.1416100
20–30 cm0.741.330.910.2527100
B0–10 cm0.761.141.040.1615100100
10–20 cm0.951.241.080.1110100
20–30 cm1.121.481.280.1411100
C0–10 cm0.421.241.000.3939100100
10–20 cm0.882.121.290.5744100
20–30 cm0.941.371.210.1815100
(Note: Unit, mg/kg; SD, Standard Deviation; CV, Coefficient of Variation; BV, Xinjiang Soil Element Background Value; IV, China Soil Environmental Quality (GB 15618-1995) Class I Standard Value; ESR, Exceeding Standard Rate; and A-ESR, Average Exceeding Standard Rate of the three soil layers.)
Table 3. Soil pollution levels of heavy metals.
CuMnZnAsCd
IndexAreaValueLevelValueLevelValueLevelValueLevelValueLevel
PNA1.00Slightly3.78Seriously1.11Slightly2.49Moderately7.54Seriously
B2.47Moderately4.97Seriously1.82Slightly2.14Moderately11.21Seriously
C4.78Seriously4.05Seriously1.63Slightly2.04Moderately9.86Seriously
Average2.75Moderately4.26Seriously1.52Slightly2.22Moderately9.54Seriously
IgeoA−2.21Unpolluted0.12Unpolluted to moderately polluted−1.54Unpolluted−0.47Unpolluted1.12Moderately polluted
B0.86Unpolluted to moderately polluted0.65Unpolluted to moderately polluted−1.02Unpolluted−0.73Unpolluted1.56Moderately polluted
C0.26Unpolluted to moderately polluted0.37Unpolluted to moderately polluted−0.98Unpolluted−0.70Unpolluted1.64Moderately polluted
Average−0.36Unpolluted to moderately polluted0.38Unpolluted to moderately polluted−1.18Unpolluted−0.63Unpolluted1.44Moderately polluted
EirA21.55Low19.75Low6.21Low131.29Medium1200.81High
B49.00Medium-low23.63Low7.73Low92.56Medium1364.64High
C112.78Medium23.27Low9.19Low112.19Medium1685.65High
Sum183.33Medium-high66.65Medium-low23.13Low336.03High4251.10High
Publisher’s Note: MDPI stays neutral with regard to jurisdictional claims in published maps and institutional affiliations.

