
Influences of Inclined Pre-Existing Flaw on Shale Failure Modes in Uniaxial Compression Tests


Abstract
:1. Introduction
2. Experiments Setup
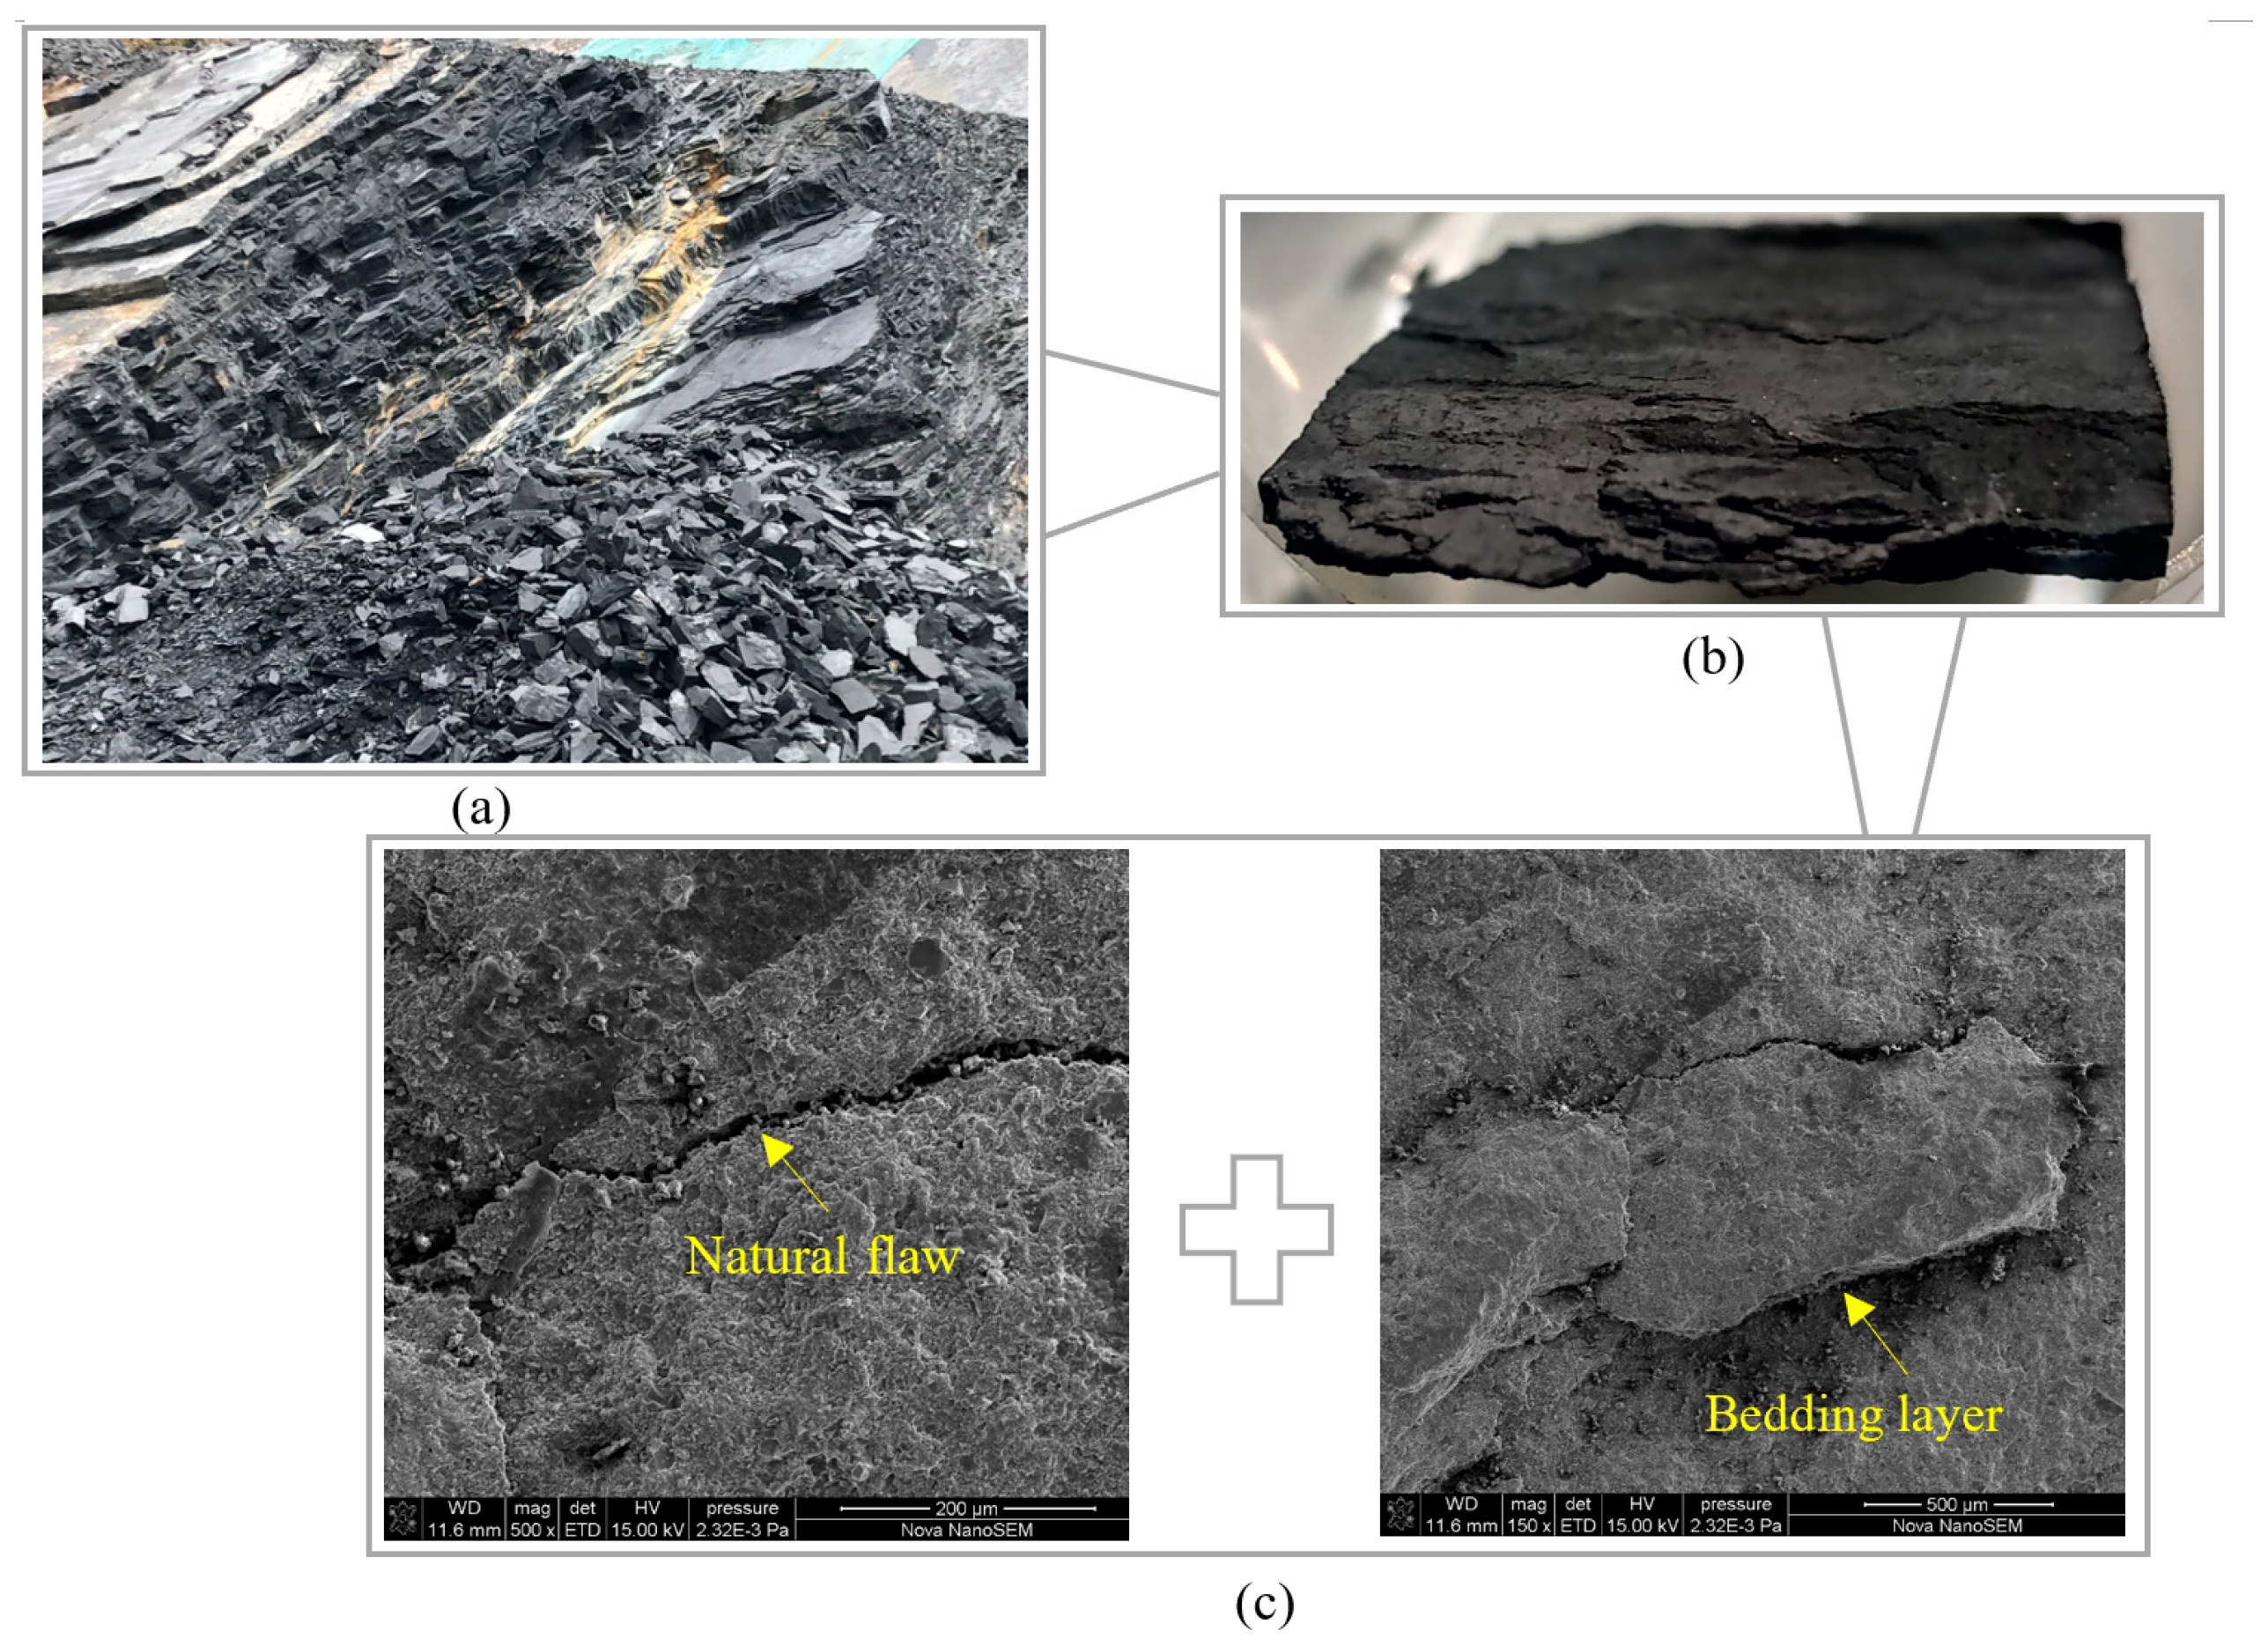
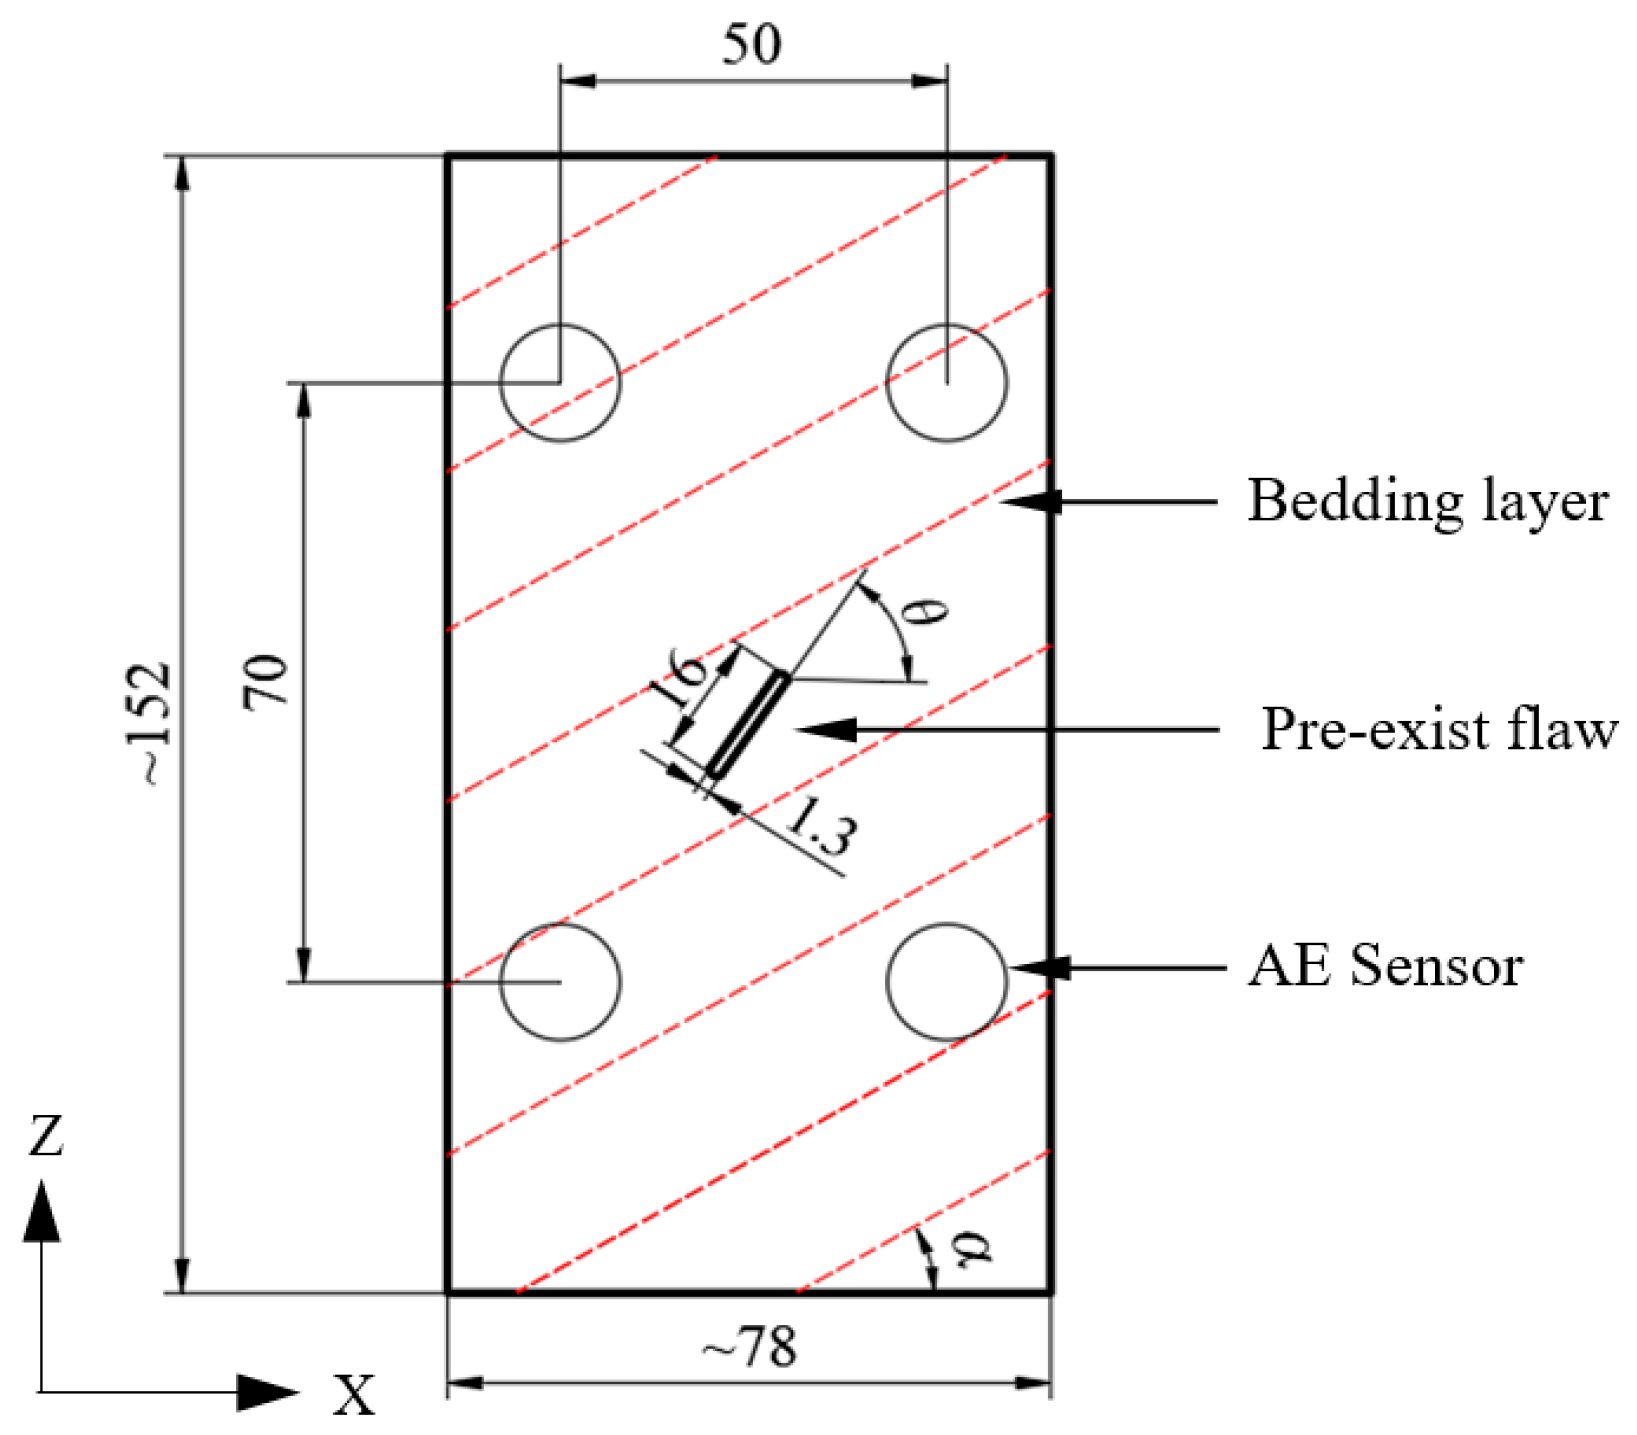
2.1. Shale Specimen
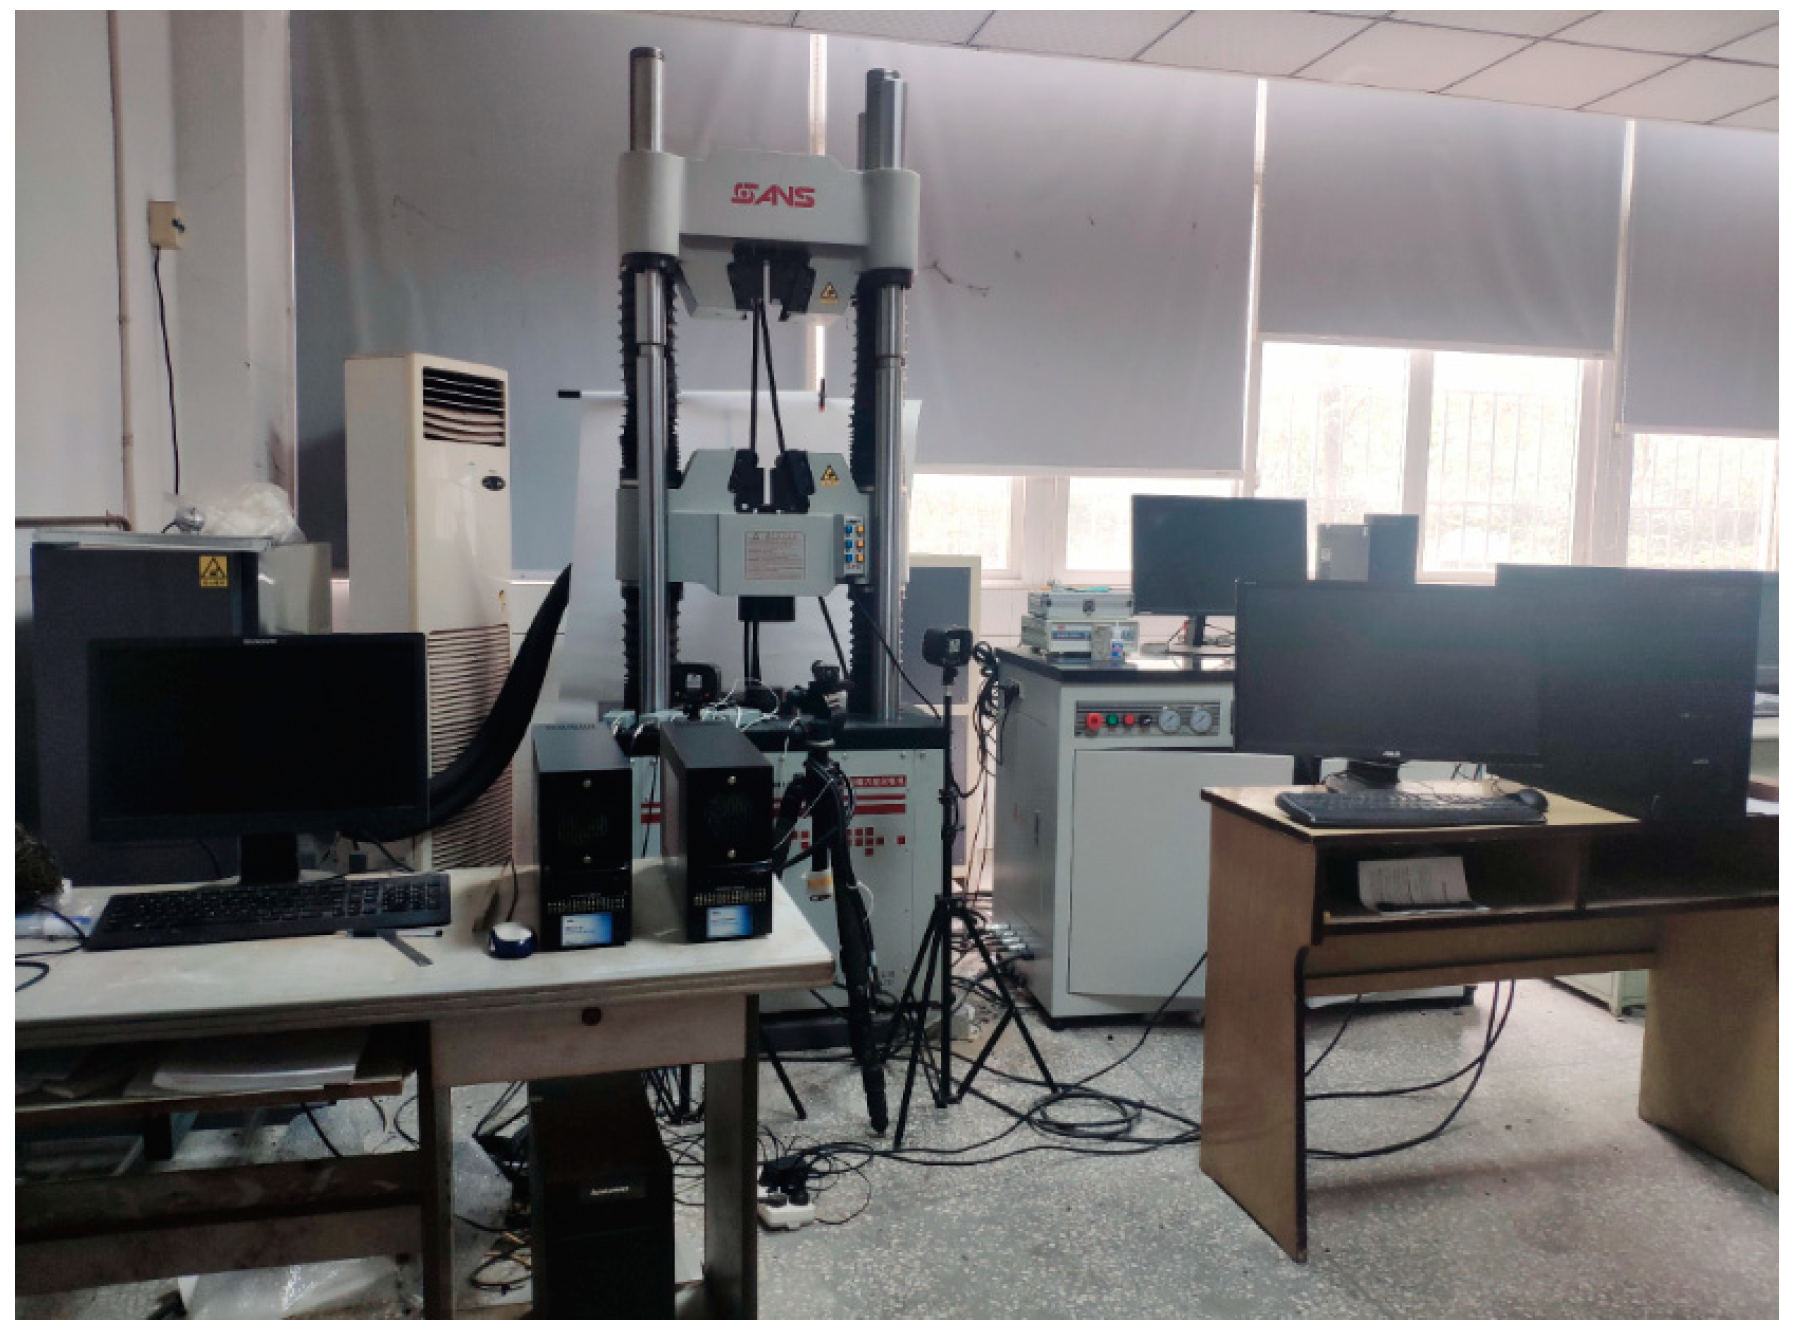
2.2. Equipment
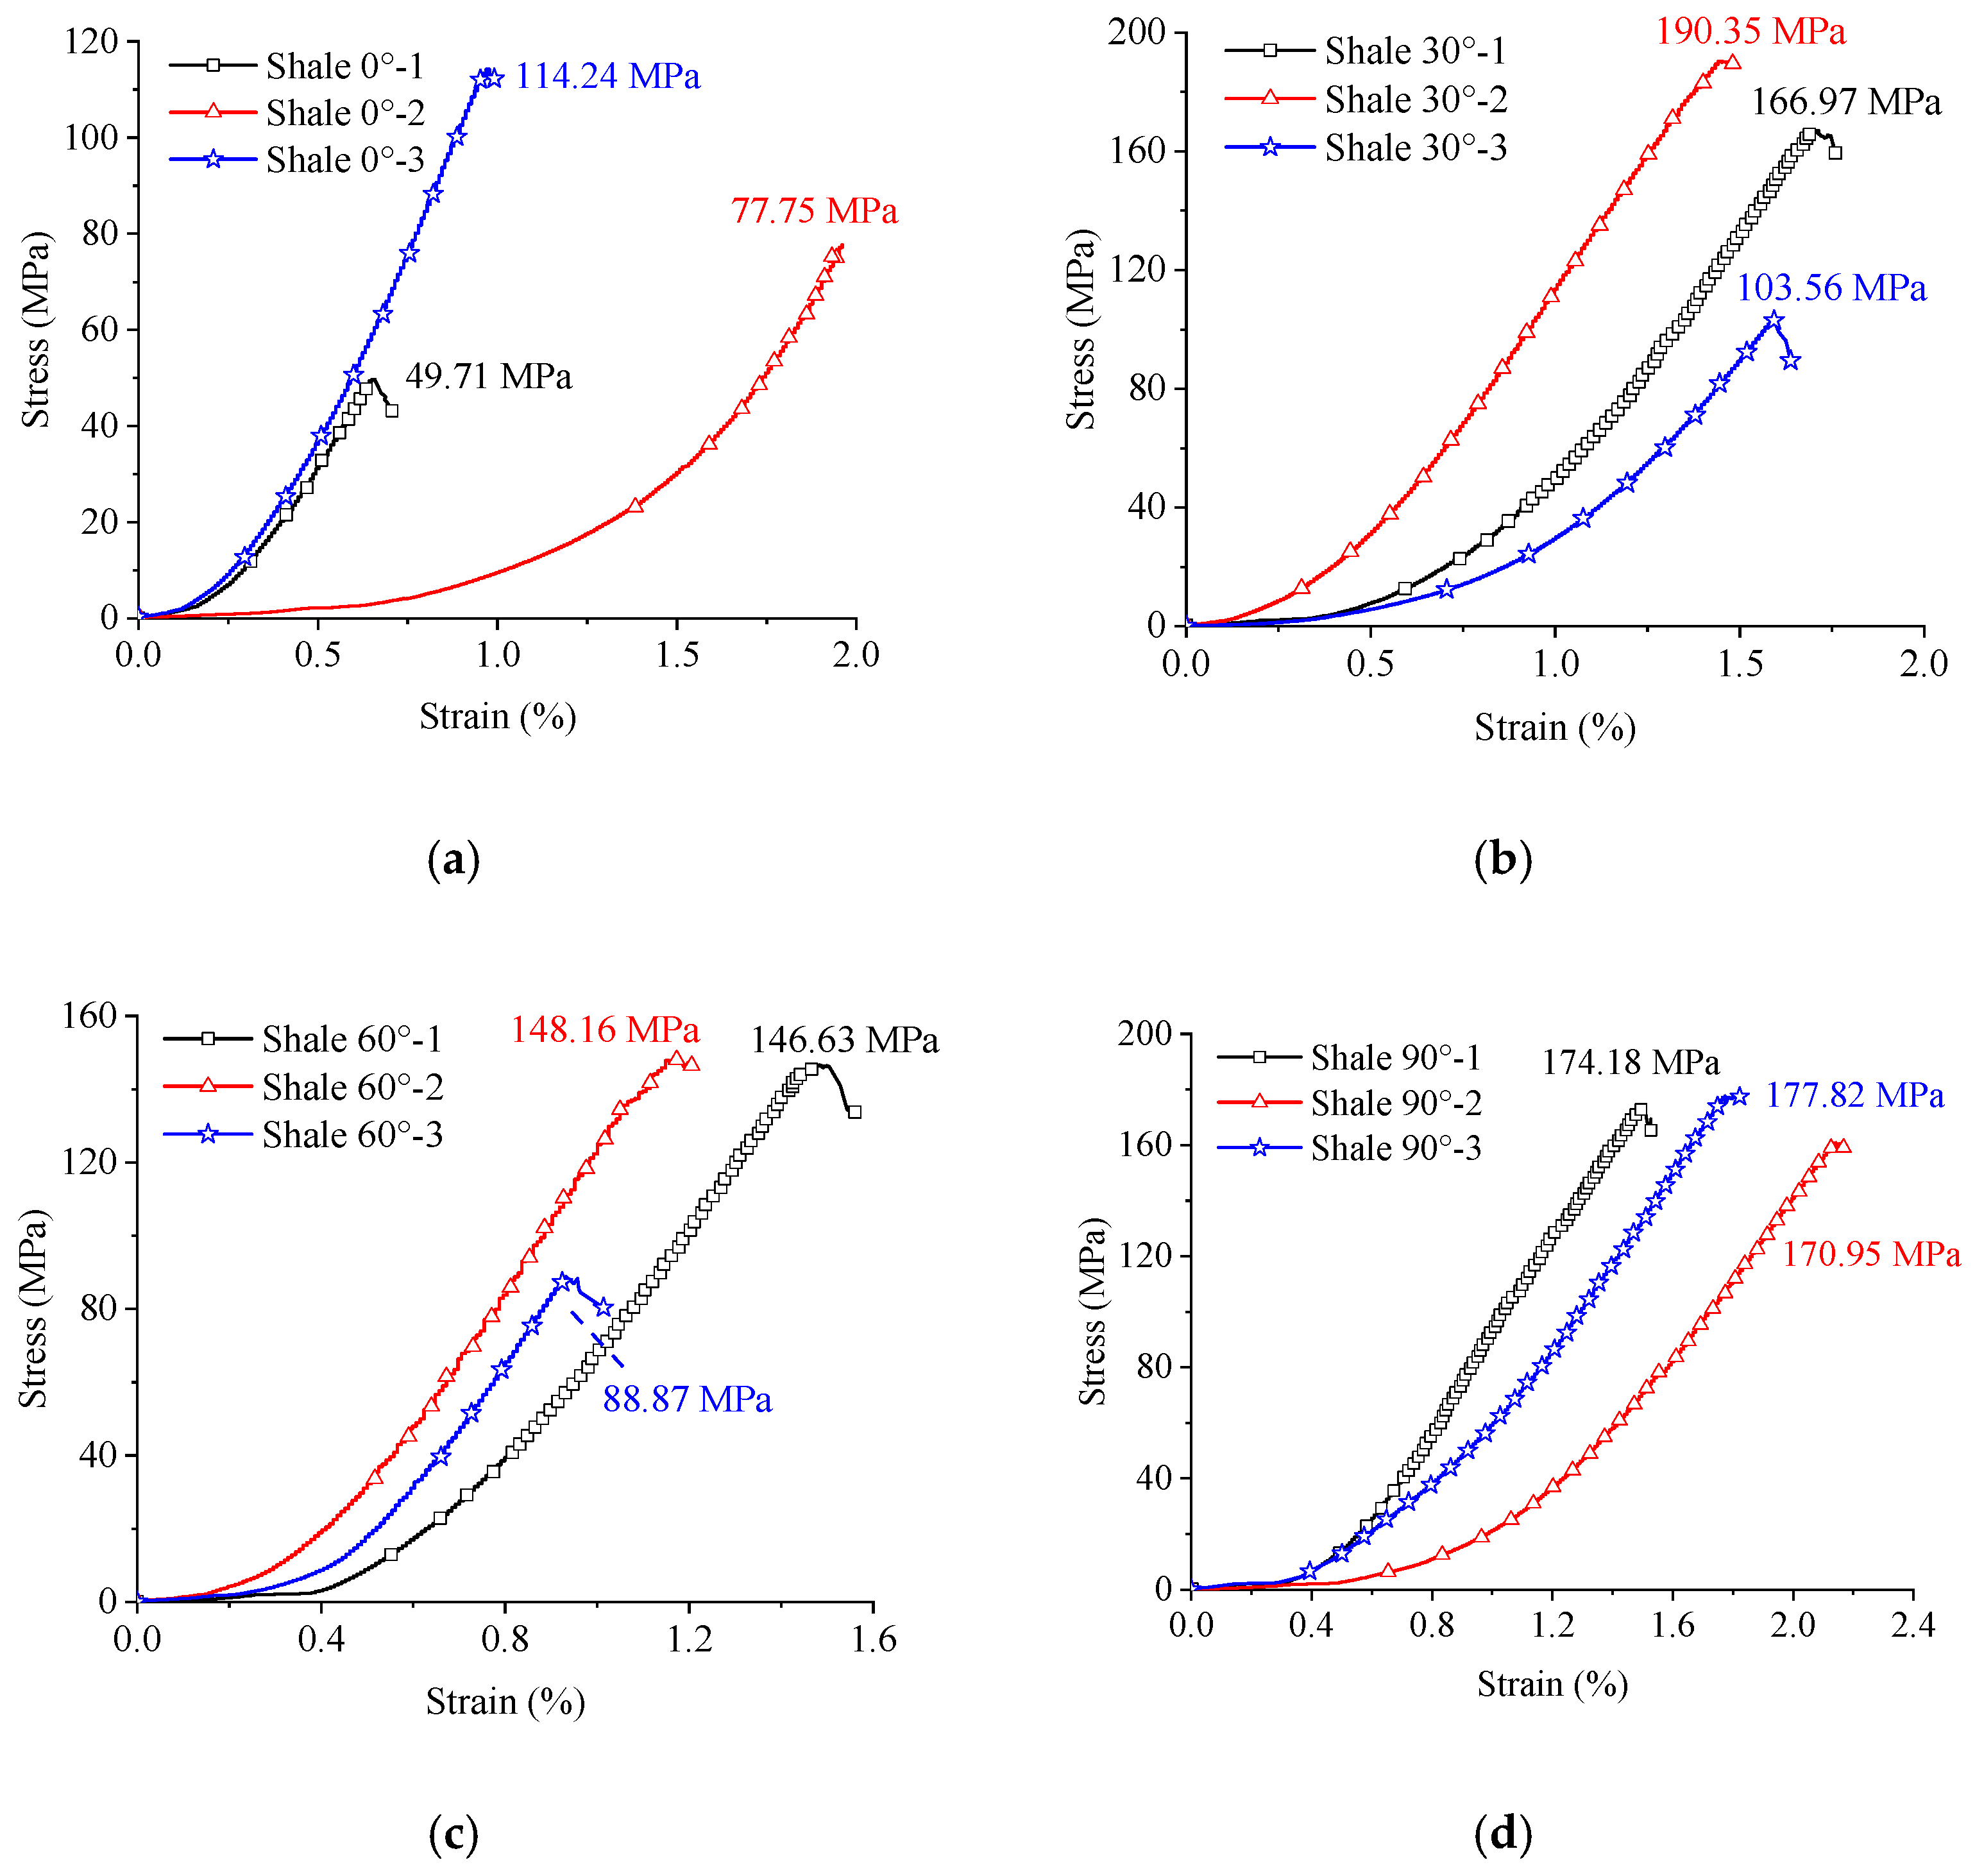
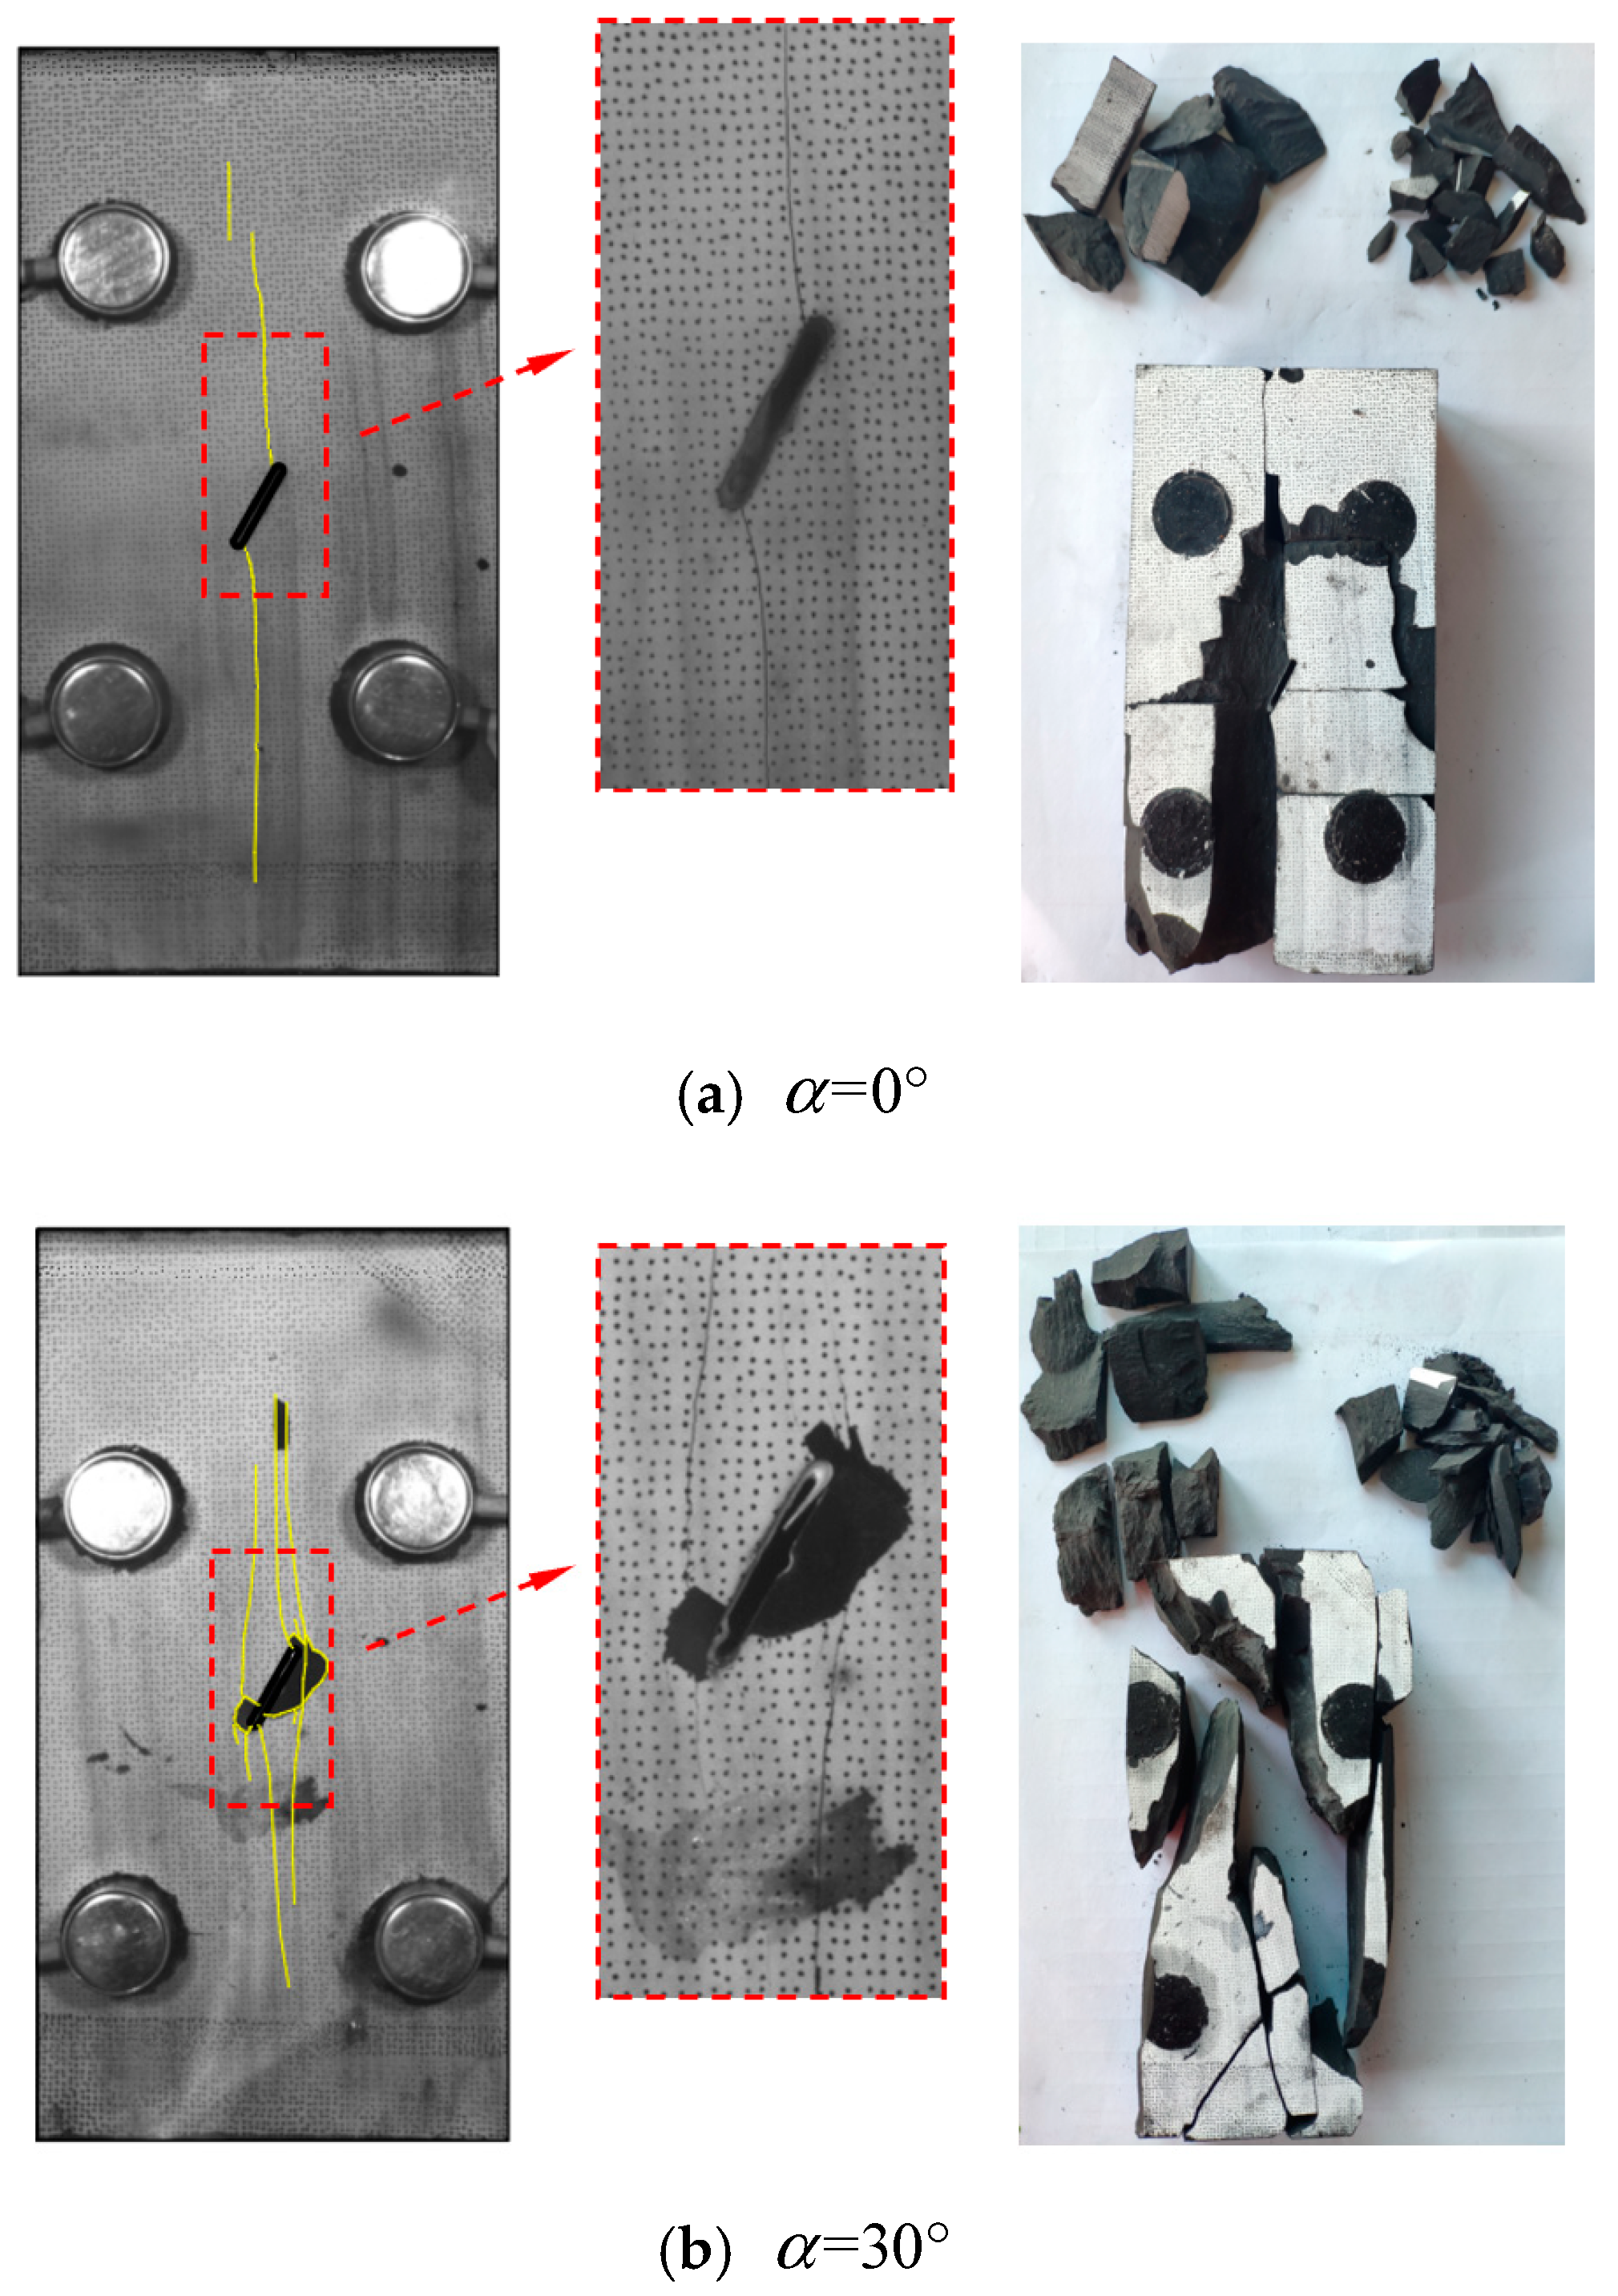
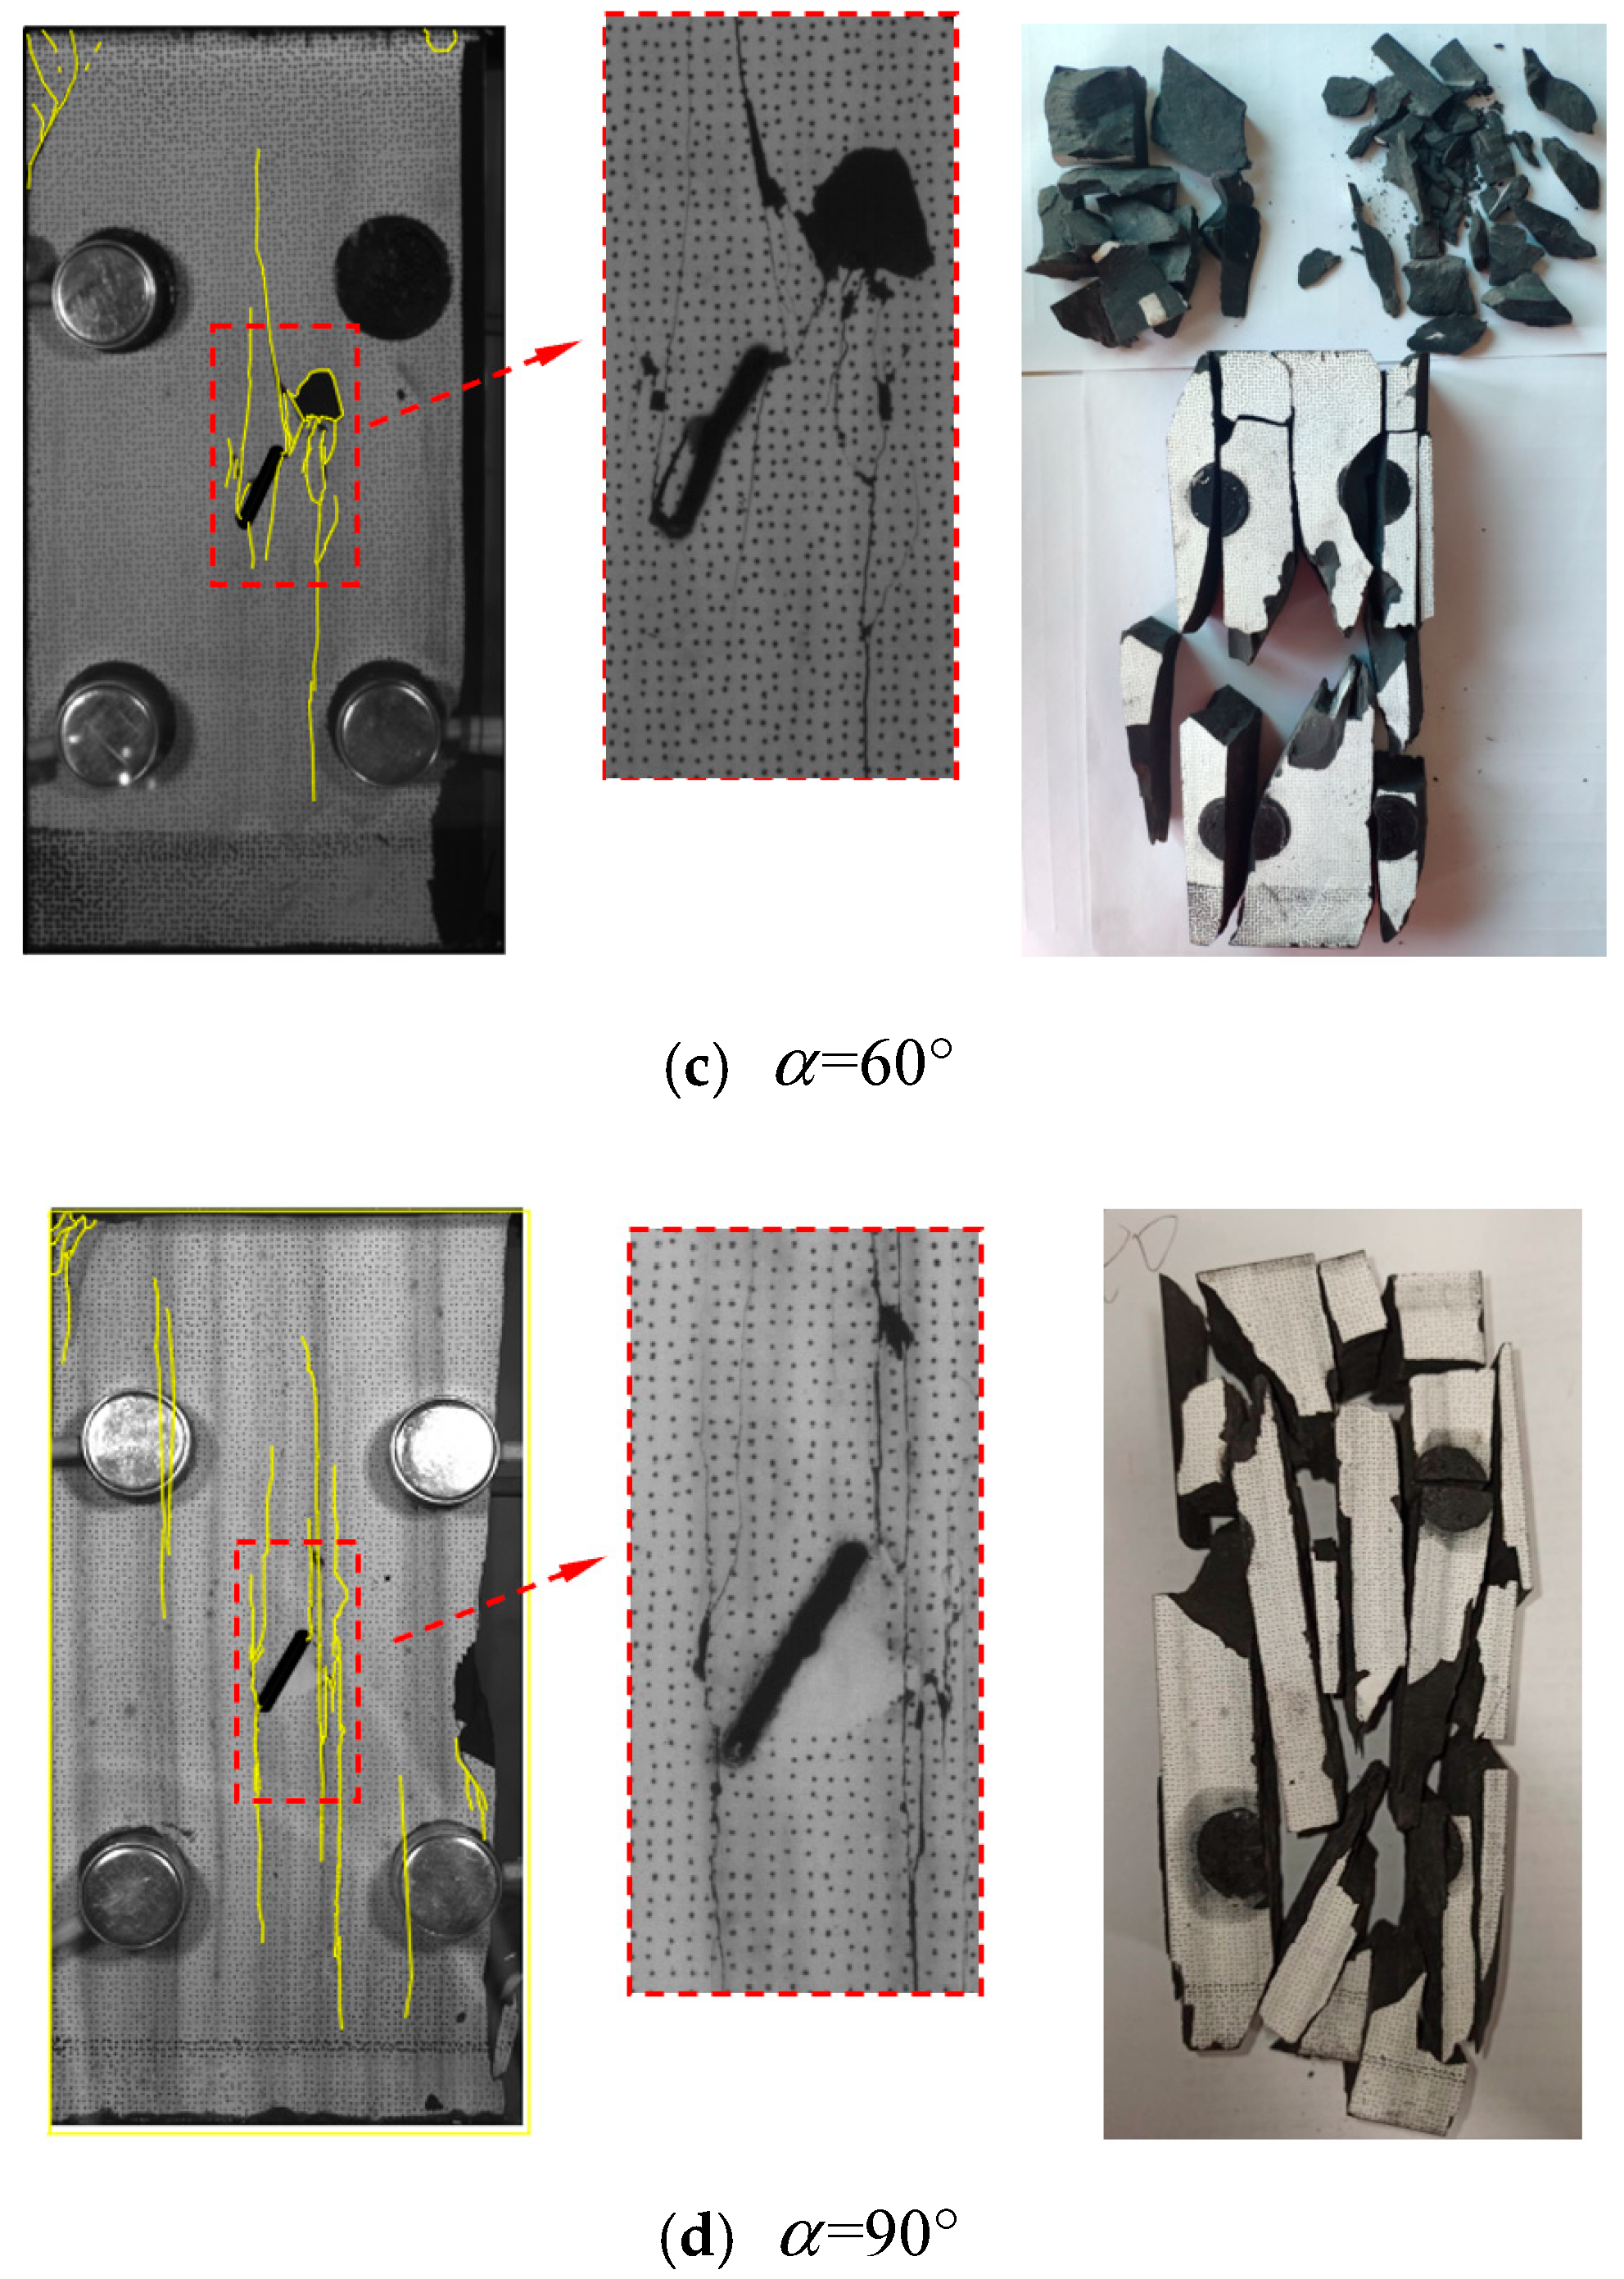
3. Test Results
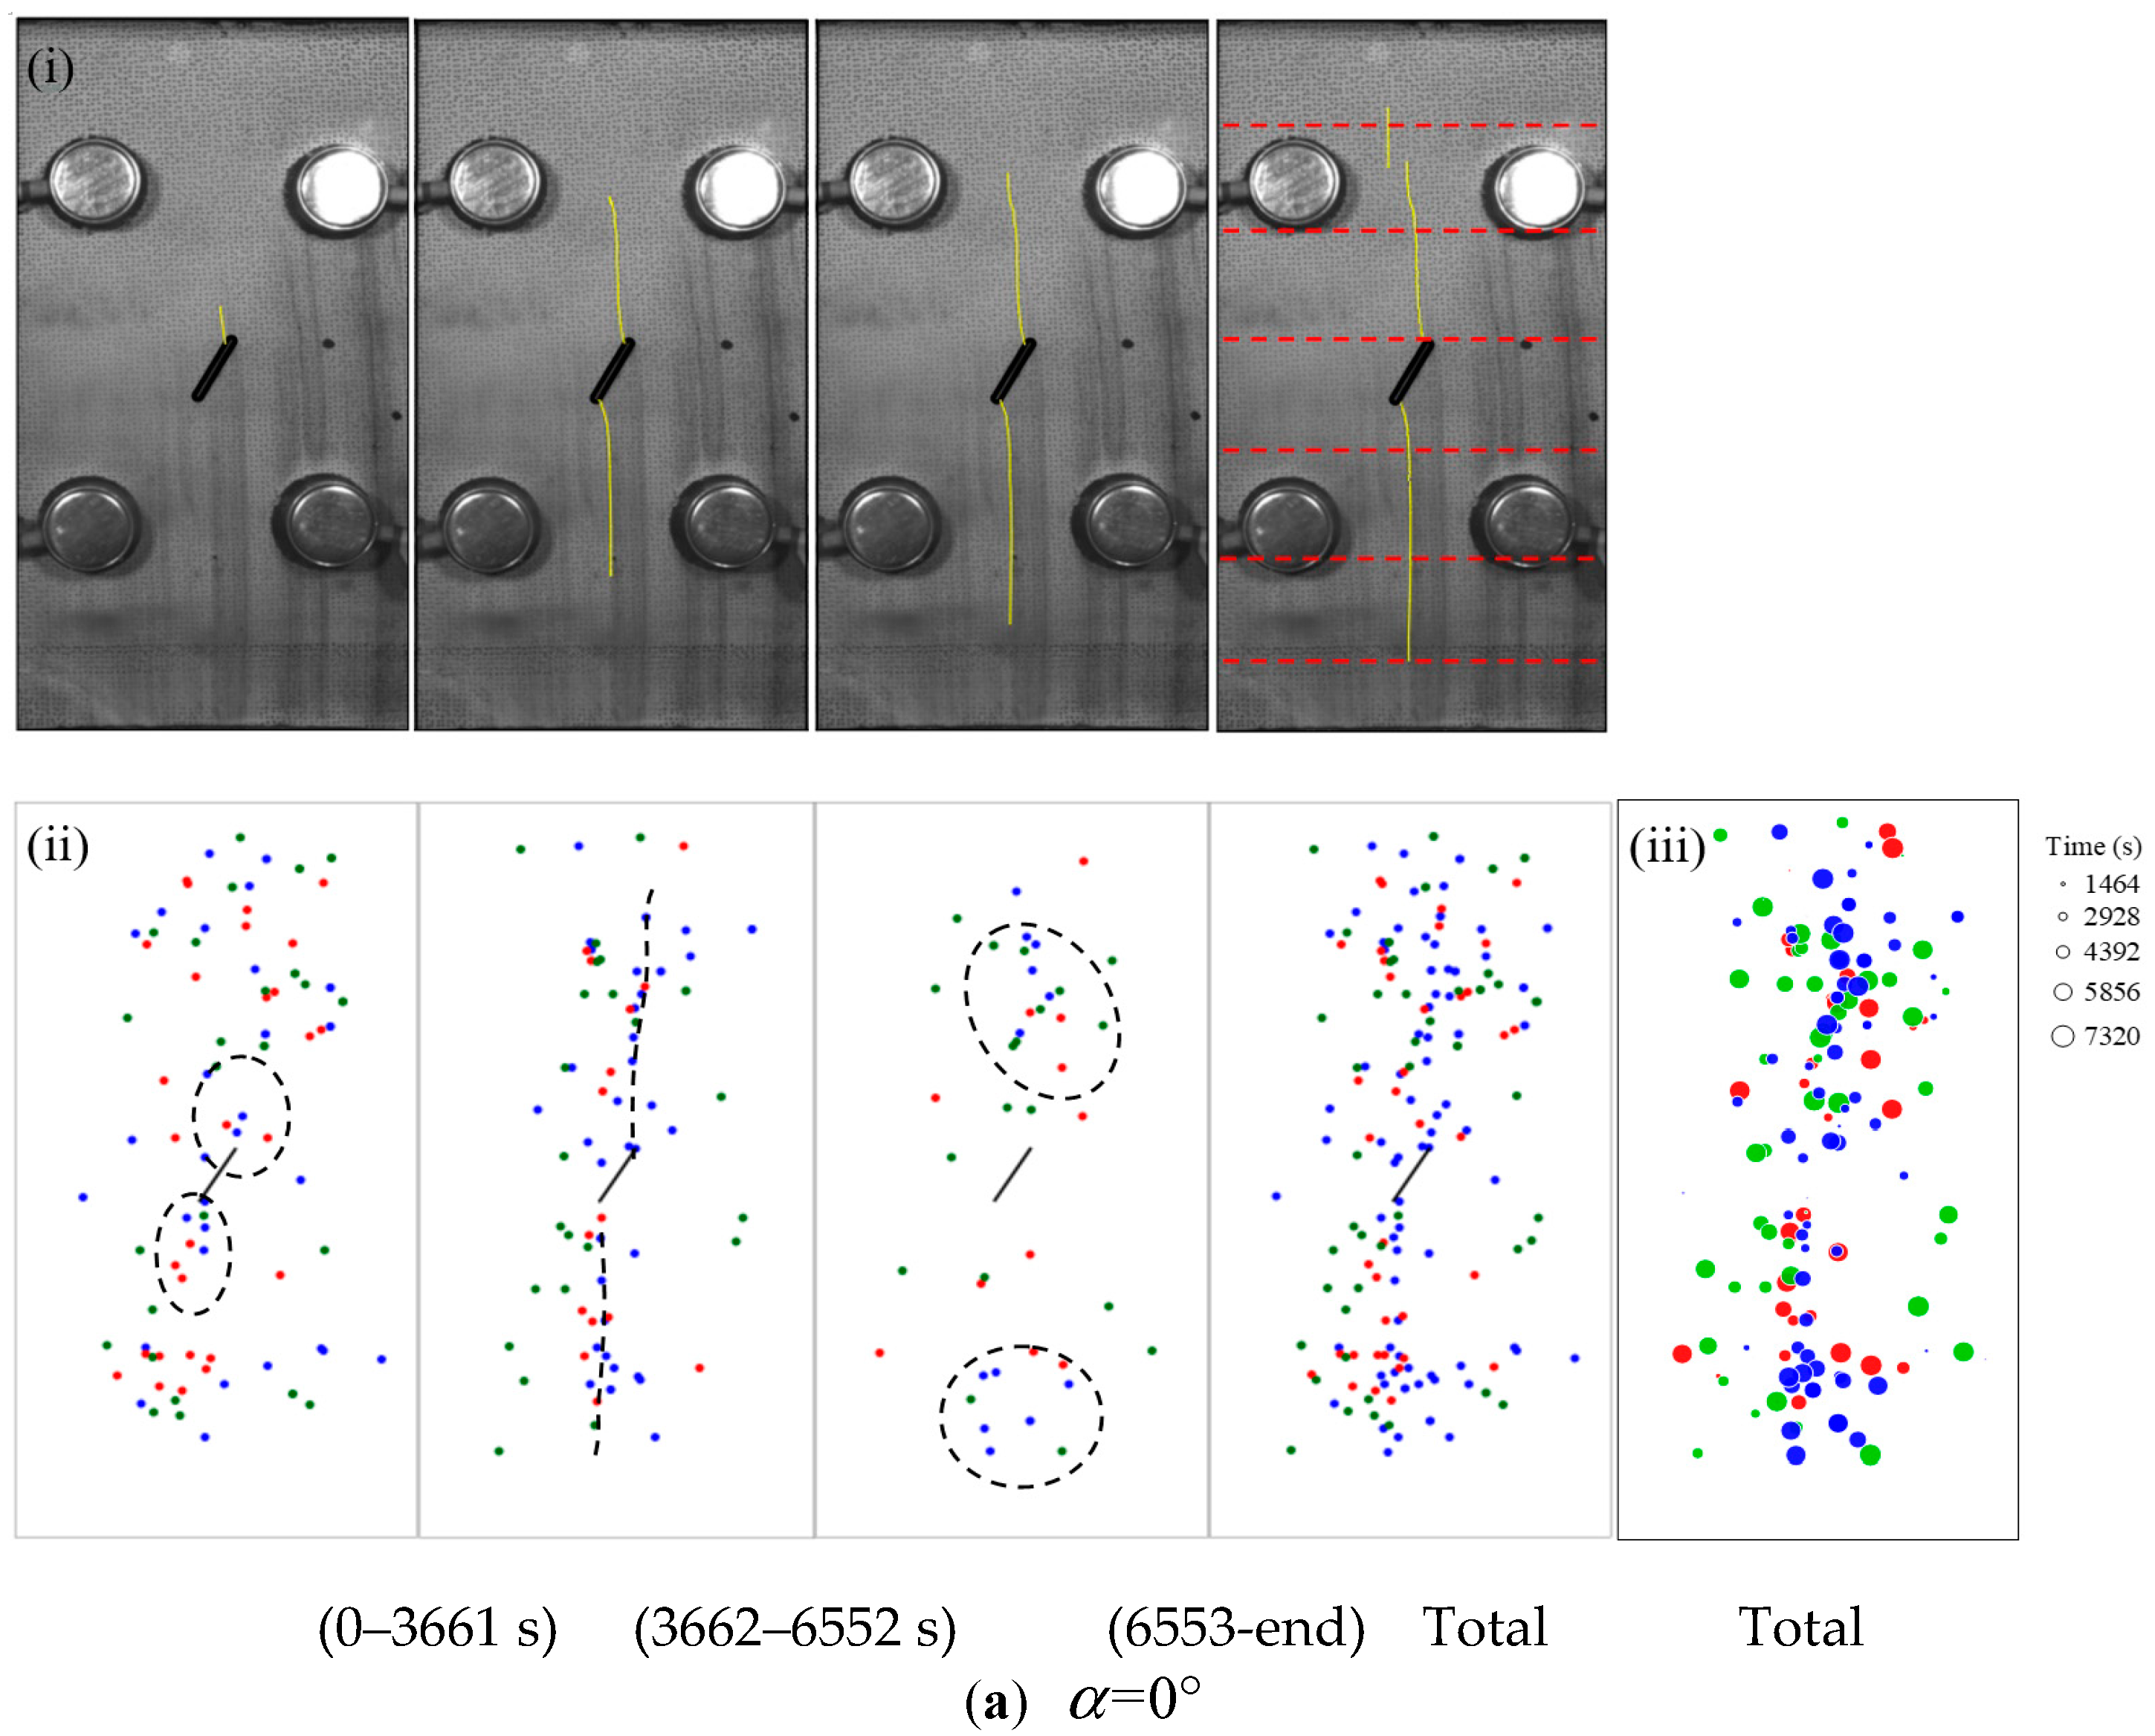
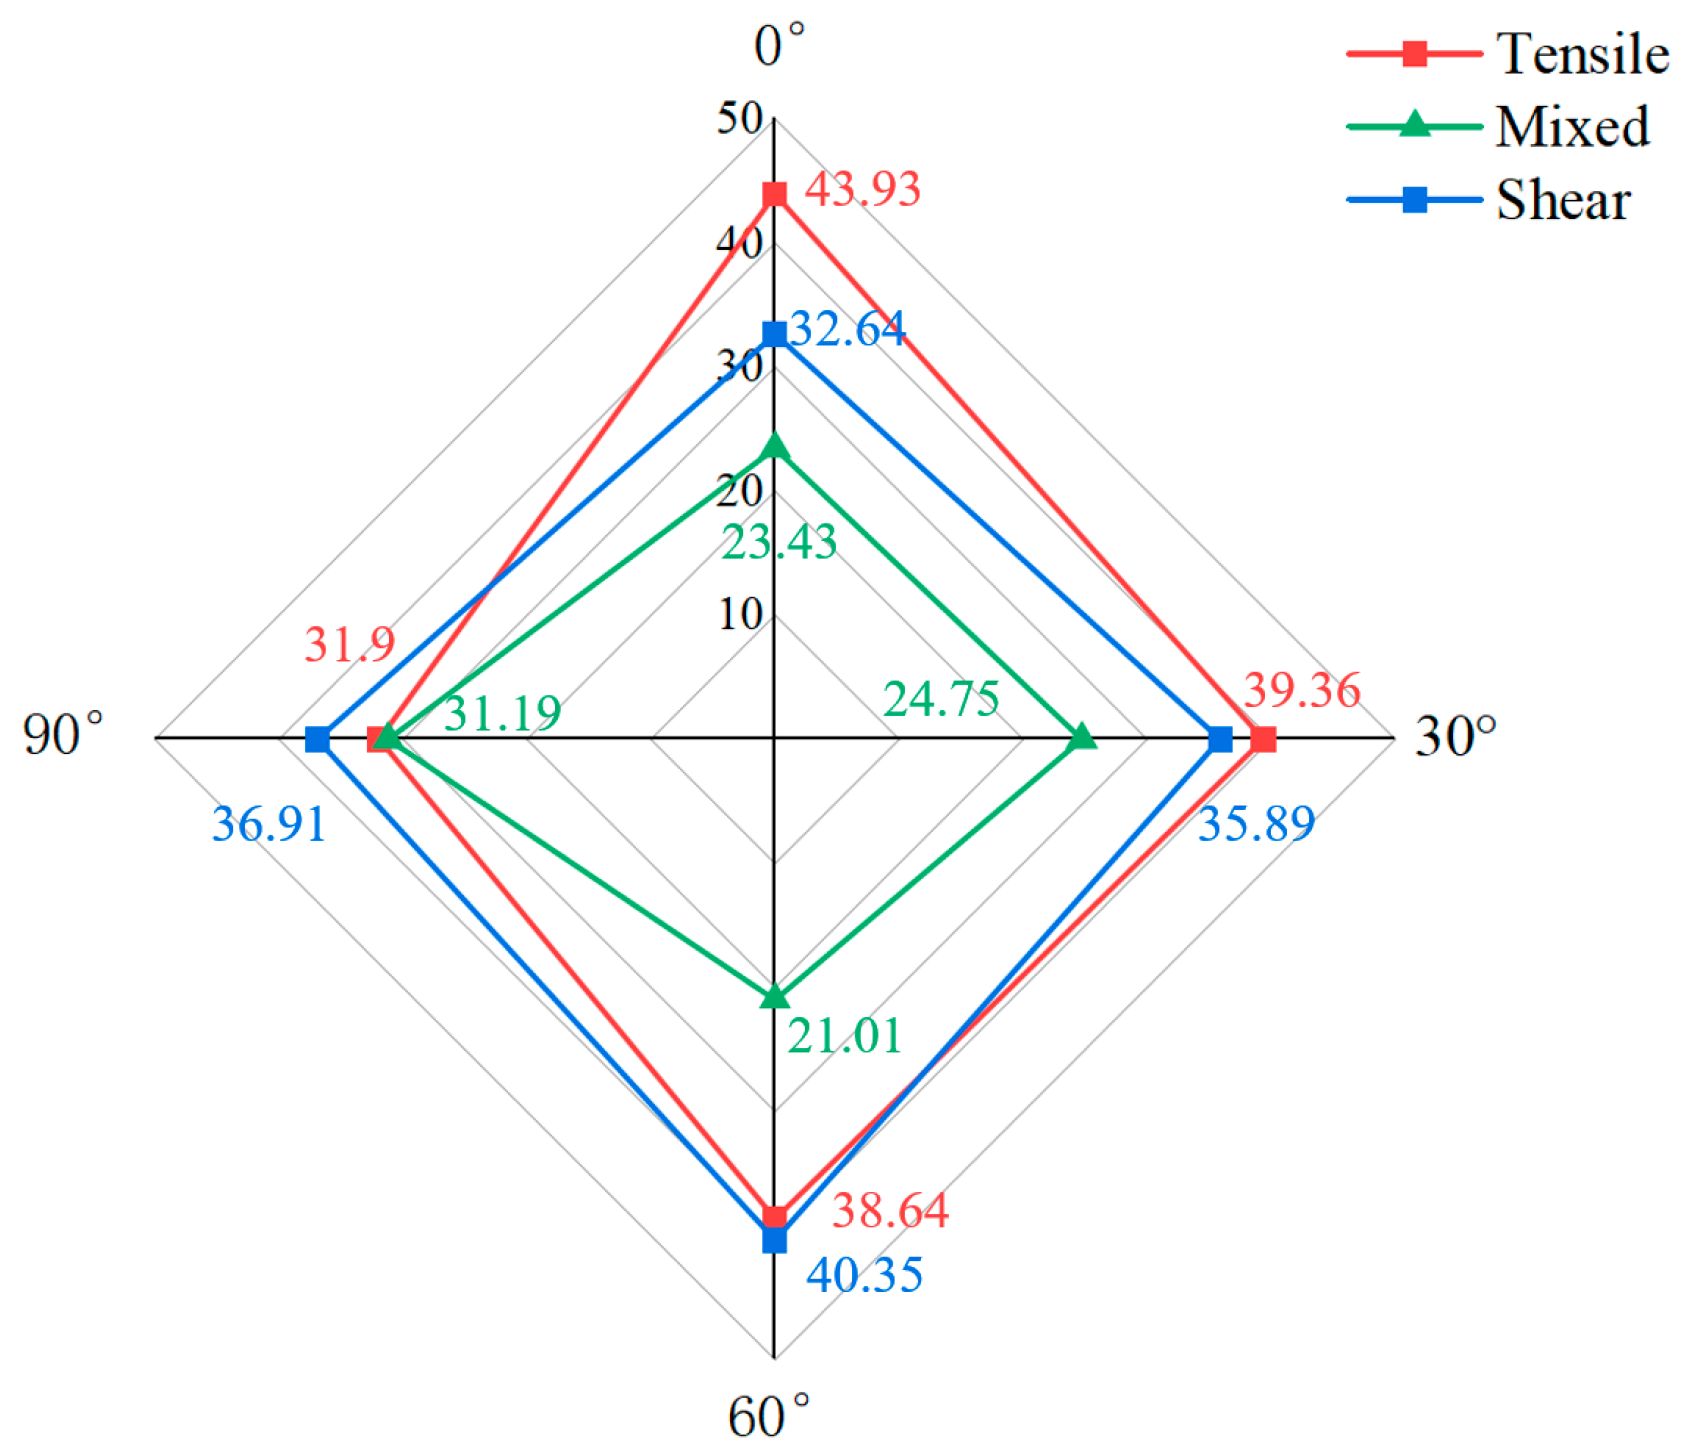
4. Evaluation of the Cracking Process
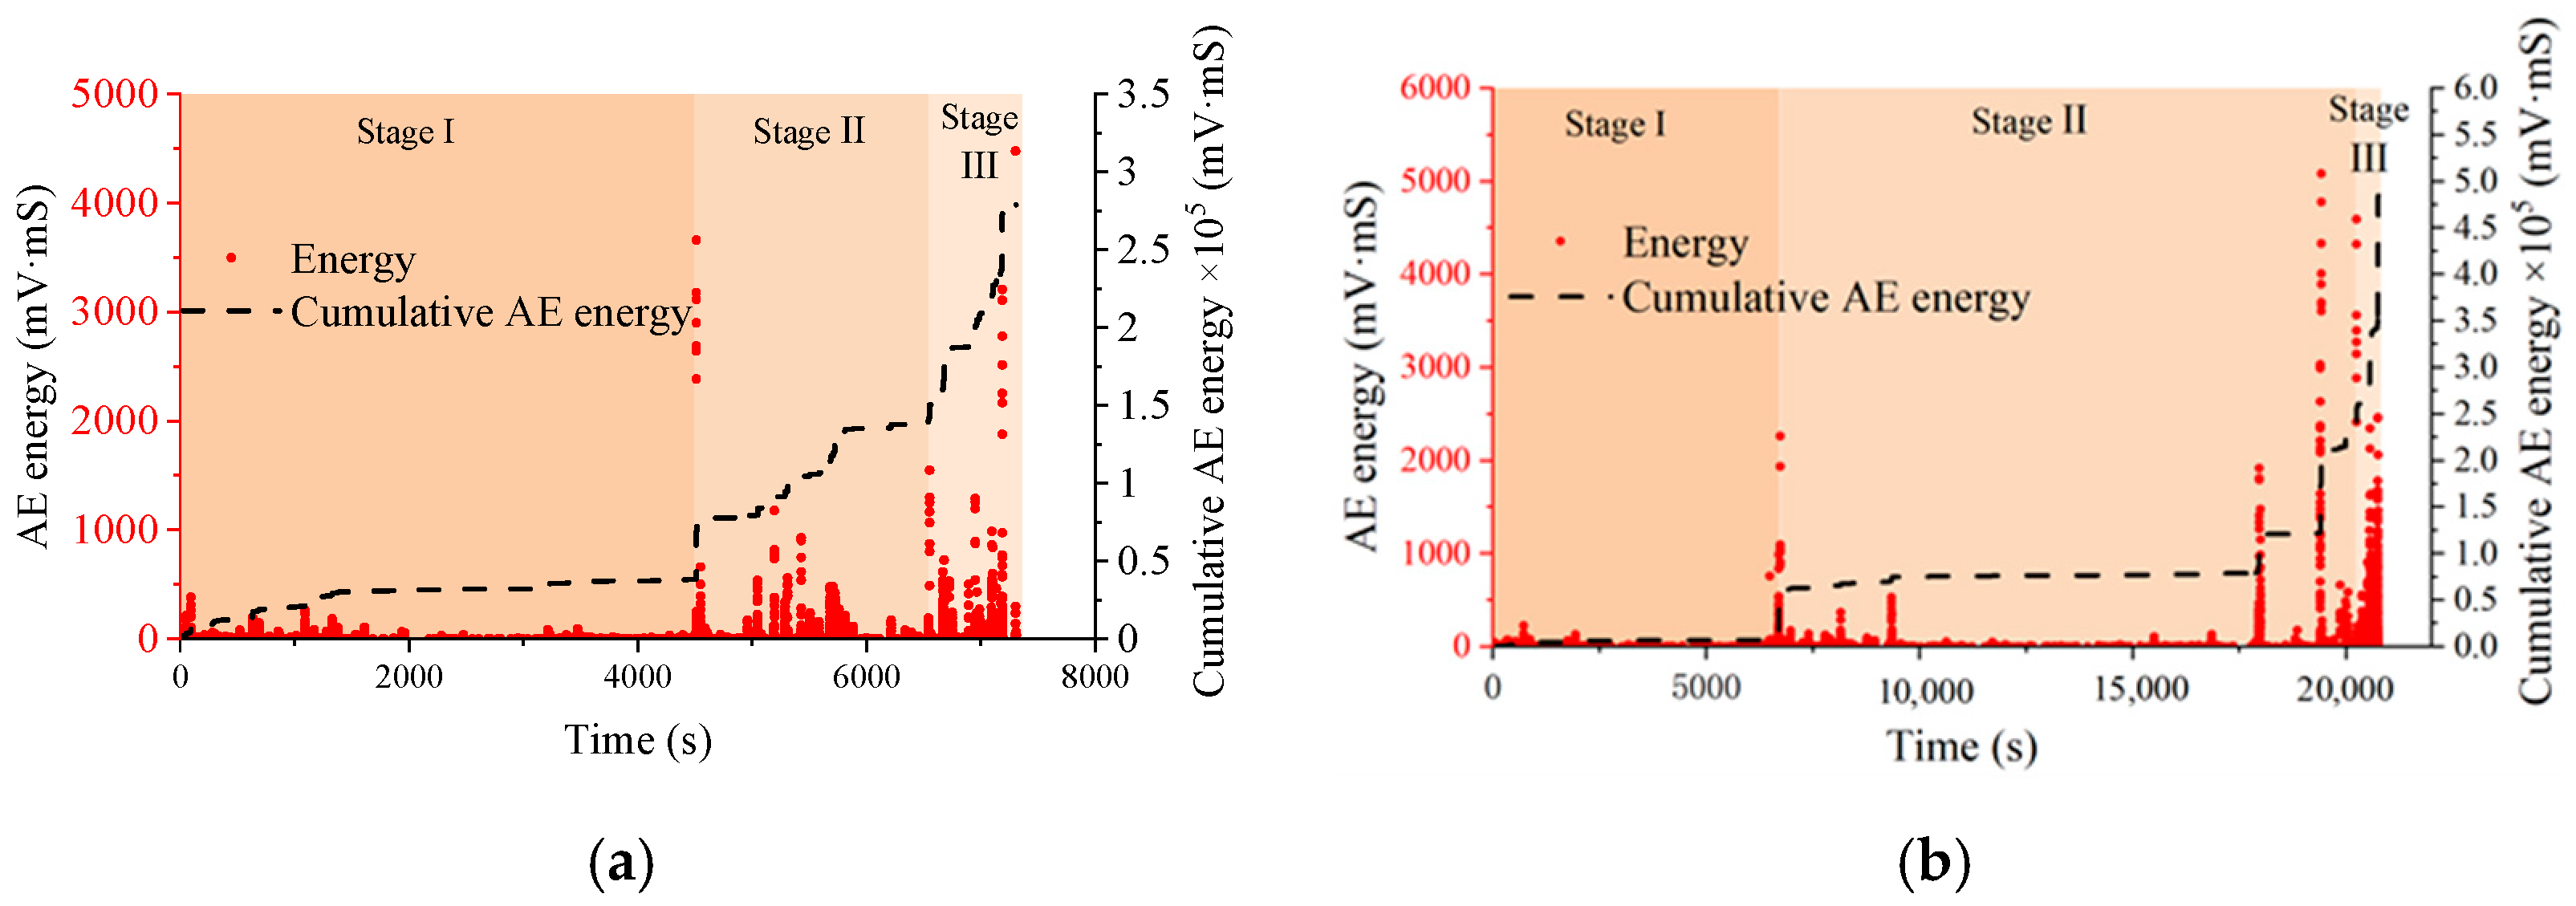
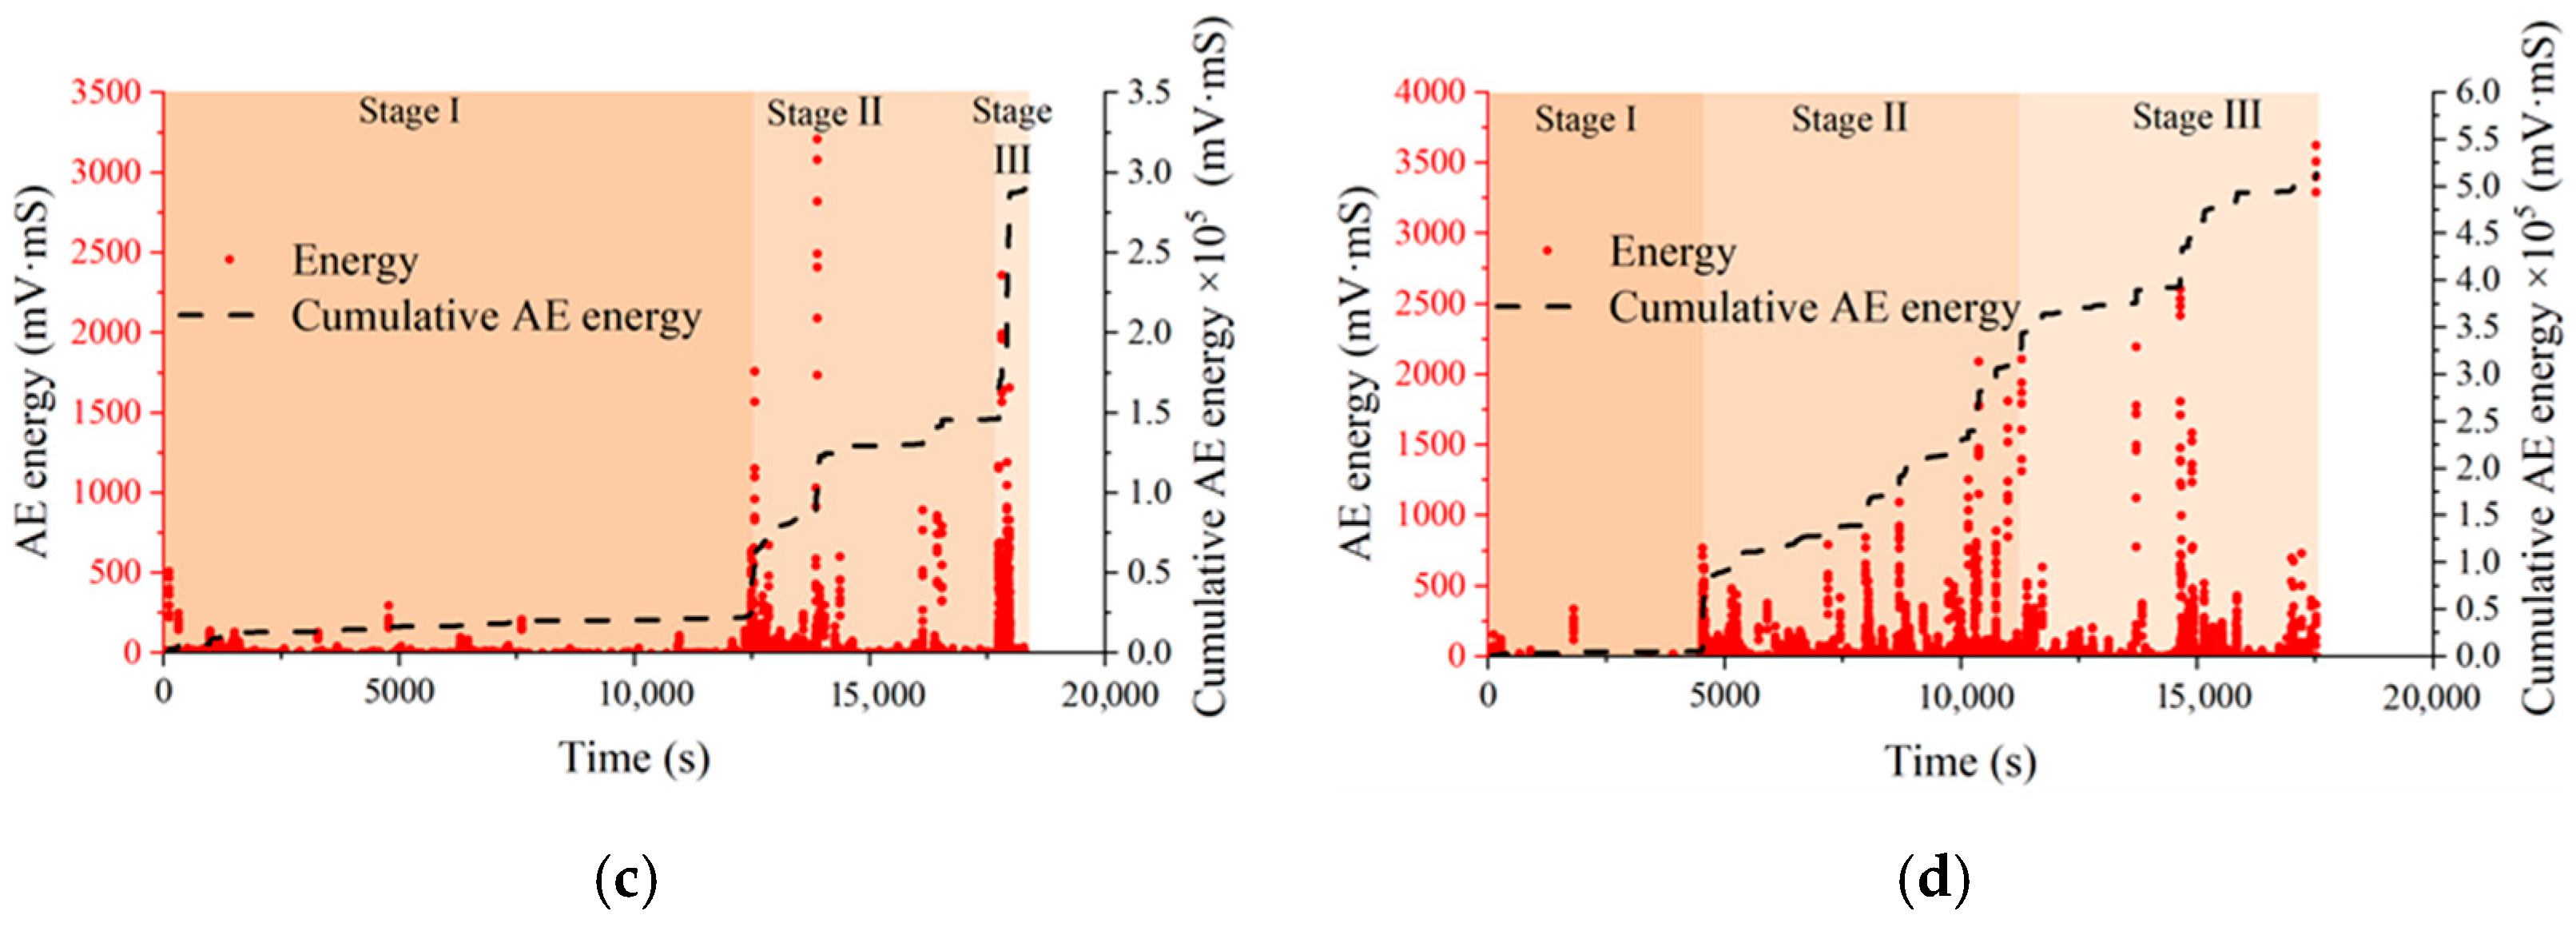
4.1. AE Energy
4.2. MT Inversion
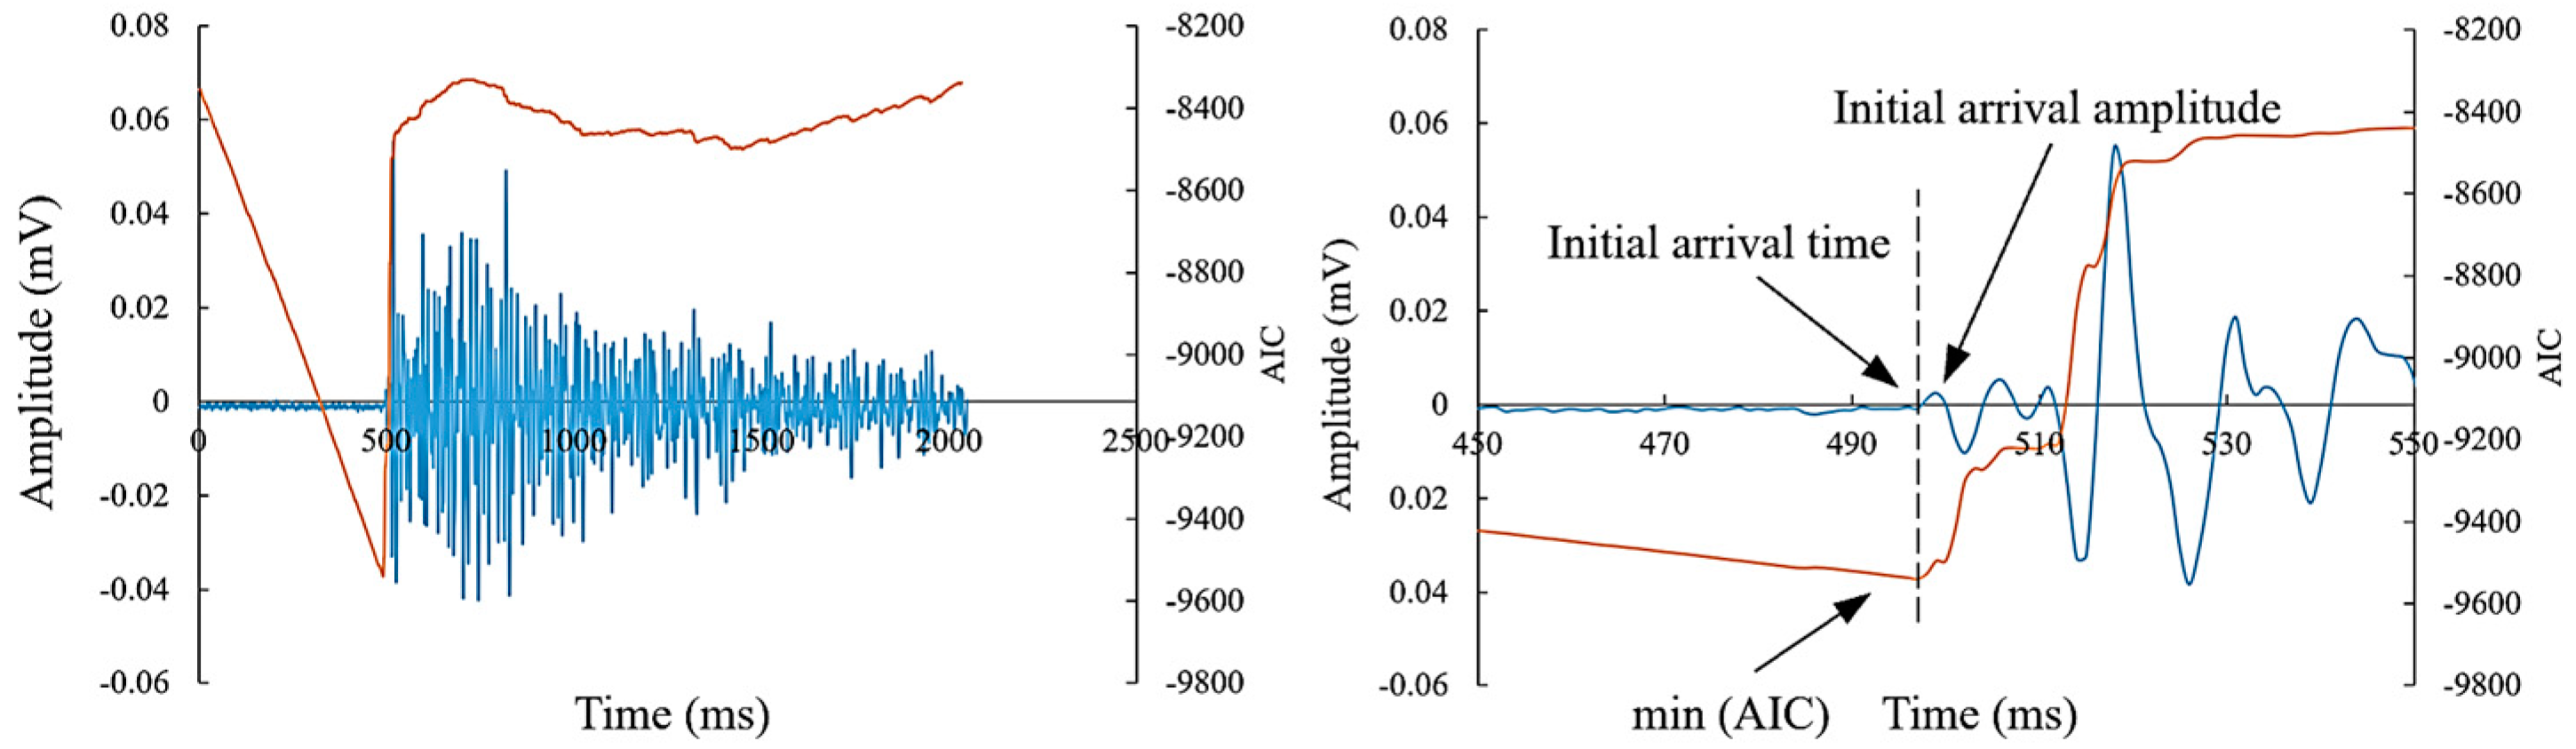
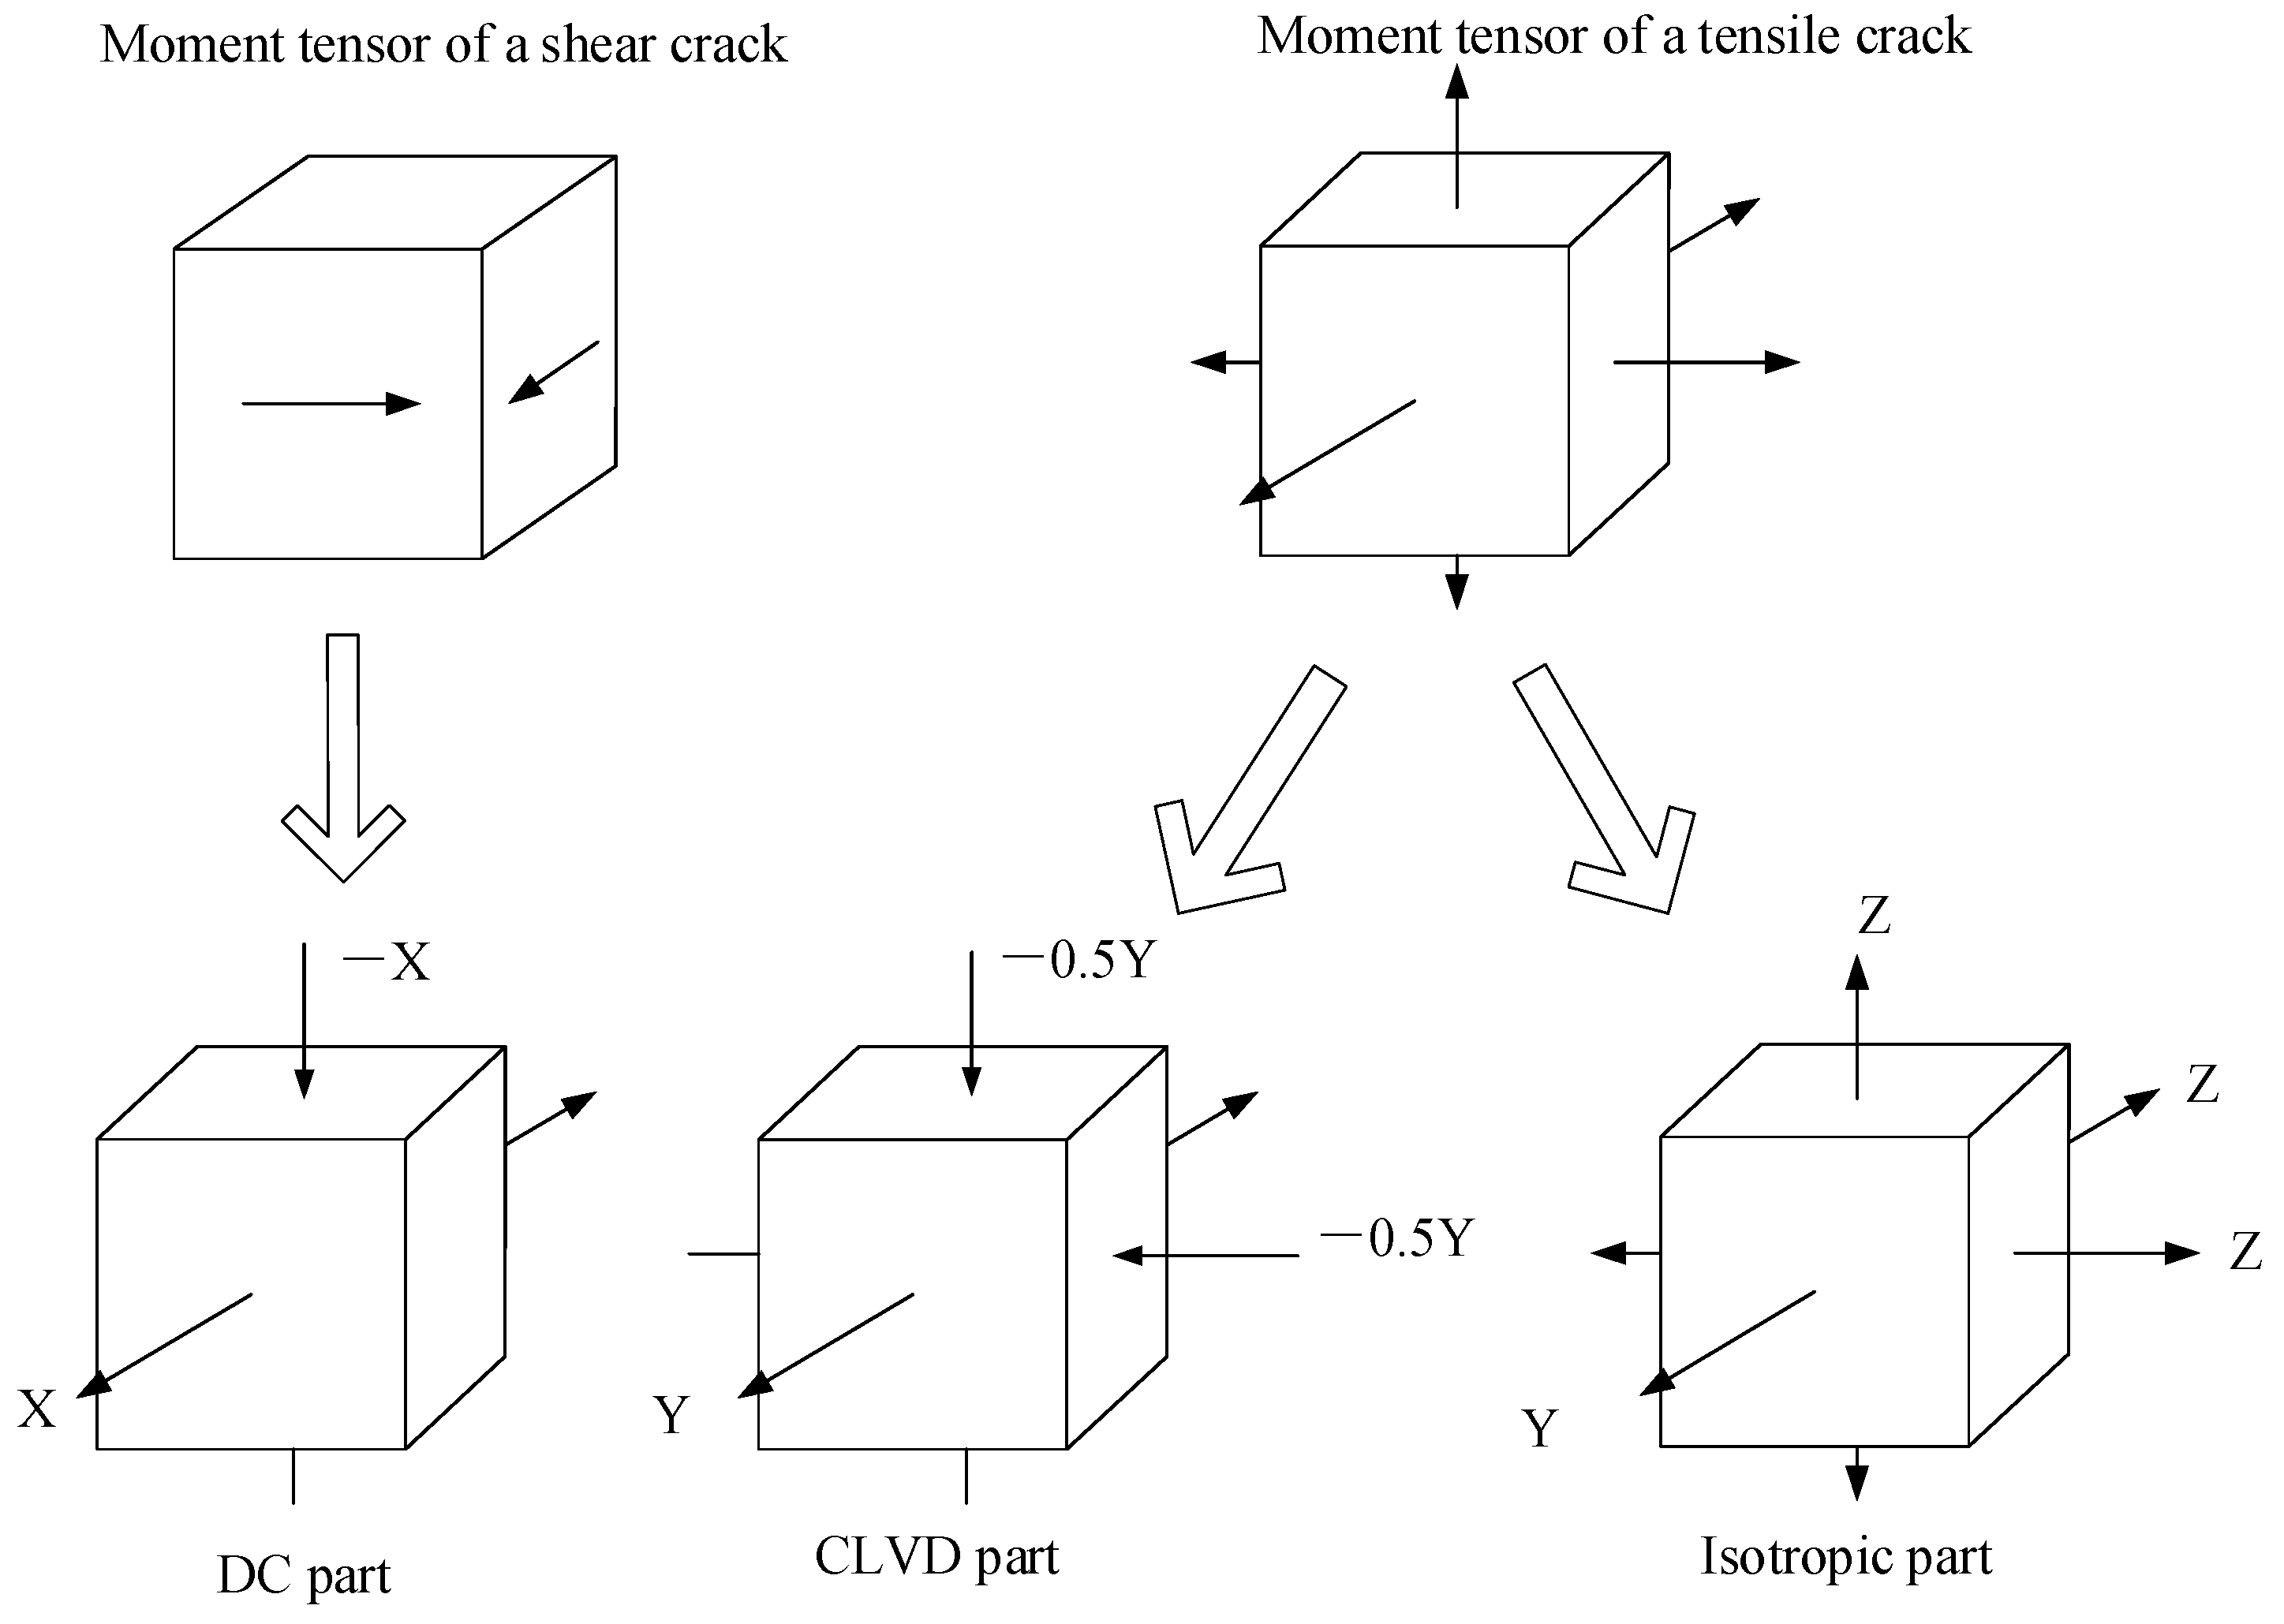
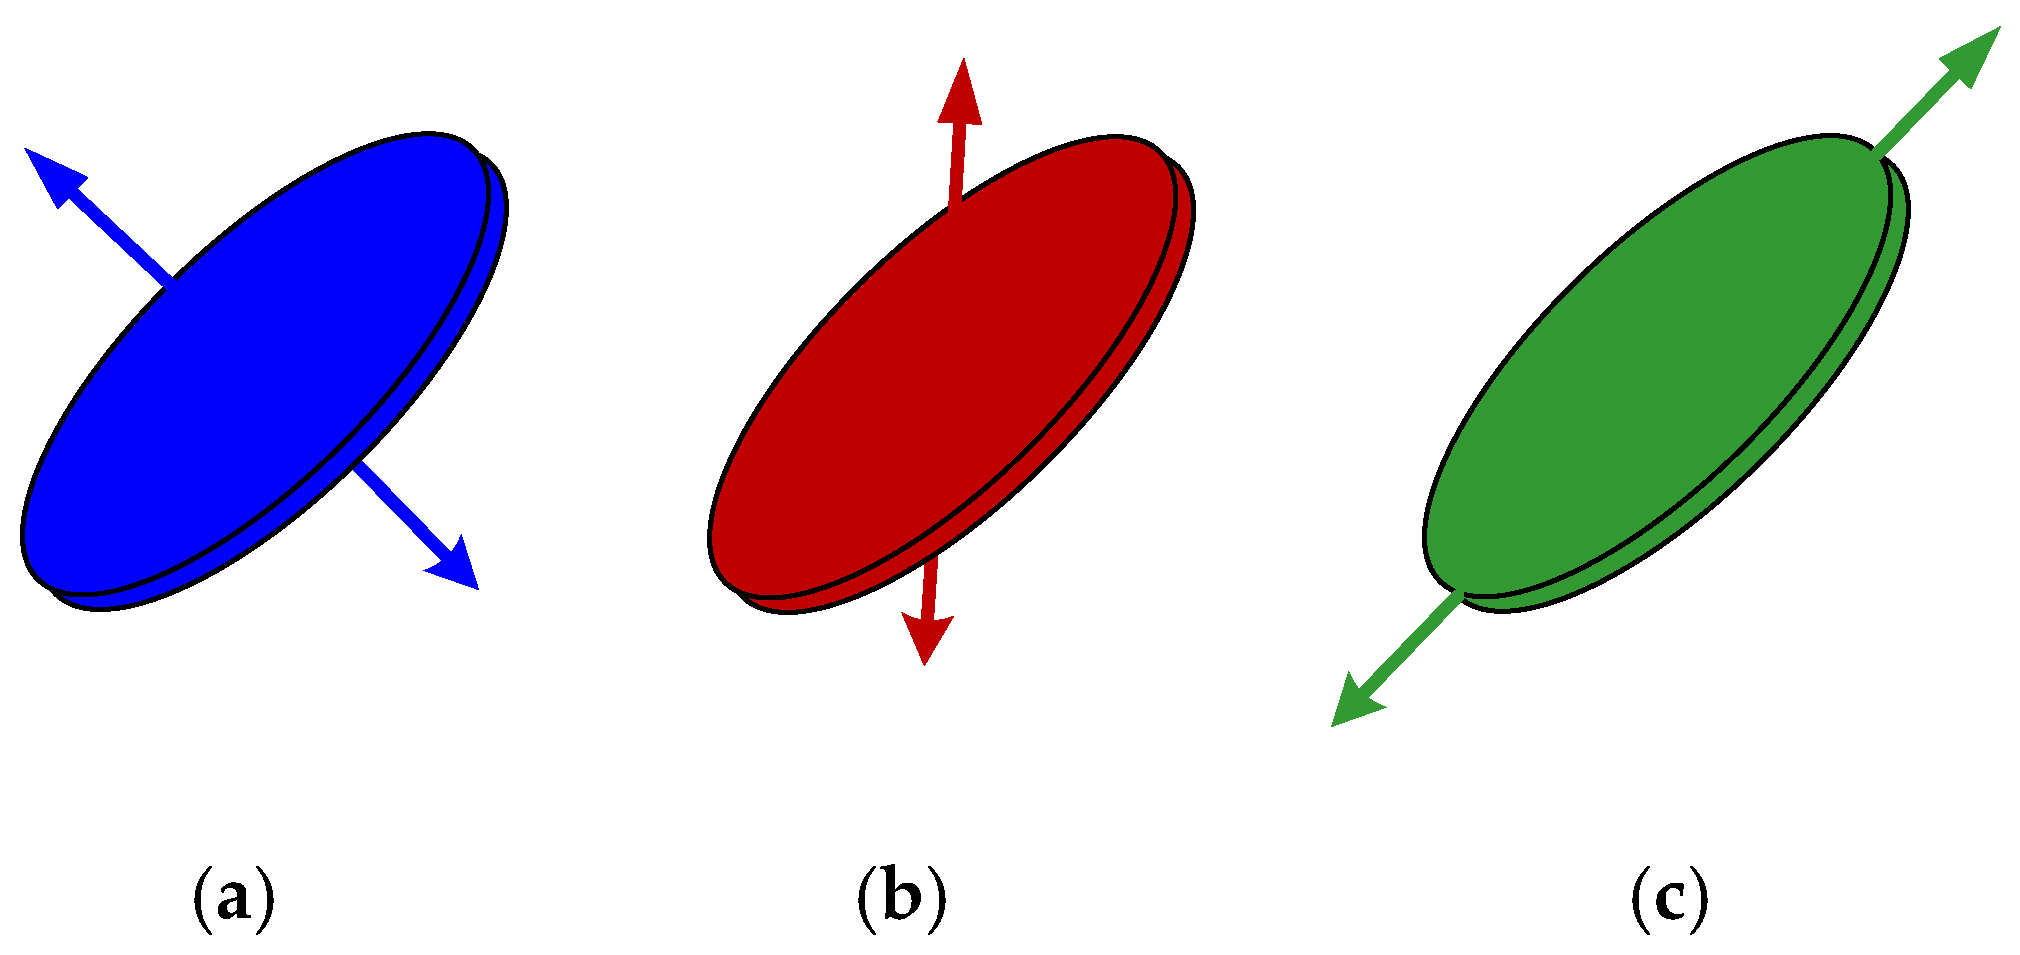
4.2.1. Theory of MT
4.2.2. MT Inversion Results
5. Discussion
6. Conclusions
Author Contributions
Funding
Conflicts of Interest
References
- Zhang, C.; Dong, D.; Wang, Y.; Guan, Q. Brittleness evaluation of the Upper Ordovician Wufeng–Lower Silurian Longmaxi shale in Southern Sichuan Basin, China. Energy Explor. Exploit. 2017, 35, 430–443. [Google Scholar] [CrossRef]
- Wang, H.; Shi, Z.; Sun, S. Biostratigraphy and reservoir characteristics of the Ordovician Wufeng Formation—Silurian Longmaxi Formation shale in the Sichuan Basin and its surrounding areas, China. Pet. Explor. Dev. 2021, 48, 1019–1032. [Google Scholar] [CrossRef]
- Li, Y.; Xue, L.; Wu, X. Study on acoustic emission and X-ray computed-tomography characteristics of shale samples under uniaxial compres-sion tests. Environ. Earth Sci. 2019, 78, 173. [Google Scholar] [CrossRef]
- Rybacki, E.; Reinicke, A.; Meier, T.; Makasi, M.; Dresen, G. What controls the mechanical properties of shale rocks?—Part I: Strength and Young’s modulus. J. Pet. Sci. Eng. 2015, 135, 702–722. [Google Scholar] [CrossRef]
- Jin, Z.; Li, W.; Jin, C.; Hambleton, J.; Cusatis, G. Anisotropic elastic, strength, and fracture properties of Marcellus shale. Int. J. Rock Mech. Min. Sci. 2018, 109, 124–137. [Google Scholar] [CrossRef] [Green Version]
- Kim, K.Y.; Zhuang, L.; Yang, H.; Kim, H.; Min, K. Strength Anisotropy of Berea sandstone: Results of X-Ray computed tomography, compression tests, and discrete modeling. Rock Mech. Rock Eng. 2016, 49, 1201–1210. [Google Scholar] [CrossRef]
- Khanlari, G.; Rafiei, B.; Abdilor, Y. An Experimental Investigation of the Brazilian Tensile Strength and Failure Patterns of Laminated Sandstones. Rock Mech. Rock Eng. 2015, 48, 843–852. [Google Scholar] [CrossRef]
- Liu, C.; Yin, G.; Li, M.; Deng, B.; Song, Z.; Liu, Y.; Yin, S. Shale permeability model considering bedding effect under true triaxial stress conditions. J. Nat. Gas Sci. Eng. 2019, 68, 102908. [Google Scholar] [CrossRef]
- Wang, Y.; Li, H.; Mitra, A.; Han, D.; Long, T. Anisotropic strength and failure behaviors of transversely isotropic shales: An experimental investigation. Interpretation 2020, 8, L59–L70. [Google Scholar] [CrossRef]
- Lei, B.; Zuo, J.; Liu, H.; Wang, J.; Xu, F.; Li, H. Experimental and numerical investigation on shale fracture behavior with different bedding properties. Eng. Fract. Mech. 2021, 247, 107639. [Google Scholar] [CrossRef]
- He, J.; Li, X.; Yin, C.; Zhang, Y.; Lin, C. Propagation and characterization of the micro cracks induced by hydraulic fracturing in shale. Energy 2020, 191, 116449. [Google Scholar] [CrossRef]
- Tien, Y.M.; Kuo, M.C.; Juang, C.H. An experimental investigation of the failure mechanism of simulated transversely isotropic rocks. Int. J. Rock Mech. Min. Sci. 2006, 43, 1163–1181. [Google Scholar] [CrossRef]
- Wu, Y.; Li, X.; He, J.; Zheng, B. Mechanical Properties of Longmaxi Black Organic-Rich Shale Samples from South China under Uniaxial and Triaxial Compression States. Energies 2016, 9, 1088. [Google Scholar] [CrossRef] [Green Version]
- Wang, Y.; Li, C.H.; Hu, Y.Z. Experimental investigation on the fracture behavior of black shale by acoustic emission monitoring and CT image anal-ysis during uniaxial compression. Geophys. J. Int. 2018, 213, 660–675. [Google Scholar] [CrossRef]
- Duan, Y.; Feng, X.; Li, X.; Yang, B. Mesoscopic damage mechanism and a constitutive model of shale using In-Situ X-ray CT device. Eng. Fract. Mech. 2022, 269, 108576. [Google Scholar] [CrossRef]
- Hou, P.; Gao, F.; Yang, Y.; Zhang, X.; Zhang, Z. Effect of the layer orientation on mechanics and energy evolution characteristics of shales under uniaxial loading. Int. J. Min. Sci. Technol. 2016, 26, 857–862. [Google Scholar] [CrossRef]
- Wang, H.; Dyskin, A.; Pasternak, E. Comparative analysis of mechanisms of 3-D brittle crack growth in compression. Eng. Fract. Mech. 2019, 220, 106656. [Google Scholar] [CrossRef]
- Morgan, S.P.; Johnson, C.A.; Einstein, H.H. Cracking processes in Barre granite: Fracture process zones and crack coalescence. Int. J. Fract. 2013, 180, 177–204. [Google Scholar] [CrossRef] [Green Version]
- Park, C.H.; Bobet, A. Crack initiation, propagation and coalescence from frictional flaws in uniaxial compression. Eng. Fract. Mech. 2010, 77, 2727–2748. [Google Scholar] [CrossRef]
- Zhang, T.; Zhou, X.; Qian, Q. Drucker-Prager plasticity model in the framework of OSB-PD theory with shear deformation. Eng. Comput. 2021. [Google Scholar] [CrossRef]
- Wong, L.N.Y.; Einstein, H.H. Systematic evaluation of cracking behavior in specimens containing single flaws under uniaxial compression. Int. J. Rock Mech. Min. Sci. 2009, 46, 239–249. [Google Scholar] [CrossRef]
- Zhang, X.P.; Wong, L.N.Y. Cracking processes in rock-like material containing a single flaw under uniaxial compression: A numerical study based on parallel bonded-particle model approach. Rock Mech. Rock Eng. 2011, 45, 711–737. [Google Scholar] [CrossRef]
- Han, G.; Liang, Q.; Bao, R.; Zhou, Y. Influence of Circular Hole Diameter on Deformation and Failure of Longmaxi Shale. Geotech. Geol. Eng. 2022, 40, 2605–2613. [Google Scholar] [CrossRef]
- Morgan, S.P.; Einstein, H.H. Cracking processes affected by bedding planes in Opalinus shale with flaw pairs. Eng. Fract. Mech. 2017, 176, 213–234. [Google Scholar] [CrossRef]
- Zhang, X.; Li, X.; Liu, Y.; Liu, W.; Li, Q.; Li, L. Experimental study on crack propagation and failure mode of fissured shale under uniaxial compression. Theor. Appl. Fract. Mech. 2022, 121, 103512. [Google Scholar] [CrossRef]
- Li, L.R.; Deng, J.H.; Zheng, L.; Liu, J.F. Dominant frequency characteristics of acoustic emissions in white marble during direct tensile tests. Rock Mech. Rock Eng. 2017, 50, 1337–1346. [Google Scholar] [CrossRef]
- Ban, Y.; Fu, X.; Xie, Q. Revealing the laminar shale microdamage mechanism considering the relationship between fracture geometrical mor-phology and acoustic emission power spectrum characteristics. Bull. Eng. Geol. Environ. 2020, 79, 1083–1096. [Google Scholar] [CrossRef]
- Hu, G.; Yang, T.; Zhou, J.; Yu, Q.; Xie, L.; Liu, H.; Zhao, Y. Mechanism of surrounding rock failure and crack evolution rules in branched pillar recovery. Minerals 2017, 7, 96. [Google Scholar] [CrossRef] [Green Version]
- Ohtsu, M. Acoustic Emission Theory for Moment Tensor Analysis. J. Res. Nondestruct. Eval. 1995, 6, 169–184. [Google Scholar] [CrossRef]
- Ohtsu, M. Post-analysis of SiGMA code for acoustic emission moment tensor analysis. NDT E Int. 1999, 32, 243–244. [Google Scholar]
- Graham, C.C.; Stanchits, S.; Main, I.G.; Dresen, G. Comparison of polarity and moment tensor inversion methods for source analysis of acoustic emission data. Int. J. Rock Mech. Min. Sci. 2010, 47, 161–169. [Google Scholar] [CrossRef]
- Chang, S.H.; Lee, C.I. Estimation of cracking and damage mechanisms in rock under triaxial compression by moment tensor analysis of acoustic emission. Int. J. Rock Mech. Min. Sci. 2004, 41, 1069–1086. [Google Scholar] [CrossRef]
- Chong, Z.; Li, X.; Hou, P.; Chen, X.; Wu, Y. Moment tensor analysis of transversely isotropic shale based on the discrete element method. Int. J. Min. Sci. Technol. 2017, 27, 507–515. [Google Scholar] [CrossRef]
- Zhai, M.; Xue, L.; Bu, F.; Yang, B.; Huang, X.; Liang, N.; Ding, H. Effects of bedding planes on progressive failure of shales under uniaxial compression: Insights from acoustic emission characteristics. Theor. Appl. Fract. Mech. 2022, 119, 103343. [Google Scholar] [CrossRef]
- Wong, L.N.Y.; Xiong, Q. A method for multiscale interpretation of fracture processes in Carrara marble specimen containing a single flaw under uniaxial compression. J. Geophys. Res. Solid Earth 2018, 123, 6459–6490. [Google Scholar] [CrossRef]
- Knill, J.; Franklin, J.; Malone, A. A study of acoustic emission from stressed rock. Int. J. Rock Mech. Min. Sci. 1968, 5, 87–121. [Google Scholar] [CrossRef]
- Wang, C.; Bao, T.; Lu, H.; Liu, L.; Lu, Z.; Li, W.; Yu, Q. Variation regulation of the acoustic emission energy parameter during the failure process of granite under uniaxial compression. Mater. Test. 2015, 52, 755–761. [Google Scholar] [CrossRef]
- Prugger, A.F.; Gendzwill, D.J. Microearthquake location: A nonlinear approach that makes use of a simplex stepping procedure. Bull. Seismol. Soc. Am. 1988, 78, 799–815. [Google Scholar] [CrossRef]
- Akaike, H. Markovian representation of stochastic processes and its application to the analysis of autoregressive moving average process. Ann. Inst. Stat. Math. 1974, 26, 363–387. [Google Scholar] [CrossRef]
- Lei, X.; Kusunose, K.; Rao, M.V.M.S.; Nishizawa, O.; Satoh, T. Quasi-static fault growth and cracking in homogeneous brittle rock under triaxial compression using acoustic emission monitoring. J. Geophys. Res. Solid Earth 2000, 105, 6127–6139. [Google Scholar] [CrossRef]
- Yang, S.; Jing, H. Strength failure and crack coalescence behavior of brittle sandstone samples containing a single fissure under uniaxial compression. Int. J. Fract. 2011, 168, 227–250. [Google Scholar] [CrossRef]


| Size (mm) | Longitudinal Waveform Velocity (m/s) | |
|---|---|---|
| 0° | 79.02 × 31.48 × 152.06 | 3710 |
| 30° | 78.70 × 31.92 × 152.52 | 3810 |
| 60° | 79.04 × 32.94 × 152.50 | 4125 |
| 90° | 77.88 × 32.52 × 152.46 | 3856 |
| 0–50 kN | 50 kN–100 kN | 100 kN–Failure |
|---|---|---|
| 0.1 kN/s | 0.05 kN/s | 0.02 kN/s |
| Intact shale | ||||
| Failure morphology |  |  |  |  |
| Failure mode | Tension across the matrix, shear sliding along the bedding layers | Shear crossing and along the bedding layers | Shear sliding | Tension sliding along bedding layers |
| Containing a pre-existing flaw | ||||
| Sketch of cracks |  |  |  |  |
| Failure mode | Tension cross the bedding layers | Tension splitting, shear matrix | Shear matrix, shear along bedding layers | Tension along the bedding layers, shear matrix |
| Major factor | Pre-existing flaw | Pre-existing flaw, bedding layers | Pre-existing flaw, bedding layers | Bedding layers |
Publisher’s Note: MDPI stays neutral with regard to jurisdictional claims in published maps and institutional affiliations. |
© 2022 by the authors. Licensee MDPI, Basel, Switzerland. This article is an open access article distributed under the terms and conditions of the Creative Commons Attribution (CC BY) license (https://creativecommons.org/licenses/by/4.0/).
Share and Cite
Ban, Y.; Xie, Q.; Duan, J.; Fu, X. Influences of Inclined Pre-Existing Flaw on Shale Failure Modes in Uniaxial Compression Tests. Minerals 2022, 12, 1330. https://doi.org/10.3390/min12101330
Ban Y, Xie Q, Duan J, Fu X. Influences of Inclined Pre-Existing Flaw on Shale Failure Modes in Uniaxial Compression Tests. Minerals. 2022; 12(10):1330. https://doi.org/10.3390/min12101330
Chicago/Turabian StyleBan, Yuxin, Qiang Xie, Jun Duan, and Xiang Fu. 2022. "Influences of Inclined Pre-Existing Flaw on Shale Failure Modes in Uniaxial Compression Tests" Minerals 12, no. 10: 1330. https://doi.org/10.3390/min12101330