
Studies on Recovery of Valuable Metals by Leaching Lead–Zinc Smelting Waste with Sulfuric Acid
Abstract
:1. Introduction
2. Experiments
2.1. Materials and Methods
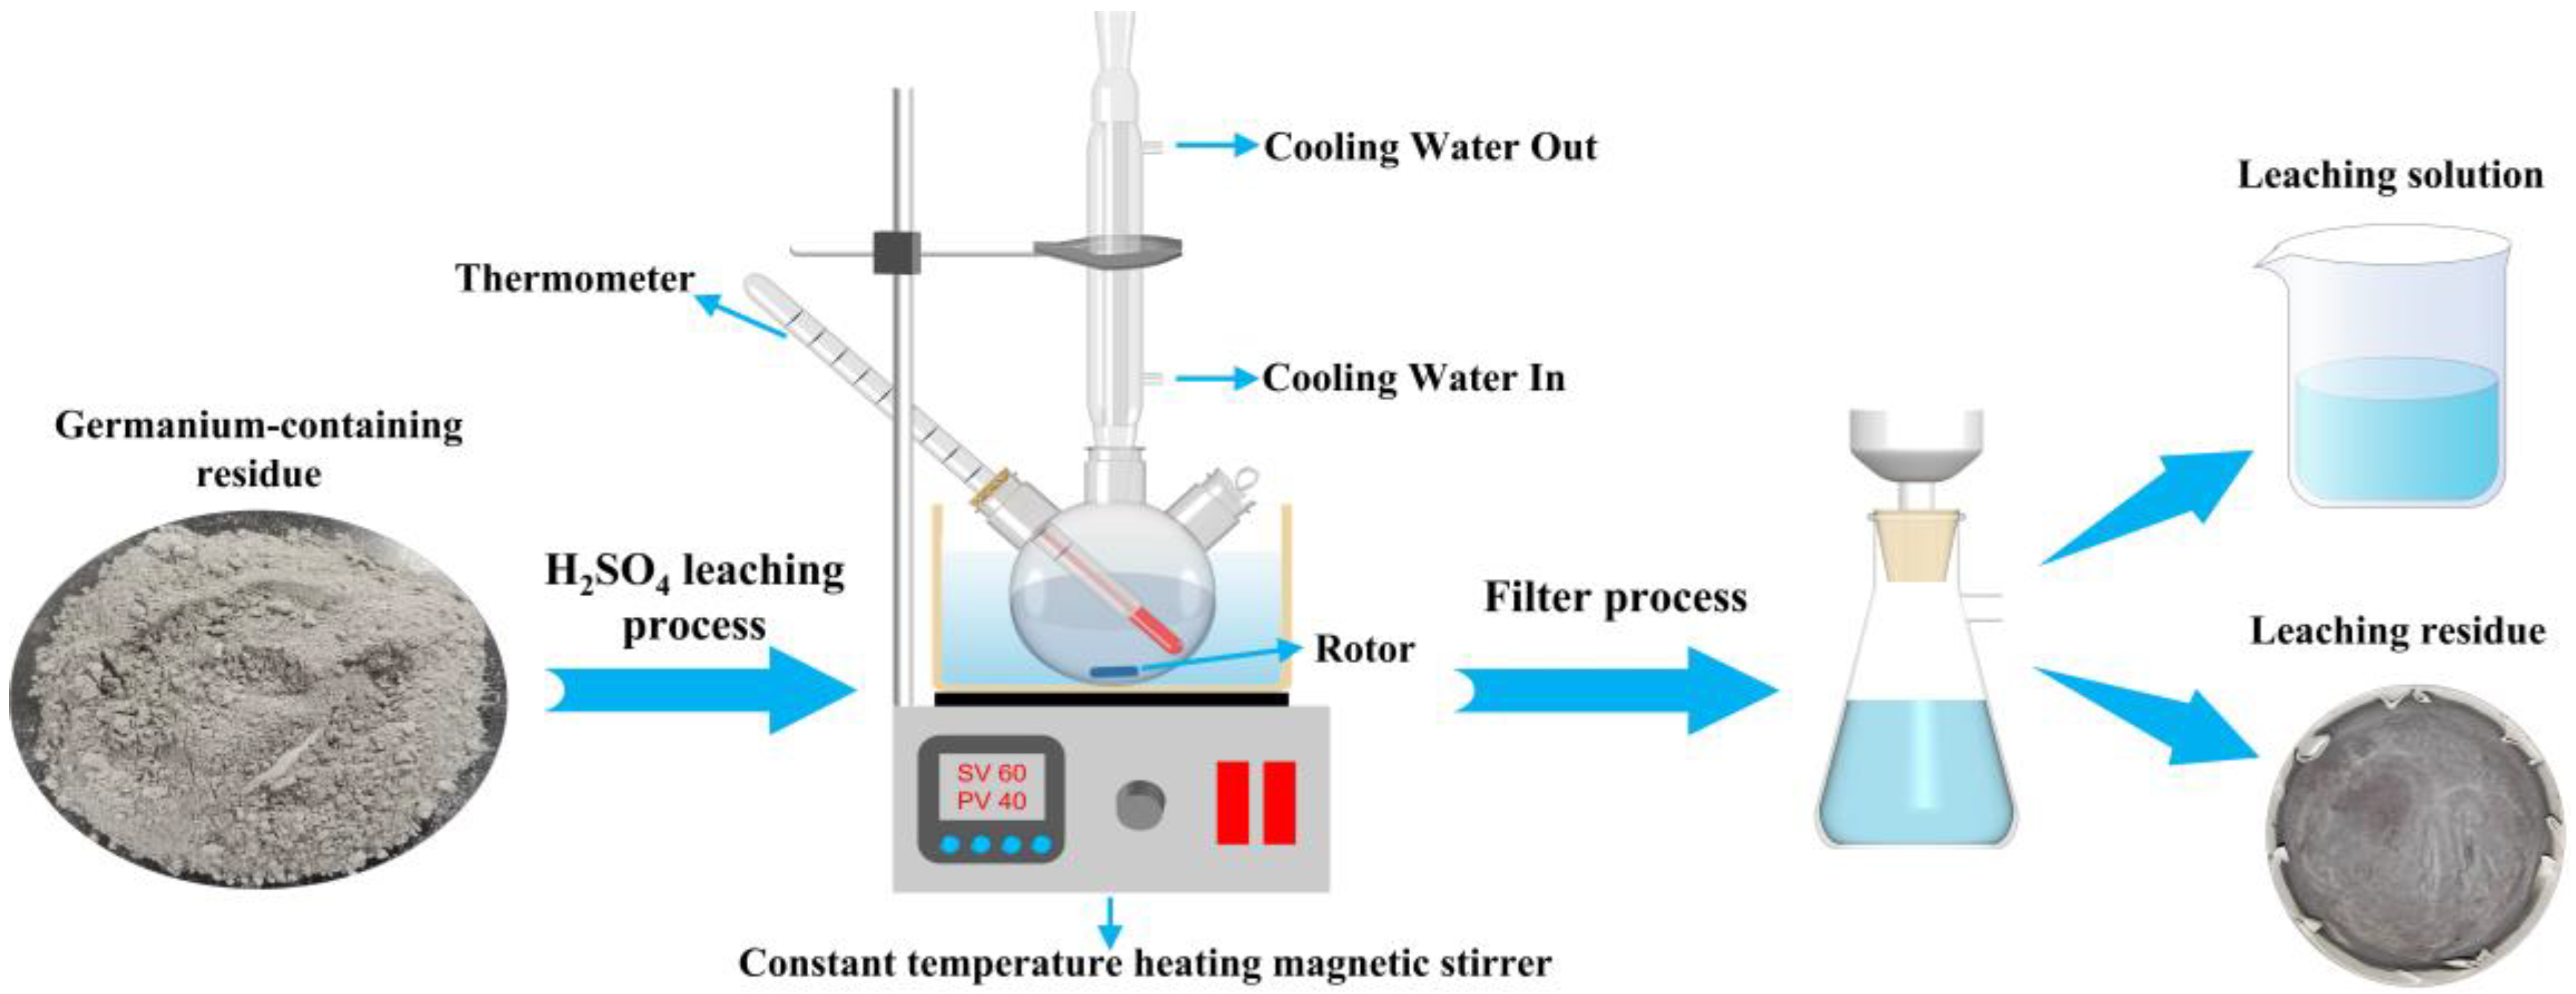
2.2. Leaching Experiment
2.3. Analytical Methods
3. Results and Discussion
3.1. Characterization of the GCR
3.2. Atmospheric Leaching Experiment
3.3. Characterization and Analysis of Leaching Residue
4. Conclusions
- (1)
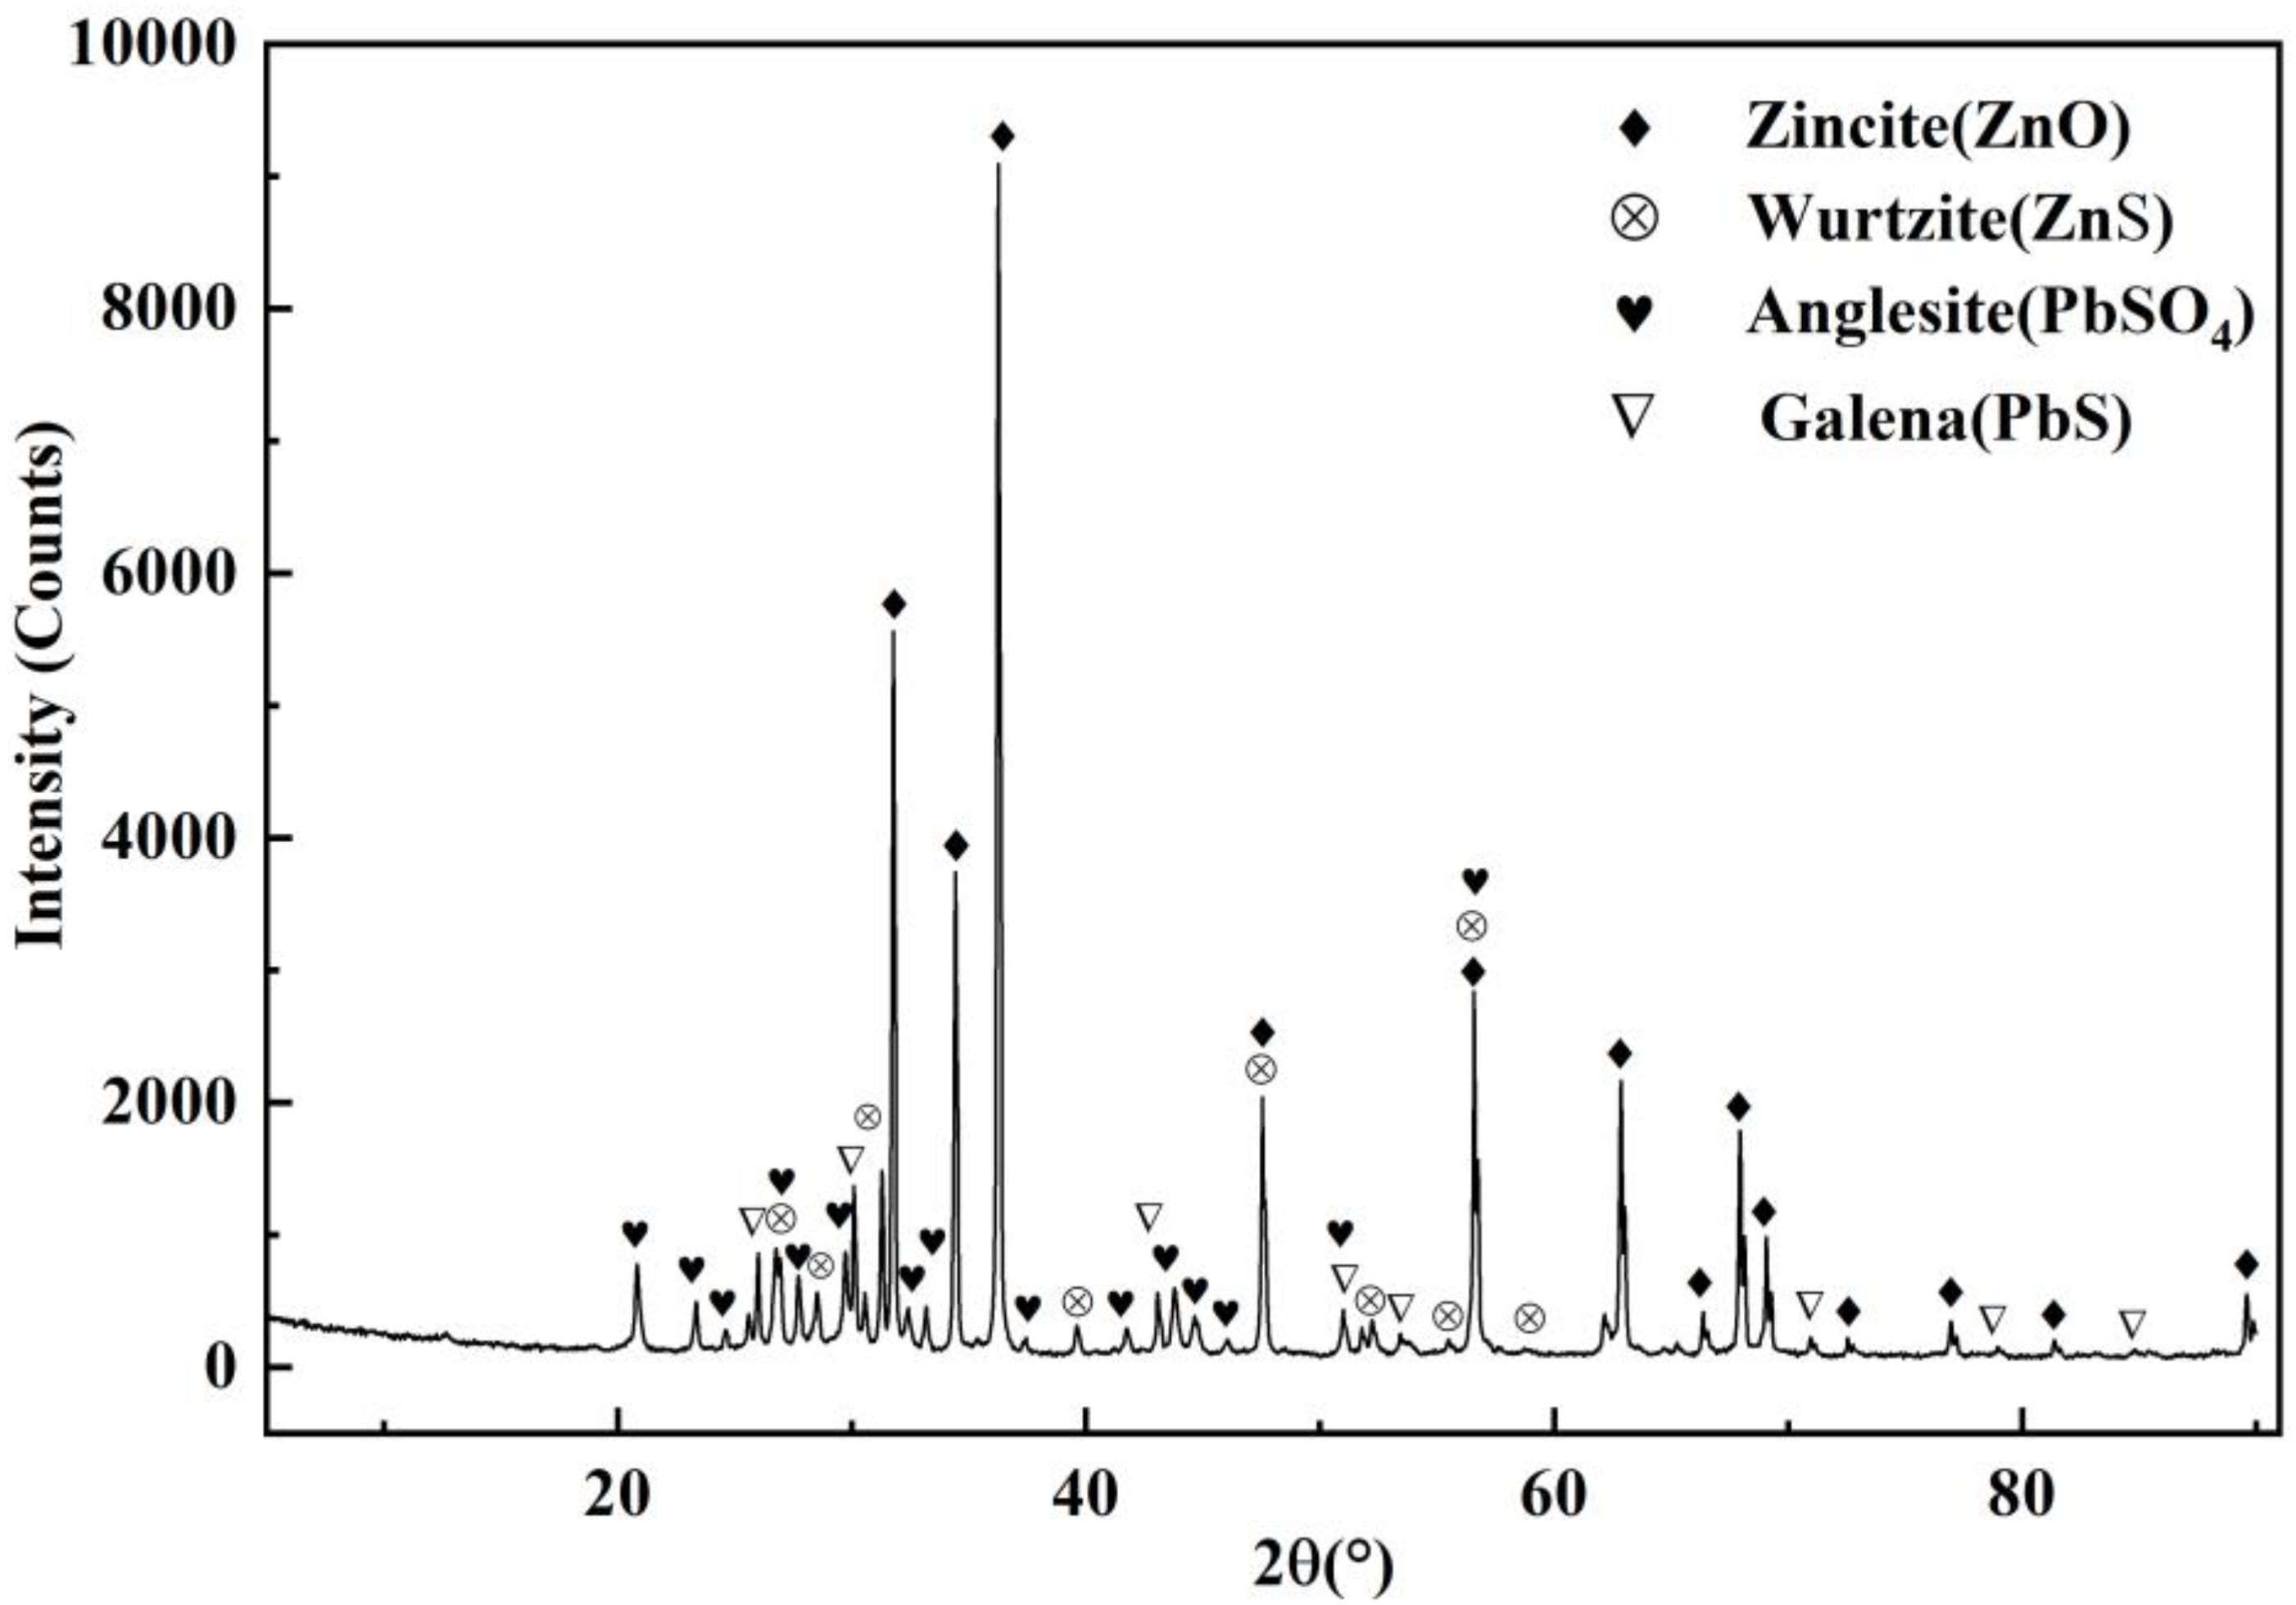
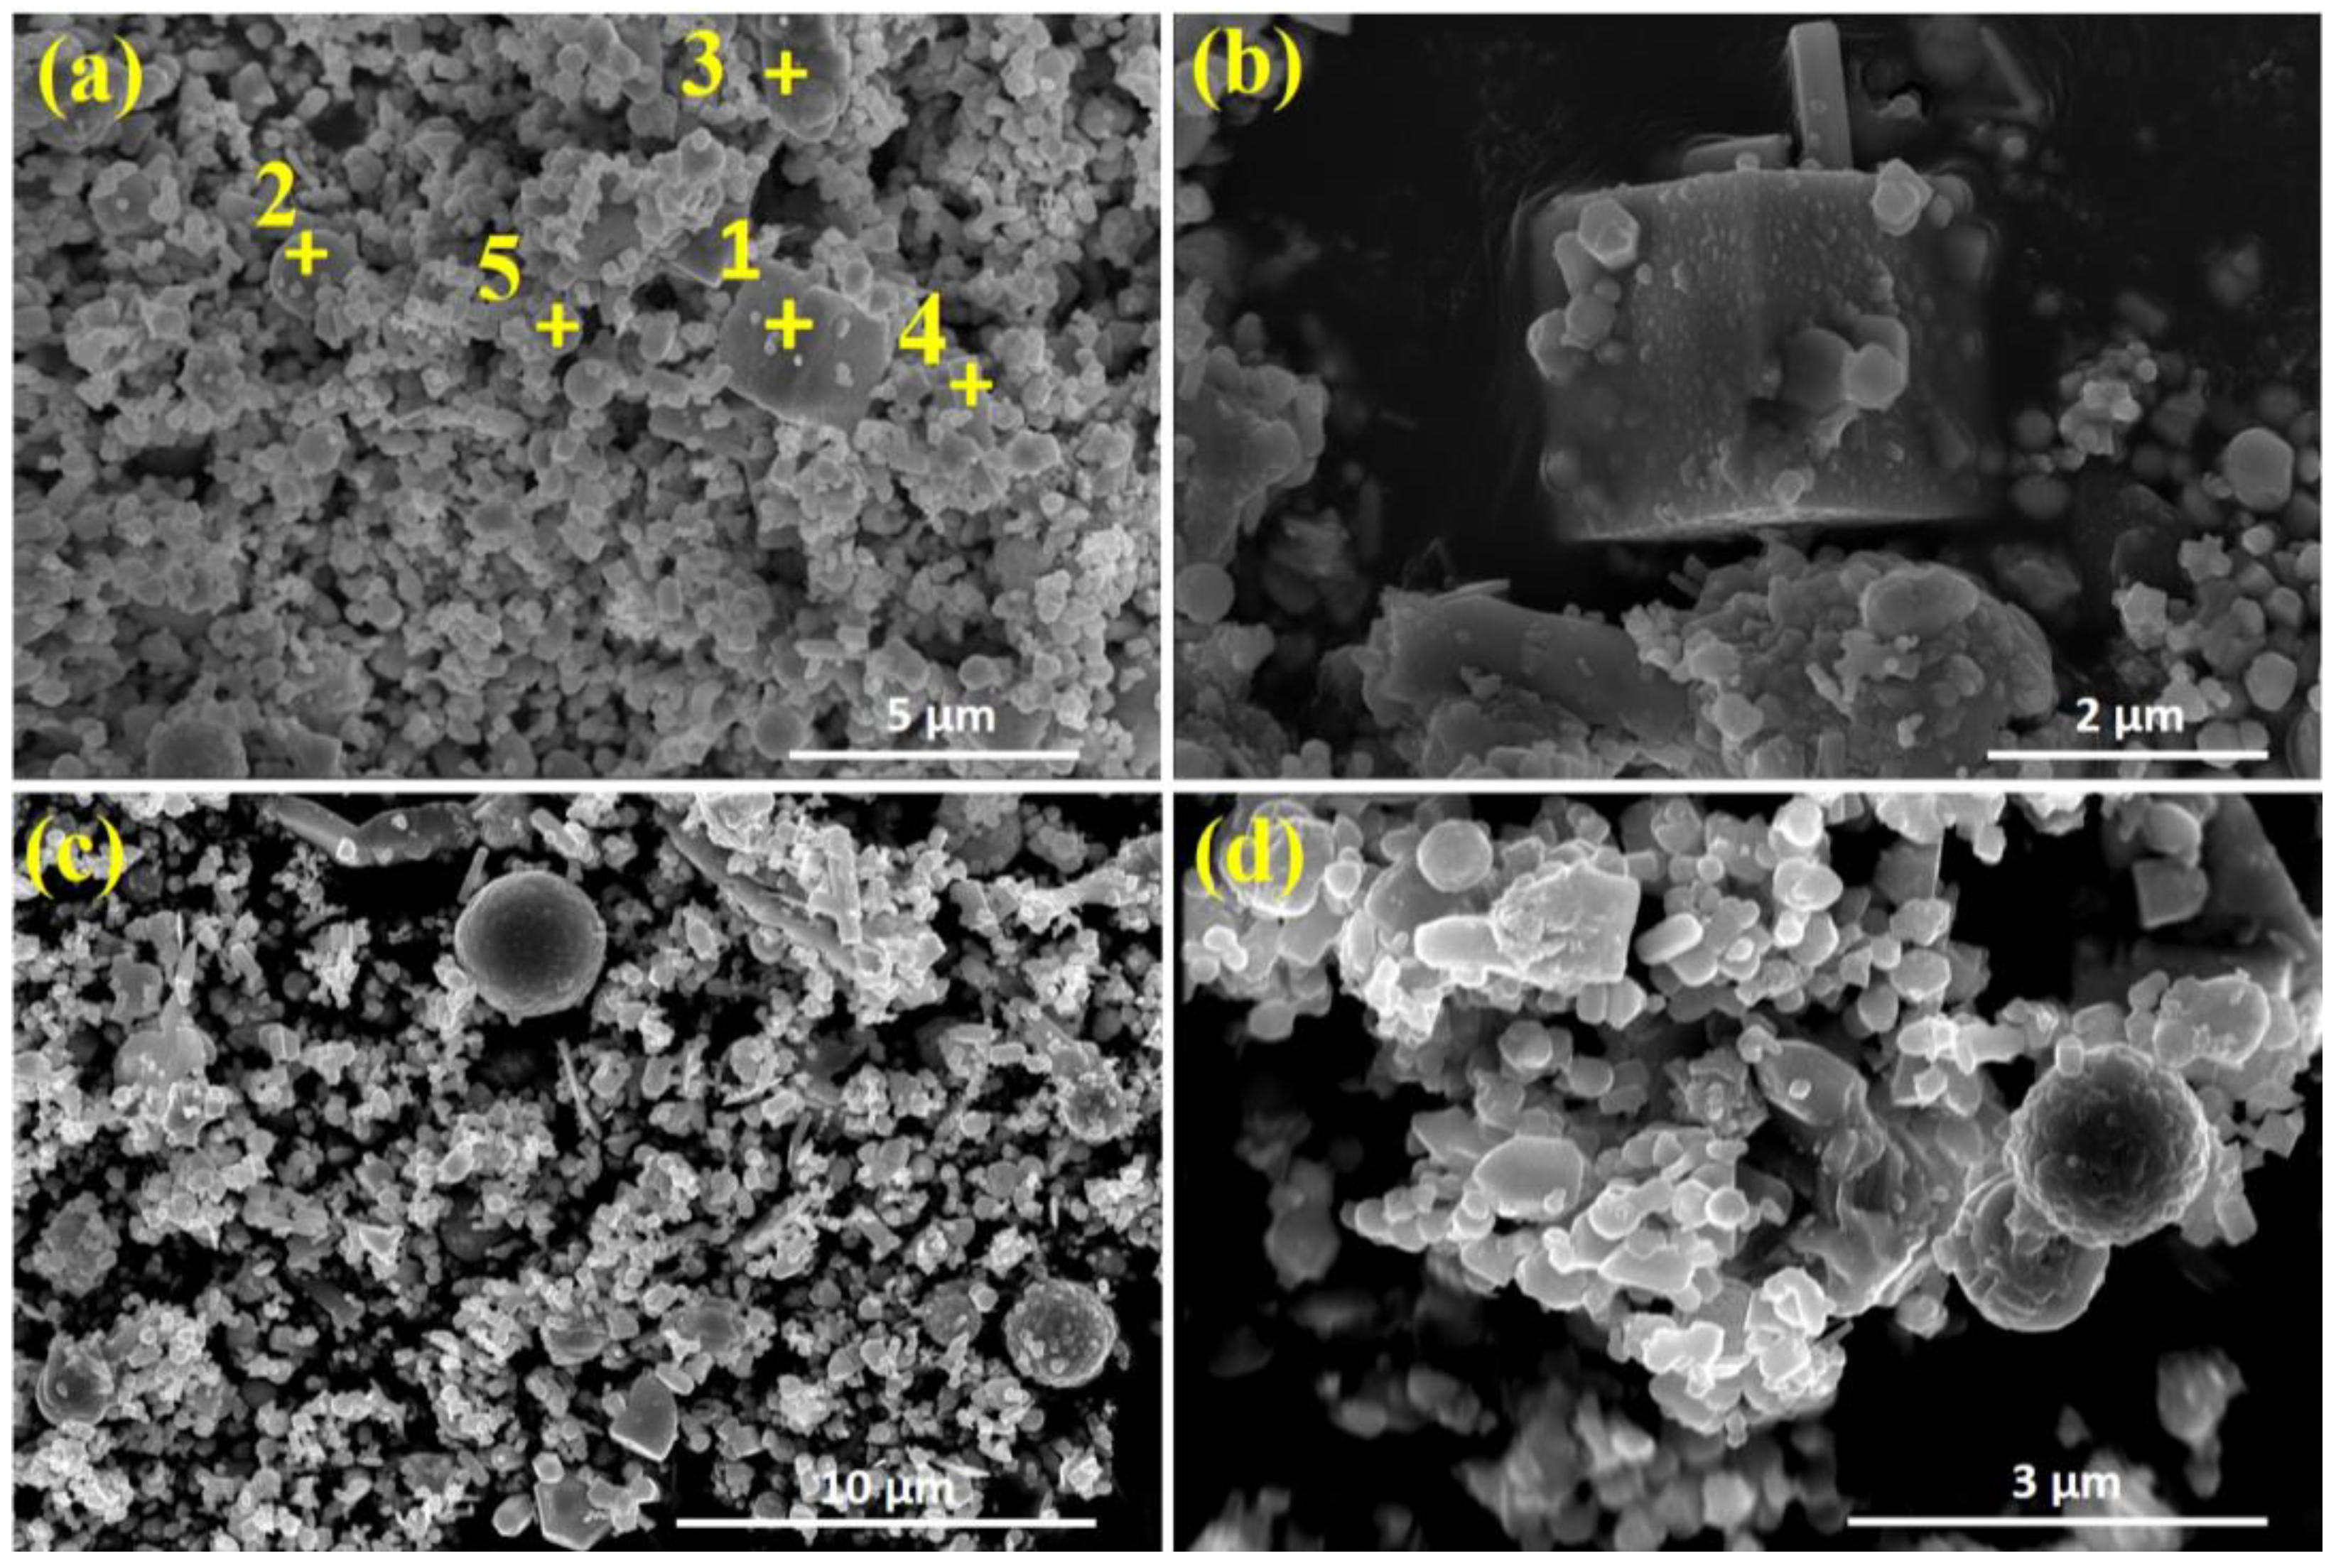
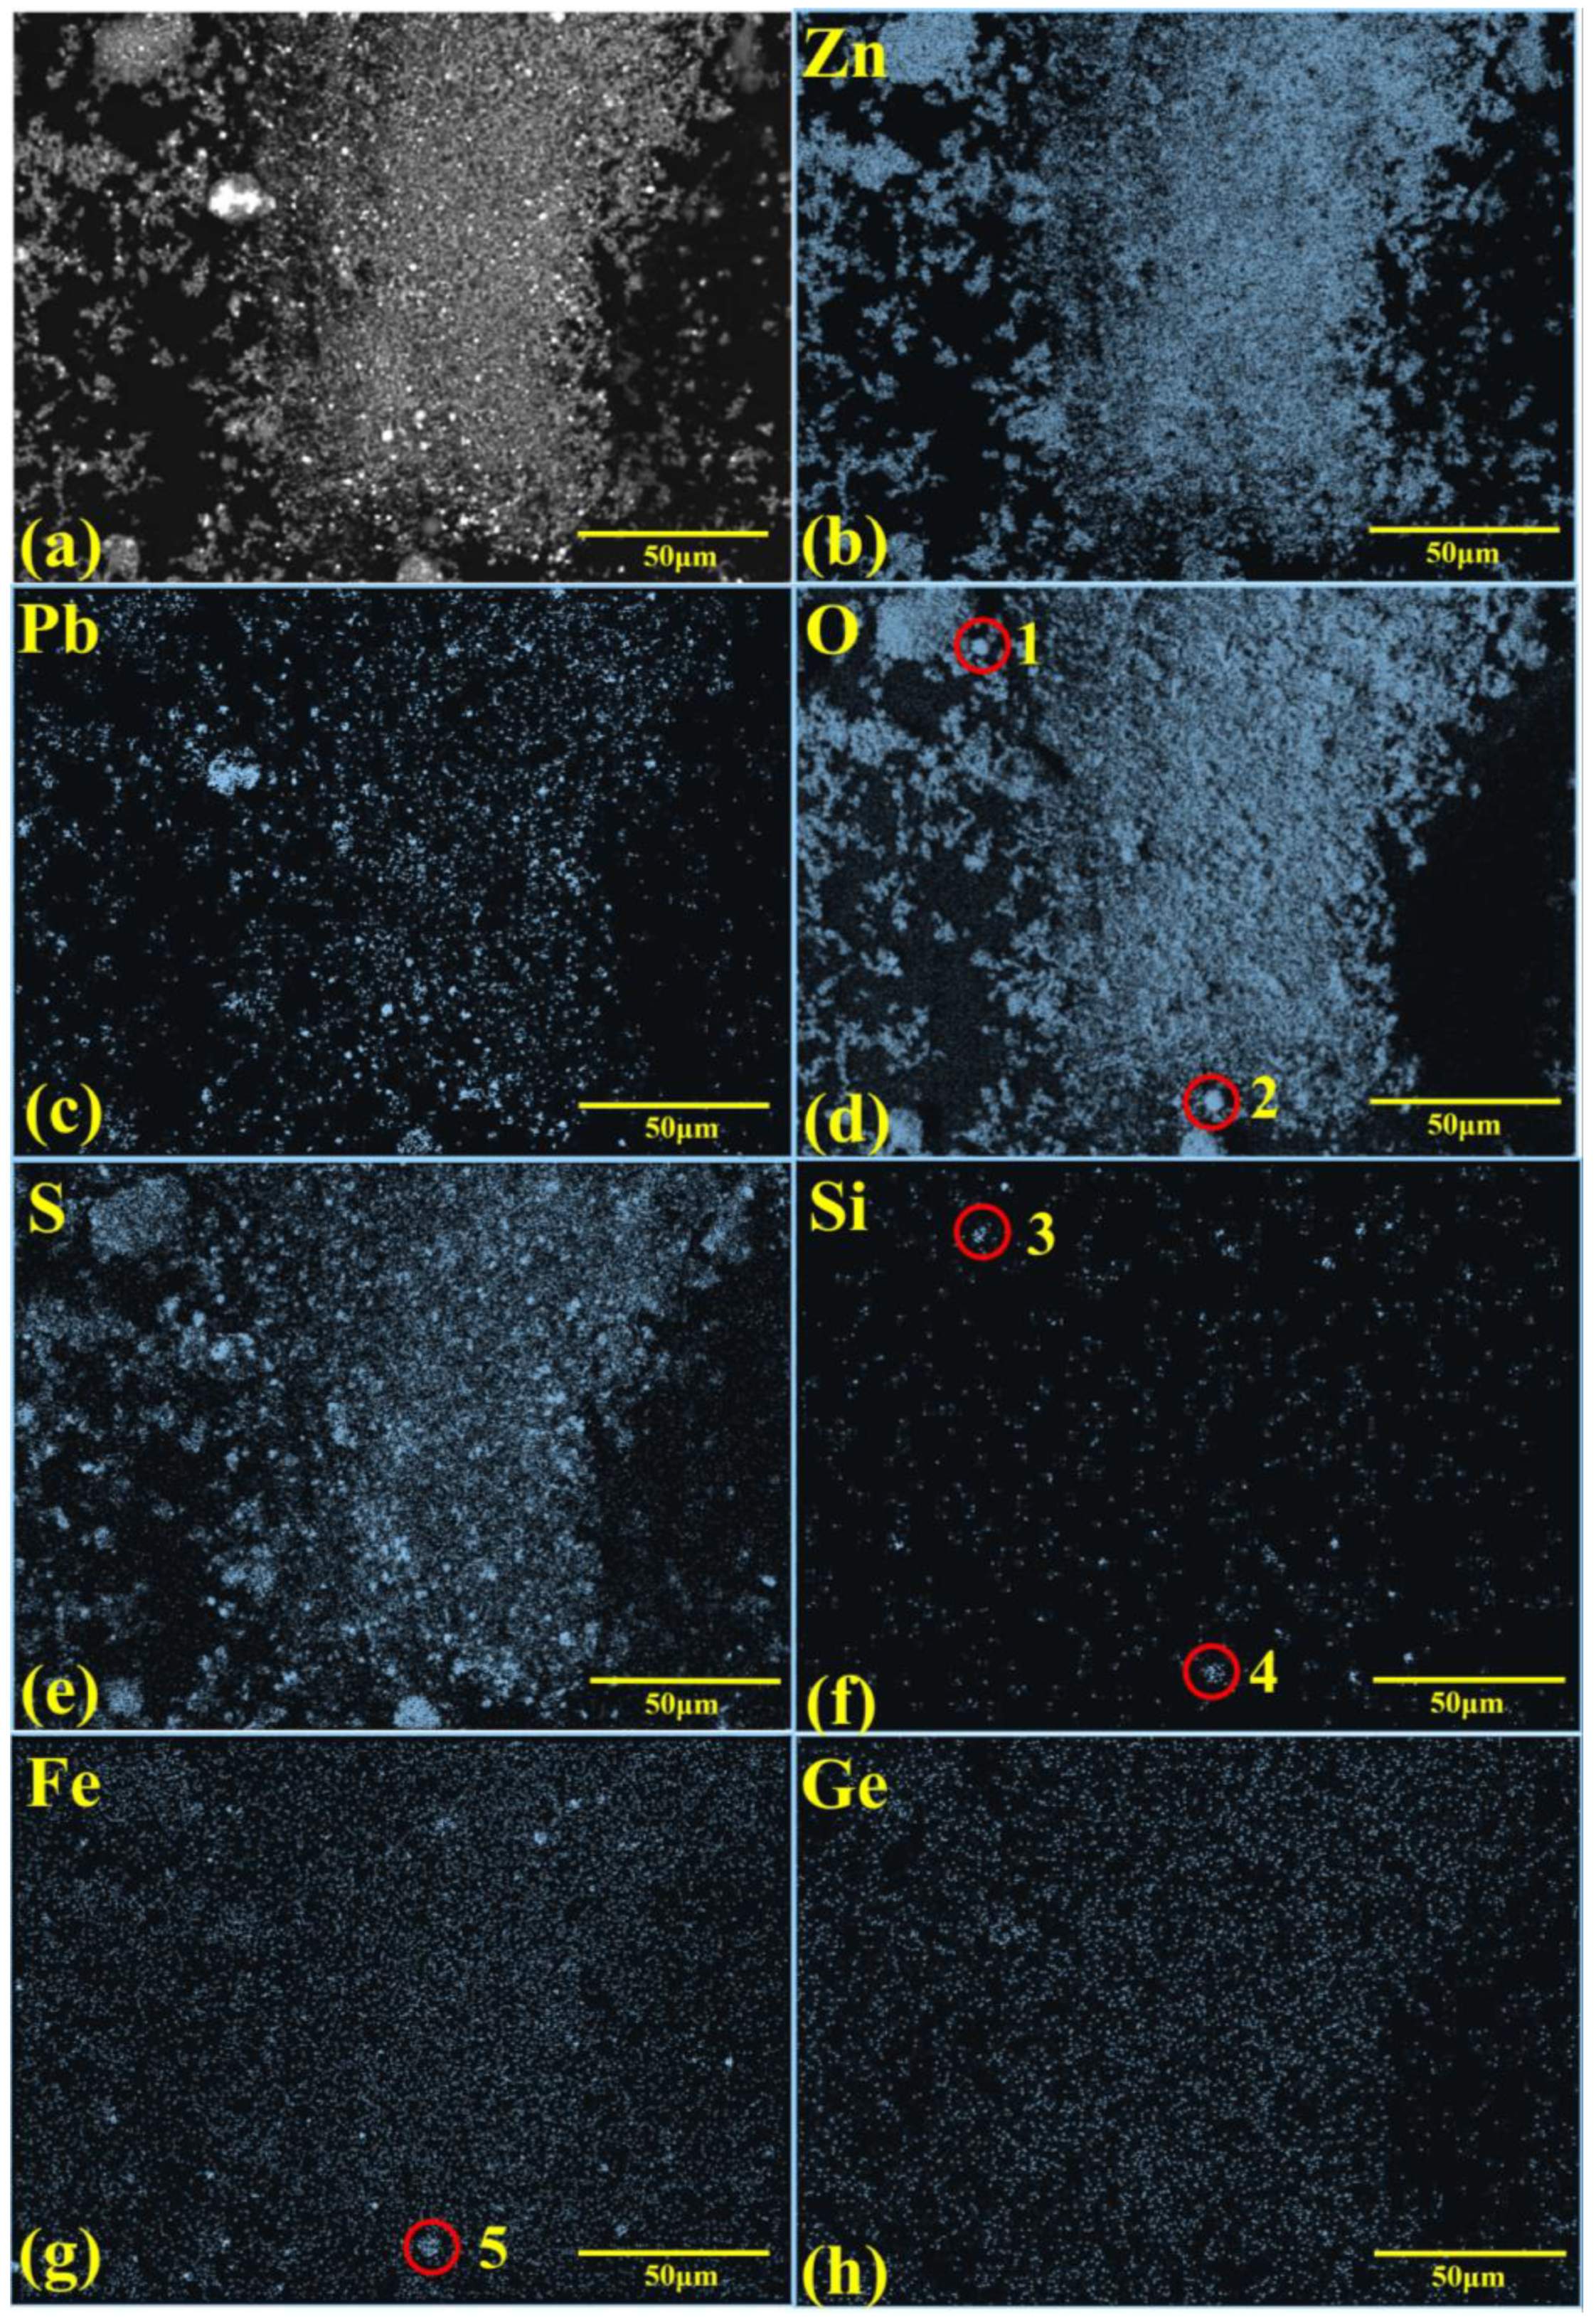
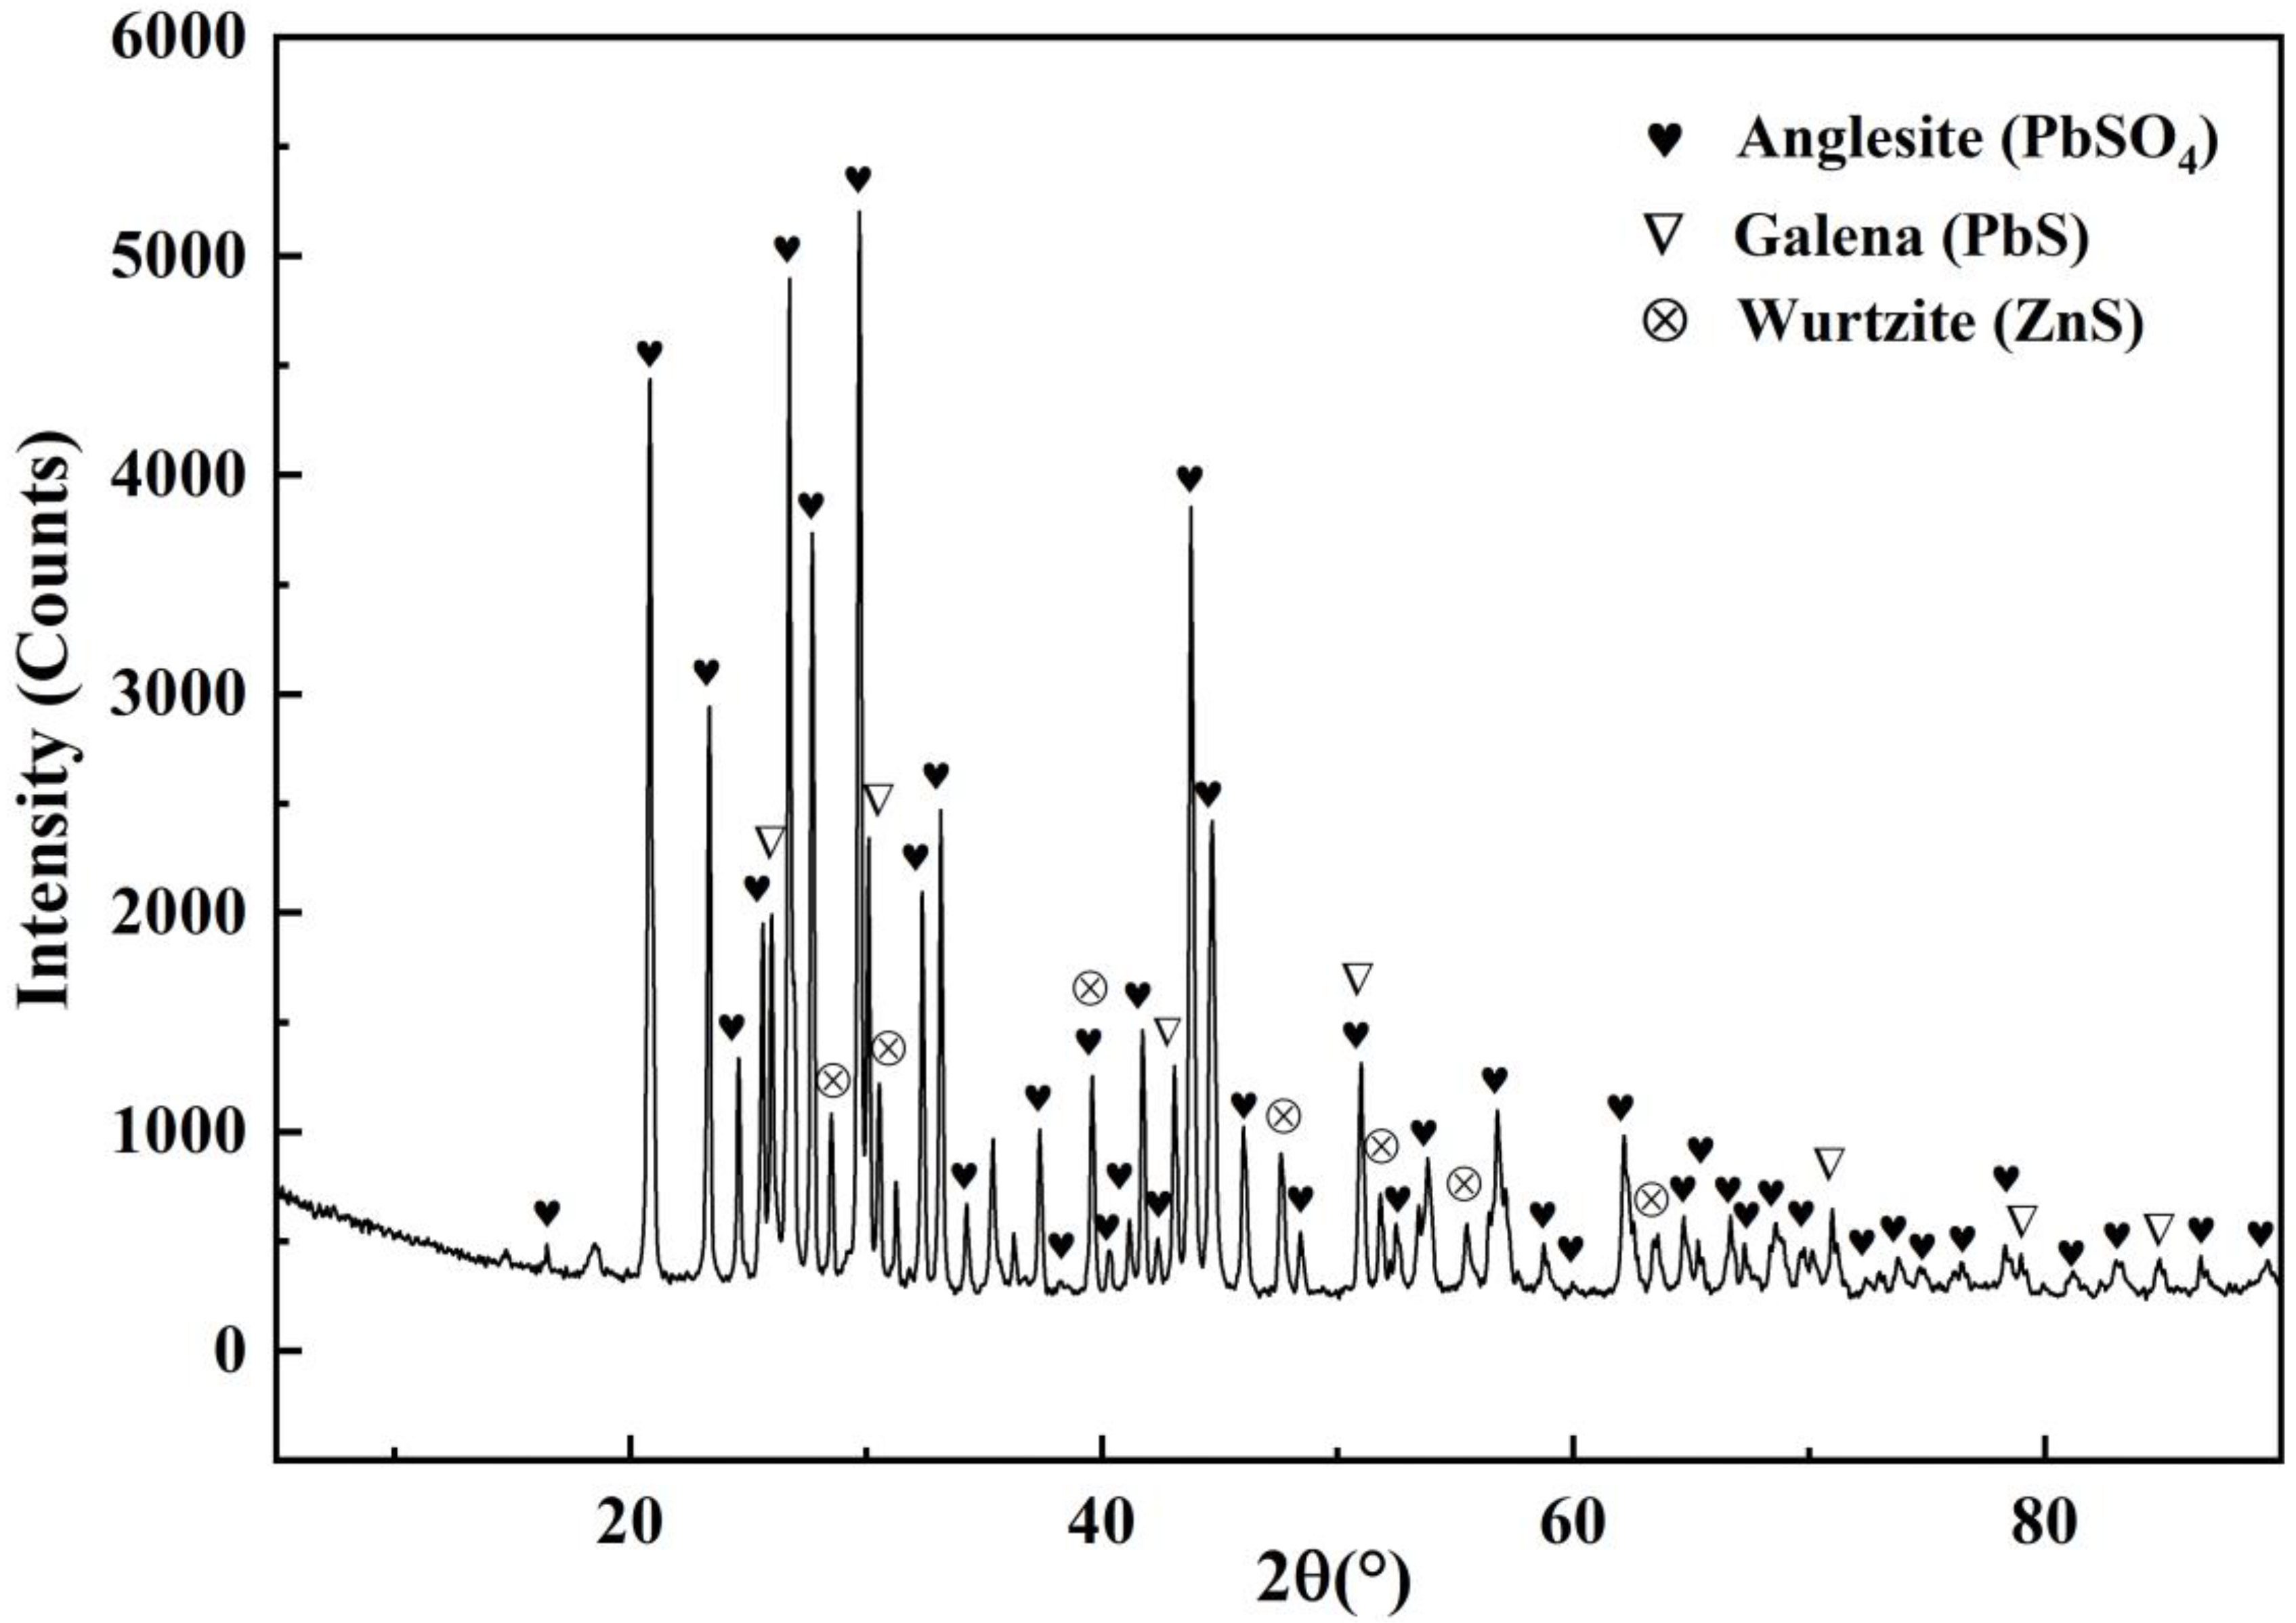
- The GCR samples studied in this paper are mainly composed of the following elements: Zn, Pb, S, As, Si, Fe and Ge. XRF, XRD, SEM-EDS and EPMA analysis show that the main phases of GCR are ZnO, ZnS, PbS and PbSO4.
- (2)
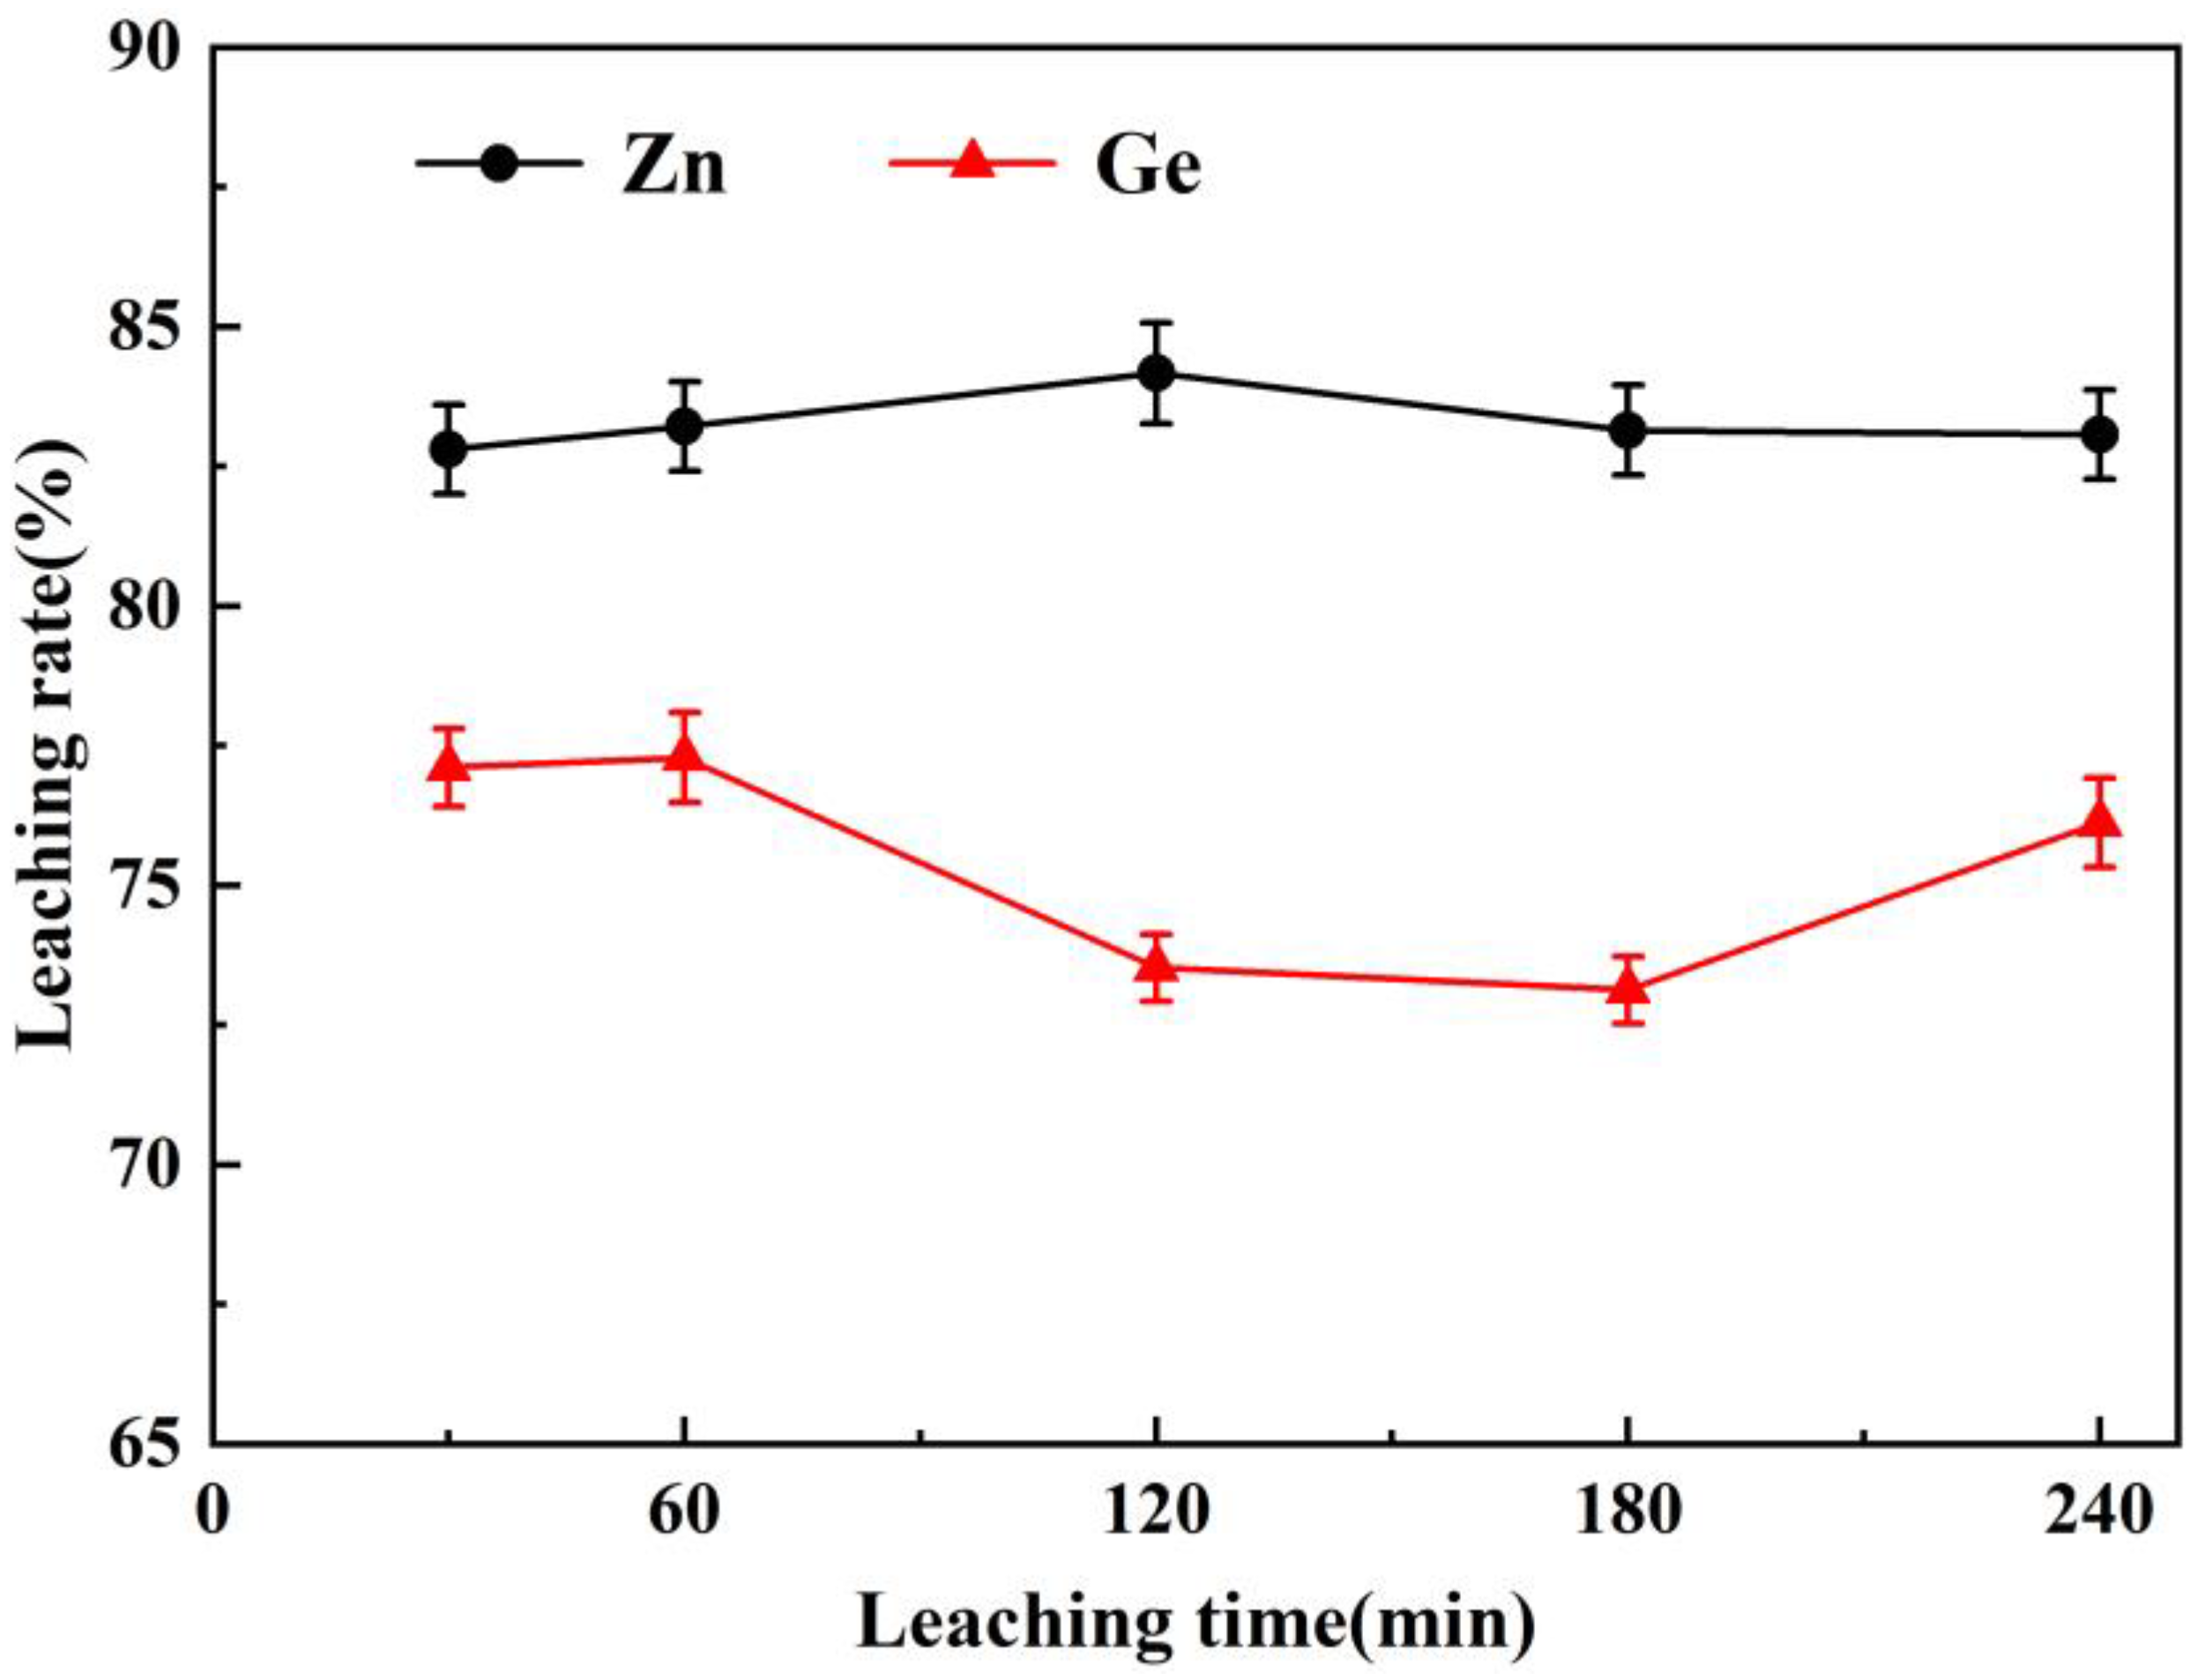
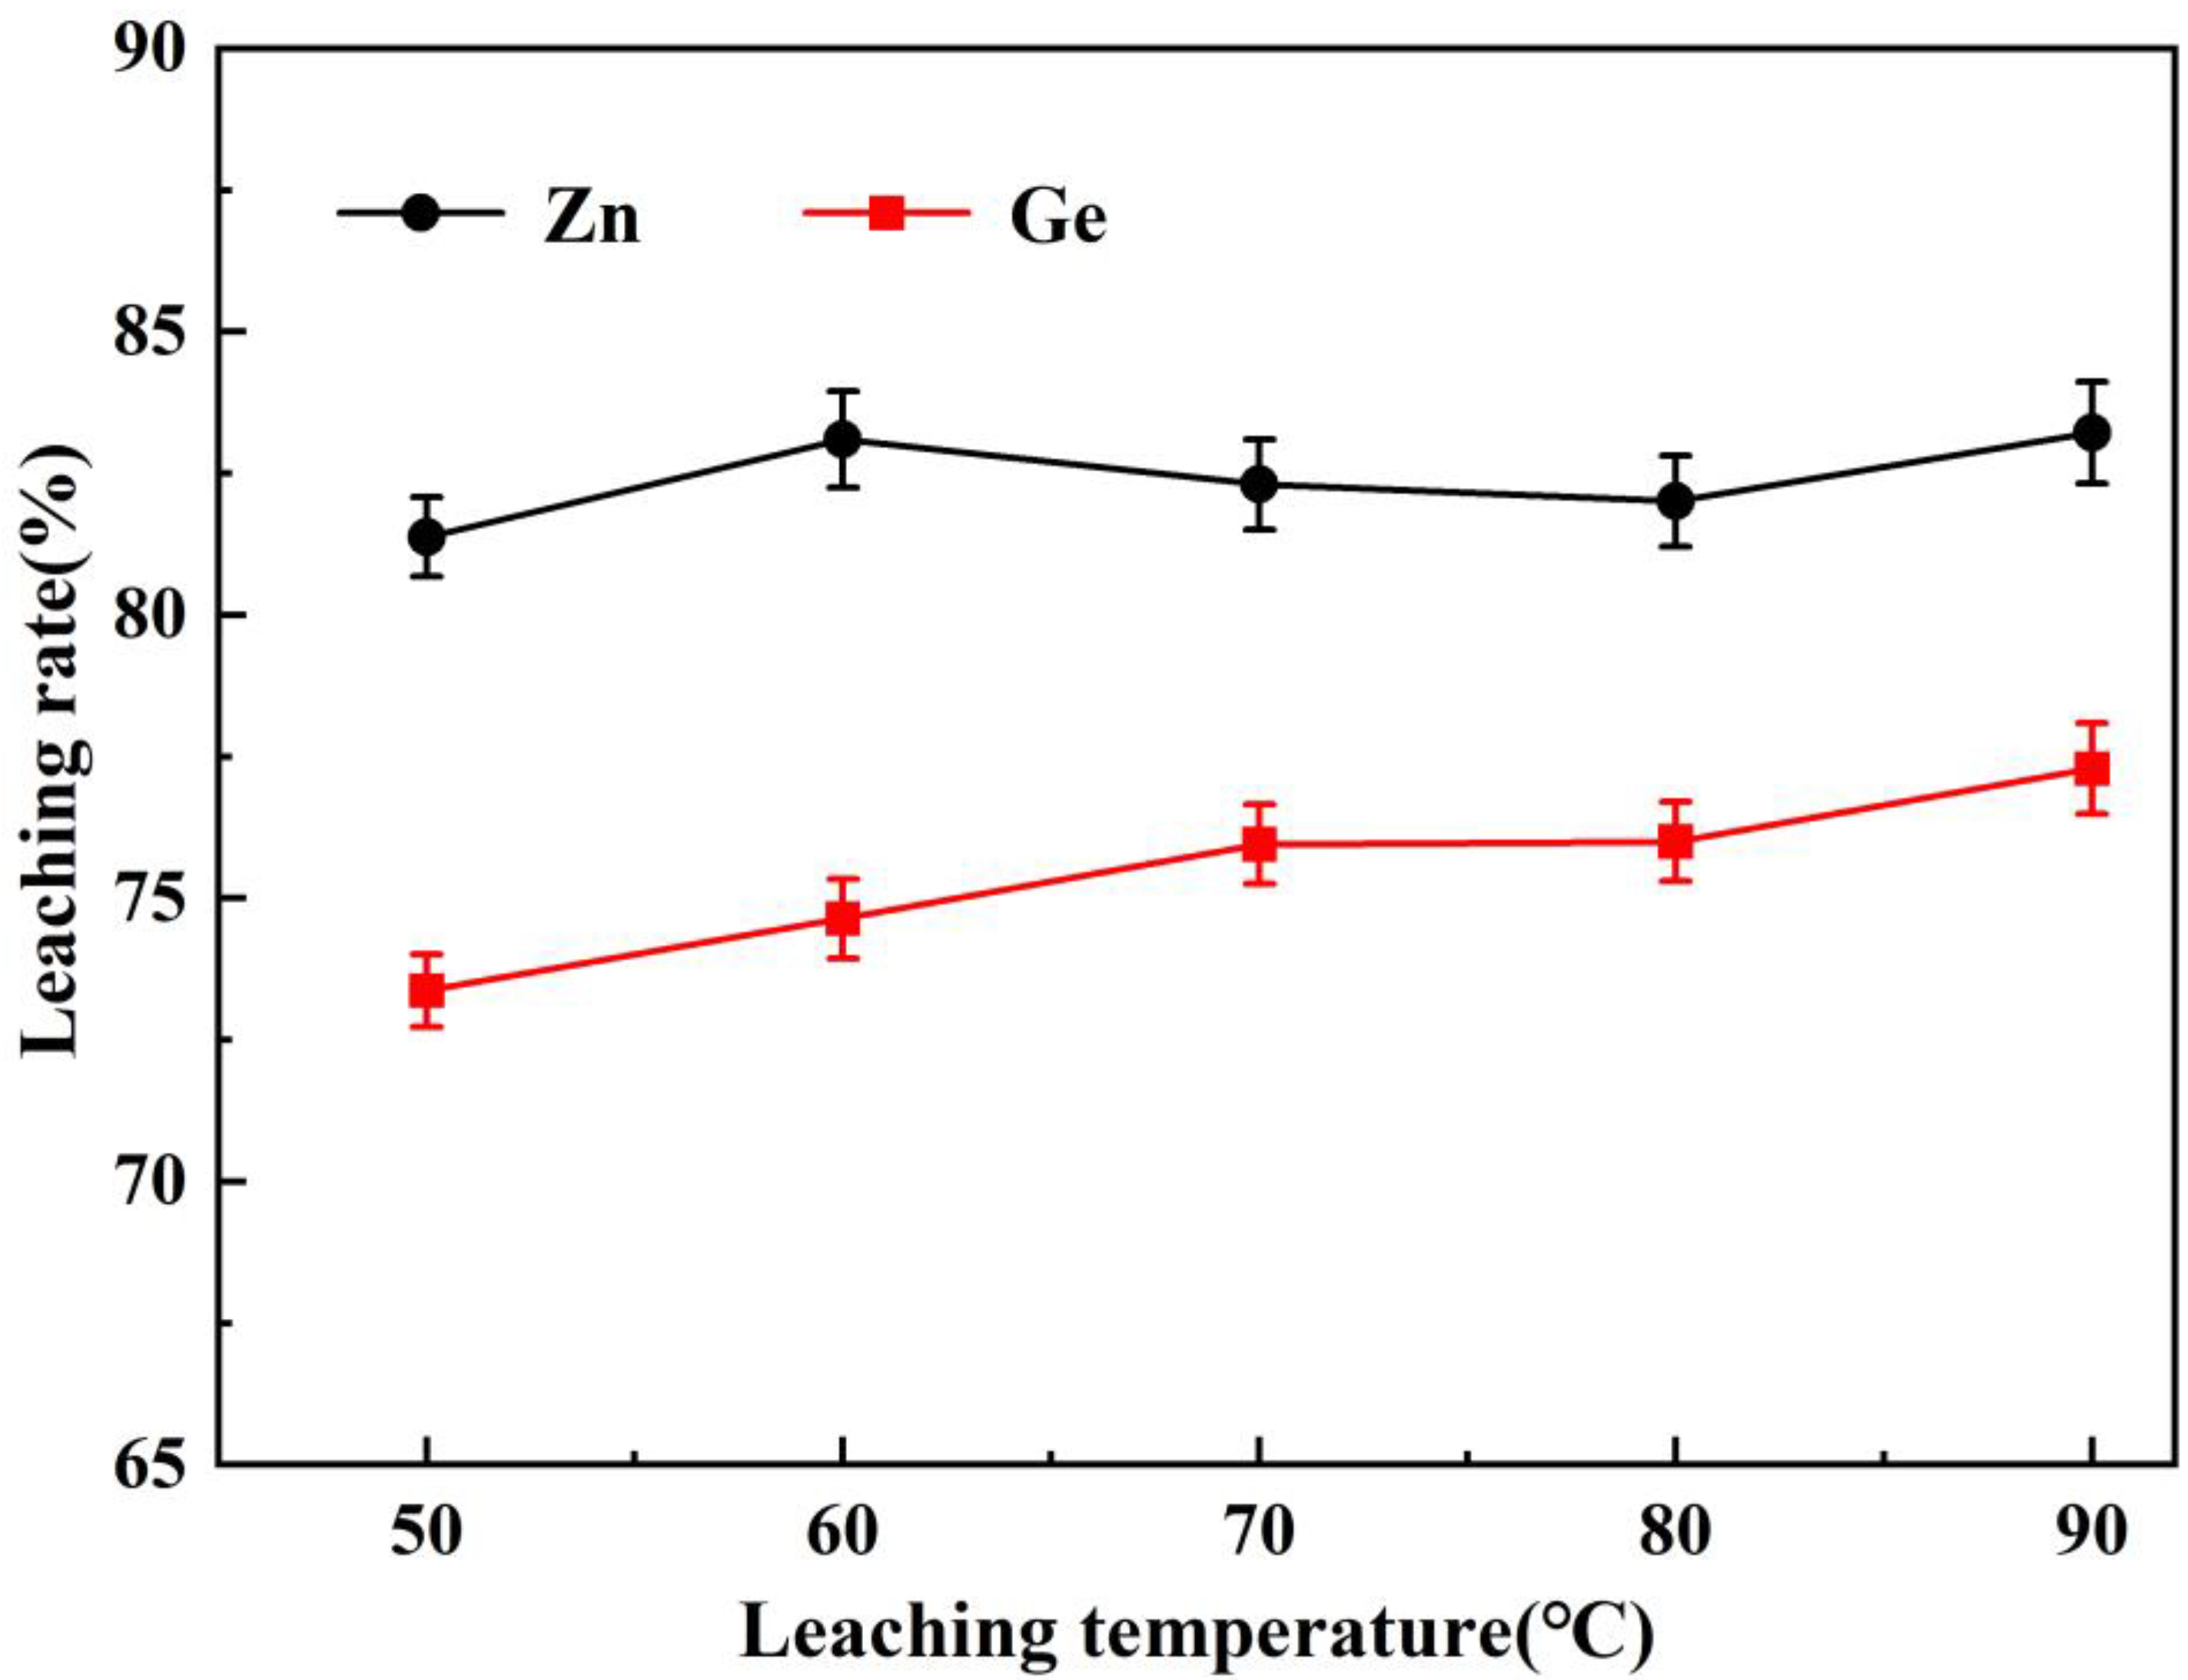
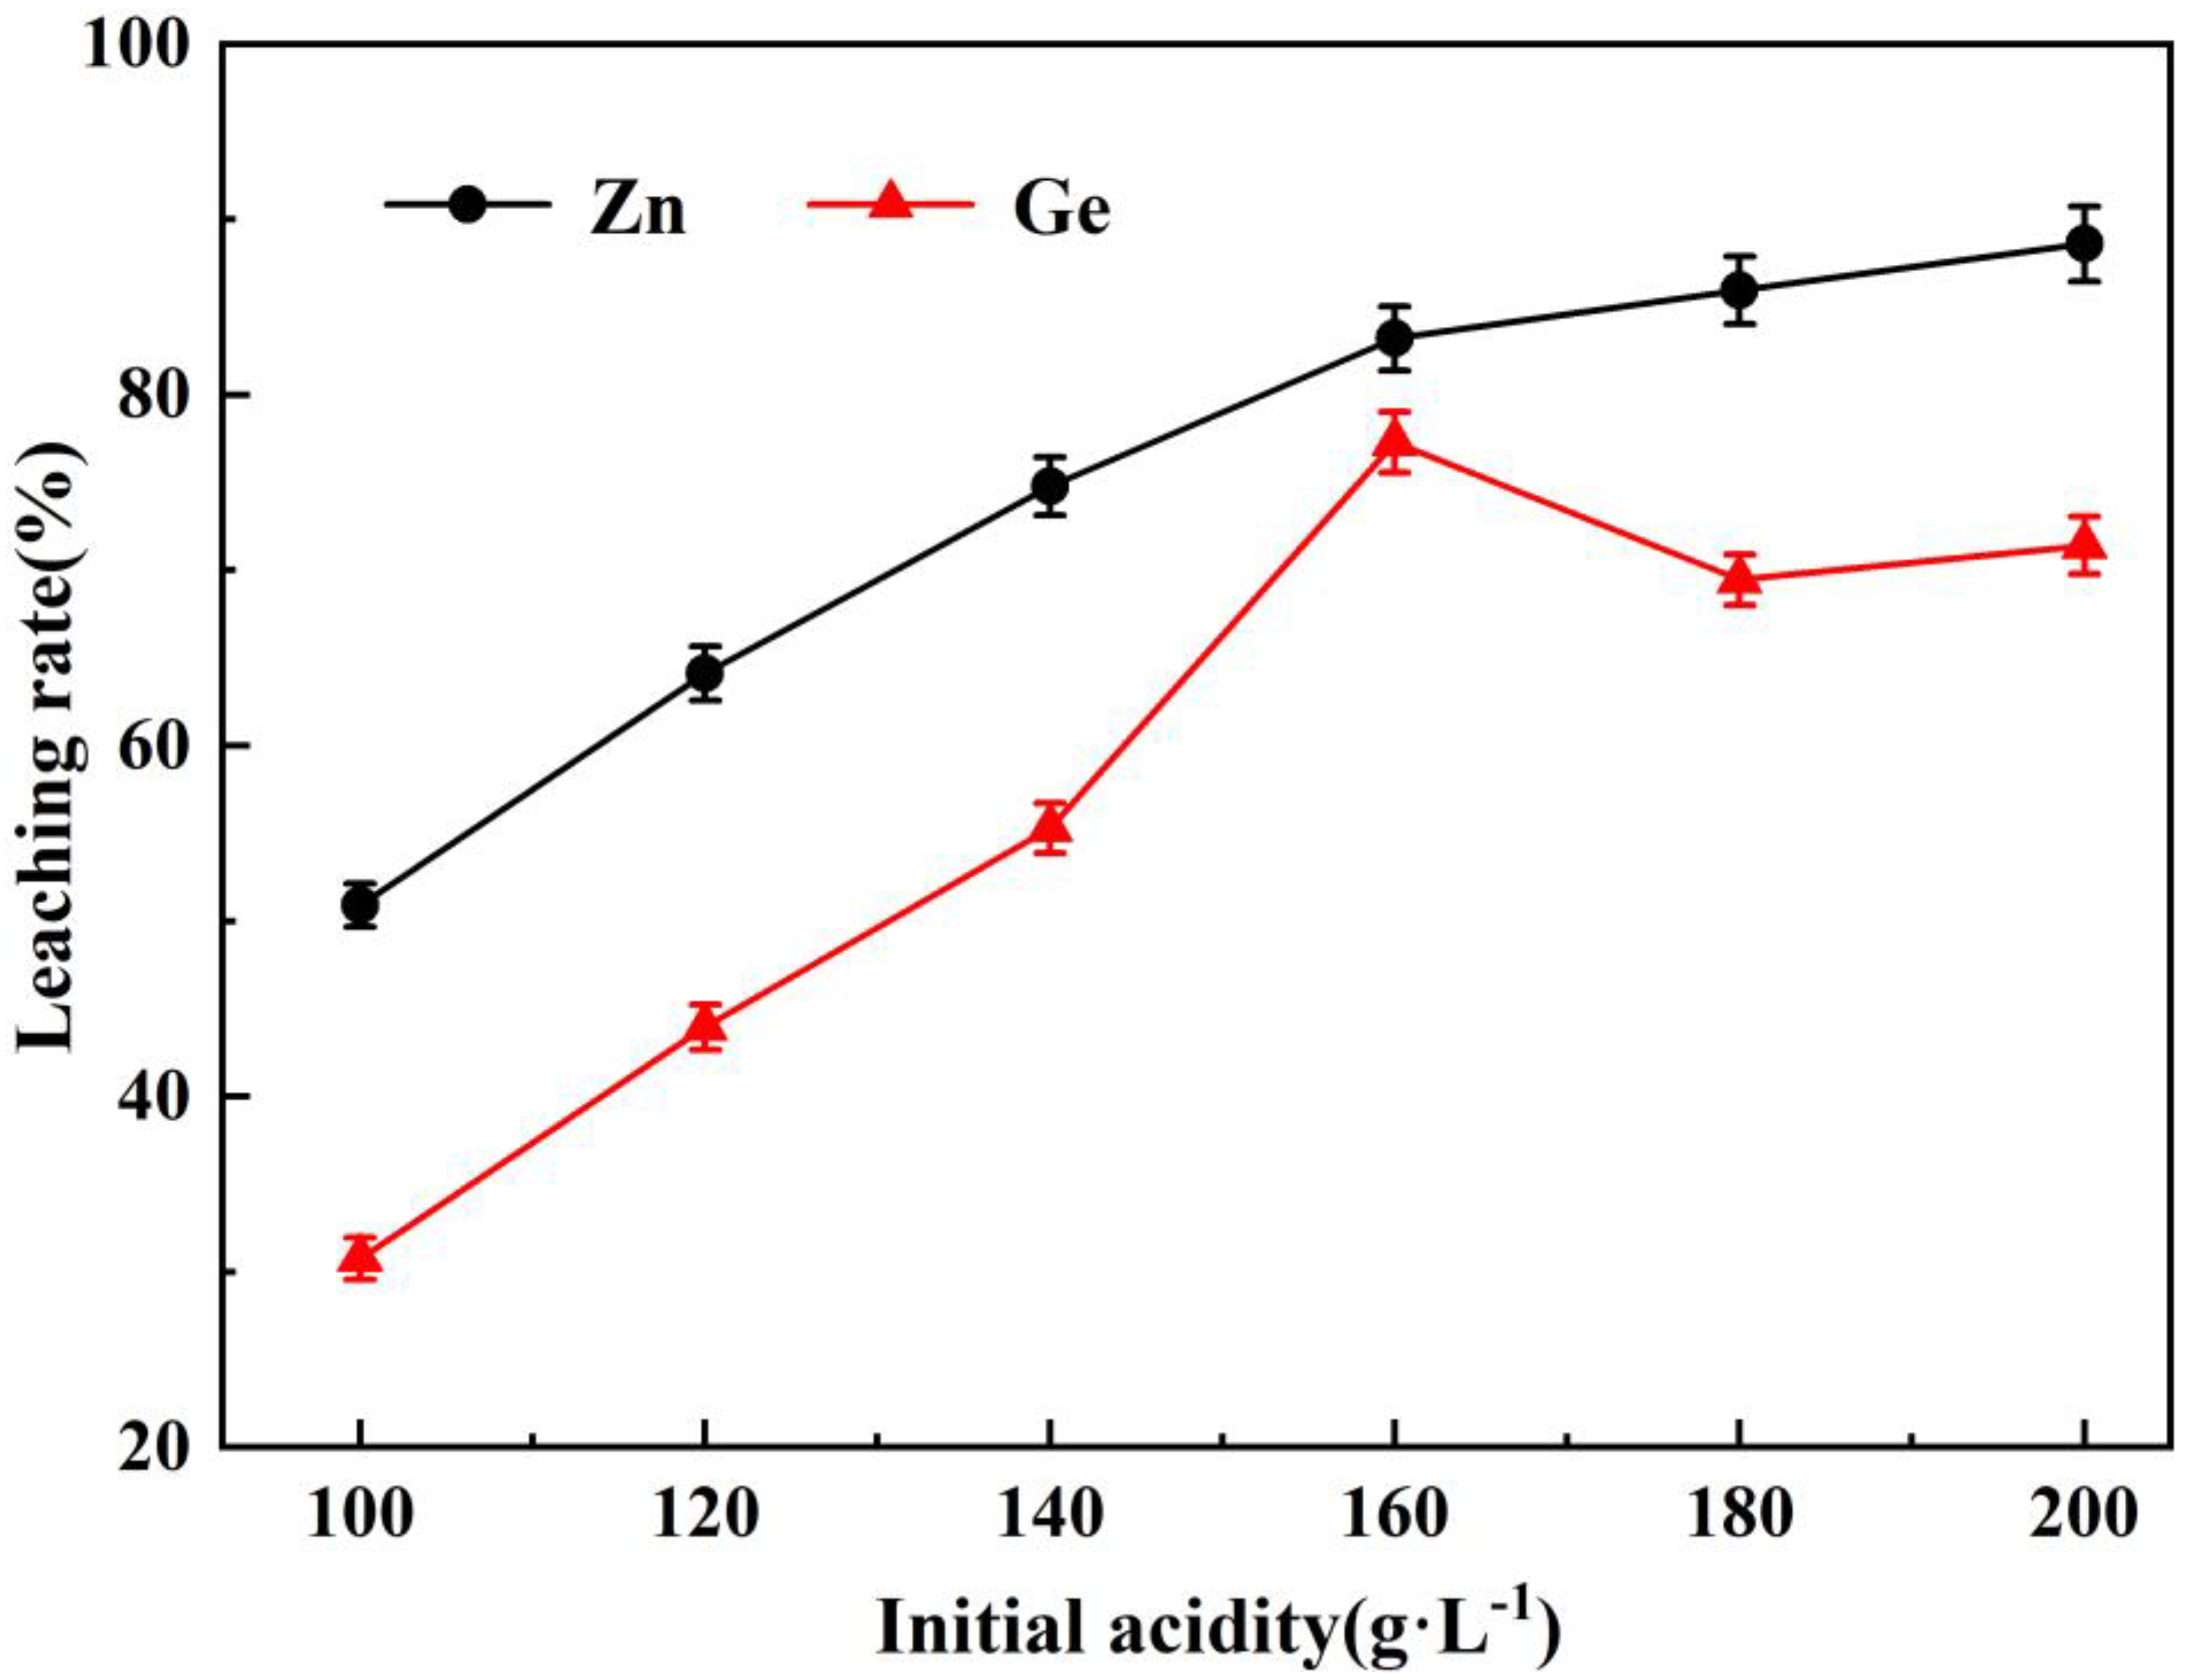
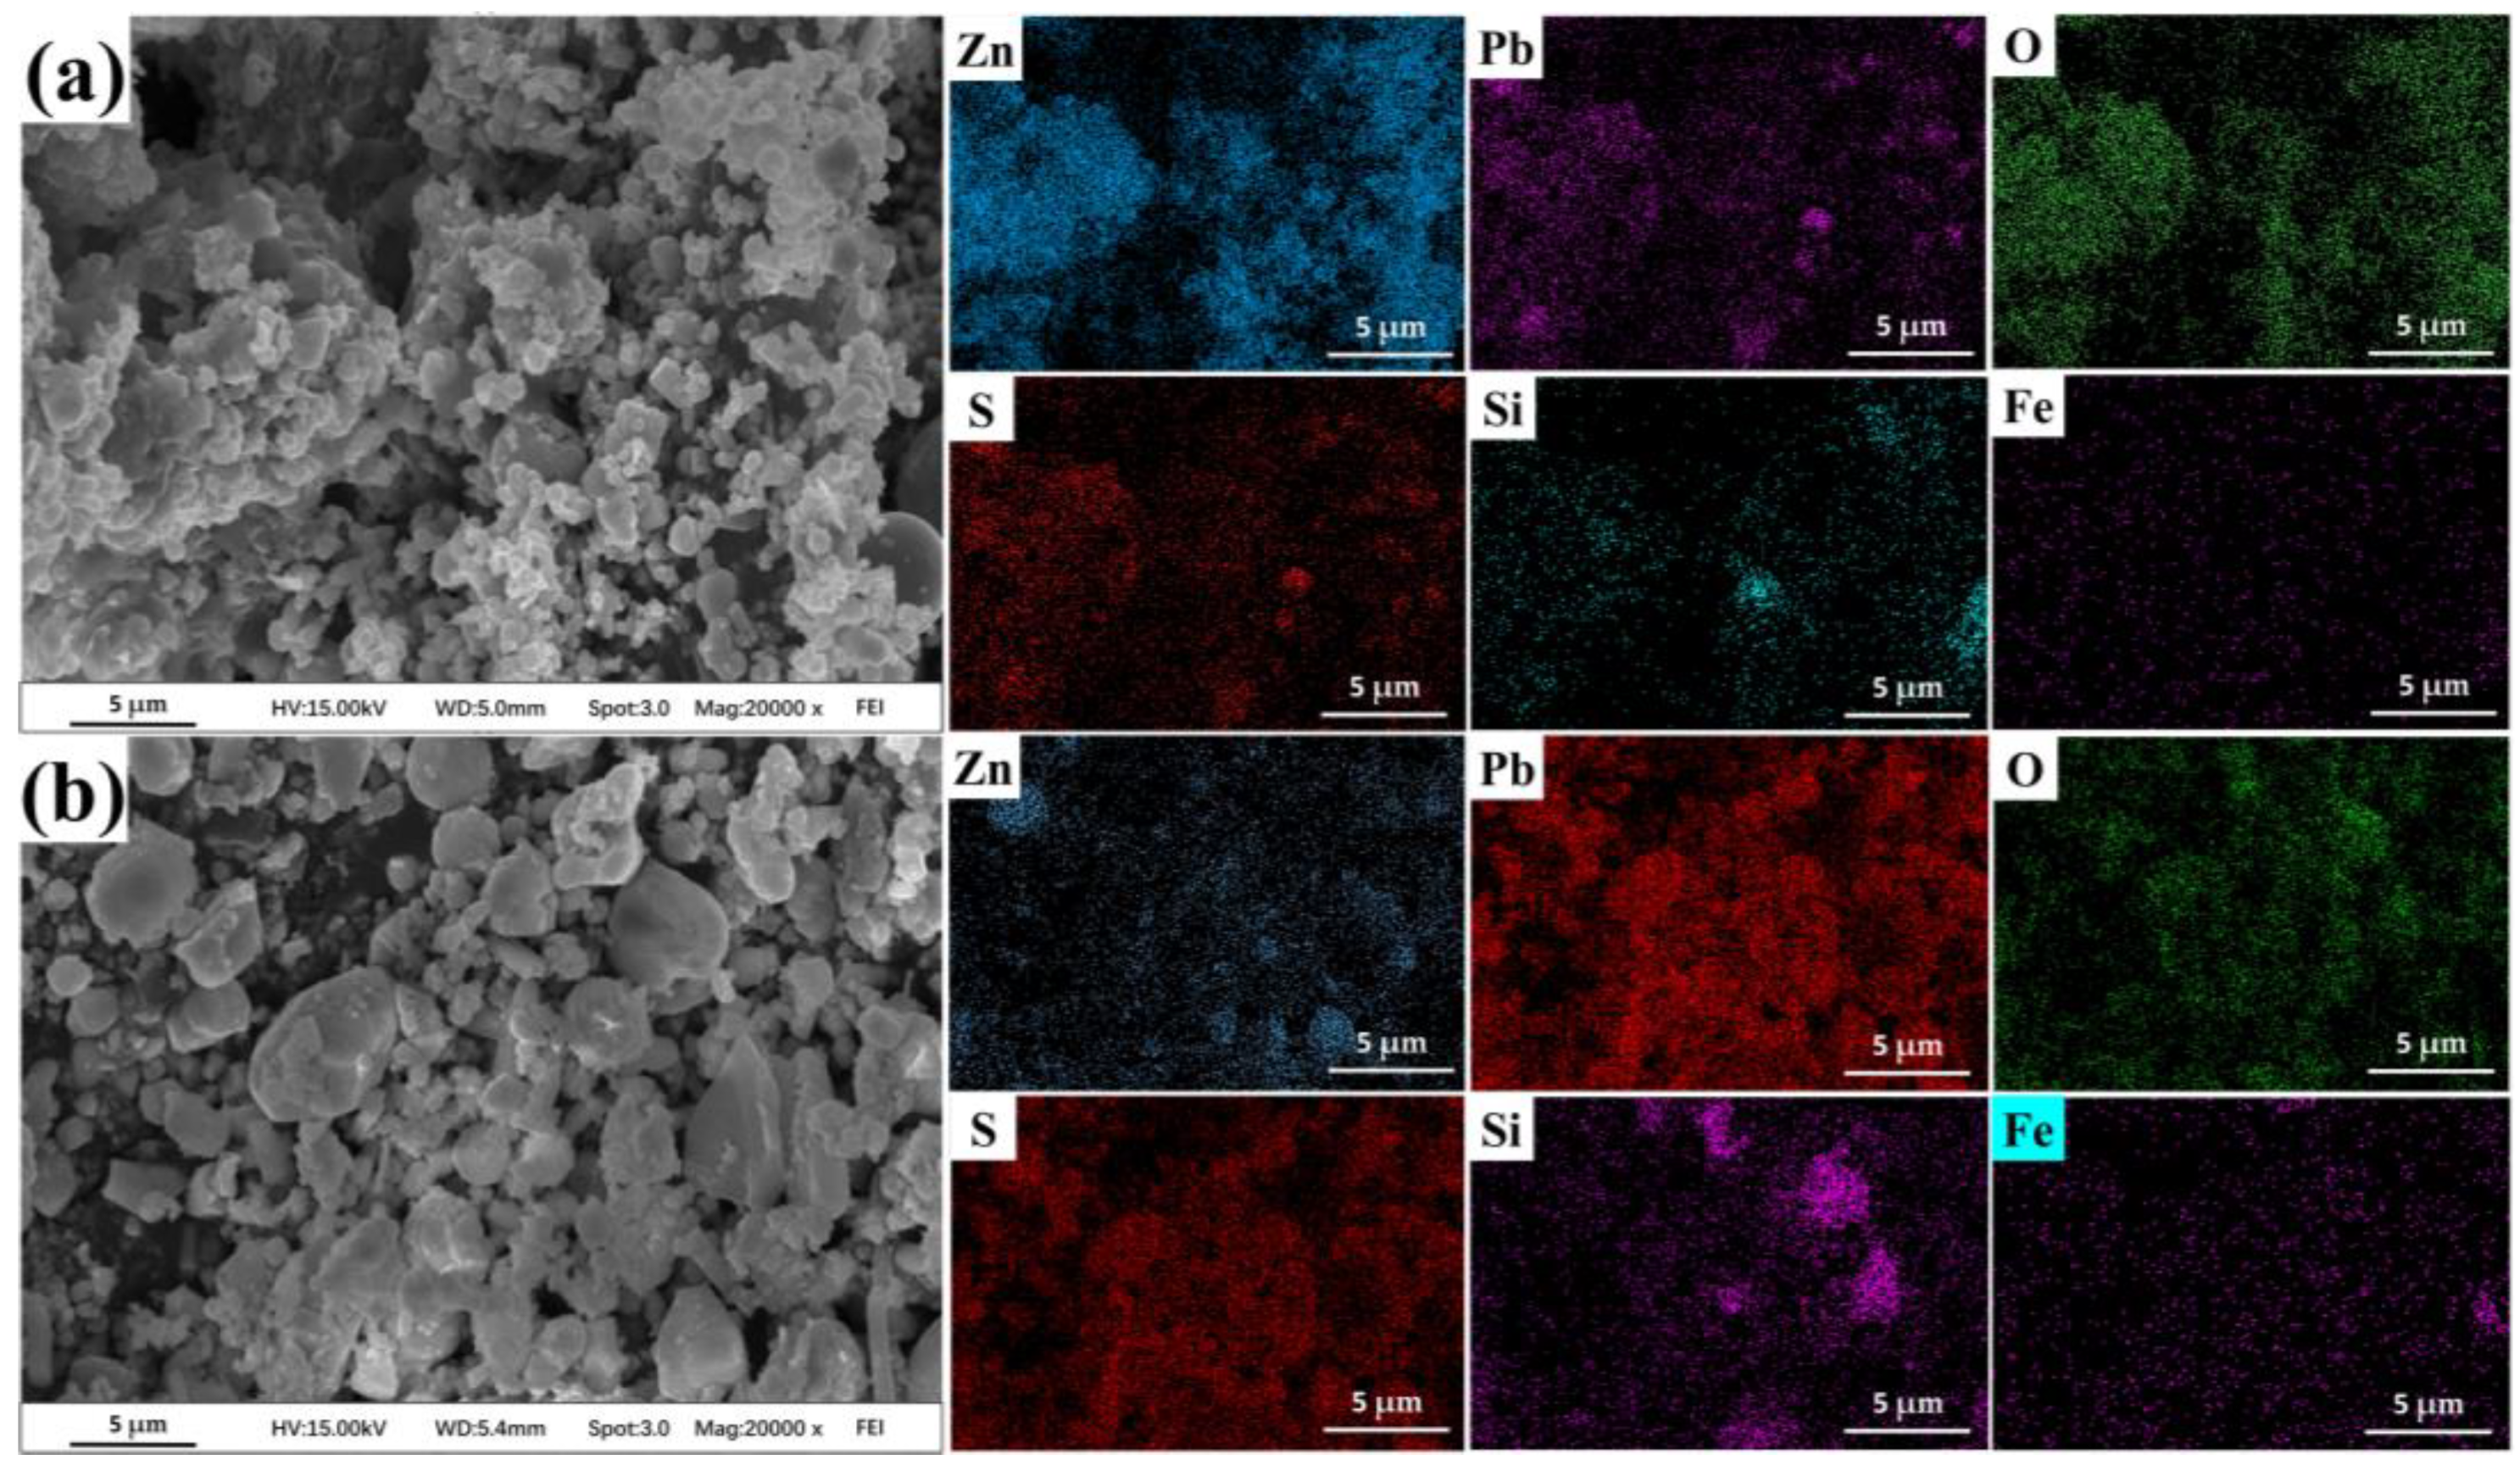
- The results of atmospheric leaching experiments show that the best reaction conditions under pH control are: leaching temperature of 90 °C, L/S mass ratio of 5:1, stirring speed of 400 r·min−1, leaching time of 60 min, and initial acidity of 160 g·L−1; under these conditions, the leaching rates of Zn and Ge are 83.22% and 77.29%, respectively. XRD and SEM-EDS show that the leaching residue is mainly composed of ZnS, PbS and PbSO4, and contains a small amount of SiO2 and Fe oxides.
- (3)
- Ge may be dispersed in ZnO, ZnS, PbS, PbSO4, SiO2 and Fe oxides. ZnO is easy to be leached by acid, while ZnS and PbS are difficult to be leached by sulfuric acid without oxidant, and SiO2 and sulfuric acid do not react. This may be one of the main reasons why the atmospheric leaching process cannot increase the Ge leaching rate.
- (4)
- The author believes that under the premise of not increasing the leaching cost and not introducing impurity ions, green and pollution-free oxidants should be added during the leaching process and external field strengthening methods should be introduced to strengthen the leaching of sulfides, such as ultrasonic waves, microwaves, etc., to achieve a low cost, high leaching rate and short leaching process which does not affect the purpose of recovering Zn and Ge in subsequent processes.
Author Contributions
Funding
Conflicts of Interest
References
- The Geological Survey of Sweden. Critical Raw Materials. Available online: https://www.sgu.se/en/mineral-resources/critical-raw-materials/ (accessed on 5 September 2022).
- Ceylan, A.; Rumaiz, A.K.; Caliskan, D.; Ozcan, S.; Ozbay, E.; Woicik, J.C. Effects of rapid thermal annealing on the structural and local atomic properties of ZnO: Ge nanocomposite thin films. J. Appl. Phys. 2015, 117, 105303. [Google Scholar] [CrossRef]
- Depuydt, B.; Theuwis, A.; Romandic, I. Germanium: From the first application of Czochralski crystal growth to large diameter dislocation-free wafers. Mat. Sci. Semicon. Proc. 2006, 9, 437–443. [Google Scholar] [CrossRef]
- Zhang, L.G.; Xu, Z.M. Application of vacuum reduction and chlorinated distillation to enrich and prepare pure germanium from coal fly ash. J. Hazard. Mater. 2017, 321, 18–27. [Google Scholar] [CrossRef]
- Claeys, C.; Simoen, E. Germanium-based technologies: From materials to devices. Mater. Today 2007, 10, 53. [Google Scholar]
- Frenzel, M.; Ketris, M.P.; Gutzmer, J. On the geological availability of germanium. Miner. Depos. 2014, 49, 471–486. [Google Scholar] [CrossRef]
- Seredin, V.V. From coal science to metal production and environmental protection: A new story of success Commentary. Int. J. Coal Geol. 2012, 90, 1–3. [Google Scholar] [CrossRef]
- Dutta, S.K.; Lodhari, D.R. Extraction of Nuclear and Non-ferrous Metals; Springer Nature: Berlin/Heidelberg, Germany, 2018. [Google Scholar]
- Jiang, T.; Zhang, T.; Liu, Z.H. Pb-based aggregate, Ge-galena coexistence, and Ge-anglesite coprecipitate-Limitations and an improvement of germanium recovery from secondary zinc oxide via H2SO4 leaching. Hydrometallurgy 2020, 10, 5543. [Google Scholar] [CrossRef]
- Guo, X.Y.; Yi, Y.; Shi, J.; Tian, Q.H. Leaching behavior of metals from high-arsenic dust by NaOH-Na2S alkaline leaching. Trans. Nonferr. Metal. Soc. 2016, 26, 575–580. [Google Scholar] [CrossRef]
- Kul, M.; Oskay, K.O.; Şimşir, M.; Sübütay, H.; Kirgezen, H. Optimization of selective leaching of Zn from electric arc furnace steelmaking dust using response surface methodology. Trans. Nonferr. Metal. Soc. 2015, 25, 2753–2762. [Google Scholar] [CrossRef]
- Li, Q.; Rao, X.F.; Xu, B.; Yang, Y.B.; Liu, T.; Jiang, T.; Hu, L. Extraction of manganese and zinc from their compound ore by reductive acid leaching. Trans. Nonferr. Metal. Soc. 2017, 27, 1172–1179. [Google Scholar] [CrossRef]
- Lutandula, M.S.; Kashala, G.N. Zinc oxide production through reprocessing of the electric arc furnace flue dusts. J. Environ. Chem. Eng. 2013, 1, 600–603. [Google Scholar] [CrossRef]
- Ding, W.; Bao, S.X.; Zhang, Y.; Xiao, J.H. Efficient selective extraction of scandium from red mud. Miner. Process. Extr. Metall. Rev. 2022, 1–9. [Google Scholar] [CrossRef]
- Liu, F.P.; Liu, Z.H.; Li, Y.H.; Liu, Z.Y.; Li, Q.H.; Zeng, L. Extraction of gallium and germanium from zinc refinery residues by pressure acid leaching. Hydrometallurgy 2016, 64, 313–320. [Google Scholar] [CrossRef]
- Wang, W.K.; Wang, F.C.; Lu, F.H. Microwave alkaline roasting-water dissolving process for germanium extraction from zinc oxide dust and its analysis by response surface methodology (RSM). Metall. Res. Technol. 2018, 115, 203. [Google Scholar] [CrossRef]
- Wei, Q.X.; Yang, C.J.; Chang, J.; Peng, J.H.; Chen, J. Kinetics of microwave roasting of zinc slag oxidation dust with concentrated sulfuric acid and water leaching. Chem. Eng. Process. 2015, 97, 75–83. [Google Scholar]
- Li, M.; Peng, B.; Chai, L.Y.; Peng, N.; Xie, X.D.; Yan, H. Technological mineralogy and environmental activity of zinc leaching residue from zinc hydrometallurgical process. Trans. Nonferr. Metal. Soc. 2013, 23, 1480–1488. [Google Scholar] [CrossRef]
- Min, X.B.; Xie, X.D.; Chai, L.Y.; Liang, Y.J.; Yong, K.E. Environmental availability and ecological risk assessment of heavy metals in zinc leaching residue. Trans. Nonferr. Metal. Soc. 2013, 23, 208–218. [Google Scholar] [CrossRef]
- Chen, B.; Bao, S.X.; Zhang, Y.M.; Ren, L.Y. A novel and sustainable technique to precipitate vanadium from vanadium-rich solutions via efficient ultrasound irradiation. J. Clean. Prod. 2022, 339, 130755. [Google Scholar] [CrossRef]
- Leclerc, N.; Meux, E.; Lecuire, J.M. Hydrometallurgical extraction of zinc from zinc ferrites. Hydrometallurgy 2003, 70, 175–183. [Google Scholar] [CrossRef]
- Antrekowitsch, J.; Antrekowitsch, H. Hydro-metallurgically recovering zinc from electric arc furnace dusts. JOM 2001, 53, 26–28. [Google Scholar] [CrossRef]
- Oustadakis, P.; Tsakiridis, P.E.; Katsiapi, A.; Agatzini-Leonardou, S. Hydrometallurgical process for zinc recovery from electric arc furnace dust (EAFD). Part I: Characterization and leaching by diluted sulphuric acid. J. Hazard. Mater. 2010, 179, 1–7. [Google Scholar] [CrossRef] [PubMed]
- Pickles, C.A. Thermodynamic modelling of the formation of zinc-manganese ferrite spinel in electric arc furnace dust. J. Hazard. Mater. 2010, 179, 309–317. [Google Scholar] [CrossRef] [PubMed]
- Orhan, G. Leaching and cementation of heavy metals from electric arc furnace dust in alkaline medium. Hydrometallurgy 2005, 78, 236–245. [Google Scholar] [CrossRef]
- Takahiro, M.; Romcha, T.C.F.; Katsuy, A.M.; Nagasaka, T. Hydrometallurgical extraction of zinc from CaO treated EAF dust in ammonium chloride solution. J. Hazard. Mater. 2016, 302, 90–96. [Google Scholar]
- Liang, D.; Wang, J.; Wang, Y. Germanium recovery by co-precipitation of germanium and iron in conventional zinc metallurgy. J. S. Afr. Inst. Min. Metall. 2008, 108, 715–771. [Google Scholar]
- Liu, F.P.; Liu, Z.H.; Li, Y.H. Recovery and separation of gallium(III) and germanium(IV) from zinc refinery residues: Part I: Leaching and iron(III) removal. Hydrometallurgy 2017, 169, 564–570. [Google Scholar] [CrossRef]
- Zhang, T.; Jiang, T.; Liu, Z. Recovery of Ge(IV) from synthetic leaching solution of secondary zinc oxide by solvent extraction using tertiary amine (N235) as extractant and trioctyl phosphate (TOP) as modifier. Miner. Eng. 2019, 136, 155–160. [Google Scholar] [CrossRef]
- Zhang, F.; Wei, C.; Deng, Z.G.; Li, C.X.; Li, X.B.; Li, M.T. Reductive leaching of zinc and indium from industrial zinc ferrite particulates in sulphuric acid medi. Trans. Nonferr. Metal. Soc. 2016, 26, 2495–2501. [Google Scholar] [CrossRef]
- Ding, W.; Bao, S.X.; Zhang, Y.; Xiao, J.H. Mechanism and kinetics study on ultrasound assisted leaching of gallium and zinc from corundum flue dust. Miner. Eng. 2022, 183, 107624. [Google Scholar] [CrossRef]
- Chen, B.; Bao, S.X.; Zhang, Y.M. Synergetic strengthening mechanism of ultrasound combined with calcium fluoride towards vanadium extraction from low-grade vanadium-bearing shale. Int. J. Min. Sci. Technol. 2021, 31, 1095–1106. [Google Scholar] [CrossRef]
- Xin, C.F.; Xia, H.Y.; Zhang, Q.; Zhang, L.B.; Zhang, W. Leaching of zinc and germanium from zinc oxide dust in sulfuric acid-ozone media. Arab. J. Chem. 2021, 14, 103450. [Google Scholar] [CrossRef]
- Xin, C.F.; Xia, H.Y.; Jiang, G.Y.; Zhang, Q.; Zhang, L.B.; Xu, Y.J.; Cai, W.C. Mechanism and kinetics study on ultrasonic combined with oxygen enhanced leaching of zinc and germanium from germanium-containing slag dust. Sep. Purif. Technol. 2022, 302. [Google Scholar] [CrossRef]
- Jiang, T.; Zhang, T.; Ye, F.C.; Liu, Z. Occurrence state and sulfuric-acid leaching behavior of germanium in secondary zinc oxide. Miner. Eng. 2019, 137, 334–343. [Google Scholar] [CrossRef]
- Huang, H.H. The Eh-pH diagram and its advances. Metals 2016, 6, 23. [Google Scholar] [CrossRef] [Green Version]
- Wang, X.; Zhong, Y.W.; Kang, Y.Z.; Gao, J.T.; Guo, Z.C. Promoted acid leaching of Zn from hazardous zinc-containing metallurgical dusts: Focusing on transformation of Zn phases in selective reduction roasting. Process. Saf. Environ. 2022, 163, 353–361. [Google Scholar] [CrossRef]
- Stefánsson, A. Iron(III) Hydrolysis and Solubility at 25 °C. Environ. Sci. Technol. 2007, 41, 6117–6123. [Google Scholar] [CrossRef]
- Lin, H.; Wu, J.; Zhang, H. Degradation of bisphenol a in aqueous solution by a novel electro/Fe3+/peroxydisulfate process. Sep. Purif. Technol. 2013, 117, 18–23. [Google Scholar] [CrossRef]
- Chiou, C.S.; Chen, Y.H.; Chang, C.T.; Chang, C.Y.; Shie, J.L.; Li, Y.S. Photochemical mineralization of di-n-butyl phthalate with H2O2/Fe3+. J. Hazard. Mater. 2006, 135, 344–349. [Google Scholar] [CrossRef]


| Element | Zn | Pb | S | Fe | As | K | Si | Cd | Ag | Ge | Others (e.g., O) |
|---|---|---|---|---|---|---|---|---|---|---|---|
| Content, wt.% | 49. 65 | 15.92 | 4.70 | 3.02 | 0.99 | 0.66 | 0.58 | 0.48 | 314.8 g/t | 620.4 g/t | 23.90 |
| Phase | ZnO | ZnS | ZnSO4 | ZnFe2O4 | Total |
|---|---|---|---|---|---|
| Zn content, wt.% | 42.66 | 5.31 | 0.92 | 0.76 | 49.65 |
| Distribution, % | 85.92 | 10.69 | 1.85 | 1.54 | 100 |
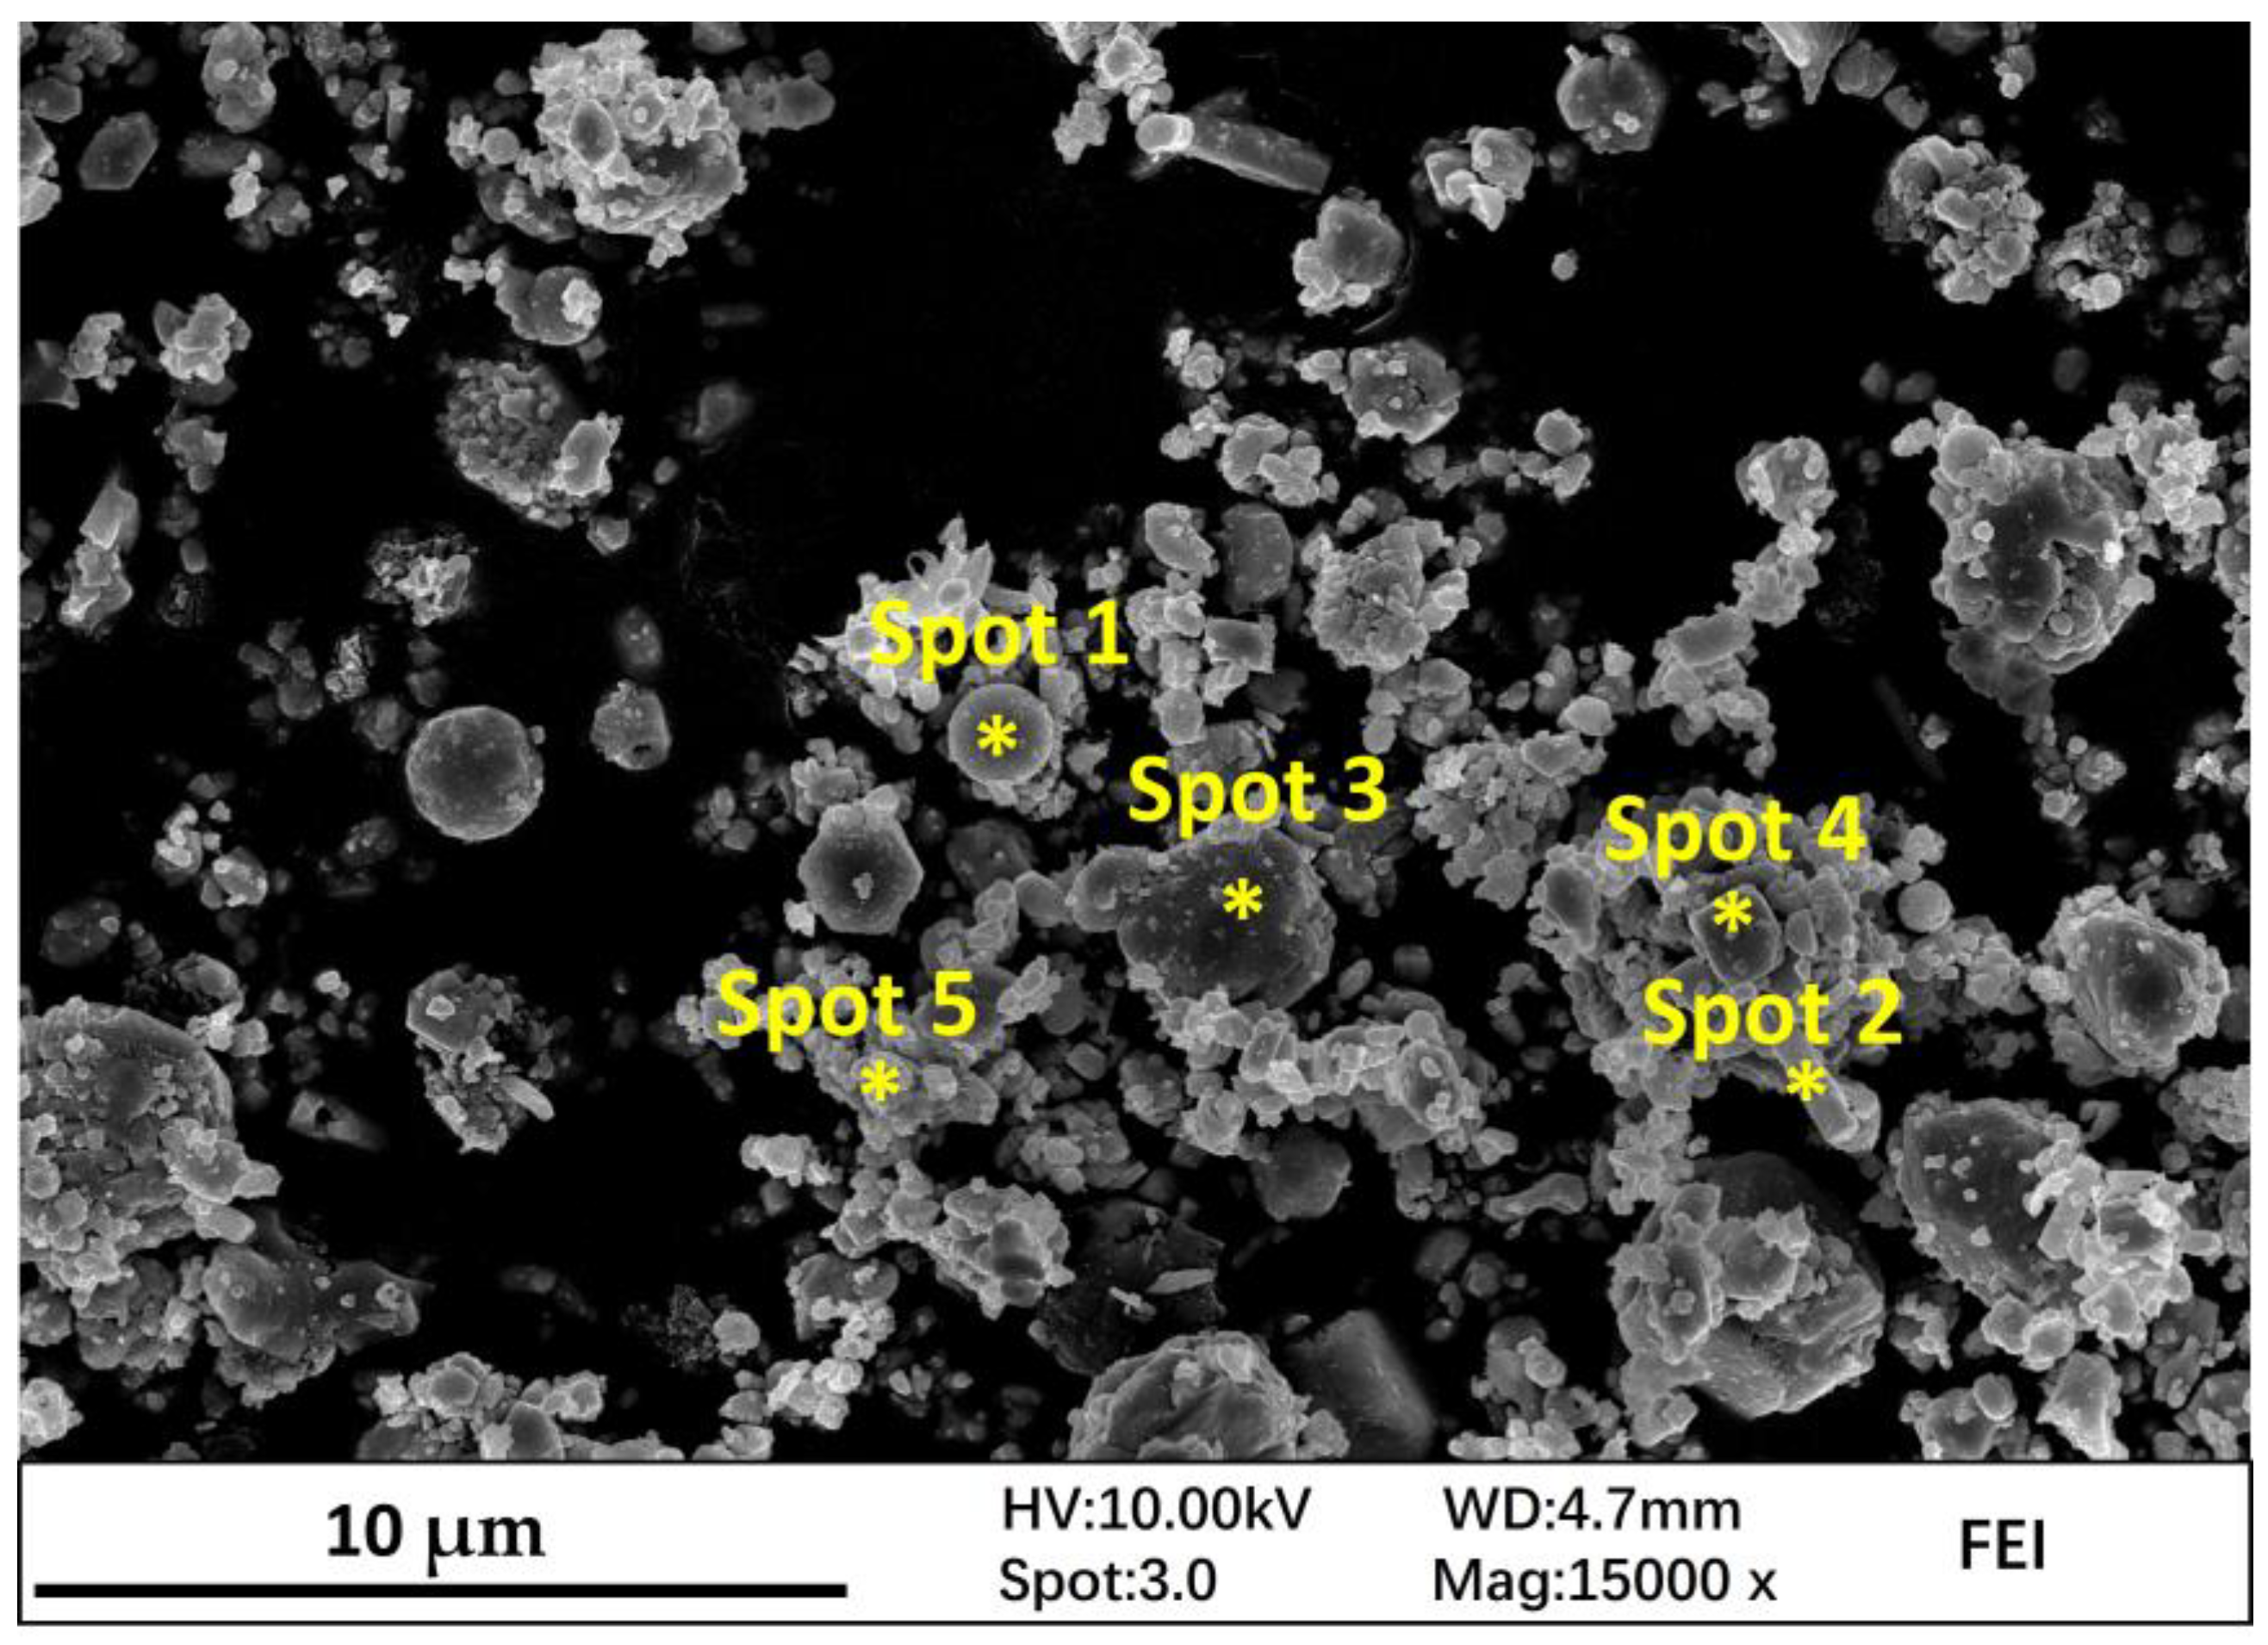
| Item | Spot 1 | Spot 2 | Spot 3 | Spot 4 | Spot 5 | |||||
|---|---|---|---|---|---|---|---|---|---|---|
| wt.% | at.% | wt.% | at.% | wt.% | at.% | wt.% | at.% | wt.% | at.% | |
| Zn | 12.24 | 11.1 | 46.74 | 25.09 | 65.12 | 32.50 | 60.41 | 35.14 | 63.86 | 36.86 |
| Pb | 64.01 | 18.31 | 9.25 | 1.57 | 0.00 | 0.00 | 11.31 | 2.07 | 8.20 | 1.49 |
| O | 14.39 | 53.3 | 21.56 | 47.29 | 31.34 | 63.90 | 24.57 | 58.39 | 24.21 | 57.09 |
| S | 9.36 | 17.3 | 2.52 | 2.76 | 3.54 | 3.60 | 3.71 | 4.40 | 2.84 | 3.34 |
| Si | 0.00 | 0.00 | 9.56 | 11.95 | 0.00 | 0.00 | 0.00 | 0.00 | 0.90 | 1.21 |
| Al | 0.00 | 0.00 | 7.17 | 9.33 | 0.00 | 0.00 | 0.00 | 0.00 | 0.00 | 0.00 |
| Fe | 0.00 | 0.00 | 3.18 | 2.00 | 0.00 | 0.00 | 0.00 | 0.00 | 0.00 | 0.00 |
| Element | Pb | Zn | S | Fe | Si | Al | As | Ge | Others (e.g., O) |
|---|---|---|---|---|---|---|---|---|---|
| Content, wt.% | 35.77 | 19.00 | 10.34 | 6.35 | 2.24 | 1.26 | 1.00 | 0.03 | 24.01 |
| Item | Spot 1 | Spot 2 | Spot 3 | Spot 4 | Spot 5 |
|---|---|---|---|---|---|
| wt.% | wt.% | wt.% | wt.% | wt.% | |
| Zn | 59.0 | 30.4 | 18.0 | 6.8 | 21.5 |
| Pb | 19.7 | 35.4 | 23.6 | 68.0 | 40.6 |
| O | 16.7 | 29.3 | 51.9 | 15.1 | 28.1 |
| S | 4.0 | 4.2 | 6.4 | 10.1 | 9.8 |
| Si | 0.6 | 0.4 | 0.00 | 0.00 | 0.00 |
| Fe | 0.00 | 0.2 | 0.00 | 0.00 | 0.00 |
Publisher’s Note: MDPI stays neutral with regard to jurisdictional claims in published maps and institutional affiliations. |
© 2022 by the authors. Licensee MDPI, Basel, Switzerland. This article is an open access article distributed under the terms and conditions of the Creative Commons Attribution (CC BY) license (https://creativecommons.org/licenses/by/4.0/).
Share and Cite
Xin, C.; Xia, H.; Jiang, G.; Zhang, Q.; Zhang, L.; Xu, Y. Studies on Recovery of Valuable Metals by Leaching Lead–Zinc Smelting Waste with Sulfuric Acid. Minerals 2022, 12, 1200. https://doi.org/10.3390/min12101200
Xin C, Xia H, Jiang G, Zhang Q, Zhang L, Xu Y. Studies on Recovery of Valuable Metals by Leaching Lead–Zinc Smelting Waste with Sulfuric Acid. Minerals. 2022; 12(10):1200. https://doi.org/10.3390/min12101200
Chicago/Turabian StyleXin, Chunfu, Hongying Xia, Guiyu Jiang, Qi Zhang, Libo Zhang, and Yingjie Xu. 2022. "Studies on Recovery of Valuable Metals by Leaching Lead–Zinc Smelting Waste with Sulfuric Acid" Minerals 12, no. 10: 1200. https://doi.org/10.3390/min12101200