Article

Kinetic Modeling and Mechanisms of Manganese Removal from Alkaline Mine Water Using a Pilot Scale Column Reactor

1
Faculty of Science and Engineering, Waseda University, 3-4-1 Okubo, Shinjuku-ku, Tokyo 169-8555, Japan
2
Graduate School of Creative Science and Engineering, Waseda University, 3-4-1 Okubo, Shinjuku-ku, Tokyo 169-8555, Japan
3
Nagaoka International Corp., 1-8-15 Azuchimachi, Chuo-ku, Osaka 541-0052, Japan
4
Faculty of Engineering, The University of Tokyo, 7-3-1 Hongo, Bunkyo-ku, Tokyo 113-8656, Japan
*
Author to whom correspondence should be addressed.
Minerals 2022, 12(1), 99; https://doi.org/10.3390/min12010099
Submission received: 25 December 2021 / Revised: 13 January 2022 / Accepted: 13 January 2022 / Published: 15 January 2022
(This article belongs to the Topic Advances in Separation and Purification Techniques)

Abstract

:
Manganese (Mn) is a major element in various aqueous and soil environments that is sometimes highly concentrated in mine water and other mineral processing wastewater. In this study, we investigated Mn removal from alkaline mine water (pH > 9) with an Mn-coated silica sand packed into a pilot-scale column reactor and examined the specific reaction mechanism using X-ray absorption near-edge structure (XANES) analysis and geochemical kinetic modeling. The kinetic effect of dissolved Mn(II) removal by birnessite (δ-Mn(IV)O2) at pH 6 and 8 was evaluated at different Mn(II)/Mn(IV) molar ratios of 0.1–10. Our results confirmed the positive effect of the presence of δ-MnO2 on the short-term removal (60 min) of dissolved Mn. XANES analysis results revealed that δ-MnO2 was more abundant than Mn(III)OOH in the reactor, which may have accumulated during a long-term reaction (4 months) after the reactor was turned on. A gradual decrease in dissolved Mn(II) concentration with depth was observed in the reactor, and comparison with the kinetic modeling result confirmed that δ-MnO2 interaction was the dominant Mn removal mechanism. Our results show that δ-MnO2 contents could play a significant role in controlling Mn removability from mine water in the reactor.

1. Introduction

Manganese (Mn) is present as a major element in various aqueous and soil environments with different stable oxidation numbers (+ II, +III, +IV, +VI, and +VII); it shows similar bio-geochemical behavior to iron (Fe) in the environment. Mining activities and mineral processing often produce Mn-rich water with concentrations of 100–1000 mg L−1 [1]. Mn is less toxic than other major trace metals (copper (Cu), zinc (Zn), and cadmium (Cd)) and metalloids (arsenic (As) and antimony (Sb)) but sometime shows similar toxicity to lead (Pb) to most animals, including humans and various aquatic organisms; however, long-term exposure to high Mn-containing water is reported to cause chronic toxicity in the nervous and respiratory systems of living organisms [2,3]. Therefore, Mn removal from wastewater to a trace level is required to reduce the negative impacts on the aqueous environment and human health; the guidelines established by the World Health Organization limit the Mn concentration in drinking water to 0.4 mg L−1, which is 20-times lower than the effluent standard of Japan (10 mg L−1) [4,5].
Among metals generally contained in mine water, ferric ion (Fe(III)) and aluminum (Al) are precipitated at around pH 2–3 and 3–5 to form hydroxide, respectively; as a result, trace metals such as Pb, Cu, Zn, and Cd are effectively removed by surface complexation and/or coprecipitation with those hydroxides at pH 4–8 when the mine water contains sufficient amounts of Fe(III) and Al rather than the removal of target metals [6,7,8]. On the other hand, Mn is difficult to remove by hydroxide formation without oxidation because its hydroxide (Mn(II)(OH)2) is formed at pH 11 and its abiotic oxidation rate by atmospheric air is very slow; e.g., half-life time is 3–7 days for 5 μM Mn(II) at pH 8.8 [9]. For these reasons, various Mn removal processes from neutral–alkaline pH water is conducted without additional alkaline reagents like slake and quick limes.
Biological processes using Mn-oxidizing bacteria (MOB) have been suggested as an effective Mn removal process. The oxidation rate of Mn(II) by MOB is reported to be about five times higher than abiotic oxidation [10]. For Mn removal from mine water using a passive treatment technique, Fuchida et al. [11] found that Mn could be removed effectively from water at pH 6–8 using subsurface limestone beds (SLB) installed at the Motokura mine, in Hokkaido, Japan, and biological analysis using a next generation sequencer evidenced that the microorganism activity of the MOB in the SLB provided an opportunity for Mn (IV) dioxide (MnO2) to form. The results from field observations and fundamental experiments indicate that MOB is appliable for the removal of Mn from mine water; however, MOB is generally heterotrophic but not autotrophic [12]. Thus, a continuous supplement of an energy source such as organic matter and the most suitable physicochemical conditions such as temperature and pH are issues when trying to maintain the removal performance of the reactor.
For Mn geochemical reactions, autocatalytic oxidation is recognized as an important reaction in the Mn oxidation process. Manganese dioxide can attract Mn(II) in solution and oxidize it on the surface as follows:
Mn·MnO2 + O2aq → 2MnO2
The most general kinetic equation for Mn oxidation has been represented by Diem and Stumm [9] as follows:
d[Mn2+]/dt = k1[Mn2+] + k2[Mn2+][MnOx]
where k1 and k2 are rate constants where k1 = k1′[O2][OH]2, k1′ = 4 × 10¹² M−3 day−1, k2 = k2′[O2][OH]2, and k2′ = 1018 M−4 day−1—acquired from Diem and Stumm’s experiments on abiotic systems [9]. A higher k2′ value than k1′means that the amount of MnOx (autocatalysis) can greatly influence the Mn(II) oxidation rate. Recently, it has been suggested that the autocatalysis reaction be divided into several reaction steps as follows:
≡MnOH + Mn2+ → ≡MnOMn+ + H+
≡MnOMn+ + O2aq + H2O → 2MnOOH
2MnOOH + O2aq → 2MnO2 + 2H+
In the first step, divalent manganese ions (Mn2+) form a complex on the MnO2 surface (Equation (3)) and is then oxidized to Mn(III)OOH by the disproportionation reaction (Equation (4)). Finally, Mn(III) is oxidized to Mn(IV) and incorporated to MnO2 (Equation (5)). Therefore, Mn removability by MnO2 can be controlled by the surface complexation capacity of MnO2. There are some polymorphic crystalline structures of MnO2 (α, β, and γ, etc.) with different physicochemical properties. Birnessite (δ-MnO2) is widely recognized as having a large surface area because of its layered crystalline structure: the specific surface area is over 700 m2 g−1, which is ten times higher than MnOOH. The point of zero charge of δ-MnO2 is 2–3, meaning that various metals, including Mn, are efficiently adsorbed under neutral–alkaline pH conditions; e.g., Pb [13], Cd [14], and Zn [15]. Many studies have extensively investigated the interaction between δ-MnO2 and dissolved Mn2+; however, this reaction is a complex process and thus the comprehensive rate equation (Equation (2)) is generally used to represent Mn removal behavior in natural systems.
Various Mn removal techniques using precipitation, oxidation, adsorption, coagulation, and flotation processes are tested for treatment of high Mn-loading groundwater and wastewater which are generated by metallurgical engineering processes such as smelting and steelmaking [1]. However, the most major issue of these techniques is to use excess chemicals such as alkali (e.g., Ca(OH)2 and CaCO3), oxidizing (e.g., HClO4), and flocculation (AlCl3) agents. Ion exchange using polymer resins is also used for Mn removal without addition of chemical agents, but the resins must be regenerated and also expensive, especially when treating a large amount of wastewater. Therefore, the development of efficient and inexpensive Mn removal techniques without chemicals is required to treat the wastewater and to decrease environmental loads. Furthermore, examples of Mn removal treatment process from mine water other than neutralization are less reported.
In this study, we investigated the removal process of Mn(II) from alkaline mine water by Mn-coated sand packed into a pilot scale column reactor installed at X mine in Japan. Net alkaline mine water is generated by the reaction with carbonate minerals more than sulfide minerals; which sometime contains a high amount of Mn(II) and Zn [16]. The column reactor does not require additional chemicals for Mn removal from the alkaine mine water because Mn compounds is believed to work as an Mn scavenger. We constructed a geochemical model using the comprehensive rate equation based on the results of the batch removal experiment using synthesized δ-MnO2 and the synchrotron analysis of column reactor samples in order to clear the Mn removal mechanisms and quantitatively evaluate the Mn removal capacity of this column reactor.

2. Materials and Methods

2.1. Mn Removal Experiment with δ-MnO2

δ-MnO2 was prepared according to our previous studies [14,15]; it was synthesized from Mn(II) solution by the addition of the oxidizing agent sodium hypochlorite (NaClO) at pH 6. The pH value was measured by a pH meter (Horiba D-75, Horiba, Ltd., Kyoto, Japan) calibrated at pH values of 4.01, 7.00, and 10.01. The freeze dried δ-MnO2 was mixed to 0.4 mmol L−1 (22 mg L−1) Mn(II) solution at different Mn(IV)/Mn(II) molar ratios: 0.1, 1, and 10, and then the suspension was stirred for 1 h after pH adjustment to 6 and 8 by addition of 1 mol L−1 KOH solution. The reactant was acidified with HNO3 (1%) in a polypropylene bottle after filtration with 0.45 μm polytetrafluoroethylene (PTFE) membrane filter (ADVANTEC Japan Co. Ltd., Tokyo, Japan) and stored until analysis.

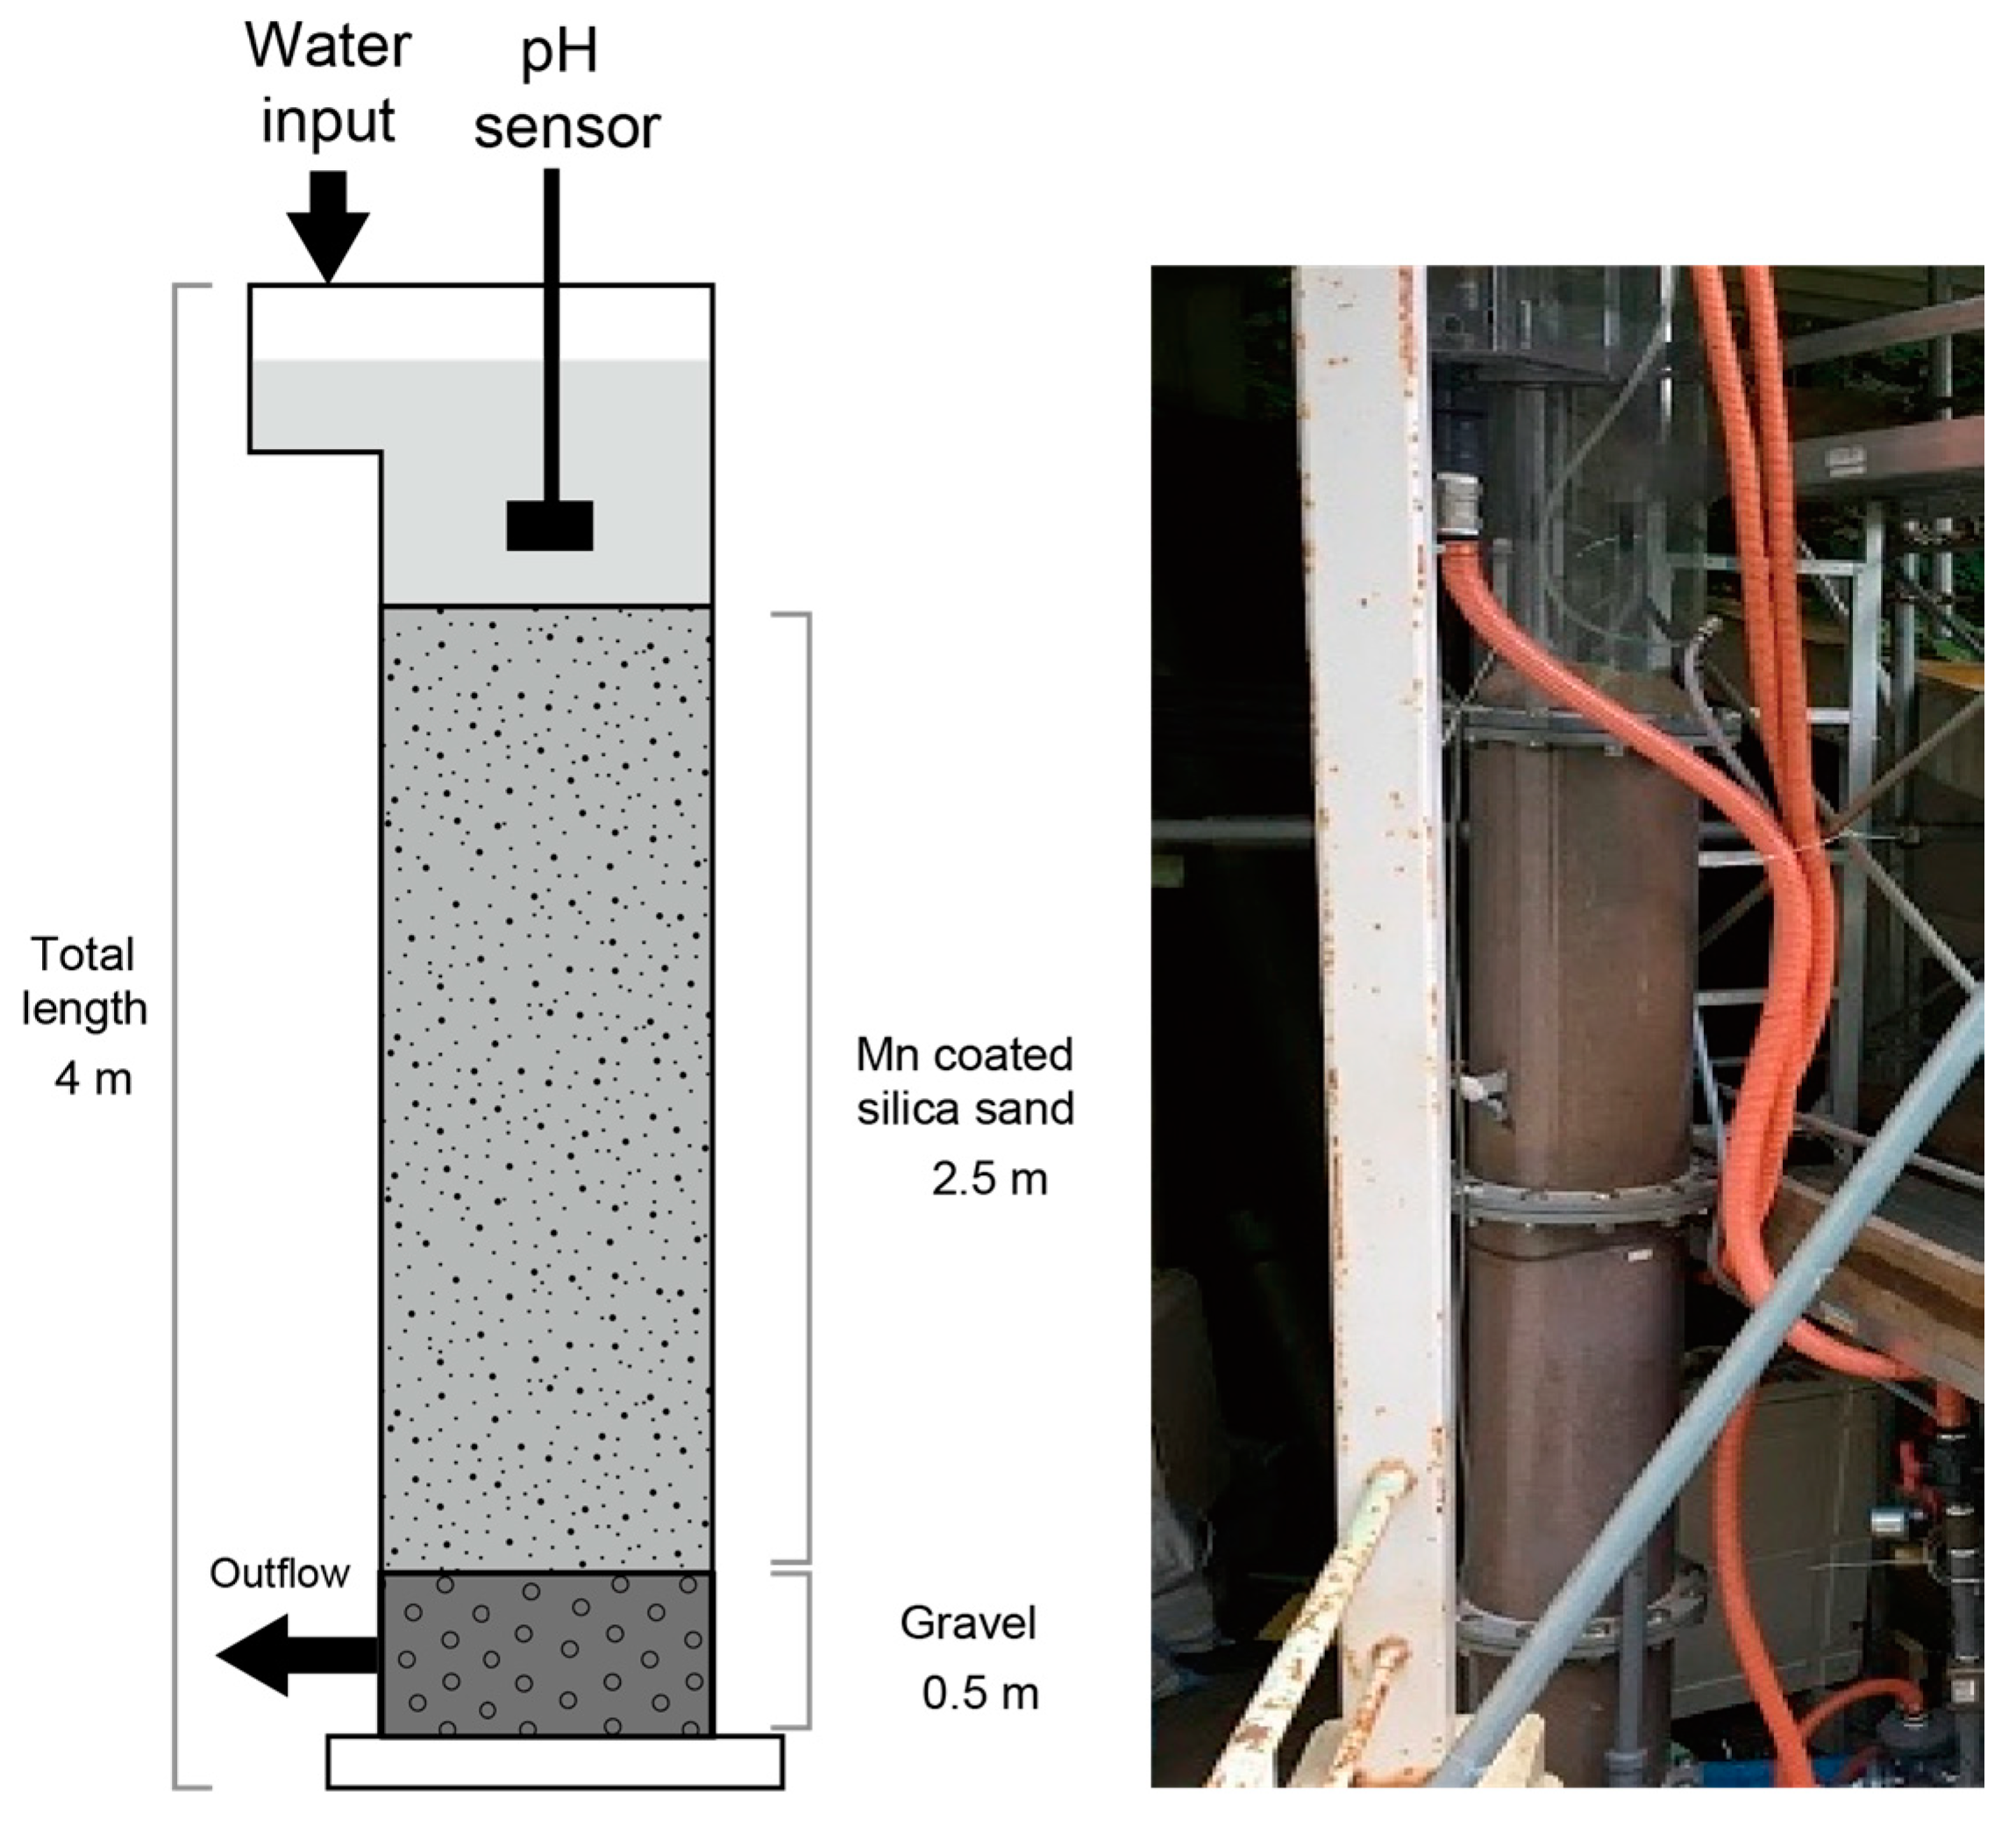
2.2. Pilot Scale Mn Removal Test

X mine is located in Aomori prefecture in Japan and the pilot-scale column reactor for Mn removal from the mine water is shown in Figure 1. X mine is a hydrothermal vein deposit containing sphalerite, pyrite and rhodochrosite [17]. The volume of the cylinder column reactor was 0.28 m3 (the length and cross-sectional area were 4 m and 0.07 m2, respectively). Gravel (size φ 2–12 mm) was placed in the bottom 0.5 m of the reactor, followed by silica sand (size φ 0.6 mm) that occupied a space of 2.5 m above the gravel. The average inflow rate was 5.0 (±0.3) L min−1 and the flux was 0.82 cm s−1. The inflow rate to the column reactor was controlled with a controller pump which connected from the drainage tank to the reactor. The reactor was on from 11 June to 30 October 2020, and the samples used in this study were collected on 8 October 2020. The chemical composition of the water put in to the column reactor prior to the sample collection is listed in Table 1. The pH value was around 9.6, meaning that most metal ions (Fe(III), Al, and Zn) were not dissolved in the water (below detection limit of our measurement). Among the metals, Mn had the highest concentration at over 5.8 mg L−1 and sulfate had the highest concentration among the anions (820 mg L−1) in the water. The solution samples were collected from sampling ports set at 0.3, 0.7, 1.05, 1.45, 1.85, 2.1, 2.45, and 2.9 (outflow) m depth from the top of the column. The pH and dissolved oxygen (DO) values of the solution were measured by a pH/DO meter (Horiba D-75, Horiba, Ltd., Kyoto, Japan). The sample was stored with HNO3 (1%) in a polypropylene bottle after filtration with a 0.45 μm polytetrafluoroethylene (PTFE) membrane filter. Mn-coating silica sand samples were also collected from the upper (0.3 m depth), middle (1.25 m depth), and lower (2.25 m depth) parts of the reactor and stored at −20 °C. The solid sample was dried in a vacuum before solid analysis.
To evaluate the amount of Mn coating on the silica sand, the dried sample (1.0 g) was reacted with 0.5 M hydroxylammonium chloride solution (40 mL) for 16 h [18] and the reacted solution was preserved in a polypropylene bottle after filtration with a 0.45 μm PTFE filter.

2.3. Analysis

2.3.1. Quantification of Chemical Components in Water Samples

Manganese concentrations in the solution samples were determined by inductively coupled plasma–mass spectrometry (ICP–MS; 8800 ICP-QQQ, Agilent Technologies, Inc., Santa Clara, CA, USA). The detection limit of Mn was 0.01 μg L−1 (RSD < 5%) in this analysis. All chemicals used in this study were analytical grade and purchased from Wako Pure Chemical Industries, Ltd. (Osaka, Japan).

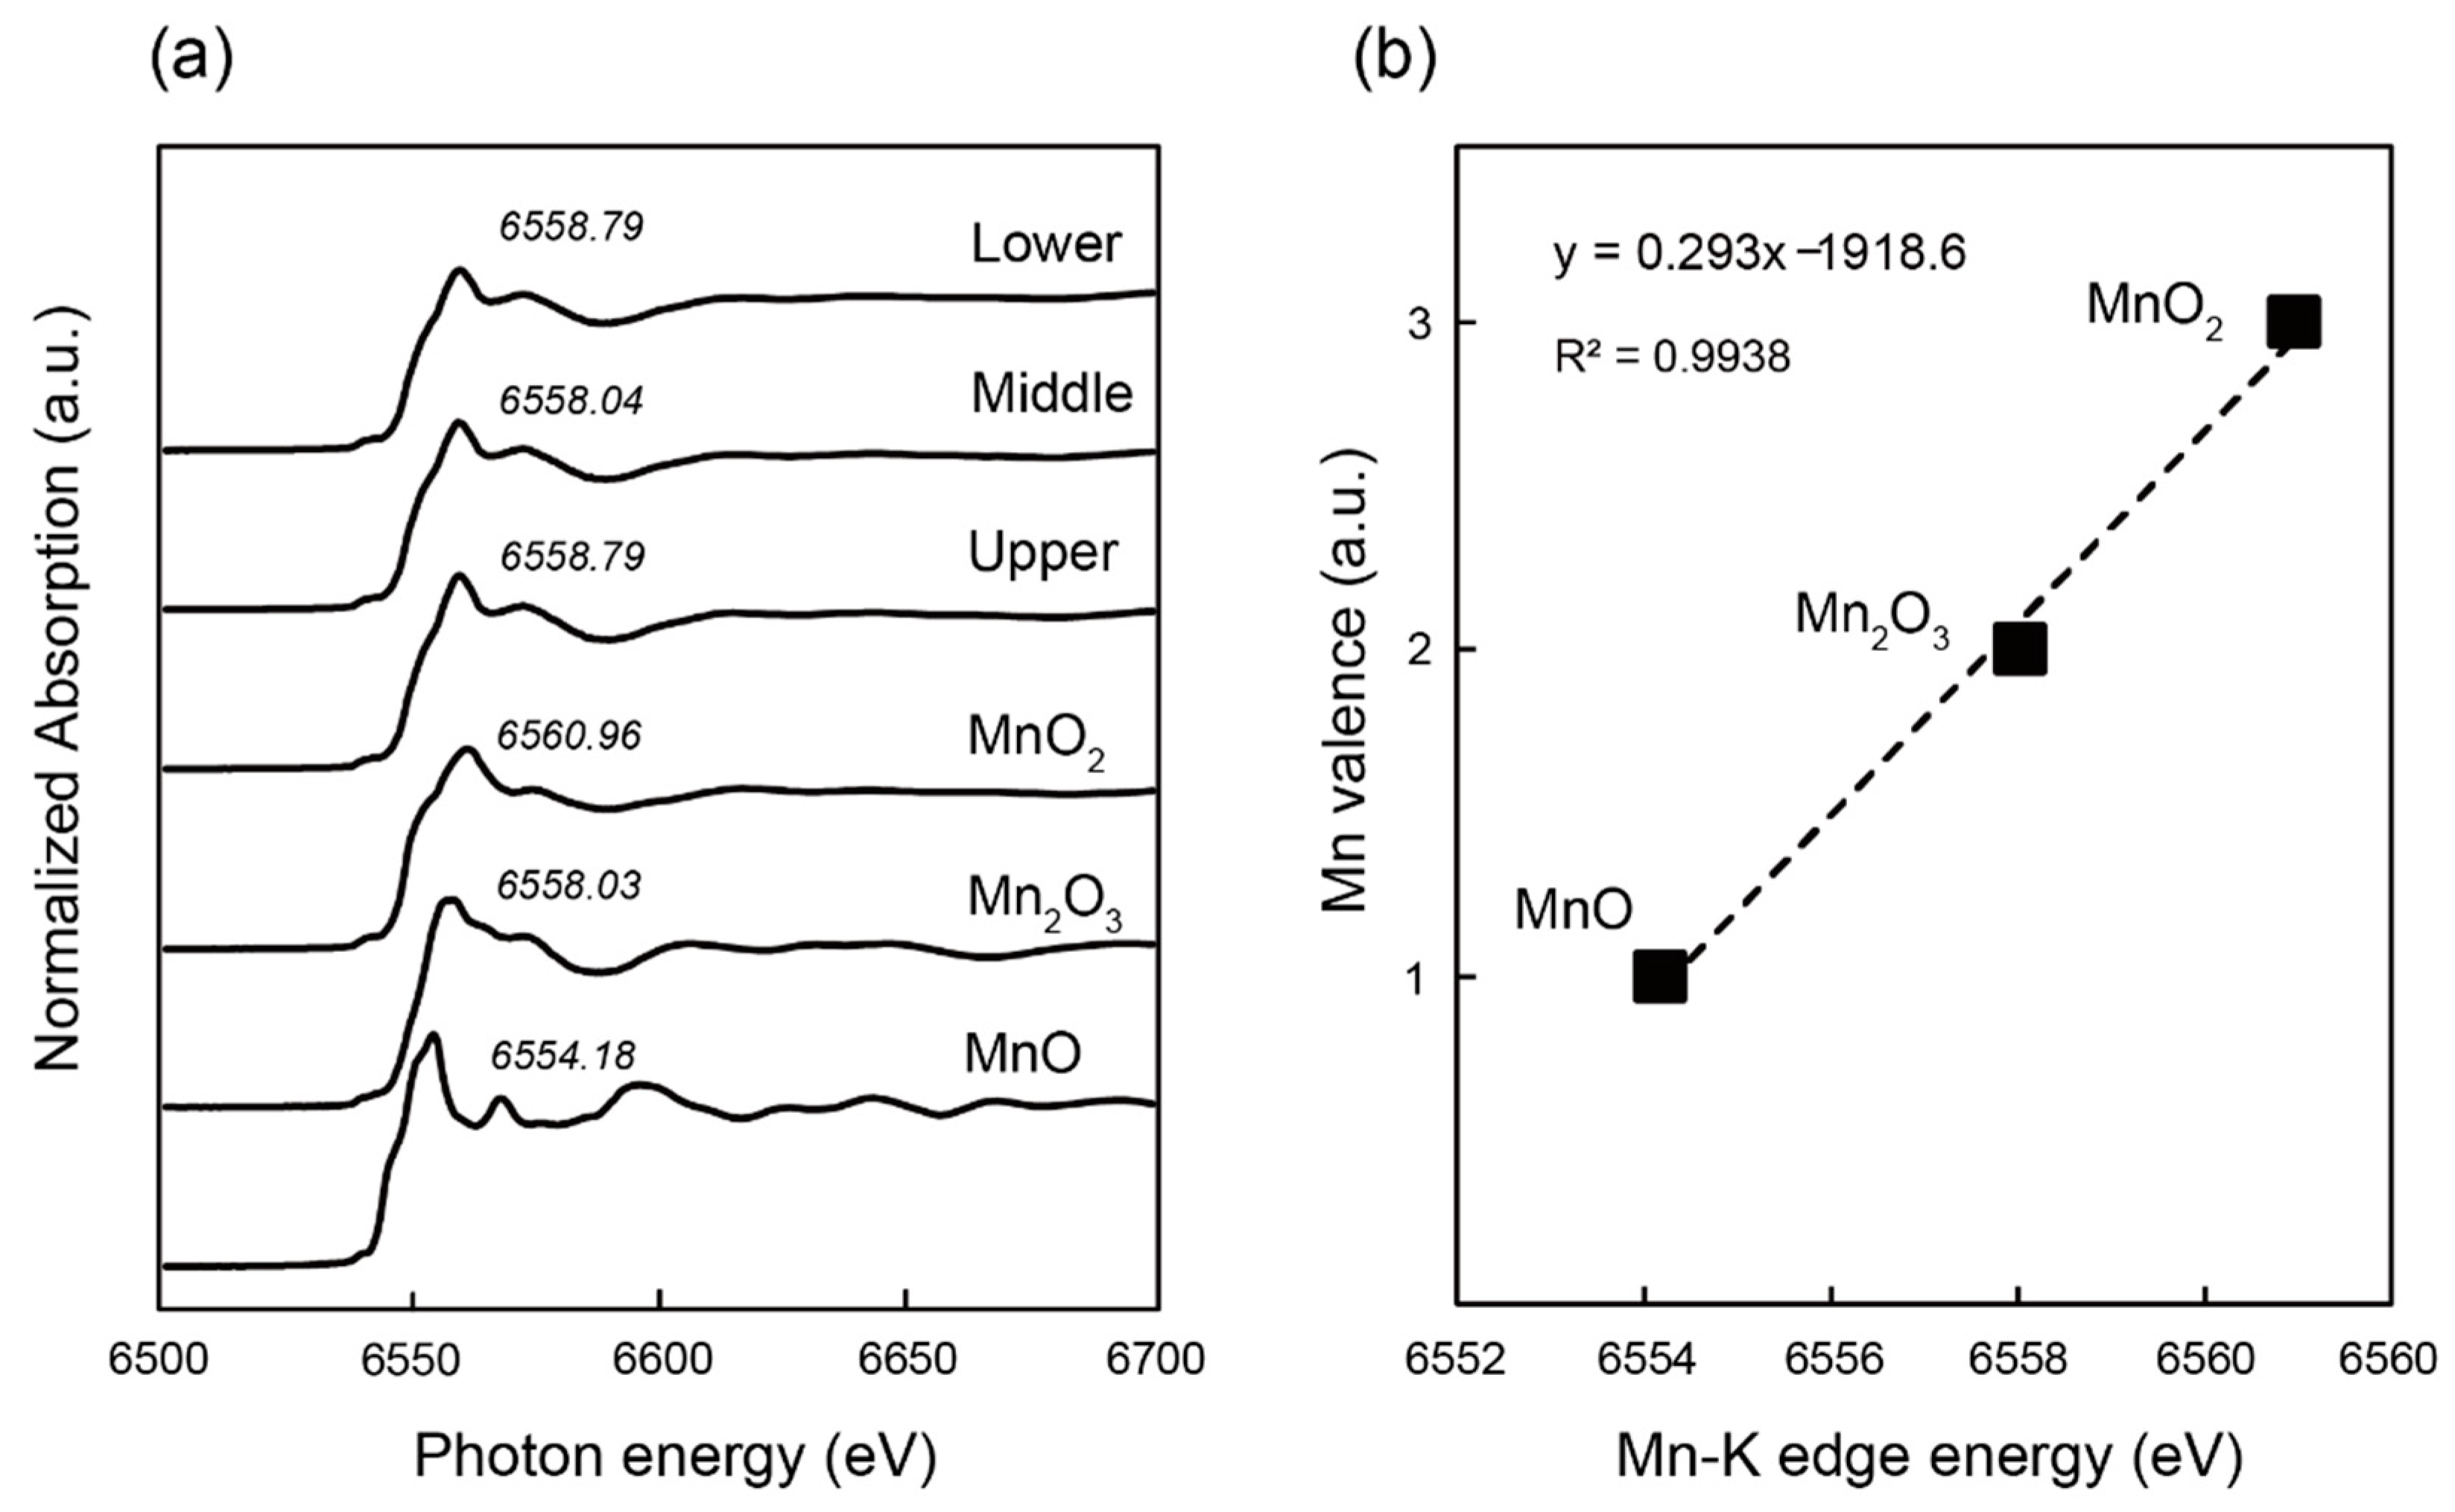
2.3.2. XANES Analysis of Mn in Solid Samples

The Mn K-edge X-ray absorption fine structure (XAFS) analysis Mn oxides on silica sand particulates was measured using the BL5S1 beamline at Aichi Synchrotron Radiation Center, Japan. The dried sample was diluted with boron nitride and formed into pellets of 10 mm diameter and 1.0 mm thickness. The X-ray absorption near-edge structure (XANES) region of the energy range 6540–6590 eV was measured by the transmission method using silica (111) monochromator crystals. Various manganese oxides (δ-MnO2, Mn(II)O (manganosite), Mn(II, III)3O4 (hausmannite), γ-Mn(III)OOH (manganite), and Mn(III)2O3) were used as reference materials. The contents of each Mn compound in the solid samples were quantified with the linear combination fitting (LCF) of XANES spectra using the Athena software package. Additionally, the valence of those Mn compounds in the solid samples were quantified by the K-edge white peak position of XANES spectra. Many previous studies have reported that there is a good liner relationship between the Mn K-edge position and Mn valence [19,20]. The white peak position of XANES spectra was found using the Athena software package.

2.4. Geochemical Modeling by PHREEQC

Geochemical code PHREEQC ver.3 (USGS) was used to simulate the behavior of Mn removal from the water path through the test column by coupling various chemical reactions and one-dimensional advection analysis [21]. The specific chemical species and equilibrium constants were published in a previous study [11,14,15,22]. Similar rate equations for Mn oxidation to Equation (2) were used in our geochemical modeling, but the reaction order and the amount of MnO2 was determined by fitting to the experimental result of the Mn removal experiment with δ-MnO2 (Section 2.1). Output data and measured values were summarized and schematic diagrams were produced using Microsoft Excel, and diagrams were drawn using Adobe Illustrator.

3. Results and Discussion

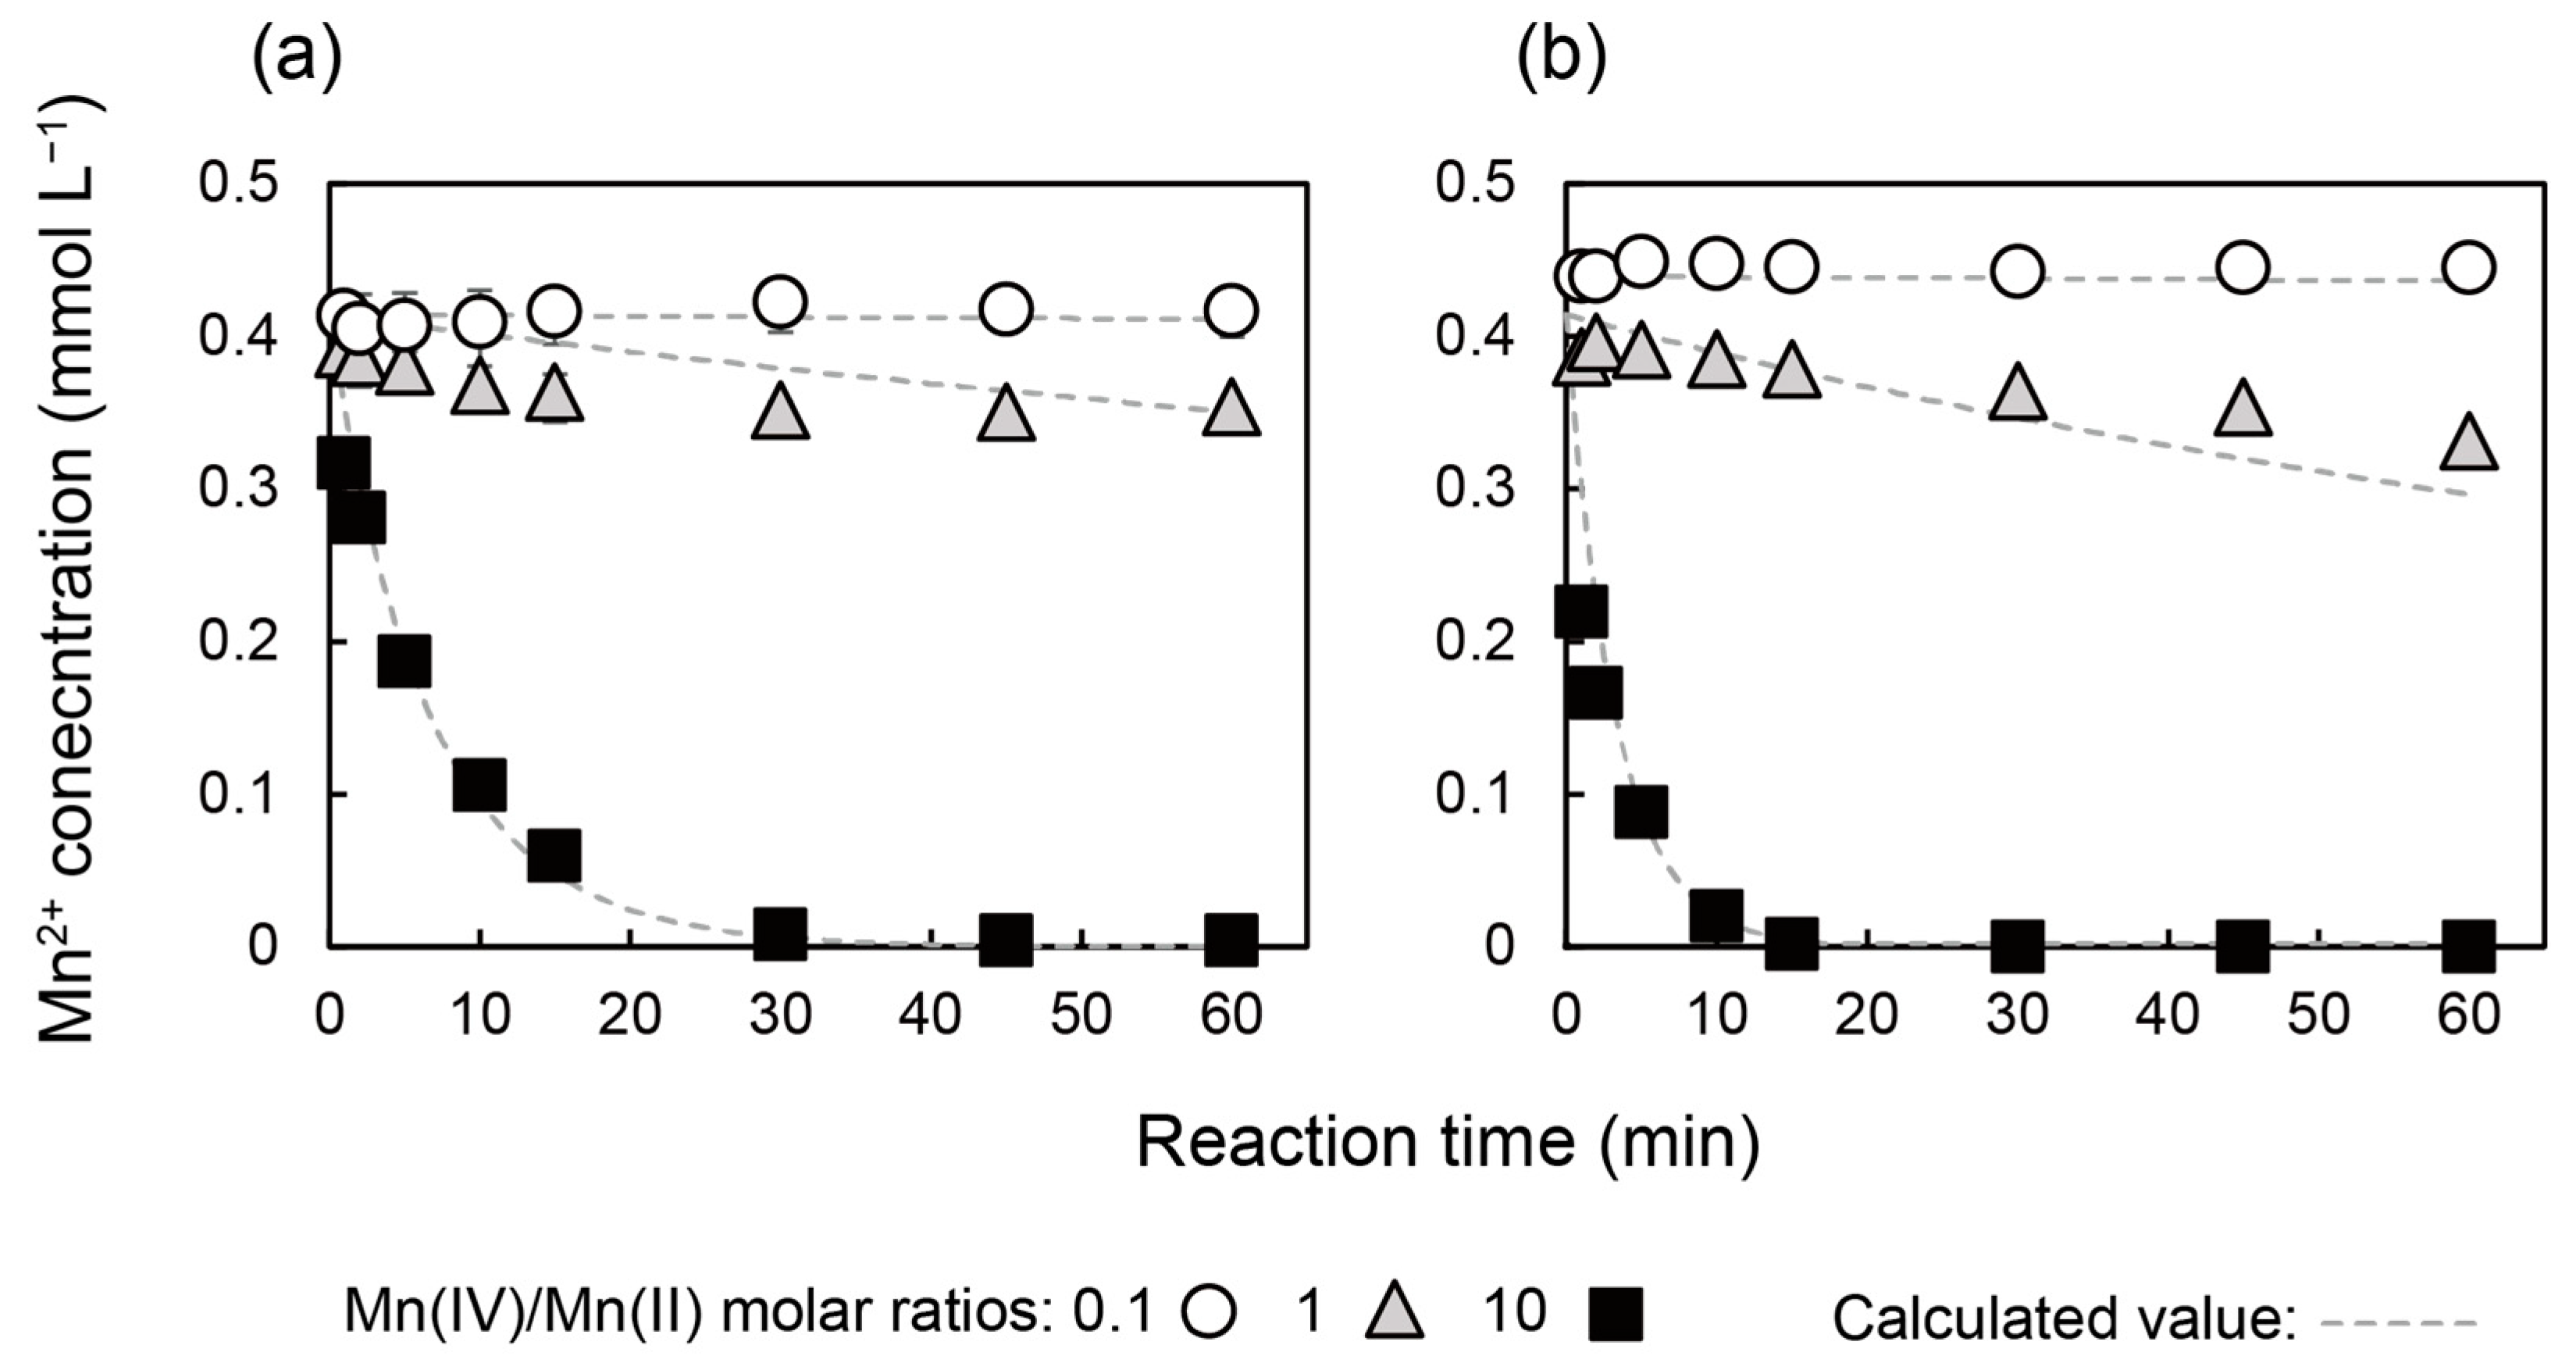
3.1. Kinetic Modeling of Mn Removal by δ-MnO2

Figure 2 shows the temporal changes in the dissolved Mn2+ concentration in the solutions that reacted with δ-MnO2 at different Mn(IV)/Mn(II) molar ratios: 0.1, 1, and 10. At both pH conditions, dissolved Mn2+ concentrations decreased gradually as the reaction proceeded; it was completely removed within the first 30 min after the start of the reaction at the highest Mn(IV)/Mn(II) molar ratio. The Mn removal rate increased with increasing Mn(IV)/Mn(II) molar ratio conditions, indicating that δ-MnO2 may play the role of both an oxidizing agent and/or an adsorbent of Mn2+ in this reaction system.
Fitting the results to the experimental values gave 1.9 as the reaction order for the amount of δ-MnO2 in the Mn oxidation rate equation; thus, the following removal rate equation was used for this study:
d[Mn2+]/dt = k1[Mn2+] + k2[Mn2+][MnO2]1.9
Similar rate constants (k1 and k2) to Diem and Stumm’s experiment [9] were used in this calculation. Although the reaction order for the amount of δ-MnO2 represents a combination influence of oxidation and surface complexation by δ-MnO2 in our study, several researchers have quantitatively evaluated the specific Mn adsorption behavior of the δ-MnO2 surface. Tonkin et al. [23] investigated the order of affinity of various metals for hydrous Mn oxides (HMO), which was believed to be a poorly crystalline δ-MnO2 via two site surface complexation modeling, and revealed that Mn showed the highest affinity for HMO among the studied divalent metals (cobalt (Co2+), Cu2+, Zn2+, nickel (Ni2+), and Cd2+). Spectroscopic analysis has revealed that there are two adsorption sites, i.e., triple-corner-sharing (TCS) and double-corner sharing (DCS) sites, on the δ-MnO2 surface [24], and the TCS (interlayer vacancy) site mainly works to uptake metal ions from the solution into the interlayer of δ-MnO2. A recent study [13] evaluated the adsorption mechanisms and order of affinity for various metals on the TCS site of δ-MnO2 using a charge distribution multiple site complexation (CD-MUSIC) model. This thermodynamic calculation showed that the adsorption affinities of metals had the following order at the TCS site: Pb2+ > Cu2+ > Co2+ > Cd2+ > Mn2+ > Zn2+ > Ni2+. These results indicate that the selectivity of Mn adsorption could easily change depending on the solution chemistry and surface properties of δ-MnO2. Once Mn2+ is adsorbed onto the δ-MnO2 surface, it is oxidized to β-MnOOH (feitknechtite) by a disproportionation reaction and then changed to γ-MnOOH and/or Mn3O4 because β-MnOOH is thermodynamically unstable under normal atmospheric conditions [25]. The interaction between Mn2+ and the δ-MnO2 surface shows a significantly complex redox process compared to Fe(II); thus, we used the comprehensive rate equation (Equation (6)) to represent Mn removal behavior in the pilot scale column reactor.

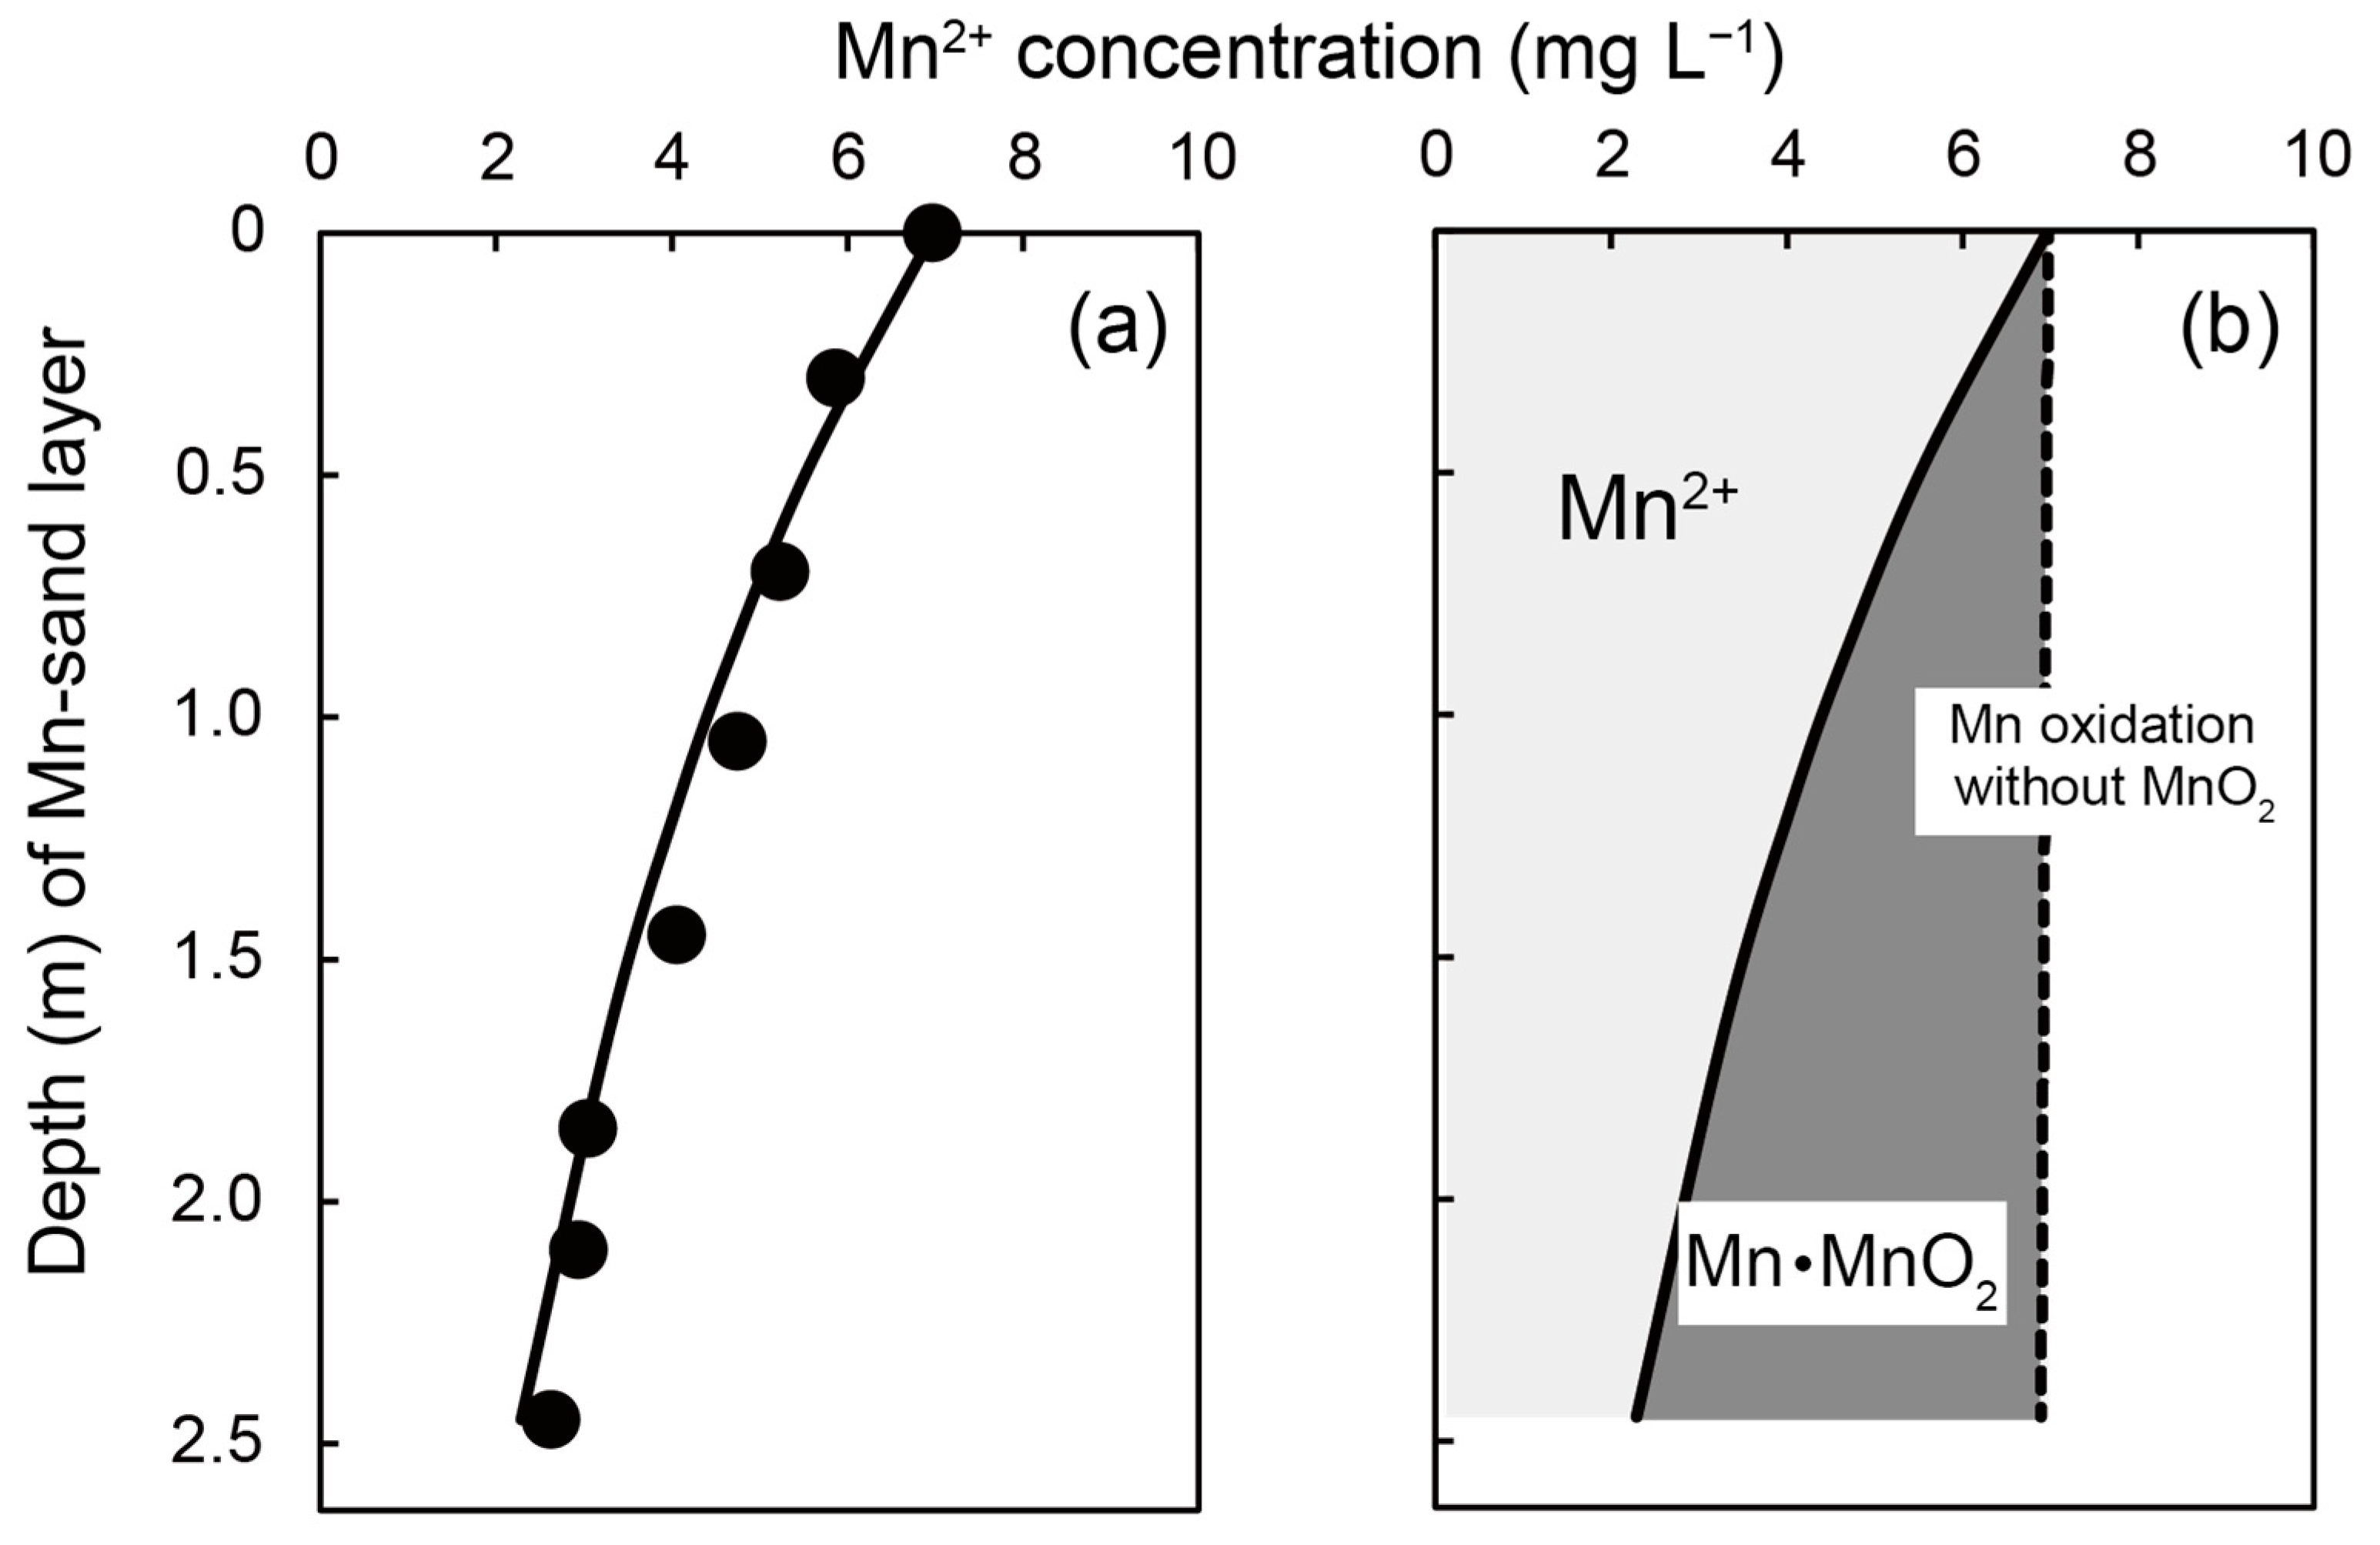
3.2. Mn Removal Mechanism and Capacity in Column Reactor

Figure 3 shows (a) the XANES spectra of Mn-coated samples collected from the reactor and reference materials and (b) the liner fitting result of the reference materials for the Mn valance estimation. Three major Mn compounds (Mn3O4, γ-MnOOH, and δ-MnO2) could be formed as a thermodynamically stable phase under normal temperature water conditions as explained below; thus, the content of these Mn compounds in each sample was determined by the LCF result. The XANES analysis results for Mn-coated sands shows similar Mn valance (3.5–3.7) regardless of sampling depth; however, the amounts of Mn3O4, γ-MnOOH, and δ-MnO2 were different between the upper and lower parts of the column reactor (Table 2). δ-MnO2 was the dominant Mn compound at all sampling depths, whereas a lower amount of γ-MnOOH was found at the upper and middle depths.
Mn3O4 is generally precipitated as the first Mn oxidation compound, which consists of both divalent and trivalent Mn as follows [13]:
6Mn2+ + O2aq + 6H2O → 2Mn3O4 + 12H+
MnOOH is formed as the result of the oxidation of aqueous Mn2+ and Mn3O4 as follows:
4Mn2+ + O2aq + 6H2O → 4MnOOH + 8H+
Mn3O4 + 2H2O → 3MnOOH + H+
These reactions release hydrogen ions, promoting MnOOH formation at alkaline pH conditions rather than acidic pH conditions. Disproportionation reactions also form MnOOH and MnO2 as follows [26]:
Mn3O4 + 2H+ → 2MnOOH + Mn2+
2MnOOH + 2H+ → MnO2 + Mn2+ + 2H2O
These disproportionation reactions are estimated to become thermodynamically unfavorable under alkaline pH conditions because they consume hydrogen ions. In addition, the disproportionation reaction of MnOOH is a dehydration reaction. Based on this thermodynamic theory, therefore, MnO2 formation could be promoted by autocatalytic reactions (Equation (5)) and direct oxidation under alkaline pH conditions rather than the disproportionation reactions of MnOOH, which is consistent with the results of our Mn2+ removal experiment using synthesized δ-MnO2 (Figure 2).
The extraction method using hydroxylammonium chloride solution revealed that the amount of Mn coating on silica sand was 1.1, 0.95, and 0.86 mol kg−1 dried sample collected from the upper, middle, and lower parts of the column reactor, respectively. The mole percentage of each Mn compound was calculated from this. The XANES results are shown in Table 3. This result also confirmed that most of the Mn was in the form of δ-MnO2. As mentioned above, samples were collected after the reactor column had been active for 4 months, meaning that δ-MnO2 was accumulated on silica sand particles.
Figure 4 shows the changes in the dissolved Mn(II) concentration with column reactor depth of Mn-coated sand layer measured values and calculated values using our geochemical model. The DO value of mine water slightly decreased from 9.0 to 7.5 during the path through the Mn-coated silica sand layer, but enough DO for Mn oxidation could be presented in the column reactor. The amount of δ-MnO2 related to Mn removal was estimated by fitting to the measured values because only part of the total δ-MnO2 could be activated and play a role in reacting with dissolved Mn2+ in the column reactor [23]. The amount of activated δ-MnO2 was calculated as 0.03 mol m−1, which is only 0.02% of the total δ-MnO2 in the column reactor. Only the surface δ-MnO2 of the Mn-compound layer on the silica particles could be reactive and contribute to removing Mn2+ from the alkaline mine water. The solution pH increased from 9.6 to 8.6–8.7 from the top to the bottom of the reactor, which is explained by the direct oxidation of Mn2+ to Mn3O4 and/or MnOOH and an autocatalytic reaction with δ-MnO2 because these reactions release hydrogen ions as explained above. Our geochemical modeling revealed that the interaction with δ-MnO2 was the main removal mechanism of Mn2+.
For Mn removal from mine water, various Mn removal techniques have been examined; e.g., precipitation with carbonate Mn(II)CO3 and sulfide Mn(II)S, adsorption by ion exchange membrane, and coagulation/flocculation with additional reagents such as AlCl3 as explained in the introduction part [1]. Among these removal techniques, oxidation and filtration could be widely used for metal mine water treatment because of the simple reaction system [1]. Many researchers have studied Mn removal from mine water with varying pH values using limestone column reactors. Silver et al. [27] conducted a continuous Mn removal experiment using different size limestone and found that initial pH conditions greatly influenced Mn removability: it became lower at acidic pH conditions (pH < 4) because the adsorption of Mn2+ on the calcite surface and carbonate formation were inhibited at the acidic pH condition. Le Bourre et al. [28] used limestone and half-calcinated dolomite (CaMg(CO3)2) to remove Mn from three different natural and simulated mine water samples (different pH (2.4–6.8) and Mn concentrations (0.6–47 mg L−1)). They found that Mn was immobilized by MnOx, which could be formed under long-term (for 255 days) contact of Mn solution with limestone and dolomite. These carbonate minerals could contribute to increase pH as a neutralizer and supply a carbonate ion to form MnCO3. However, general mine water contains high amounts of SO42− (over several hundred or thousand mg L−1), which is derived from the oxidative dissolution of sulfide minerals [29]. Calcium sulfate is formed around limestone particles by a reaction with sulfate-rich water, resulting in a decrease in metal removability due to passivation [30]. Furthermore, high ferrous ion (Fe(II)) concentration also inhibits Mn removal from mine water by carbonate minerals because Fe(II) can reduce Mn(III) and Mn(IV) to Mn(II) by the deprotonation reaction and decrease the active mineral surface area by passivation and the formation of hydroxide (Fe(OH)3) [28,30]. Postma and Appelo [31] investigated the kinetic effect of the co-presence of Fe(II) on Mn removal by natural δ-MnO2-coated sand that was collected from lake sediment in Ikast, Denmark, and reported that δ-MnO2 decomposition is a first order rate reaction dependent on the Fe activity, resulting in MnOOH formation. As explained above, δ-MnO2 shows a higher reactivity than MnOOH because of a higher surface area (about ten times higher than MnOOH). A reduction in δ-MnO2 is thought to be a serious problem to maintaining the removal performance of Mn and other metal cations by Mn-coated sand. Our result clearly shows that Mn was effectively removed from the mine water even though it contains a significant amount of SO42− (820 mg L−1) when Fe(II) concentration was low; therefore, pretreatment to remove Fe2+ and long-term oxidation to accumulate δ-MnO2 could enhance the removability of Mn and other metals using a Mn-coated sand column reactor. This technique would be suitable for sustainable mine water treatment rather than limestone treatment such as SLB and contribute efficient and inexpensive Mn removal from mine water.
Our result shows the interaction with δ-MnO2 was the main removal mechanism of Mn2+ rather than simple oxidation and precipitation reactions, and Mn removal behavior could be represented by the comprehensive rate equation which has been demonstrated by Diem and Stumm [9], indicating this kinetic model is useful to examine Mn removal mechanism in actual wastewater treatment systems. However, Mn interaction with MnO2 is a significantly complex process, i.e., surface complexation and disproportionation reaction. In addition, there are many polymorphic minerals of MnO2. Thus, a kinetic model including all specific reactions for Mn–MnO2 interactions could be required to estimate more accurately and quantitatively Mn removal capacity in actual wastewater treatment systems.

4. Conclusions

In this study, we investigated Mn removability from alkaline mine water (pH > 9) with Mn-coated silica sand packed into a column reactor and examined the specific reaction mechanism. A gradual decrease in dissolved Mn(II) concentration with column reactor depth was observed and a comparison with the results of kinetic modeling confirmed that the interaction with δ-MnO2 was the main removal mechanism of Mn2+. Therefore, the Mn removability could be controlled by the amount of activated δ-MnO2 presence in the reactor rather than total Mn mineral contents. Although our study targeted the alkaline mine water with a simple chemical composition (less Fe and other heavy metals), most mine water shows acidic pH and contains high amounts of Fe2+, which inhibits efficient Mn removal. Recently, the interaction between δ-MnO2 and dissolved metals, including Fe2+ and Mn2+, has been extensively investigated; however, the quantitative evaluation of the specific reaction is inadequate to evaluate the actual efficiency of this technique for mine water treatment. Therefore, more thermodynamic and kinetic data about the nature of Mn minerals are required to estimate applicable mine water composition and suitable treatment conditions for this technique.

Author Contributions

Conceptualization, S.F. and C.T.; methodology, S.F. and S.T.; sample preparation and experiment, T.N.; analysis and calculation, S.T.; validation, S.F. and S.T.; writing—original draft preparation, S.F.; writing—review and editing, S.F., C.T. and S.T.; funding acquisition, C.T. All authors have read and agreed to the published version of the manuscript.

Funding

This research was partially funded by Nagaoka International Corp. (2019FY–2021FY) and JOGMEC (Japan Oil, Gas and Metals National Corporation) (2019FY–2021FY).

Data Availability Statement

Not applicable.

Acknowledgments

Part of this work was performed at the Waseda Research Institute for Science and Research Organization for Open Innovation Strategy, Waseda University. The synchrotron radiation experiments were performed using a BL5S1 beamline courtesy of the Aichi Synchrotron Radiation Center, Aichi Science & Technology Foundation, Aichi, Japan.

Conflicts of Interest

The authors declare no conflict of interest.

References

  1. Patil, S.D.; Chavan, M.S.; Kennedy Oubagaranadin, U.J. A review of technologies for manganese removal from wastewaters. J. Environ. Chem. Eng. 2016, 4, 468–487. [Google Scholar] [CrossRef]
  2. Avila, S.D.; Gubert, P.; Roos, H.D.; Puntel, R.; Aschner, M. Manganese. Ency. Food Health 2016, 441, 637–640. [Google Scholar]
  3. Carlito, B.T.; Park, I.; Phengsaart, T.; Jeon, S.; Villacorte-Tabelin, M.; Alonzo, D.; Yoo, K.; Ito, M.; Hiroyoshi, N. Copper and critical metals production from porphyry ores and E-wastes: A review of resource availability, processing/recycling challenges, socio-environmental aspects, and sustainability issues. Resour. Conserv. Recycl. 2021, 170, 105610. [Google Scholar]
  4. WHO (World Health Organization). Manganese in Drinking-water. In Background Document for Development of WHO Guidelines for Drinking Water Quality; WHO: Geneva, Switzerland, 2011. [Google Scholar]
  5. MOE (Ministry of the Environment, Government of Japan). Uniform National Effluent Standards. Available online: https://www.env.go.jp/water/impure/haisui.html (accessed on 8 December 2021).
  6. Scheinost, C.A.; Abend, S.; Pandya, I.K.; Sparks, L.D. Kinetic controls on Cu and Pb sorption by ferrihydrite. Environ. Sci. Technol. 2001, 35, 1090–1096. [Google Scholar] [CrossRef] [PubMed]
  7. Tokoro, C.; Yatsugi, Y.; Koga, H.; Owada, S. Sorption mechanisms of arsenate during coprecipitation with ferrihydrite in aqueous solution. Environ. Sci. Technol. 2010, 44, 638–643. [Google Scholar] [CrossRef] [PubMed]
  8. Tokoro, C.; Sakakibara, T.; Suzuki, S. Mechanism investigation and surface complexation modeling of zinc sorption on aluminum hydroxide in adsorption/coprecipitation processes. Chem. Eng. J. 2015, 279, 86–92. [Google Scholar] [CrossRef]
  9. Diem, D.; Stumm, W. Is dissolved Mn2+ being oxidized by O2 in absence of Mn-bacteria or surface catalysts? Geochim. Cosmochim. Acta 1984, 48, 1571–1573. [Google Scholar] [CrossRef]
  10. Piazza, A.; Casalini, C.L.; Pacini, A.V.; Sanguinetti, G.; Ottado, J.; Gottign, N. Environmental bacteria involved in manganese(II) oxidation and removal from groundwater. Front. Microbiol. 2019, 10, 119. [Google Scholar] [CrossRef] [Green Version]
  11. Dick, G.J.; Podell, S.; Johnson, H.A.; Rivera-Espinoza, Y.; Bernier-Latmani, R.; McCarthy, J.K.; Torpey, J.W.; Clement, B.G.; Gaasterland, T.; Tebo, B.M. Genomic insights into Mn(II) oxidation by the marine alphaproteobacterium Aurantimonas sp.Strain SI85-9A1. Appl. Environ. Microbiol. 2008, 74, 2646–2658. [Google Scholar] [CrossRef] [Green Version]
  12. Fuchida, S.; Suzuki, K.; Kato, T.; Kadokura, M.; Tokoro, C. Understanding the biogeochemical mechanisms of metal removal from acid mine water with a subsurface limestone bed at the Motokura Mine, Japan. Sci. Rep. 2020, 10, 20889231. [Google Scholar] [CrossRef]
  13. Li, Y.; Zhao, X.; Wu, J.; Gu, X. Surface complexation modeling of divalent metal cation adsorption on birnessite. Chem Geol. 2019, 551, 119774. [Google Scholar] [CrossRef]
  14. Suzuki, K.; Kato, T.; Fuchida, S.; Tokoro, C. Removal mechanisms of cadmium by δ-MnO2 in adsorption and coprecipitation processes at pH 6. Chem. Geol. 2020, 550, 119744. [Google Scholar] [CrossRef]
  15. Tajima, S.; Fuchida, S.; Tokoro, C. Coprecipitation mechanisms of Zn by birnessite formation and its mineralogy under neutral pH conditions. J. Environ. Sci. 2021, in press. [Google Scholar]
  16. Kelly, J.; Champagne, P.; Michel, F. Mitigation of alkaline mine drainage in a natural wetland system. WIT Trans. Ecol. Environ. 2006, 89, 115–124. [Google Scholar]
  17. Yamamoto, G.; Nagamine, T.; Kitagaki, T.; Unno, T. Discovery of the manganese nodule in groundwater from the Oppu Mine, Aomori Prefecture, Japan. Earth Sci. 2004, 58, 375–388, (In Japanese with English Abstract). [Google Scholar]
  18. Suda, A.; Makino, T.; Higashi, T. Extractability of manganese and iron oxides in typical Japanese soils by 0.5 mol L−1 hydroxylamine hydrochloride (pH 1.5). Soil Sci. Plant Nutr. 2012, 58, 684–695. [Google Scholar] [CrossRef]
  19. Ressler, T.; Wong, J.; Roos, J.; Smith, L.J. Quantitative Speciation of Mn-Bearing Particulates Emitted from Autos Burning (Methylcyclopentadienyl)manganese Tricarbonyl-Added Gasolines Using XANES Spectroscopy. Environ. Sci. Technol. 2000, 34, 950–958. [Google Scholar] [CrossRef] [Green Version]
  20. Jiao, F.; Frei, H. Nanostructured manganese oxide clusters supported on mesoporous silica as efficient oxygen-evolving catalysts. Chem. Commun. 2010, 46, 2920–2922. [Google Scholar] [CrossRef]
  21. Parkhurst, D.L.; Appelo, C.A.J. Description of Input and Examples for PHREEQC Version 3—A Computer Program for Speciation, Batch-Reaction, One-Dimensional Transport, and Inverse Geochemical Calculations; U.S. Geological Survey: Reston, VA, USA, 2013.
  22. Kato, T.; Yagisawa, M.; Matsuoka, M.; Tokoro, C.; Sakakibara, T.; Hayashi, K. Quantitative modeling incorporating surface complexation for the treatment of acid mine water. Kagaku Kogaku Ronbunshu 2017, 43, 207–212, (In Japanese with English abstract). [Google Scholar] [CrossRef] [Green Version]
  23. Tonkin, W.J.; Laurie SBalistrieri, S.L.; Murray, W.J. Modeling sorption of divalent metal cations on hydrous manganese oxide using the diffuse double layer model. Appl. Geochem. 2004, 19, 29–53. [Google Scholar] [CrossRef]
  24. Van Genuchten, C.M.; Peña, J. Sorption selectivity of birnessite particle edges: A d-PDF analysis of Cd(ii) and Pb(ii) sorption by δ-MnO2 and ferrihydrite. Environ. Sci. Processes Impacts 2016, 18, 1030–1041. [Google Scholar] [CrossRef] [PubMed]
  25. Lefkowitz, P.J.; Rouff, A.A.; Elzinga, J.E. Influence of pH on the Reductive Transformation of Birnessite by Aqueous Mn(II). Environ. Sci. Technol 2013, 47, 10364–10371. [Google Scholar] [CrossRef] [PubMed]
  26. Hem, D.J.; Roberson, E.C.; Fournier, B.R. Stability of βMnOOH and manganese oxide deposition from springwater. Water Resour. Res. 1982, 18, 563–570. [Google Scholar] [CrossRef]
  27. Silva, A.M.; Cruz, L.S.F.; Lima, M.F.R.; Teixeira, C.M.; Leão, A.V. Manganese and limestone interactions during mine water treatment. J. Hazard. Mater. 2010, 181, 514–520. [Google Scholar] [CrossRef] [PubMed] [Green Version]
  28. Le Bourre, B.; Carmen, M.; Neculita, M.C.; Coudert, L.; Rosa, E. Manganese removal processes and geochemical behavior in residues from passive treatment of mine water. Chemosphere 2020, 259, 127424. [Google Scholar] [CrossRef] [PubMed]
  29. Santomartino, S.; Webb, J.A. Estimating the longevity of limestone drains in treating acid mine water containing high concentrations of iron. Appl. Geochem. 2007, 22, 2344–2361. [Google Scholar] [CrossRef]
  30. Soler, J.M.; Boi, M.; Mogollón, J.L.; Cama JAyora, C.; Nico, S.P.; Tamura, N.; Kunz, M. The passivation of calcite by acid mine water. Column experiments with ferric sulfate and ferric chloride solutions at pH 2. Appl. Geochem. 2008, 23, 3579–3588. [Google Scholar] [CrossRef] [Green Version]
  31. Postma, D.; Appelo, A.C. Reduction of Mn-oxides by ferrous iron in a flow system: Column experiment and reactive transport modeling. Geochim. Cosmochim. Acta 2000, 64, 1237–1247. [Google Scholar] [CrossRef]
Figure 1. A schematic image and picture of the pilot-scale column reactor for Mn removal installed at X mine (Aomori, Japan).
Minerals 12 00099 g001
Figure 2. Dissolved Mn2+ removal behavior in the presence of δ-MnO2 at (a) pH 6 and (b) pH 8 and calculation results by PHREEQC. Plots show mean values of duplicates.
Minerals 12 00099 g002
Figure 3. (a) Mn-edge XANES spectra of Mn-coated sands sampled from column reactor and reference material and (b) the linear relationship between the Mn K-edge position and Mn valence. The values shown on each XANES peak represents the white line position determined by Athena.
Minerals 12 00099 g003
Figure 4. Mn removal behavior in the pilot scale column: changes in dissolved (a) Mn concentration and (b) its removal reaction with the depth of the column reactor and the comparison between measured (plots) and calculated (lines) results by PHREEQC.
Minerals 12 00099 g004
Table 1. The chemical composition of water input into the column reactor.
Concentrations (mg L−1)
Na+K+Ca+Mn2+Al3+Zn2+Cd2+SO42−Cl
891.6115.80.0510.0780.002182029
Table 2. Mn valence value and molar percentage of each Mn compound determined by XANES analysis using Athena.
Mn ValenceRatio (mol %)
Mn3O4γ-MnOOHδ-MnO2
Upper3.7250.7074
Middle3.5380.062
Under3.6211762
Table 3. The amount of each Mn compound was calculated from the extraction experiment and XANES analysis results.
Amount (mol m−1)
Mn3O4γ-MnOOHδ-MnO2
Upper68.61.90203
Middle77.30.00127
Under48.639.2142
Average64.913.7157
Publisher’s Note: MDPI stays neutral with regard to jurisdictional claims in published maps and institutional affiliations.

