1. Introduction
Production of mineral aggregates is realized in processing circuits that use mostly crushing and screening operations. However, these relatively simple systems require a certain control and need to be adopted to the characteristics of the feed material as well as to expected technological outcomes [
1]. Three main groups of variables can be distinguished when an issue of improvement of work effectiveness is considered:
Physical and mechanical parameters of the feed material,
Operational parameters of crushing and screening devices,
Parameters linked with the type of technological process or operation.
Properties of the feed material seem to be of crucial impact on the quality of obtained products, especially in terms of strength characteristics of specific fractions of aggregates or quality of produced concrete and asphalt mixtures [
2,
3,
4]. The shape of particles also affects the outcomes of some operations of mechanical processing, like gravity concentration and hydraulic classification [
5,
6]. Particles that are irregular in shape, i.e., elongated, oblong, or flat, are undesired in final products, and qualitative requirements and standards determine maximum boundary contents of such particles [
7].
Results of investigations show that depending on the type of rock material, there can be usually observed a correlation between the content of irregular particles in feed and in products [
1,
2], and when the yield of irregular particles in feed is significant, it is relatively harder to obtain products with regular particles. The technological regime, process course, and especially the type of applied crushing devices have a great impact on the shape of obtained products [
8,
9,
10,
11,
12]. There can be observed various ideas and solutions aiming at irregular particles in the crushing products, both in crushing and screening operations. Several patents were worked out as well [
13]. Scanning techniques utilizing image analysis vision systems are also helpful in accurate characterization of the granular material properties and usually help in real-time process control [
14,
15].
The crushing process is of key significance in the aggregate processing sector but is also of a special concern in raw materials treatment, in general. In ore processing it applies both crushing and grinding operations, for the reason they are energy consuming, and breakage effectiveness is relatively low, especially in grinding operations in tumble mills [
16]. Industrial comminution consumes from 3 to 5% of world electric energy usage [
17], and negatively affects the environment through high rates of CO
2 emission, as well as noise, dust, and heat generation [
18,
19,
20,
21,
22,
23]. It leads to deterioration of the living standards of inhabitants in the vicinity of mineral processing plants and constitutes a potential health risk for mine workers [
24].
2. Problem Significance and Research Motivation
Results of up-to-date investigations as well as an industrial practice show that crushing and classifying circuits, despite their relative simplicity, may operate with too low effectiveness, in terms of insufficient size reduction ratio, lower liberation level (in case of ores), or inaccurate particle size distribution of final products. Most frequently, the type and general strength properties of the feed are taken into consideration at the starting point of the optimization approach. However, results of various investigations show that particle shape of aggregate product [
25,
26] significantly influences the qualitative characteristics of concrete mixes and cement mortals with adding of such aggregate. It is, however, worth mentioning that the problem of control the crushing products characteristics—is the subject of many studies. It is common to all types of granular materials: from coals [
27], through aggregates and cement powder production, ending on ore processing, and relates both to crushing and grinding devices. More investigative programs were carried out for crushing devices, due to relatively higher number of operational parameters (i.e., gap, frequency of rotation, jump, profile of liners, nip angle, and others), and higher potentials of their steering [
28]. The models worked out for crushing devices that usually operate on entire crushing stages, like cone and jaw crushers, were developed in works of Whiten [
29,
30] where the breakage function was described as a functional relationship of the feed particle size distribution. More recent investigations focus on impact crushers, where the authors have taken into consideration both the operational parameters of crushing devices and feed characteristics. In Ref. [
31], the model based on classification and breakage matrices that depended both on the rotor radius, angular velocity, and the throughput was developed. The Weibull’s distribution was used in modeling and the results were compared with data achieved in plant-scale operation. Models of size distribution for products from various crushers were developed in [
32,
33], where statistical distribution of t-family was used, and material characteristics based on Bond index values were taken into consideration. Investigations were carried out for limestone samples and a high value of determination coefficient was achieved.
An approach aiming at improvements of aggregate production effectiveness should also focus on the final effects that are achieved as an operation of the entire circuit, not only a single device. It means that a key-device should be optimized, but the potential effect should be related to qualitative parameters of the final products, not only to the crusher product. The scope of the presented paper investigates an impact of the crusher device operation on the production of the fine aggregates. A practical tool for control (model) was developed, and showed what effects could be expected, for specific values of primary operational parameters of the crusher. The two main parameters were used in the model and the influence of each of them was determined, so it was possible to observe which parameter has a potentially greater impact on the final effect. Such a model can be developed, and a higher number of values can be used, depending on the requirements and specific situation. It is worth remembering that heuristic analysis should be performed prior to modeling. The presented approach is a novelty, and not commonly met in literature.
3. Materials and Methodology
3.1. Circuit and Device Characteristics
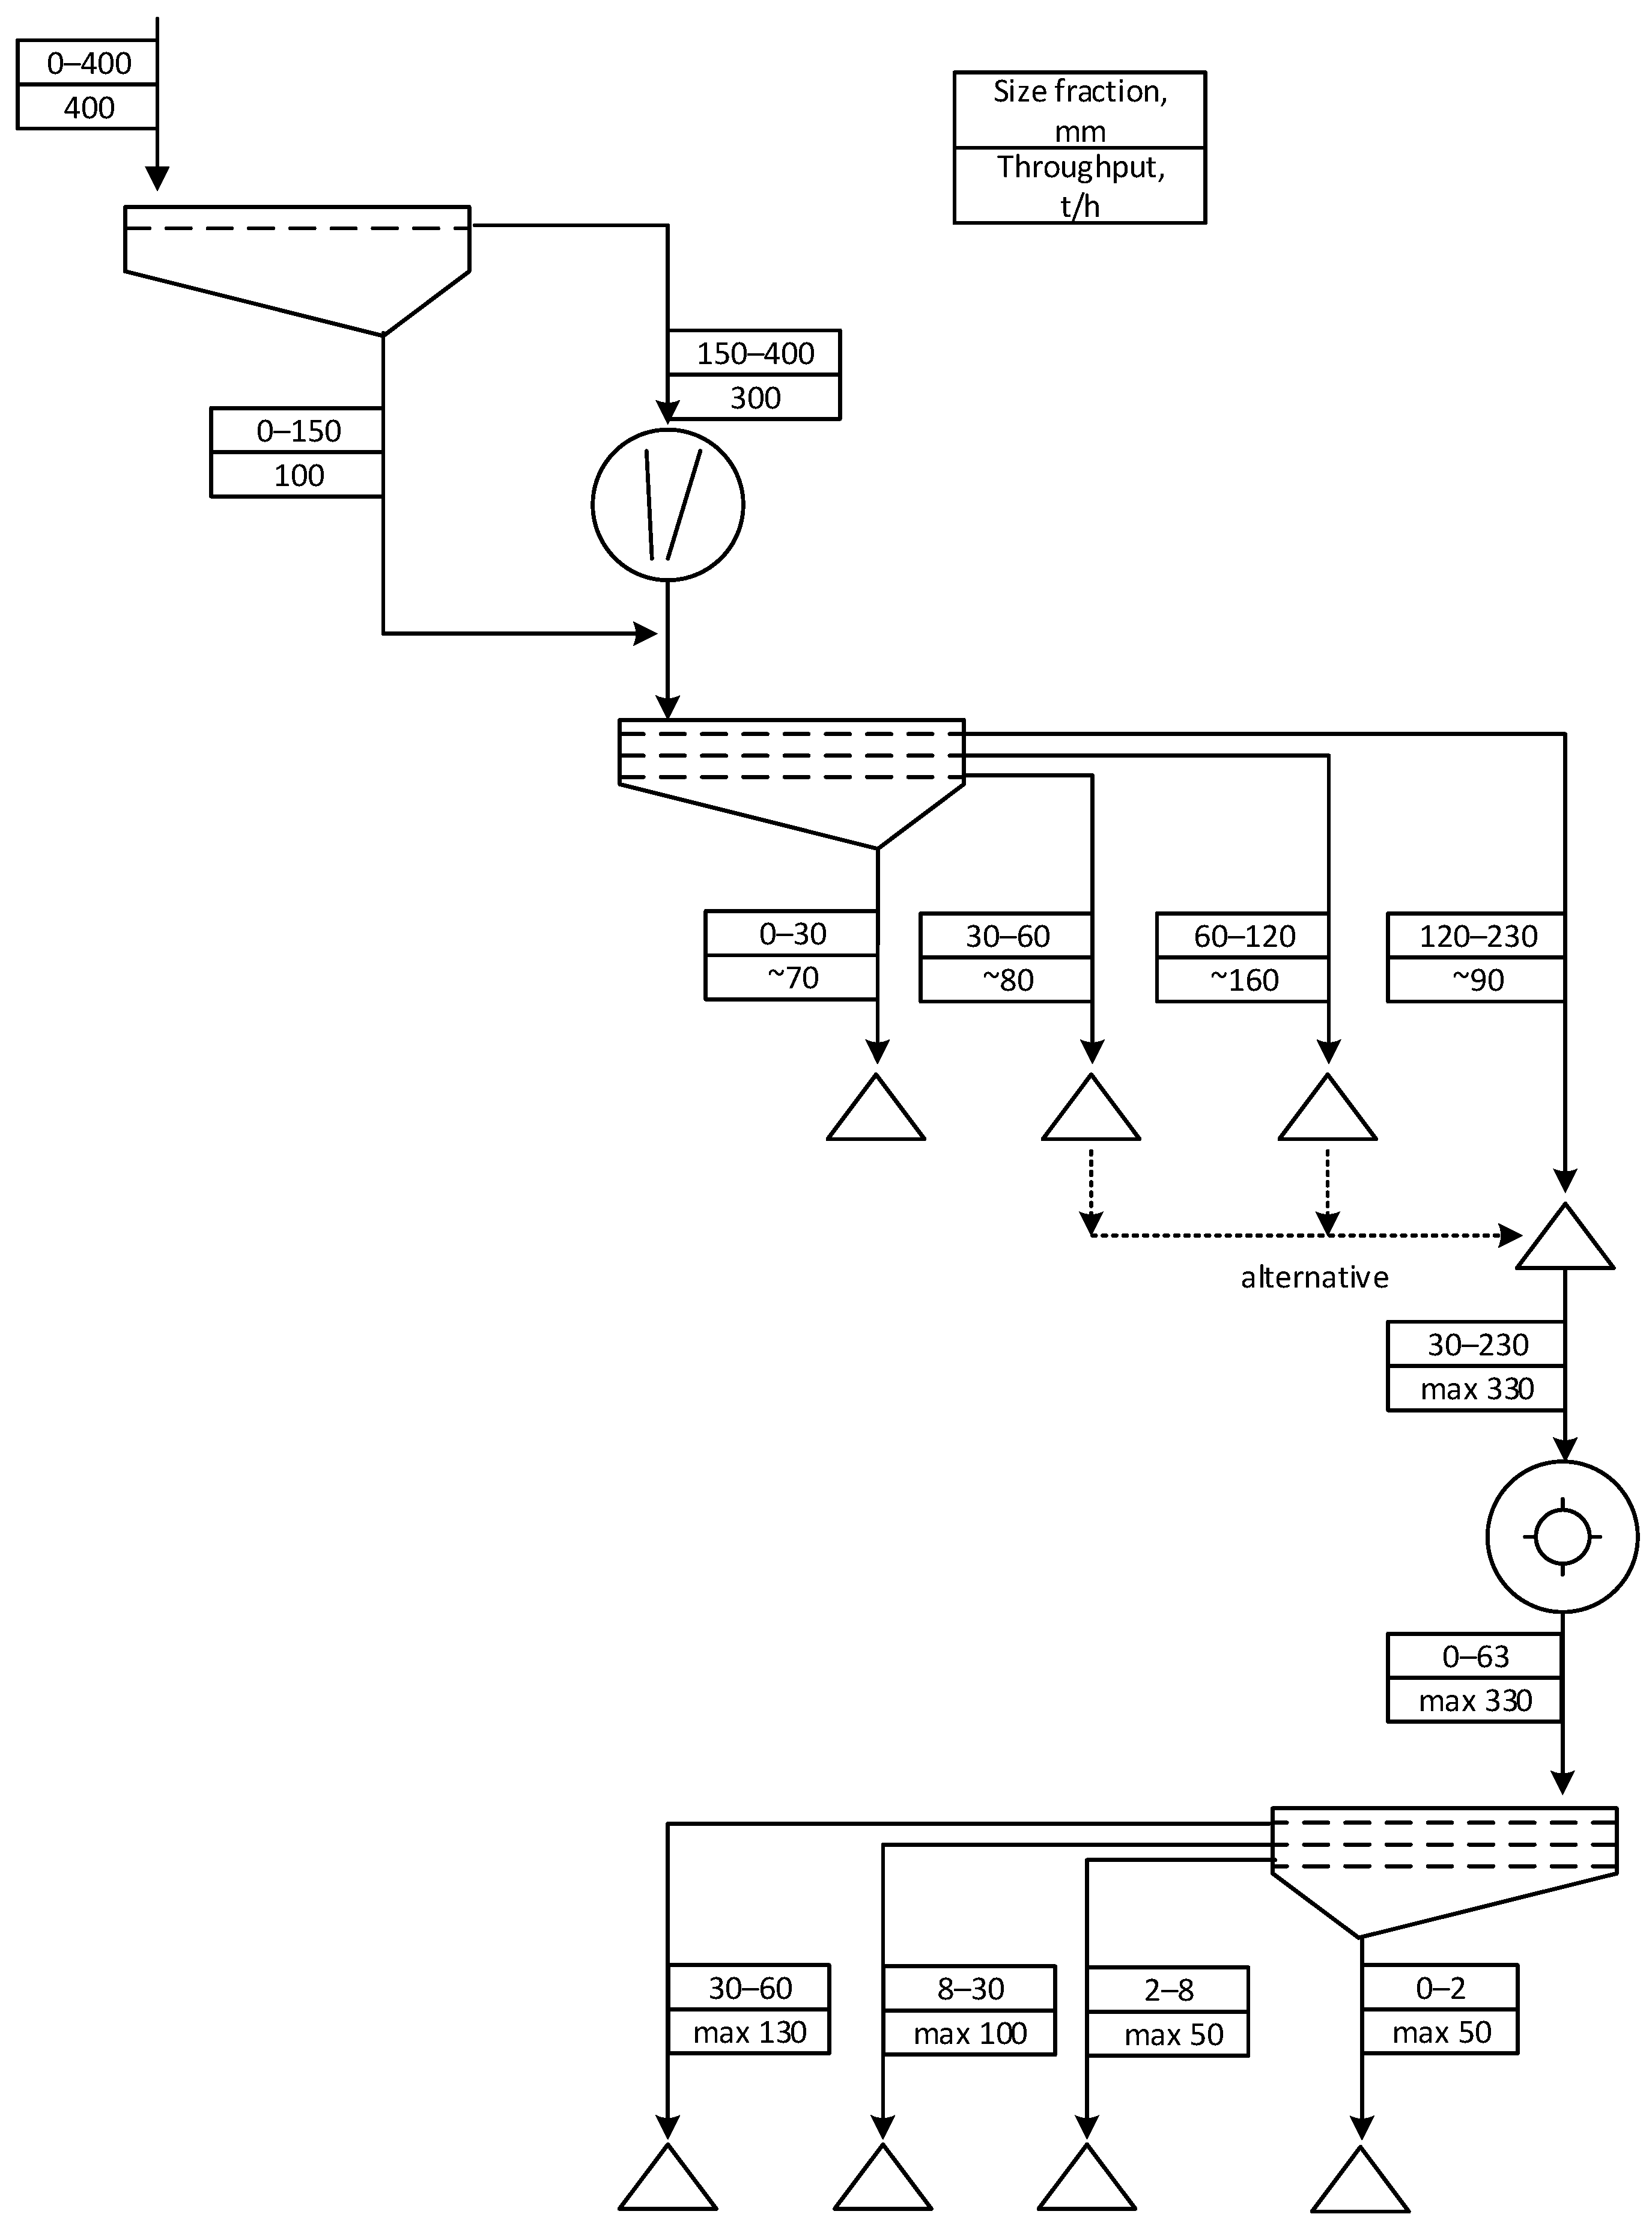
An investigative program was carried out on an industrial scale on an aggregate production circuit operating in the Dolomite Imielin Mine, located in Imielin, in Silesia (Poland). The mine extract rock raw materials in an open pit system and also operates circuits of mineral aggregate production.
The circuit that was the object of investigations consisted of two-stage crushing processes and a series of screening and sieve classification operations. The product from a first stage of crushing in the jaw crusher is downstream classified in a three-decked vibrating screen. The size fraction over 120 mm is re-crushed in the impactor, products of which are subjected to further classification, as a result of what the further fine sized fractions of products can be obtained. A simplified scheme of the circuit is presented in
Figure 1.
The main purpose of the investigations is an assessment operation of an impact crusher that operates on the second crushing stage. This is a device of key significance in the circuit, because its crushing product is classified into final products according to specific particle size fractions (see
Figure 1), and at the same time constitutes the final aggregate products. This type of crushing device is quite commonly used in aggregate production circuits due to the fact that crushing products contain relatively lower content of irregular (i.e., flat, elongated) particles comparing to jaw crushers, what is often expected for aggregate products.
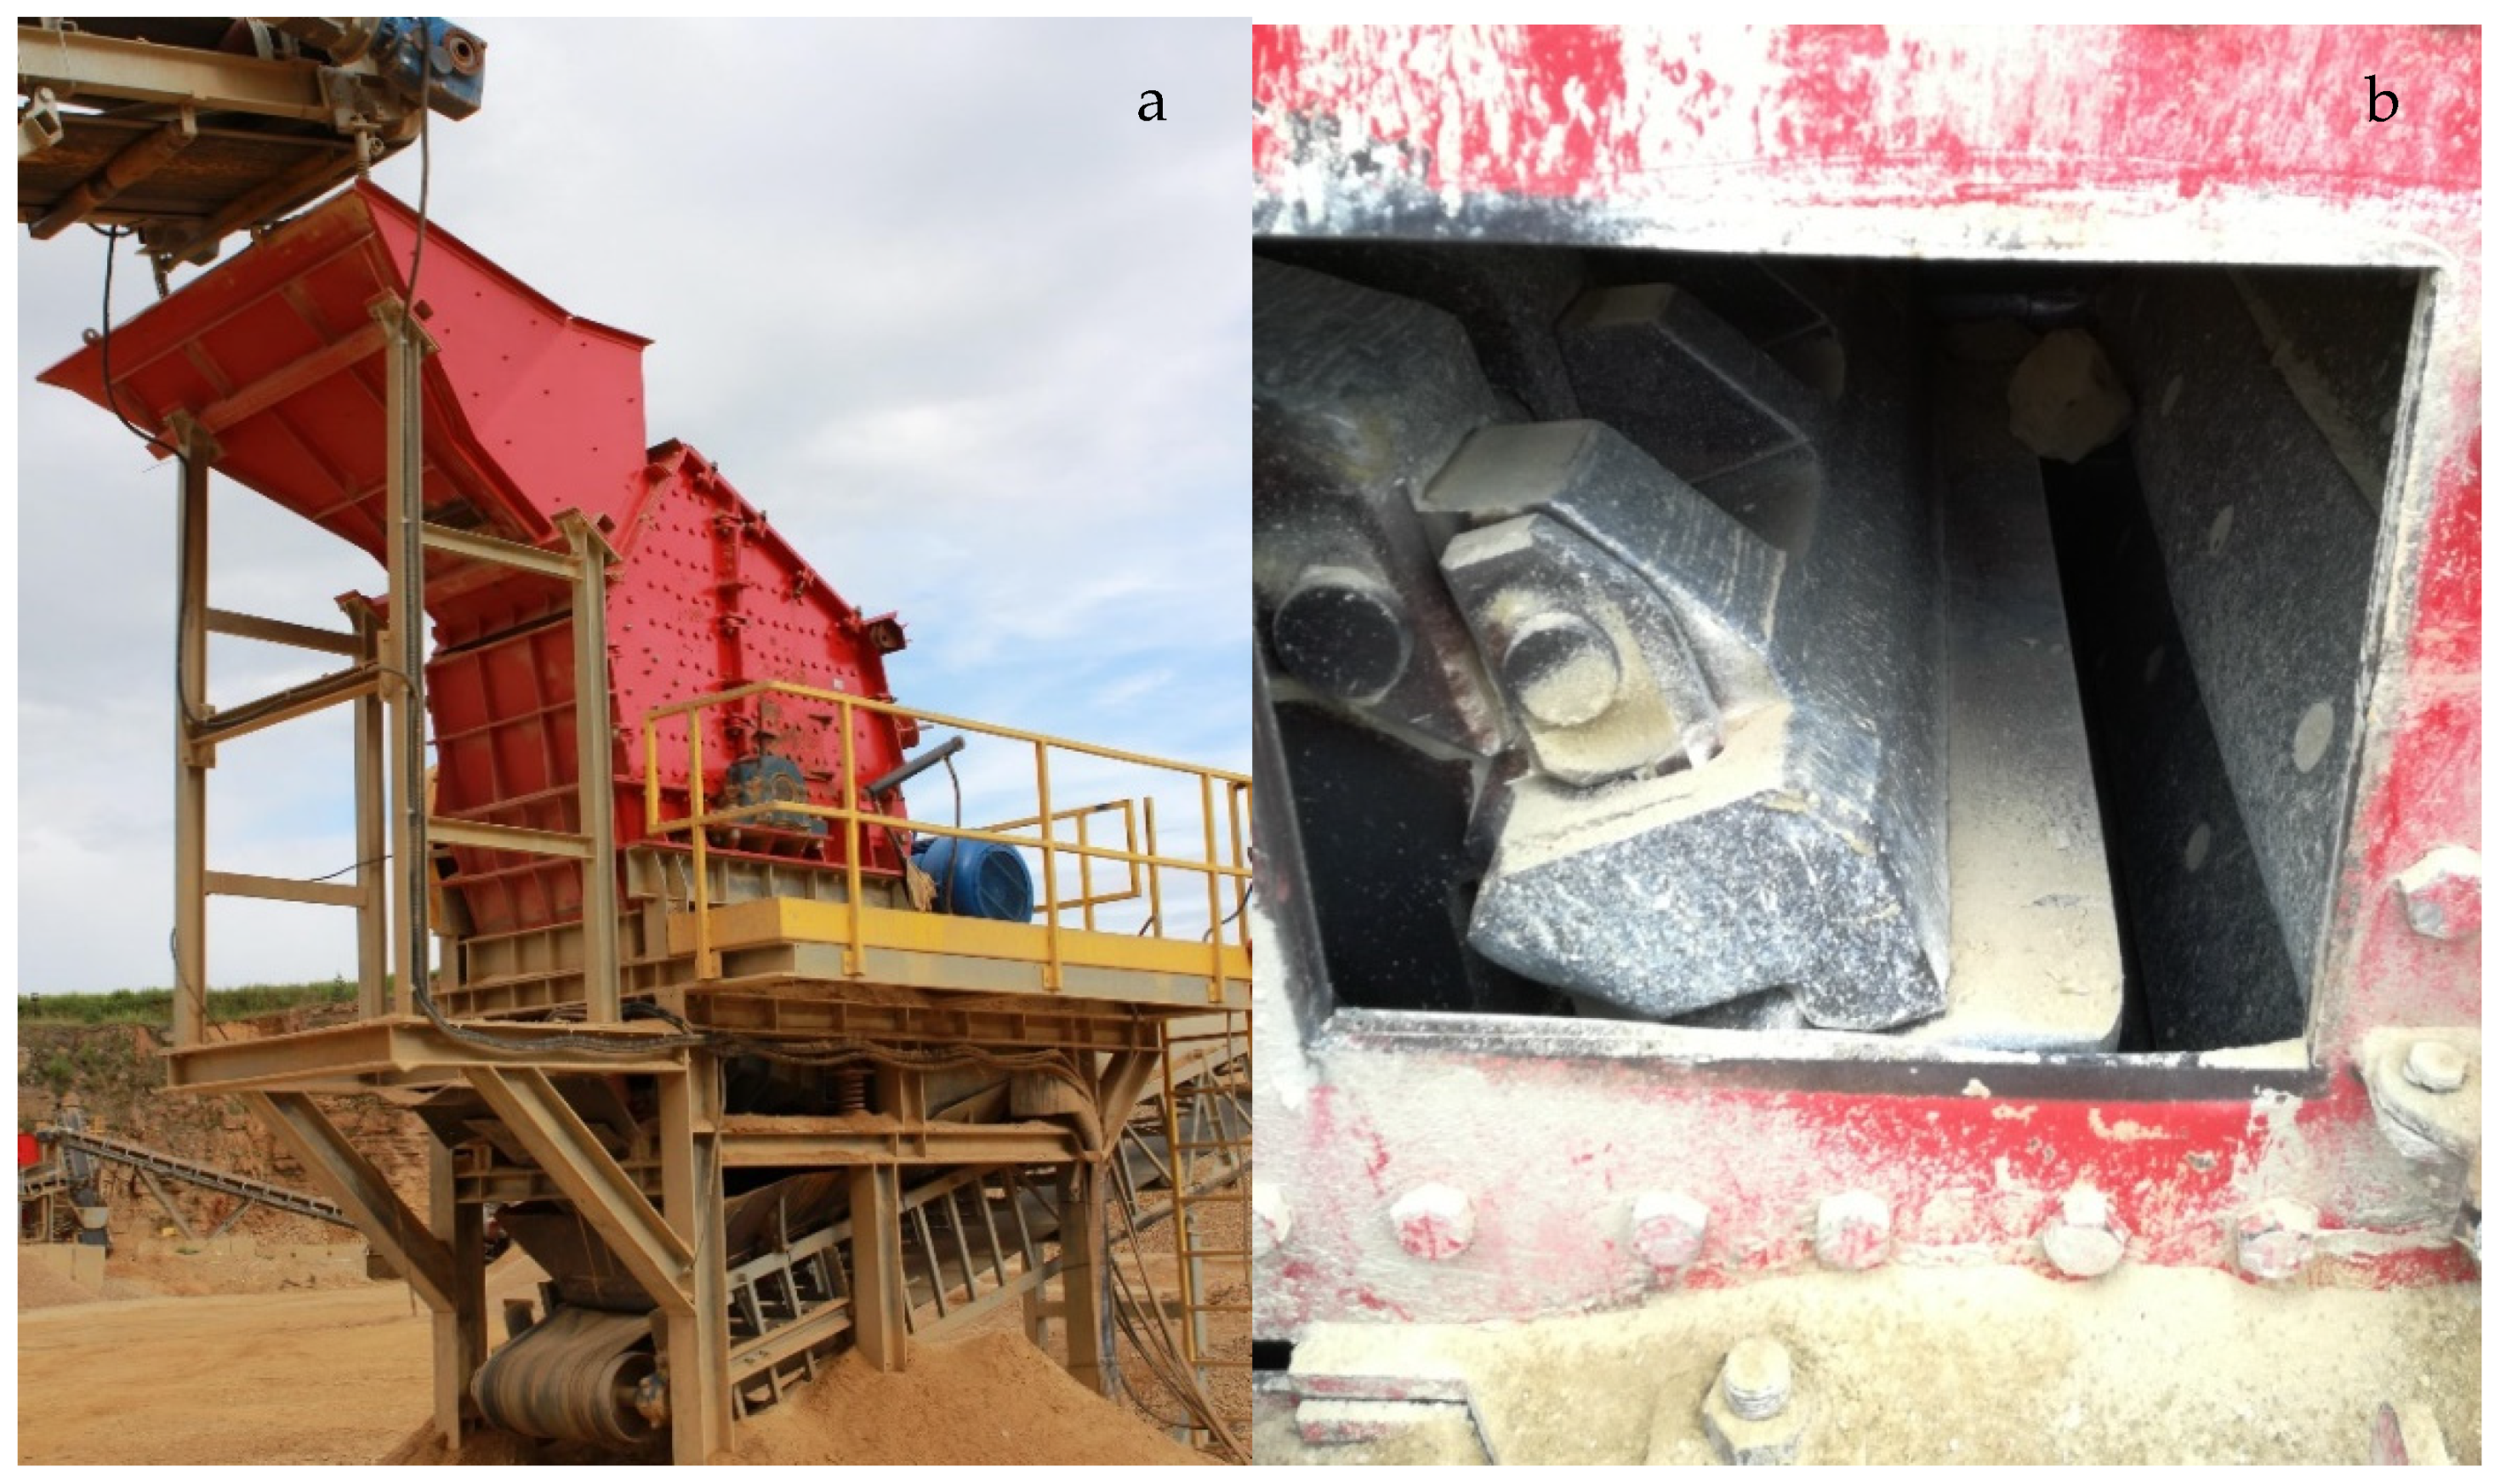
The tested impact crusher KU65-120 (
Figure 2a) is the device with horizontal shaft, equipped with four blades, and powered by a 200 KW engine. Dimensions of an inlet of the working chamber are 650 mm × 1200 mm. Three consecutive gaps are in the working chamber of the crusher and each of them is adjustable, according to requirements. The last one, called the calibrating gap (
Figure 2b), has the smallest width, which was subject to change in the investigative program. The first and the second gaps remained constant during experimental program and equaled 20 and 90 mm, respectively. The speed of rotor is controlled by adjustment of a specific frequency value on the thyristor box. For example, the frequency within the range 40–50 Hz corresponds to rotor velocity from 30 to 38 m/s.
The rotational speed of the rotor was the other operational changeable parameter. Nominal throughput of the crusher varies from 200 to 300 Mg/h depending on the breakage resistance of the crushed material. The machine is equipped with a counter of the power consumed during operation. This value was registered during the testing program and the unit energy consumption was calculated as a relationship of total power consumed to the throughput of the machine.
The device is top-fed by means of vibrating feeder. The material entering the working chamber is subjected to a series of collisions with the rotating blades of the rotor, walls and plates of the chamber, as well as other particles and after that exits the chamber as suitably finer particles, and around 80% of them have a regular shape.
3.2. Material Properties
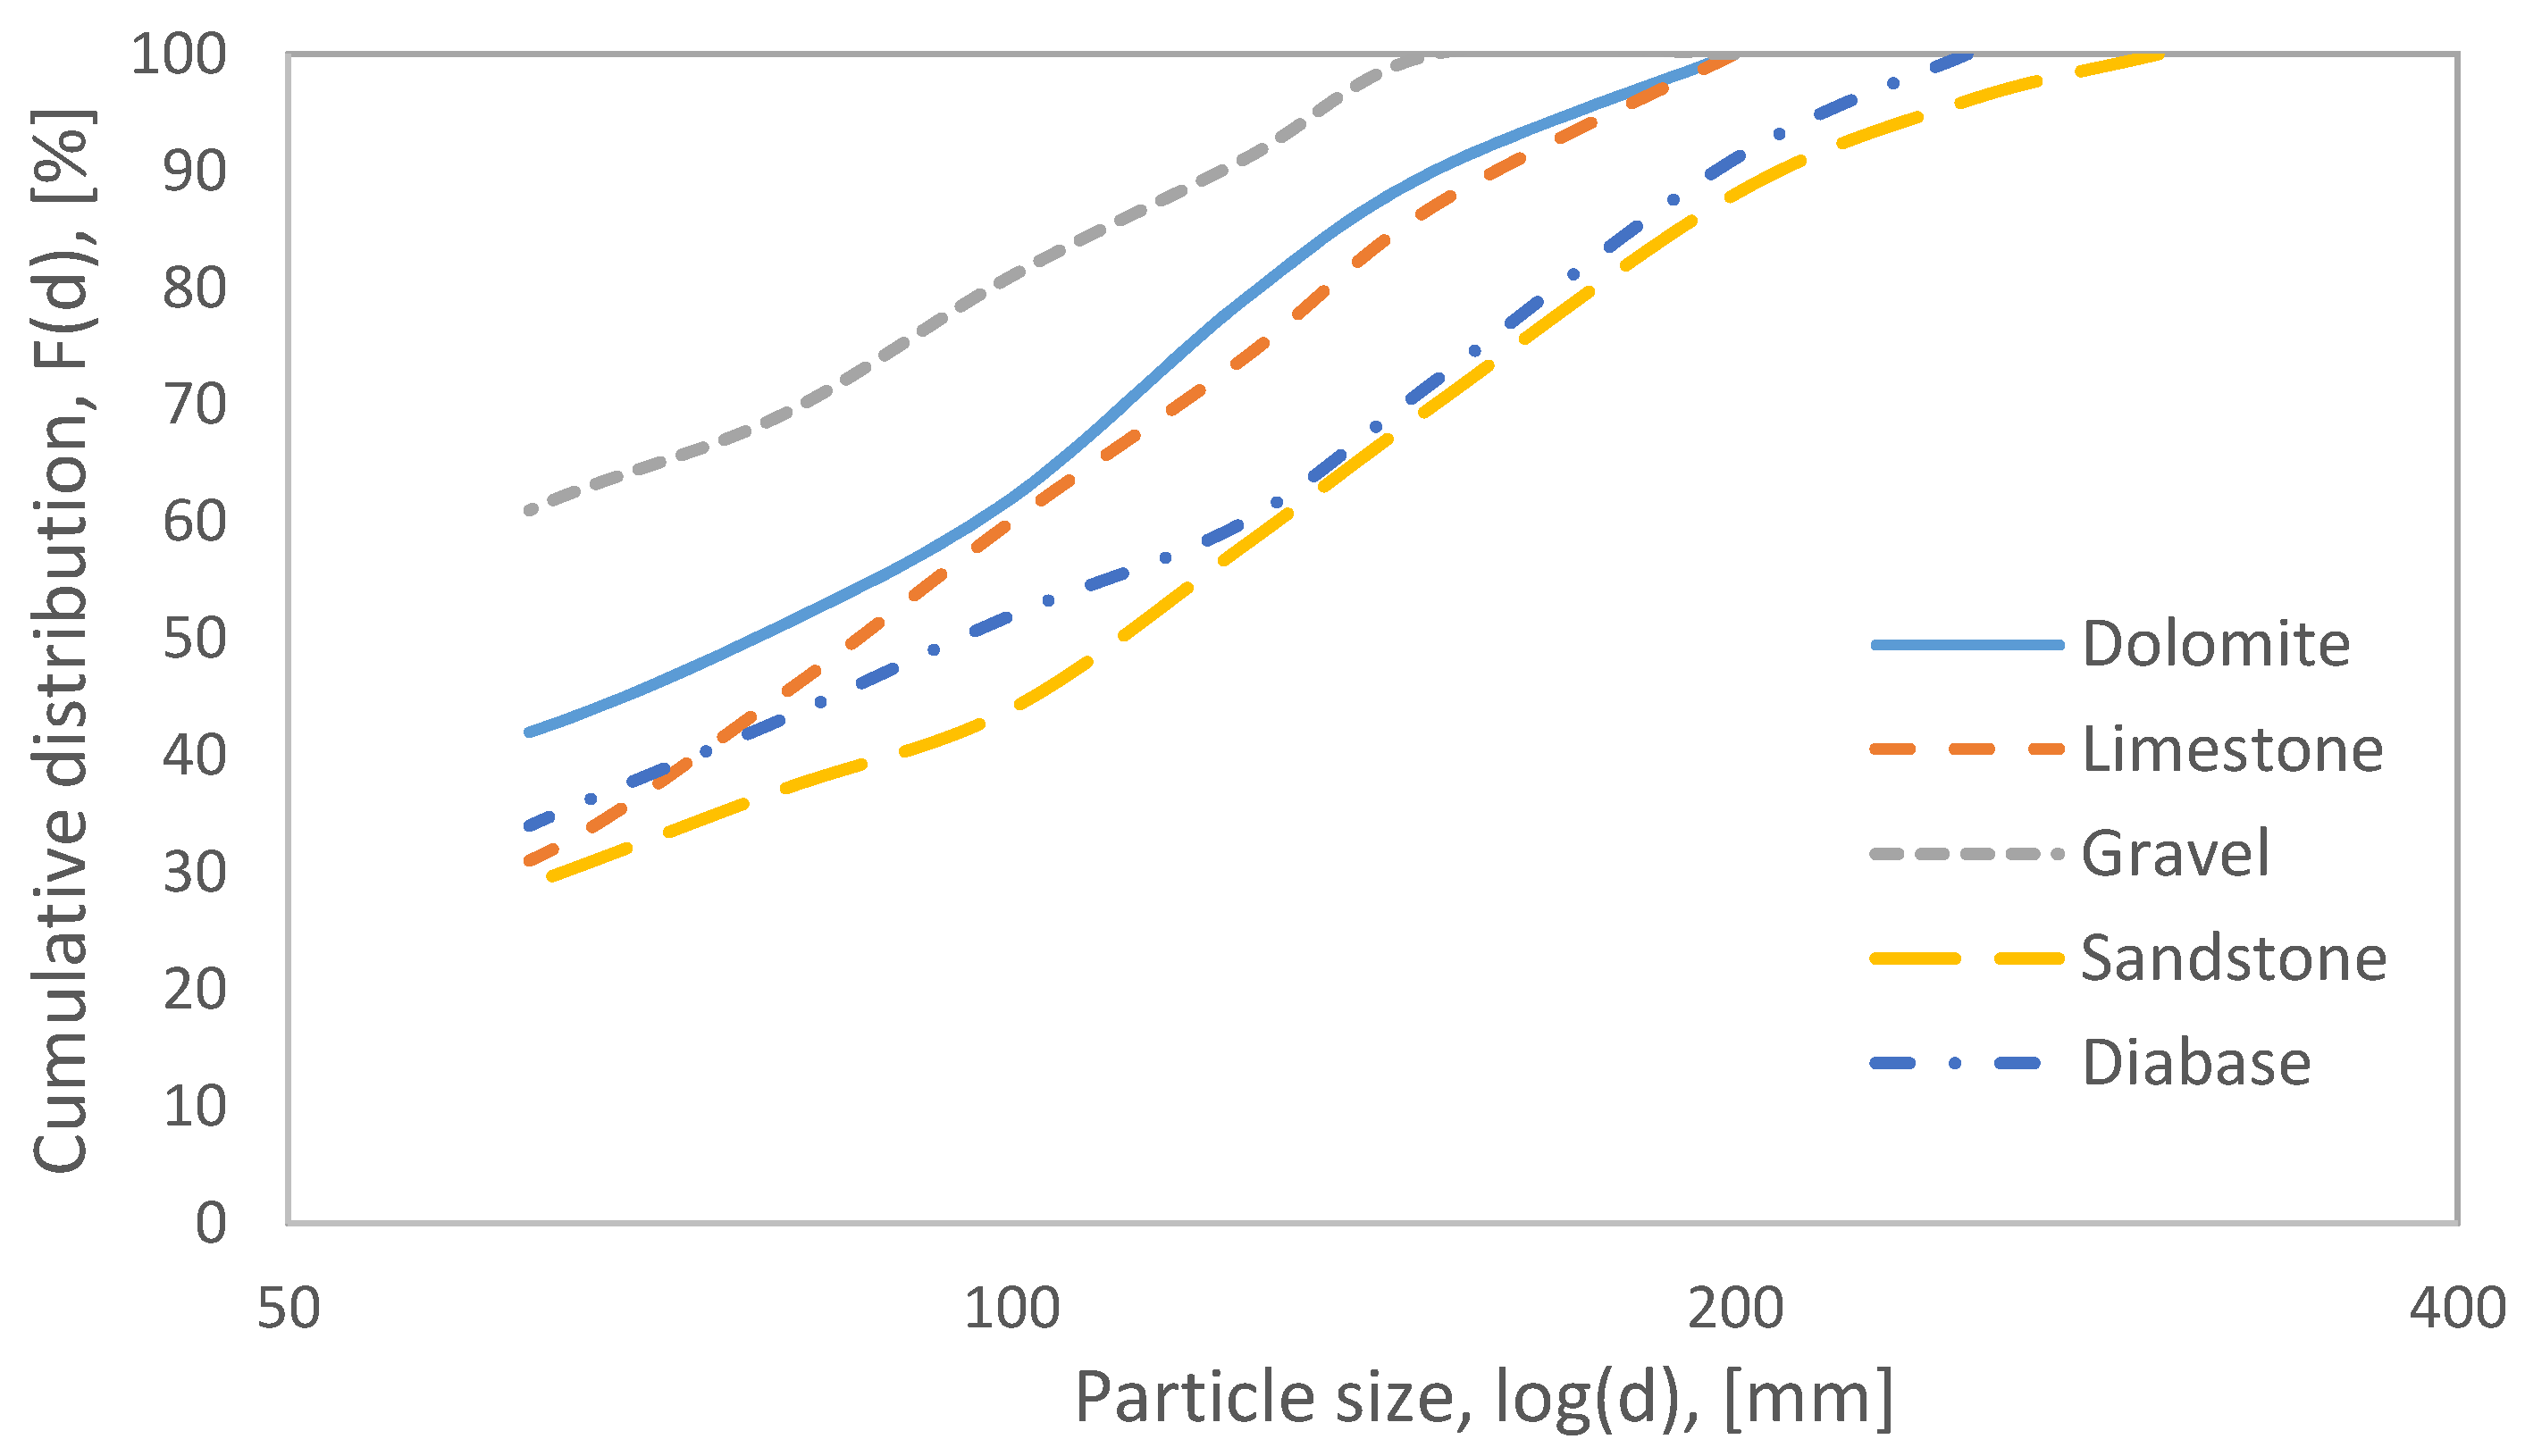
Five types of feed material were used in the testing program: dolomite (M1), limestone (M2), gravel (M3), sandstone (M4), and diabase (M5). Maximum particle size of gravel feed was 150 mm, while dolomite and limestone
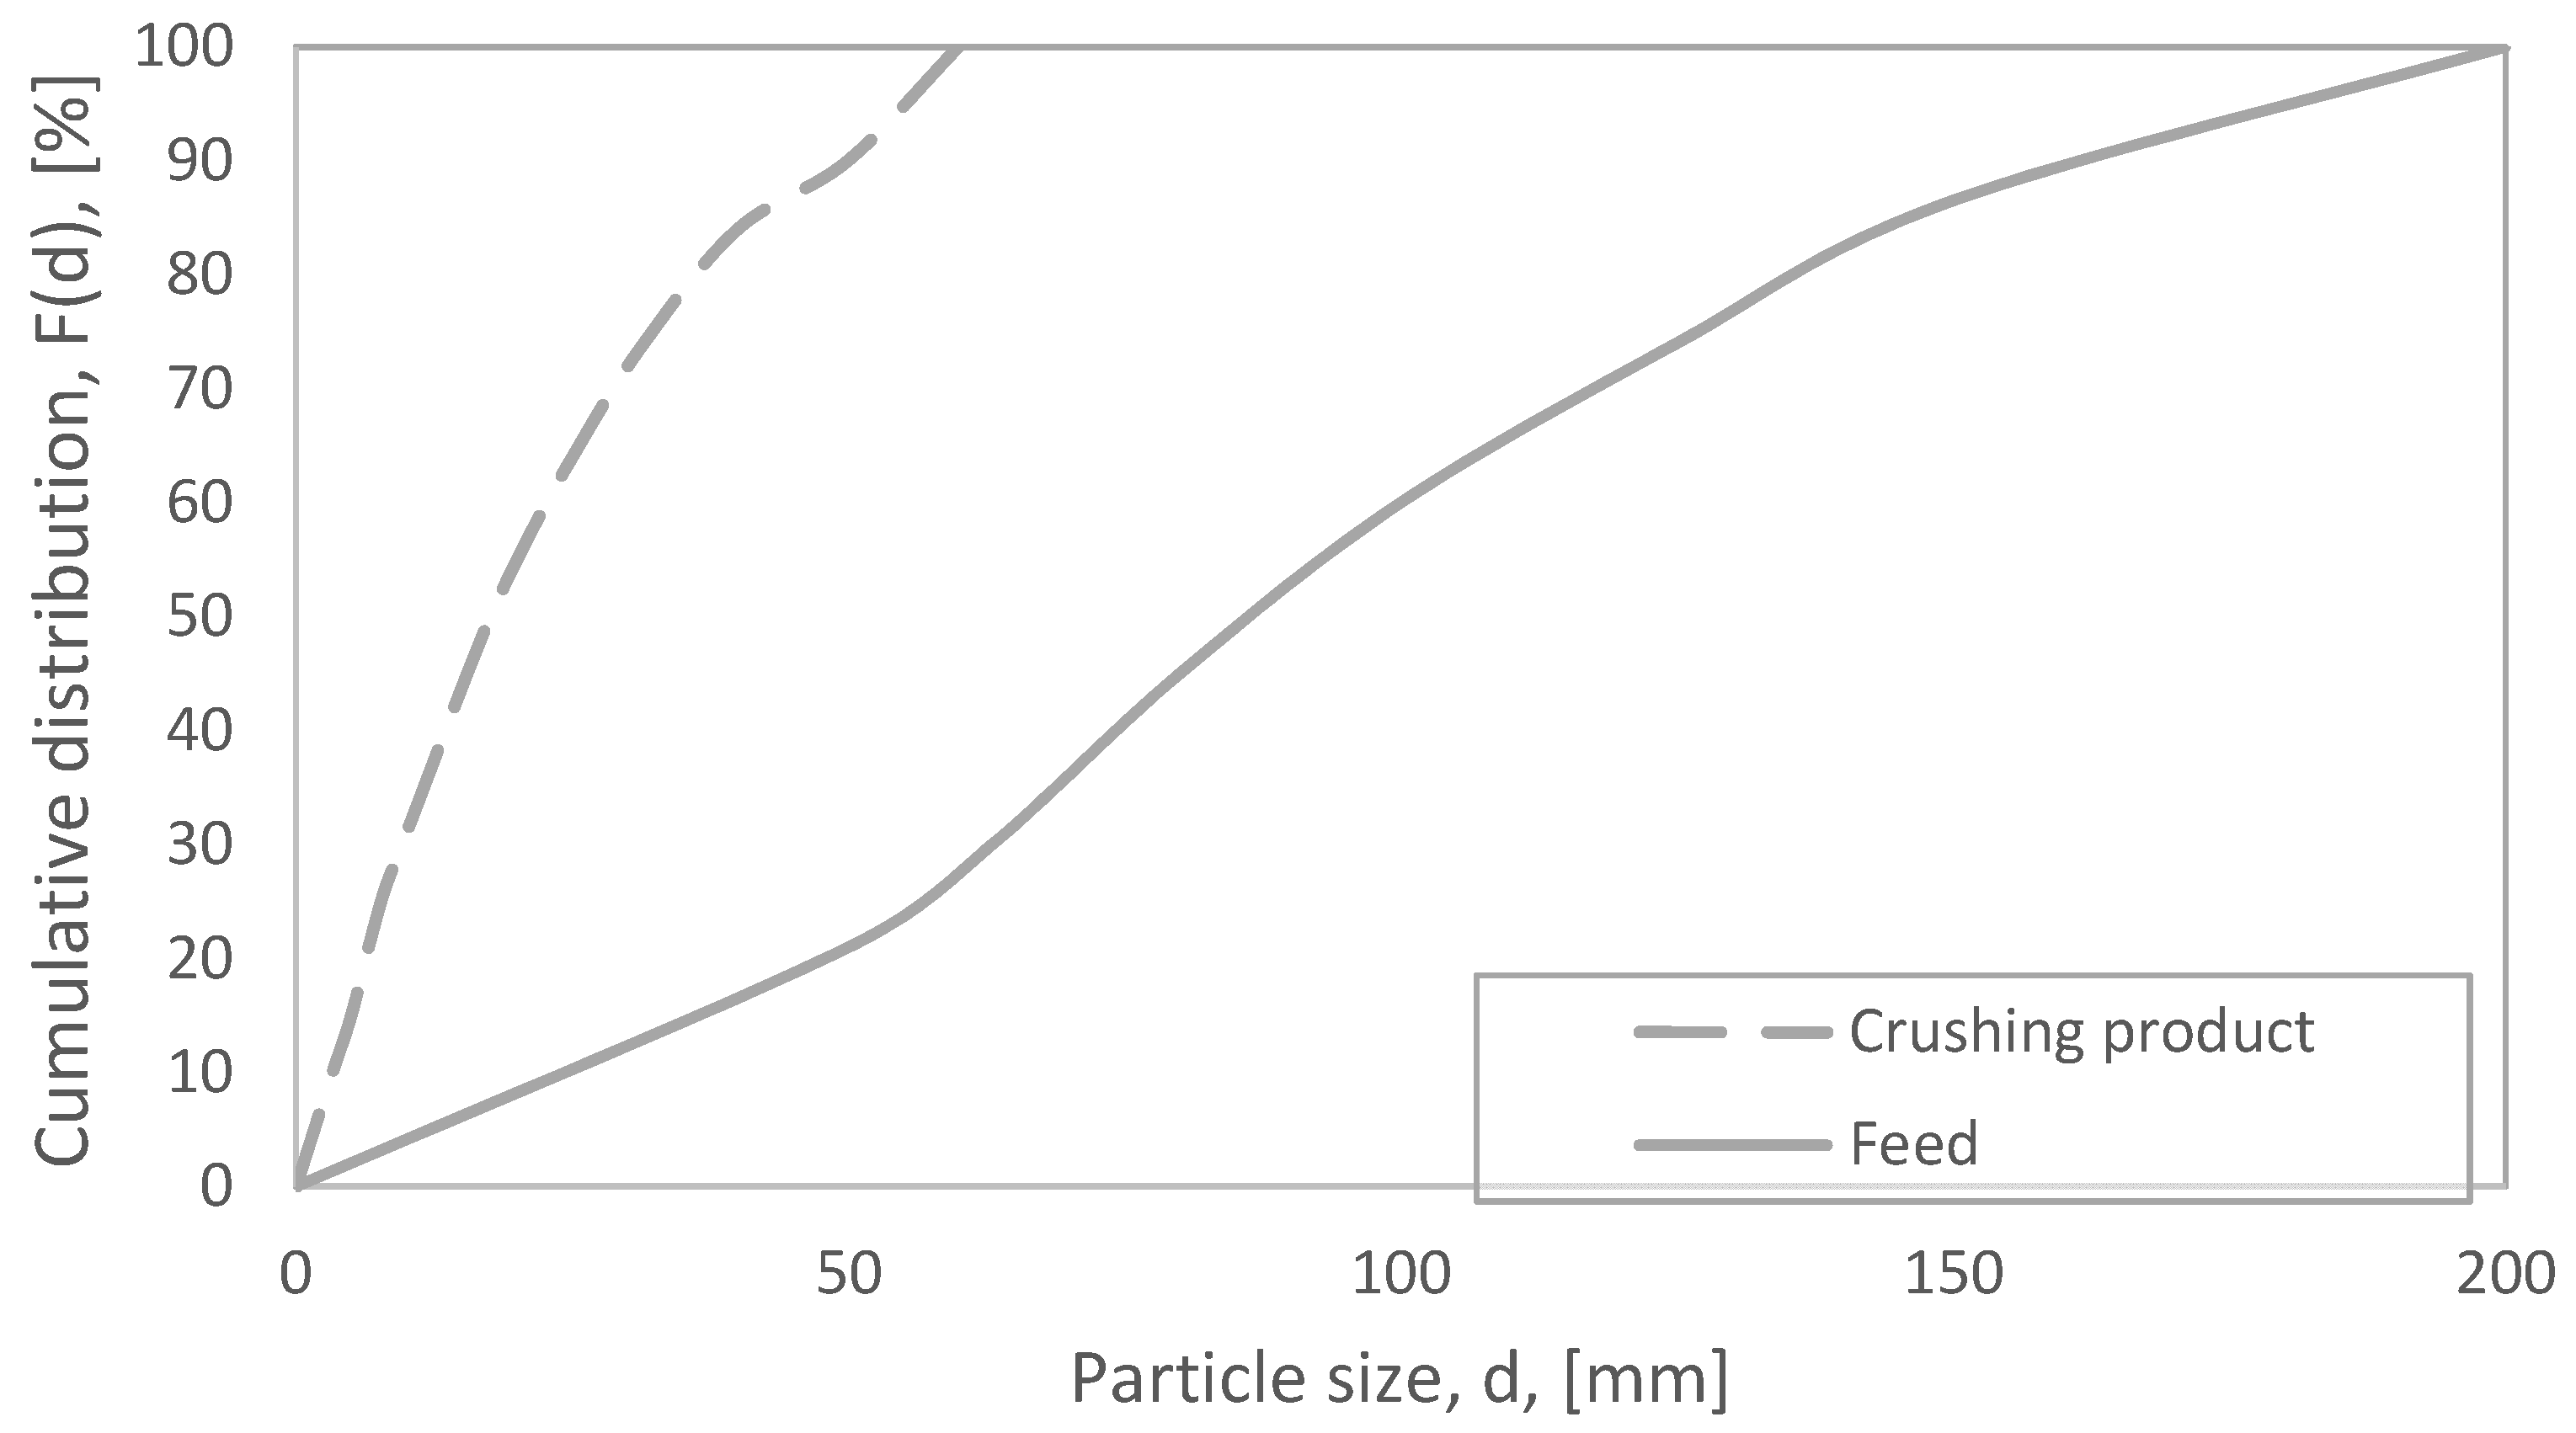
Dmax equaled 200 mm. Maximum size of diabase was 250 mm and the coarsest material, sandstone, was characterized with maximum particle size 300 mm. Detailed characteristics of particle size distributions of individual material types in semi-log scale are presented in
Figure 3.
Particle size distributions of individual types of materials differ, which is due to various conditions, i.e., internal structure of material, physical and mechanical properties of the feed, upstream mining techniques of material treatment, including blasting and primary crushing. Therefore, comparative analysis was based on achieved size reduction ratios S90. Limestone and sandstone can be characterized as materials that are easily crushed, while diabase and gravel showed the highest breakage resistance. Values of Bond’s work indices (BWi) were determined that equal, respectively, for the sandstone BWi = 9.2 kWh/t, for limestone BWi = 9.9 kWh/t, for dolomite BWi = 11.6 kWh/t, for gravel BWi = 13.1 kWh/t, and for diabase BWi = 13.4 kWh/t. The values were determined according to the Bond’s procedure in laboratory ball mill with dimensions 305 mm × 305 mm. The material volume for each single batch test was 700 cm3 with the load of 285 steel grinders (balls) (20.1 kg) with diameters from 15.2 to 38.1 mm.
Investigations were carried out on an industrial scale. The parameters of the device were set accordingly, and the production started. Samples of specific crushing products in a total mass about 200 kg each, were collected from the belt, after stabilization of the circuit capacity. Next, they were subjected to a mass reduction with use of a riffle sample splitter. Mass of a single sample for further analyses amounted from 30 to 50 kg, depending on the particle size of individual crushing products. After the sample collection, the settings of operational parameters were changed according to the testing program and after further stabilization of the circuit operation, another sample was collected.
3.3. Structure of the Model
Tests for various types of material and various operational parameters of the crusher were included in an investigative program. The variables can be therefore grouped into two categories: the one connected with material properties, and the other related to characteristic of the crushing device. A general form of the mathematical model can be written as follows:
where
y denotes a dependent value, which was defined either as a size reduction ratio
Sx, or as yield of the finest product (
FP1). The size reduction ratio, presented in Formula (2), is an index calculated as a relation of characteristic particle in the feed (i.e.,
D50,
D80,
D90) to the characteristic particle of the product (i.e.,
d50,
d80,
d90).
The second dependent variable,
FP1, was obtained during the sieve analysis performed for each crushing product. The
FP1 denotes yield of the finest particle size fractions, i.e., below 2 mm, that existed in individual crushing product. Feed analysis shows (
Figure 3) that none of the material contains size fractions below 2 mm. Determined values of both dependent variables for each crushing products are presented in specific columns in
Table 1,
Table 2,
Table 3,
Table 4,
Table 5 and
Table 6, along with the other results of experiments.
The experimental program was conducted according to methodology of factorial experiments [
34,
35], in which various levels of variability were used, depending on the type of variable. Two major operational parameters of the impact crusher (variable 1 and variable 2) were selected as independent variables in specific models and three levels of changeability were assumed for each of them.
For variable 1 (linear velocity of rotor) values 30, 34, and 38 m/s were tested, while for the gap (variable 2) the widths 40, 60, and 80 mm, were used. During the crushing process two additional operational parameters were registered:
Crusher’s productivity, Q,
Unit energy consumption, Esp.
In the case when each testing variable has the same number of changeability levels, the total number of required single experiments to be performed can be described through Formula (3).
where
k—number of variables;
n—number of variability levels. For the above assumptions nine single experiments were carried out for a given type of feed material. Investigations were carried out for five various types of feed materials, in order to check the potential effect of material on crushing results. The material type can be then treated as a variable 3, with five levels of changeability.
A complete factorial experiment was conducted for materials M1, M2, and M3, with N = 9 tests for each material. On the basis of the obtained results, it was possible to reduce the one variability level for the variable v1 (34 m/s of rotor’s linear velocity) in the testing of materials M4 and M5. The results indicated that it was also possible to eliminate the middle value of variable v2 (gap 60 mm), and the further tests, conducted on materials M4 and M5, included two variables with two levels of changeability. A factorial experiment with
N = 4 tests was conducted for materials M4 and M5. A detailed testing scheme is presented in
Table 1.
As it was defined in Formula (1), for each configuration of independent variables, the crusher’s work models were calculated separately for FP1 and S90.
Considering the above, the Formula (1) can be written as follows:
where:
FP1—yield of the finest product;
S90—90% size reduction ratio. In total, 35 single experiments were conducted on plant scale.
4. Results
Table 2,
Table 3 and
Table 4 present the achieved results for materials M1–M3: dolomite, limestone, and gravel, respectively.
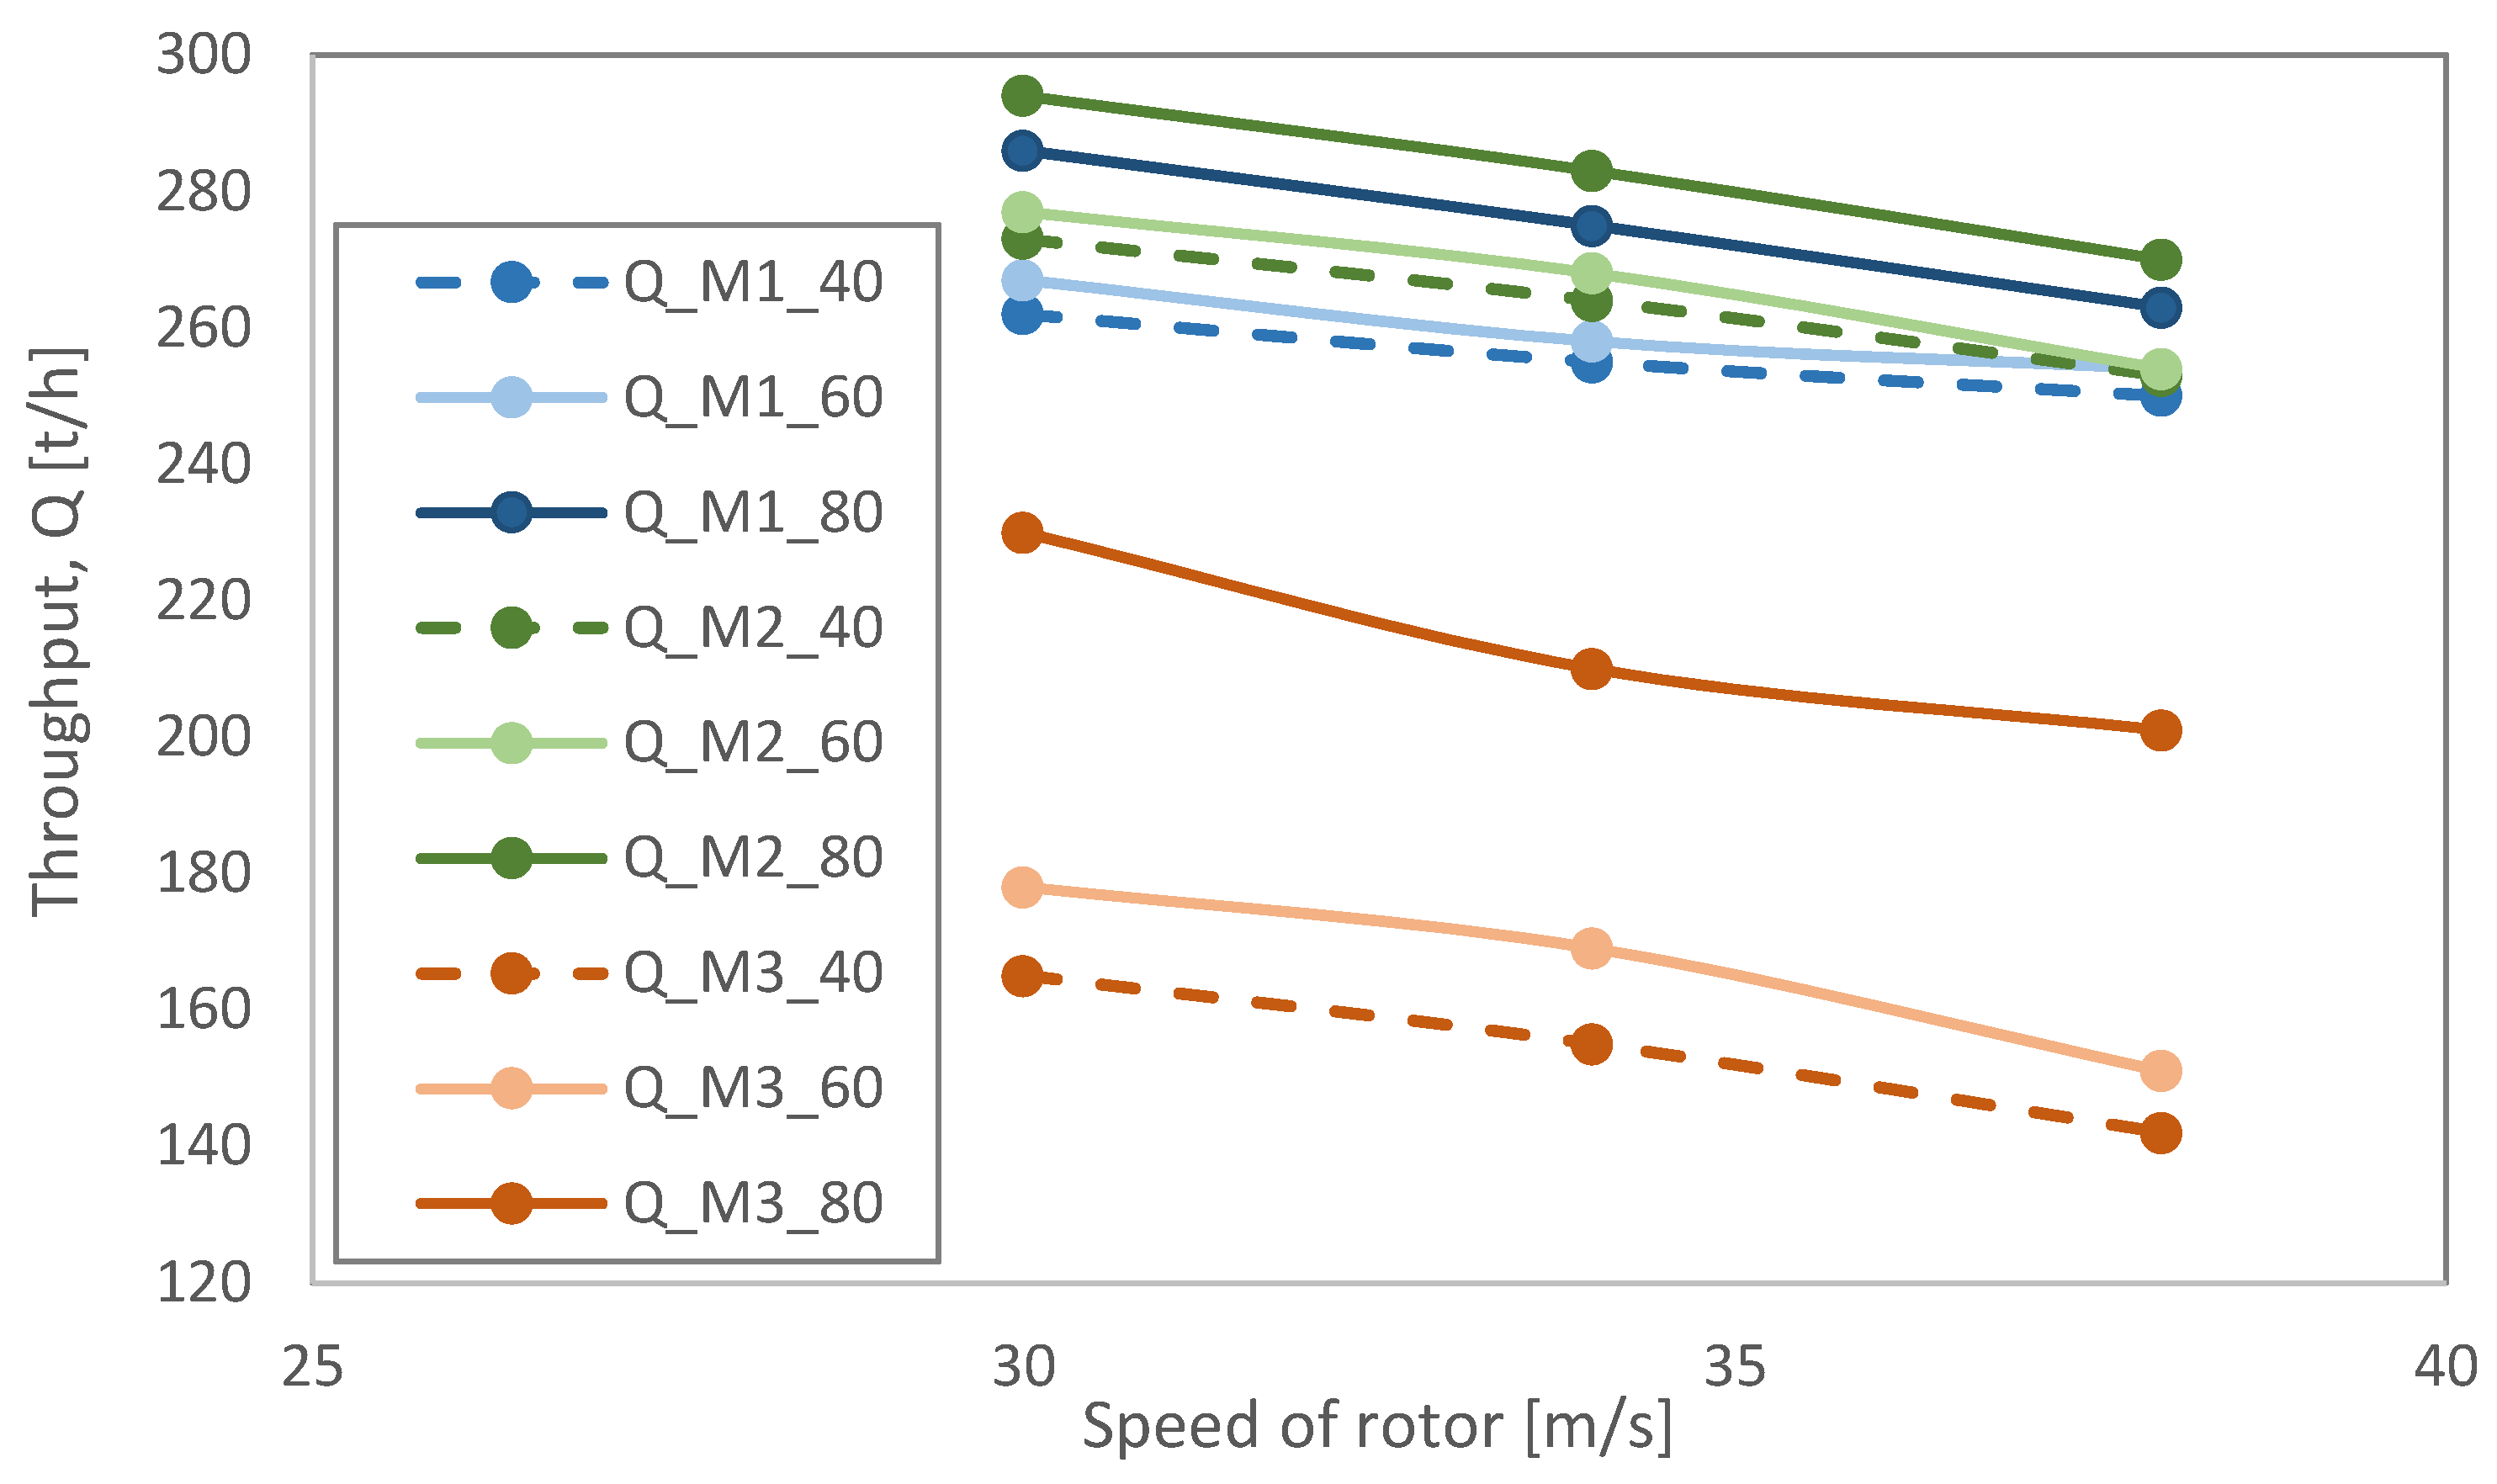
Analysis of throughput (
Figure 4) shows that the highest diversity in results can be observed for the material M3 (gravel) and the lowest for dolomite (M1). However, changeability for limestone (M2) was almost identical as for dolomite. The results obtained for material M3 were also the lowest in absolute numbers. It can be stated that processing of broken aggregates (M1 and M2) can be carried out at higher throughputs, while for the gravel much less favorable throughput was achieved. This is due to physical properties of the material and individual characteristics related to breakage resistance. It is not possible to clearly state which of the variables have a more significant impact on the throughput, especially for broken aggregates, i.e., materials M1 and M2. It is, however, visible that the gap width is proportionally correlated with the productivity, while the speed of rotor shows an inverse relationship: an increase in the speed of rotor from 30 to 38 m/s is effective in decreasing the throughput value by nearly 10%. This is due to the higher number of collisions with the rotor and plates, that a single particle experiences in the working chamber. The relationship between speed of rotor and the throughput for the gravel material is similar to materials M1 and M2, also in terms of the magnitude of changeability, but the gap has a significantly higher impact on the throughput. Increasing the gap from 40 to 80 mm causes the throughput increase by about 30%.
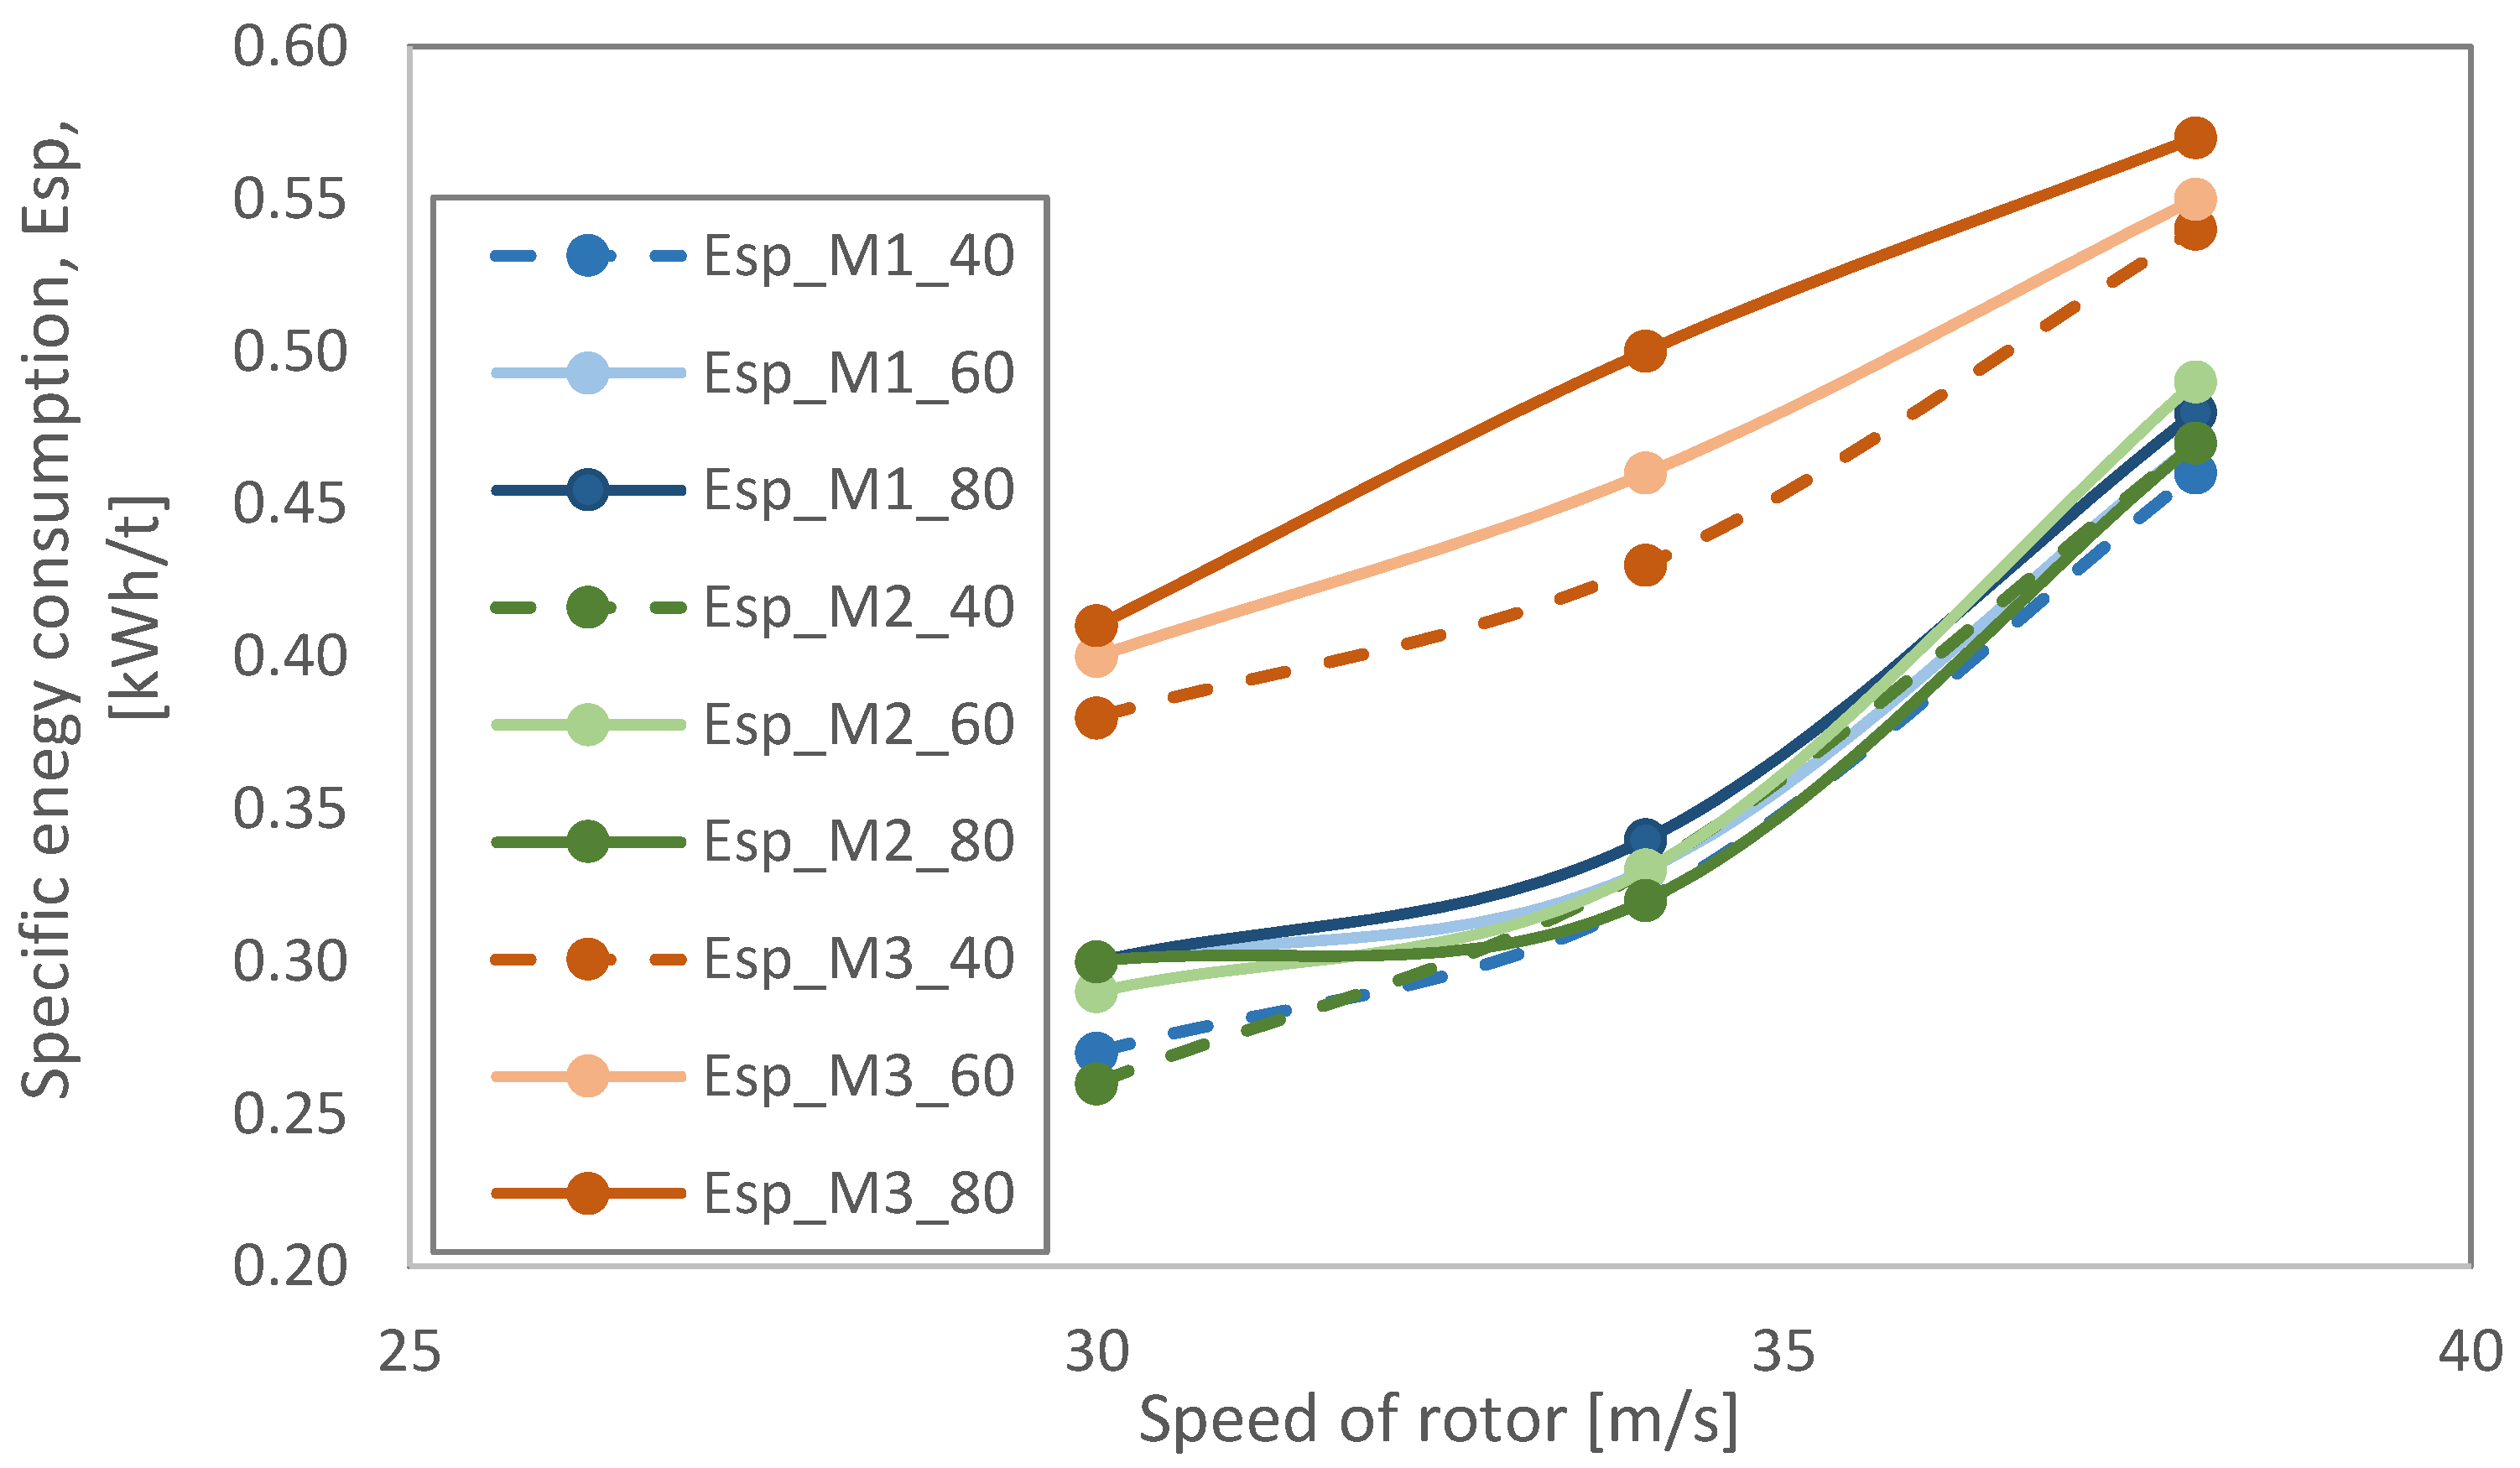
Both the relationship between a unit energy consumption and the speed of rotor appear to be proportional for all tests (
Figure 5). For materials M1 and M2, an increase in the
Esp together with the higher values of the speed of the rotor is more intense than for the gravel—
Figure 4. On the basis of these results, it can be stated that in the case of broken aggregates the speed of the rotor has the higher impact on energy consumption than for the gravel aggregates. Processing (comminution) of these aggregates requires more input of energy, probably due to the more rounded shape of single particles, causing it to be more difficult to disintegrate them in the crushing device. The width of gap has a much less significant impact on the energy consumption than speed of rotor and can be even disregarded in this approach.
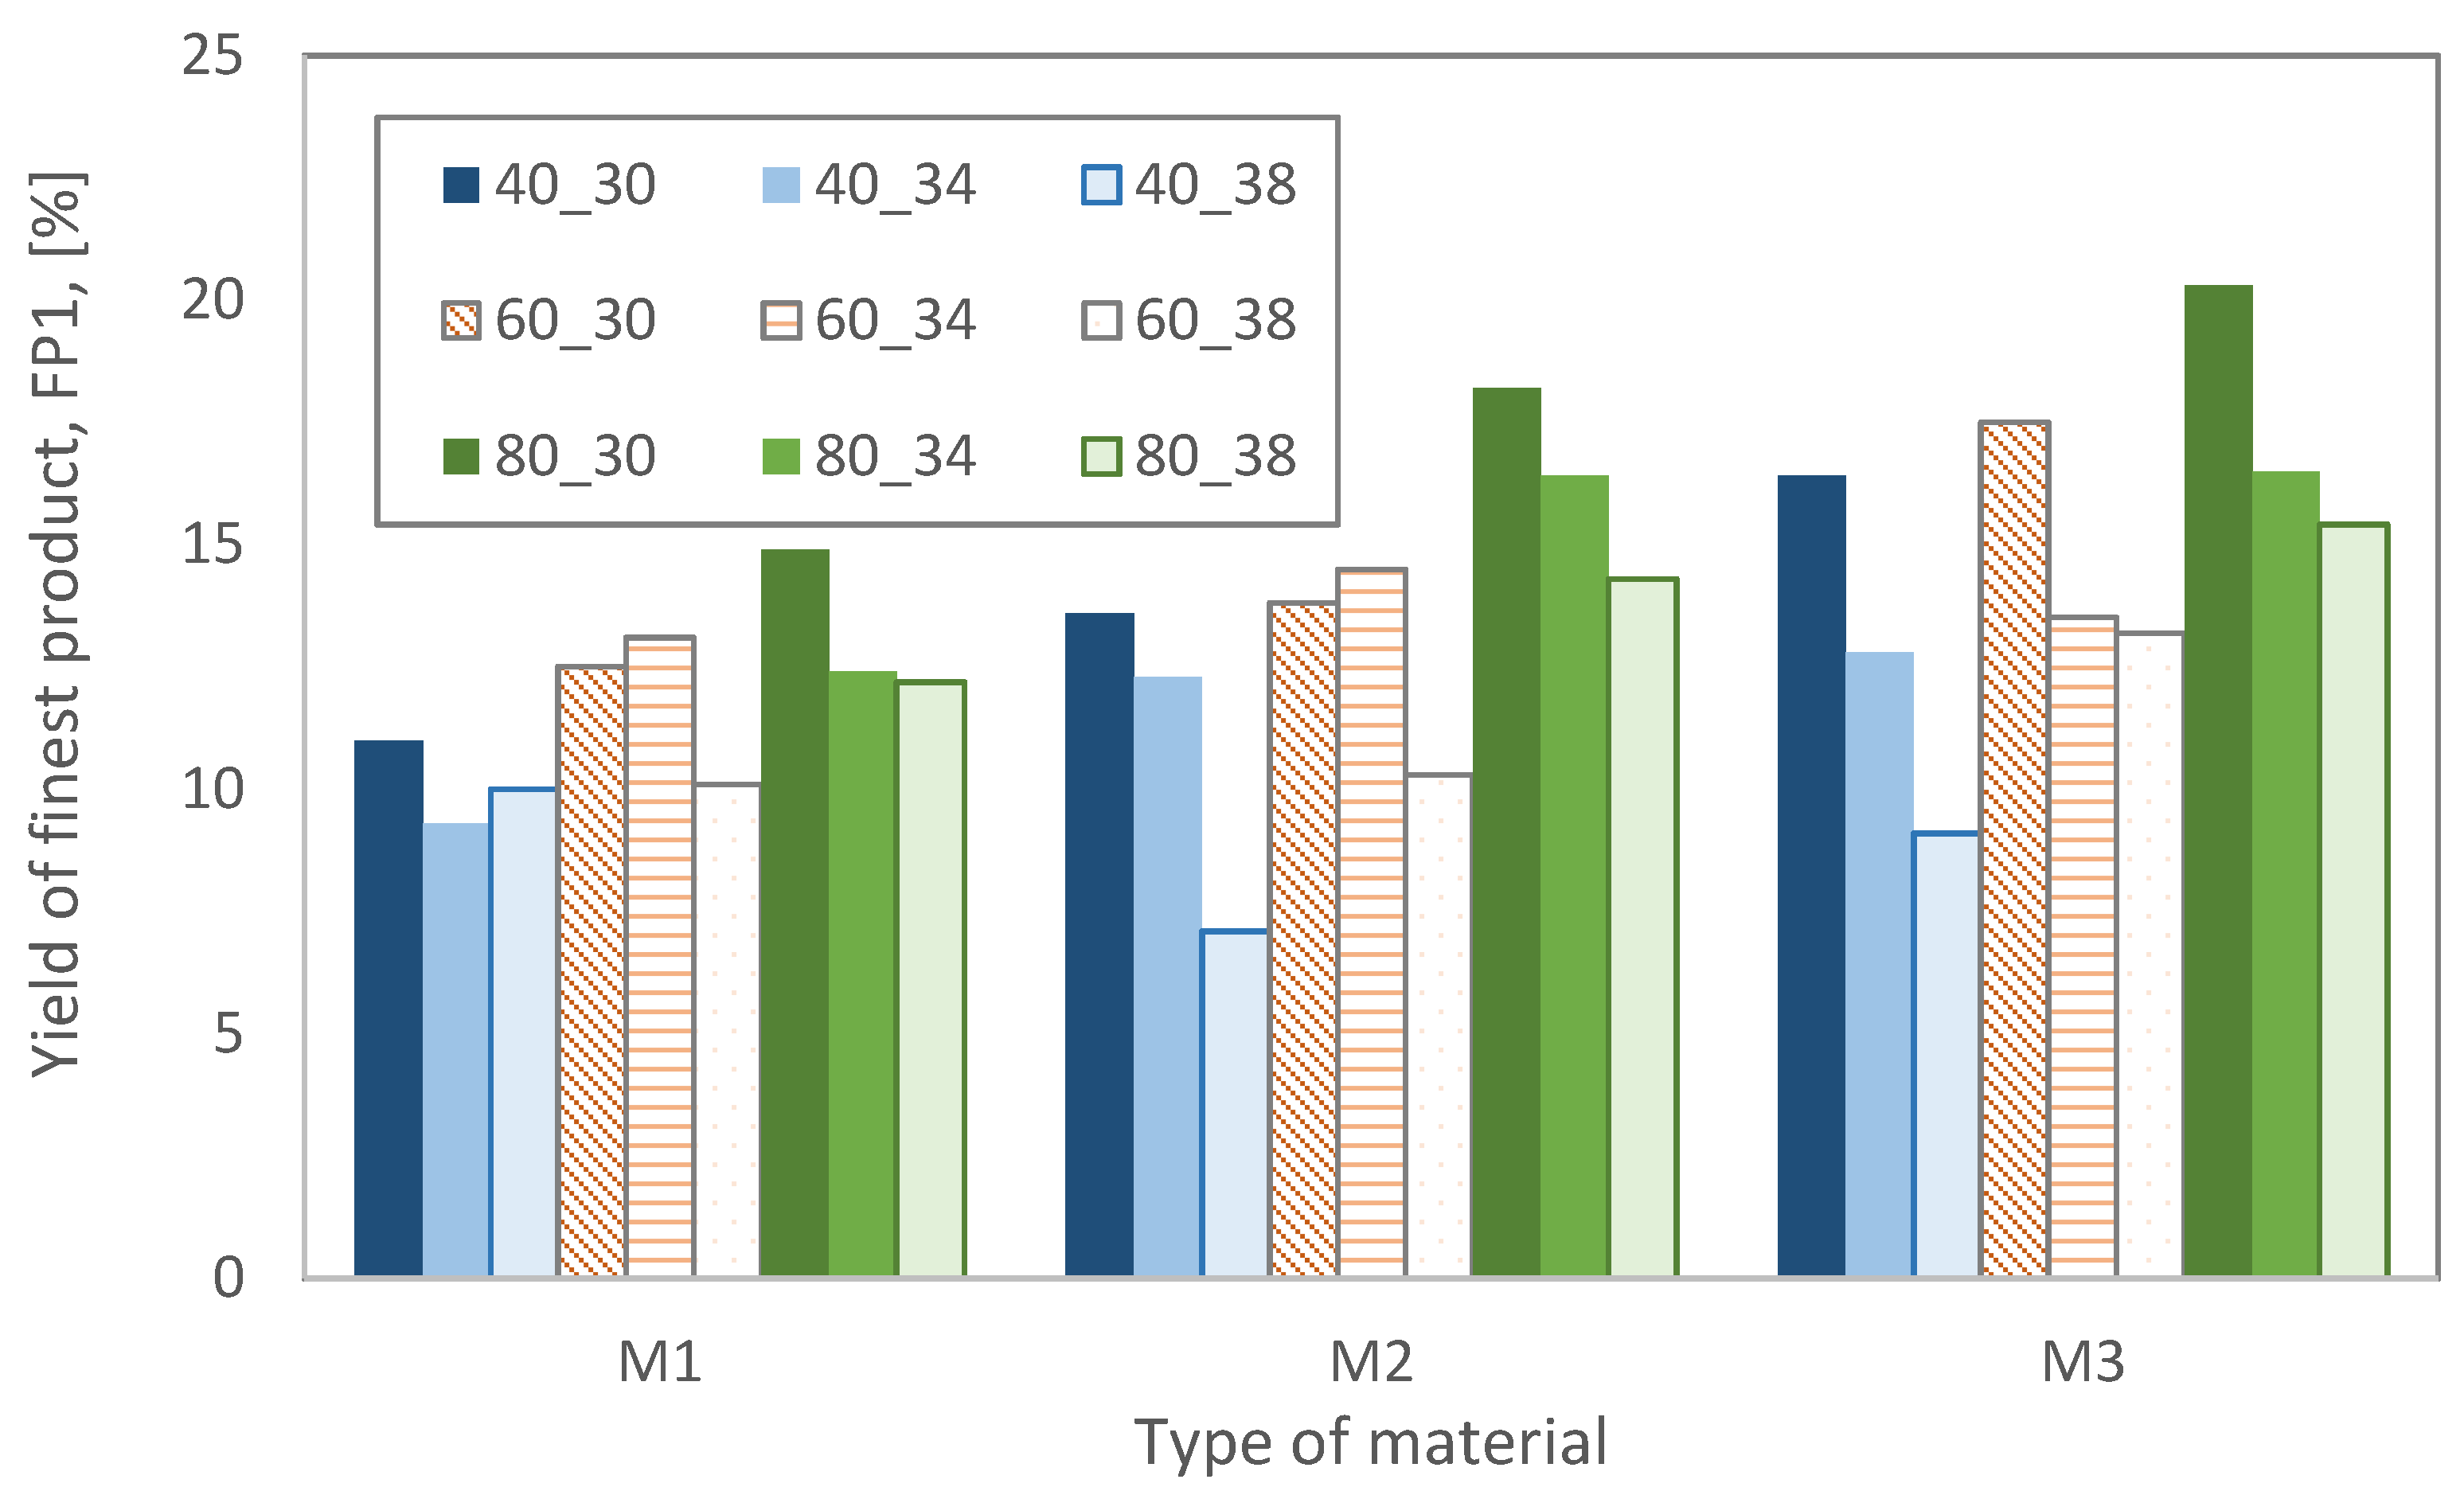
The yields of finest size fractions (i.e., below 2 mm) in individual crushing products are presented in
Figure 6. The lowest content of fines was observed for the material M1, and equaled 11.72%, on average. For the limestone (M2), this value was nearly 2% higher (13.39%) and the highest value was observed for the gravel aggregate M3 and amounted to 14.97%. For the M2 and M3, a relationship between
FP1 and speed of rotor is inverse, while for the material M1 it is hard to determine a clear relationship, because depending on the gap width, the relationship is parabolic or inverse. The width of the gap, in turn, is proportional to the yield of finest products, regardless of the speed of the rotor (
Figure 6).
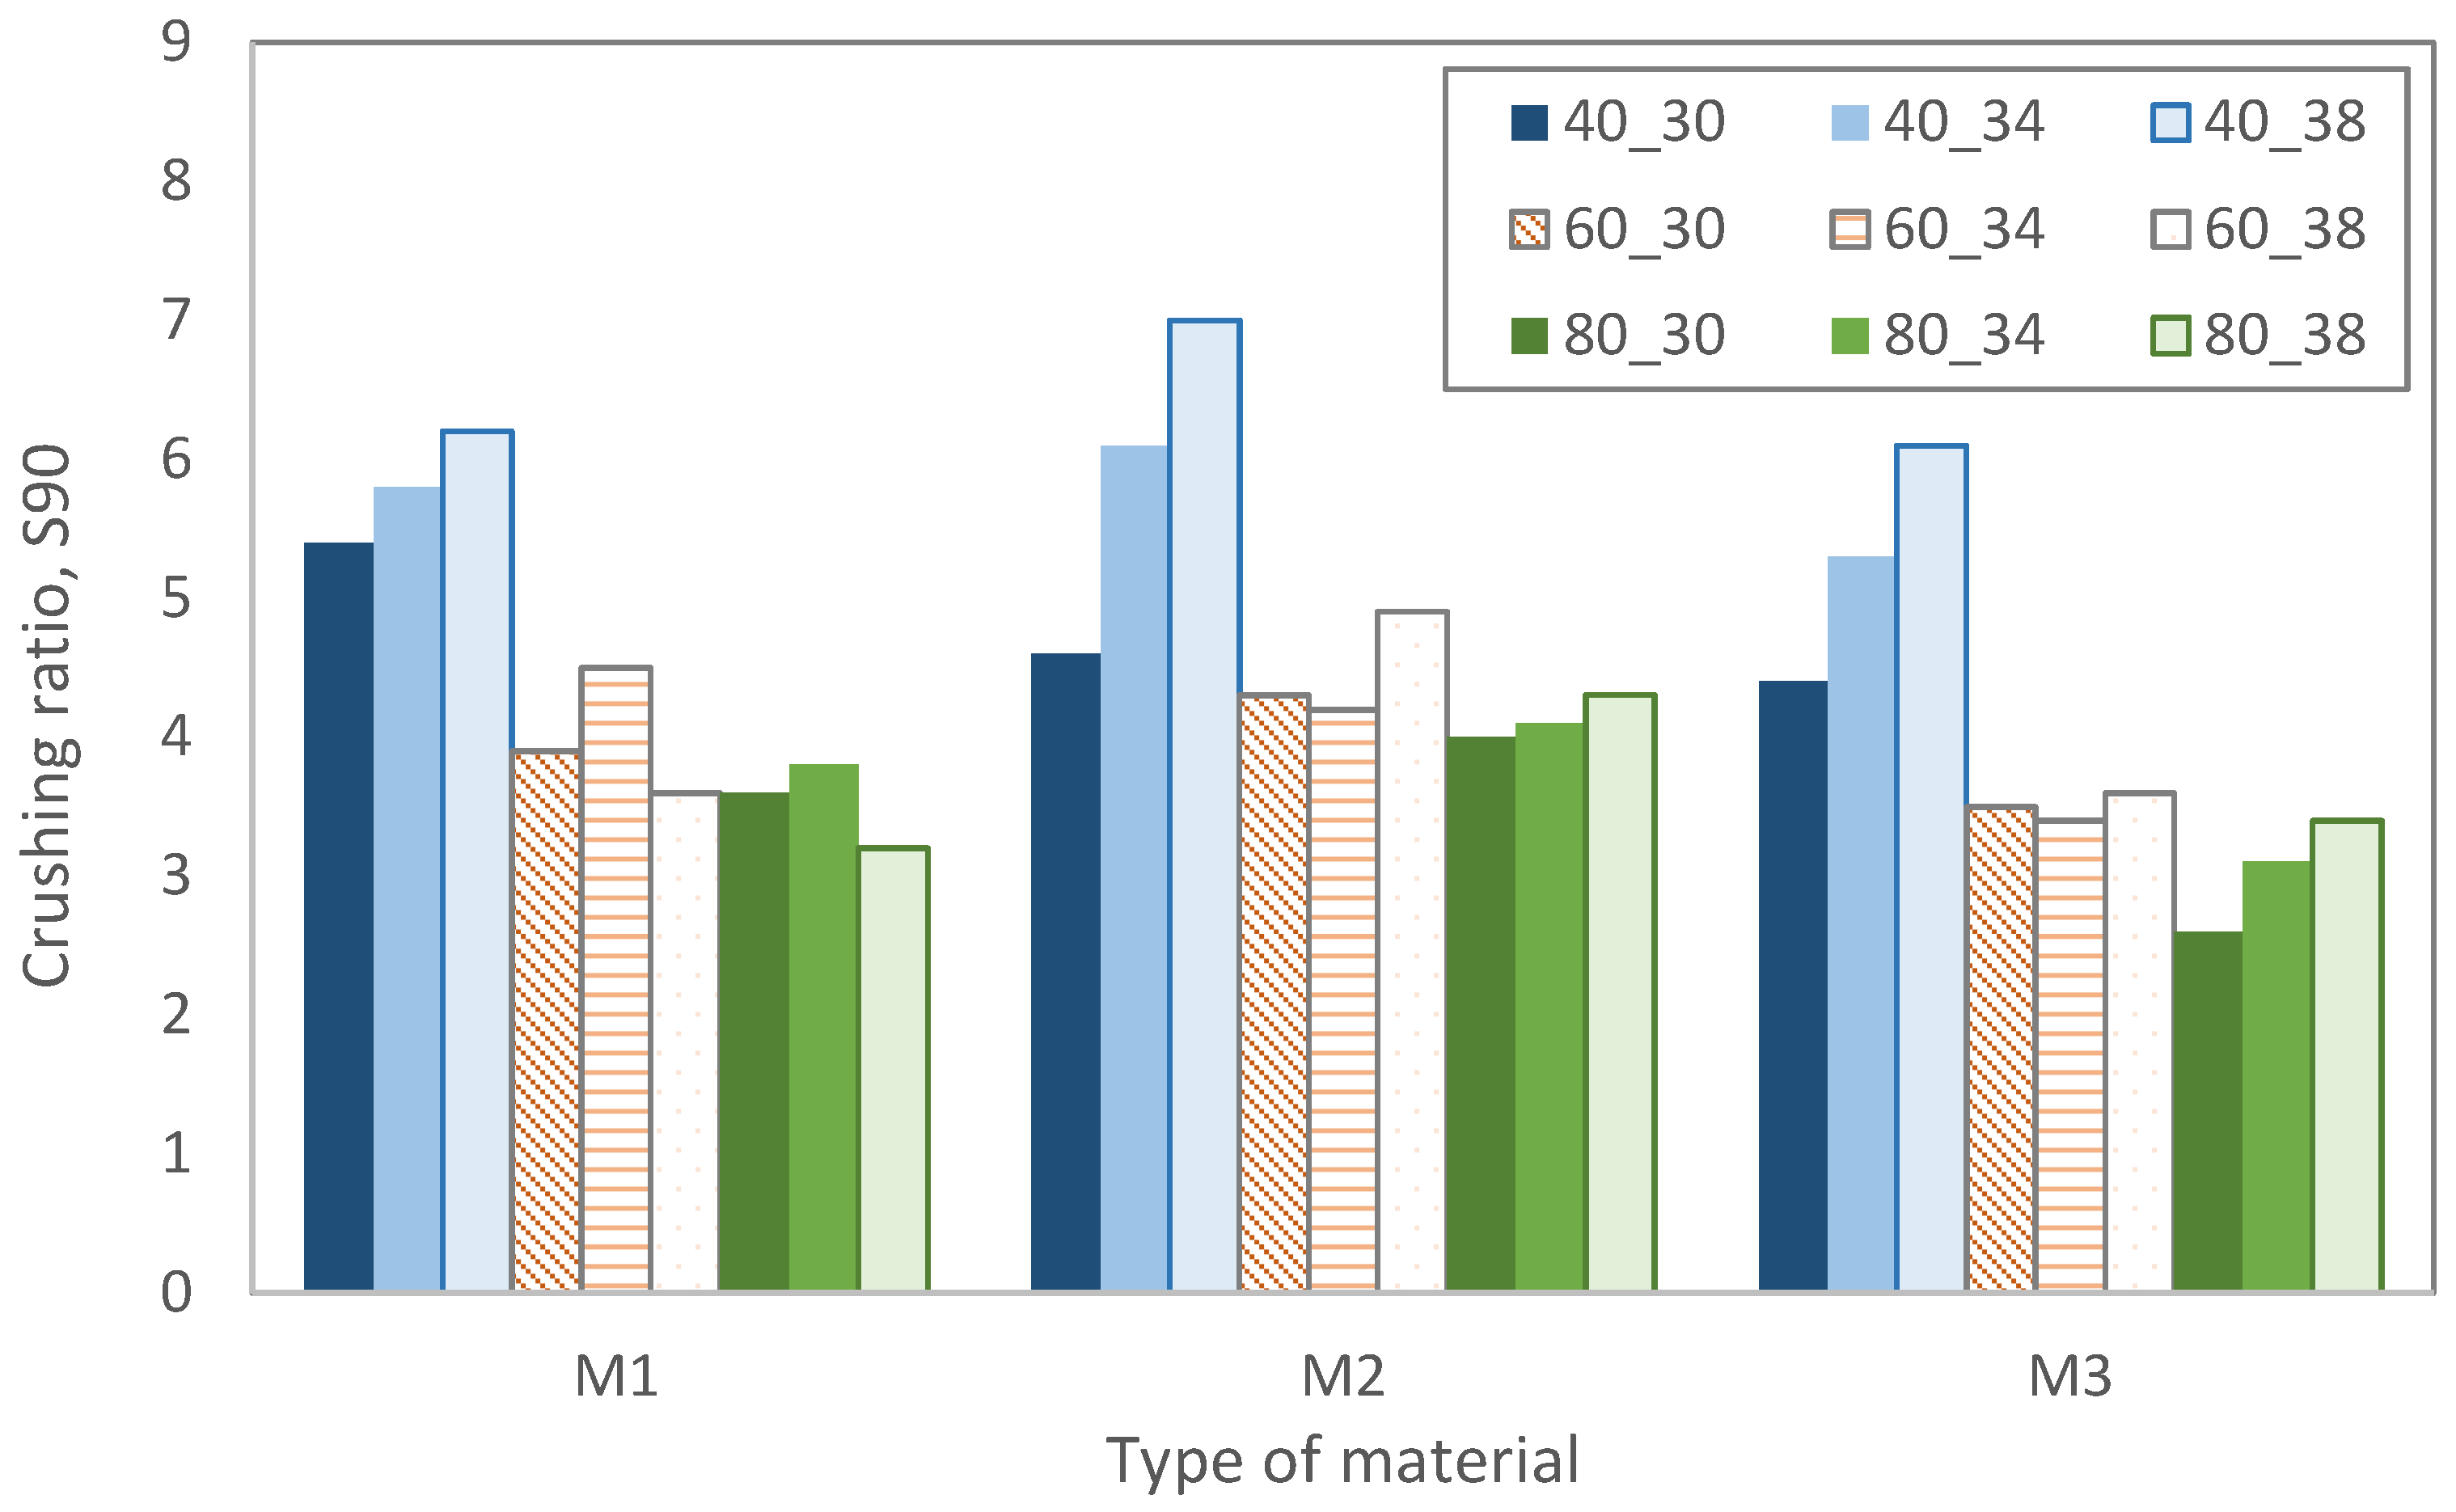
Analysis of values achieved for the 90% crushing ratio shows that the highest results were obtained for the width of gap 40 mm. Analogous values for the gaps of 60 and 40mm were significantly lower, regardless of the type of material. A significant impact of the speed of the rotor on the crushing ratio can be observed especially for M2 and M3, but mostly for the smallest gap. For 60 and 80 mm of gap values, there are rather insignificant variations observed in
S90 values, both in terms of material type and the speed of the rotor (
Figure 7).
In the second stage of experiments, two levels of values were accepted for analyzed variables. Results of investigations show that most achieved results (
Figure 4 and
Figure 5) for the mid-values of speed of rotor and the gap are placed proportionally between the boundary values. Similar tendencies can be observed inspecting
Figure 6 and
Figure 7. Therefore, only boundary values were taken into consideration in investigations, and for variable v1—speed of rotor—30 and 38 m/s were accepted, while for variable v2—the gap—40 and 80 mm widths were used. Two further materials, sandstone (M4) and diabase (M5), were tested and four tests in total were carried out for each material (see
Table 1). The test results are presented in
Table 5 and
Table 6.
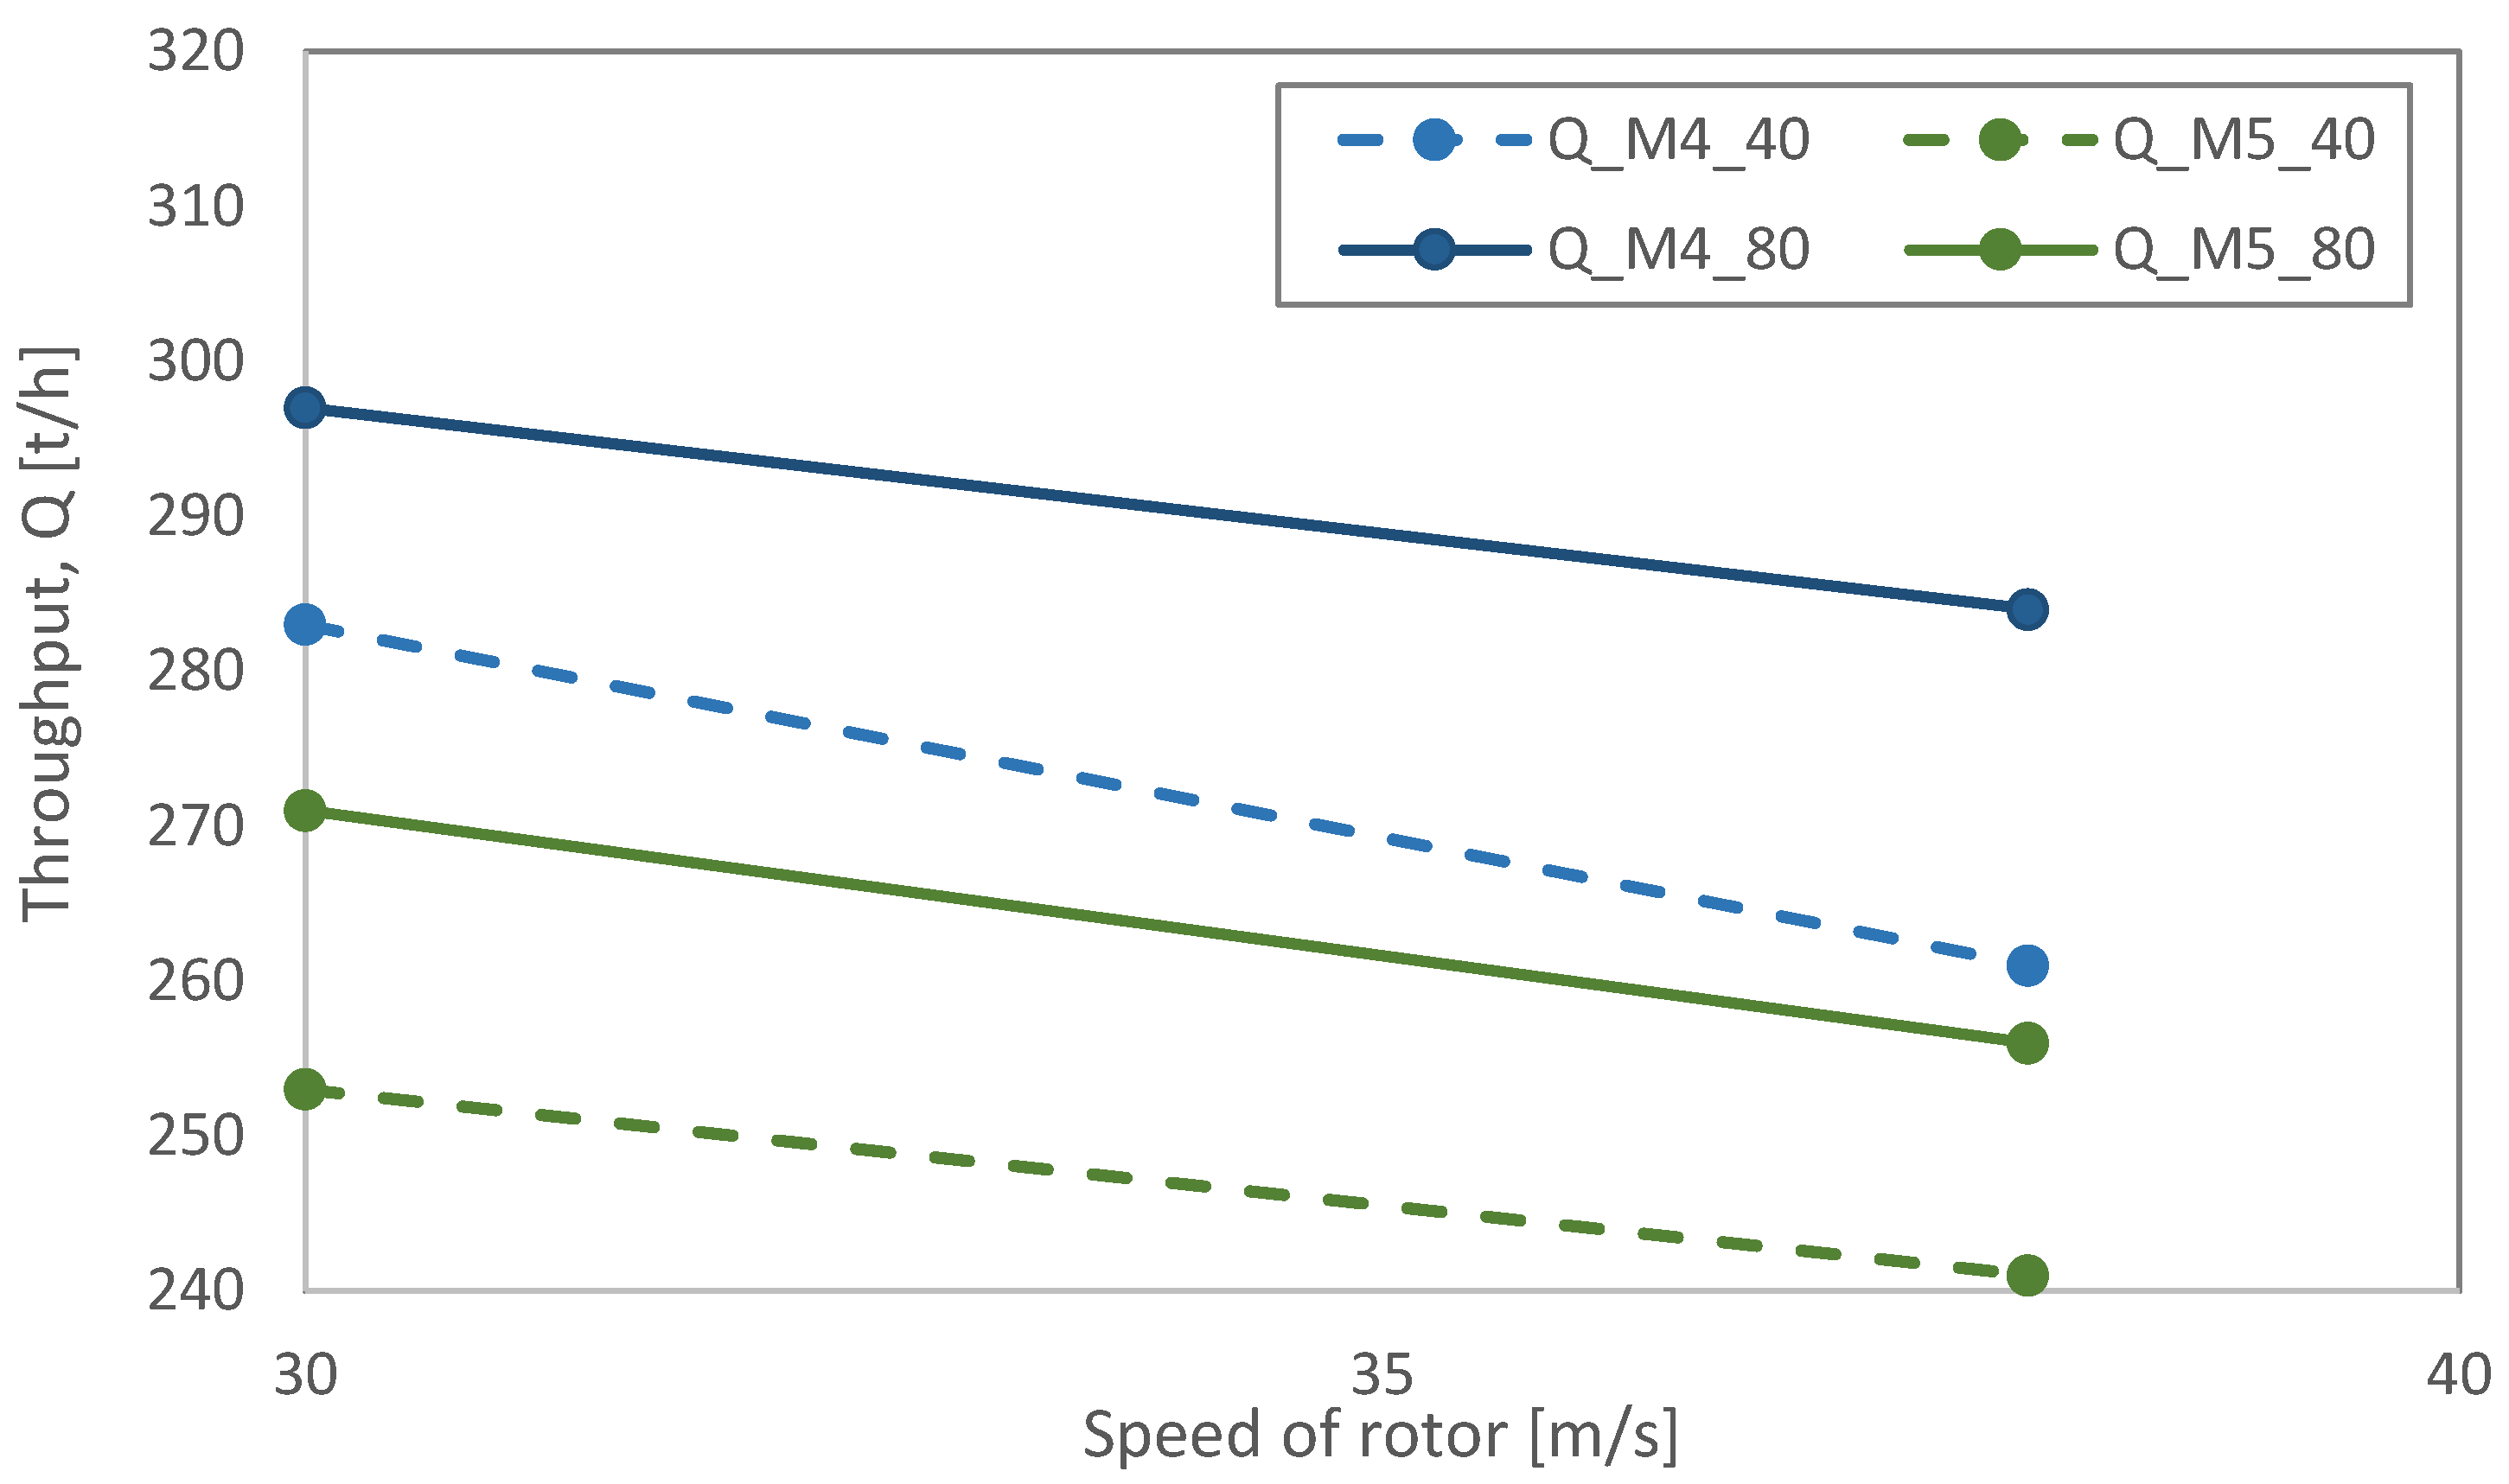
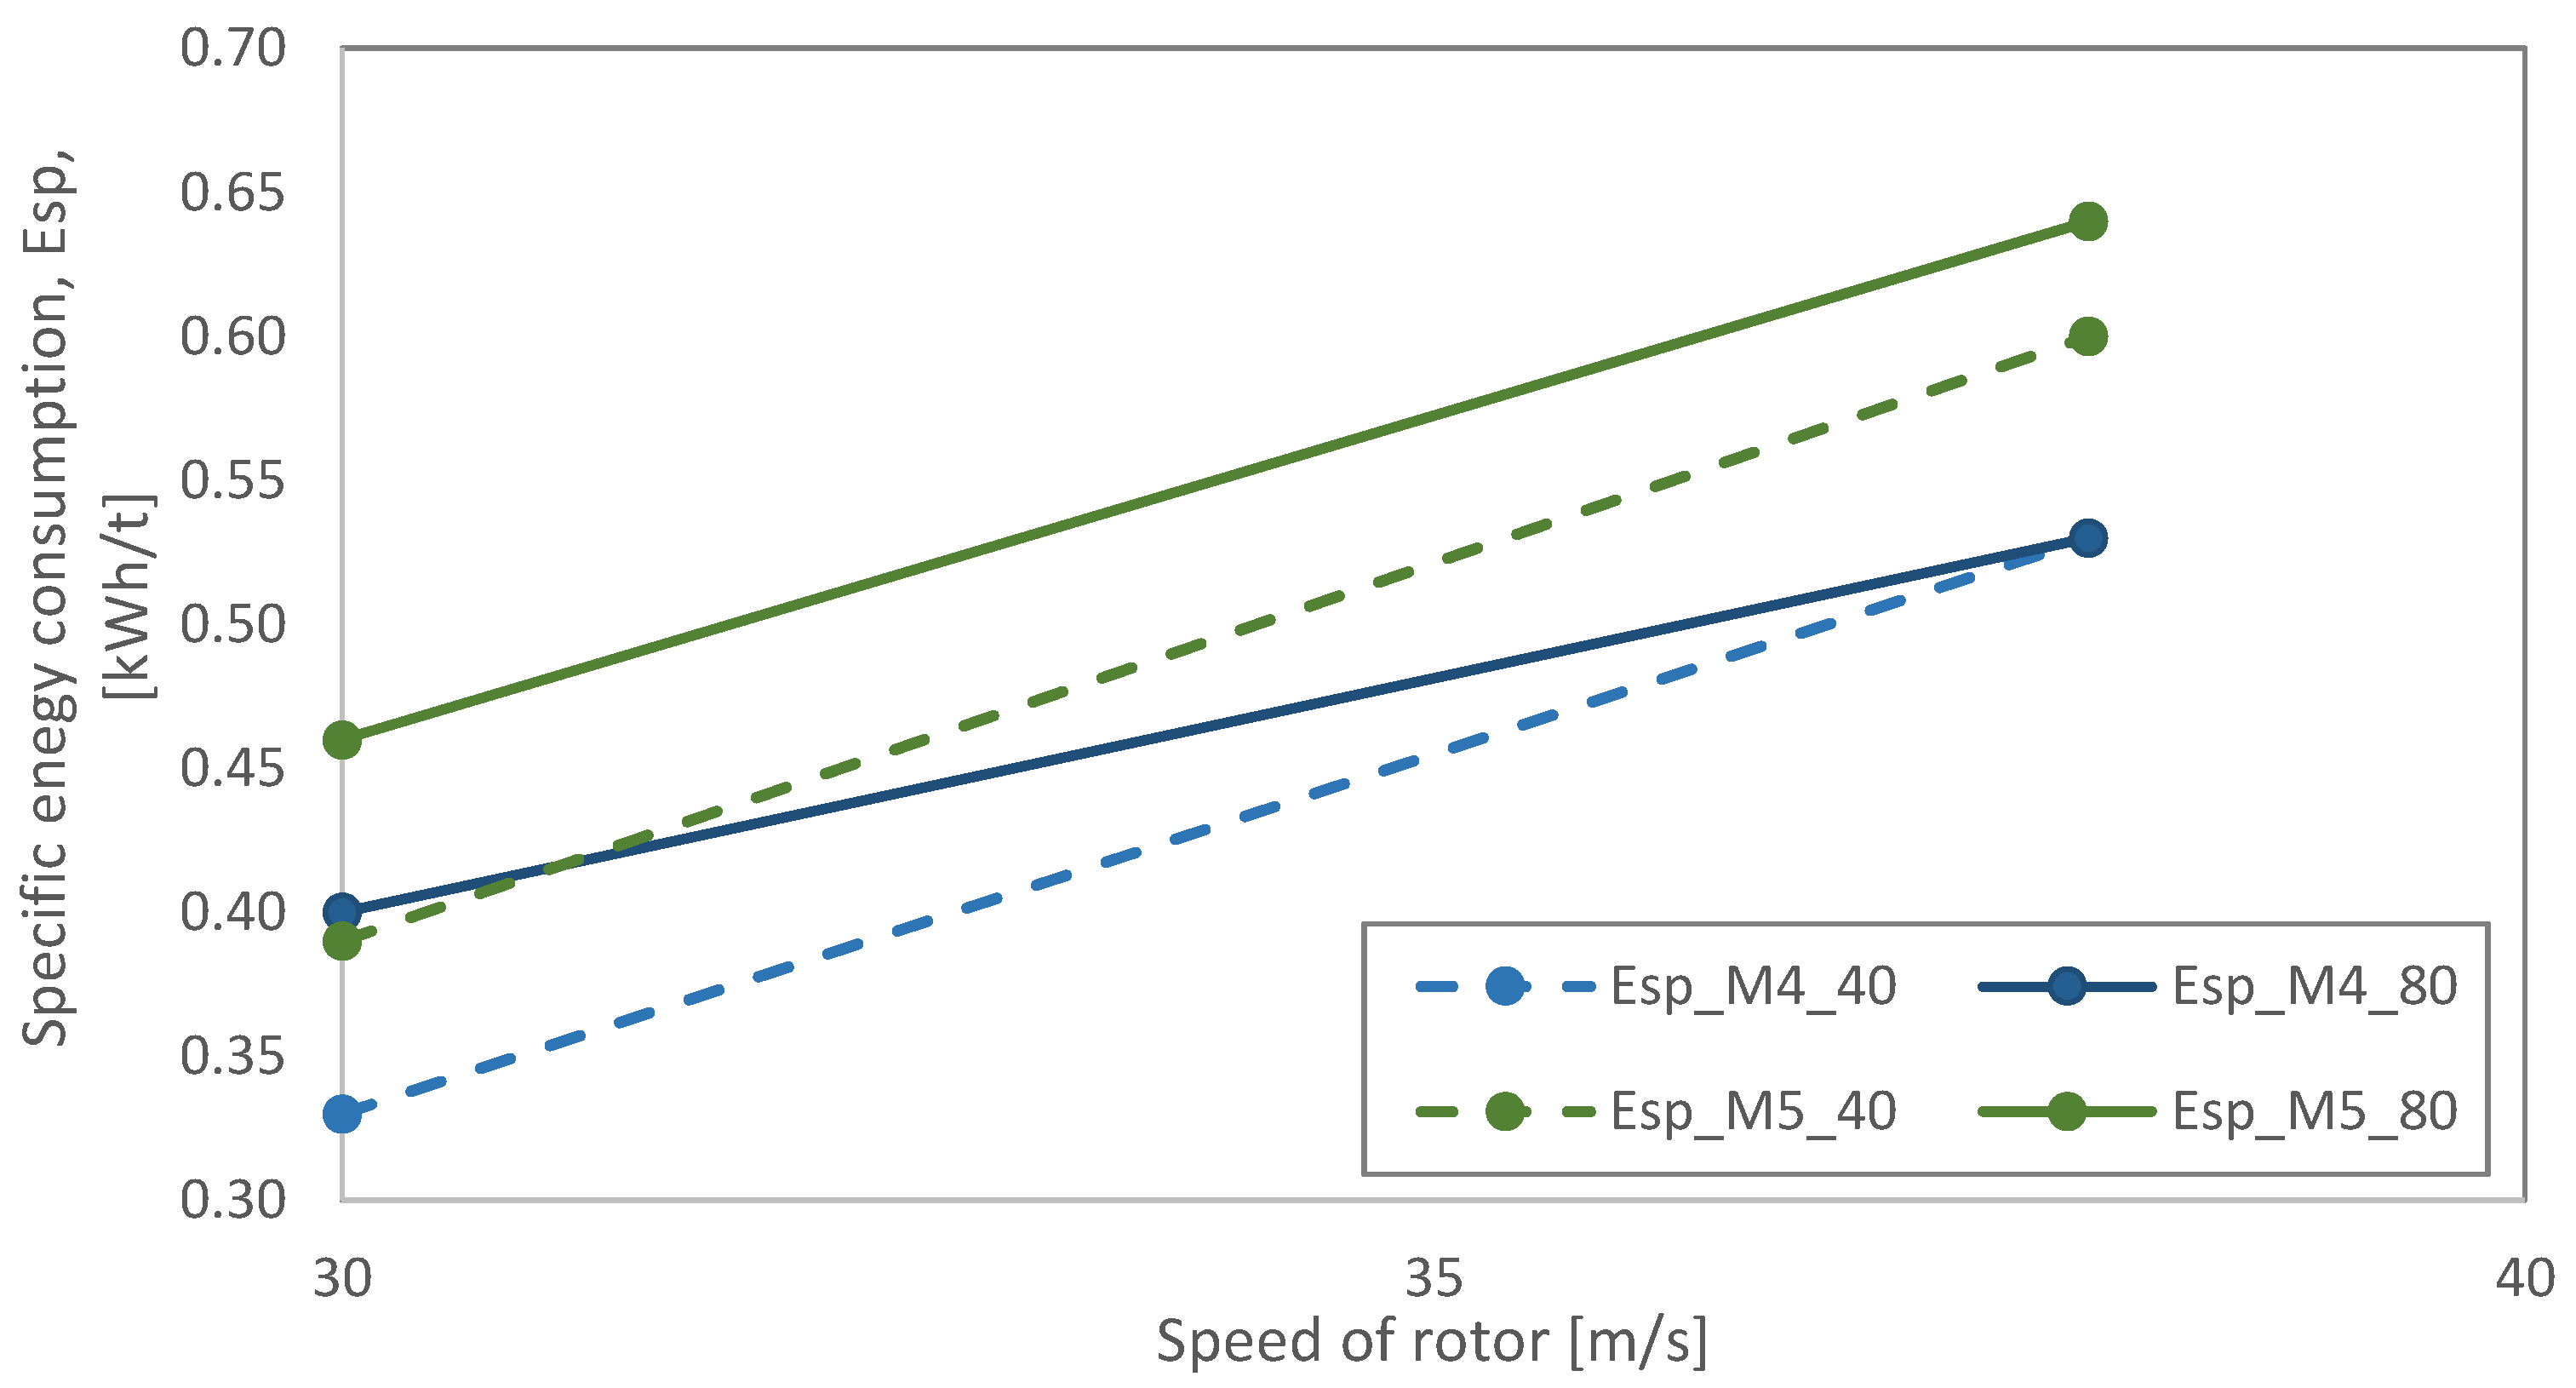
Figure 8 presents relationships between the throughput speed of the rotor and the gap, while
Figure 9 shows the correlation of the above variables with the specific energy consumption. Both relationships are similar in direction and changeability range to those established for materials M1–M3. For the limestone processing, a material comparably less resistant to comminution than the diabase, relatively higher throughput values and lower energy consumption were achieved. It is hard to decide definitely which of the variables has more significant impact on the throughput, but in the case of
Esp, the speed of the rotor has a slightly higher impact on energy consumption than the gap.
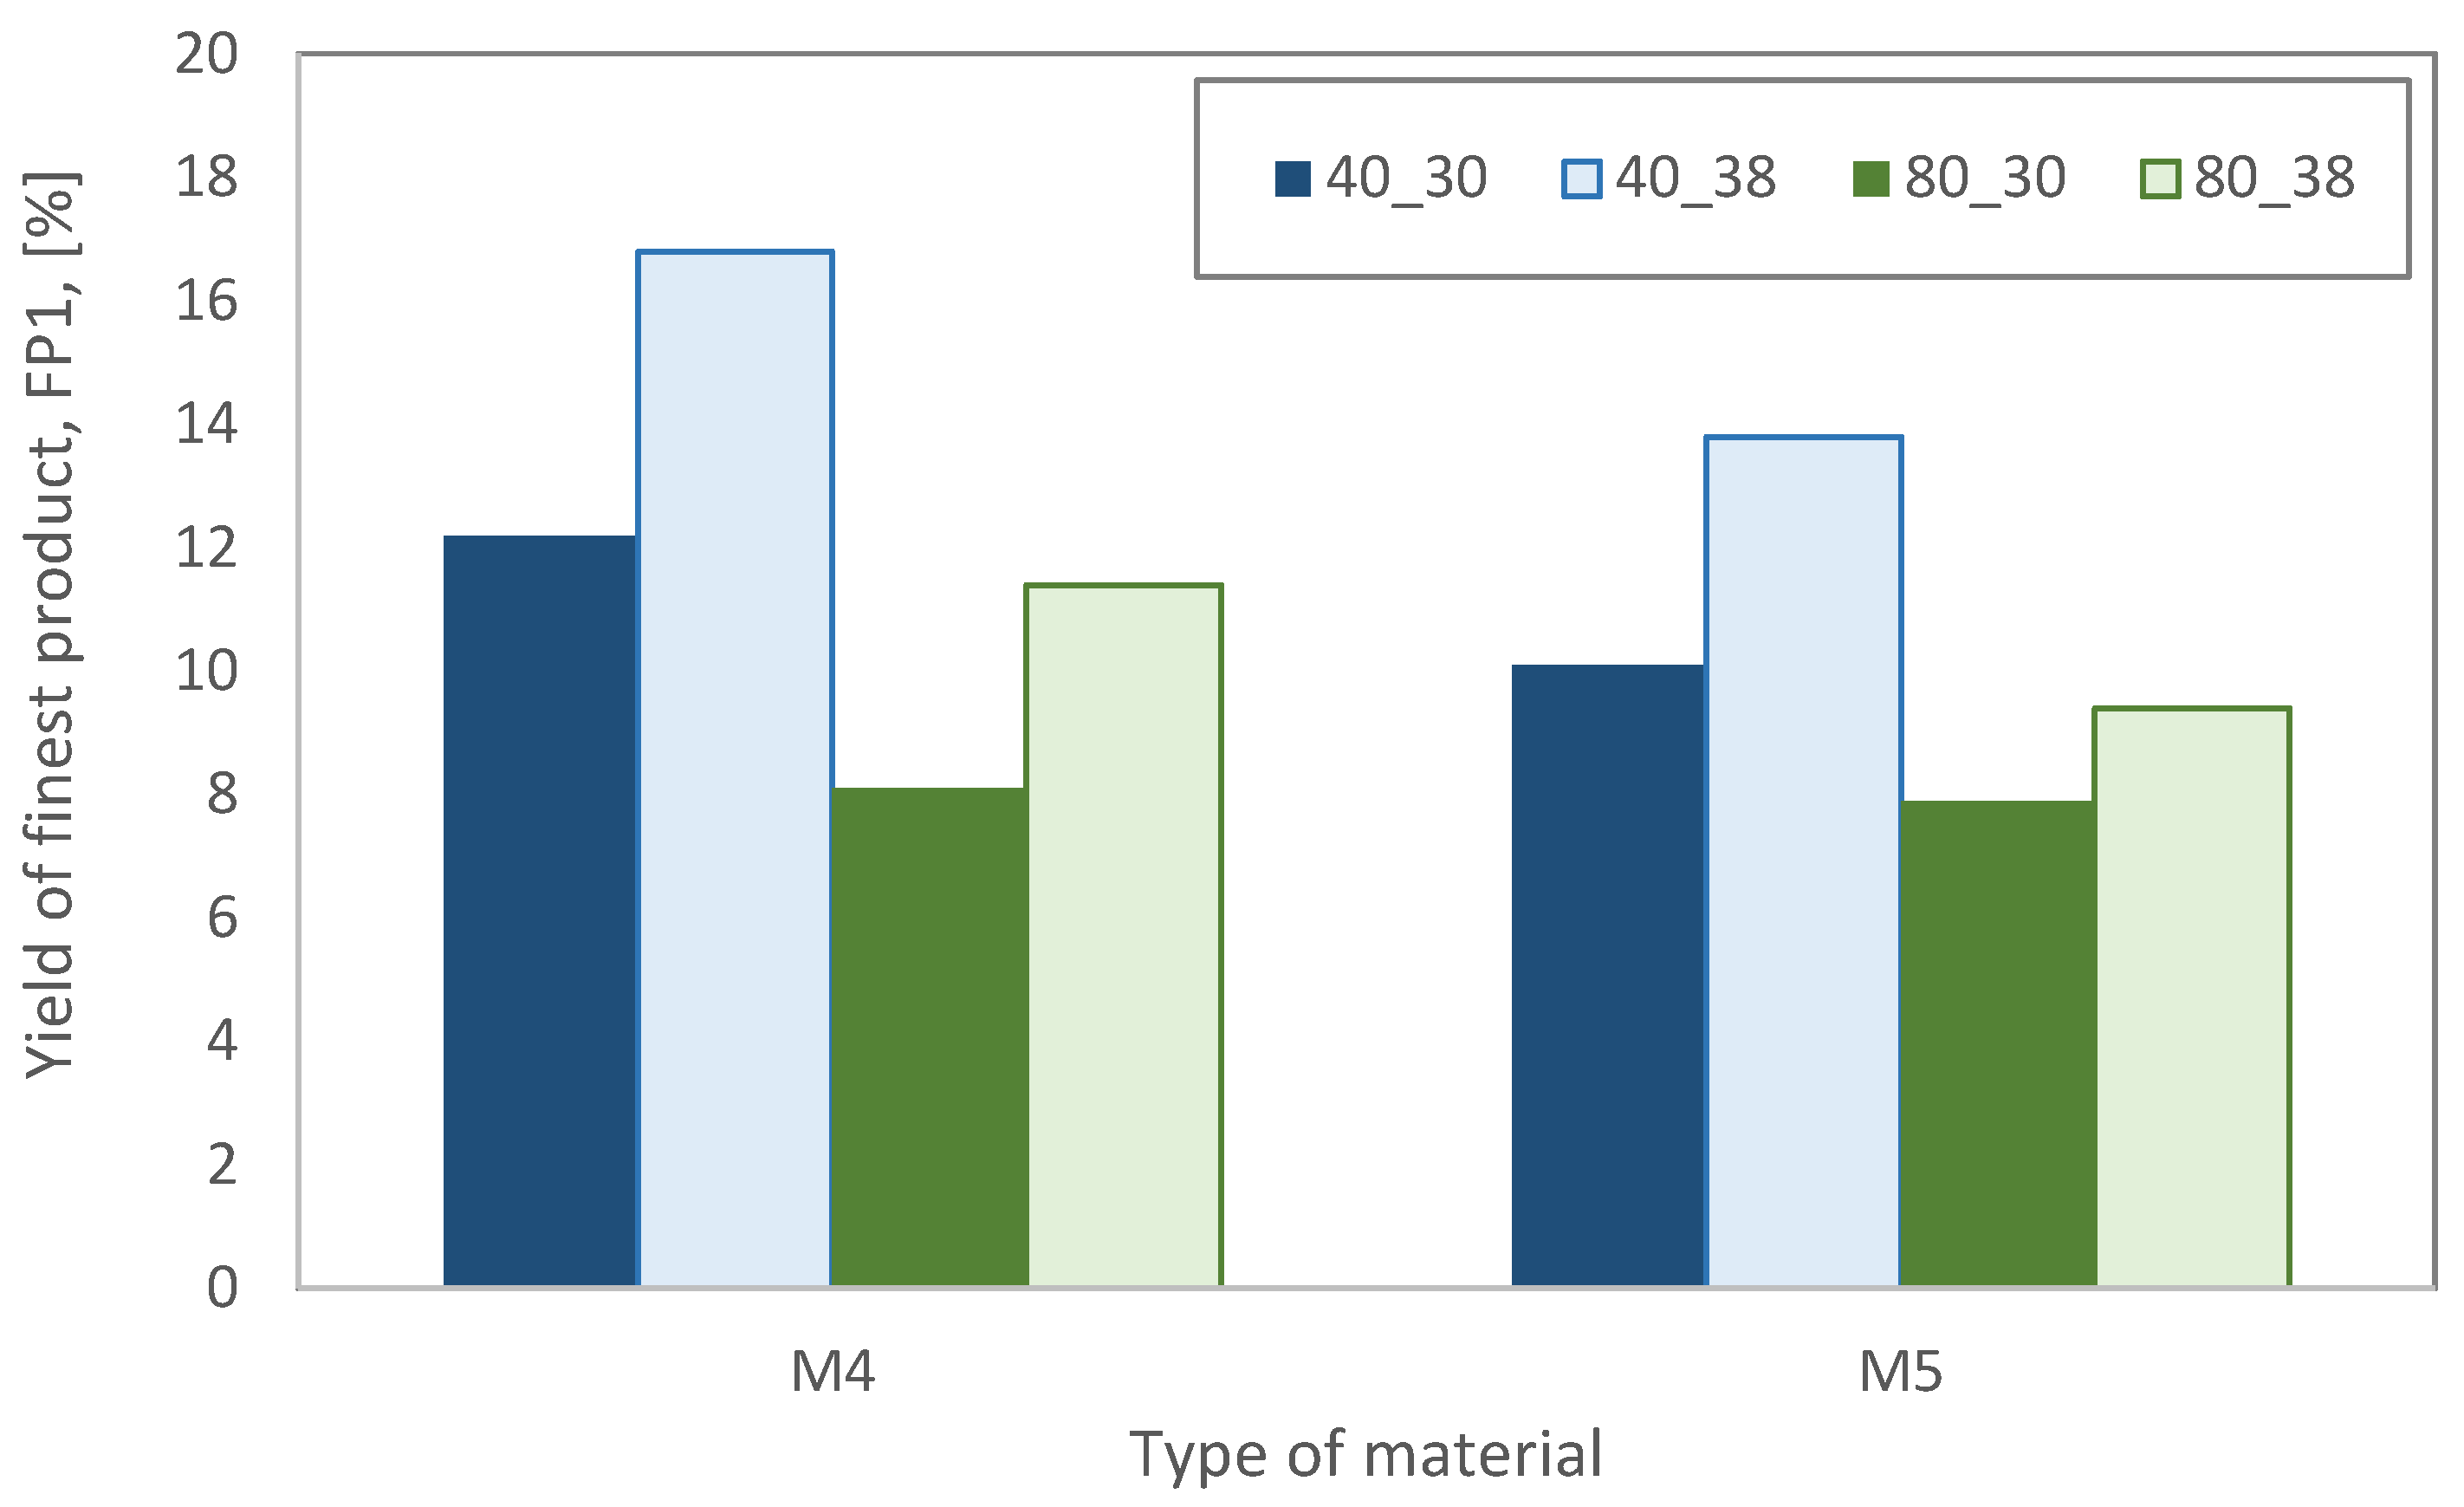
In the case of a yield of size fraction below 2 mm in crushing product, it can be seen that this content grows together with increasing the speed of the rotor. Lower contents of fines were achieved for the diabase for the gap width of 80 mm (
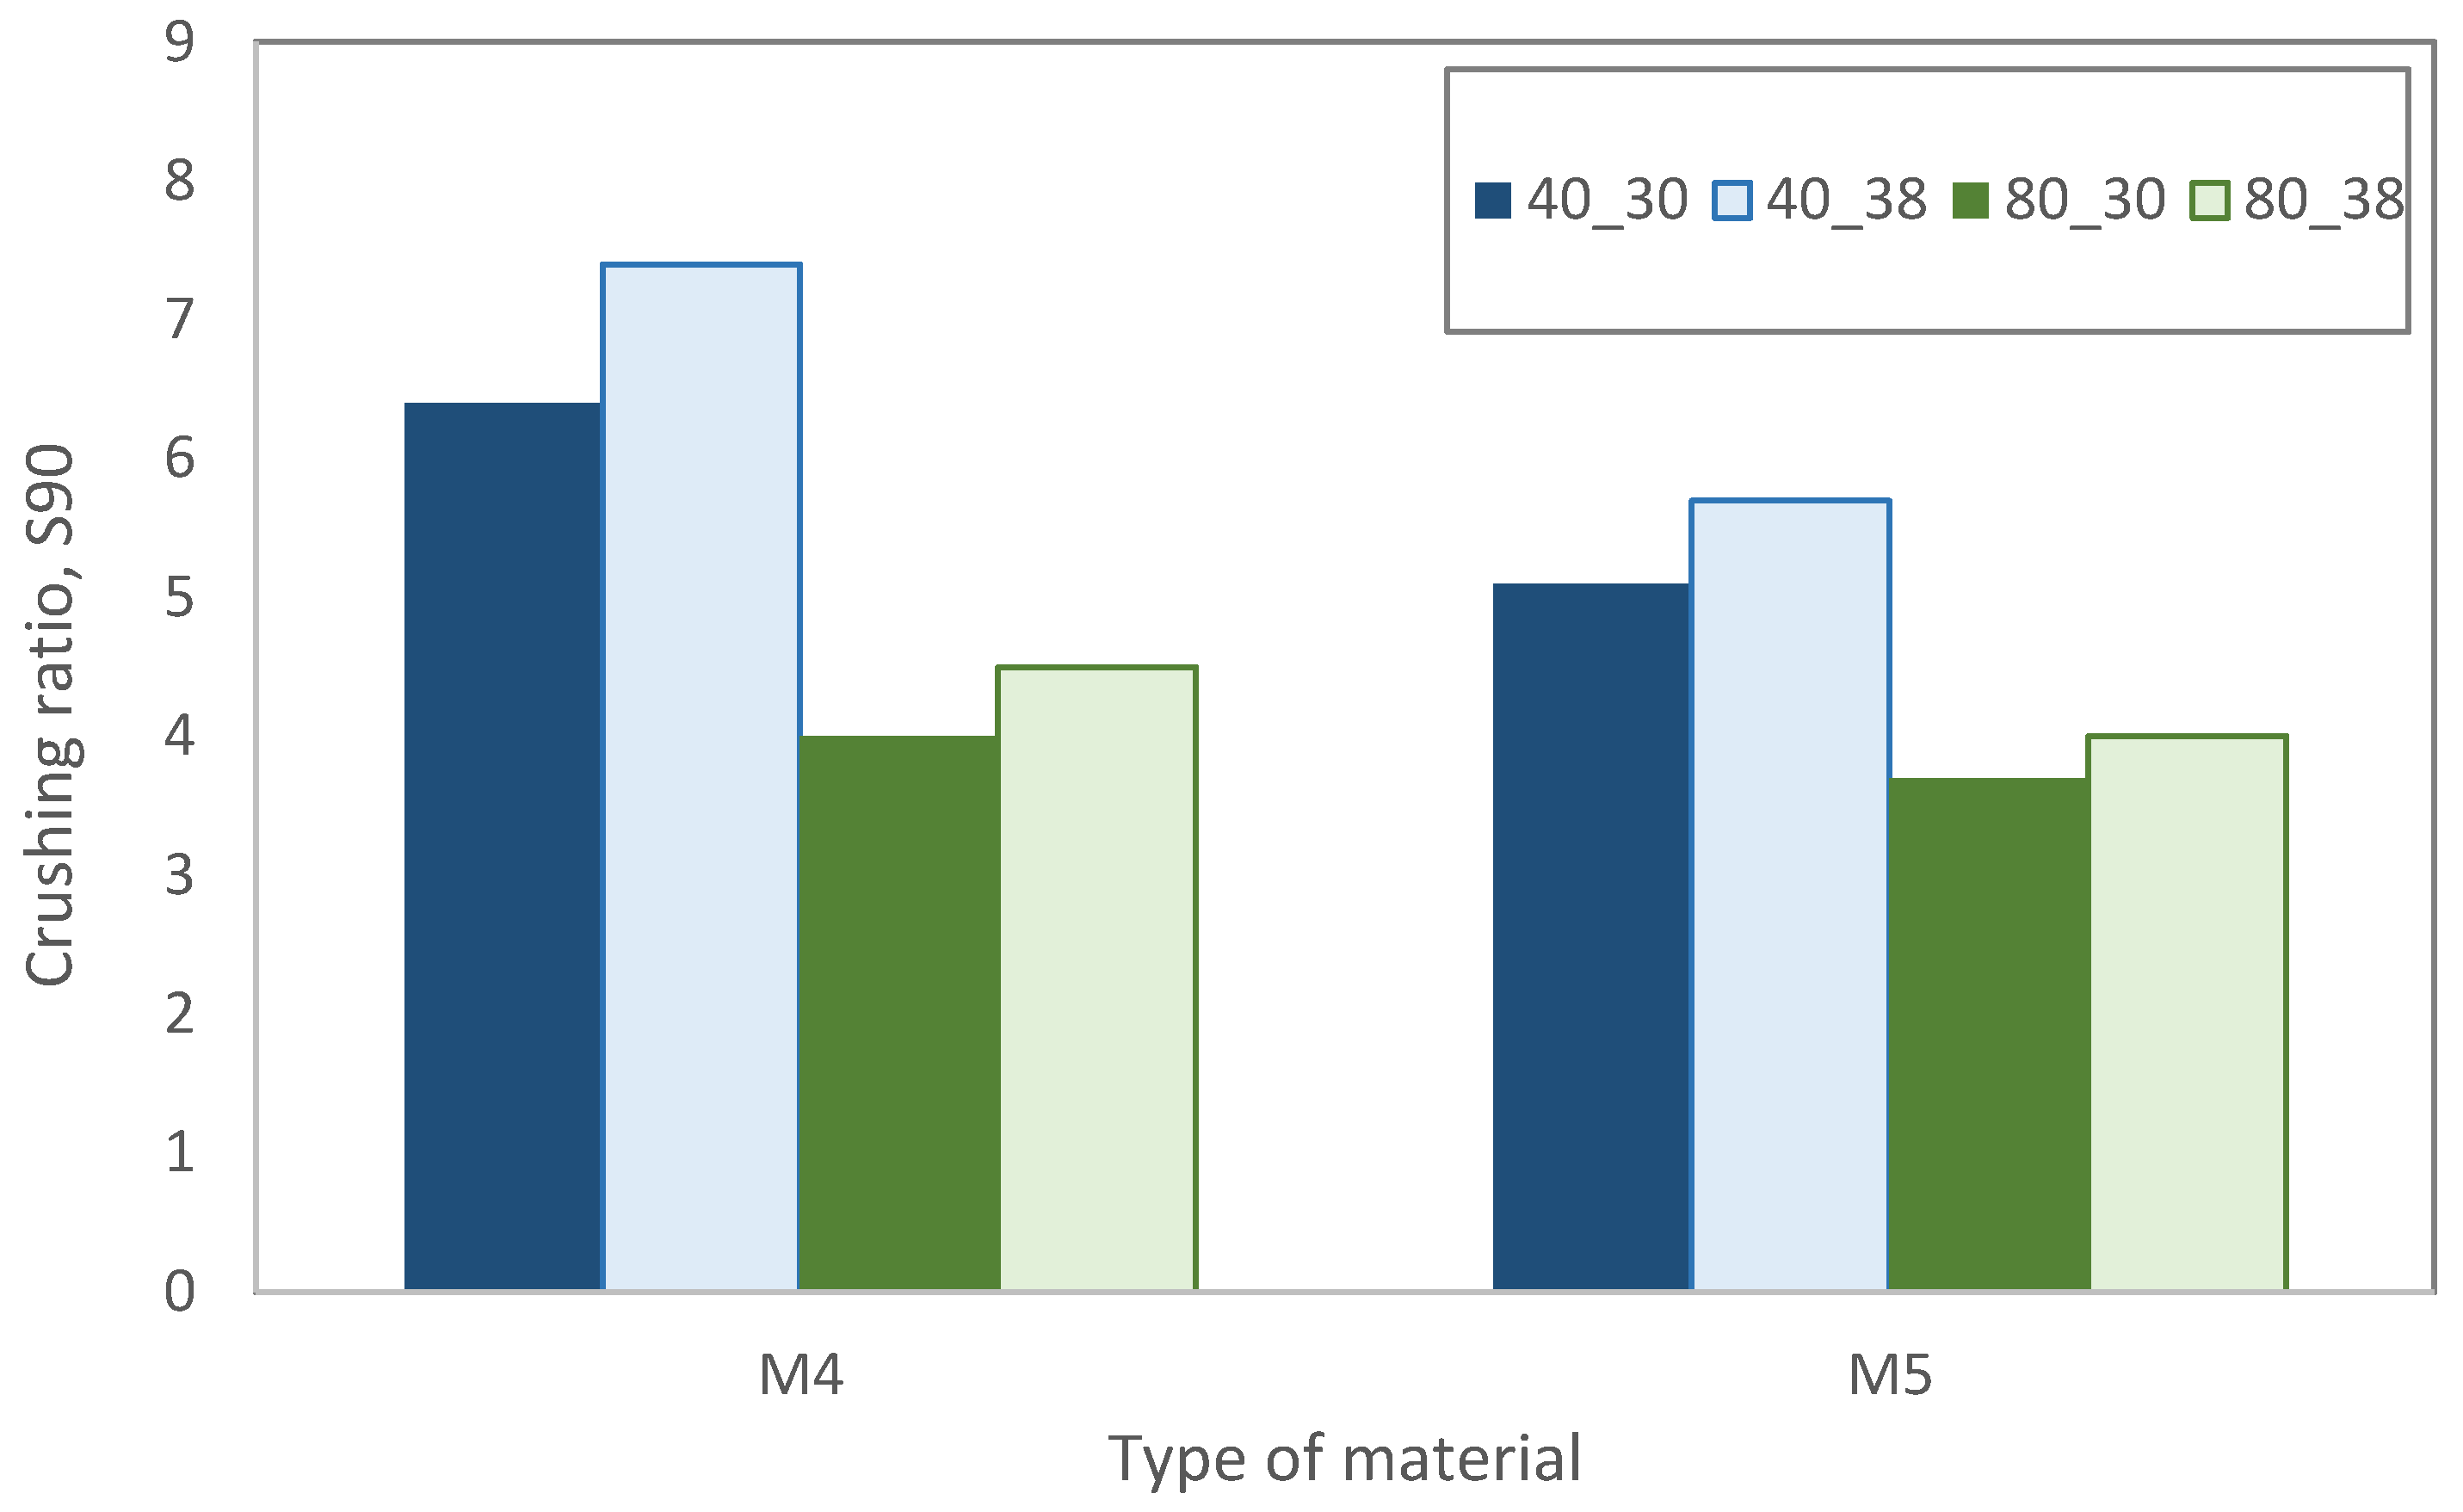
Figure 10). For the size reduction ratio, in turn, the speed of rotor did not have a very significant impact, especially for the gap of 80 mm. On the other hand, a visible difference can be observed for products crushed at the gap of 40 mm, and a distinction regarding the type of material can be noticed for that value. For the gap of 80 mm, in turn, the achieved size reduction ratios are similar, regardless of the type of material (
Figure 11).
Each product was also assessed in terms of the content of irregular particles. Yields of flat particles were determined using of a set of bar sieves, and values of flatness indices were obtained accordingly. For the material M1 the range of flatness index varied between 15 and 20%, for M2: 14–20%, for M3: 15–24%, for M4: 15–19%, and for M5: 19–22%. It can be seen that the most favorable results were achieved for materials M1 and M2, and the least favorable for the gravel (M3) and then diabase (M5). It is worth mentioning, however, that the lowest values of flatness index were achieved for the samples crushed at the highest speed of the rotor, regardless of the type of material.
6. Summary and Conclusions
The results of the investigation presented in the paper showed that control of qualitative characteristics of the final aggregate products is to some extent possible through adjustment of a specific operation of the crushing device. It was also possible to design and build mathematical models of crusher operation, with independent variables connected to the feed characteristics and operational parameters of the machine.
Both obtained models i.e., describing the 90% size reduction ratio as well as characterizing the yield of finest particle size fraction, were convergent for each type of the tested material. However, the significance and influence of individual variables in models was diverse. The gap shows an inverse relationship with size reduction ratio and the yield of finest particle size fraction both in general models and in the models built separately for each type of feed material.
A very high level of model fitting was achieved, too. Only one model showed the value of determination coefficient R square lower than 80%. In six cases, the R2 value was greater than 90%. Both general models achieved an R2 value greater than 80%. Validation of the obtained model with real operational results for dolomite, limestone, and the gravel also show high degree of accuracy, especially for the latter material type. It proved that the modeling approach was selected properly, and that potential improvement of model accuracy can be achieved through more detailed investigative programs and additional independent variables can be investigated.
The presented models fit the specific situation, i.e., given technological circuit of aggregate production and individual type of crushing device. It is possible, however, to adopt this approach into different specifics of raw materials processing, provided certain assumptions and characteristics, related to such new operational practice, are implemented.


