Article

A Method of Backfill Mining Crossing the Interchange Bridge and Application of a Ground Subsidence Prediction Model

1
School of Mines, China University of Mining and Technology, Xuzhou 221116, China
2
State Key Laboratory of Coal Resources and Safe Mining, China University of Mining and Technology, Xuzhou 221116, China
*
Author to whom correspondence should be addressed.
Minerals 2021, 11(9), 945; https://doi.org/10.3390/min11090945
Submission received: 11 July 2021 / Revised: 24 August 2021 / Accepted: 27 August 2021 / Published: 30 August 2021

Abstract

:
The traditional backfill mining method is a technology developed by the general trend of green coal mining, but with a high cost and an impact on production efficiency. This paper proposes a structured backfill mining method with high-water materials and pillars. The evolution of roof pressure appearance is assessed through the sensor and monitoring system in the hydraulic support. The main roof fracture step distance is determined based on the roof structure characteristics of backfill mining, and the backfill step distance of underground structural backfill is 22.7 m considering the safety factor. Through the simulation results of Abaqus commercial simulation software, the roof subsidence evolution of different backfill schemes under temporary load and permanent load is compared, and the rationality of the backfill step distance is verified. Based on the probability integral method, the surface subsidence prediction model is proposed, then the final value and the maximum dynamic change value of the surface subsidence at the north and south ends of the interchange bridge by traditional mining and backfill mining are analyzed, which verifies the rationality of the structural backfill mining method.

1. Introduction

Ground subsidence mitigation regarding backfill mining is inextricably linked to backfill mining technology [1,2,3,4,5]. Towards the extent that solid backfill can be used to control ground subsidence, some scholars have conducted systematic analyses of the equivalent mining diameter theory of strata movement in backfill mining, developed a structural mechanics model of strata movement in high-density backfill mining, and performed continuous medium mechanics analysis [6,7,8]. It is proposed that when the probability integral approach is employed to predict ground sinking regarding dense filling, the traditional ground subsidence prediction specifications will be adjusted [9,10].
Additionally, some scholars established a model for estimating solid-filled coal mining subsidence based on the equivalent mining height theory, suggested a design procedure for solid-filled mining under buildings, as well as described a strategy for determining the probability integral method’s parameters [11,12,13]. Vyazmensky et al. [14] and Hamdi et al. [14,15] constructed a computational model of ground subsidence in backfill mining and simulated it using discrete element and finite difference methods. Li et al. [16] developed a method for calculating subsidence regions using a surface subsidence database and described the principles, specifications, methodologies, and steps for sketching a subsidence boundary, completed a quantitative assessment of underground coal mining damage caused by surface subsidence and promoted the use of Geographic Information System (GIS) in mining damage assessment. Shi et al. [17] constructed a simulation experiment methodology to examine the propagation of cracks in overlaying layers based on the real mechanical characteristics of rock and soil in goaf. Lamich et al. [18] proposed a novel, self-contained approach for evaluating the linear direction of potentially hazardous locations in order to estimate the impact of underground coal mining on future development. It is proposed that standard geodetic monitoring of roadways be developed as a stand-alone technique for identifying hazardous regions in foundation engineering. The laws of overburden movement, the process of overburden collapse, and the dynamic behaviors of overburden are the primary concerns of subsidence theory [15,19,20,21,22,23,24]. The laws of strata movement and surface subsidence are studied by scholars from different scopes. On the one hand, it is concerned with analyzing the mechanical mechanisms behind the behavior of mining rock masses through the examination of overburden failure, deformation, and movement laws, and then with analyzing surface deformation and failure [25,26,27]. On the other hand, it has created significant achievements in both theoretical and practical investigations, which concentrate on the mathematical analysis and assessment of the mining rock mass’s behavior, beginning with research into the surface curvature and failure laws and progressing to the analysis of the overlaying rock’s distortion and breakdown [10,23,28,29,30]. The strata stabilization theory is determined by the relationship between overburden deformation and failure and the ground on the ground, which differs from the relationship observed in traditional mining [18,31,32,33]. Hence, the strata systems theory of backfill mining provides the foundation for studying the deformation and breakdown of overburden and ground subsidence, for determining the filling method, filling material performance, and support strength, and for representing a critical comparison for cost reduction. As a result, it is essential to expand studies into the strata mitigation theory of backfill mining [25,27,30].
Currently, mining technology for “three under” coal pressure consists primarily of multiple methodologies: protective coal pillar locations, goaf backfill mining, incomplete mining, goaf gangue space grouting filling, and overburden separation zone grouting [34,35]. The traditional “three under” mining technology suffers from inefficiency and resources wastage. The Liangshuijing coal mine 421 area mined a total of 14 working faces from panel 42,101 to panel 42,114. Now, there is a challenge with “three under” coal pressure in panel 42,115. If the backfill protection mining strategy is not implemented, a considerable number of protective coal pillars will need to be installed in the 42,115 panel at the interchange bridge section. On the one hand, this will result in a significant waste of coal resources. On the other hand, when mining the 42,115 panel, the working face’s equipment must be relocated, significantly reducing the working face’s production efficiency. The efficient processing of 42,115 work faces while ensuring the safety and stability of the interchange bridge is a critical factor at the Liangshuijing coal mine. Thus, research on structural backfill mining methods based on roof structural characteristics is being conducted in order to give theoretical and technological guidance for ensuring interchange bridge mining protection.
Therefore, the objectives of this paper are:
-
Propose a roof subsidence numerical simulation method and determine the structural backfill parameters;
-
Theoretical basis and application of a ground subsidence prediction model;
-
To develop an efficient structural backfill method through “three under” coal mining, to be combined with high-water materials filling barricades and pillars.

2. Geological Conditions and Structural Backfill Schemes

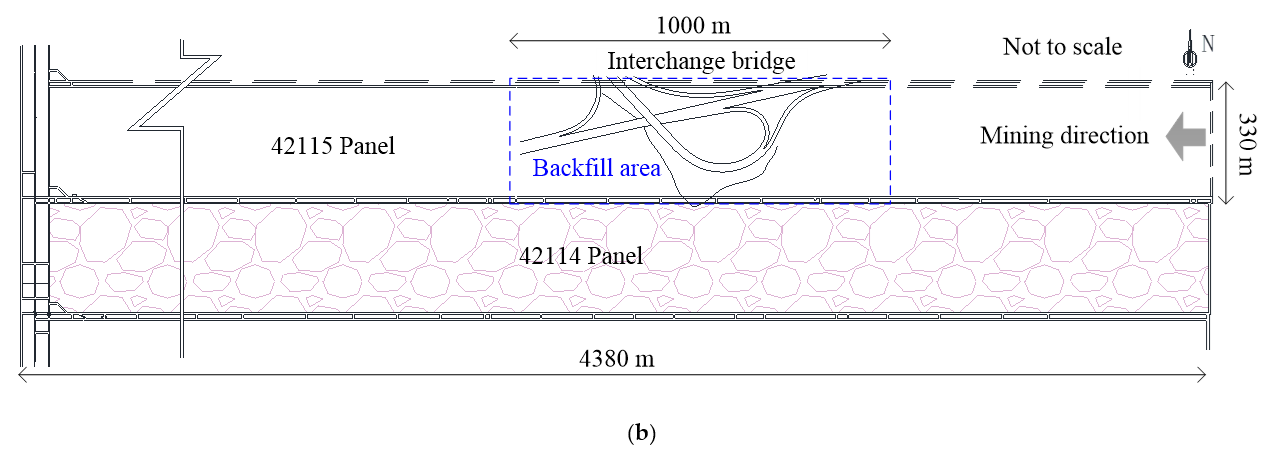
2.1. Geological Conditions of Working Face under Interchange Bridge

The Liangshuijing coal mine is about 16 km west of Shenmu County, Yulin City, Shaanxi Province, with the following geographic coordinates: 110°14′22″–110°21′24″ E, 38°47′29″–38°53′24″ N (shown in Figure 1a). The relationship between interchange bridge above 42,115 working face and underground mining is shown in Figure 1b, the 42,115 fully mechanized working face is located to the north of the 421 mine area. The length and width of the 42,115 panel are 4380 m and 330 m, respectively. The buried depth of the coal seam (42#) near the 42,115 and 42,114 panels is 250 m. The geological drilling near interchange bridge shows that the roof and floor rock properties of 42,115 working face are shown in Figure 2, the coal seam has a dip angle of about 1°~3° and an average thickness of about 3.5 m. The lithology is mostly mudstone and siltstone, and the coal seam structure is complex. The lithology of the roof is mainly siltstone and fine sandstone, locally medium grained sandstone, and mudstone, and occasionally mudstone pseudo roof, which is a class II medium stable roof. The lithology of the coal seam floor is mainly siltstone, locally fine sandstone, and mudstone. The average thickness of the immediate roof is about 5.0 m, and the average thickness of the main roof is about 15.0 m.

2.2. Mine Pressure Evolution of the Working Face around the Interchange Bridge

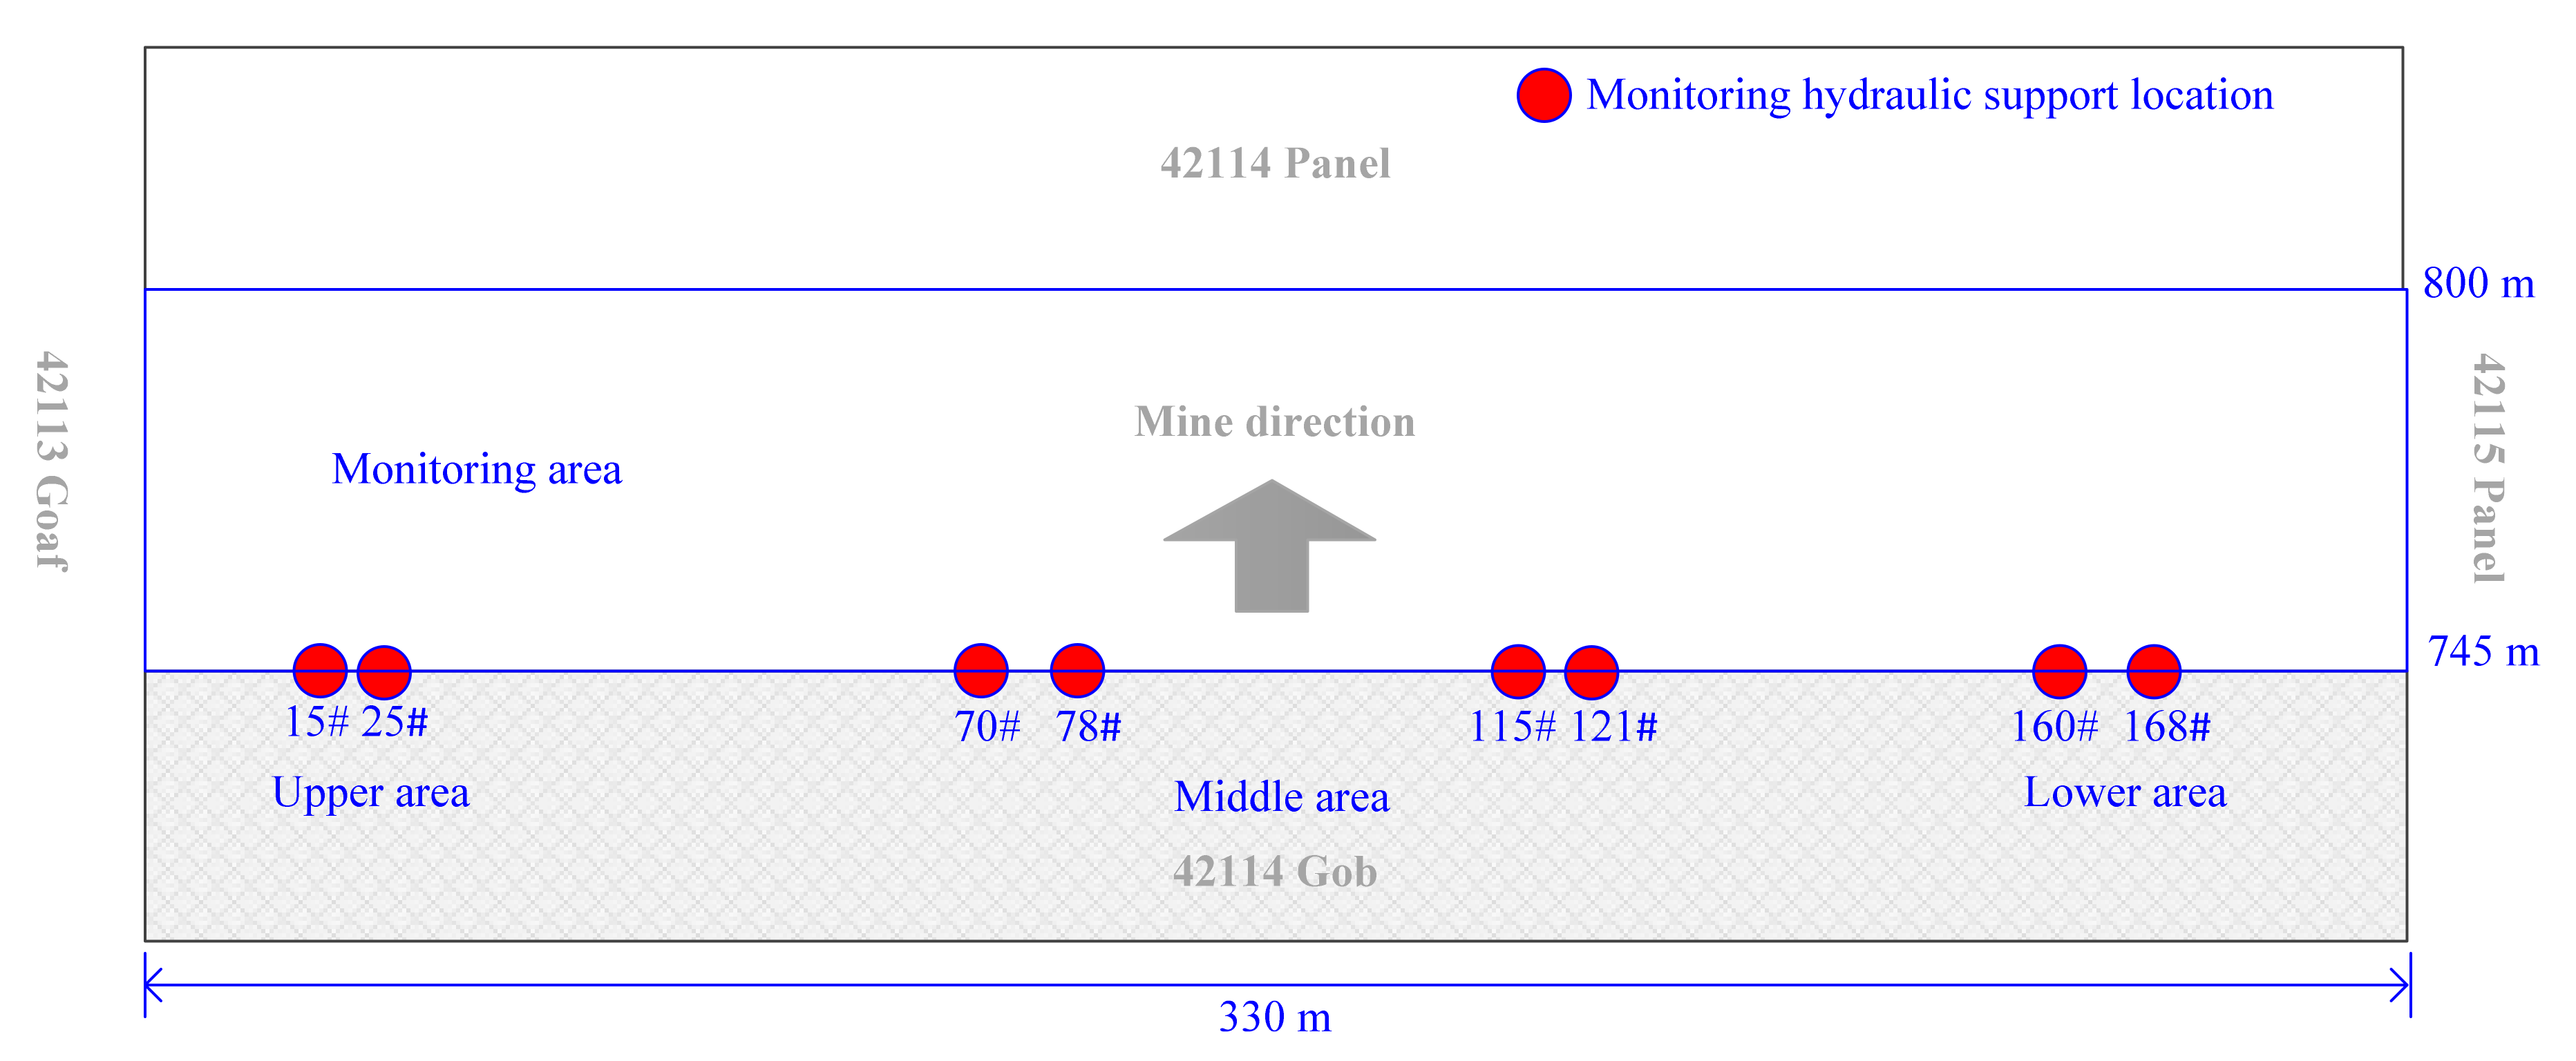
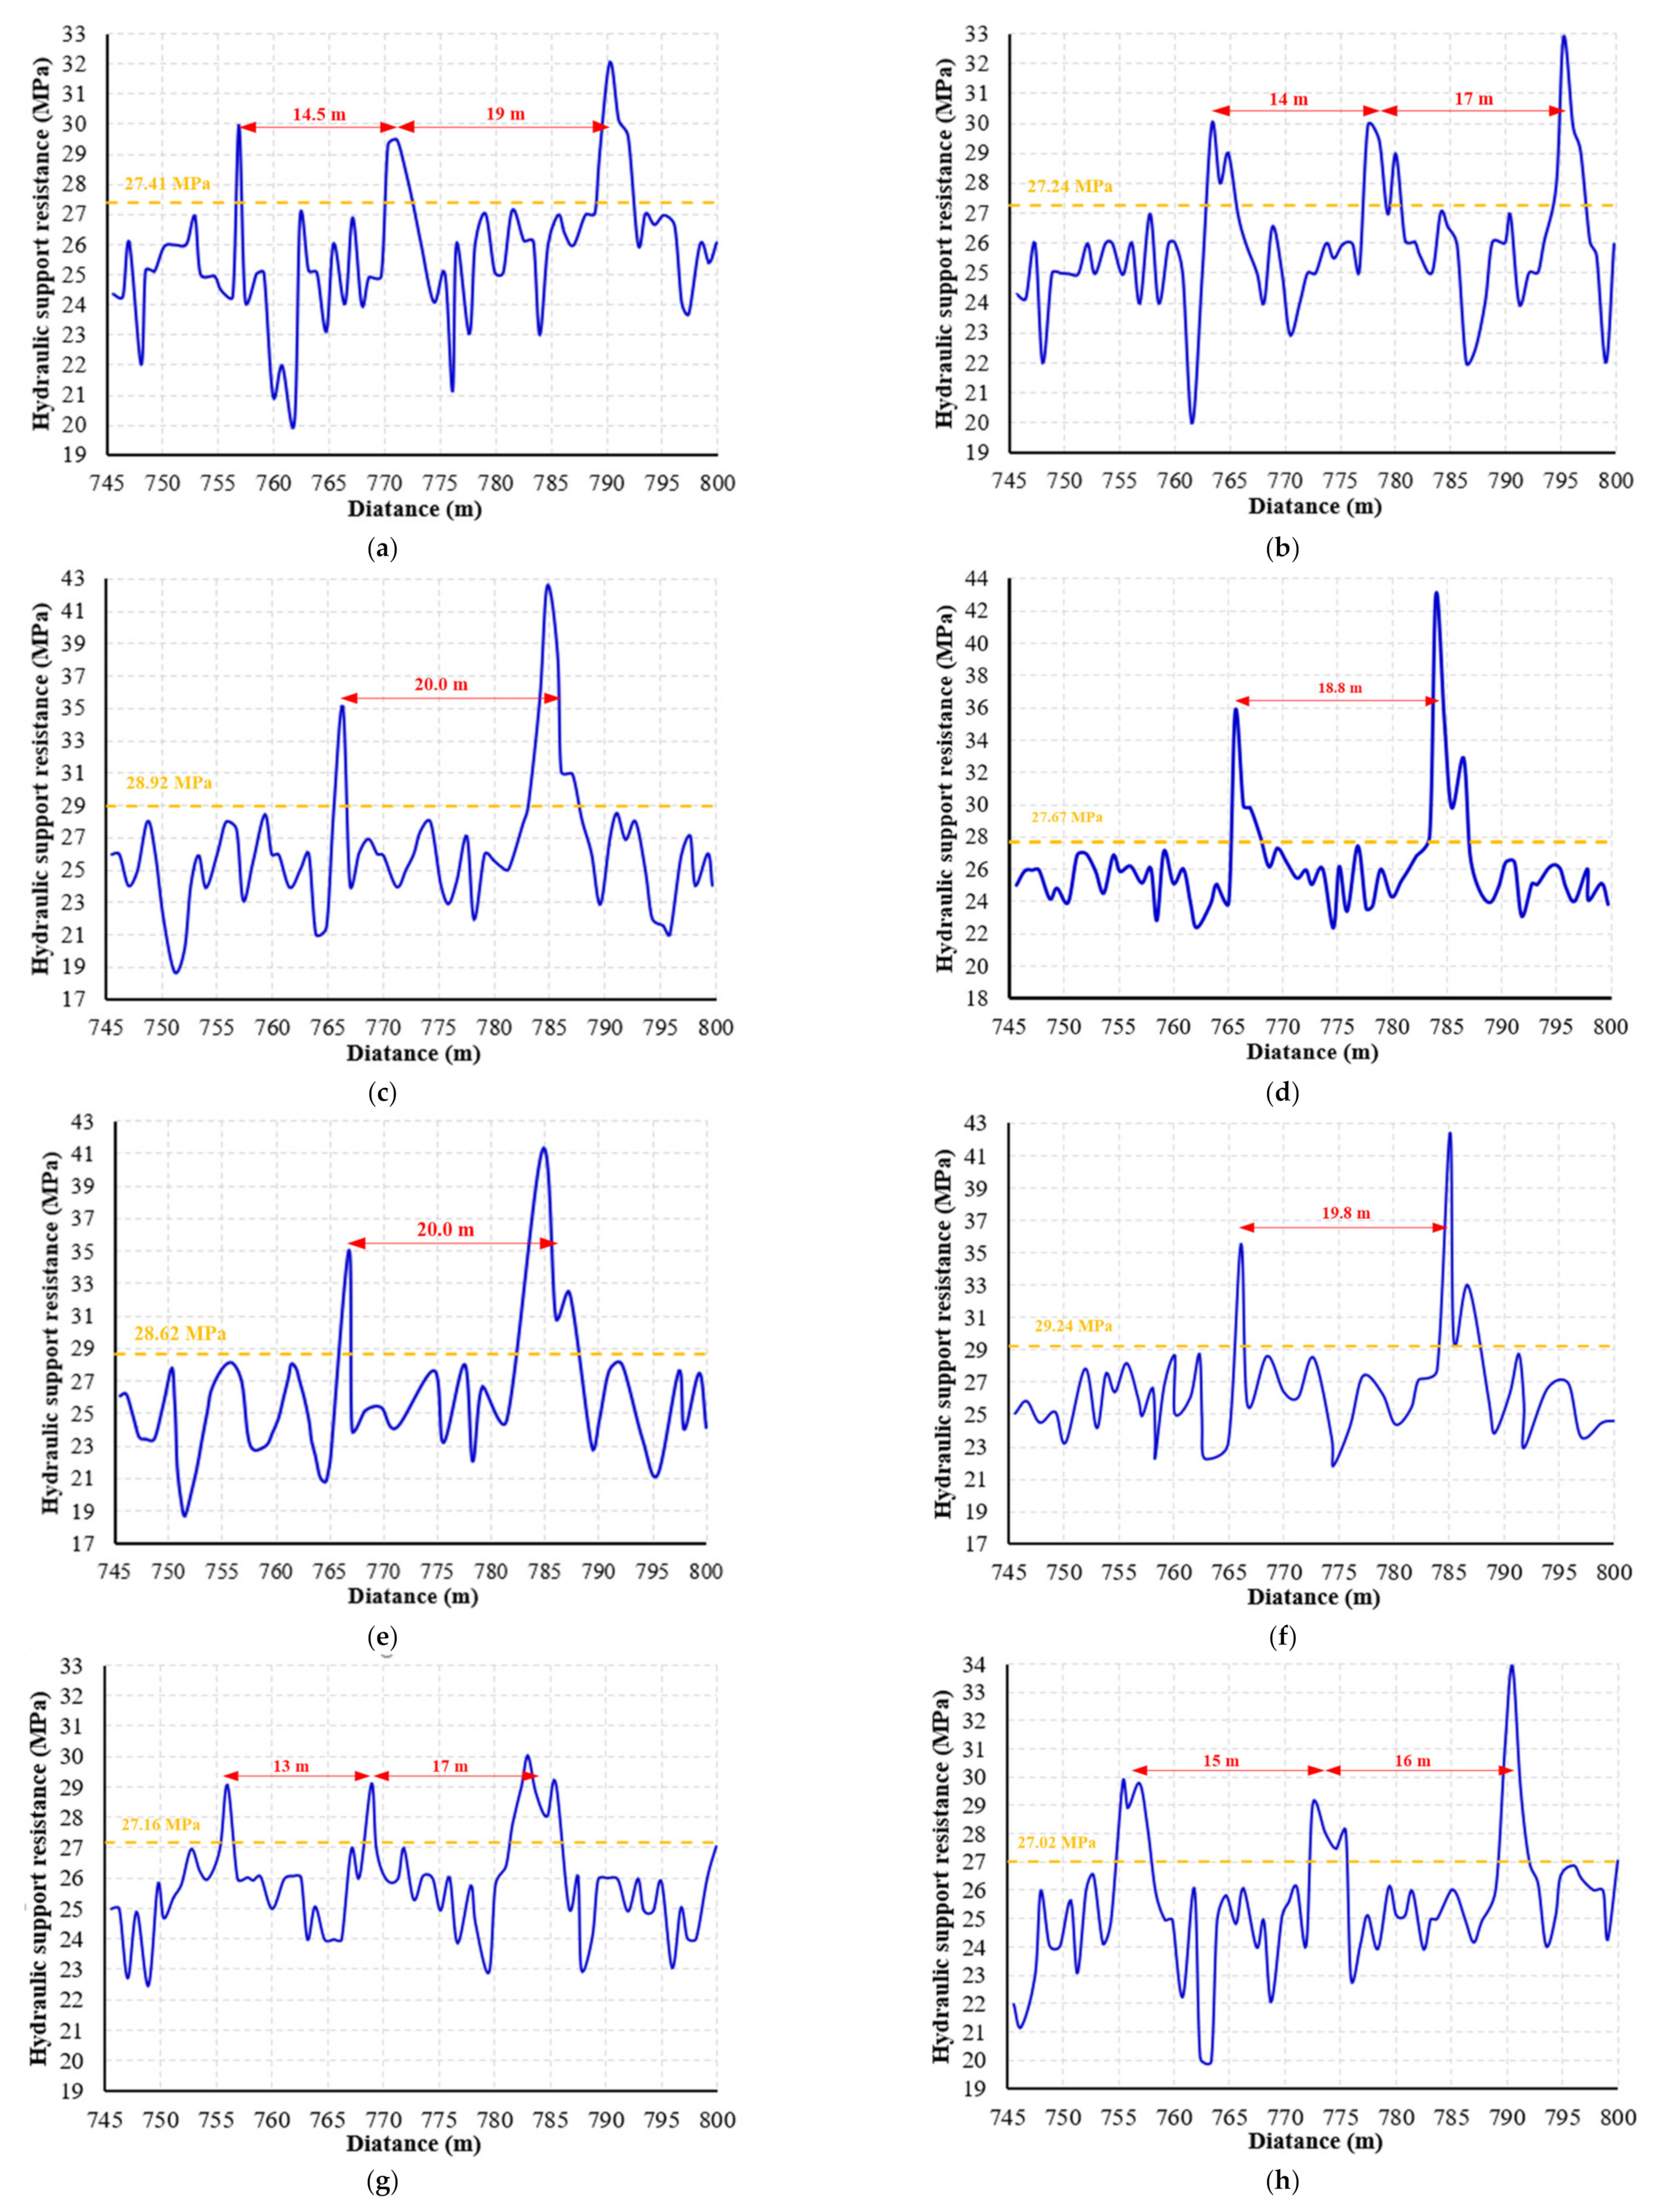
2.2.1. Mine Pressure Evolution Monitoring and Result of the 42,114 Working Face

ZY12000/20/40D (a hydraulic support codename) hydraulic support was used in the 42,111 working face, and a German Marco control and monitoring system was installed on the support for real-time monitoring. The Marco system consists of three parts at the control level, mechatronics control at the level of single hydraulic support, fieldbus control at the level of working face and Supervisory Control and Data Acquisition (SCADA, production process control) control at the level of channel. The controllers in the fully mechanized working face are connected into a control system through the cables between the supports. Through the bus communication technology, the fieldbus control system including all the hydraulic supports in the working face is formed. The data is transmitted to the ground monitoring host, and the monitoring results are obtained after the system program analysis and processing. The mine pressure monitoring equipment system can monitor the stope pressure behavior in real time, analyze the mine pressure data reasonably, and then forecast the failure of the roof based on the stope pressure behavior.
During the mining process of the 42,114 panel, the working resistance of the hydraulic support was monitored in the area (745 m~800 m) potentially affected by the interchange bridge, and the specific monitoring location is shown in Figure 3. The working resistance monitoring results of the upper area hydraulic support (15#, 20#), the middle area hydraulic support (70#, 78#, 115#, 121#), and the lower area hydraulic support (160#, 168#) in the 745 m~800 m monitoring area are shown in Figure 4a–h.
The evolution of hydraulic support working resistance is a common method to predict the distance of the periodic pressure of the roof [36]. Usually, the sum of the average working resistance of the hydraulic support and the variance of its average value is used as the index of the periodic pressure judgment. The judgment criteria are as follows:
P = P t ¯ + σ P
σ P = 1 n i = 1 n p t i p t ¯ 2
P t ¯ = 1 n i = 1 n p t i
where P is the period of pressure criterion, MPa; P t ¯ is the average value of hydraulic support resistance at the end of the cycle, MPa; σ P is the variance of the mean value of the resistance of the hydraulic support at the end of the cycle, MPa; and p t i is the working resistance of the hydraulic support at the end of the cycle, MPa.
According to Figure 4a–g, with the change of the advancing distance of the 42,114 working face, the hydraulic support resistance of the three areas shows periodic changes. Furthermore, the upper monitoring area (Figure 4a,b) hydraulic supports maximum working resistance of 32.1 MPa, 33.0 MPa, average working resistance of 25.20 MPa, 25.14 MPa, and periodic pressure distances of 14.5 m, 19 m, and 17 m, the average periodic distance is 16.1 m; the middle monitoring area (Figure 4c–f) hydraulic supports maximum working resistance of 42.9 MPa, 43.1 MPa, 41.2 MPa, 42.5 MPa, average working resistance of 25.04 MPa, 24.45 MPa, 25.11 MPa, 24.81 MPa, and periodic pressure distances of 20 m, 18.8 m, and 19.8 m, the average periodic distance is 19.7 m; the upper monitoring area (Figure 4g,h) hydraulic supports maximum working resistance of 30.9 MPa, 33.7 MPa, average working resistance of 25.02 MPa, 24.52 MPa, and periodic pressure distances of 13 m, 17 m, 15 m, 16 m, and 14.5 m; the average periodic distance is 15.3 m. Combined with Table 1, the upper hydraulic support resistance and the lower hydraulic support resistance of the working face are slightly lower than the middle hydraulic support resistance, which is consistent with the previous research result [36,37] for the period pressure distance evolution. The periodic pressure step distance is about 15.3 m~19.7 m, with an average value of 17.0 m.

2.2.2. General Situations of Backfill Strategies

Figure 5 depicts the relationship between the 42,115 working face and its interchange bridge. The open-off cut width of 42,115 working face is 330 m, and the mining has been completed near 42,114 working face. The width of the yielding coal pillar between the two working faces is 10 m. In order to reduce the impact of 42,115 working face mining on the stability of the interchange bridge, it is necessary to carry out certain protective mining in the corresponding area under the interchange bridge and carry out structural backfill in a certain direction of the 42,115 working face. Under the protection of structural backfill, it is necessary to ensure that 42,115 working face mining has as little impact on the interchange bridge as possible. The feasible backfill technology scheme of 42,115 working face passing through the interchange bridge has also been determined.
When the 42,115 working face is mined to the backfill position, the roof is maintained by means of net laying, roof rock bolts, and anchor cables. The channel formed by the backfill support is used to transport the single hydraulic prop and wooden stack to the goaf. At the same time, the high-water materials are used to fill the isolation wall, so that the height of the roof and floor can reach 3.4 m. To fill the steel pipes, new high-water materials with high strength and pumpability are used. The cast-in-place support pillars and the gangue (high-water materials filling) between the pillars are used to support the roof. The initial roof support parameters in the backfill area are shown in Table 2.

3. Theoretical Model of Backfill Parameters and Finite Element Simulation of Roof Subsidence

3.1. The Ultimate Collapse Step Distance of the Main Roof of Underground Structural Backfill

The study and application of structural backfill technology of goaf with high-water materials and pillars is an innovative approach to solve the problem of coal mining in 42,115 working face of Liangshuijing coal mine passing through the interchange bridge. The high-water materials have the performance of fast loading, and it supports the main roof load together with the pillars. In the underground structural backfill area, when the filling barricades bear the immediate roof, the determination of the ultimate fracture step distance of the main roof is the key factor in studying the partition size of structural backfill.

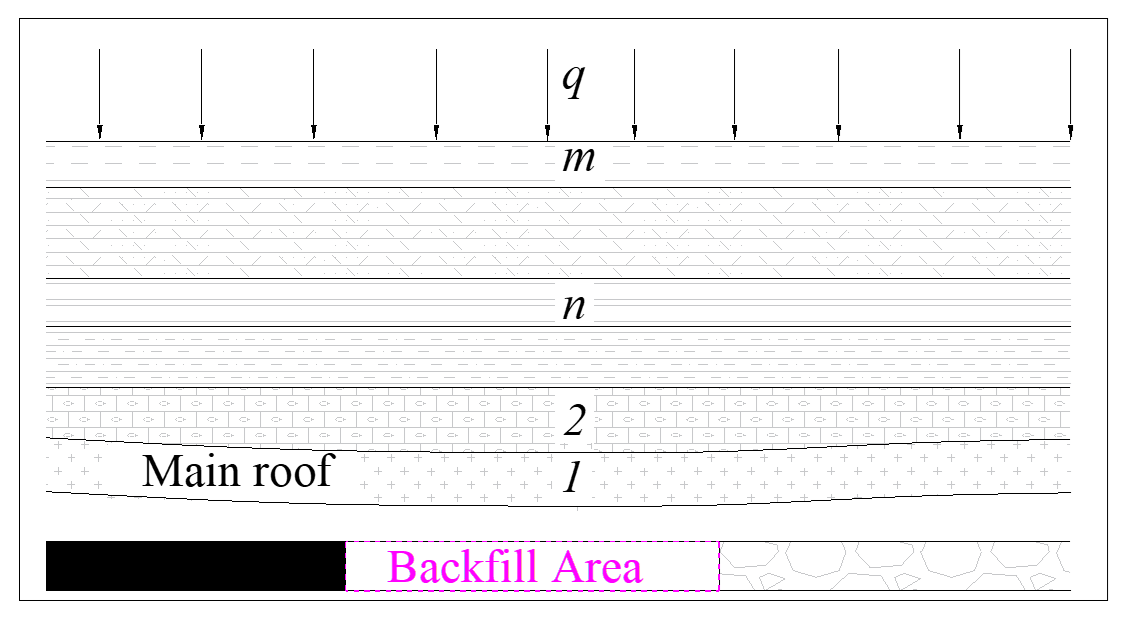
3.1.1. Assessment of the Main Roof Load Using the Periodic Weighting Step Distance

According to the mine pressure observation of Liangshuijing coal mine, in the mining process of 42,114 working face, which is adjacent to 42,115 working face in the study area, the periodic weighting step distance is 15~19 m, with an average of 17 m. In the case of the traditional mining process of 42,115 working face, the main roof periodic weighting beam structure is a cantilever beam, as shown in Figure 6, the stress structure diagram and bending moment of the beam are as follows [38,39]:
According to the force and bending moment diagram, it can be determined that, at the point x = 0 , the force F is:
F = q l
where l is the length of the cantilever beam; q is the uniform load on the cantilever beam.
When x = 0 , the maximum bending moment M is:
M = 1 2 q l 2
Normal stress σ at any point in the cantilever beam is:
σ = M y I z
The maximum bending moment occurs at x = 0 , y = ± h / 2 , so:
σ max = 1 2 q l 2 h 2 1 12 h 3 = 3 q l 2 h 2
where σ max is the maximum normal stress in the cantilever beam; h is the thickness of the cantilever beam.
When σ max = R T , the rock layer’s normal stress achieves its ultimate tensile strength, the rock layer splits at this point, and the ultimate span of beam fracture is:
L l T = h R T 3 q
Owing to the 42,115 working face’s rock tensile strength R T = 1.9   MPa , the periodic weighting step distance L l T = 17   m , and the thickness of the main roof h = 15   m , so:
q = R T h 2 3 L l T 2 = 1.9 × 10 6 × 15 2 3 × 17 2 Pa = 0.493   MPa

3.1.2. Estimation of the Main Roof Fracture Step Distance Based on the Backfill Structure

Under backfill structure conditions, the periodic weighing step distance of the main roof is modelled as a mechanical structure with fixed-freely-supported, and the elastic-plastic bending of beams is assumed as follows [40,41]:
(1) The main roof material is ideal rigid plastic, that is to say, the rigid plastic deformation model is adopted without considering the elastic properties and strengthening effect of the material;
(2) Rock is a brittle material. Before failure, the deformation of the structure is small enough, and the geometric relationship of material deformation is linear;
(3) Before reaching the ultimate load, the structure will not lose its stability.
Figure 7 shows the stress analysis and bending moment diagram of fixed-freely-supported after backfilling with high-water materials in the structural backfill system.
According to the principles of structural mechanics and elastic mechanics:
F 0 Δ 1 l + Δ 1 p = 0
In addition:
Δ 1 l = 1 3 l 3 l E I , Δ 1 p = 1 8 q l 4 l E I
Then:
F 0 = 3 8 q l , F l = 5 8 q l
It can be determined according to the bending moment diagram: when x = 3 l / 8 , the bending moment M is the maximum, 9 q l 2 / 128 .
Normal stress σ at any point in the fixed-freely-supported beam is:
σ = M y I z
The maximum bending moment occurs at x = 3 l / 8 , y = ± h / 2 , so:
σ max = 9 128 q l 2 h 2 1 12 h 3 = 27 q l 2 64 h 2
When σ max = R T , the rock layer’s normal stress develops its ultimate tensile strength, the rock layer splits at this point, and the ultimate span of beam fracture under the condition of the support of the wall filled with the underground structural filling high-water materials are:
L l T = 8 h R T 27 q
According to the model result above, the main roof load q is equal to 0.493 MPa, so the ultimate span of beam fracture L l T = 45.33   m , and considering the safety factor of 2.0, the backfill step distance is 22.7 m.

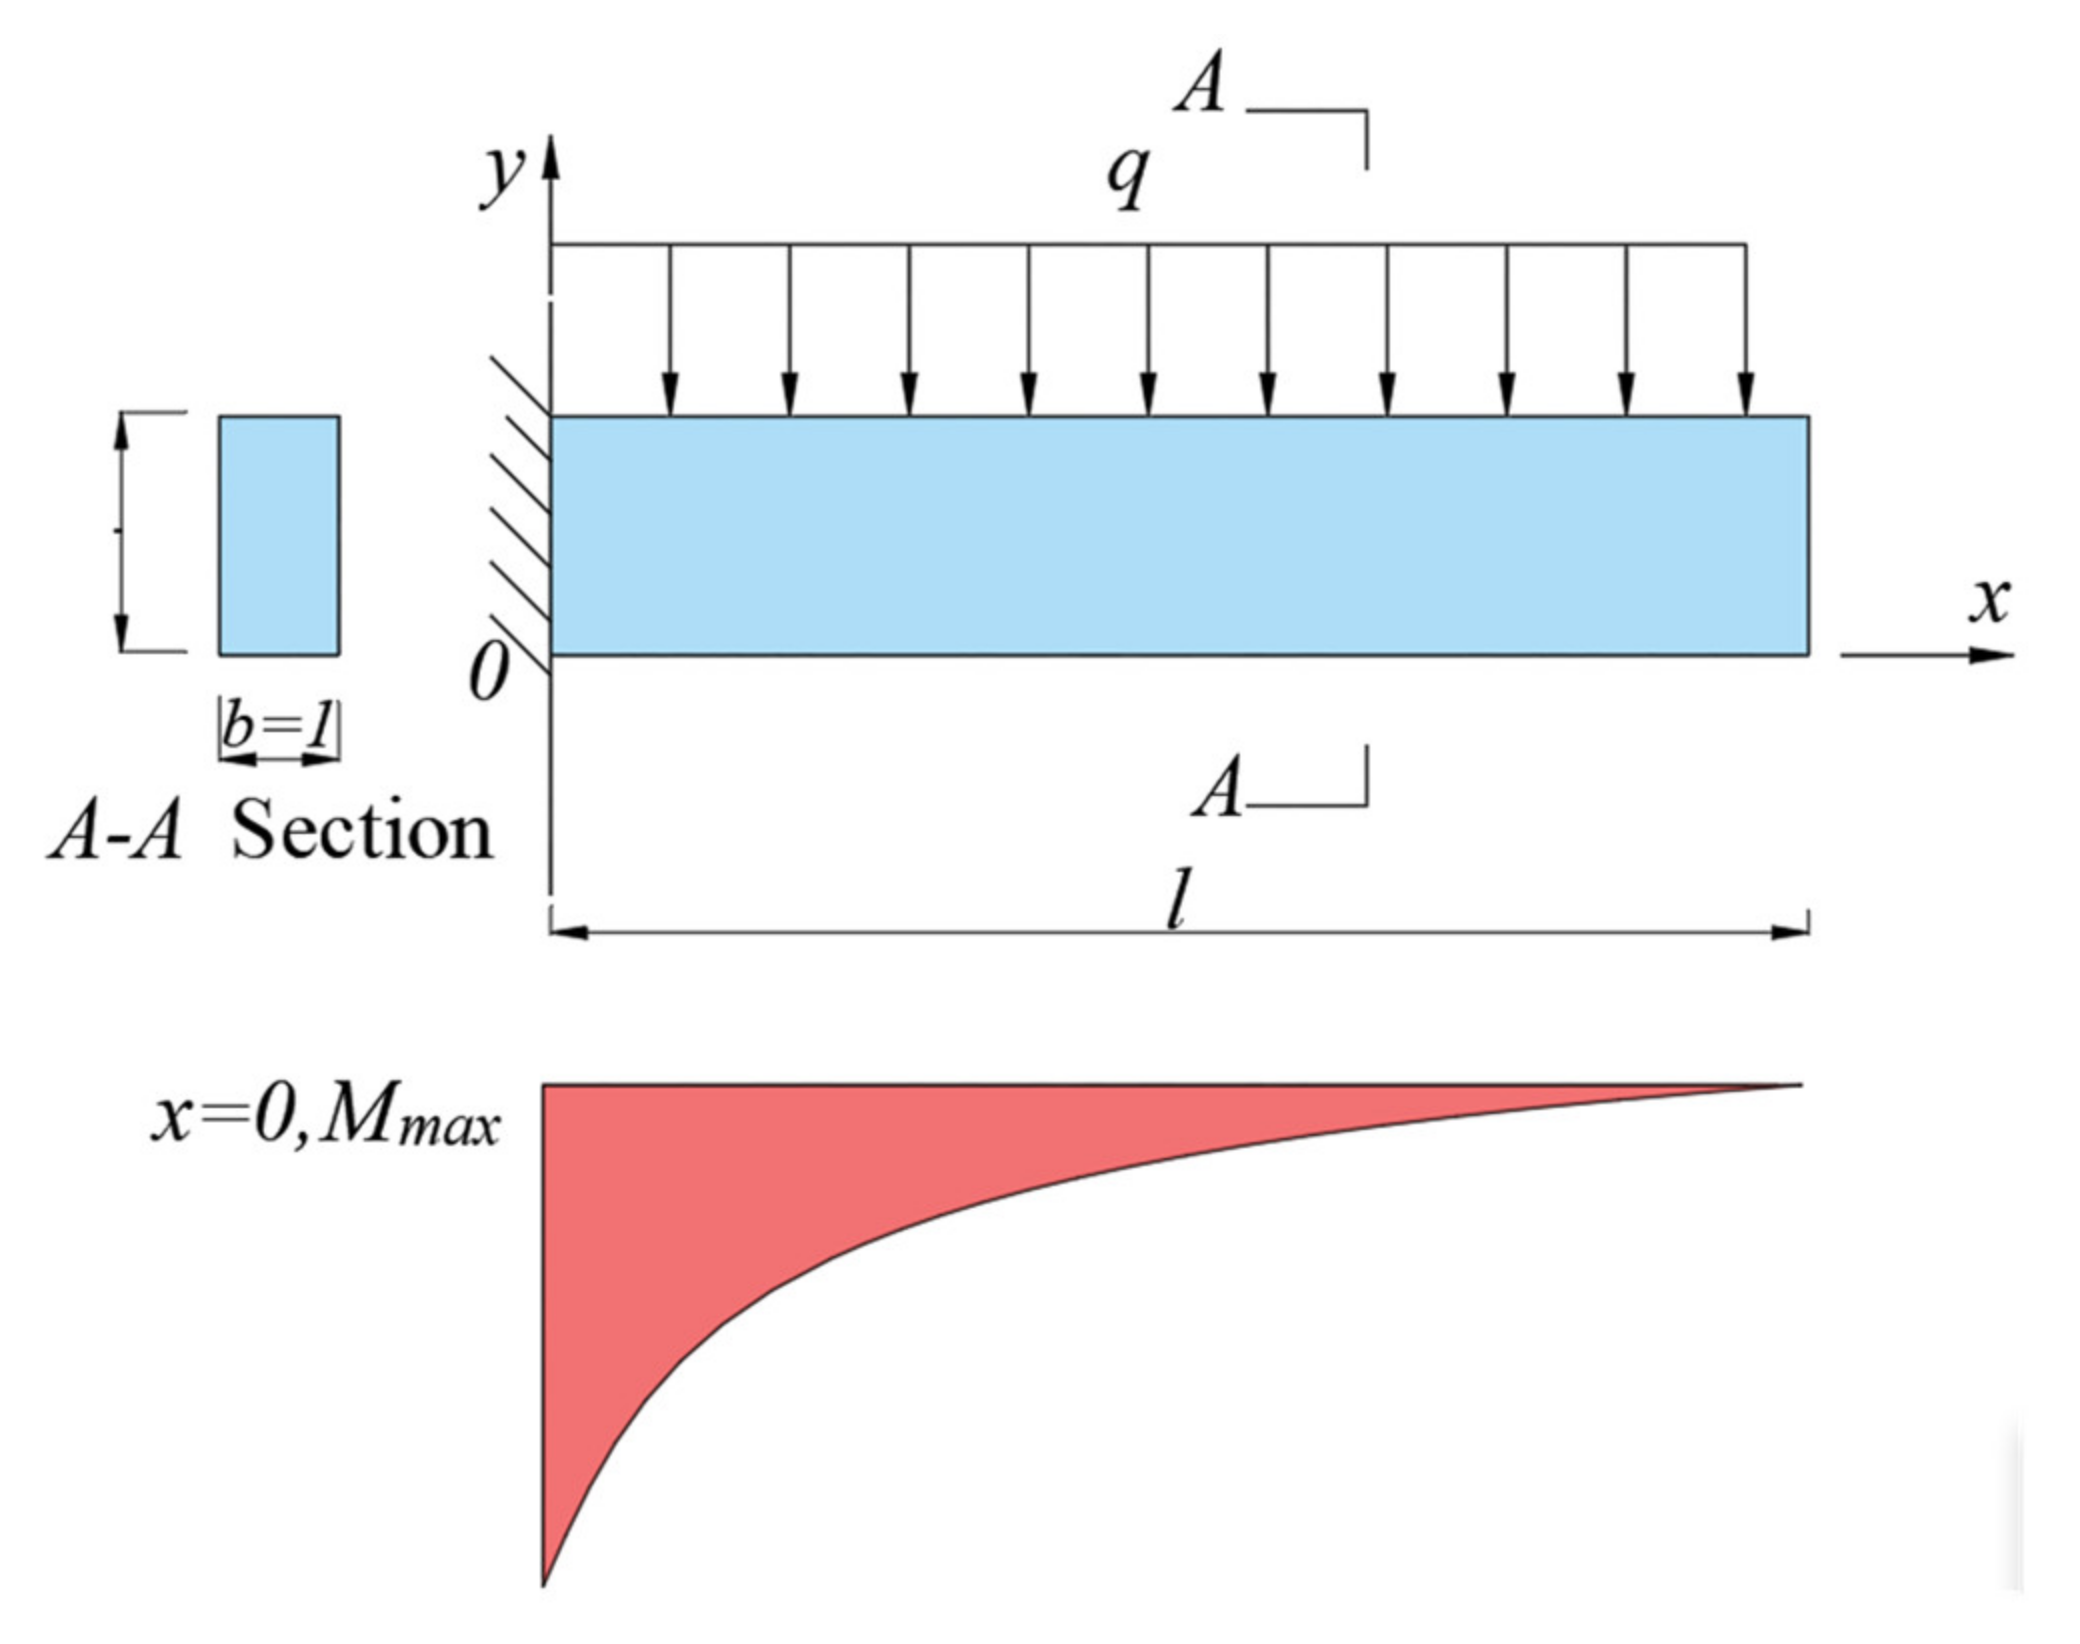
3.1.3. The Procedure of Resolving Beam Load Problems

The beam load is determined using composite beam theory. The immediate roof, the main roof, and the strata of each stratum comprise the upper portion of the coal seam. It must meet the uniform load of the overlaying strata in this location [38,42]. As illustrated in Figure 8, there are m layers of strata above the backfill barricade, with the elastic modulus, thickness, and volume force of each layer being E i (i = 1,2,…, m), h i (i = 1,2,…, m), and γ i (i = 1,2,…, m), respectively.
Assume that the main roof is the first layer, with n strata controlled by it. The n layers maintain contact, and the lower layer’s deformation governs the top layer’s deformation. Together, the n layers create a composite beam. According to composite beam theory, the rock section’s bending moment M and shear force Q fulfil the following equation:
Q = Q 1 + Q 2 + + Q n M = M 1 + M 2 + + M n
In the case of structural backfill mining, the subsidence deformation of the composite beam is small, and the curvature of each rock stratum in the composite beam is consistent after deformation:
k i = 1 ρ i = M i x E i I i
where ρ i is the curvature radius of layer i, E i is the elastic modulus of layer i, and I i is the moment of inertia of the i stratum.
M 1 E 1 I 1 = M 2 E 2 I 2 = = M n E n I n
That is:
M 1 x M 2 x = E 1 I 1 E 2 I 2 , M 1 x M 3 x = E 1 I 1 E 3 I 3 , , M 1 x M n x = E 1 I 1 E n I n
In addition:
M x = M 1 x + M 2 x + + M n x = M 1 x 1 + E 2 I 2 + E 3 I 3 + + E n I n E 1 I 1
The shear force is the first derivative of the bending moment, so:
d M d x = Q
That is:
Q 1 x = E 1 I 1 E 1 I 1 + E 2 I 2 + E n I n Q x
The beam load is the first derivative of the shear force, so,
d Q d x = q
That is:
q 1 x = E 1 I 1 E 1 I 1 + E 2 I 2 + E n I n q x
In addition:
q x = γ 1 h 1 + γ 2 h 2 + + γ n h n I 1 = b h 1 3 12 , I 2 = b h 2 3 12 , , I n = b h n 3 12
q 1 x is the load formed when considering the influence of n layers on the first layer, which is q n 1 , then:
q n 1 = E 1 h 1 3 γ 1 h 1 + γ 2 h 2 + + γ n h n E 1 I 1 + E 2 I 2 + E n I n
The roof load of the filling barricade in the backfill structure, Q, is:
Q = q 1 + q 2 = 0.618   MPa
According to the calculation of coal seam buried depth, the permanent load that the filling barricade needs to bear is 3.75 MPa (permanent load).

3.2. Subsidence Analysis of Main Roof and Immediate Roof Using Finite Element Model

According to the rock drilling histogram in Section 2, the thickness of the overlying immediate roof is 5 m, and the thickness of the floor is 10 m. The full-scale model was established by Abaqus [39] as shown in Figure 9, and the dimensions of the immediate roof and floor are adjusted with the spacing of the supporting barricades, and the corresponding parameters of the rock stratum are defined; Hexahedral element (HEX) is adopted for rock stratum and pillars, consolidation constraint is adopted for wall bottom, hard contact force is adopted for barricade and immediate roof and floor, and tie constraint is applied for relative space position. The subject of this section is the influence of different filling parameters on roof subsidence. The main factors considered are the influence of temporary load and permanent load on roof subsidence. The influence of immediate roof and main roof mechanical parameters has exceeded the scope of this paper. Therefore, in the simulation process, the immediate roof and the main roof are simplified to the same material, called the “upper rock layer”, with a thickness of 20 m. The mechanical parameters applied in the model are shown in Table 2. The dimension of the “upper rock layer” is 330 m in length and 20 m in height, with mesh of 1 m in all three directions. The applied surface load has been calculated to be 0.618 MPa (temporary load) and 3.75 MPa (permanent load).
In the X positive and negative direction of the coordinate system, the filled partition barricade model sets the position for the partition barricade, and the mechanical behavior of directly jacking in these areas completely depends on the support effect of the barricade, so there is no constraint condition. So, its deformation behavior can only be obtained through the constraint effect of the barricade. In the Y positive and negative direction of the coordinate system, the negative direction of the Y coordinate is the coal wall, which is set as a fixed constraint. The square of the Y coordinate is the direction of the connecting roadway, which can be different according to different reinforcement schemes, so there is no constraint.
According to the method in GB50936-2014 [43], GB50017-2017 [44], the ultimate bearing capacity of the precast concrete-filled steel tube pillars is calculated, and the relevant parameters of the Φ 500 mm L 4000 mm pillars under the temporary load of 0.618 MPa are shown in Table 3.
Through the above model, the finite calculation of the temporary wall support is carried out, and the deformation law of the roof is analyzed when the support wall spacing is 5 m, 10 m, 15 m, and 20 m respectively.
Through the comparative analysis of the subgraphs in Figure 10, the maximum settlement of the roof is in the center of the two wall supports in the X direction, and the vertical deformation of the wall support area and the wall is small, which also conforms to the deformation law of the unidirectional slab under uniform load. When only temporary load (0.618 MPa) is considered, the maximum settlement of direct roof with spacing of 5 m, 10 m, 15 m, and 20 m is 2.584 mm, 7.787 mm, 23.32 mm, and 63.24 mm, respectively. Considering the permanent support load (3.75 MPa), the maximum settlement of the roof with the spacing of 5 m, 10 m, 15 m, and 20 m is 15.68 mm, 47.25 mm, 144.6 mm, and 598.03 mm, respectively.
The numerical variation law of the maximum settlement area of the roof is shown in Figure 11. The settlement rate of the immediate roof increases with the increase of the spacing between the supporting barricades. The settlement rate of the immediate roof increases more rapidly in the section of 15~20 m, and the settlement rate of the immediate roof increases more gently in the section of 5~10 m. The maximum displacement calculated by the column model with boundary constraints is 8.375 mm, while the maximum settlement calculated by the 5 m and 10 m infilled pillar support scheme is 2.584 mm and 7.787 mm, which shows that the infilled wall construction scheme is more reasonable. The infilled wall restricts the roof settlement to a certain extent, the construction is more convenient, and the cost is relatively low.

3.3. Determine the Structure Backfill Mining Parameters

(1) Material and size selection of pillars
The pillars support the roof strata of the backfill area. Related parameters such as pillar size and materials are discussed in Section 3.2. There are mainly three commonly used concrete types for the materials of the pillars, namely C35, C40, and C60. In the structural backfill method, the column and the partition wall are supported together, and the bearing capacity of the column is not the most crucial factor. Therefore, the commonly used C35 concrete is selected. There are mainly two commonly used diameters for pillars, namely Φ 800 mm and Φ 500 mm. According to the calculation method of bearing capacity provided by GB50936-2014 [43], GB50017-2017 [44], the parameters of different types of pillars under the temporary load of 0.618 MPa are shown in Table 4. Φ 500 mm, although the bearing capacity provided is less than Φ 800 mm, because its weight is one-third of Φ 800 mm, the cost is one-half of Φ 800 mm. Therefore, a Φ 500 mm pillar prefabricated with C35 concrete was chosen.
(2) Material and size selection of barricade
Regarding the material of the filling barricade, concrete, sand, and gravel can be selected [45,46]. The selection of high-water materials has advantages over other materials due to its fast load-bearing characteristics. The mechanical load-bearing properties of high-water materials are discussed in detail in Section 5.1 and are also proven in previous literature [47,48]. In Section 3.2, the variation relationship of the roof subsidence of different backfill barricades spacing is simulated, and the roof subsidence is smaller under the filling barricade spacing of 5~15 m, considering the spacing and row spacing between the columns are both 4 m. Therefore, the spacing of the filling barricade is determined to be 12 m. In addition, the width of the filling barricade is 1.5 m, the maximum distance between the filling barricade and the pillars and the coal mining face is 22.7 m (discussed in Section 3.1.2).

4. Prediction Model of Mining Deformation and Subsidence and Its Application

4.1. Basic Theory of Prediction Model

The probability integral theory hypothesizes that the law of strata and surface movement induced by mining is comparable to the law given in macroscopic terms by the granular medium model as a randomized medium, and it has developed into one of the most matured and extensively used prediction methods [49,50,51].
As shown in Figure 12, unit B u , v is mined in an inclined coal seam by taking ground coordinate system x O y and coal seam coordinate system u O y v . According to the principle of probability integral method, the subsidence value of surface point A x , y caused by unit mining is:
W e x , y = 1 r 2 exp π x u 2 + y v + H c tan θ 2 r 2
where r is the main influence radius at unit B , r = H / tan β ; H is the mining depth at unit B ; tanβ is the tangent of the main influence angle; θ is the propagation angle of mining influence.
Accordingly, the inclination i e x x , y , i e y x , y , curvature K e x x , y , K e y x , y , horizontal movement U e x x , y , U e y x , y and horizontal deformation ε e x x , y , ε e y x , y of surface point A x , y along x , y directions are as follows:
i e x x , y = 2 π x u r 2 W e x , y i e y x , y = 2 π y v + H c tan θ r 2 W e x , y
K e x x , y = 2 π r 2 1 2 π x u 2 r 2 W e x , y K e y x , y = 2 π r 2 1 2 π y v + H c tan θ 2 r 2 W e x , y
U e x x , y = b r i e x x , y U e y x , y = b r i e y x , y + W e x , y c tan θ
ε e x x , y = b r K e x x , y ε e y x , y = b r K e y x , y + i e y x , y c tan θ
where b is the horizontal displacement coefficient. According to the superposition principle, the subsidence W x , y of surface point A x , y caused by the whole coal seam mining is:
W x , y = W 0 s 3 l s 1 cos α L W e x , y d v d u
where W 0 is the maximum subsidence, W 0 = m q cos α ; m is the normal mining thickness of coal seam; q is the subsidence coefficient; α is the dip angle of coal seam;
l = D 3 s 4 L = D 1 s 2 cos α
where D 3 is the strike length of working face; D 1 is the inclined length of working face; s 1 , s 2 , s 3 , s 4 is the inflection point offset of the left and right boundary in downhill direction, uphill direction and strike direction, respectively.
On this basis, it can be deduced that the surface point A x , y along any direction φ , the inclination i x , y , φ , curvature K x , y , φ , horizontal movement U x , y , φ and horizontal deformation ε x , y , φ of the model are as follows:
i x , y , φ = W 0 s 3 l s 1 cos α L i e x x , y cos φ + i e y x , y sin φ d v d u
K x , y , φ = W 0 s 3 l s 1 cos α L K e x x , y cos 2 φ + K e y x , y sin 2 φ + 4 π 2 x u y v + H c tan θ r 4 W e x , y sin 2 φ d v d u
U x , y , φ = W 0 s 3 l s 1 cos α L U e x x , y cos φ + U e y x , y sin φ d v d u
ε x , y , φ = W 0 s 3 l s 1 cos α L ε e x x , y cos 2 φ + ε e y x , y sin 2 φ + 8 b π 2 x u y v + H c tan θ r 3 W e x , y + i e x x , y c tan θ sin φ cos φ d v d u
When the surface is fully mined, the maximum deformation can be calculated by the following equation: Maximum value of ground surface subsidence, W 0 = mqcos α , inclination, i 0 = W 0 / r , curvature, k 0 = ± 1.52 W 0 / r 2 , horizontal movement, U 0 = b W 0 , and horizontal deformation, ε 0 = ± 1.52 b W 0 / r .

4.2. Input Parameters of the MSAS

The Mining subsidence prediction and analysis system (MSAS) was developed on the basis of the visual basic 6.0 system, which can truly realize the prediction calculation of surface subsidence, inclination, curvature, horizontal movement and horizontal deformation caused by mining of any shape working face [52]. In addition, the system has the advantages of simple data preparation and convenient operation, which abandons the traditional method of rectangular partitions for any working face, and adopts the integral method to calculate, which reduces the partition error and makes the calculation results more accurate. Consequently, the contour lines of maximum inclination, maximum curvature and maximum horizontal deformation can be given, which makes the analysis of mining damage easier. Considering the reasonable length of the article, there is no detailed study on the expected parameters, and the relevant parameters in the reference [53] are selected when the prediction model is applied, as follows:
(1) Normal mining prediction parameters of the MSAS:
Surface subsidence coefficient, q = 0.72 , horizontal movement coefficient, b = 0.3 , main influence angle tangent, tan β = 1.8 , inflection point translation distance, S 0 = 0.05 H , mining influence spread angle, θ = 90 0.5 α .
(2) Backfill mining prediction parameters of the MSAS:
Surface subsidence coefficient, q = 0.085 , horizontal movement coefficient, b = 0.3 , main influence angle tangent, tan β = 1.8 , inflection point translation distance, S 0 = 0.03 H , mining influence spread angle, θ = 90 0.5 α .

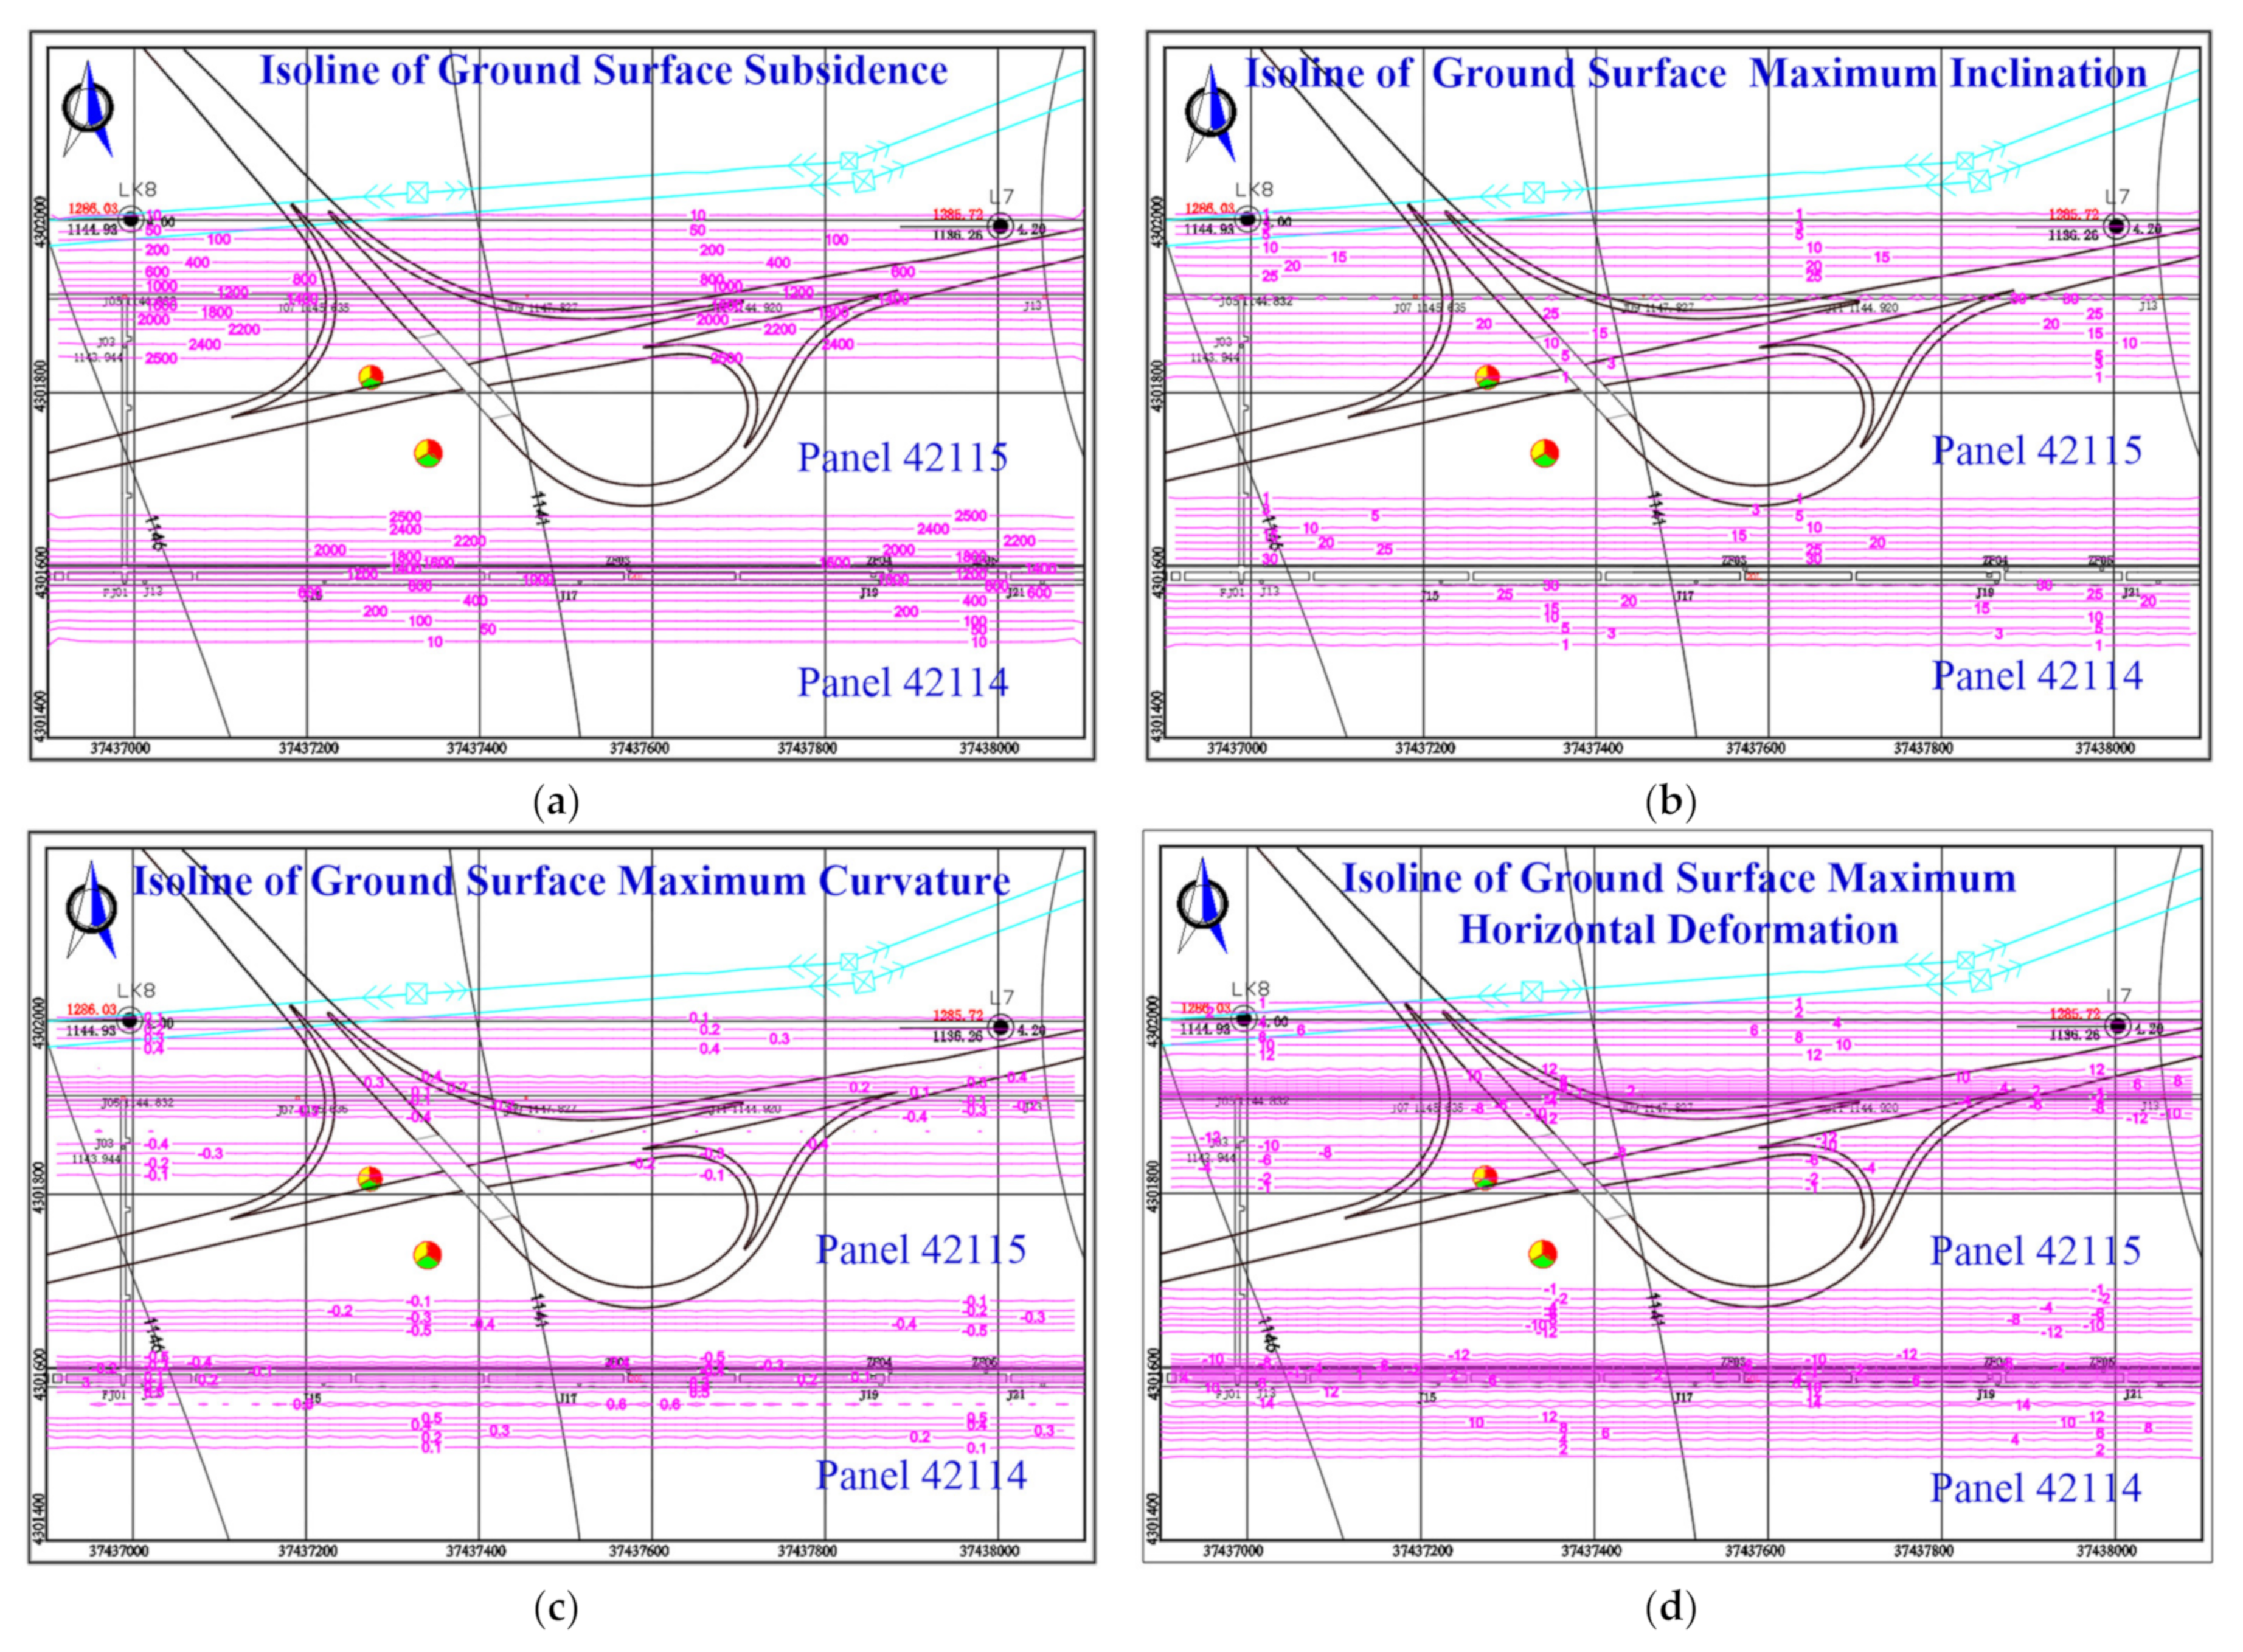
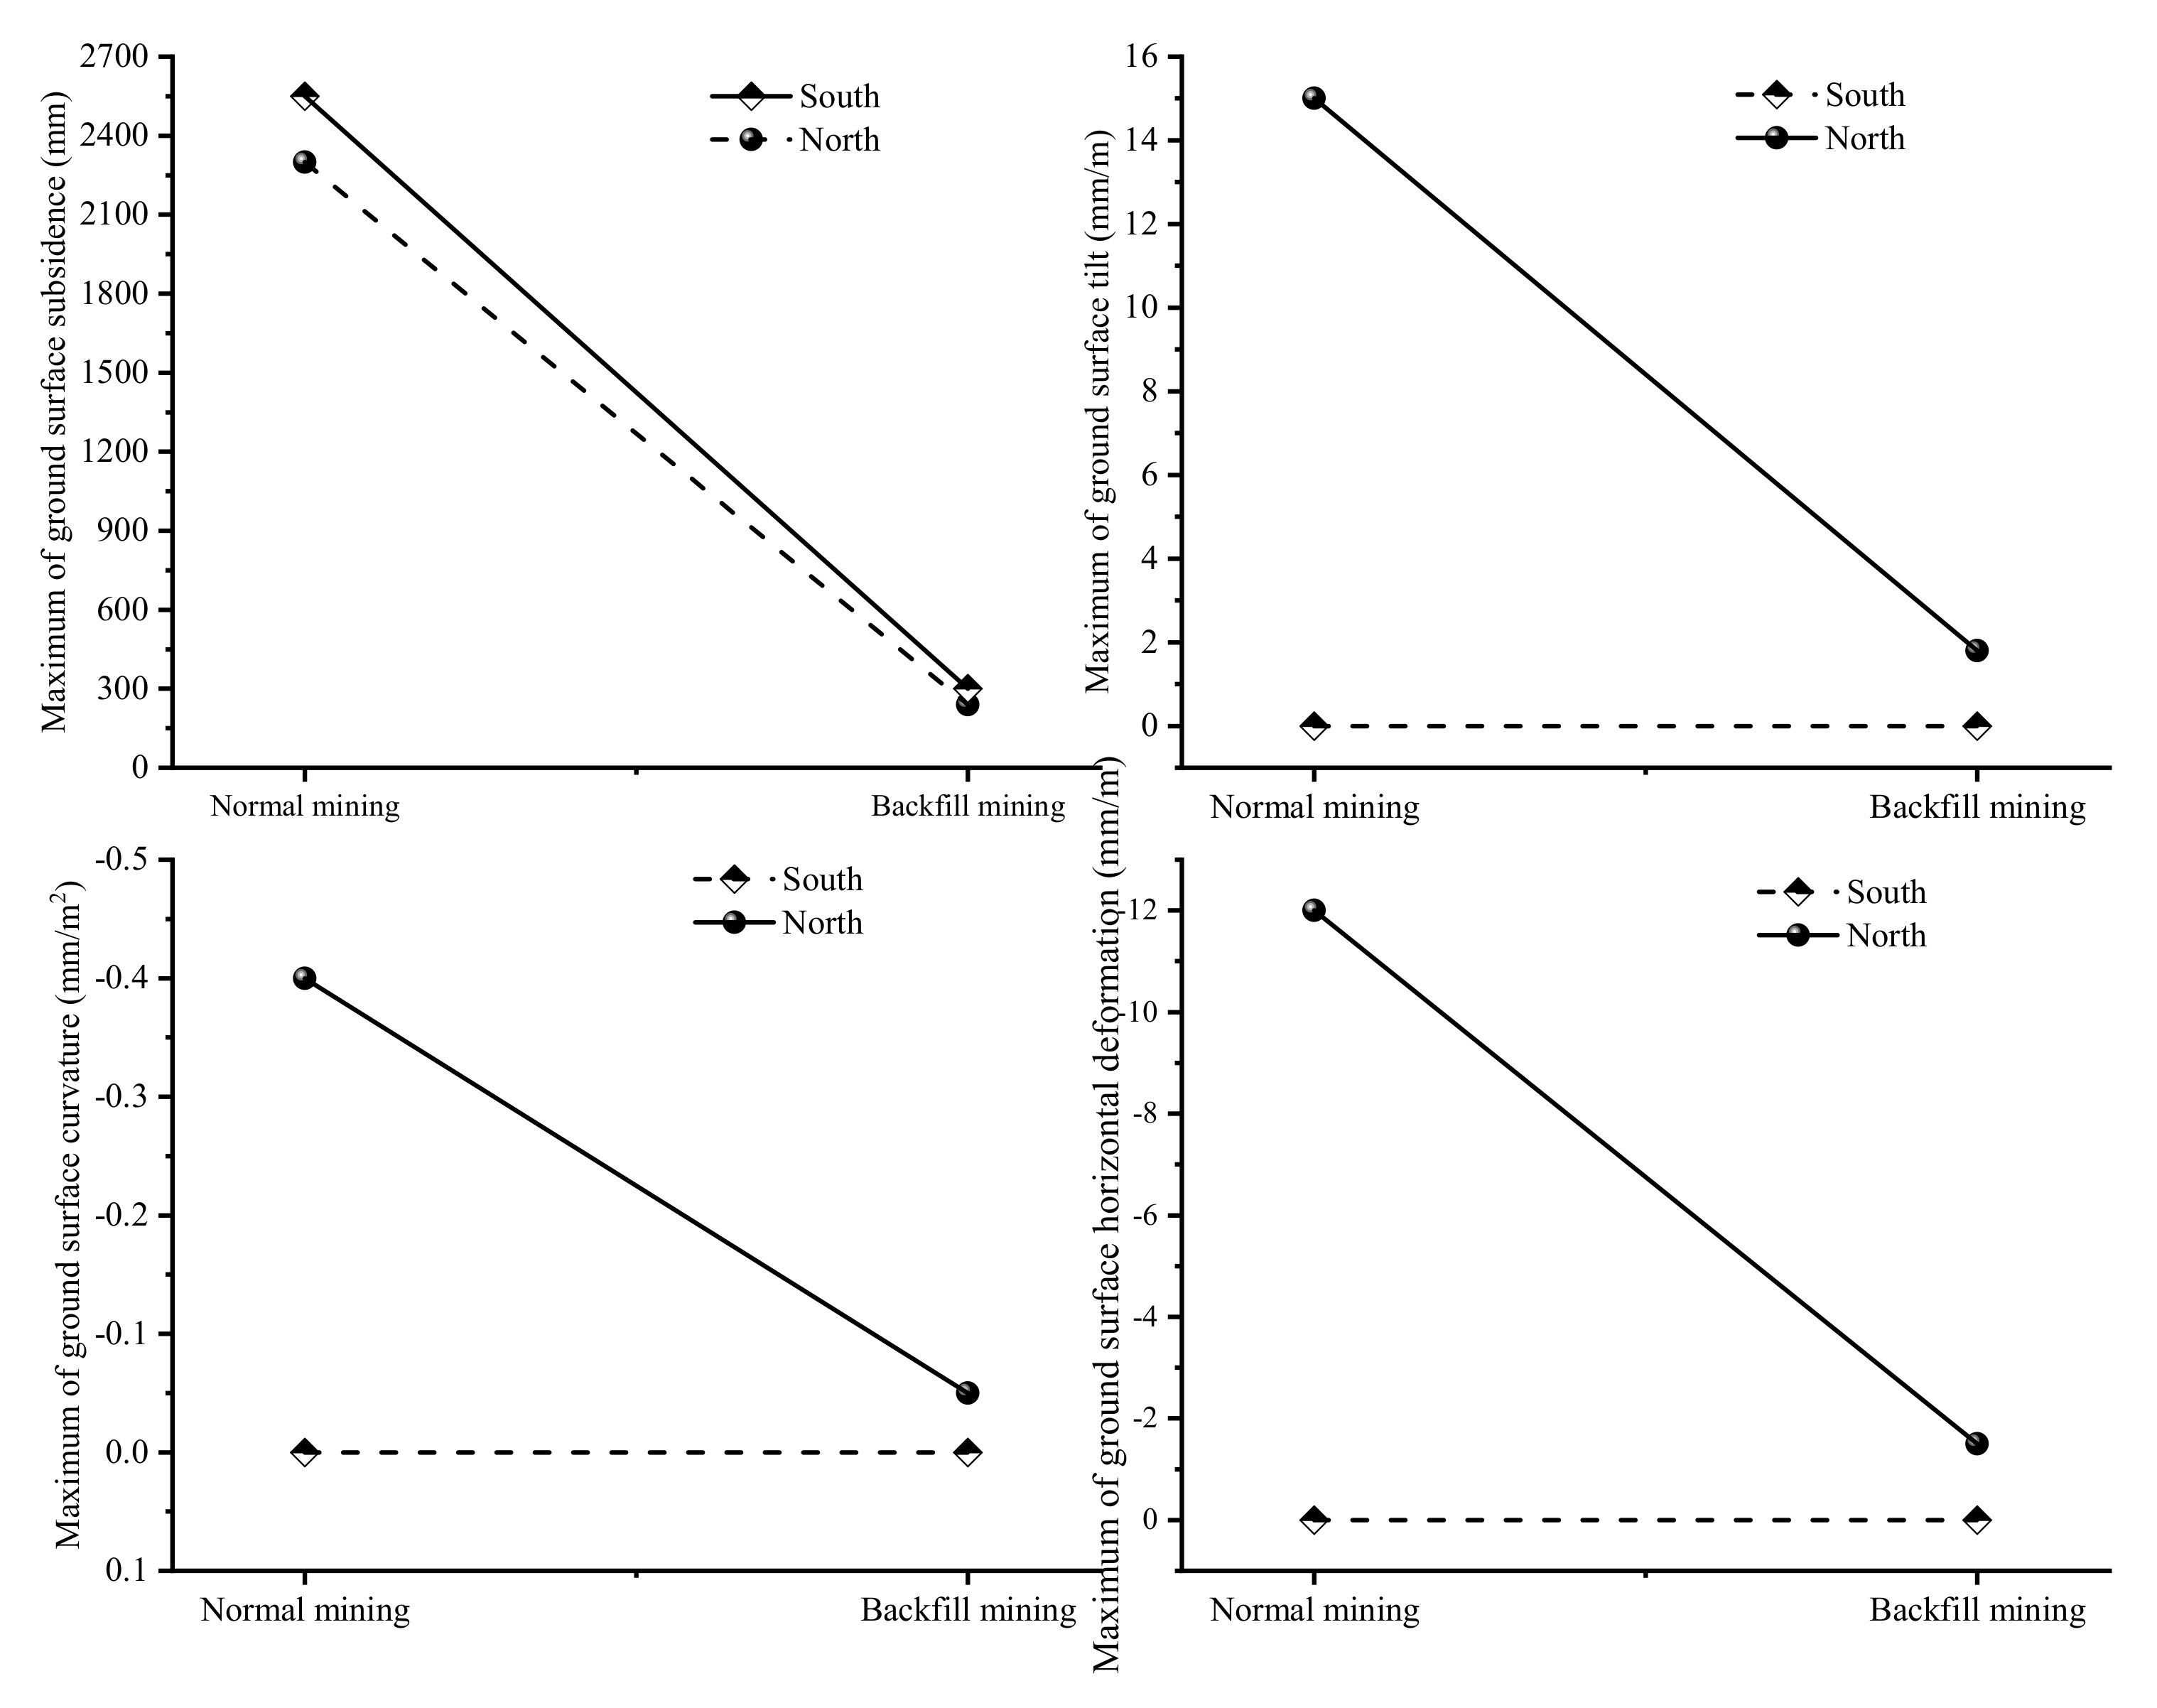
4.3. Model Application and Result Analysis

Through the calculation of the MSAS system, the surface subsidence and deformation of the interchange bridge area after 42,115 working face mining can be obtained. The contour map of surface subsidence and the contour map of maximum inclination, curvature and horizontal deformation are shown in Figure 13 and Figure 14.
The interchange bridge area final subsidence and maximum deformation values of normal mining and backfill mining are shown in Figure 13, Figure 14 and Figure 15. Under normal mining conditions, the maximum subsidence at the north end of the interchange bridge area is 2300 mm, and the maximum subsidence at the south end of the interchange bridge area is 2550 mm. Under backfill mining conditions, the maximum subsidence at the north end of the interchange bridge area is 240 mm, and the maximum subsidence at the south end of the interchange bridge area is 300 mm. Under normal mining conditions, the maximum inclination of the north end of the interchange bridge area is 15 mm/m, and under backfill mining conditions, the maximum inclination of the north end of the interchange bridge area is 1.8 mm/m. Under normal mining conditions, the maximum curvature of the north end of the interchange bridge area is −0.4 mm/m2, and under backfill mining conditions, the maximum curvature of the north end of the interchange bridge area is −0.1 mm/m2. Under normal mining conditions, the maximum horizontal deformation of the north end of the interchange bridge area is −12 mm/m, and under filling mining conditions, the maximum curvature of the north end of the interchange bridge area is −1.5 mm/m.
Due to the interchange bridge being located directly above the 42,115 working face, which is located in the center of the subsidence basin after mining, each deformation value is small. During the mining process, the interchange bridge is affected by various dynamic deformations, especially when the working face is pushed under the interchange bridge, then each deformation value is the largest. The interchange bridge is first subjected to positive curvature and tensile deformation, and then to negative curvature and compression deformation. For this reason, the surface subsidence deformation of 42,115 working face under the interchange bridge area is specially predicted. The maximum dynamic deformation value of normal mining and backfill mining under the interchange bridge area is shown in Table 5.
As shown in Table 5, at the south of the interchange bridge, the maximum dynamic tilt, curvature, and horizontal deformation under normal mining conditions are 30 mm/m, −0.5~0.5 mm/m2, and −14~14 mm/m compared to backfill mining, which are 3.5 mm/m, −0.05~0.05 mm/m2, and −1.5~1.5 mm/m. At the north of the interchange bridge, the maximum dynamic tilt, curvature, and horizontal deformation under normal mining conditions are 25 mm/m, −0.4~0.4 mm/m2, and −12~12 mm/m compared to backfill mining which are 3.0 mm/m, −0.05~0.05 mm/m2, and −1.3~1.3 mm/m. Obviously, the surface subsidence parameters are reduced appropriately by ten times under the conditions of backfill mining. In other words, backfill mining can effectively limit surface deformation and greatly reduce the impact of mining on surface buildings, which is consistent with the previous research result [4,16,54,55,56].

5. Discussions

5.1. Feasibility of Structural Backfill Engineering

Several parameters govern the mechanical characteristics of backfill materials, which could be divided into two categories: macroscopic parameters and intrinsic parameters [3,57]. Ingredients A and B make up the high-water materials. Ingredient A is a unique concrete that contains the minerals listed in Table 6. The major components of ingredient B are quicklime (CaO) and gypsum (CaSO4). Ingredients A and B are combined with water and fluttered constantly for 24 h to keep the mixture uncondensed. Ingredients A and B are combined with water and fluttered constantly for 24 h to keep the mixture uncondensed. The major components of high water material are ettringite, alumina, and free water [47], which has the benefit of quick healing and a significant post peak deformation with a high load carrying capacity. The full stress-strain curve and deformation characteristics of high-water materials after 7 days of setting at the water cement ratio of 1.5:1 is shown in Figure 16 [58,59,60].
It can be seen from Figure 16 that high-water materials have outstanding plastic characteristics. After the load reaches the peak strength, the high-water materials do not completely destroy and lose the bearing capacity immediately. However, with the further increase of strain, the bearing capacity decreases slowly, and the rate of bearing capacity decreasing slowly with the increase of strain is far less than that of ordinary concrete and rock materials. Under this condition, the peak compressive strength of high-water materials is 10.4 MPa. When the strain reaches 0.1, the compressive strength is still above 65% of the peak strength, the strain continues to increase to 0.18, and the residual compressive strength is about 59% of the peak strength [61]. The barricade of high-water materials shows obvious plastic materials characteristics, which can allow large plastic deformation under pressure, and the strength attenuation is relatively slow, which can maintain high residual strength.

5.2. Measured Analysis of Support Resistance

After adopting the structural backfill and mining technology, the monitoring result of the hydraulic support resistance is shown in Figure 17 when the 42,115 working face passes through the interchange bridge region.
As shown in Figure 17, the overall resistance of hydraulic support is less than 22 MPa, and there is no obvious strata behavior due to the supporting effect of filling body on the roof of 42,115 working face. The resistance of the hydraulic support in the backfill area of the 42,115 working face is relatively small, indicating that the small roof pressure of the working face verifies the rationality of the structural backfill parameters, and it is also consistent with the surface subsidence results predicted in Section 4.3.

5.3. Economic and Social Benefit Analysis

(1) Economic benefit analysis:
The output value of coal mine mining by using the structure backfill method:
The length and width of the mining area affected by the interchange bridge are 1000 m and 330 m respectively. After adopting the structural backfill technology of high-water materials combined with pillars for this region, the increased output value of coal mine mining can be calculated by the following equation:
G = L D m η γ V
where G is the increase output value of 42,115 working face, R M B ; L is the increase length of 42,115 working face, 1000 m; D is the increase width of 42,115 working face, 330 m; m  is the coal seam thickness of 42,115 working face, 3.5 m; η is the recovery rate of 42,115 working face, 95%; γ is the coal seam bulk density of 42,115 working face, 1.29   t / m 3 ; and V is the price per ton of coal, 600   CNY , so:
G = 1000 × 330 × 3.5 × 95 % × 1.29 × 600 = 849,271,500   CNY
The cost of using the structure backfill method is shown in Table 7:
Therefore, the economic benefit after using the structure backfill mining method is:
Economic benefit = 849,271,500 − 172,250,900 = 677,020,600 CNY
(2) Social benefit analysis:
This technology has the potential to significantly improve resource recovery rates, noticeably reduce coal resource waste, extend the life of the mine, and ensure the establishment of a high-yielding and efficient mine [46,62]. This technology not only solves the problem of safe mining of coal resources under the overpass, but also deals with a large amount of underground discharge and accumulation of gangue, alleviating the social problems such as no gangue discharge space and environmental pollution. The successful implementation of mixed filling mining of gangue and structural column widens the application scope of filling mining method, which provides an important engineering reference for coal mining under similar conditions.
In the mining process of 42,115 working face, the structural backfill technology of high-water materials combined with pillars for goaf is adopted. After mining, the height of roof crack development and vertical displacement are small, which can ensure the stability of the interchange bridge above the 42,115 working face and meet the requirement of safe production [63]. It not only achieves significant economic benefits, but also has considerable social benefits.

6. Conclusions

In this paper, through field measurement, theoretical analysis, and numerical simulation, a structural backfill method based on roof structural characteristics is proposed. The main conclusions obtained are as follows:
(1) Based on the monitoring result of the hydraulic support resistance, the periodic weighting step is determined to be an average of 17 m, then the main roof load is calculated to be to be 0.493 MPa, and the backfill step distance is determined to be 22.7 m. According to the composite beam theory of roof strata, the temporary load of the backfill structure is 0.618 MPa, and the permanent load is 3.75 MPa.
(2) The finite element model is established, then the roof layer mechanical properties and pillars parameters is selected depending on the related criteria. The result of the finite element model shows that the subsidence is lower when the spacing of the filling barricade is 5~15 m, considering the pillars layout, the reasonable filling spacing (12 m) of the barricade is determined, and the rationality of backfill mining for safe mining under the interchange bridge is verified by the probability integral method result.
(3) This paper discusses the feasibility of the structural backfill technology with high-water materials and pillars in goaf, and finally analyses the economic benefits of 677,020,600 CNY and demonstrates the application value of the structural backfill mining method based on the roof structural characteristics and its subsidence prediction model.
The structural filling strategy proposed in this paper with high-water materials and pillars is of great significance to solving the mining face under the building. It has significant advantages with the rapid bearing of high-water materials and the stable support of the pillars, which provides an innovation in the field of backfilling mining.

Author Contributions

Conceptualization, S.L. and J.B.; methodology, X.W.; software, S.L., G.W.; validation, S.L., J.B., X.W., G.W. and B.W.; formal analysis, G.W.; writing—original draft preparation, S.L., J.B. and G.W.; writing—review and editing, S.L., J.B., X.W., G.W. and B.W.; funding acquisition, J.B. and S.L. All authors have read and agreed to the published version of the manuscript.

Funding

This work was supported by the Postgraduate Research & Practice Innovation Program of Jiangsu Province, grant number KYCX21_2388. This research was also funded by the National Natural Science Foundation of China, grant number No. 52074239.

Data Availability Statement

Data is available on request from the corresponding author of the manuscript.

Acknowledgments

The authors are grateful to the reviewers for their helpful advice and comments.

Conflicts of Interest

The authors declare no conflict of interest.

References

  1. Yang, Z.F.; Li, Z.W.; Zhu, J.J.; Yi, H.W.; Hu, J.; Feng, G.C. Deriving Dynamic Subsidence of Coal Mining Areas Using InSAR and Logistic Model. Remote Sens. 2017, 9, 125. [Google Scholar] [CrossRef] [Green Version]
  2. Zheng, M.N.; Deng, K.Z.; Fan, H.D.; Du, S. Monitoring and Analysis of Surface Deformation in Mining Area Based on InSAR and GRACE. Remote Sens. 2018, 10, 1392. [Google Scholar] [CrossRef] [Green Version]
  3. Benzaazoua, M.; Fall, M.; Belem, T. A contribution to understanding the hardening process of cemented pastefill. Miner. Eng. 2004, 17, 141–152. [Google Scholar] [CrossRef]
  4. Hassani, F.; Archibald, J. Mine Backfill; Canadian Institute of Mining, Metallurgy and Petroleum: Montreal, QC, Canada, 1998. [Google Scholar]
  5. Fall, M.; Celestin, J.C.; Pokharel, M.; Toure, M. A contribution to understanding the effects of curing temperature on the mechanical properties of mine cemented tailings backfill. Eng. Geol. 2010, 114, 397–413. [Google Scholar] [CrossRef]
  6. Qi, C.; Fourie, A. Cemented paste backfill for mineral tailings management: Review and future perspectives. Miner. Eng. 2019, 144, 106025. [Google Scholar] [CrossRef]
  7. Guo, S.J.; Zhang, J.X.; Li, M.; Zhou, N.; Song, W.J.; Wang, Z.J.; Qi, S.M. A preliminary study of solid-waste coal gangue based biomineralization as eco-friendly underground backfill material: Material preparation and macro-micro analyses. Sci. Total Environ. 2021, 770, 145241. [Google Scholar] [CrossRef] [PubMed]
  8. Qi, C.-C. Big data management in the mining industry. Int. J. Miner. Metall. Mater. 2020, 27, 131–139. [Google Scholar] [CrossRef]
  9. Tang, F.Q.; Lu, J.X.; Li, P.F. A prediction model for mining subsidence in loess-covered mountainous areas of western China. Curr. Sci. 2019, 116, 2036–2043. [Google Scholar] [CrossRef]
  10. Shi, M.Y.; Yang, H.L.; Wang, B.C.; Peng, J.H.; Gao, Z.Z.; Zhang, B. Improving Boundary Constraint of Probability Integral Method in SBAS-InSAR for Deformation Monitoring in Mining Areas. Remote Sens. 2021, 13, 1497. [Google Scholar] [CrossRef]
  11. Guo, G.L.; Zhu, X.J.; Zha, J.F.; Wang, Q. Subsidence prediction method based on equivalent mining height theory for solid backfilling mining. Trans. Nonferrous Met. Soc. China 2014, 24, 3302–3308. [Google Scholar] [CrossRef]
  12. Guo, K.K.; Guo, G.L.; Li, H.Z.; Wang, C.Y.; Gong, Y.Q. Strata movement and surface subsidence prediction model of deep backfilling mining. Energy Sources Part A Recover. Util. Environ. Eff. 2020, 1–15. [Google Scholar] [CrossRef]
  13. Zhu, X.J.; Guo, G.L.; Liu, H.; Yang, X.Y. Surface subsidence prediction method of backfill-strip mining in coal mining. Bull. Eng. Geol. Environ. 2019, 78, 6235–6248. [Google Scholar] [CrossRef]
  14. Vyazmensky, A.; Elmo, D.; Stead, D.; Rance, J.R. Combined finite-discrete element modelling of surface subsidence associated with block caving mining. In Proceedings of the 1st Canada—U.S. Rock Mechanics Symposium, Vancouver, BC, Canada, 27–31 May 2007; pp. 467–475. [Google Scholar]
  15. Hamdi, P.; Stead, D.; Elmo, D.; Toyra, J. Use of an integrated finite/discrete element method-discrete fracture network approach to characterize surface subsidence associated with sub-level caving. Int. J. Rock Mech. Min. Sci. 2018, 103, 55–67. [Google Scholar] [CrossRef]
  16. Li, Y.; Liu, L.M.; Li, Y.H.; Zhang, M.Y.; Wang, X.J. Quantitative Calculation Method Surface Subsidence Caused by Underground Mining Based on GIS. Geotech. Geol. Eng. 2020, 38, 61–69. [Google Scholar] [CrossRef]
  17. Shi, H.; Zhang, Y.B.; Tang, L. Physical test of fracture development in the overburden strata above the goaf and diffusion process of permeable grout slurry. Bull. Eng. Geol. Environ. 2021, 80, 4791–4802. [Google Scholar] [CrossRef]
  18. Lamich, D.; Marschalko, M.; Yilmaz, I.; Bednarova, P.; Niemiec, D.; Mikulenka, V.; Kubecka, K. Geodetic monitoring of roads as a tool for determination of hazard zones in areas influenced by deep coal mining. Bull. Eng. Geol. Environ. 2016, 75, 1033–1044. [Google Scholar] [CrossRef]
  19. Ju, Y.; Nie, X.D.; Zhu, Y.; Xie, H.P. In situ fluidized mining and conversion solution to alleviate geological damage and greenhouse gas emissions due to coal exploitation: A numerical analysis and evaluation. Energy Sci. Eng. 2021, 9, 40–57. [Google Scholar] [CrossRef]
  20. Huang, Q.X.; Cao, J. Research on Coal Pillar Malposition Distance Based on Coupling Control of Three-Field in Shallow Buried Closely Spaced Multi-Seam Mining, China. Energies 2019, 12, 462. [Google Scholar] [CrossRef] [Green Version]
  21. Hu, H.F.; Lian, X.G.; Chen, S.Y. Effects on Buildings of Surface Curvature Caused by Underground Coal Mining. J. Eng. Technol. Sci. 2016, 48, 254–275. [Google Scholar] [CrossRef]
  22. Guo, W.Y.; Hu, B.N.; Zhang, J.Y.; Chen, Q.T.; Jia, X.G.; Li, J.H. Research on the Settlement Regulation and Stability of Large Building Foundation over Gobs: A Case Study in the Xiangcheng Coal Mine, China. Shock Vib. 2021, 2021, 1–17. [Google Scholar]
  23. Guo, W.B.; Guo, M.J.; Tan, Y.; Bai, E.H.; Zhao, G.B. Sustainable Development of Resources and the Environment: Mining-Induced Eco-Geological Environmental Damage and Mitigation Measures-A Case Study in the Henan Coal Mining Area, China. Sustainability 2019, 11, 4366. [Google Scholar] [CrossRef] [Green Version]
  24. Liu, S.G.; Bai, J.B.; Wang, X.Y.; Wu, B.W.; Wu, W.D. Mechanisms of Floor Heave in Roadways Adjacent to a Goaf Caused by the Fracturing of a Competent Roof and Controlling Technology. Shock Vib. 2020, 2020, 1–17. [Google Scholar] [CrossRef]
  25. Dong, J.H.; Li, H.J.; Wang, Y.S.; Zhang, Y.H. Characteristics and monitoring-based analysis on deformation mechanism of Jianshanying landslide, Guizhou Province, southwestern China. Arab. J. Geosci. 2021, 14, 1–10. [Google Scholar] [CrossRef]
  26. Chen, D.D.; Wang, E.; Xie, S.R.; He, F.L.; Wang, L.; Zhang, Q.; Wu, X.Y.; Jiang, Z.S.; Li, Y.B.; Shi, S.H. Roadway Surrounding Rock under Multi-Coal-Seam Mining: Deviatoric Stress Evolution and Control Technology. Adv. Civ. Eng. 2020, 2020, 1–18. [Google Scholar]
  27. Cheben, V.; Drusa, M.; Kuba, M. Innovative Groundwater Table Monitoring Using TDR Technology. Int. J. Geomate 2015, 9, 1428–1433. [Google Scholar]
  28. Petlovanyi, M.V.; Ruskykh, V.V.; Zubko, S.A. Peculiarities of the underground mining of high-grade iron ores in anomalous geological conditions. J. Geol. Geogr. Geoecol. 2019, 28, 706–716. [Google Scholar] [CrossRef]
  29. Marschalko, M.; Yilmaz, I.; Kristkova, V.; Fuka, M.; Kubecka, K.; Bouchal, T. An indicative method for determination of the most hazardous changes in slopes of the subsidence basins in underground coal mining area in Ostrava (Czech Republic). Environ. Monit. Assess. 2013, 185, 509–522. [Google Scholar] [CrossRef] [PubMed]
  30. Dong, Y.; Huang, Y.C.; Du, J.F.; Zhao, F. Study on Overburden Stability and Development Height of Water Flowing Fractured Zone in Roadway Mining with Cemented Backfill. Shock Vib. 2021, 2021, 1–12. [Google Scholar]
  31. Li, H.J.; Li, J.H.; Li, L.; Xu, H.; Wei, J.J. Prevention of water and sand inrush during mining of extremely thick coal seams under unconsolidated Cenozoic alluvium. Bull. Eng. Geol. Environ. 2020, 79, 3271–3283. [Google Scholar] [CrossRef]
  32. Liu, W.R. Experimental and Numerical Study of Rock Stratum Movement Characteristics in Longwall Mining. Shock Vib. 2019, 2019, 1–15. [Google Scholar] [CrossRef]
  33. Liu, S.G.; Bai, J.B.; Wang, X.Y.; Wu, B.W.; Wang, G.H.; Li, Y.H.; Xu, J. Study on Dynamic Evolution of Roof Crack and Support Timing of Secondary Tunneling for Large Section Open-Off Cut in Deep Mines. Adv. Civ. Eng. 2021, 2021, 1–16. [Google Scholar]
  34. Akcin, H. A GIS-based building risk assessment for the subsidence due to undercity coal mining activities in Zonguldak, Turkey. Arab. J. Geosci. 2021, 14, 1–13. [Google Scholar] [CrossRef]
  35. Kong, D.Z.; Li, Q.; Wang, N.; Wu, G.Y. Analysis on the Breaking Law of Soft and Thick Roof of Fully Mechanized Top-Coal Caving Face. Geotech. Geol. Eng. 2020, 38, 5941–5953. [Google Scholar] [CrossRef]
  36. Ju, J.F.; Xu, J.L. Structural characteristics of key strata and strata behaviour of a fully mechanized longwall face with 7.0 m height chocks. Int. J. Rock Mech. Min. Sci. 2013, 58, 46–54. [Google Scholar] [CrossRef]
  37. Guo, J.; Feng, G.R.; Wang, P.F.; Qi, T.Y.; Zhang, X.R.; Yan, Y.G. Roof Strata Behavior and Support Resistance Determination for Ultra-Thick Longwall Top Coal Caving Panel: A Case Study of the Tashan Coal Mine. Energies 2018, 11, 1041. [Google Scholar] [CrossRef] [Green Version]
  38. Zhu, C.; Yuan, Y.; Yuan, C.F.; Liu, F.Q.; Chen, Z.S.; Wang, S.Z. Study on the structural forms of the key strata in the overburden of a stope during periodic weighting and the reasonable working resistance of the support. Energy Sci. Eng. 2020, 8, 2599–2620. [Google Scholar] [CrossRef] [Green Version]
  39. ABAQUS. Abaqus 2017 User’s Manual; SIMULIA: Providence, RI, USA, 2017. [Google Scholar]
  40. Xu, Z. A Concise Course of Elasticity, 5th ed.; Higher Education Press: Beijing, China, 2016. [Google Scholar]
  41. Liu, S.; Bai, J.; Wang, X.; Yan, S.; Zhao, J. Field and Numerical Study on Deformation and Failure Characteristics of Deep High-Stress Main Roadway in Dongpang Coal Mine. Sustainability 2021, 13, 8507. [Google Scholar] [CrossRef]
  42. Shen, W.L.; Wang, M.; Cao, Z.Z.; Su, F.Q.; Nan, H.; Li, X.L. Mining-Induced Failure Criteria of Interactional Hard Roof Structures: A Case Study. Energies 2019, 12, 3016. [Google Scholar] [CrossRef] [Green Version]
  43. GB50936-2014, Technical Code for Concrete Filled Steel Tubular Structures; China Architecture & Building Press: Beijing, China, 2014.
  44. GB50017-2017, Standard for Design of Steel Structures; China Architecture & Building: Beijing, China, 2017.
  45. Wang, Y.B.; Yin, D.W.; Chen, S.J.; Zhang, L.B.; Liu, D.Y.; Sun, Y.H. Experimental Study on Properties of Rock-Cemented Coal Gangue-Fly Ash Backfill Bimaterials with Different Coal Gangue Particle Sizes. Adv. Civ. Eng. 2020, 2020, 1–12. [Google Scholar] [CrossRef]
  46. Xu, W.; Zhang, Y.; Zuo, X.; Hong, M. Time-dependent rheological and mechanical properties of silica fume modified cemented tailings backfill in low temperature environment. Cem. Concr. Compos. 2020, 114, 103804. [Google Scholar] [CrossRef]
  47. Li, H.; Zhang, Y.; Xu, L.; Jia, X.; Gu, X. Examination of the treatment quality of filling mined-out voids using super-high-water material by the TEM technique. Environ. Earth Sci. 2017, 76, 115. [Google Scholar] [CrossRef]
  48. Zhang, Z.Z.; Deng, M.; Bai, J.B.; Yan, S.; Yu, X.Y. Stability control of gob-side entry retained under the gob with close distance coal seams. Int. J. Min. Sci. Technol. 2021, 31, 321–332. [Google Scholar] [CrossRef]
  49. Li, H.; Zhang, B.Y.; Bai, H.B.; Wu, J.J.; Meng, Q.B.; Xiao, N.; Li, F.; Wu, G.M. Surface Water Resource Protection in a Mining Process under Varying Strata ThicknessA Case Study of Buliangou Coal Mine, China. Sustainability 2018, 10, 4634. [Google Scholar] [CrossRef] [Green Version]
  50. Malinowska, A.; Hejmanowski, R.; Dai, H.Y. Ground movements modeling applying adjusted influence function. Int. J. Min. Sci. Technol. 2020, 30, 243–249. [Google Scholar] [CrossRef]
  51. Yan, W.T.; Dai, H.Y.; Chen, J.J. Surface crack and sand inrush disaster induced by high-strength mining: Example from the Shendong coal field, China. Geosci. J. 2018, 22, 347–357. [Google Scholar] [CrossRef]
  52. Lu, G.D.; Yang, X.G.; Qi, S.C.; Li, X.L.; Ding, P.P.; Zhou, J.W. A generic framework for overpressure generation in sedimentary sequences under thermal perturbations. Comput. Geotech. 2020, 124, 103636. [Google Scholar] [CrossRef]
  53. Liu, X.; Guo, G.; Li, H. Study on Damage of Shallow Foundation Building caused by Surface Curvature Deformation in Coal Mining Area. KSCE J. Civ. Eng. 2019, 23, 4601–4610. [Google Scholar] [CrossRef]
  54. Li, L.; Aubertin, M.; Belem, T. Formulation of a three dimensional analytical solution to evaluate stresses in backfilled vertical narrow openings. Can. Geotech. J. 2005, 42, 1705–1717. [Google Scholar] [CrossRef]
  55. Zhu, X.J.; Guo, G.L.; Wang, J.; Fang, Q.; Chen, T. Analysis of strata and ground subsidence in fully mechanized solid backfilling mining: A case study of Huayuan coal mine. Trans. Inst. Min. Metall. Sect. A Min. Technol. 2016, 125, 233–241. [Google Scholar] [CrossRef]
  56. Zhang, X.S.; Yu, H.C.; Dong, J.Y.; Liu, S.P.; Huang, Z.Q.; Wang, J.X.; Wong, H. A physical and numerical model-based research on the subsidence features of overlying strata caused by coal mining in Henan, China. Environ. Earth Sci. 2017, 76, 1–11. [Google Scholar] [CrossRef]
  57. Chen, Q.; Sun, S.; Liu, Y.; Qi, C.; Zhou, H.; Zhang, Q. Immobilization and leaching characteristics of fluoride from phosphogypsum-based cemented paste backfill. Int. J. Miner. Metall. Mater. 2021, 1–13. [Google Scholar] [CrossRef]
  58. Zhang, F.T.; Wang, X.Y.; Bai, J.B.; Wang, G.Y.; Wu, B.W. Post-peak mechanical characteristics of the high-water material for backfilling the gob-side entry retaining: From experiment to field application. Arab. J. Geosci. 2020, 13, 1–13. [Google Scholar] [CrossRef]
  59. Zhang, J.X.; Li, M.; Taheri, A.; Zhang, W.Q.; Wu, Z.Y.; Song, W.J. Properties and Application of Backfill Materials in Coal Mines in China. Minerals 2019, 9, 53. [Google Scholar] [CrossRef] [Green Version]
  60. Zhang, Z.Z.; Bai, J.B.; Han, Z.T.; Wang, X.Y.; Xu, Y.; Wang, M. Roof mechanics analysis and backfill technology for abandoned roadway. J. Min. Saf. Eng. 2013, 30, 194–198. [Google Scholar]
  61. Wang, E.; Xie, S.R.; Chen, D.D.; Sun, Y.H.; Qi, P.Y. Influence of different loading rates on the mechanics and failure characteristics of high-water-content material. Geomech. Geoengin. 2021, 1–12. [Google Scholar] [CrossRef]
  62. Li, E.; Zhou, J.; Shi, X.; Jahed Armaghani, D.; Yu, Z.; Chen, X.; Huang, P. Developing a hybrid model of salp swarm algorithm-based support vector machine to predict the strength of fiber-reinforced cemented paste backfill. Eng. Comput. 2020, 1–22. [Google Scholar] [CrossRef]
  63. Wu, J.Y.; Jing, H.W.; Meng, Q.B.; Yin, Q.; Yu, L.Y. Assessment of cemented waste rock backfill for recycling gangue and controlling strata: Creep experiments and models. Environ. Sci. Pollut. Res. 2021, 28, 35924–35940. [Google Scholar] [CrossRef] [PubMed]
Figure 1. The study coal mine location and geological conditions. (a) Location of Liangshuijing coal mine and panels layout in the 421 mine area; (b) The mining conditions of 42,115 panel and adjacent panel.
Minerals 11 00945 g001aMinerals 11 00945 g001b
Figure 2. A borehole histogram is displayed in the L7 borehole.
Minerals 11 00945 g002
Figure 3. The monitoring location of hydraulic support.
Minerals 11 00945 g003
Figure 4. Monitoring results of the hydraulic support resistance during mining in 42,114 working face. (a) Resistance of 15# hydraulic support; (b) Resistance of 20# hydraulic support; (c) Resistance of 70# hydraulic support; (d) Resistance of 78# hydraulic support; (e) Resistance of 115# hydraulic support; (f) Resistance of 121# hydraulic support; (g) Resistance of 160# hydraulic support; and (h) Resistance of 168# hydraulic support.
Minerals 11 00945 g004
Figure 5. The relationship and relative location of the yield coal pillar, working face, interchange bridge and the structure backfill area.
Minerals 11 00945 g005
Figure 6. Force model and bending moment diagram of a cantilever beam.
Minerals 11 00945 g006
Figure 7. Force model and bending moment diagram with a fixed-freely-supported beam.
Minerals 11 00945 g007
Figure 8. Solving model of composite beam roof load.
Minerals 11 00945 g008
Figure 9. Finite element model of structural pillars backfill. (a) Global model diagram; (b) Local component diagram.
Minerals 11 00945 g009
Figure 10. Vertical displacement cloud distribution map under different support barricade spacing. (a) Support barricade spacing is 5 m; (b) Support barricade spacing is 5 m; (c) Support barricade spacing is 15 m; and (d) Support barricade spacing is 20 m.
Minerals 11 00945 g010
Figure 11. Wall spacing-maximum settlement of the roof.
Minerals 11 00945 g011
Figure 12. Space mining coordinate system.
Minerals 11 00945 g012
Figure 13. Prediction results of surface deformation after 42,115 working face normal mining. (a) Ground surface subsidence; (b) Ground surface inclination; (c) Ground surface curvature; (d) Ground surface horizontal deformation.
Minerals 11 00945 g013
Figure 14. Prediction results of surface deformation after 42,115 working face backfill mining. (a) Ground surface subsidence; (b) Ground surface inclination; (c) Ground surface curvature; (d) Ground surface horizontal deformation.
Minerals 11 00945 g014
Figure 15. Final value of surface subsidence prediction for normal mining and backfill mining.
Minerals 11 00945 g015
Figure 16. Full stress strain curve of high-water materials.
Minerals 11 00945 g016
Figure 17. Curve of the support resistance of 42,115 working face under the interchange bridge area. (a) Resistance of 80 # hydraulic support; (b) Resistance of 90# hydraulic support.
Minerals 11 00945 g017
Table 1. Periodic pressure characteristic value of 42,114 working face monitoring area.
RemarkHSnMShsec/MPa P t ¯ / MPa σ P / MPa PPC/MPaPPD/m
Upper area15#32.125.202.2127.4114.5, 19
20#33.025.142.1027.2414, 17
Middle area70#42.925.043.8828.9220
78#43.124.453.2527.6718.8
115#41.225.113.5128.6220
121#42.524.813.4329.2419.8
Lower area160#30.925.022.1427.1613, 17
168#33.724.522.5027.0215, 16
HSn—Hydraulic support number; MShsec—Maximum working resistance of hydraulic support at the end of cycle; P t ¯ —Average working resistance of hydraulic support at the end of cycle; σ P —The variance of the mean value of the resistance of the hydraulic support at the end of the cycle; PPC—Periodic pressure criterion; PPD—Periodic pressure distance.
Table 2. Initial roof support parameters in the backfill area.
Support MaterialsParametersRequirementsRemarks
Rock boltsDiameter/lengthΦ 18 mm × L 1800 mmScrew thread steel
Spacing and row spacing1000 mm, 800 mm
Tray140 mm × 250 mm × 10 mm
W-shaped steel tray
Anchorage agentMSCK 23/80 mm
Anchor cablesDiameter/lengthΦ 15.24 × L 7500 mm Mine anchor cables
Spacing and row spacing2000 mm, 1600 mm
Tray300 mm × 300 mm × 16 mm dished tray
Anchorage agentMSCK23/60 mm + MSZ23/80 mm
Rhombic metal meshSpecification8#Two pieces lapped by 100 mm
Length2800 mm
Width1000 mm
Hydraulic supportSpecificationZY12000/20/40D
Support height2000~4000 mm
Center distance1750 mm
Rated working resistance12,000 kN
Rated initial support force7917 kN
Backfill hydraulic supportSpecificationZZC10000/20/40
Support height2000~4000 mm
Center distance1500 mm
Rated working resistance10,000 kN
Rated initial support force8322 kN
Single hydraulic propSpecificationDW31.5-300/100
Maximum support height3500 mm
Rated working resistance200 kN
Spacing1000 mm
Table 3. Parameters of Φ 500 mm L 4000 mm pillars in structural filling.
MaterialsStrength GradeDiameterLengthUltimate Bearing
Capacity
SpacingRow Spacing
ConcreteC35500 mm4000 mm10,200 kN44
Table 4. The parameters of different types of pillars.
MaterialsStrength
Grade
Diameter
(mm)
Length
(mm)
Ultimate Bearing
Capacity (kN)
Spacing
(m)
Row Spacing
(m)
Cost *
(CNY)
Weight
(kg/each)
ConcreteC60800400028,1506.5739004040
ConcreteC40800400024,50066.538604006
ConcreteC35800400023,0004438304001
ConcreteC60500400011,50044.518801660
ConcreteC40500400010,90044.418701643
ConcreteC35500400010,2004418501641
Cost *—The value is the project cost of the pillars, which is different from the cost in the Section 5.3 (considering the cost of surface transportation and underground transportation) of the calculation of economic benefits.
Table 5. Dynamic maximum evolution value of surface subsidence prediction between normal mining and backfill mining.
Mining MethodLocationTilt
(mm/m)
Curvature
(mm/m2)
Horizontal Deformation
(mm/m)
Normal miningSouth30−0.5~0.5−14~14
North25−0.4~0.4−12~12
Backfill miningSouth3.5−0.05~0.05−1.5~1.5
North3.0−0.05~0.05−1.3~1.3
Table 6. Mineral composition of ingredient A.
Mineral Composition3CaO·3Al2O3·CaSO42CaO·SiO24CaO·Al2O3·Fe2O3
Content/%3~1330~481~3
Table 7. The cost of using the structure backfill method.
ItemSum NumberPriceCost/CNY
MaterialsRock bolts230036 CNY/series *82,800
Anchor cable500135 CNY/series * 67,500
Metal mesh2000 m217 CNY/m234,000
High-water materials2700 t2150 CNY/t5,805,000
EquipmentBackfill hydraulic support40650,000 CNY/each-
Hydraulic support40486,000 CNY/each-
Difference between hydraulic support-16,400 CNY/each65,600
Two-fluid grouting pump2350,000 CNY/each700,000
Mixing drum425,000 CNY/each100,000
PillarsPrecast concrete column11,0002100 CNY/each23,100,000
Backfill working faceWorker1320 days300 CNY/day396,000
High-water materials66,000 t2150 CNY/t141,900,000
Sum172,250,900
* A series of rock bolt contains the anchorage agent and tray; A series of anchor cable contains the anchorage agent, anchor lock and tray.
Publisher’s Note: MDPI stays neutral with regard to jurisdictional claims in published maps and institutional affiliations.

