Article

Ancient Pigments in Afrasiab Murals: Characterization by XRD, SEM, and Raman Spectroscopy

1
Conservation Science Division, National Research Institute of Cultural Heritage, Daejeon 34122, Korea
2
Planning and Coordination Division, National Research Institute of Cultural Heritage, Daejeon 34122, Korea
*
Author to whom correspondence should be addressed.
Minerals 2021, 11(9), 939; https://doi.org/10.3390/min11090939
Submission received: 5 August 2021 / Revised: 23 August 2021 / Accepted: 25 August 2021 / Published: 29 August 2021
(This article belongs to the Special Issue Colours in Minerals and Rocks)

Abstract

:
The Afrasiab murals discovered in the northeast of Samarkand, Uzbekistan—the center of the ancient Silk Road—are presumed to date to the mid-seventh century during the Sogdian era. Although previous studies have examined the primary materials of the pigments used in these murals using chemical and microscopic analyses, in-depth investigations of the pigment raw material composition have not been conducted to verify the results of these studies. We applied X-ray diffractometry, Raman spectroscopy, and scanning electron microscopy in conjunction with energy-dispersive X-ray spectroscopy for the first time to identify the raw materials of ancient pigments in fragments obtained from the Afrasiab murals. The results show that lazurite, cinnabar, and amorphous carbon were used as blue, red, and black pigments, respectively. Moreover, we identified that pigments were not directly painted on the wall surface; instead, they were painted on a white undercoat of gypsum plaster, similar to other ancient Silk Road wall paintings. The results of this study can benefit the provision of more accurate information with regard to the composition of raw materials and further support the selection of appropriate substances for the purposes of conservation and restoration of Afrasiab murals.

1. Introduction

The Afrasiab murals [1] were discovered in 1965 in the vast palace site northeast of Samarkand, Uzbekistan, and they are currently curated and preserved in the Afrasiab Museum of Samarkand (Figure 1). The murals were located on the west, south, north, and east walls of the house and depict a wide range of content [2,3,4,5,6,7,8]. The southern wall mural is filled with a theme of the ancient Iranian world, Samarkand—a religious funerary procession in honor of the ancestors during the Nowruz festival. In addition, the northern wall mural represents ancient China—a Chinese festival, the Empress on a boat, and the Emperor hunting. Moreover, the much-destroyed eastern wall mural is interpreted as a depiction of ancient India—as the land of the astrologers and of the pygmies.
The topic on the main wall—the western wall facing the entrance—is debated among experts [2,3,4,5,6,7,8,9,10]. Kökturk soldiers are escorting ambassadors coming from various countries of the world—assumed to be ancient Korea, China, Iran, etc. According to the inscriptions on the west wall paintings—on which ambassadors from several countries appear—Afrasiab murals are assumed to date back to the mid-seventh century during the Sogdian era, showing that Samarkand was the thriving commercial center in the middle of the Silk Road [9,10].
Since their discovery, Afrasiab murals have undergone several restorative treatments [11,12]. Furthermore, until recently, active research was undertaken, including a digital restoration project—a collaborative effort between the Northeast Asian History Foundation of Korea and the Afrasiab Museum of Samarkand [13]. In addition, previous studies examined the primary materials of the pigments used in these murals through chemical and microscopic analyses [11,13]. However, a thorough investigation of the raw material composition of the pigments, complementing the results of existing studies, has not yet been conducted.
In general, studies that investigate the types of materials and technology used in creating the ancient murals employ techniques such as Raman spectroscopy, Fourier-transform infrared spectroscopy (FT-IR), scanning electron microscopy plus energy-dispersive X-ray spectroscopy (SEM-EDS), and X-ray diffractometry (XRD) to identify pigments and organic materials used in conservation treatments [14,15,16,17,18,19]. In particular, in recent years, nondestructive analytical methods based on portable X-ray fluorescence (P-XRF) spectrometry, particle-induced X-ray emission (PIXE), and false-color infrared imaging (FCIR), combining spectrophotometric colorimetry and spectral analysis, have been improved and applied to research on murals [13,20,21,22,23,24,25,26,27,28,29,30]. These techniques are noninvasive and, therefore, allow us to obtain the composition of the main elements on the sample surfaces at several points, as well as create maps. However, analyses using these types of nondestructive methods can sometimes be prone to errors due to the conservation of the painting, the presence of impurities, and incorrect identification of the mineral (in particular, polymorphs); therefore, careful interpretation of the results is required [13,31].
This study was aimed at accurately identifying the raw materials of each color pigment used in Afrasiab murals by applying XRD, Raman spectroscopy, and SEM-EDS; these techniques were applied in the investigations of this archaeological site for the first time. Furthermore, the results of this study can be used not only to provide accurate information on the mineral composition of raw materials but also for the selection of substances suitable for conservation treatments and restoration of Afrasiab murals; this will potentially facilitate a scholastic exchange between relevant fields.

2. Materials and Methods

2.1. Materials

As shown in Figure 2a, three fragments provided by the Ministry of Culture of Uzbekistan were used for the investigation; two were painted blue and red, whereas one had a black line. As can be observed from Figure 1, the blue specimen was presumably a fragment from a blue background. In contrast, the red specimen was potentially a fragment from a red area in any of the Afrasiab murals (such as the garment of a character in Figure 1, silk offered to the king, or the boat of a Chinese ambassador depicted on the north wall). The black line was painted thinly against a yellow background and was presumed to be part of the outline of a character or an object.
After surface inspection, a small amount of powder was collected from each specimen. Polished specimens were subsequently prepared for cross-section analysis. In addition, residual soil was observed underneath the red specimen, which presumably flaked off from a wall (Figure 2b); its powder was also collected for analysis.

2.2. Methods

The distribution pattern of the pigment particles on the surfaces of the fragments was observed using an optical microscope (AXIO Imager A2m, Zeiss, Oberkochen, Germany).
XRD patterns were recorded using powdered samples, with a Cu-Kα diffractometer (Empyrean, Malvern Panalytical, Malvern, UK), which scanned in the 2θ range 5–60° at 45 kV/40 mA, with a scanning interval of 0.02° (2θ).
Raman spectroscopy was performed using a multifunctional Raman spectroscopy system (XperRam F2.8, NanoBase, Seoul, Korea) to examine the spectral properties of the pigment particles on the bulk fragments. For the analysis conditions, a 473 nm laser and a 633 nm laser were used in conjunction with a 40× lens (OLYMPUS, Tokyo, Japan), and the measurement range was set to 100–2400 cm−1. To prevent damage, laser wavelength, luminous intensity, and exposure time were adjusted for measurements according to the type and condition of the samples. The measured Raman spectra were then compared to Raman data from the RRUFF project [32].
SEM-EDS was conducted on cross-section samples using a JSM-IT300 (JEOL, Tokyo, Japan). The SEM-EDS analysis of particulate distribution was completed after platinum-coating the samples, to identify the chemical composition.

3. Results and Discussion

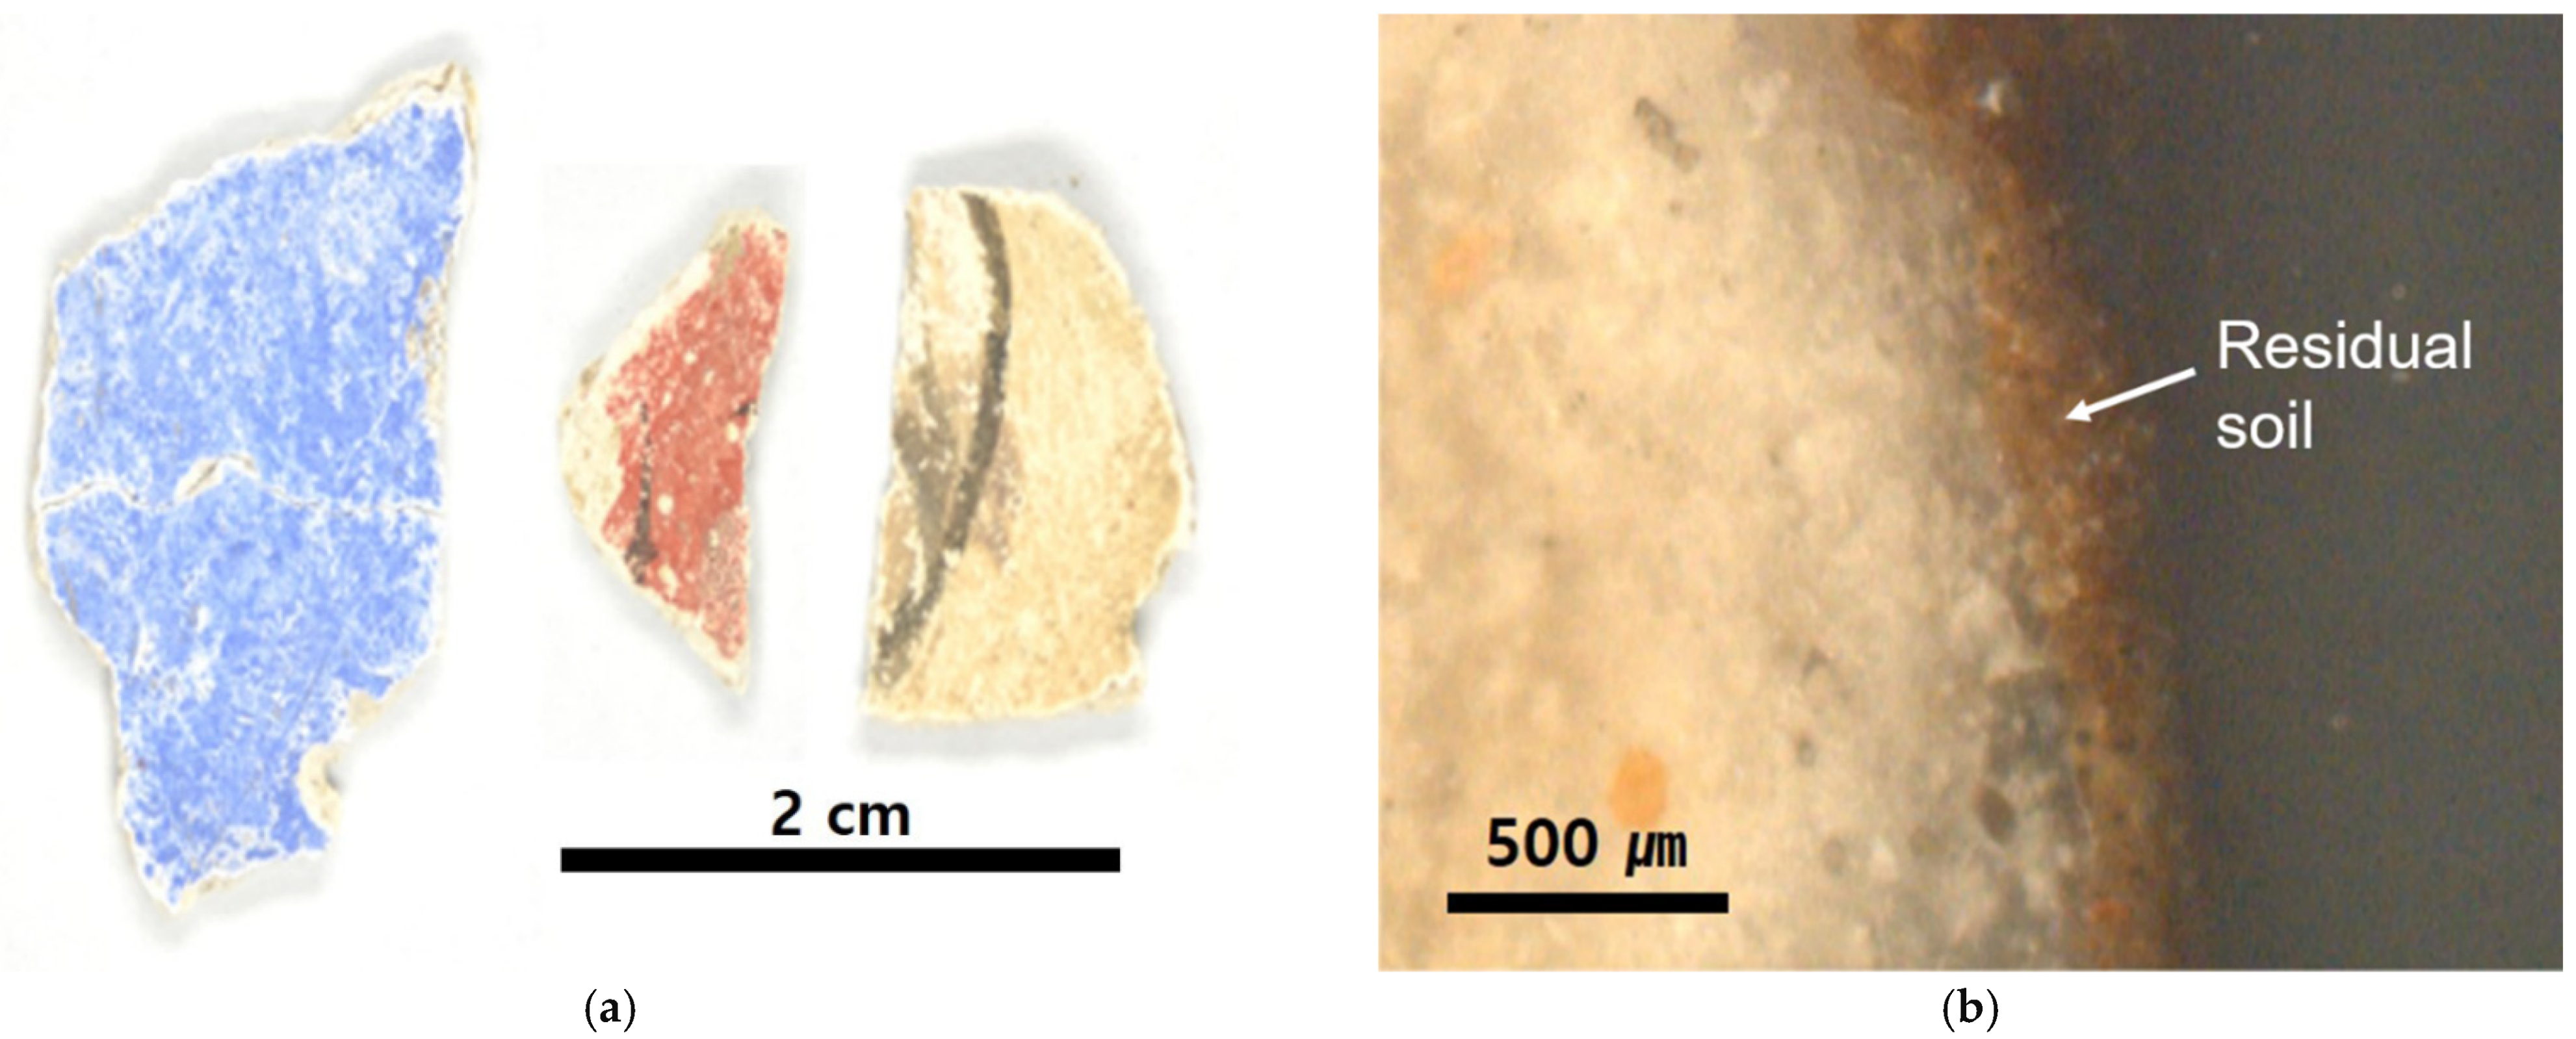
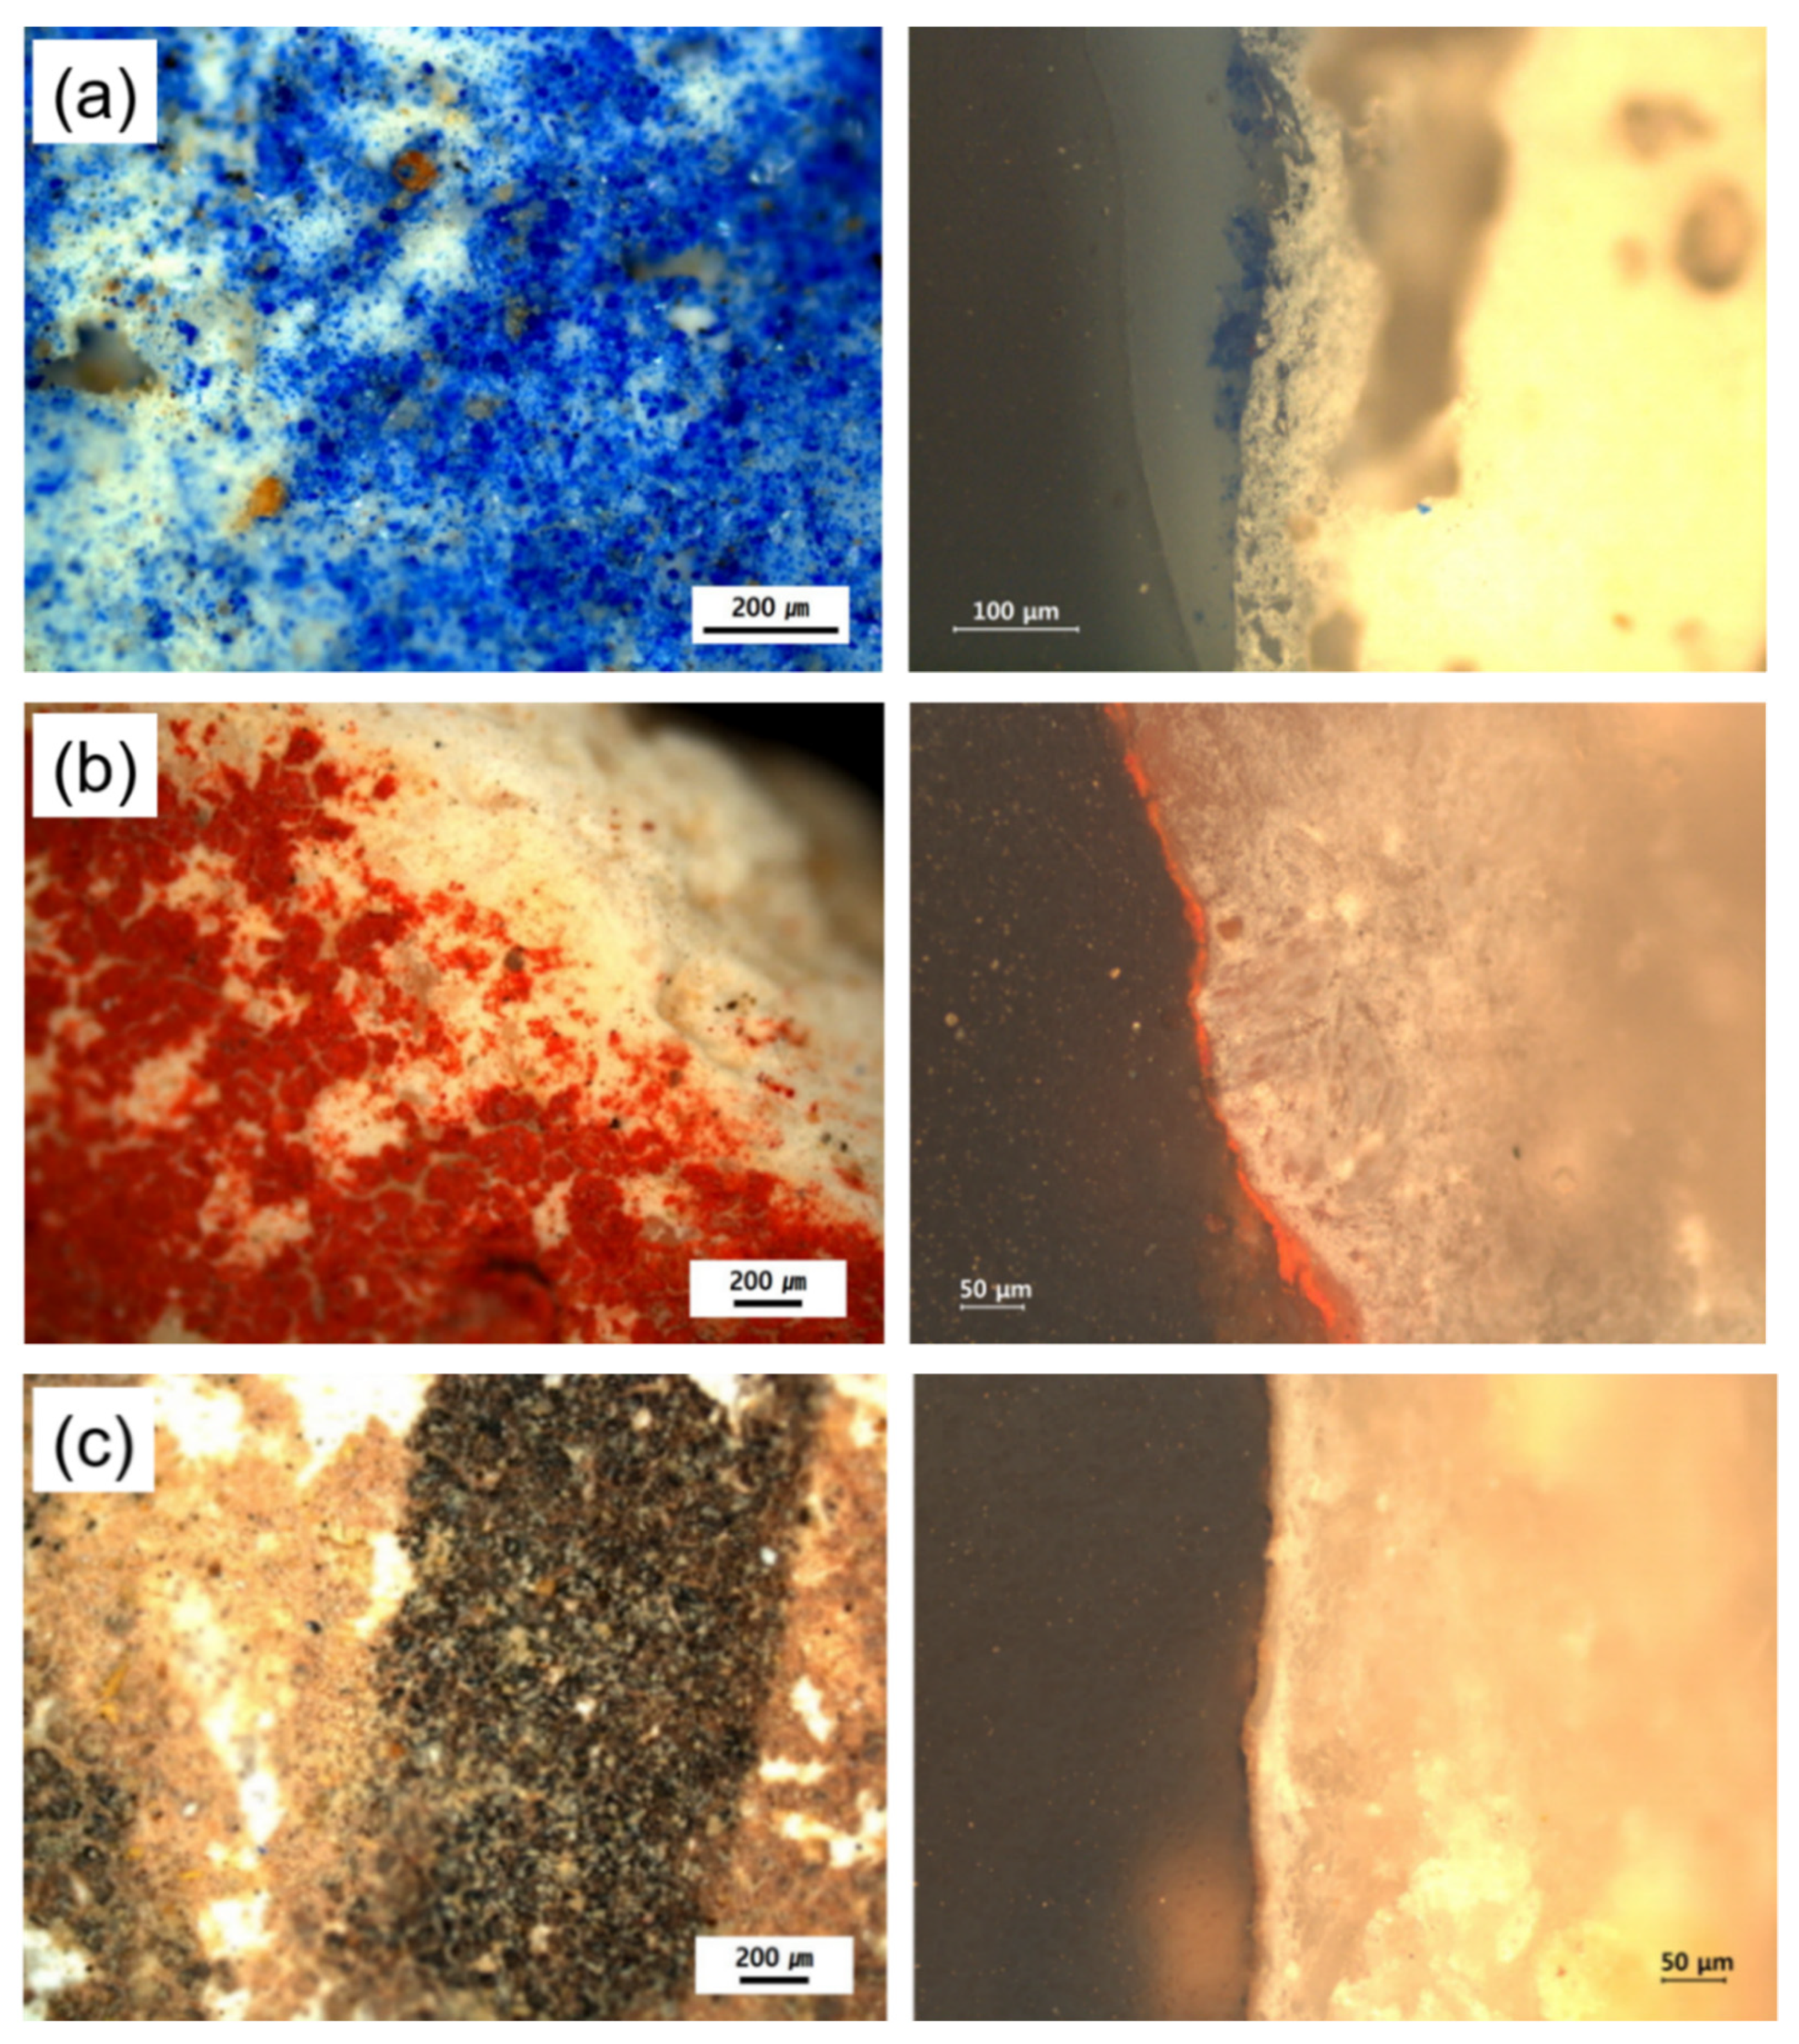
3.1. Microscopic Observation

The distribution patterns of the pigment layers were examined microscopically. For the blue and red pigment layers, we observed that the pigments were painted on top of a white ground layer (Figure 3a,b). For the black pigment layer, the pigment was painted on yellow (yellow brown) particles distributed on a white primer (Figure 3c). In addition, the thickness of the colored layer observed in the cross-section was about 20 μm and 10 μm for the blue and red pigment layers, respectively. In the case of the black pigment, a very thin layer was observed on top of the yellow-brownish layer with a thickness of about 10 μm.

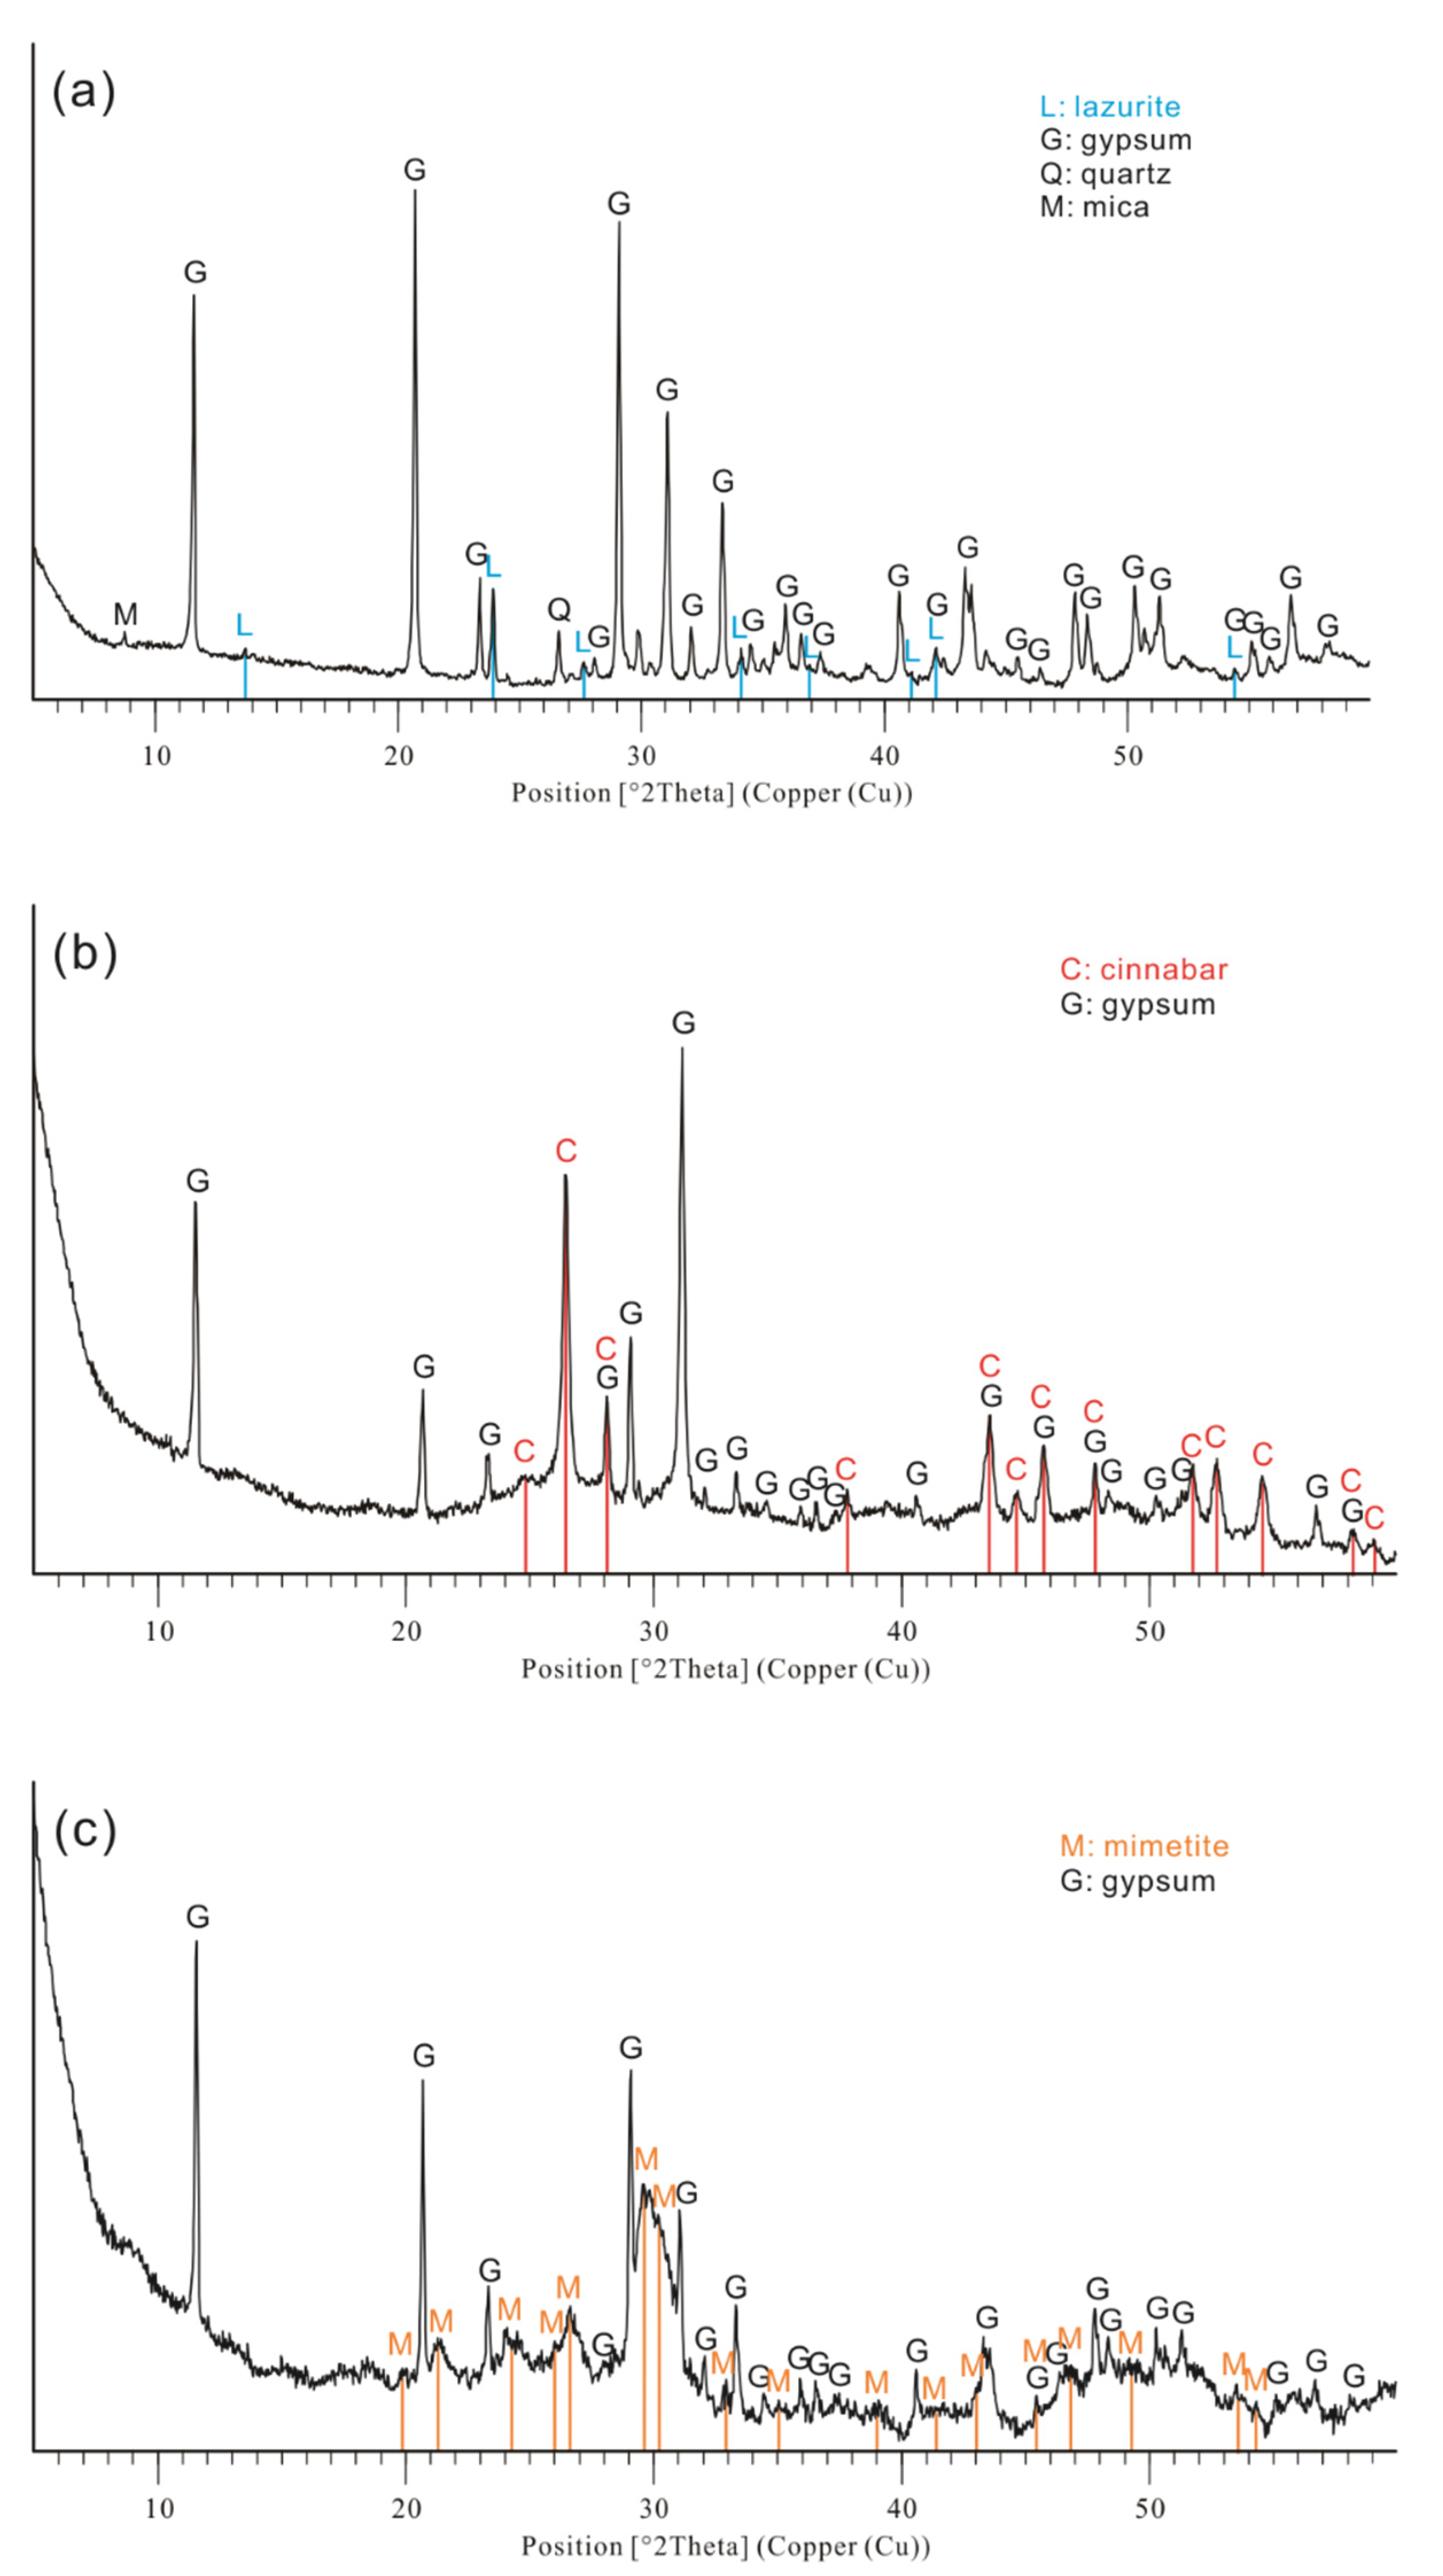
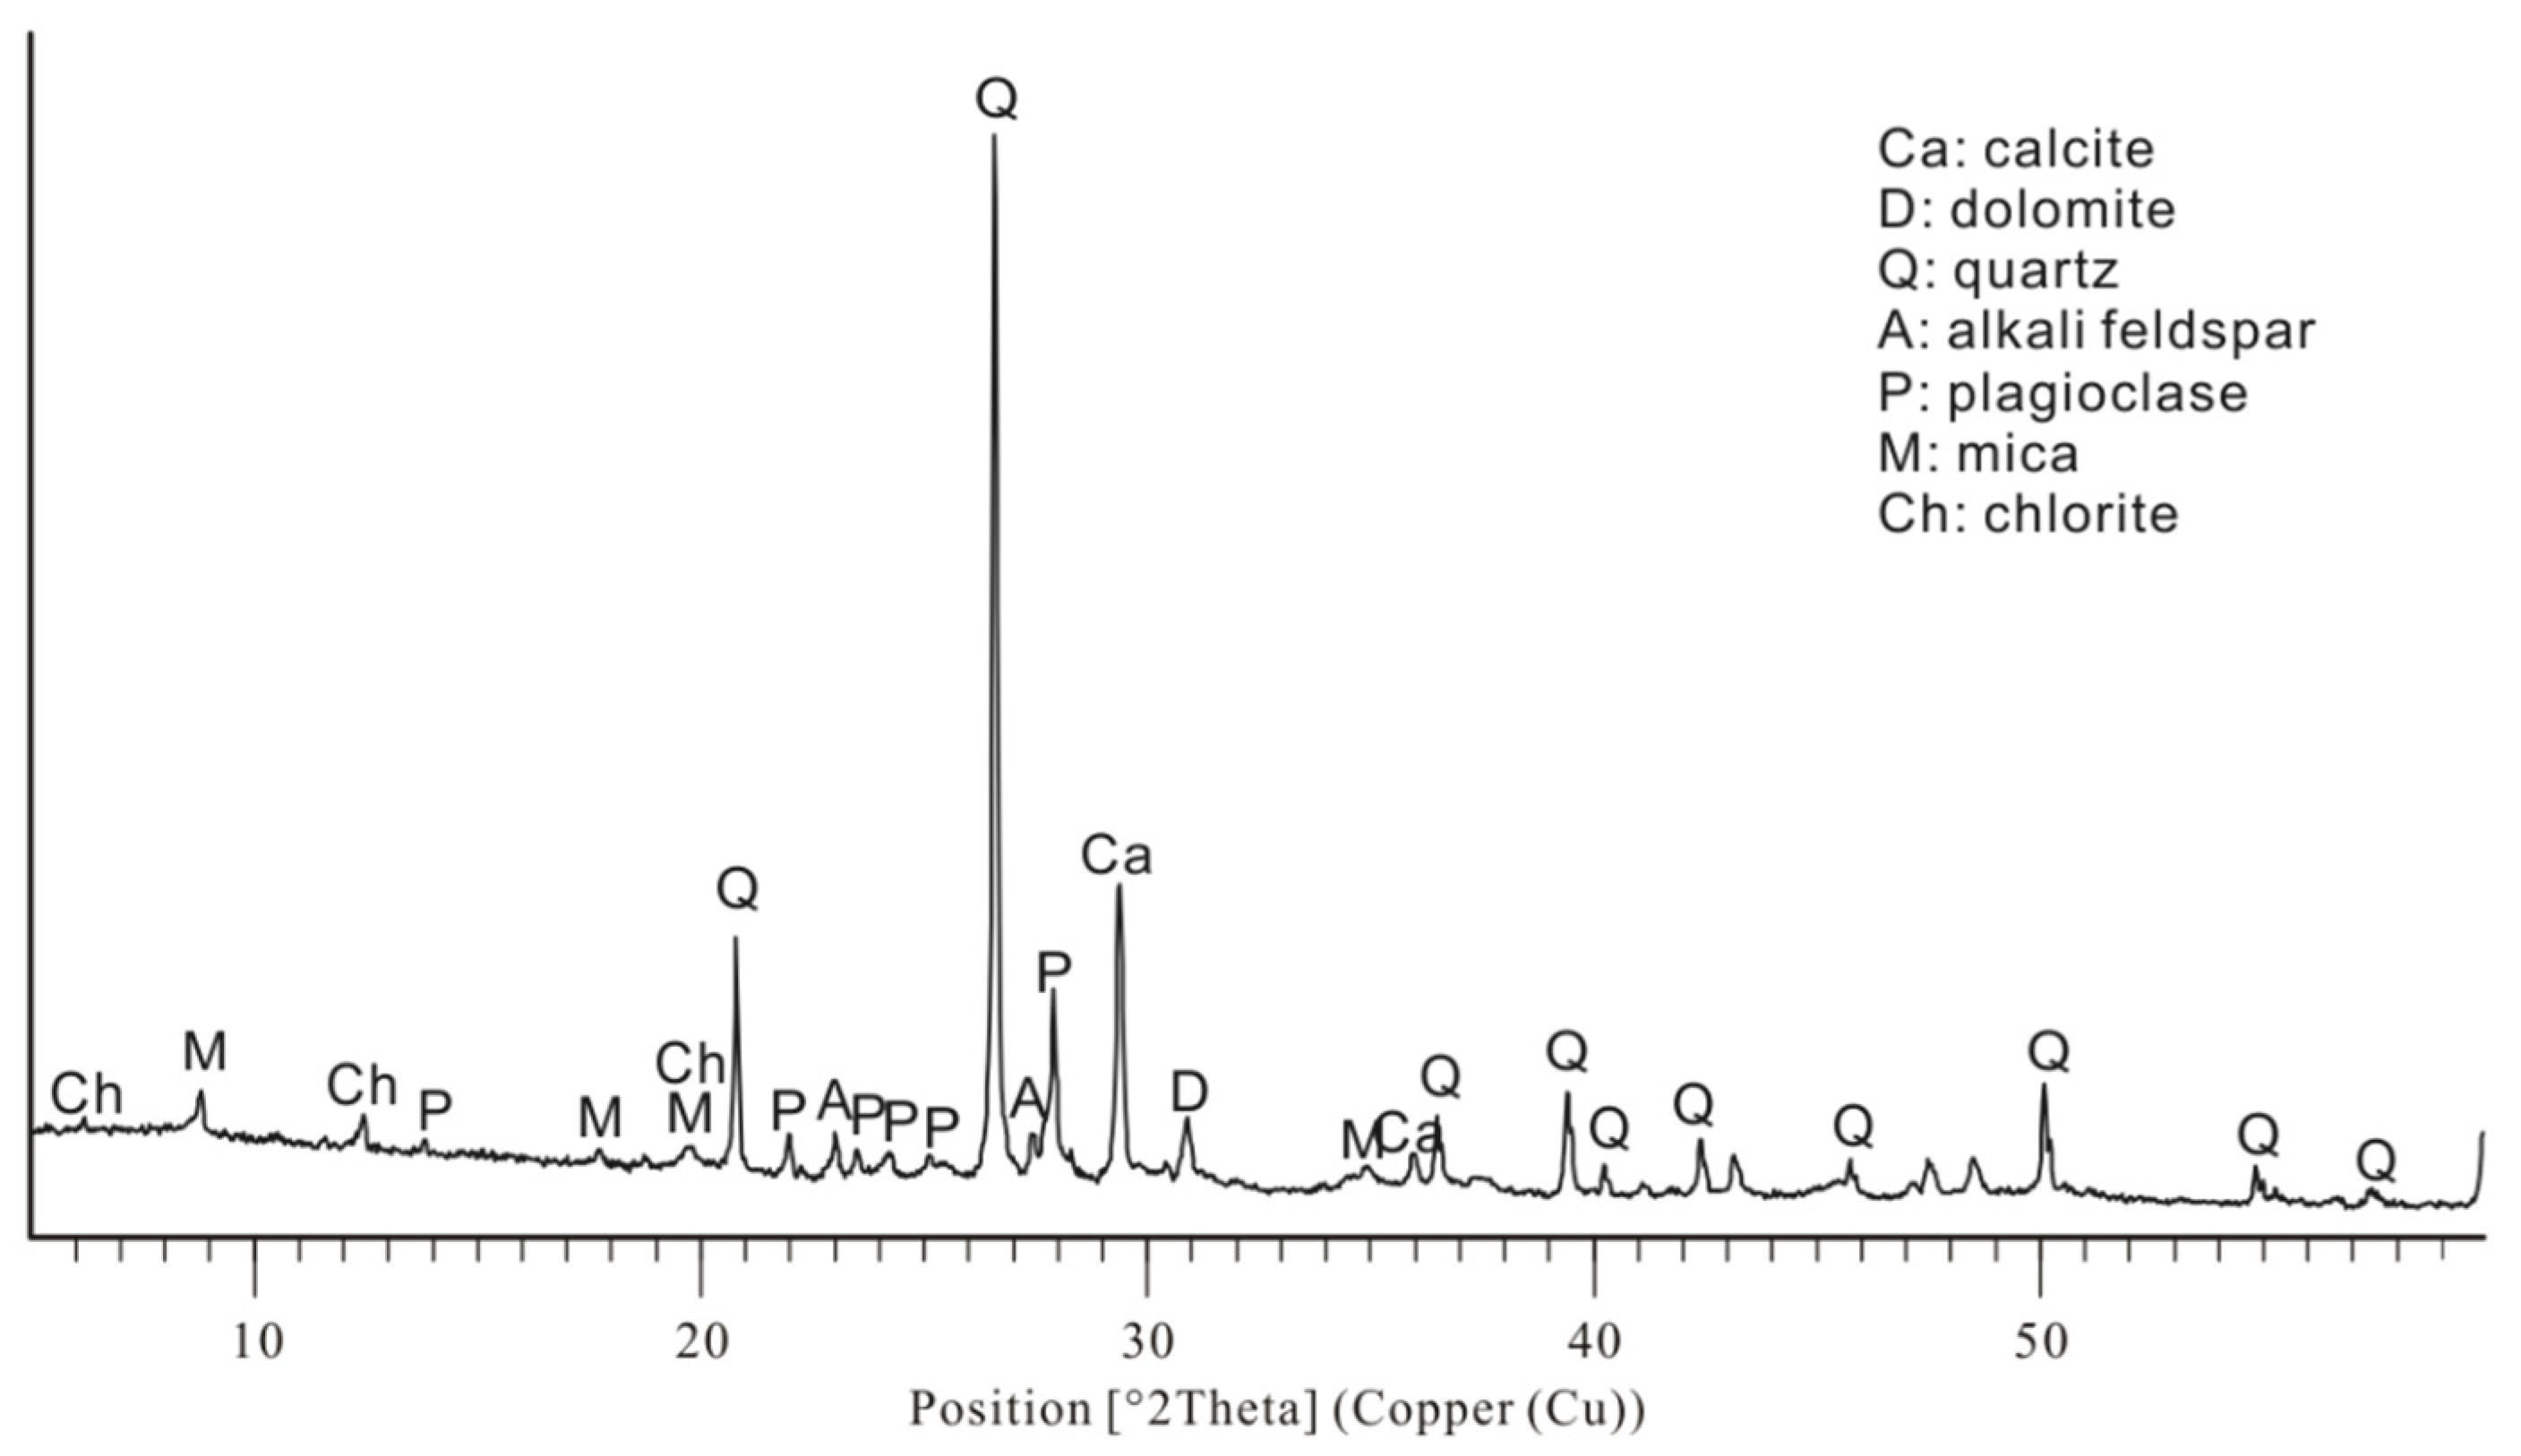
3.2. X-ray Diffractometry

The results of XRD for each specimen are illustrated in Figure 4. In all colored specimens, gypsum, which was considered to be a component of the white ground layer, was identified. In addition, lazurite and cinnabar peaks were observed in the blue and red specimens, respectively. Moreover, the blue-colored layer was confirmed as containing small amounts of quartz and mica as impurities in the lazurite ore. These results are consistent with those of previous studies that identified minerals by analyzing the chemical composition of pigments [11,13]. Gypsum, lazurite, and cinnabar, which were identified as base minerals for the white, blue, and red pigments, respectively, have been used as raw materials for pigments in various cultures and regions along the Silk Road [16,33,34,35,36,37].
In the case of the black specimen, the diffraction pattern of mimetite, a mineral containing lead, was recorded, as shown in Figure 4c. This mineral has reportedly been used as a yellow and yellow-brown pigment in Central Asian and Egyptian cultures [38,39,40].
However, mimetite has not been previously reported in Afrasiab murals and was, therefore, analyzed for the first time in this study. The mimetite reported in present study is thought to be the mineral composition of the yellow or yellow-brown particles under the black painted layer observed in Figure 3c. In addition, previous studies on Afrasiab murals estimated that charcoal-based amorphous carbon was used as a raw material for black pigments [12,13]. However, since amorphous carbon is non-crystalline and, as such, cannot be identified by XRD analysis, an alternative approach is required for its investigation, such as Raman spectroscopic analysis.
In addition, minerals such as quartz, plagioclase, alkali feldspar, mica, and chlorite, as well as constituents of limestone, such as calcite and dolomite, were detected in the residue collected underneath the red specimen (Figure 5). On the basis of these findings, it can be confirmed that the Afrasiab mural was painted on top of a lime-plastered wall made of a mixture of soil and limestone. This lime-plastered wall was estimated to contain a higher proportion of soil than limestone, according to the relative area of the X-ray diffraction pattern. Furthermore, quartz was identified as the most abundant mineral in the soil, and the limestone was considered to be a calcite-rich type with a higher amount of calcite than dolomite.

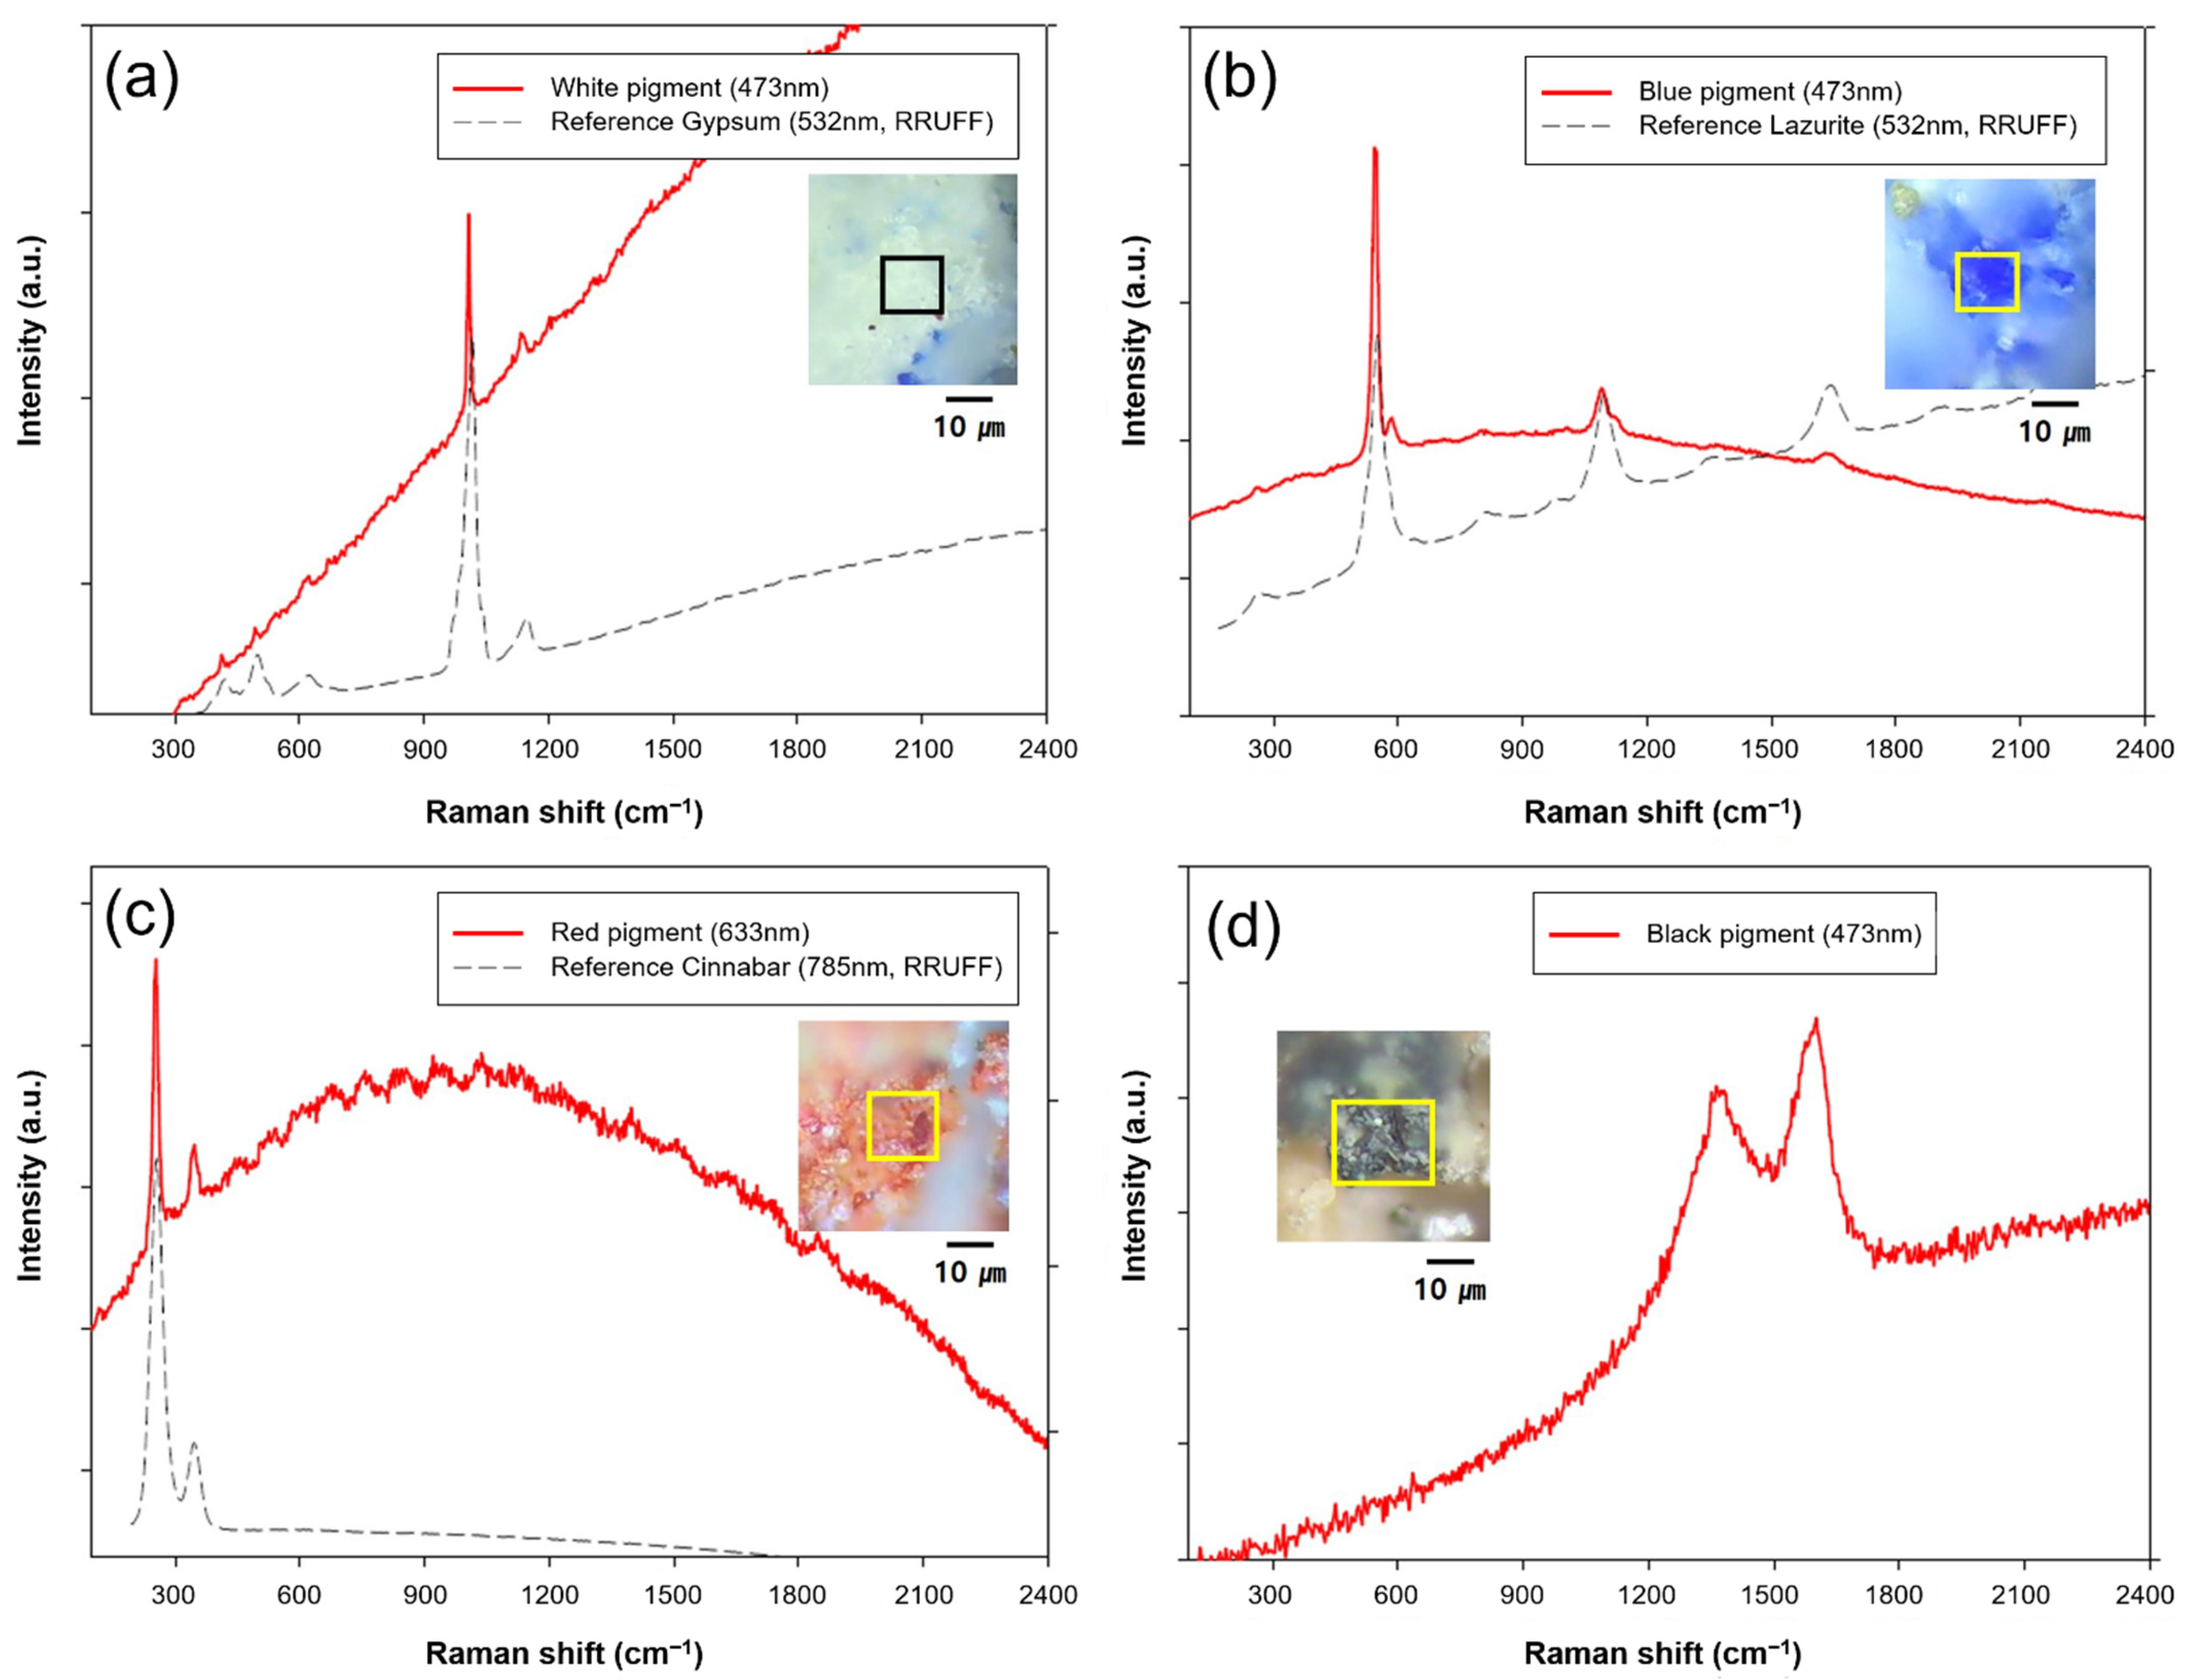
3.3. Raman Spectroscopy

As shown in Figure 6a, the Raman spectra of the white specimen of the ground layer presented a strong peak at 1008 cm−1. This peak was almost identical to the symmetric stretching of SO4 tetrahedra, the strongest Raman spectral peak of gypsum; as such, the white ground layer was confirmed as gypsum. For the blue pigment particles, characteristic peaks were observed at 545, 586, and 1088 cm−1; these were almost identical to the Raman shifts of lazurite (Figure 6b). As for the red pigment particles, characteristic Raman peaks were identified at 253 and 344 cm−1, confirming that the red pigment was cinnabar (Figure 6c). As such, the results of Raman spectroscopy on the white, blue, and red pigments were consistent with the XRD results.
For the black particles, from the observation of a broad band comprising two peaks at 1320–1360 and 1500–1600 cm−1 (Figure 6d), the particles were identified as carbon black—which was not detected via XRD [41,42,43]. This result confirms that charcoal-based amorphous carbon was used in the black pigment, consistent with the assumptions of previous studies [12,13].

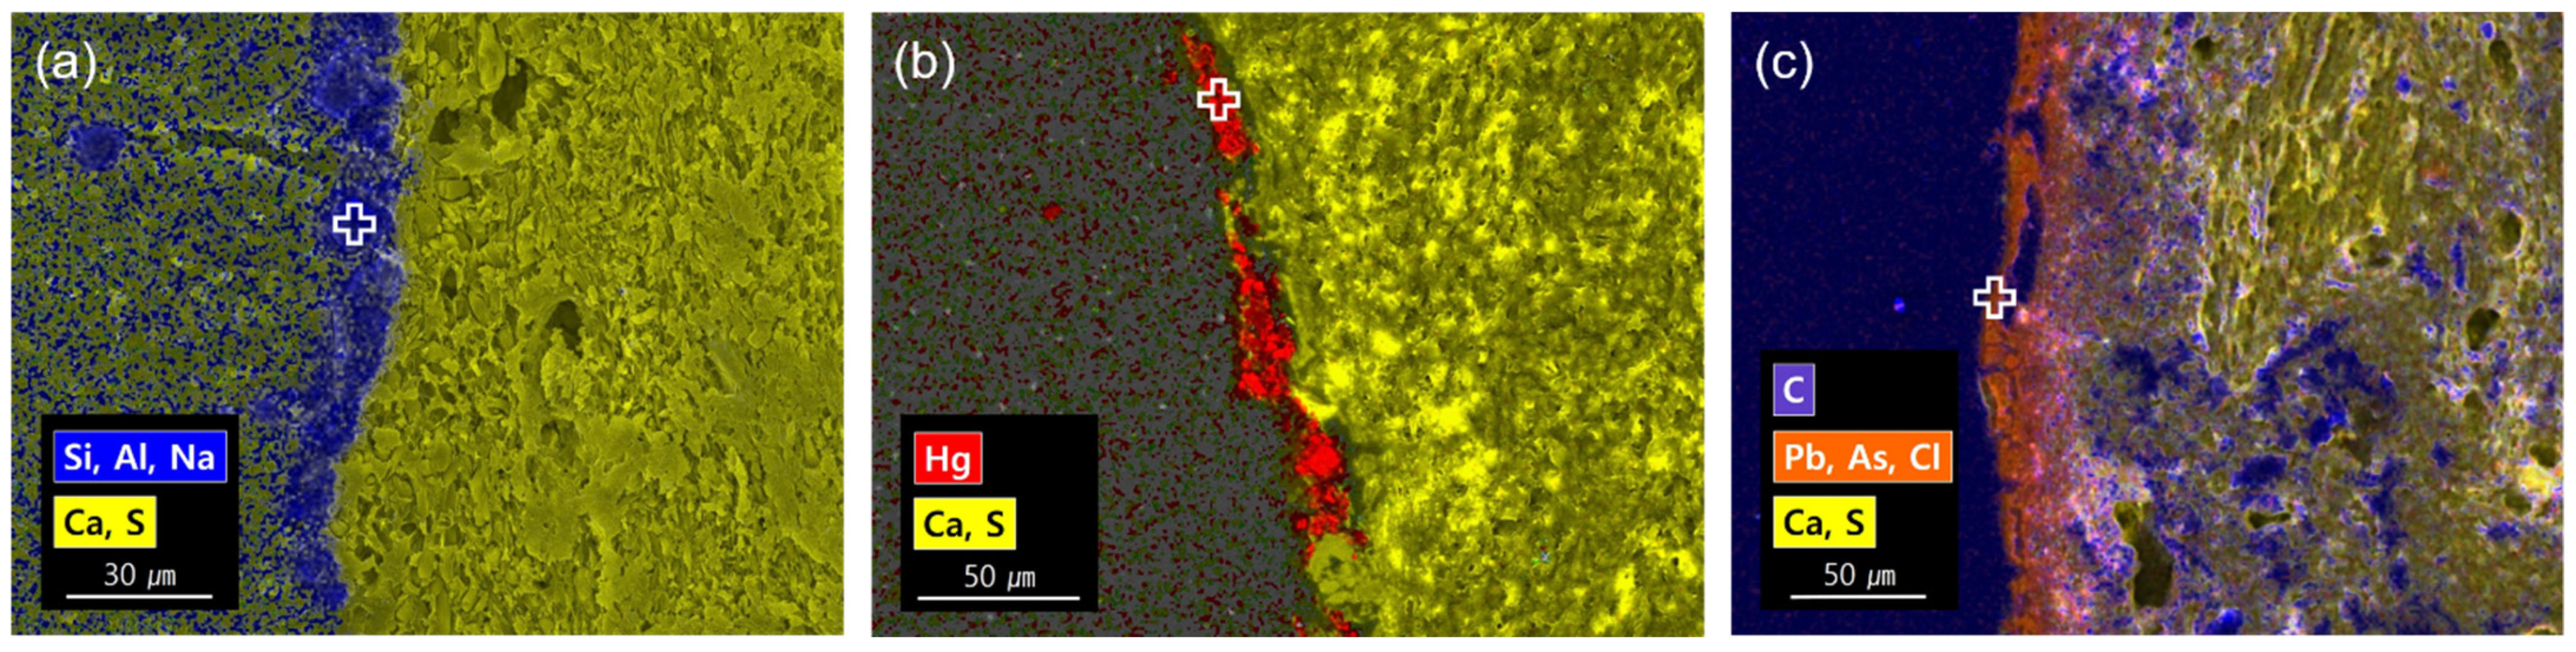
3.4. SEM-EDS Mapping

The analysis of the elemental distribution through SEM-EDS mapping showed that the pigment layers were all painted on a gypsum (CaSO4·2H2O) surface. The mapping clearly revealed the distribution of calcium and sulfur on the gypsum surface (Figure 7).
In the blue specimen, the lazurite ((Na,Ca)8(Al6Si6O24)(S,Cl,SO4,OH2)) layer was identified through the observed distribution of silicon, aluminum, and sodium (Figure 7 and Table 1). Likewise, in the red specimen, the cinnabar (HgS) layer was distinguished through the mapped distribution of mercury (Figure 7 and Table 1). Furthermore, for the surface carbon-painted layer in the black specimen, the raw material that was identified as amorphous carbon through Raman spectroscopy (Figure 6d) could not be distinguished through SEM-EDS owing to the penetration of the epoxy resin used in fabricating the cross-sectional specimen (Figure 7). However, the identification of the mimetite (Pb5(AsO4)3Cl) layer was possible by analyzing the distribution of lead, arsenic, and chlorine (Figure 7 and Table 1).
From the above results, it can be concluded that lazurite, cinnabar, and amorphous carbon, which were raw materials for blue, red, and black pigments, respectively, were painted on top of the white ground layer plastered using gypsum. This painting technique has been commonly reported in murals in caves and buildings distributed across the regions crisscrossed by the ancient Silk Road [16,19,33,34,35,36], and the results of this study confirm that the same techniques were applied to the Afrasiab mural.

4. Conclusions

In this study, XRD, Raman spectroscopy, and SEM-EDS were applied for the first time on specimens—painted with blue, red, and black pigments—collected from an Afrasiab mural from Samarkand, the melting pot of world cultures on the ancient Silk Road. Consequently, we successfully identified the raw materials of each pigment. Previously, the characteristics of these raw materials were only hypothesized on the basis of analyses of the chemical composition and the observations of the particles. Additionally, the coloring techniques of the mural were examined using the results obtained.
We confirmed that, on Afrasiab murals, gypsum was used as a priming coat on lime-plastered wall; each pigment was then painted on top of the gypsum ground layer. For the blue and red specimens, the analysis results confirmed that the surfaces were colored using lazurite and cinnabar, respectively. For the black specimen, the black line was colored on top of a pale yellow (mimetite) surface using a black substance composed of amorphous carbon.
The raw materials of each pigment and the technique of painting on top of the white gypsum ground layer, which were identified in this study, indicate that the characteristics of murals distributed along the ancient Silk Road were also present on the Afrasiab murals. In the future, more precise analysis and interpretation will be possible if further research is performed on specimens with a greater variety of colors and on a larger scale.

Author Contributions

Conceptualization, D.-H.M. and E.-W.L.; methodology, D.-H.M., N.-R.L. and E.-W.L.; validation, D.-H.M., N.-R.L. and E.-W.L.; formal analysis, D.-H.M.; investigation, E.-W.L.; resources, E.-W.L.; data curation, D.-H.M. and N.-R.L.; writing—original draft preparation, D.-H.M., N.-R.L. and E.-W.L.; writing—review and editing, D.-H.M., N.-R.L. and E.-W.L.; visualization, D.-H.M. and N.-R.L.; supervision, E.-W.L. and D.-H.M.; project administration, E.-W.L.; funding acquisition, E.-W.L. All authors have read and agreed to the published version of the manuscript.

Funding

This study was supported by the National Research Institute of Cultural Heritage as a part of the Cultural Heritage Research and Development program (NRICH-2005-C31F-1).

Acknowledgments

We acknowledge that the mural specimens used in this study were provided as part of the ODA project based on the Memorandum of Understanding (19 April 2019) signed by the Cultural Heritage Administration of Korea and Ministry of Culture of Uzbekistan, and we hereby express our gratitude for the support.

Conflicts of Interest

The authors declare no conflict of interest. The funders had no role in the design of the study; in the collection, analyses, or interpretation of data; in the writing of the manuscript, or in the decision to publish the results.

References

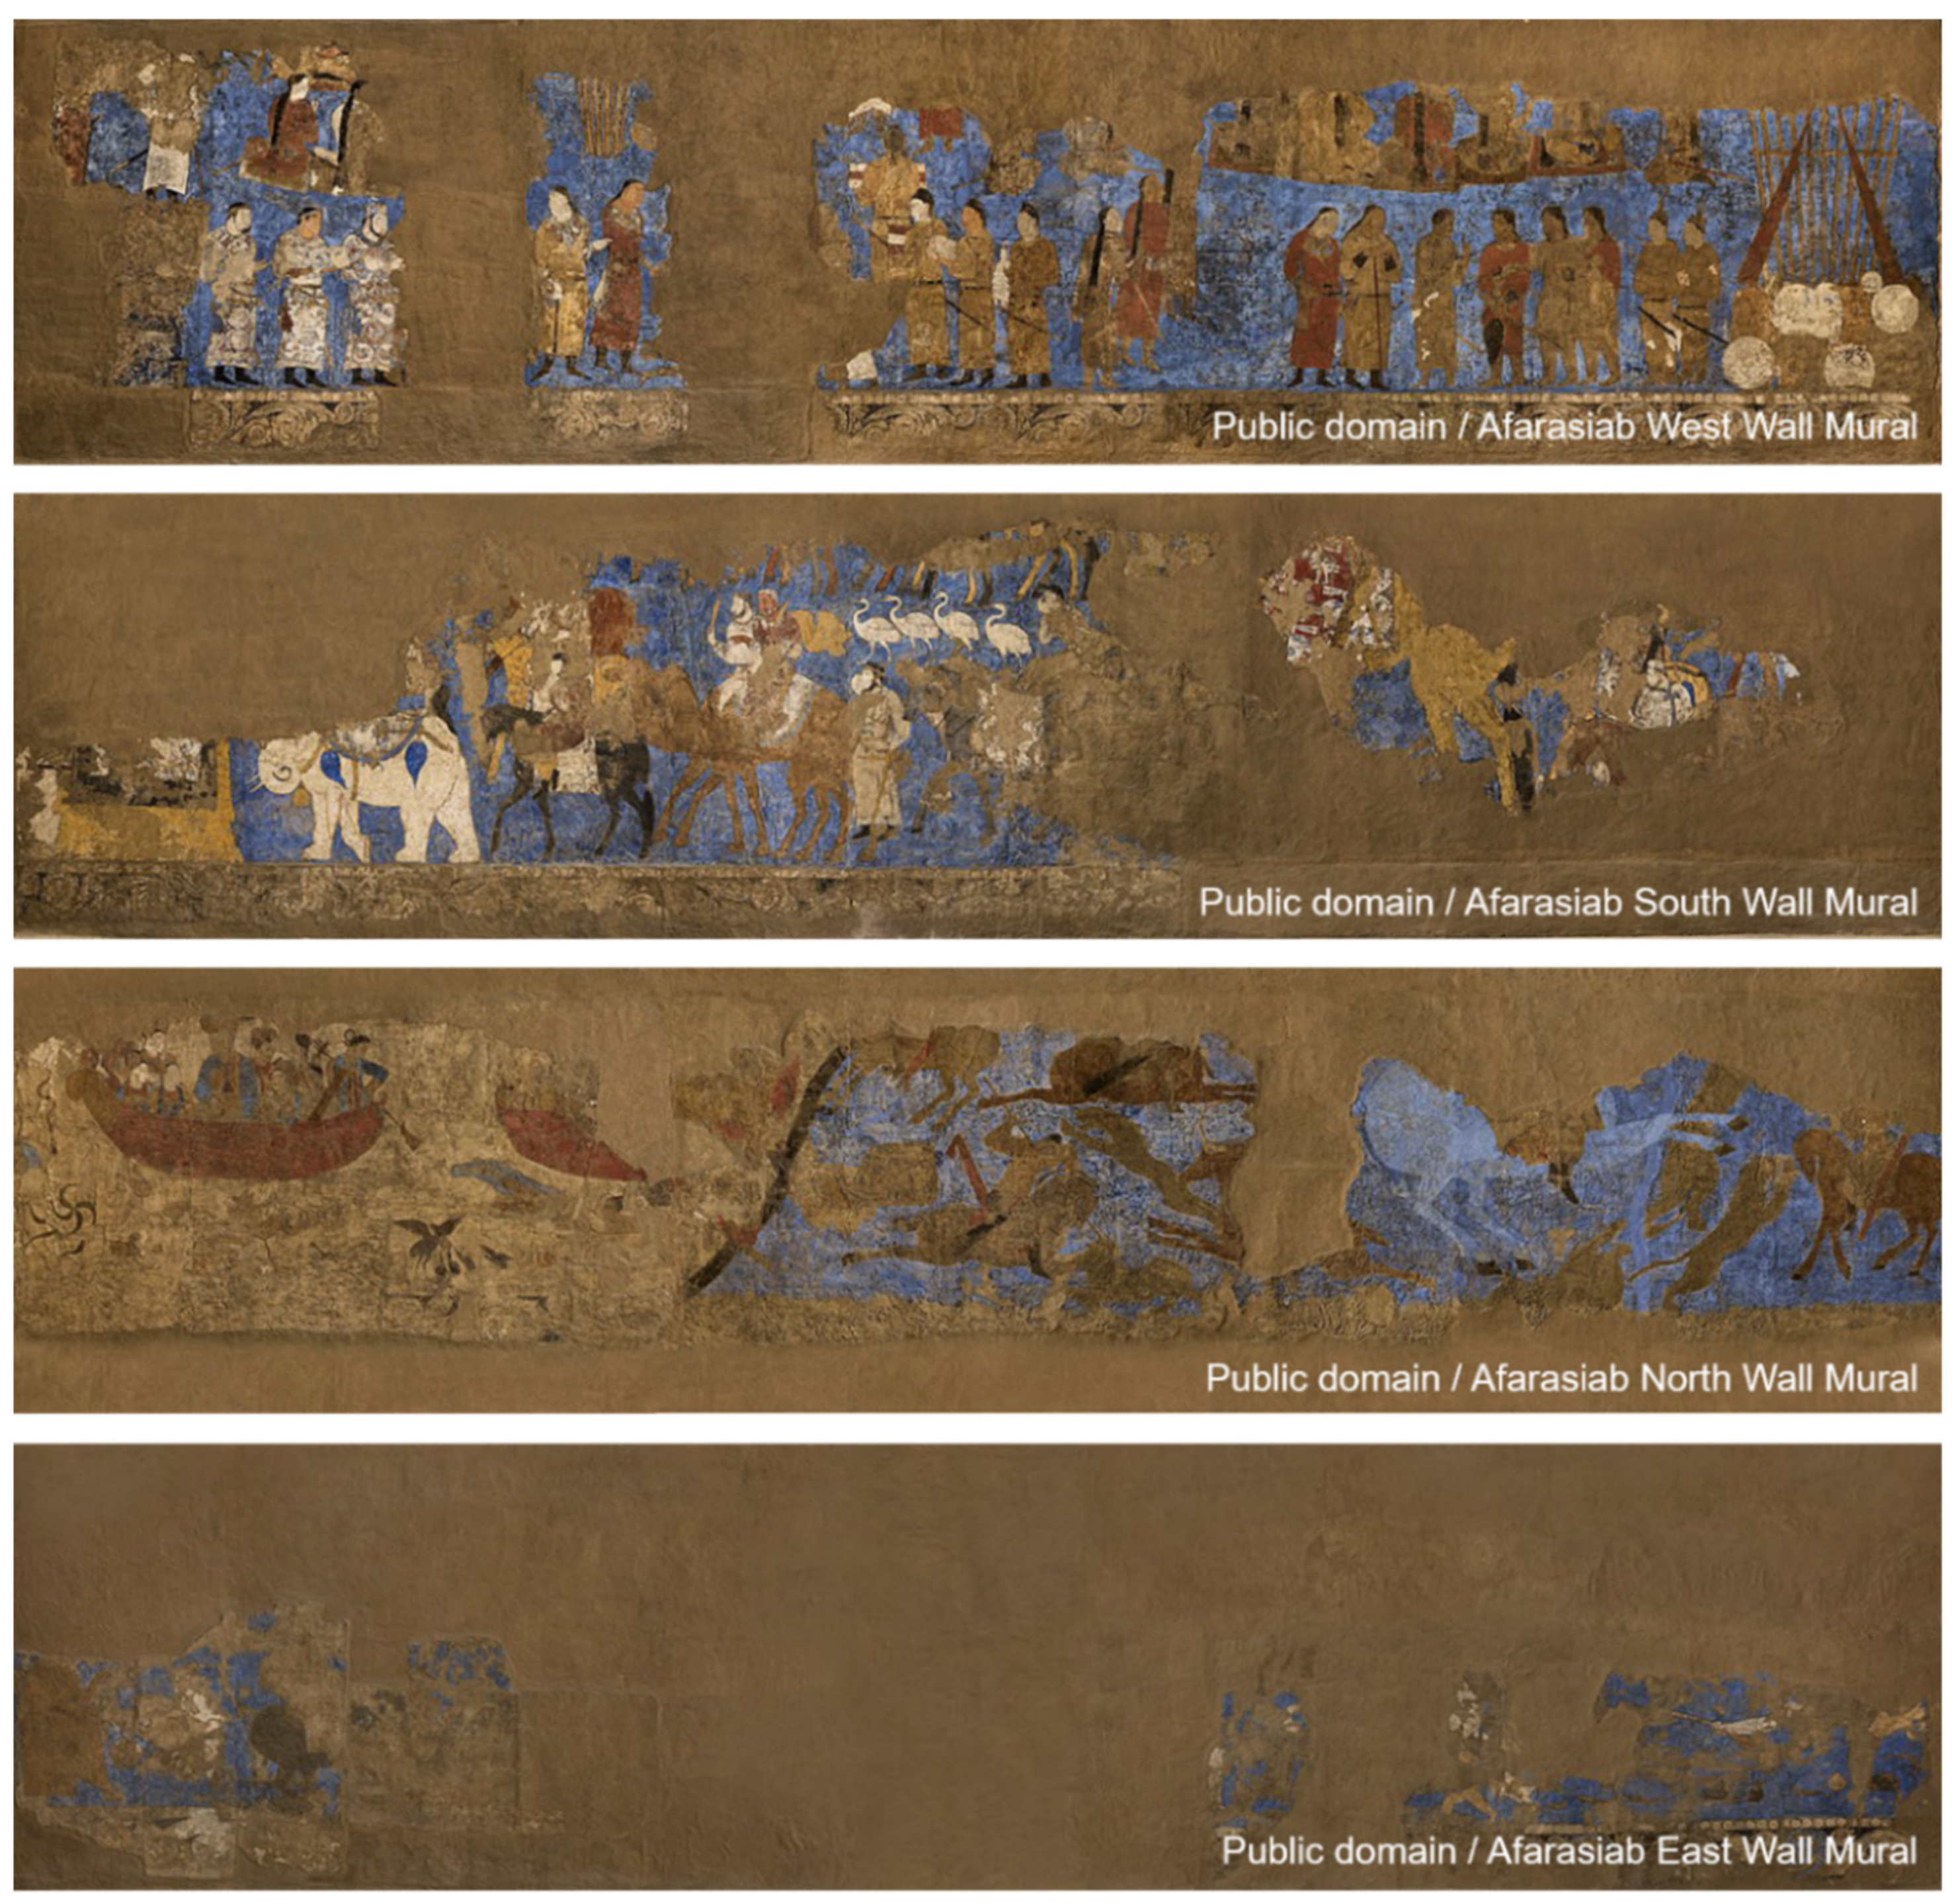
  1. UNESCO Silk Roads Programme. Cultural Selection: The Afrosiab Paintings. Available online: https://en.unesco.org/silkroad/content/cultural-selection-afrasiab-paintings (accessed on 15 August 2021).
  2. Baumer, C. History of Central Asia, The: 4-Volume Set; Bloomsbury Publishing: London, UK, 2018; p. 243. [Google Scholar]
  3. Whitfield, S. The Silk Road: Trade, Travel, War and Faith; British Library; Serindia Publications, Inc.: Chicago, IL, USA, 2004; p. 112. [Google Scholar]
  4. Mode, M. Reading the Afrasiab Murals: Some Comments on Reconstructions and Details. Riv. Studi Orient. 2006, 78, 107–128. [Google Scholar]
  5. De La Vaissière, É. Les Turcs, rois du monde à Samarcande. Riv. Studi Orient. 2006, 78, 147–162. [Google Scholar]
  6. Compareti, M. Ancient Iranian decorative textiles: New evidence from archaeological investigations and private collections. Silk Road 2015, 13, 36–44. [Google Scholar]
  7. Kim, Y.M. A study of costumes appearing in Afrasiab mural painting. J. Korean Soc. Costume 2010, 60, 117–130. [Google Scholar]
  8. Lee, S.H. Sogdian murals at Afrasiab, Samarkand, and exchanges between ancient Korea and Sogd. Hist. Rev. Soongsil Univ. 2020, 44, 189–221. [Google Scholar]
  9. Livšic, V. The Sogdian Wall Instructions on the Site of Afrasiab. Riv. Studi Orient. 2006, 78, 59–74. [Google Scholar]
  10. Azarpay, G. The Afrasiab murals: A pictorial narrative reconsidered. Silk Road 2014, 12, 49–56. [Google Scholar]
  11. Abdurazakov, A.A.; Kambarov, M.K. Restoration of Wall Painting Afrasiab; Sadykova, A.S., Ed.; Publishing House FAN: Tashkent, Uzbekistan, 1975. (In Russian) [Google Scholar]
  12. Fray, G.; Grenet, F.; Khasanov, M.; Reutova, M.; Riep, M. A pastoral festival on a wall painting from Afrasiab (Samarkand). J. Inn. Asian Art Archaeol. 2015, 6, 53–73. [Google Scholar] [CrossRef]
  13. Ko, K. The Digital Restoration Copy of the Afrasiab Palatial Mural. Eastern Art 2018, 41, 35–56. [Google Scholar]
  14. Mazzeo, R.; Baraldi, P.; Lujan, R.; Fagnano, C. Characterization of mural painting pigments from the Thubchen Lhakhang temple in Lo Manthang, Nepal. J. Raman Spectrosc. 2004, 35, 678–685. [Google Scholar] [CrossRef]
  15. Sodo, A.; Artioli, D.; Botti, A.; De Palma, G.; Giovagnoli, A.; Mariottini, M.; Paradisi, A.; Polidoro, C.; Ricci, M.A. The colors of Etruscan painting: A study on the Tomba dell’Orco in the necropolis of Tarquinia. J. Raman Spectrosc. 2008, 39, 1035–1041. [Google Scholar] [CrossRef]
  16. Egel, E.; Simon, S. Investigation of the painting materials in Zhongshan Grottoes (Shaanxi, China). Herit. Sci. 2013, 1, 29. [Google Scholar] [CrossRef] [Green Version]
  17. Liu, Z.; Han, Y.; Han, L.; Cheng, Y.; Ma, Y.; Fang, L. MicroRaman analysis of the pigments on painted pottery figurines from two tombs of the Northern Wei Dynasty in Luoyang. Spectrochim. Acta A Mol. Biomol. Spectrosc. 2013, 109, 42–46. [Google Scholar] [CrossRef]
  18. Veneranda, M.; Irazola, M.; Pitarch, A.; Olivares, M.; Iturregui, A.; Castro, K.; Madariaga, J.M. In-situ and laboratory Raman analysis in the field of cultural heritage: The case of a mural painting. J. Raman Spectrosc. 2014, 45, 228–237. [Google Scholar] [CrossRef]
  19. Liu, L.; He, J.; Ye, M.; Zhu, Z.; Zhong, Q.; Yang, J. Spectral characterization of pigment from the No. 1 cave, Kizil cave-temple complex. J. Spectrosc. 2019, 2019, 8502524. [Google Scholar] [CrossRef]
  20. Bodnar, J.L.; Mouhoubi, K.; Di Pallo, L.; Detalle, V.; Vallet, J.M.; Duvaut, T. Contribution to the improvement of heritage mural painting non-destructive testing by stimulated infrared thermography. Eur. Phys. J. Appl. Phys. 2013, 64, 11002. [Google Scholar] [CrossRef]
  21. Ha, J.W.; Lee, S.J. Identification of natural inorganic pigments used on 18th century Korean traditional mural paintings by using a portable x-ray fluorescence. J. Ind. Eng. Chem. 2015, 28, 328–333. [Google Scholar] [CrossRef]
  22. Li, J.; Xie, D.; Li, M.; Liu, S.; Wei, C. Pigment identification of ancient wall paintings based on a visible spectral Image. J. Spectrosc. 2020, 2020, 3695801. [Google Scholar] [CrossRef]
  23. Aguilar-Téllez, D.M.; Ruvalcaba-Sil, J.L.; Claes, P.; González-González, D. False color and infrared imaging for the identification of pigments in paintings. Mater. Res. Soc. Symp. Proc. 2014, 1618, 3–15. [Google Scholar] [CrossRef]
  24. Moon, T.; Schilling, M.R.; Thirkettle, S. A Note on the Use of False-Color Infrared Photography in Conservation. Stud. Conserv. 1992, 37, 42. [Google Scholar] [CrossRef]
  25. Ruvalcaba-Sil, J.L.; Barba, L.; Casanova-González, E.; Mitrani, A.; Muñoz, M.; Rangel-Chavez, I.; Maynez-Rojas, M.Á.; Cañetas, J. Analytical Approach for the Study of Teotihuacan Mural Paintings from the Techinantitla Complex. Minerals 2021, 11, 508. [Google Scholar] [CrossRef]
  26. Kostomitsopoulou Marketou, A.; Andriulo, F.; Steindal, C.; Handberg, S. Egyptian Blue Pellets from the First Century BCE Workshop of Kos (Greece): Microanalytical Investigation by Optical Microscopy, Scanning Electron Microscopy-X-ray Energy Dispersive Spectroscopy and Micro-Raman Spectroscopy. Minerals 2020, 10, 1063. [Google Scholar] [CrossRef]
  27. Miriello, D.; Bloise, A.; Crisci, G.M.; De Luca, R.; De Nigris, B.; Martellone, A.; Osanna, M.; Pace, R.; Pecci, A.; Ruggieri, N. Non-Destructive Multi-Analytical Approach to Study the Pigments of Wall Painting Fragments Reused in Mortars from the Archaeological Site of Pompeii (Italy). Minerals 2018, 8, 134. [Google Scholar] [CrossRef] [Green Version]
  28. Secco, M.; Rainer, L.; Graves, K.; Heginbotham, A.; Artioli, G.; Piqué, F.; Angelini, I. Ochre-Based Pigments in the Tablinum of the House of the Bicentenary (Herculaneum, Italy) between Decorative Technology and Natural Disasters. Minerals 2021, 11, 67. [Google Scholar] [CrossRef]
  29. Dayet, L. Invasive and Non-Invasive Analyses of Ochre and Iron-Based Pigment Raw Materials: A Methodological Perspective. Minerals 2021, 11, 210. [Google Scholar] [CrossRef]
  30. Pronti, L.; Capobianco, G.; Vendittelli, M.; Felici, A.C.; Serranti, S.; Bonifazi, G. Optimized Method for Mapping Inorganic Pigments by Means of Multispectral Imaging Combined with Hyperspectral Spectroscopy for the Study of Vincenzo Pasqualoni’s Wall Painting at the Basilica of S. Nicola in Carcere in Rome. Minerals 2021, 11, 839. [Google Scholar] [CrossRef]
  31. Moon, D.H. Mineralogical Study on the Raw Materials of Cultural Properties; Interpretation and Rediscovery. Ph.D. Thesis, Gyeongsang National University, Jinju, Korea, 2021. [Google Scholar]
  32. Lafuente, B.; Downs, R.T.; Yang, H.; Stone, N. The power of databases: The RRUFF project. In Highlights in Mineralogical Crystallography; Armbruster, T., Danisi, R.M., Eds.; W. De Gruyter: Berlin, Germany, 2015; pp. 1–30. [Google Scholar]
  33. Schmidt, B.A.; Ziemann, M.A.; Pentzien, S.; Gabsch, T.; Koch, W.; Krüger, J. Technical analysis of a Central Asian wall painting detached from a Buddhist cave temple on the Northern Silk Road. Stud. Conserv. 2016, 61, 113–122. [Google Scholar] [CrossRef] [Green Version]
  34. Siddall, R. Mineral Pigments in Archaeology: Their Analysis and the Range of Available Materials. Minerals 2018, 8, 201. [Google Scholar] [CrossRef] [Green Version]
  35. Reiche, I. Mineral pigments: The colorful palette of nature. In The Contribution of Mineralogy to Cultural Heritage; Artioli, G., Oberti, R., Eds.; Mineralogical Society: London, UK, 2019; pp. 283–322. [Google Scholar]
  36. Aoki, S.; Taniguchi, Y.; Rickerby, S.; Mori, M.; Kijima, T.; Bomin, S.; Kirino, F. Conservation and Painting Techniques of Wall Paintings on the Ancient Silk Road; Springer Nature: London, UK, 2021; pp. 1–323. [Google Scholar]
  37. Frison, G.; Brun, G. Lapis lazuli, lazurite, ultramarine ‘blue’, and the color term ‘azure’ up to the 13th century. J. Int. Color Assoc. 2016, 16, 41–55. [Google Scholar]
  38. Buisson, N.; Burlot, D.; Eistov, H.; Eveno, M.; Sarkis, N. The tomb of the three brothers in Palmyra: The use of mimetite, a rare yellow pigment, in a rich decoration. Archaeometry 2015, 57, 1025. [Google Scholar] [CrossRef]
  39. Chiriu, D.; Ricci, P.C.; Carbonaro, C.M.; Nadali, D.; Polcaro, A.; Collins, P. Raman identification of cuneiform tablet pigments: Emphasis and color technology in ancient Mesopotamian mid-third millennium. Heliyon 2017, 3, e00272. [Google Scholar] [CrossRef] [PubMed] [Green Version]
  40. Brecoulaki, H. A scientific investigation on the painted decoration of the Tomb of the Palmettes. In Das Palmettengrab in Lefkadia; Rhomiopoulou, K., Schmidt-Dounas, B., Eds.; V. Ph. von Zabern: Mainz, Germany, 2010; pp. 102–118. [Google Scholar]
  41. Trąbska, J.; Wesełucha-Birczyńska, A.; Zięba-Palus, J.; Thagård Runge, M. Black painted pottery, Kildehuse II, Odense County, Denmark. Spectrochim. Acta A Mol. Biomol. Spectrosc. 2011, 79, 824–830. [Google Scholar] [CrossRef] [PubMed]
  42. Tomasini, E.P.; Gómez, B.; Halac, E.B.; Reinoso, M.; Di Liscia, E.J.; Siracusano, G.; Maier, M.S. Identification of carbon-based black pigments in four South American polychrome wooden sculptures by Raman microscopy. Herit. Sci. 2015, 3, 19. [Google Scholar] [CrossRef] [Green Version]
  43. Coccato, A.; Jehlicka, J.; Moens, L.; Vandenabeele, P. Raman spectroscopy for the investigation of carbon-based black pigments: Investigation of carbon-based black pigments. J. Raman Spectrosc. 2015, 46, 1003–1015. [Google Scholar] [CrossRef] [Green Version]
Figure 1. Afrasiab murals (the present photographs are Public Domain image of the UNESCO [1]).
Minerals 11 00939 g001
Figure 2. (a) Sample fragments for blue, red, and black pigments; (b) residual soil under the red sample.
Minerals 11 00939 g002
Figure 3. Surface and cross-sectional optical micrographs of (a) blue, (b) red, and (c) black pigment layers.
Minerals 11 00939 g003
Figure 4. X-ray diffraction patterns of (a) blue pigment, (b) red pigment, and (c) black pigment.
Minerals 11 00939 g004
Figure 5. X-ray diffraction patterns of residual soil.
Minerals 11 00939 g005
Figure 6. Raman spectra and target particles of (a) white background, (b) blue pigment, (c) red pigment, and (d) black pigment.
Minerals 11 00939 g006
Figure 7. Overlaid elemental maps of (a) blue pigment, (b) red pigment, and (c) black pigment by SEM-EDS. The open crosses indicate the EDS analysis points in Table 1.
Minerals 11 00939 g007
Table 1. Results from SEM-EDS point analysis of the colored surface layer.
Analyzing PointEDS SpectrumElemental Composition (wt.%) 1
Blue layer Minerals 11 00939 i001 Na (25.25)
Al (24.37)
Si (27.67)
S (14.81)
Cl (0.63)
K (3.19)
Ca (4.08)
Red layer Minerals 11 00939 i002 Si (4.07)
S (15.81)
Hg (79.76)
Black-yellow-brown crossed layer Minerals 11 00939 i003 P (4.18)
Cl (3.32)
Ca (9.40)
As (11.22)
Pb (71.87)
1 Normalized data excluding oxygen content.
Publisher’s Note: MDPI stays neutral with regard to jurisdictional claims in published maps and institutional affiliations.

